Article

Age-Effect on Intra-Annual δ13C-Variability within Scots Pine Tree-Rings from Central Siberia

by
Marina V. Fonti
1,*,
Eugene A. Vaganov
1,2,
Christian Wirth
3,
Alexander V. Shashkin
2,
Natalya V. Astrakhantseva
2 and
Еrnst-Detlef Schulze
4
1
Institute of Ecology and Geography, Siberian Federal University, Svobodny pr. 79, Krasnoyarsk 660041, Russia
2
V.N. Sukachev Institute of Forest SB RAS, Akademgorodok 50, bld. 28, Krasnoyarsk 660036, Russia
3
Institute of Biology I, University of Leipzig, Johannisallee 21–23, 04103 Leipzig, Germany
4
Max-Planck Institute of Biogeochemistry, Hans-Knöll-Straße 10, 07701 Jena, Germany
*
Author to whom correspondence should be addressed.
Forests 2018, 9(6), 364; https://doi.org/10.3390/f9060364
Submission received: 30 March 2018 / Revised: 3 June 2018 / Accepted: 4 June 2018 / Published: 19 June 2018
(This article belongs to the Special Issue Isotope Application in Forest Growth Assessment)

Abstract

:
Intra-annual tree-ring parameters are increasingly used in dendroecology thanks to their high temporal resolution. To better understand the nature of intra-ring proxy signals, we compared old and young trees according to the different ways in which they respond to climate. The study was carried out in central Siberia (Russia, 60°75′ N, 89°38′ E) in two even-aged Pinus sylvestris L. stands of different ages (20 and 220 years). Ring width, cell size, and intra-annual δ¹³С were measured for 4 to 27 tree rings, depending on age group (young vs. old) and tree-ring parameter. Wood formation was monitored to link tree-ring position to its time of formation. Results indicated more distinct intra-annual δ¹³С patterns at both the beginning and end of the ring of young trees compared to old ones. Older trees showed a stronger significant correlation between δ¹³С across the ring border, indicating a stronger carry-over effect of the previous year’s growing conditions on current year wood production. This suggests that tree age/size influences the magnitude of the transfer of mobile carbon reserves across the years.

1. Introduction

During their lifetime, trees change tremendously in age and size, and thus their structure and function need to be continuously adjusted to sustain successful interactions with the environment [1]. At the same time, while growing, a tree records and archives valuable environmental information within its tree-rings [2]; therefore, time-series of tree-ring proxies are often used to reconstruct past climates [3]. However, the signal encoded can be influenced by changes in tree size [4]. To remove age- or size-related distortions in the tree-ring width signal, dendrochronologists have developed different de-trending procedures [5]. Another way to eliminate age-effects on tree-ring growth responses to climate is to exclude the juvenile period from long-living trees. This procedure has been successfully applied to annually resolved tree-ring proxies, e.g., tree-ring width or maximum latewood density. However, at present, very little is known about the influence of size and age on the signal of tree-ring proxies that can be measured with intra-annual resolution, such as, for example, the anatomy of the xylem cells [6], or the isotopic composition of the wood or cellulose [7,8].
Cell anatomical features of tree rings have already been shown to encode environmental signals (e.g., [9,10,11,12,13]). Furthermore, important advancements over recent years in monitoring tree-growth at higher time resolutions are showing that it is possible to mechanistically link the environment with wood formation and structure [14,15]. Cambium produces tracheid layers during the growth season in sequence one by one. Direct observation of xylogenesis allows us to know the exact time of appearance and development of each cell layer, and accordingly, the period whose conditions controlled cell enlarging, maturation, and the accumulation of biomass by the cell wall. There is thus a growing amount of evidence that seasonal and annual changes in tree-ring anatomy (e.g., tree-ring width, cell number, size, wall thickness, and wood density) reflect processes of xylem cell differentiation and maturation, and that these processes are, in turn, determined by environmental factors [16,17].
There are several indications that ontogeny-related effects, such as a different growth rate or a different sensitivity to the environment, can influence the ability of a tree to record the intra-seasonal environmental signal. Recent observations with intra-annual resolution are providing a more detailed picture of tree-ring structural-functional relationships due to environmental changes or extreme events [18,19,20,21]. Moreover, there are indications that younger trees better capture the environmental signal than older trees, and thus, allow us to better distill information on short-term environmental control. For example, intra-annual density fluctuations have been observed to occur more frequently in the juvenile phase of a tree than in later developmental stages [22]. Studies on trees from uneven-age stands [23,24,25] or from trees with different growth rates [26,27] are also showing that the timing of xylem formation can extend or shift from several days to some weeks. This might be caused by a different intensity and duration of physiological processes such as photosynthesis, accumulation, and re-distribution of current carbohydrates or the usage of reserve assimilates to build up cell wall of tracheids and other components of wood [28]. Moreover, measurements performed on trees representing different levels of intrinsic growth rates in several conifers in Alpine, Temperate, and Boreal Europe indicated that the effect of summer drought in fast-growing trees does not occur in slow-growing ones [20]. In contrast, there are some characteristics of the wood structure, such as those related to hydraulic efficiency (via the tracheid lumen diameter), that are much more constrained over age and size changes, since they play a fundamental role in assimilation and growth [29].
In this study, we aim to better understand how age influences the nature and pattern of the intra-ring δ13С signal by comparing old and young trees. We hypothesized that trees of different ages show contrasting ecophysiological responses during the growing season that can alter the way carbon is captured and fixed within their tree-ring tissue. Specifically, our approach relies on the combination of high-resolution isotope and cellular anatomical analysis with classical methods of dendrochronology and xylogenesis.

2. Materials and Methods

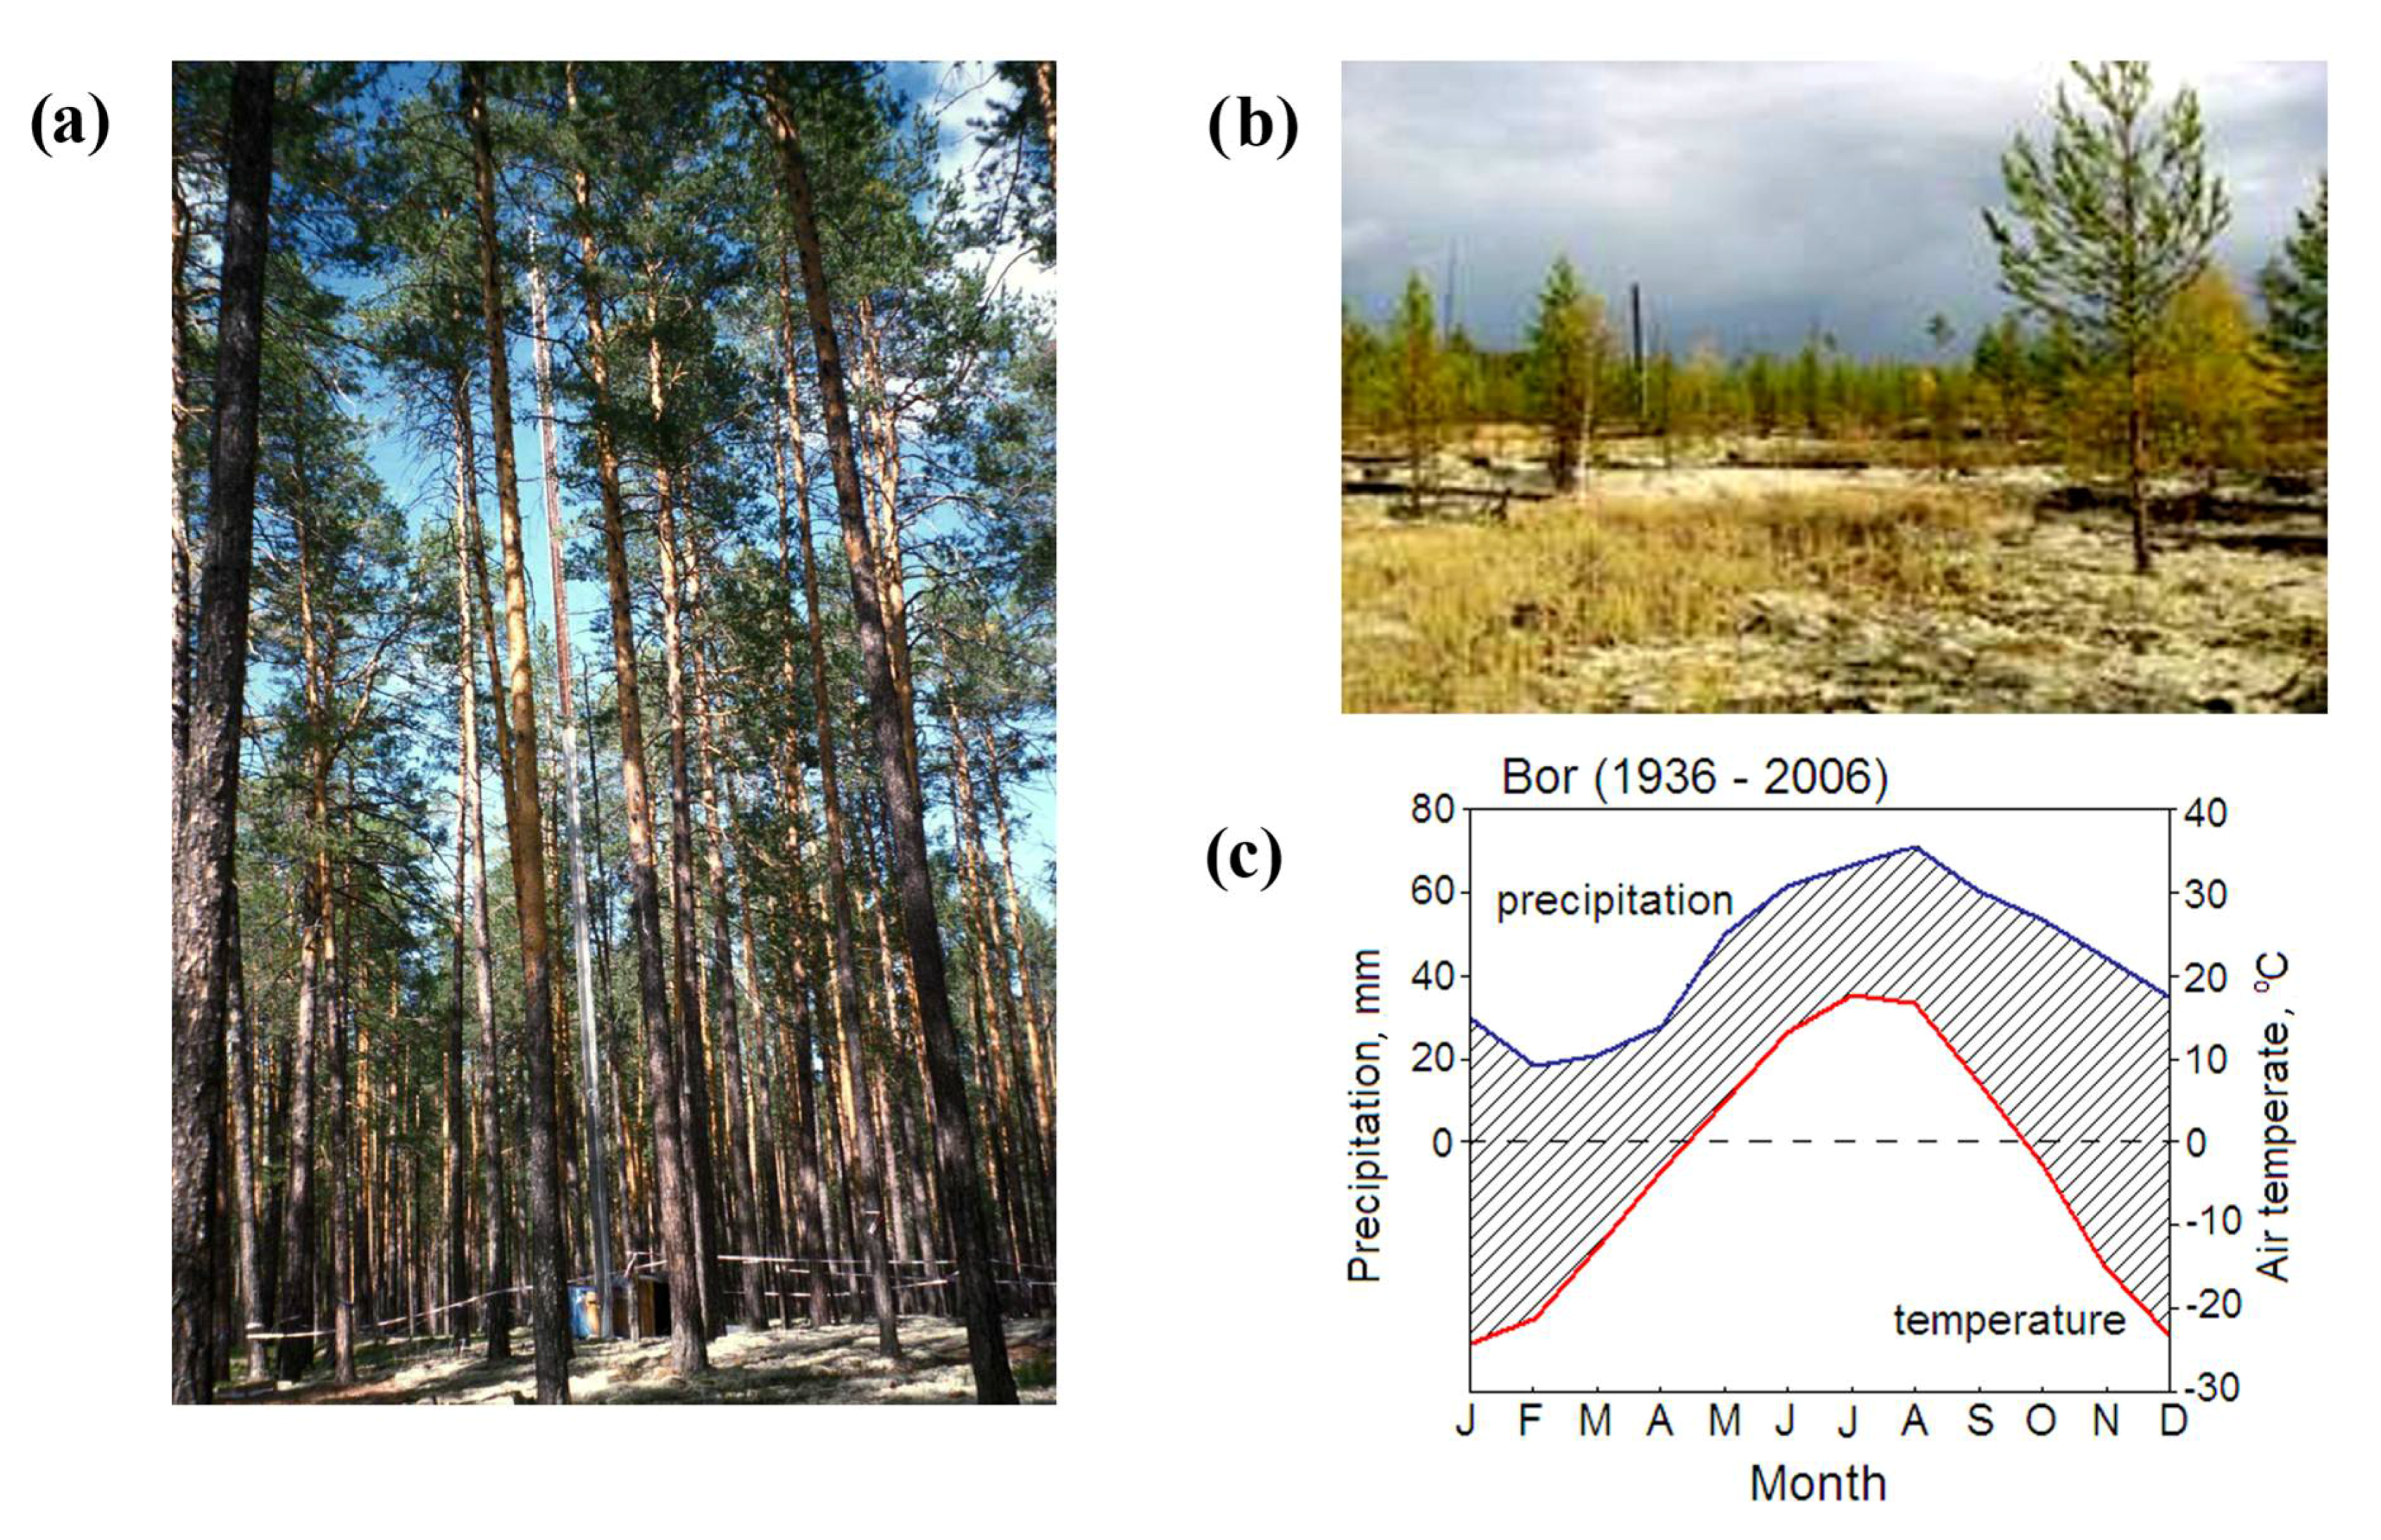
2.1. Study Sites and Climate

The study was carried out in Central Siberia (Russia), at the TCOS-Siberia (Terrestrial Carbon Observation System Siberia) site of Zotino, located 30 km west of the Yenisei River (60°45′ N, 89°23′ E, elevation 90 m above sea level). Two stands of Pinus sylvestris L. with same soil characteristics and approximately 1 km apart were chosen based on the age differences (Figure 1a,b). The soils have a podzolic morphology with no underlying permafrost. The old stand with mature trees (site OT—old trees) had a pyrogenic genesis [30]. Mean age of trees in 1999 has been estimated as 200 years, mean diameter at breast height was 27 cm and tree height 22 m. The stand density was about 470 trees ha−1 [31]. The forest is situated on alluvial sand dunes with a lichen layer (Cladina spp., Cladonia spp.) and sparse Vaccinium spp. [31,32]. The young stand (site YT—young trees) is a succession after logging. The age of trees was estimated at 20 years in 2004 (mean diameter at breast height was 11 cm and tree height 5 m, stand density was around 6000 trees ha−1). The above-ground vegetation was dominated by Chamaenerion angustifolium L., Carex ericetorum Poll., Solidago dahurica Kitag. and Arctostaphylos uva-ursi (L.) Spreng. [33].
The mean annual air temperature of the area (as measured at the nearest weather station of Bor (61°45′ N, 91°13′ E) for the period 1936–2006 is −3.7 °C, with July being the warmest month (+17.3 °C) and January the coldest (−22.9 °C). The period with daily temperature above +5 °C typically lasts for 147 days and mean daily temperate for this period is +11.5 °C [32,34]. Annual precipitation averages 493 mm, with 70% falling in summer [32]. According to the climate analysis of [35], the site has a positive hydrological balance (Figure 1c).

2.2. Tree Sampling and Dendrochronological Analysis

For the intra-ring survey we sampled and analyzed tree-rings from twenty old pine trees (OT) and five young trees (YT). Two cores from each tree were collected at stem breast height (1.3 m) along the same radius, vertically displaced 5 cm one above other with a 5-mm-diameter increment borer. One core was used for the measurement of the tree-ring width and the anatomical parameters, and the other served for the intra-annual measurement of whole wood δ13С.
Tree-ring width (TRW), earlywood width (EWW) and latewood width (LWW) were measured on all samples using a semi-automatic measuring device (LINTAB-V) [36]. The quality of visually cross-dated ring-width measurements was successfully checked with the program COFECHA [37,38].

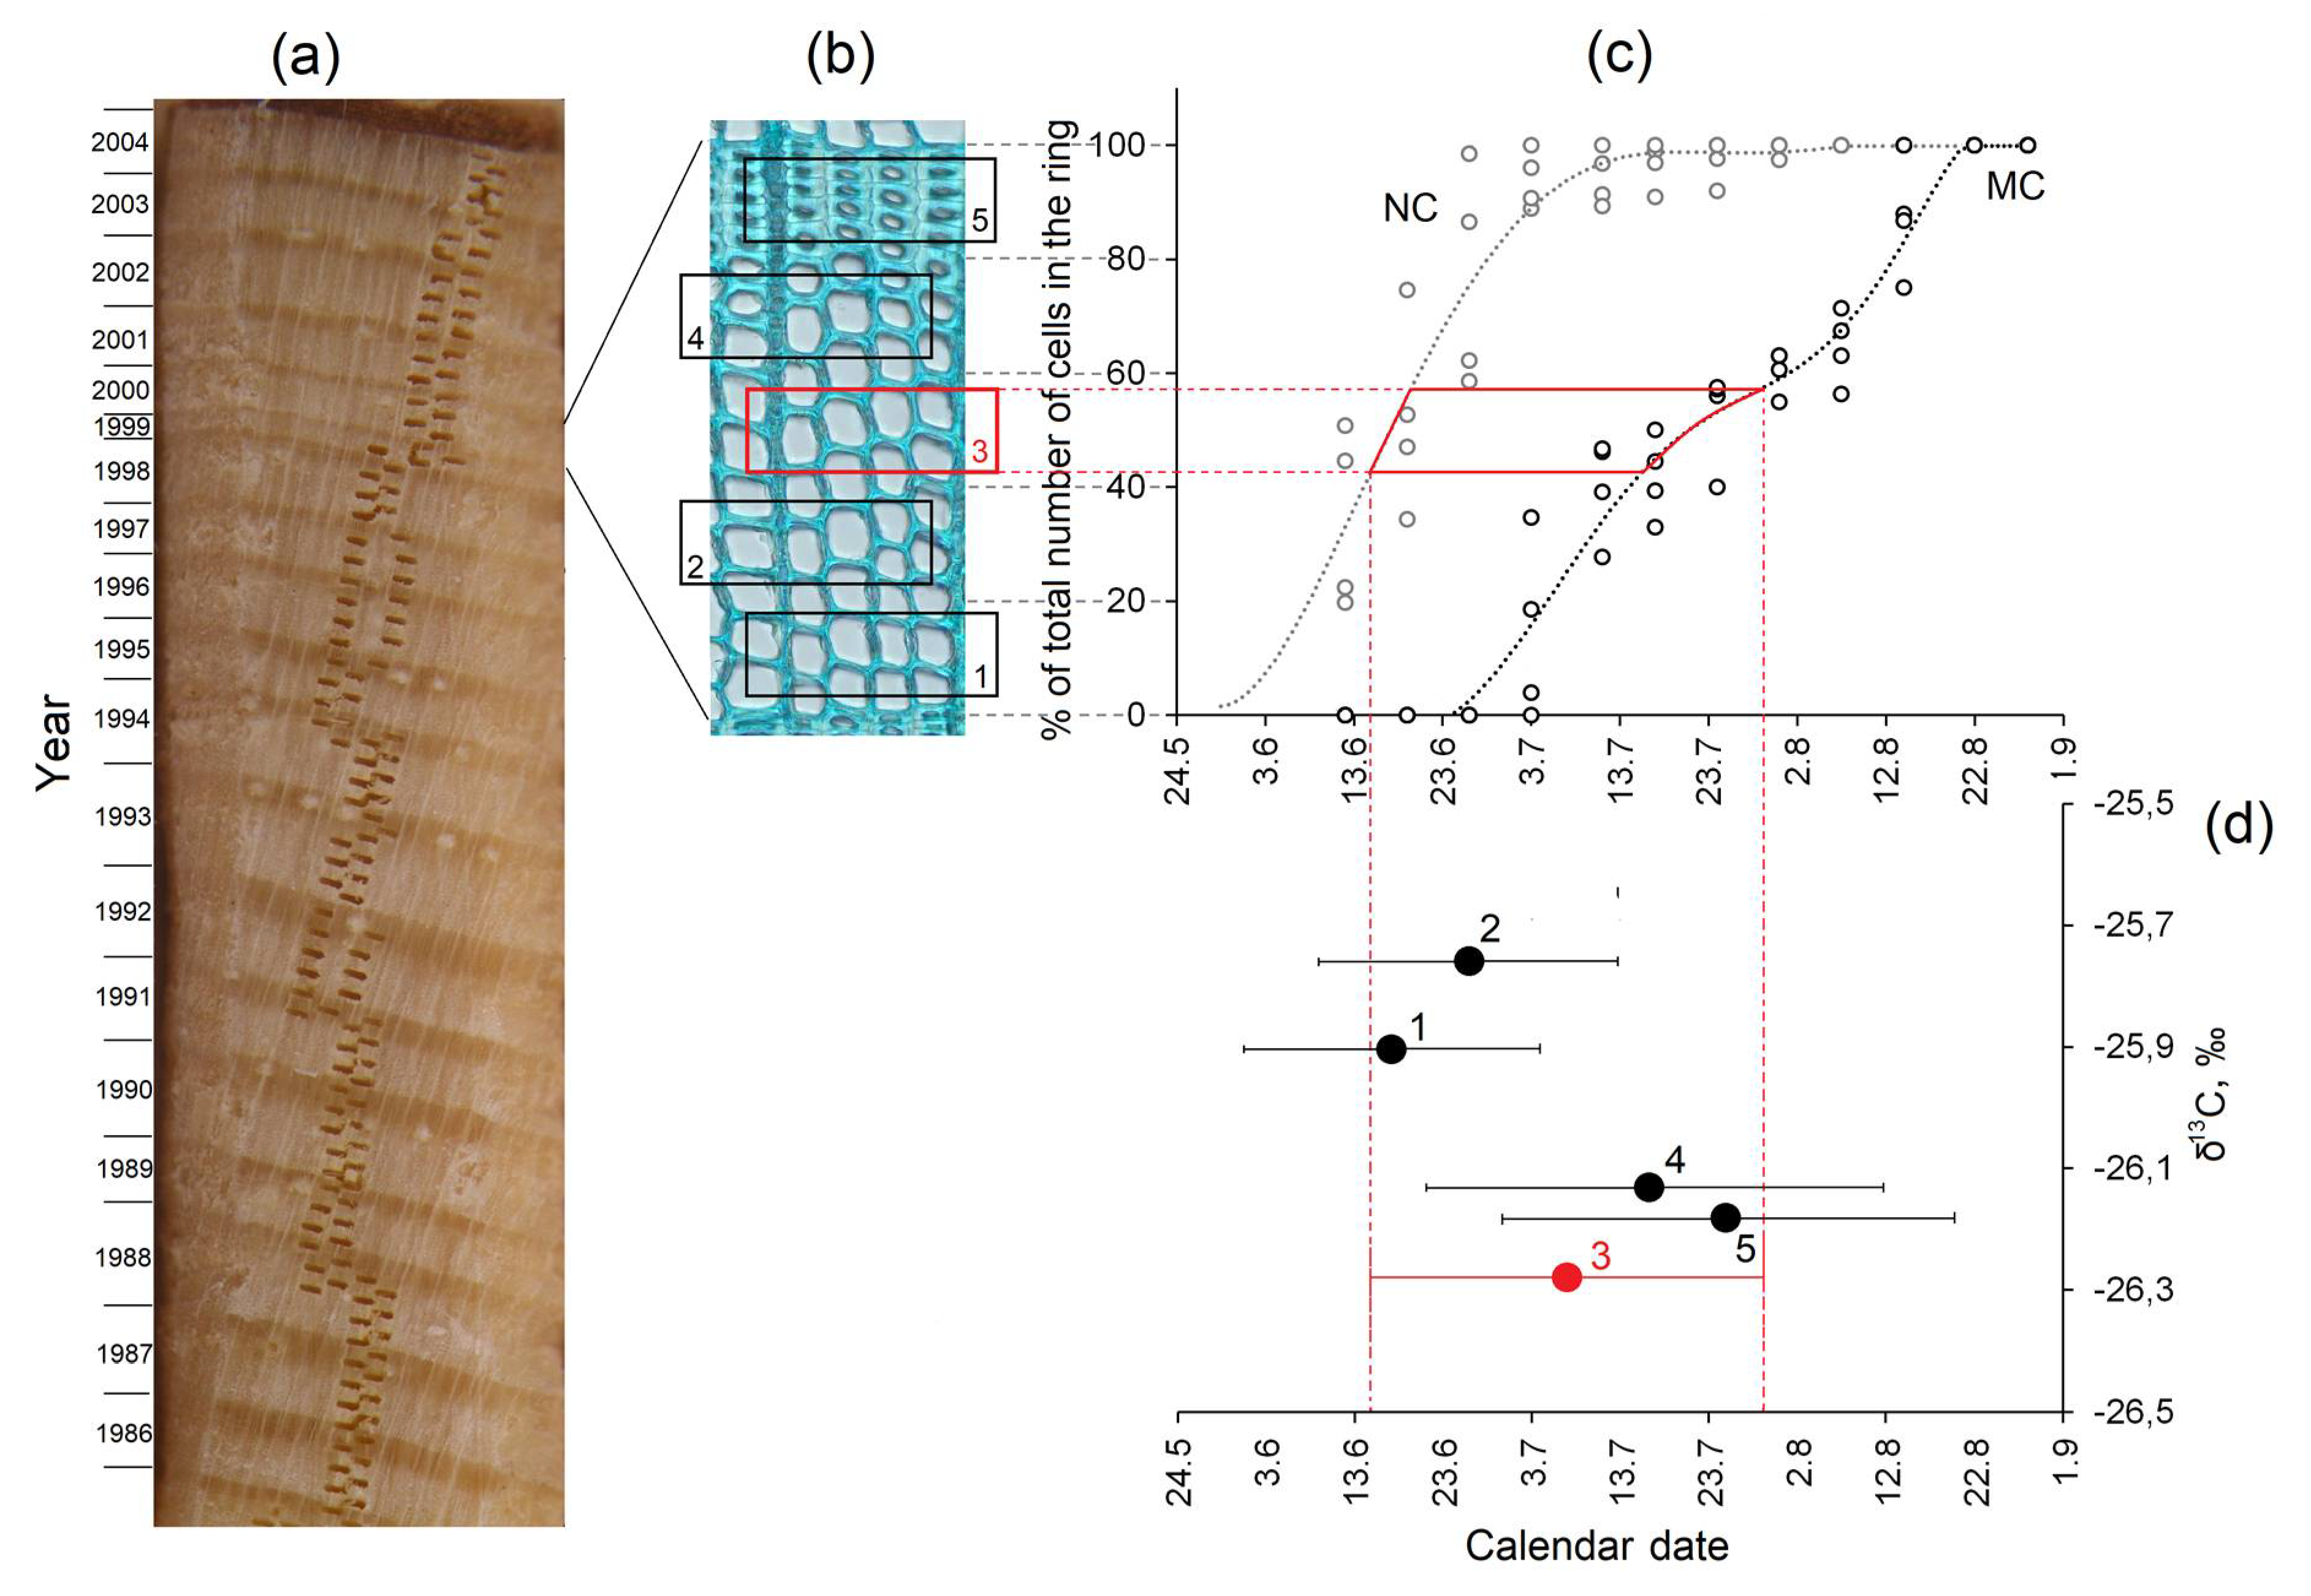
2.3. Image Analysis of Tracheid Dimensions

Tracheid structure was measured for 5 trees per site. For OT we selected the samples characterized by the highest tree-ring width correlation with the master time series (correlation ranged 0.54 to 0.67). This implies a relatively high common signal in tree-ring growth of the selected five individuals.
From each selected core (of both young and old trees), we prepared 20 μm thick cross-sections using a sliding microtome. Cross-sections were stained with methylene blue and fixed in glycerol [39,40]. Images of ring cross-sections were captured using an Image analysis system (Carl Zeiss, Jena, Germany). Tracheid parameters in tree rings were determined using the image analysis software AxioVision (Carl Zeiss SE64 Rel 4.9.1., Germany). Radial cell size (D), radial lumen size (LD), cell wall thickness (CWT), tangential cell diameter (T) were measured along five radial files (among those with the largest tangential diameter) in each ring [16,41]. Assuming a rectangular shape of the tracheid in cross section, these data were used to calculate cell-wall area (CWA) and cell-lumen area (LUM) [12,16]. To distinguish earlywood and latewood tracheids, we applied the Mork’s index [42], which assigns a cell to earlywood when 2*CWT > LD and vice versa. Since tree-ring width and number of cells within tree ring varied considerably between years and trees, measurements were normalized to a standard number of cells [43] to obtain comparable cell numbers across rings. The standardized tracheidograms for each variable were built for the common for OT and YT period 2000–2003.

2.4. Observation of Wood Formation

To have an indication of timings of tracheid differentiation, and assign a timing to intra-ring measurements (anatomical and isotopes), tree-ring formation was monitored for four OT during the year 2000. Micro-cores were collected at stem breast height with a weekly resolution from May to August. Before processing in the laboratory, wood samples were stored in ethanol-formalin-acetic acid solution (90:5:5). Transverse sections were then cut with a microtome and stained with cresyl violet to differentiate lignified tissue. For each microsection we counted the number of tracheids (N) along ten radial files differentiating among cells in enlargement or cell-wall thickening phase and mature cells [44]. The duration of tracheid formation was estimated as the period of time that the cell was spending in the enlargement and wall thickening phases.

2.5. Carbon Isotope Analysis

Carbon isotope ratios were determined in bulk wood for the same 5 trees used to measure cell structure. Isotopes measurements were performed via a laser ablation-combustion line (Nd:YAG 266 nm UV Laser, Merchantek—New Wave, Fremont, CA, USA) coupled to a mass-spectrometer (Finnigan Delta +XL), according to the description in [44]. The exact location of each ablation spot was visualized with a camera mounted directly on the laser ablation station. The wood samples were enclosed in an aluminum chamber with a quartz window, which was flushed with helium as a carrier gas. For quantitative combustion of the ablation particles to CO2 and H2O, the sample was passed through an Al2O3 tube containing CuO wire as source of oxygen at 700 °C. The reaction gas further passed through a GC column (HayeSep D, Bandera, TX, USA) to separate CO2 from other gases. Water was removed with an on-line Nafion water trap. Carbon stable isotope ratios were expressed in the δ-notation on the VPDB scale using NBS22 with a value of 30.03‰ as the scale anchor. The spatial resolution of a laser shot was about 80 μm; the series of shots was repeated radially along the same line every 100 microns for narrow rings (OT), and 150–200 microns for wide rings (YT); this resulted in 2 to 17 data points per tree ring. Profiles of δ13C were obtained for the rings formed during the period 1980–2003 (OT) and 2000–2003 (YT). Since the δ13С values within a tree ring varied within and between years, the data were normalized by calculating the deviation of the measured value at time t from the average of that same year (δ13Сt-δ13Сavt) [16].
We used the δ13С notation rather than discrimination (Δ) because we cannot be sure about all discrimination steps during wood formation, and we did not measure the atmospheric δ13С. The δ13С values represent the isotope ratios of bulk wood, including lignin. Since the offset between cellulose and natural wood is constant (1.5‰ in conifers) and independent of season [45,46], cellulose extraction was unnecessary.

2.6. Climate-Growth Relationship and Statistical Analysis

Growth responses to the climate were evaluated by calculating Pearson correlations between tree-ring width and δ13С chronologies and the monthly temperature and precipitation from the Bor meteorological station for the period from 1980 to 2003 for OT-site. Analysis was performed for each month, from May of the previous year to September of the current year. Since the growing season for northern territories lasts for about four months, it was necessary to take into account the effect of short-term weather conditions [47,48]. Pearson’s correlations of tree-ring width and δ13С with climatic parameters were calculated for a 20-days window, with 10-days step moving along the period 1980–2003.
To estimate drought impact on tree growth, we used the standardized precipitation evapotranspiration index (SPEI) [49] for the period 1980–2003 at the grid cell 60–61° N, 89–90° E (http://climexp.knmi.nl).

3. Results

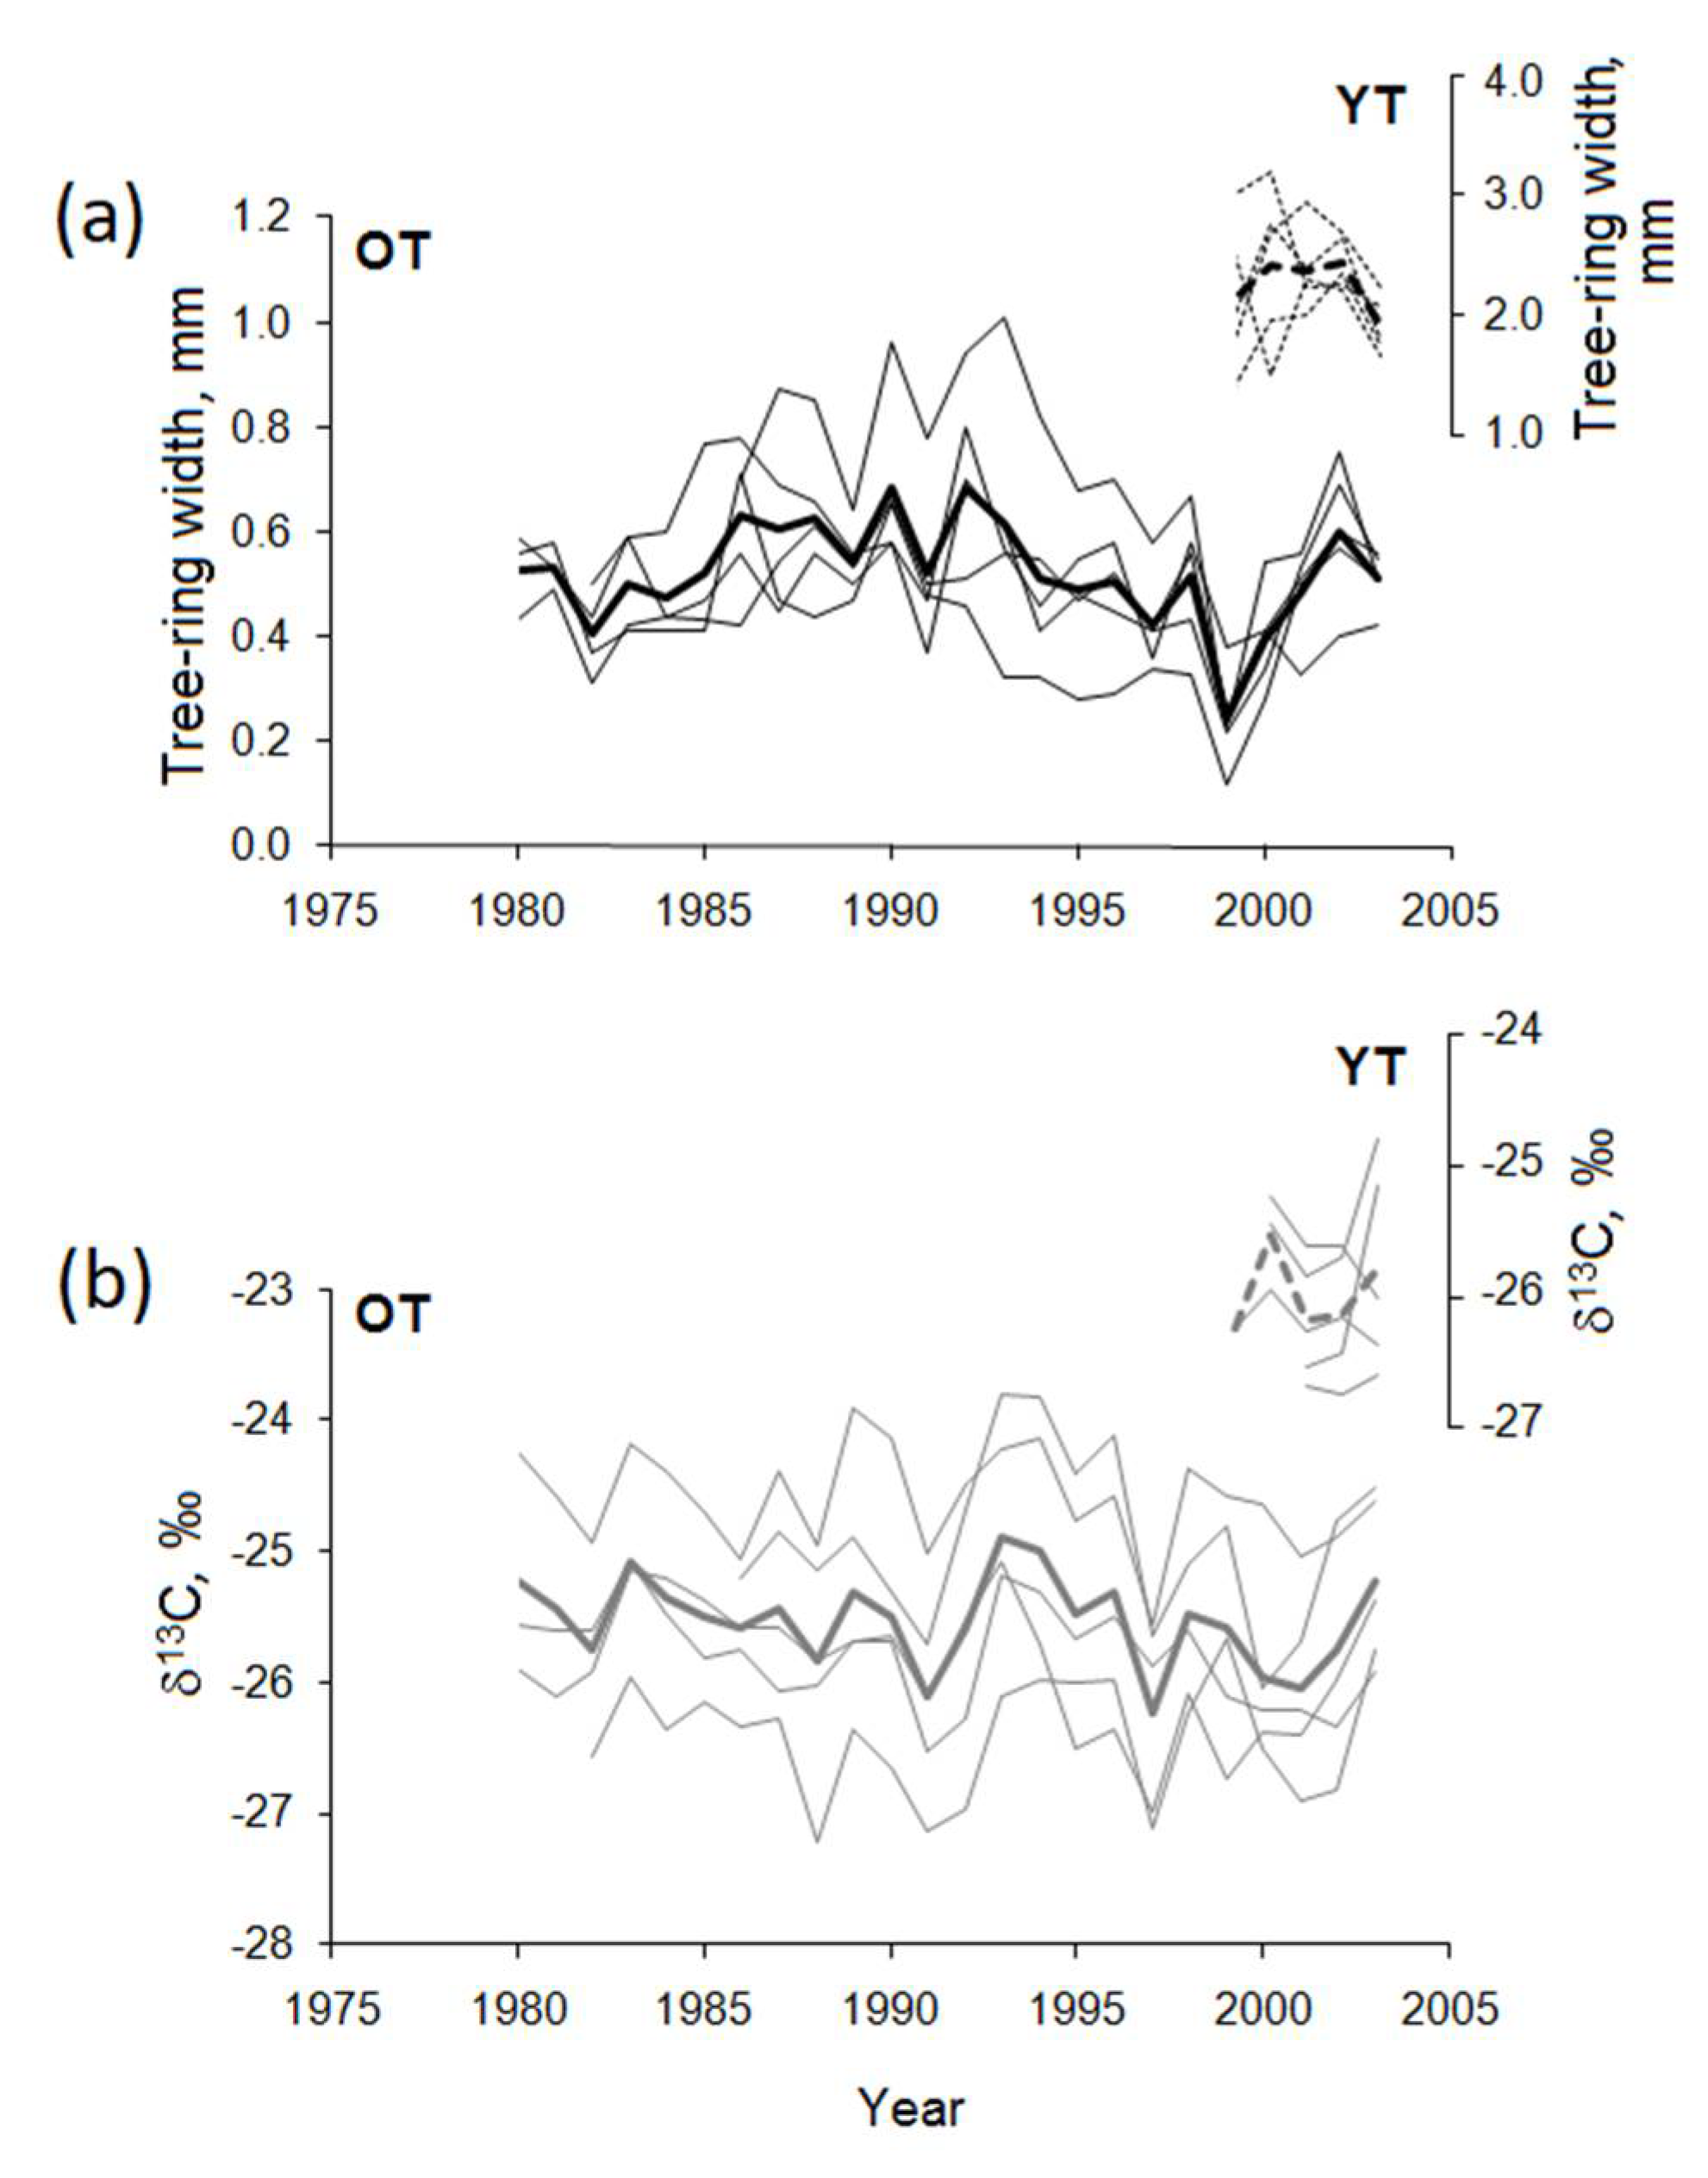
3.1. Time-Series and Correlations Among Parameters

Tree-ring width and average annual δ13С covered differing period lengths (period 1980–2003 for old trees and 1999–2003 for young trees, Figure 2).
Our measurements show that, on average, OT has six times narrower rings than YT (0.52 ± 0.16 mm versus 3.09 ± 1.00 mm). Average cell number per ring was 15 ± 5 and 73 ± 9 (mean ± standard deviation) for old and young trees, respectively. The diameter of the earlywood tracheids was larger for OT (37.6 ± 7.8 μm) than for YT (36.6 ± 5.7 μm), while the cell-wall thickness was identical between both groups (3.7 ± 1.4 μm) (Table 1).
The trees of the OT site showed a fairly strong common signal between tree individuals for both ring width and δ13С (mean inter-series correlation of 0.54 and 0.48, respectively). Between age groups the trees show a similar year-to-year ring-width pattern (R = 0.58, p < 0.05) but not between δ13С chronologies (R = 0.07, p > 0.05).
Correlation analysis among the tree-ring and δ13С parameters in various tree rings zones of OT for the period 1980–2003 showed that TRW is highly correlated with both earlywood width (EWW, R = 0.94, p < 0.001) and latewood width (LWW, R = 0.75, p < 0.001). Correlation between EWW and LWW is also highly significant (R = 0.53, p < 0.05). The average δ13С of the whole ring showed positive correlation with earlywood δ13С (R = 0.94, p < 0.001) and latewood δ13С (R = 0.81, p < 0.01), and positive correlation between δ13Сew and δ13Сlw (R = 0.59, p < 0.05).
Correlation between TRW and δ13С was weak for both age groups (R = 0.25 (n = 24) and R = −0.14 (n = 4), p < 0.05, for OT and YT respectively).

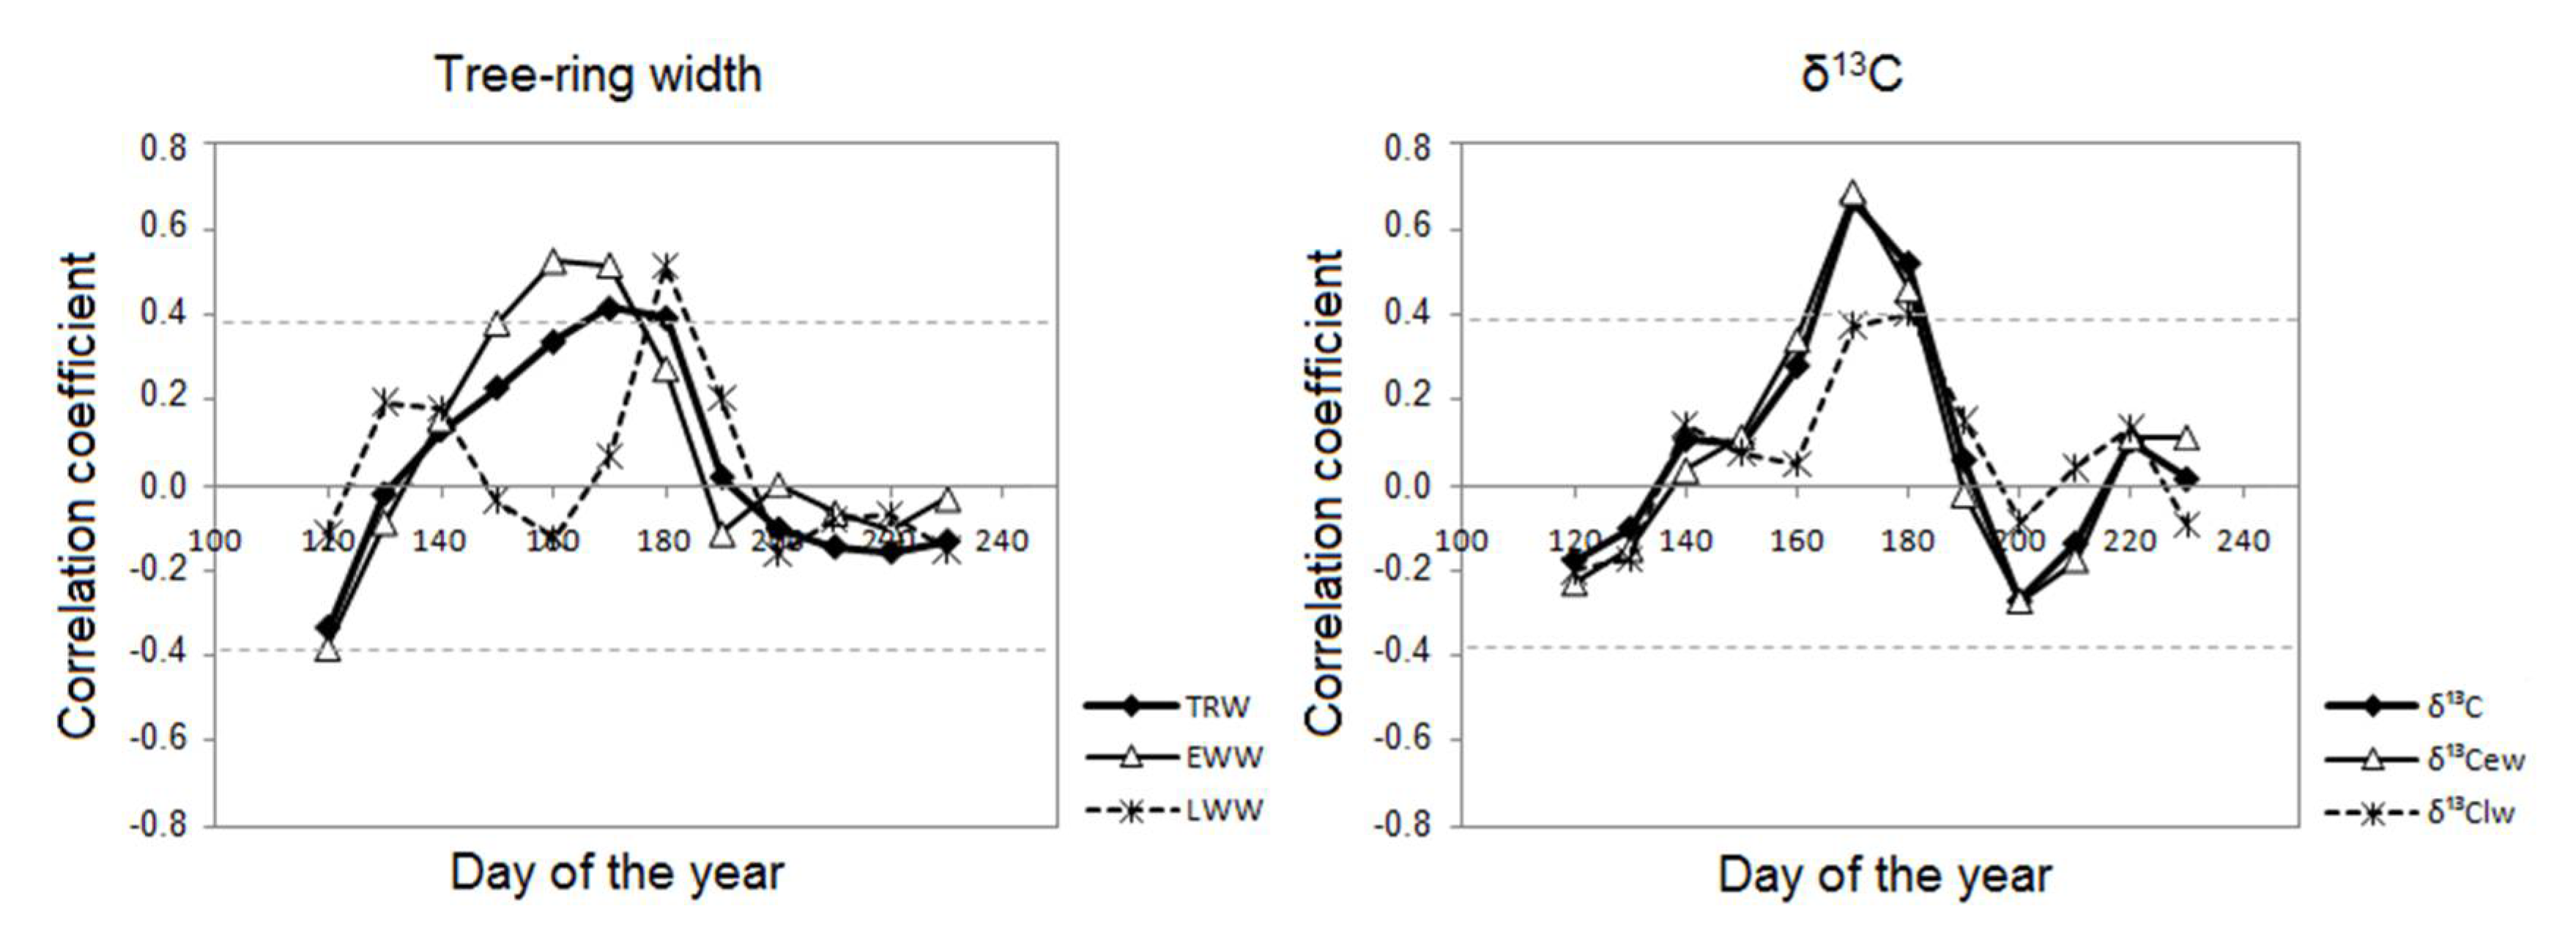
3.2. Tree-Ring Width and Average-Annual δ13С Responses to Climate

Our dendroclimatic analysis indicated that summer temperature is the most important climatic factor in determining both tree-ring width and δ13С in pine tree rings. Detailed analysis showed that temperature from 9 June to 8 July significantly affected TRW (Figure 3). Temperature from 30 May to 8 July positively influenced EWW, and temperature of the subsequent 20-days period (9–28 July) was significant for LWW. The δ13С in the whole tree ring correlated positively with temperature from 19 June to 18 July, as did δ13Сew with the period of 19 June–18 July, and δ13Сlw with 29 June–18 July. The correlations observed are higher for the isotope composition than for the ring width.
Correlations between tree-ring parameters and precipitation were observed slightly above the significant threshold at p < 0.05 only in summer, for a period of 20-days at the beginning of the growing season from May 30 to June 8. Despite the weak influence of summer precipitation on tree-ring growth, significant positive correlation (p < 0.05) was found between δ13С and drought index SPEI of April and May (R = 0.40 and R = 0.44, respectively,) and negative (p < 0.05) with SPEI of July (R = −0.46). However, no significant correlation between SPEI and TRW was found.

3.3. Intra-Ring Variability of Isotopic Composition and Anatomical Features of Young and Old Trees

Intra-annual δ13С measurements have been aligned to the earlywood-latewood transition and ordered according to their relative position in the ring to allow a fair comparison among annual rings from different trees and calendar years (Figure 4). The comparisons among the old and young trees indicate intra-annual differences in δ13С. In general, we observed that δ13С-values were lighter in the earlywood of both groups, although δ13С of young tree rings (YT) start at lower level and rises more rapidly than OT. In addition, YT reach a maximum in the transition zone before slightly decreasing in the latewood, while δ13С of OT rings level off in the latewood. Thus, for young trees, the δ13С of latewood is more similar to the earlywood, while for old trees, latewood has higher δ13С values than in the earlywood of the same ring. The average amplitude of the intra-annual variation of δ13С for old trees is about 0.2–3.0%, and for young trees 0.5–3.9%, depending on year of growth.
The intra-seasonal curves of δ13С, cell-wall, and lumen area for the rings 2000 to 2003 of each group are summarized in Figure 5. The climatic years of the selected rings are characterized by contrasting conditions, with a wet 2001 and dry 2003 growing season. Unexpectedly, the number of cells produced during the wet year was higher than in the dry year in the YT only (74 cells in 2001 and 63 cells in 2003), while there was an increase in OT (from 15 to 19 cells).
The analysis of seasonal δ13C-variability among these different climatic years (Figure 5b) indicates different responses. In particular, in both OT and YT trees we observed an n-shaped intra-ring pattern (i.e., with a maximum δ13C in the center of the ring and low values at both ring borders) in years with dry conditions (i.e., the year 2003; but also observed in 1983, 1987, 1989, 1990, 1993, 1998, 1999 in OT), while this pattern tended to be flat in wet years (i.e., the year 2001; see both SPEI and precipitation data in Figure 5a). However, in the intermediate years (i.e., 2000 and 2002), the response of the age groups differs, being still n-shaped in YT and flat in OT trees. In addition, we also observed that the maximum values of δ13С of young trees is not always positioned in the same location in the ring, being in the latewood in 2000, in the earlywood in 2002 and in the transition wood in the dry year of 2003.
Regarding the cell anatomical characteristics (Figure 5c,d) the intra-annual pattern appeared to be more stable than δ13C. However, the maximum was reached earlier in the ring (relative position) for OT than for YT, which indicates a larger proportion of latewood in OT. Maximum CWA occurred in latewood of the dry year 2003 for YT (730–763 µm2), and in the latewood of 2002 (699–719 µm2) for OT. The area of the cell-lumina was largest at the beginning of the growing season, and progressively decreased later in the season. The maximum was generally slightly higher for the old trees (up to 1419 µm2) than for young trees (up to 1162 µm2), with a maximum and minimum respectively in the earlywood of the wet year 2001 and the dry year 2003.

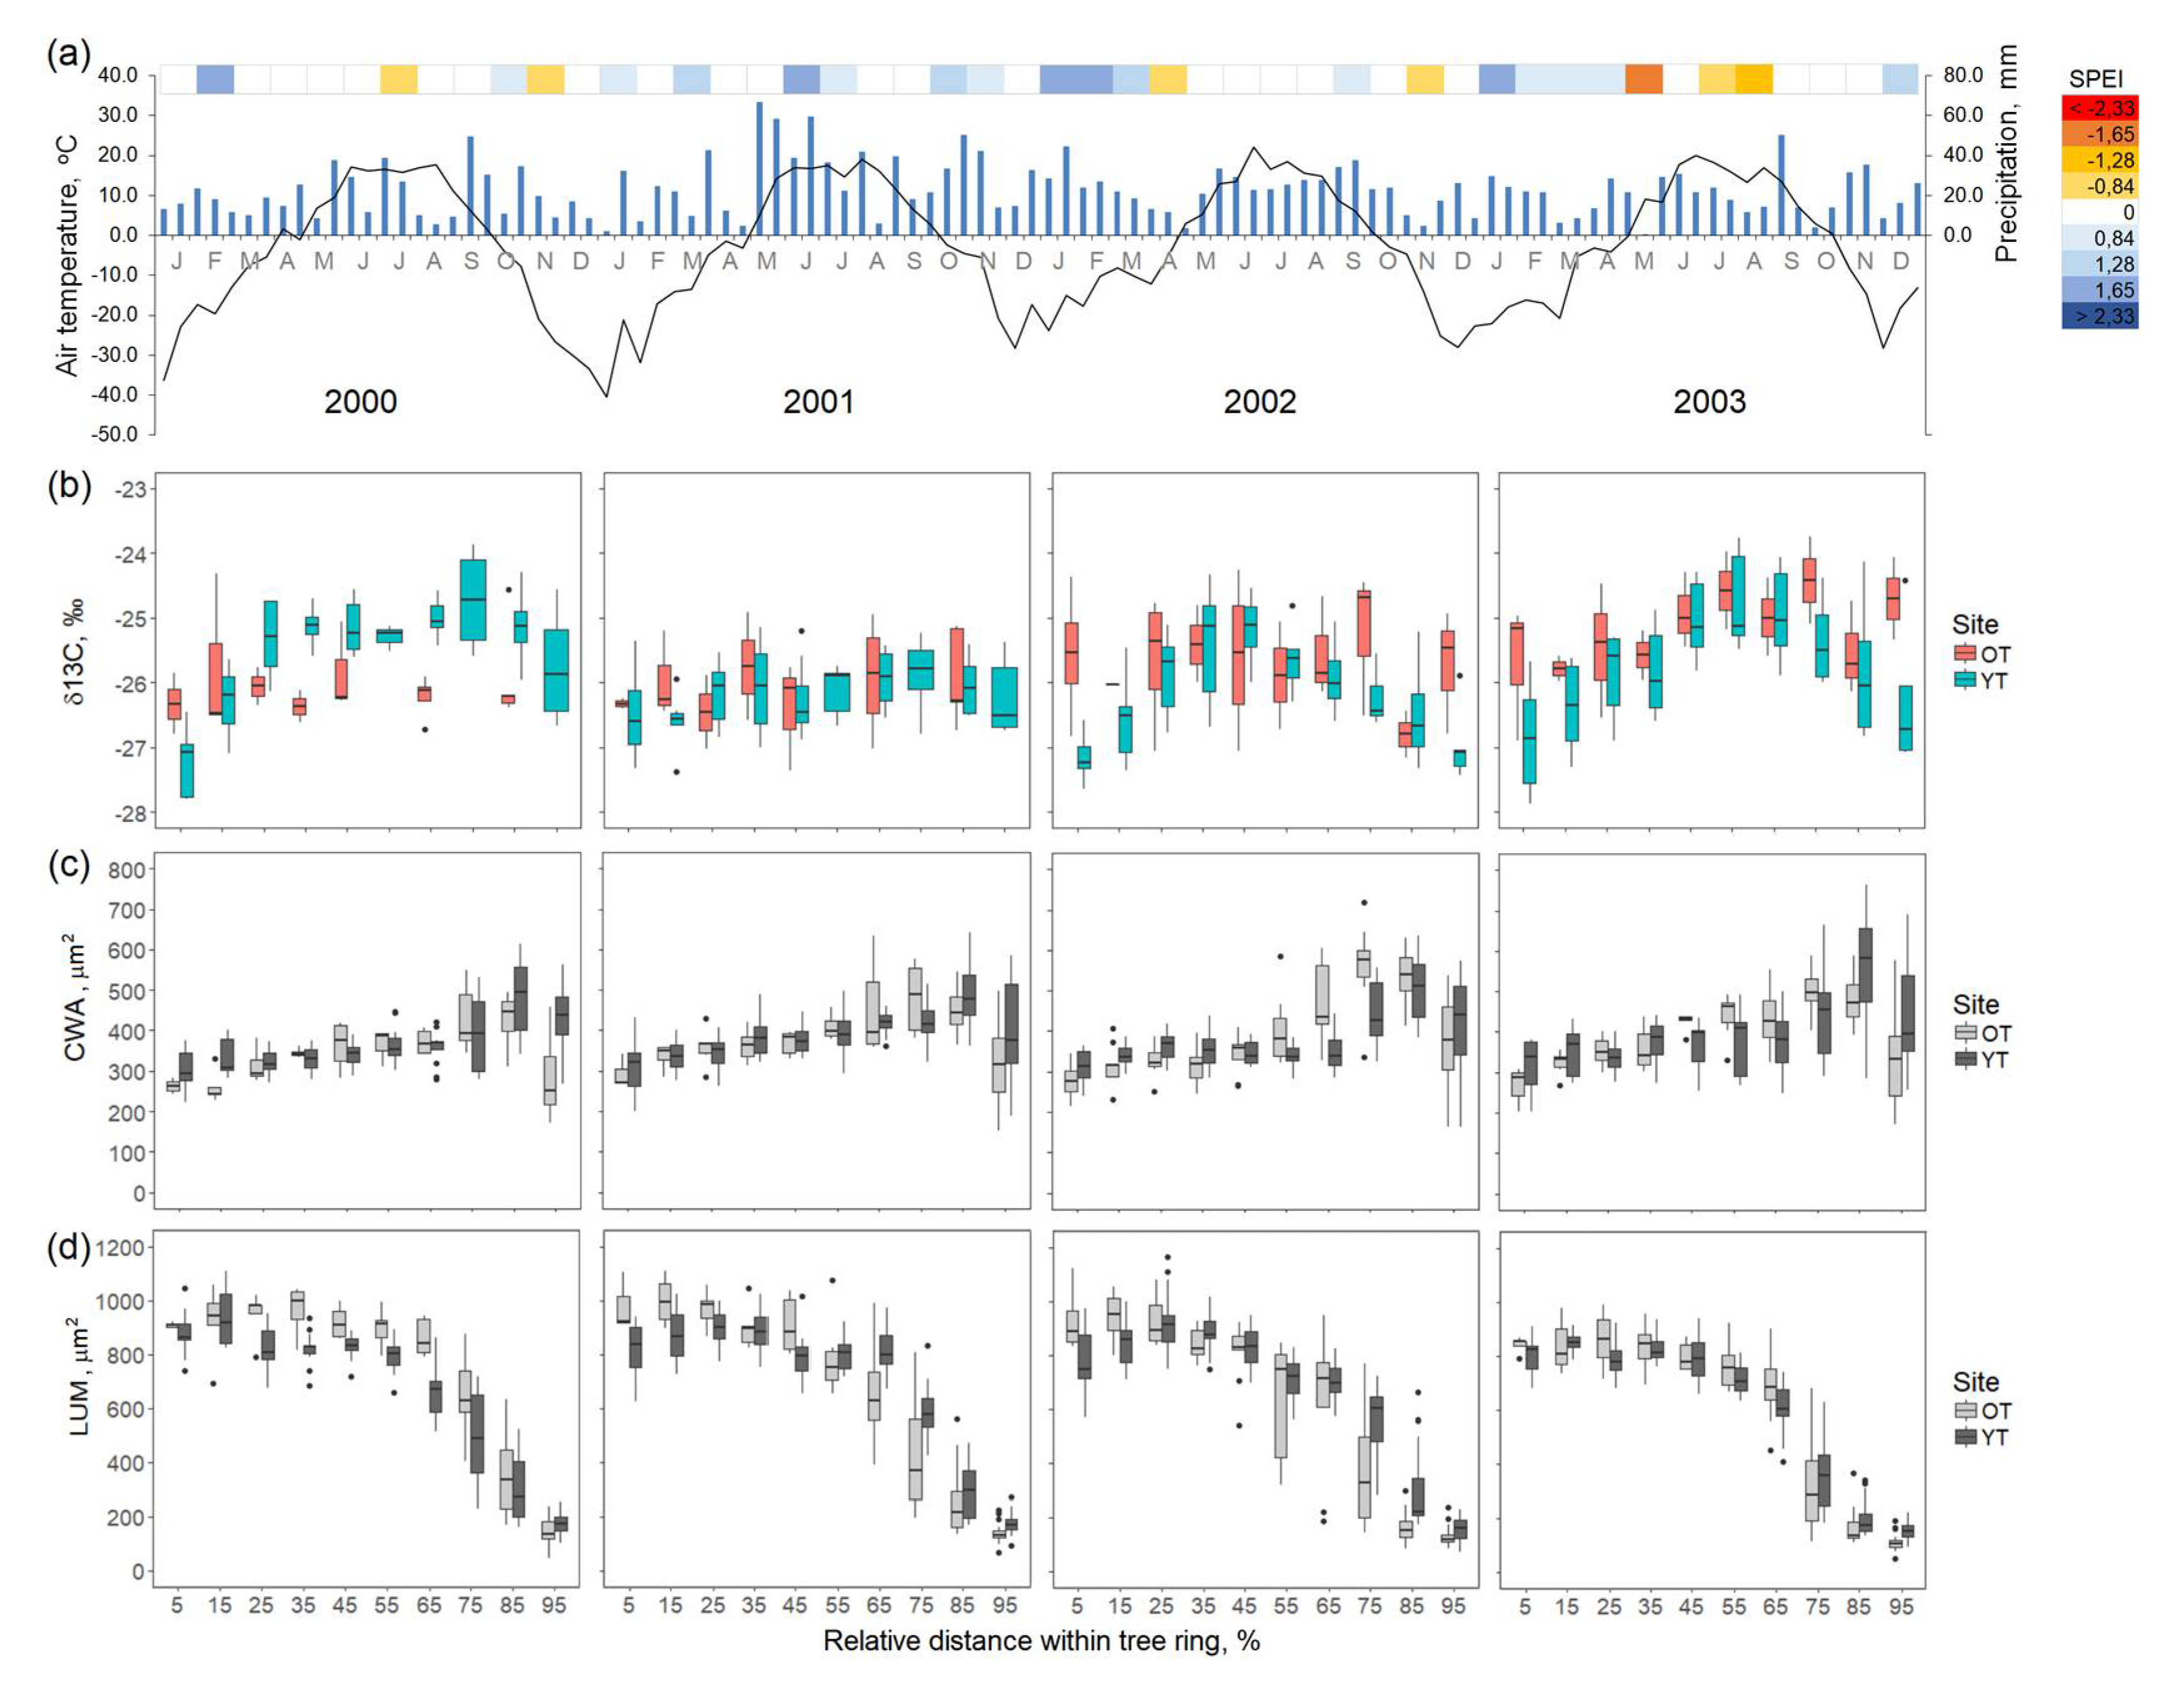
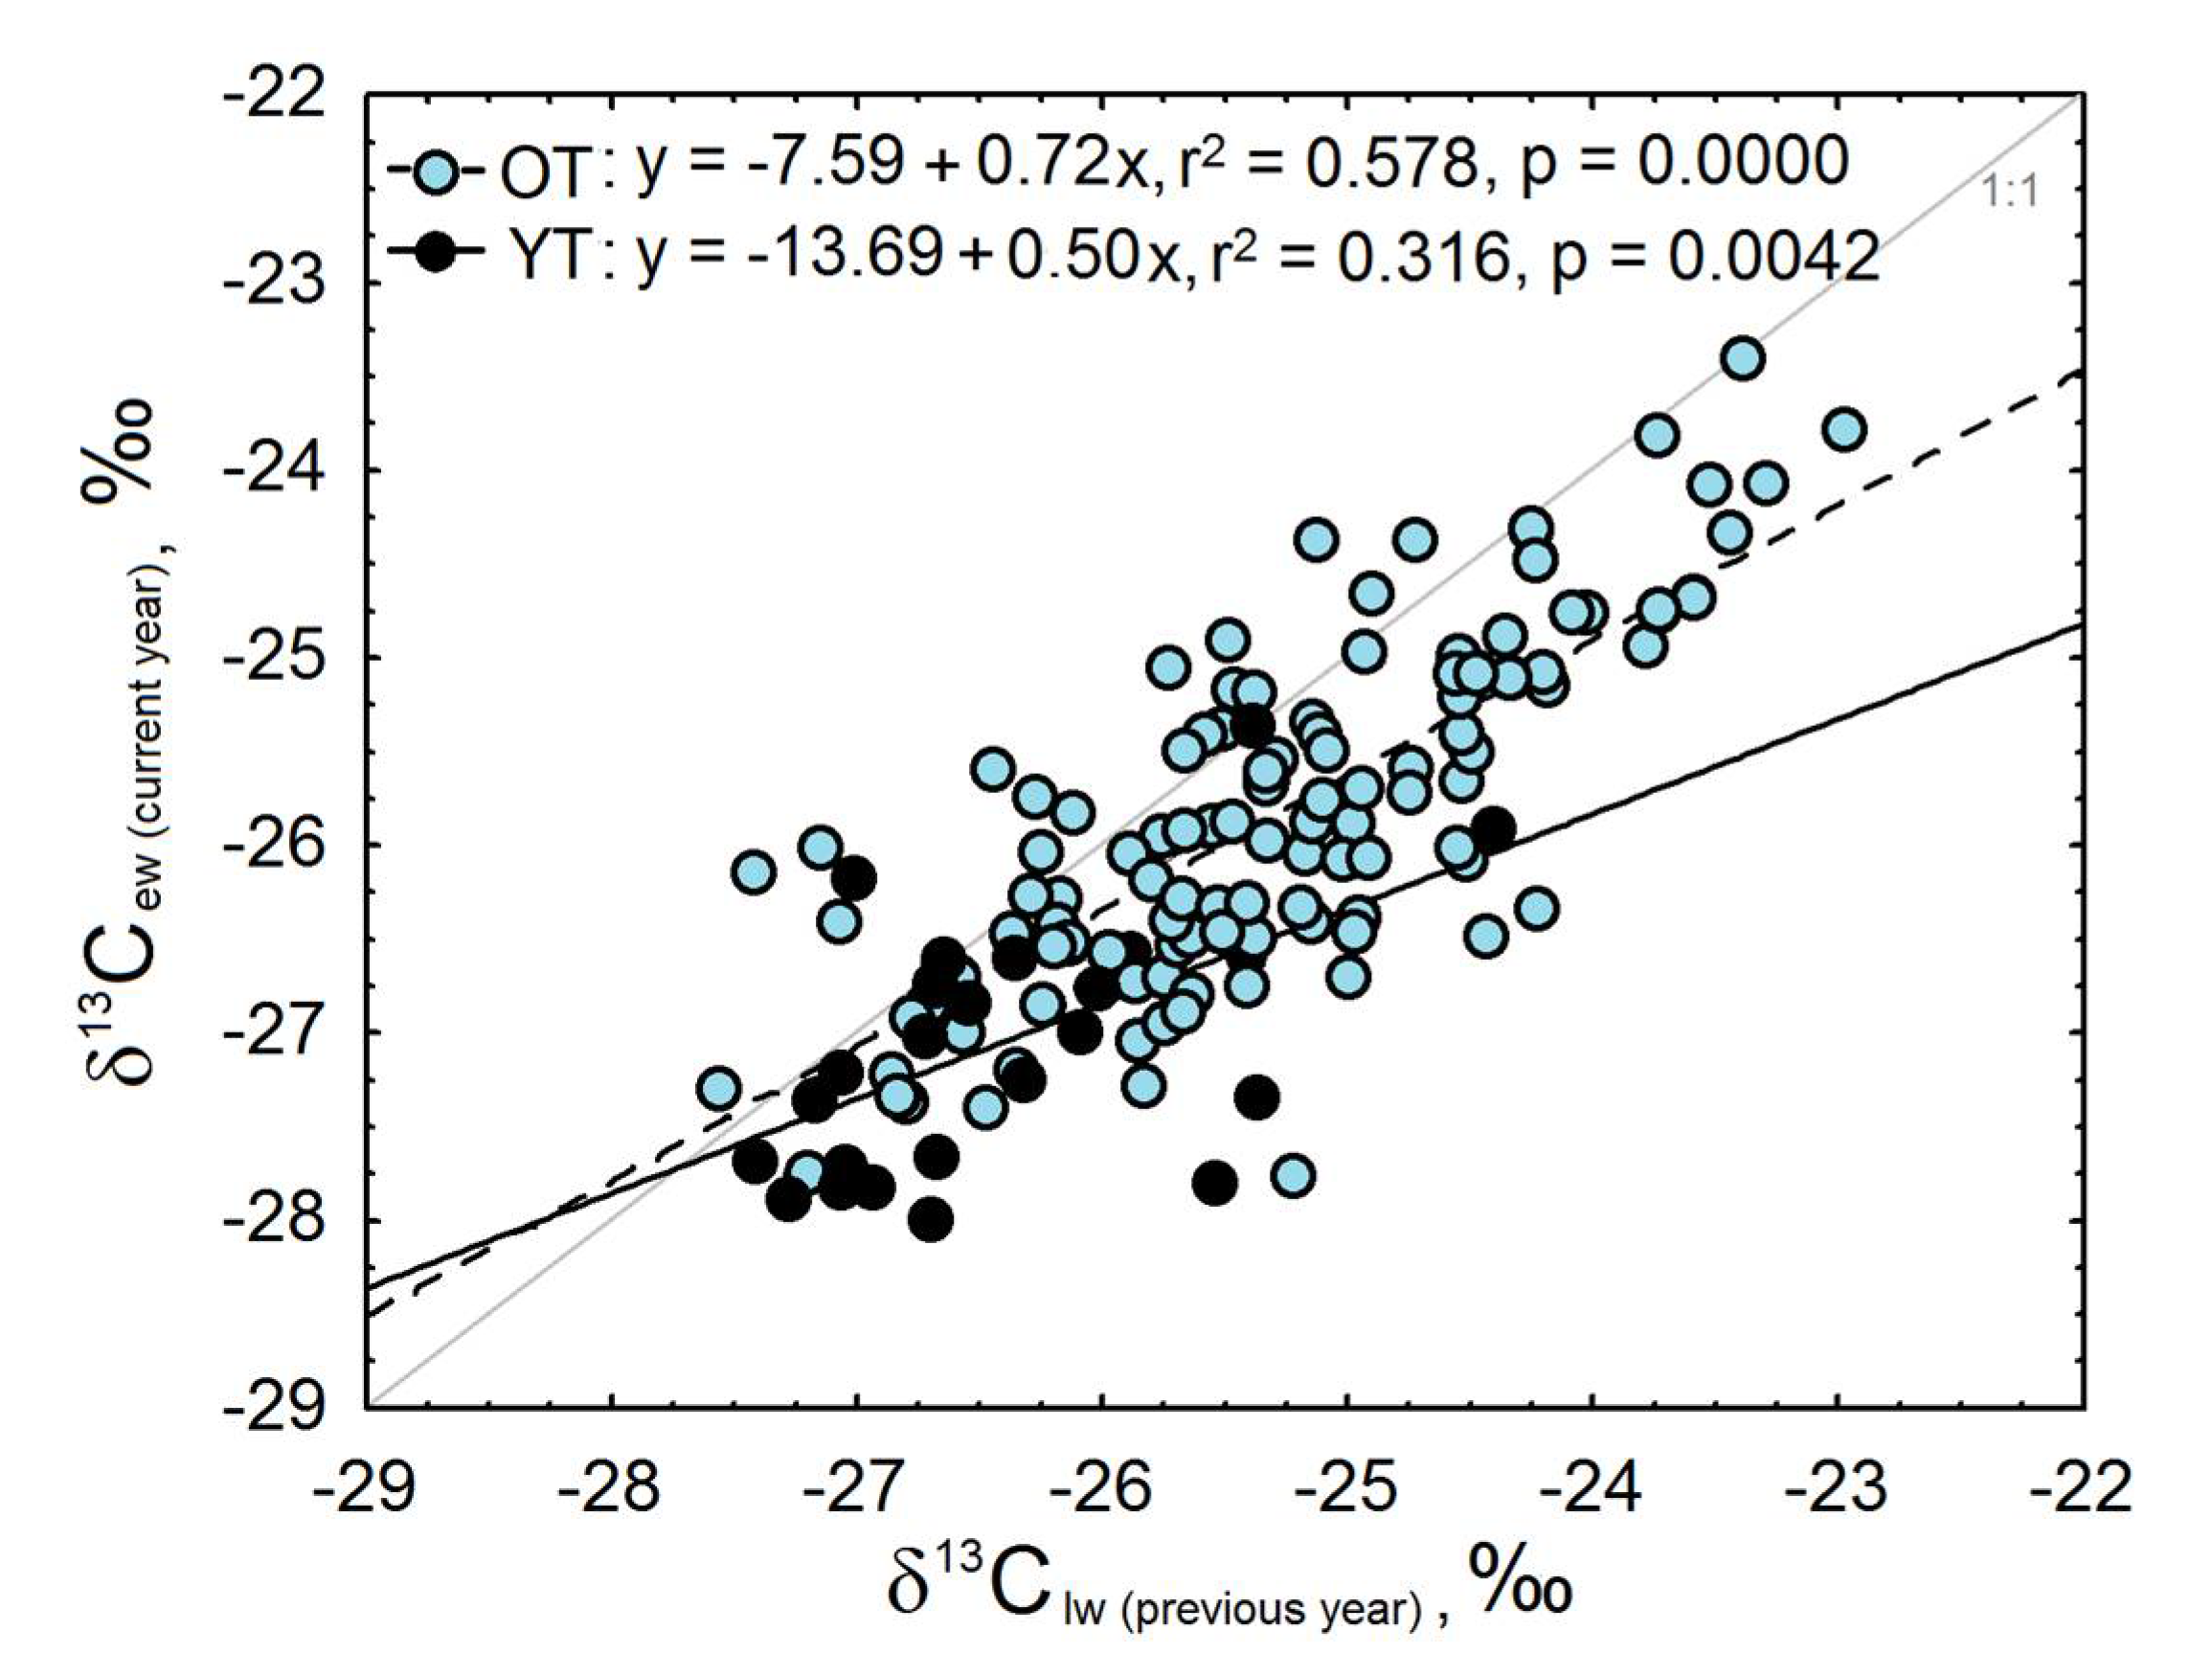
3.4. Xylem Development and Intra-Annual δ13C

Xylogenesis observation performed for the old trees during the year 2000 indicated that the growing season was approximately three months long, from the end of May to the end of August. According to the example shown in Figure 6, the isotopes measurements integrates δ13C fixation of a radial wood sector whose formation required between 4 (in EW) and 8 (in LW) weeks to be formed.
Comparisons of δ13С values between previous latewood and given year earlywood δ13С of bordering rings showed the existence of a significant correlation between the first earlywood cells in a given year (t), and the last latewood tracheids formed in the preceding year (t − 1). The R2 and the slope are higher for OT (R2 = 0.578 and slope = −7.59) than for YT (R2 = 0.316 and slope = −13.6) (Figure 7).

4. Discussion

This study was carried out to assess differences in environmental sensitivity and climatic signals of intra-ring δ13C, cell-wall, and lumen area between old and young trees. Although the study has been performed on two carefully selected and comparable sites, we cannot exclude that the differences observed are uniquely related to age/size, soil properties, management history, and genetic differences. Nevertheless, here we discuss how a different functioning of young and old trees could explain the observed differences in tree-ring anatomical structure and carbon isotope composition.

4.1. Different Climatic Signal and Sensitivity between OT and YT

The long-term (1980–2003) analysis of TRW and mean ring δ13С chronologies performed for the OT have indicated that the trees of the selected area shows a common signal (inter-series correlation of 0.54 and 0.48 for TRW and δ13С) encoding information of past summer temperature (R > 0.4 and 0.6 for TRW and δ13С, see Figure 3). Similarly, although YT chronologies were too short for reliable climate-growth correlation (only 4 years measured), responses of YT δ13С (R = 0.53, p < 0.05) occurred slightly earlier in the season, showing a positive response to late-spring temperatures. This time-shift in climatic signal between the groups is also confirmed when considering the intra-annual observations.
Particularly interesting was the difference observed in the occurrence of maximum values of cell parameters and δ13С along the ring. Although the differences in absolute cell diameter of young and old trees can be explained by biophysical hydraulic constraints related to the ascent of the sap [50,51], LUM and CWA culminated earlier in OT rings than in YT (Figure 5), while latewood δ13С showed a decrease only in YT trees (Figure 4).
The difference observed between the age groups also included differences in the climatic sensitivity, i.e., in the intra- and inter-annual variability of the measured parameters. In general, the young trees displayed higher variability of TRW and δ13С at both intra and inter-annual resolution (Figure 2 and Figure 5). In addition, we could also observe that young trees were still showing an n-shaped intra-annual pattern in the intermediate years (years 2000 and 2002), while the old trees already had a flat type of δ13С (Figure 5). These differences in sensitivity might also be related to the different strength of the autocorrelation observed between the latewood of the previous ring and the earlywood of the current year (Figure 7).

4.2. Growth Rate, Carbon Storage and Tree Size Might Explain the Differences

It is well known that the number of tracheids and their size varies significantly between old and young trees [3,51], being usually less numerous but larger in old trees. The differences observed in the timing and sensitivity between the two groups is consistent with the hypothesis that trees with a higher rate of cell division (more number of cell produced) are also more likely to better express the intra-seasonal signal stored within the ring [25]. The earlier-shifted climatic signal observed for the younger trees supports the hypothesis that younger trees extend the growing season, as also supported by previous study showing an age-depended xylogenesis between adult (40–70 years) and old conifer trees (200–350 years) [25]. Indeed, the longer and faster xylogenetic activity in the younger trees increases the resolution of each tree-ring sector (in this study a laser shot) to better resolve and display the intra-annual climatic signal. In contrast, in older trees the annual ring best integrates the information over the longer period (up to 15–25% longer for cambial activity and cell differentiation, as shown by the climate-growth signal in our data) and increases the response level to climate, as observed for TRW by [52]. In the best of the cases, a laser shot performed in the earlywood of an OT already integrated the wood formed during a time window of up to 4 weeks (Figure 6d). Herewith, since we did not distinguished between formation of primary and secondary walls, nor between deposition of cellulose, hemicelluloses and lignin, the δ13С signal integrated the deposition of all compounds into the whole wood [53].
Another process that might explain the difference in intra-annual pattern among groups might be related to the utilization of carbon reserves from the previous years. It is known that at the end of the growing season, storage reserves can be remobilized in the successive spring to supply the newly forming ring [18]. The results from this study support the evidence that this process is much less pronounced in younger trees. Indeed both the lower autocorrelation between previous latewood and current earlywood (Figure 6) and the higher intra-annual range (with more negative δ13С towards to ring borders) indicate a lower mixture of current year assimilates.
Finally, a last factor that can play a role to explain the difference in intra-annual signal between trees is the impact of tree size on water transport and carbon discrimination. As trees increase in height, the increased gravitational constraint on water path length to reach the upper canopy affects stomatal conductance [54,55], photosynthesis, and eventually isotope discrimination [56]. Associated developmental changes in tree morphology and physiology may further affect isotope discrimination [55,57].

5. Conclusions

The results highlighted in this study on Pinus sylvestris trees of different age growing in the temperature limited Siberian taiga suggest that the climatic information encoded within the annual ring of young and old trees differs. In this environment, age/size appeared to be an important covariate for tree-ring formation, and should therefore be considered when measuring tree-ring proxies at intra-annual resolution. Although the same climate variables control tree growth throughout the lifetime of a tree, the impact of these variables changes with age/size [48] because the time window of tree-ring production shortens and its ability to capture a distinct environment signal decreases. In particular, the extended timing and increased rates of growth of young trees compared to old trees provides YT the ability to better resolve the recorded intra-annual signal over more wood. Indeed, OT trees are less sensitive to shorter environmental changes due to the fact that their functioning relies on or is distributed to a larger biomass (e.g., larger and deeper root system, thicker sapwood and leaf area, more storage), providing a certain short-term resilience [1]. In addition, the earlywood isotopic values of OT encode a larger proportion of remobilized reserves, or have a different discrimination due to more negative water potential and longer water transport; thus, the intra-annual climatic sensitivity is stronger in YT. We therefore conclude that YT actually have a better climatic signal and larger temporal coverage of the growing season (larger ring = higher resolution; longer growing season) than OT. Particular attention should be given to tree age/size when sampling for intra-annual measurements. However, more work is needed to investigate both the ontogenetic (age) effect on intra-annually resolved proxy and their xylogenesis, especially during the tree’s juvenile phase for a better assessment of age/size effect on the intra-annual pattern of the tree-ring proxy. Process-based models as the Vaganov-Shashkin model [16] or MAIDENiso [58] could be useful tools helping to clarify the biological and physical processes influencing δ13С and growth.

Author Contributions

M.V.F., E.A.V., C.W. and E.-D.S. conceived and designed the study; M.V.F. and N.V.A. performed the field and lab work; M.V.F. and A.V.S. analyzed the data; M.V.F., E.A.V., C.W. and E.-D.S. wrote the paper.

Acknowledgments

We thank Willi A. Brand and Petra Linke for their support in isotope analysis, Alexander V. Kirdyanov for his help with tree-ring width measurements, and Patrick Fonti for useful comments and advices. This work was supported by the Alexander von Humboldt fund (Research Award 2003 for E.A.V.) and INTAS YSF Ref. 06-1000014-6300 (awarded for M.V.F.).

Conflicts of Interest

The authors declare no conflict of interest.

References

  1. Meinzer, F.C.; Lachenbruch, B.; Dawson, T.E. Size- and Age-Related Changes in Tree Structure and Function; Springer: Dordrecht, The Netherlands, 2011; Volume 4, 514p, ISBN 978-94-007-1241-6. [Google Scholar]
  2. Schweingruber, F.H. Tree Rings and Environment Dendroecology; Paul Haupt: Bern, Switzerland, 1996; 609p. [Google Scholar]
  3. Fritts, H. Tree Rings and Climate; Academic Press: London, UK; New York, NY, USA, 1976; 582p, ISBN 9780323145282. [Google Scholar]
  4. Brienen, R.J.W.; Gloor, E.; Clerici, S.; Newton, R.; Arppe, L.; Boom, A.; Bottrell, S.; Callaghan, M.; Heaton, T.; Helama, S.; et al. Tree height strongly affects estimates of water-use efficiency responses to climate and CO2 using isotopes. Nat. Commun. 2017, 8, 288. [Google Scholar] [CrossRef] [PubMed]
  5. Cook, E.R.; Kairiukstis, L.A. Methods of Dendrochronology. Application in the Environmental Sciences; Kluwer Academic Publishers: Dordrecht, The Netherlands, 1990; 394p, ISBN 978-0-7923-0586-6. [Google Scholar]
  6. Fonti, P.; Von Arx, G.; García-González, I.; Eilmann, B.; Sass-Klaassen, U.; Gärtner, H.; Eckstein, D. Studying global change through investigation of the plastic responses of xylem anatomy in tree rings. New Phytol. 2010, 185, 42–53. [Google Scholar] [CrossRef] [PubMed]
  7. De Micco, V.; Battipaglia, G.; Brand, W.A.; Linke, P.; Saurer, M.; Aronne, G.; Cherubini, P. Discrete versus continuous analysis of anatomical and δ13C variability in tree rings with intra-annual density fluctuations. Trees Struct. Funct. 2012, 26, 513–524. [Google Scholar] [CrossRef]
  8. Rinne, K.T.; Saurer, M.; Kirdyanov, A.V.; Loader, N.; Bryukhanova, M.V.; Werner, R.; Siegwolf, R.T.W. The relationship between needle sugar carbon isotope ratios and tree rings of larch in Siberia. Tree Physiol. 2015, 35, 1192–1205. [Google Scholar] [CrossRef] [PubMed]
  9. Fritts, H.C.; Vaganov, E.A.; Sviderskaya, I.V.; Shashkin, A.V. Climatic variation and tree-ring structure in conifers: Empirical and mechanistic models of tree-ring width, number of cells, cell size, cell-wall thickness and wood density. Clim. Res. 1991, 1, 97–116. [Google Scholar] [CrossRef]
  10. Pumijumnong, N.; Park, W.K. Vessel chronologies from teak in northern Thailand and their climatic signal. IAWA J. 1999, 20, 285–294. [Google Scholar] [CrossRef]
  11. Panyushkina, I.P.; Hughes, M.K.; Vaganov, E.A.; Munro, M.A.R. Summer temperature in northeastern Siberia since 1642 reconstructed from tracheid dimensions and cell numbers of Larix cajanderi. Can. J. For. Res. 2003, 33, 1905–1914. [Google Scholar] [CrossRef]
  12. Bryukhanova, M.V.; Fonti, P.; Kirdyanov, A.V.; Siegwolf, R.T.W.; Saurer, M.; Pochebyt, N.P.; Churakova (Sidorova), O.V.; Prokushkin, A.S. The response of δ13C, δ18O and cell anatomy of Larix gmelinii tree rings to differing soil active layer depths. Dendrochronologia 2015, 34, 51–59. [Google Scholar] [CrossRef]
  13. Fonti, P.; Babushkina, E.A. Tracheid anatomical responses to climate in a forest-steppe in Southern Siberia. Dendrochronologia 2016, 39, 32–41. [Google Scholar] [CrossRef]
  14. Vieira, J.; Rossi, S.; Campelo, F.; Freitas, H.; Nabais, C. Xylogenesis of Pinus pinaster under a Mediterranean climate. Ann. For. Sci. 2014, 71, 71–80. [Google Scholar] [CrossRef]
  15. Steppe, K.; Sterck, F.; Deslauriers, A. Diel growth dynamics in tree stems: Linking anatomy and ecophysiology. Trends Plant Sci. 2015, 20, 335–343. [Google Scholar] [CrossRef] [PubMed]
  16. Vaganov, E.A.; Hughes, M.K.; Shashkin, A.V. Growth Dynamics of Conifer Tree Rings: Images of Past and Future Environments; Springer: Berlin/Heidelberg, Germany, 2006; Volume 183, 354p, ISBN 978-3-540-26086-8. [Google Scholar]
  17. Cuny, H.E.; Rathgeber, C.B.K.; Frank, D.; Fonti, P.; Mäkinen, H.; Prislan, P.; Rossi, S.; Martinez del Castillo, E.; Campelo, F.; Vavrčík, H.; et al. Woody biomass production lags stem-girth increase by over one month in coniferous forests. Nat. Plants 2015, 1, 1–6. [Google Scholar] [CrossRef] [PubMed]
  18. Kagawa, A.; Sugimoto, A.; Maximov, T.C. Seasonal course of translocation, storage and remobilization of 13CO2 pulse-labelling photoassimilate in naturally growing Larix gmelini saplings. New Phytol. 2006, 171, 793–804. [Google Scholar] [CrossRef] [PubMed]
  19. Skomarkova, M.V.; Vaganov, E.A.; Mund, M.; Knohl, A.; Linke, P.; Boerner, A.; Schulze, E.-D. Inter-annual and seasonal variability of radial growth, wood density and carbon isotope ratios 13С/12С in tree rings of beech (Fagus sylvatica) growing in Germany and Italy. Trees Struct. Funct. 2006, 20, 571–586. [Google Scholar] [CrossRef]
  20. Vaganov, E.A.; Schulze, Е.-D.; Skomarkova, M.V.; Knohl, A.; Brand, W.A.; Roscher, C. Intra-annual variability of anatomical structure and δ13С values within tree rings of spruce and pine in alpine, temperate and boreal Europe. Oecologia 2009, 161, 729–745. [Google Scholar] [CrossRef] [PubMed]
  21. Krepkowski, J.; Gebrekirstos, A.; Shibistova, O.; Bräuning, A. Stable carbon isotope labeling reveals different carry-over effects between functional types of tropical trees in an Ethiopian mountain forest. New Phytol. 2013, 199, 431–440. [Google Scholar] [CrossRef] [PubMed] [Green Version]
  22. Campelo, F.; Vieira, J.; Battipaglia, G.; de Luis, M.; Nabais, C.; Freitas, H.; Cherubini, P. Which matters most for the formation of intra-annual density fluctuations in Pinus pinaster: Age or size? Trees Struct. Funct. 2015, 29, 237–245. [Google Scholar] [CrossRef]
  23. Connor, K.F.; Lanner, R.M. Effects of tree age on secondary xylem and phloem anatomy in stems of Great Basin bristlecone pine (Pinus longaeuai). Am. J. Bot. 1990, 77, 1070–1077. [Google Scholar] [CrossRef]
  24. Briand, C.H.; Posluszny, U.; Larson, D.W. Influence of age and growth rate on radial anatomy of annual rings of Thuja occidentalis L. (eastern white cedar). Int. J. Plant Sci. 1993, 154, 406–411. [Google Scholar] [CrossRef]
  25. Rossi, S.; Deslauriers, A.; Anfodillo, T.; Carrer, M. Age-dependent xylogenesis in timberline conifers. New Phytol. 2008, 177, 199–208. [Google Scholar] [CrossRef] [PubMed]
  26. Bryukhanova, M.V.; Kirdyanov, A.V.; Prokushkin, A.S.; Silkin, P.P. Specific features of xylogenesis in Dahurian larch, Larix gmelinii (Rupr.) Rupr., growing on permafrost soils in Middle Siberia. Russ. J. Ecol. 2013, 44, 361–366. [Google Scholar] [CrossRef]
  27. Montwé, D.; Spiecker, H.; Hamann, A. An experimentally controlled extreme drought in a Norway spruce forest reveals fast hydraulic response and subsequent recovery of growth rates. Trees Struct. Funct. 2014, 28, 891–900. [Google Scholar] [CrossRef]
  28. Gessler, A.; Ferrio, J.P.; Hommel, R.; Treydte, K.; Werner, R.A.; Monson, R.K. Stable isotopes in tree rings: Towards a mechanistic understanding of isotope fractionation and mixing processes from the leaves to the wood. Tree Physiol. 2014, 34, 796–818. [Google Scholar] [CrossRef] [PubMed]
  29. Prendin, A.L.; Petit, G.; Fonti, P.; Rixen, C.; Dawes, M.A.; von Arx, G. Axial xylem architecture of Larix decidua exposed to CO2 enrichment and soil warming at the treeline. Funct. Ecol. 2018, 32, 273–287. [Google Scholar] [CrossRef]
  30. Furyaev, V.V.; Vaganov, E.A.; Tchebakova, N.M.; Valendik, E.N. Effects of fire and climate on succession and structural changes in the Siberian boreal forest. Eur. J. For. Res. 2001, 2, 1–15. [Google Scholar]
  31. Wirth, C.; Schulze, E.-D.; Schulze, W.; von Stunzner-Karbe, D.; Ziegler, W.; Miljukowa, I.M.; Sogatchev, A.; Varlagin, A.B.; Panvyorov, M.; Grigoriev, S.; et al. Above-ground biomassand structure of pristine Siberian Scots pine forests as controlled by competition and fire. Oecologia 1999, 121, 66–80. [Google Scholar] [CrossRef] [PubMed]
  32. Wirth, C.; Schulze, E.-D.; Luhker, B.; Grigoriev, S.; Siry, M.; Hardes, G.; Ziegler, W.; Backor, M.; Bauer, G.; Vygodskaya, N.N. Fire and site type effects on the long-term carbon and nitrogen balance in pristine Siberian Scots pine forests. Plant Soil 2002, 242, 41–63. [Google Scholar] [CrossRef]
  33. Panov, A.V.; Onuchin, A.A.; Zrazhevskaya, G.K.; Shibistova, O.B. Structure and dynamics of organic matter pools in clearings in the lichen pine forests of middle taiga subzone of Yenisei Siberia. Izvestiya Akademii Nauk Seriya Biologicheskaya 2012, 6, 658–666. (In Russian) [Google Scholar] [CrossRef]
  34. Glebov, F.Z. Bogs and Wetlands of the Forest Zone of the Yenisei Left-Bank; Nauka: Moscow, Russia, 1969; 132p. (In Russian) [Google Scholar]
  35. Walter, H.; Lieth, H. Klimadiagramm Weltatlas; Fischer: Jena, Germany, 1967. [Google Scholar]
  36. Rinn, F. Tsap V 3.6 Reference Manual: Computer Program for Tree-Ring Analysis and Presentation; Bierhelder weg 20, D-69126; RINNTECH: Heidelberg, Germany, 1996; 263p. [Google Scholar]
  37. Cook, E.R.; Peters, K. The smoothing spline: A new approach to standardizing forest interior tree-ring width series for dendroclimatic studies. Tree Ring Bull. 1981, 41, 45–53. [Google Scholar]
  38. Holmes, R.L. Program COFECHA: Version 3; The University of Arizona: Tucson, AZ, USA, 1992. [Google Scholar]
  39. Furst, G.G. Methods of Anatomical and Histochemical Research of Plant Tissue; Nauka: Moscow, Russia, 1979; 156p. (In Russian) [Google Scholar]
  40. Vaganov, E.A.; Shashkin, A.V.; Sviderskaya, I.V.; Vysotskaya, L.G. Histometric Analysis of Woody Plant Growth; Nauka: Novosibirsk, Russia, 1985; 108p. (In Russian) [Google Scholar]
  41. Munro, M.A.R.; Brown, P.M.; Hughes, M.K.; Garcia, E.M.R. Image analysis of tracheid dimensions for dendrochronological use. In Tree Rings, Environment and Humanity, Proceedings of the International Conference, Tucson, Arizona, 17–21 May 1994; Dean, J.S., Meko, D.M., Swetnam, T.W., Eds.; Radiocarbon: Tucson, AZ, USA, 1996; pp. 843–852. [Google Scholar]
  42. Denne, M.P. Definition of latewood according to Mork (1928). IAWA J. 1989, 10, 59–62. [Google Scholar] [CrossRef]
  43. Vaganov, E.A. The traheidogram method in tree-ring analysis and its application. In Methods of Dendrochronology. Application in Environmental Sciences; Kluwer Academic Publishers: Dordrecht, The Netherlands; Boston, MA, USA; London, UK, 1990; pp. 63–75. ISBN 978-0-7923-0586-6. [Google Scholar]
  44. Astrahantseva, N.V.; Cherkashin, V.P.; Stasova, V.V.; Antonova, G.F. The structure and development of secondary xylem and secondary phloem in the stems of Pinus sylvestris (Pinaceae) trees with different growth rates. Russ. J. Bot. (Botanicheskiy zhurnal) 2010, 95, 190–202. (In Russian) [Google Scholar]
  45. Schulze, B.; Wirth, C.; Linke, P.; Brand, W.A.; Kuhlmann, I.; Horna, V.; Schulze, E.-D. Laser-Ablation-Combustion-GC-IRMS—A new method for online analysis of intra-annual variation of δ¹³С in tree ring. Tree Physiol. 2004, 24, 1193–1201. [Google Scholar] [CrossRef] [PubMed]
  46. Guerrieri, R.; Jennings, K.; Belmecheri, S.; Asbjornsen, H.; Ollinger, S. Evaluating climate signal recorded in tree-ring δ13C and δ18O values from bulk wood and α-cellulose for six species across four sites in the northeastern US. Rapid Commun. Mass Spectrom. 2017, 31, 2081–2091. [Google Scholar] [CrossRef] [PubMed]
  47. Benkova, V.E.; Shashkin, A.V.; Naurzbaev, M.M.; Prokushkin, A.S.; Simanko, V.V. The importance of microecological conditions for growth of Larix gmelinii at the timberline on Taimyr Peninsula. Russ. J. For. (Lesovedenie) 2012, 5, 59–70. (In Russian) [Google Scholar]
  48. Fonti, P.; Bryukhanova, M.V.; Myglan, V.S.; Kirdyanov, A.V.; Naumova, O.V.; Vaganov, E.A. Temperature-induced responses of xylem structure of Larix Sibirica Ldb. (Pinaceae) from Russian Altay. Am. J. Bot. 2013, 100, 1332–1343. [Google Scholar] [CrossRef] [PubMed]
  49. Vincente-Serrano, M.S.; Begueria, S.; Lopez-Moreno, J.I. A Multiscalar Drought Index Sensitive to Global Warming: The Standardized Precipitation Evapotranspiration Index. J. Clim. 2010, 23, 1696–1718. [Google Scholar] [CrossRef] [Green Version]
  50. Anfodillo, T.; Petit, G.; Crivellaro, A. Axial conduit widening in woody species: A still neglected anatomical pattern. IAWA J. 2013, 34, 352–364. [Google Scholar] [CrossRef]
  51. Carrer, M.; Von Arx, G.; Castagneri, D.; Petit, G. Distilling allometric and environmental information from time series of conduit size: The standardization issue and its relationship to tree hydraulic architecture. Tree Physiol. 2015, 35, 27–33. [Google Scholar] [CrossRef] [PubMed]
  52. Carrer, M.; Urbinati, C. Age-dependent tree-ring growth responses to climate in Larix decidua and Pinus cembra. Ecology 2004, 85, 730–740. [Google Scholar] [CrossRef]
  53. Boerjan, W.; Ralph, J.; Baucher, M. Lignin Biosynthesis. Annu. Rev. Plant Biol. 2003, 54, 519–546. [Google Scholar] [CrossRef] [PubMed]
  54. Koch, G.W.; Sillett, S.C.; Jennings, G.M.; Davis, S.D. The limits to tree height. Nature 2004, 428, 851–854. [Google Scholar] [CrossRef] [PubMed] [Green Version]
  55. Niinemets, Ü. Stomatal conductance alone does not explain the decline in foliar photosynthetic rates with increasing tree age and size in Picea abies and Pinus sylvestris. Tree Physiol. 2002, 22, 515–535. [Google Scholar] [CrossRef] [PubMed]
  56. Farquhar, G.D.; Ehleringer, J.R.; Hubick, K.T. Carbon isotope discrimination and photosynthesis. Annu. Rev. Plant Physiol. Plant Mol. Biol. 1989, 40, 503–537. [Google Scholar] [CrossRef]
  57. Steppe, K.; Niinemets, Ü.; Teskey, R.O. Tree Size- and Age-Related Changes in Leaf Physiology and Their Influence on Carbon Gain. In Size- and Age-Related Changes in Tree Structure and Function; Meinzer, F.C., Lachenbruch, B., Dawson, T.E., Eds.; Springer: Dordrecht, The Netherlands, 2011; Volume 4, pp. 235–253. ISBN 978-94-007-1241-6. [Google Scholar]
  58. Danis, P.-A.; Hatté, C.; Misson, L.; Guiot, J. MAIDENiso: A multiproxy biophysical model of tree-ring width and oxygen and carbon isotopes. Can. J. For. 2012, 42, 1697–1713. [Google Scholar] [CrossRef]
Figure 1. Photo of (a) the old (OT) and (b) the young (YT) Pinus sylvestris L. stands selected for the study; and (c) climatic diagram of the studied area (monthly average data from the meteorogical station of Bor from 1936 to 2006). Blue line = precipitation, Red line = temperature, Hatched area indicates the period with a positive hydrological balance.
Forests 09 00364 g001
Figure 2. Tree-ring width (a) and δ¹³С (b) time series of old (OT) and young (YT) trees. Thin lines are individual chronologies; bold lines are mean chronologies.
Forests 09 00364 g002
Figure 3. Moving correlation (20 days window with 10 days step) between different tree-ring parameters and air temperature for the period from 1980 to 2003 for the old pine trees (OT-site). Horizontal lines indicate the significance level at p < 0.05. TRW—tree-ring width, EWW—earlywood width, LWW—latewood width, δ13С—mean value of whole tree ring, δ13Сew—mean value of earlywood, δ13Сlw—mean value of latewood.
Forests 09 00364 g003
Figure 4. Intra-annual δ13C distribution within tree rings of old (OT) and young (YT) trees, aligned to the earlywood-latewood transition (i.e., negative values—earlywood, positive values-latewood). The relative distance from the transition has been calculated has the departure from the earlywood-latewood transition to allow comparisons between ring of different size.
Forests 09 00364 g004
Figure 5. Overview of climatic conditions and intra-annual isotopes and cell anatomical characteristics over the years 2000 to 2003 grouped by age-classes (YT = young trees; OT = old trees). (a) Description of the climatic conditions with monthly SPEI (standardized precipitation evapotranspiration index) on the upper scale and plot of bi-weekly temperature (line) and precipitation (column); (b) intra-annual δ13C, (c) cell-wall area (CWA), (d) lumen area (LUM).
Forests 09 00364 g005
Figure 6. Time assignment of intra-annual δ13С measurements. (a) Image of a Pinus sylvestris L. core (tree number 5, OT) used for δ13С measurement. The series of vertical marks spaced by 100 μm and with a shift of 50 μm shown on the wood cross-section of the core shows the position of the 80 μm width laser shots used for δ13С measurement; (b) Image of a micro-section of the tree ring formed in 2000. Rectangle indicates the laser shoot position within tree ring; (c) Curves of the total non-mature (NC) and mature (MC) number of cells counted during the 2000 growing season. Lines indicate a fifth-order polynomial fitting. The horizontal distance between the two curves indicates the time spent by each cell in the enlarging and wall thickening phase; (d) Plot of the measured δ13С aligned along a temporal axis corresponding to the time of formation of the ring sector used for isotopes measurements, as derived according to the description above.
Forests 09 00364 g006
Figure 7. Relation between δ13С from previous latewood and current earlywood of two bordering rings and differentiated by age classes. OT = old trees, YT = young trees.
Forests 09 00364 g007
Table 1. Mean values of tree-ring parameters grouped by young and old trees (EW—earlywood, LW—latewood, D—tracheid radial diameter, CWT—cell-wall thickness, CWA—cell-wall area, LUM—lumen area).
ParameterYoung TreesOld Trees
RingEWLWRingEWLW
Width, mm3.092.620.470.520.390.13
Cell number73551815105
D, μm33.336.621.730.937.616.7
CWT, μm3.73.15.73.73.34.7
CWA, μm2395.3375.3464.3377.2386.2358.9
LUM, μm2603.0723.7187.6550.3744.8150.5
δ13С, ‰−25.93−25.89−26.04−25.50−25.61−25.19

