Genetic Diversity and Structure through Three Cycles of a Eucalyptus urophylla S.T.Blake Breeding Program


1
China Eucalypt Research Centre, Chinese Academy of Forestry, 30 Mid Renmin Dadao, Zhanjiang 524022, China
2
Forest Science Institute, Dongmen State Forest Farm, Fusui 532108, China
*
Author to whom correspondence should be addressed.
Forests 2018, 9(7), 372; https://doi.org/10.3390/f9070372
Submission received: 17 April 2018
/
Revised: 15 June 2018
/
Accepted: 15 June 2018
/
Published: 21 June 2018
(This article belongs to the Special Issue Genetic and Morphological Variation in Tropical and Temperate Plant Species)
Abstract
:Eucalyptus urophylla S.T.Blake is an important commercial tropical plantation species worldwide. In China, a breeding program for this species has progressed through three cycles but genetic diversity and structure in the breeding populations are uncertain. A sampling of field trials from these populations was carried out to evaluate their genetic diversity and structure using 16 microsatellite loci. Significant deviations from Hardy-Weinberg equilibrium were recorded at all 16 loci in the populations. Overall expected and observed heterozygosity (He and Ho) estimates of 0.87 and 0.59 respectively for the first cycle population, and 0.88 and 0.60 respectively for the third cycle population, revealed reasonably high levels of genetic diversity. The genetic differentiation coefficient (Fst) revealed low differentiation among pairs of provenances (from the species’ native range) comprising the first cycle population (range: 0.012–0.108), and AMOVA results showed that the majority of molecular genetic variation existed among individuals rather than among provenances for the first cycle population and among individuals rather than among field trial sources in the third cycle population. Levels of genetic diversity appeared to remain unchanged from the first to third cycle populations, and the results indicate prospects for maintaining if not increasing diversity through recurrent breeding. Likely effects of artificial directional selection, prior to sampling, on both populations examined are discussed along with implications for future E. urophylla breeding.
1. Introduction
Eucalyptus urophylla S.T.Blake is a tall forest tree that has a natural distribution spanning seven of the Lesser Sunda Islands in eastern Indonesia, where it is mostly found growing on volcanically derived soils, and it also extends into East Timor. Across this natural range, the species can vary from a tall forest tree up to 45 m high to a shrub like form of less than 2 m [1,2]. Cross-pollination in the species is mostly effected by insects and birds [3] and though self-compatible, it is predominantly outcrossing but with a mixed mating system in natural stands [4]. On lower slopes it often co-occurs with Eucalyptus alba Reinw. ex Blume in mosaic stands [1] and it was only in 1977 that E. urophylla was described as a species separate from E. alba [3].
As an exotic forest plantation species E. urophylla is now one of the most commercially important hardwood species worldwide. Both the pure species and hybrid varieties involving this species (most commonly with Eucalyptus grandis W.Hill ex Maiden) are the foundation of substantial areas of commercial plantations in tropical and warmer subtropical regions for the production of pulpwood, fuelwood, poles, veneer logs and even saw logs [2,5,6]. It was first introduced to China in 1971 [7] and by mid-1990s the species and its hybrids had become leading genetic material for commercial plantations established in tropical and warmer sub-tropical areas of southern China [8,9]. Today in this country, there are over three million hectares of plantations established with hybrid varieties of this species, and this resource provides livelihoods for hundreds of thousands of people [10].
Following the phenotypic diversity observed in the species for growth and stem-form through its natural range, high levels of genetic diversity have been recorded across this range through designed genetic field trials. Phenotypic observations/measurements on quantitative traits have been carried out in various statistically designed provenance/family cum progeny field trials of this species to examine genetic variability and diversity in adaptive and economically important growth, stem form and wood quality traits. Examples of such work with E. urophylla are provided by Hodge and Dvorak [11], who reported results for 65 provenances originating from the seven Indonesian islands where the species occurs naturally, that were tested in a series of 125 provenance/progeny trials planted in five countries, and by Kien et al. [12] who reported results on 144 families, representing 9 provenances, tested in two field trials located in northern Vietnam.
Genetic variation and relationships among and within natural populations of E. urophylla have also been examined in a number of molecular genetic studies. House and Bell [4] examined material from across the species’ full natural range by using isozymes and found that most of the genetic diversity of the species was attributed to variation within populations. In contrast, they found that genetic differences between populations, at least for the isozymes examined, appeared to be small, while no striking patterns relating to geography were detected. Similarly, Payn et al. [13] and Payn et al. [14] investigated genetic diversity and geographical distribution of chloroplast DNA variations in the species and found moderate to high levels of genetic diversity throughout its geographic range (He = 0.70–0.78). However, the latter of these studies also found relatively low genetic differentiation among populations (Fst = 0.03), which the authors took to indicate low levels of recurrent gene flow among the Indonesian islands of the species occurrence.
In a separate study Tripiana et al. [15] used 10 microsatellite markers to study 360 seedlings, representing 49 provenances (referred to by them as “subpopulations”), spanning E. urophylla’s natural range in Indonesia and East Timor, which they grouped into 17 “natural populations”, in order to assess the species’ genetic diversity and structure. They found that microsatellite heterozygosity was moderate to high within populations (Ho = 0.51–0.72) based on the loci they examined. They also found that the index of fixation was significantly different from zero for all populations (FIS = 0.13–0.31), whilst the differentiation among populations was low (Fst = 0.04) and not significantly different from zero, due to extensive gene flow across the species’ natural range via pollen flow. They also suggested that the FIS values observed might have been due to a Wahlund effect. The latter effect arises when two genetically distinct groups are (inadvertently or intentionally) lumped into a single sampling unit, either because they co-occur but rarely interbreed, or because the spatial scale chosen for sampling is larger than the true scale of a population (or of a subpopulation, depending on the definitions used for these terms). This Wahlund effect (substructure within populations) can lead to heterozygote deficits and deviations from Hardy-Weinberg equilibrium (HWE) [16,17].
However, despite the convincing evidence presented by such molecular genetic studies on E. urophylla, it is noteworthy that House and Bell [4] saw a paradox in that an apparent lack of, or at least relative minor, differentiation between populations of E. urophylla from its natural range found in isozyme, and subsequently also in molecular genetics studies, seemed somewhat contradictory compared to a high degree of population differentiation for morphological/adaptive traits. Pryor et al.’s [1] detailed study on morphological features from 23 populations across E. urophylla’s natural range supported the identification of three separate taxa from within the species: E. urophylla, Eucalyptus orophila L.D.Pryor and Eucalyptus wetarensis L.D. Pryor. Indeed House and Bell’s [4] study identified a large degree of allelic diversity between the genetic material originating from the island of Wetar and that originating from other islands; the former populations having been classified as E. wetarensis by Pryor et al. [1]. Although such division into separate species has generally not yet been accepted either by eucalypt growers or researchers, a recently published taxonomic classification of Eucalyptus species does identify E. urophylla, E. orophila and E. wetarensis as separate species [18].
Though studies such as those cited above [1,4,11,12,14,15] have provided excellent insights into the natural populations of E. urophylla, today most commercial growers of the species no longer focus on genetic material collected directly from natural populations. Worldwide, many E. urophylla improvement programs have already captured in their breeding populations diverse genetic material originating from the species’ natural range, and out of the initial breeding populations most of them have by now progressed through several cycles of selection and breeding.
During the 1980s and 1990s genetically diverse seedlots of E. urophylla were imported to China for the establishment of a base population to support ongoing genetic improvement [9,19]. With this material a first cycle breeding population of E. urophylla was established as a series of field trials during the period 1988 to 1998 and included over 400 open-pollinated families representing 30 provenances from the species’ natural range along with families and seedlots from various planted stands/exotic seed sources. Then in 2004 a second cycle breeding population of E. urophylla was established in China as a single field trial, with open-pollinated (OP) seed collected from selected plus-trees of the first cycle population (i.e., OP families). In 2006, a Chinese cooperative tree improvement program was initiated involving commercial growers and a number of government research institutes. Through this cooperative program, a third cycle breeding population for E. urophylla was established in 2010, with material selected from both the first and the second cycle populations.
How much genetic diversity is currently present in the third cycle breeding population of E. urophylla in China, and how this has been affected by the preceding cycles of selection, are critical questions. Maintaining broad genetic diversity through the successive cycles of breeding is essential for achieving genetic gains from both the current and future cycles of this species. Variation is needed in key economic traits, so that artificial selection can ultimately result in heritable genetic improvements [2]. The genetic diversity—quantifiable, unquantifiable and/or “cryptic”—will serve as the primary basis for adaptation to future biotic and abiotic challenges, and selection for traits not currently seen or linked to economic values, e.g. adaptation to future climatic shifts and/or emergence of new pathogens [15].
Thus, the present study was initiated in order to examine the first and third cycle E. urophylla breeding populations in China, using molecular genetic markers with the following specific objective: To evaluate the potential loss of genetic diversity through breeding cycles by comparing the genetic diversity, being assessed by molecular markers, between the founding (first cycle) and the descendent (third cycle) breeding populations. The parameters estimated in this study will also provide a benchmark for comparison with future, successive breeding populations.
2. Materials and Methods
2.1. Plant Material
The natural stand origins of some of the genetic materials included in the breeding populations and examined in this study are known to be on the island of Wetar, Indonesia, and thus could be classified as E. wetarensis according to Pryor et al. [1] and Nicole [18]. However, for the purpose of the study reported here, the taxonomic classification of E. urophylla according to Brooker [20], is followed and all material involved is referred to as E. urophylla.
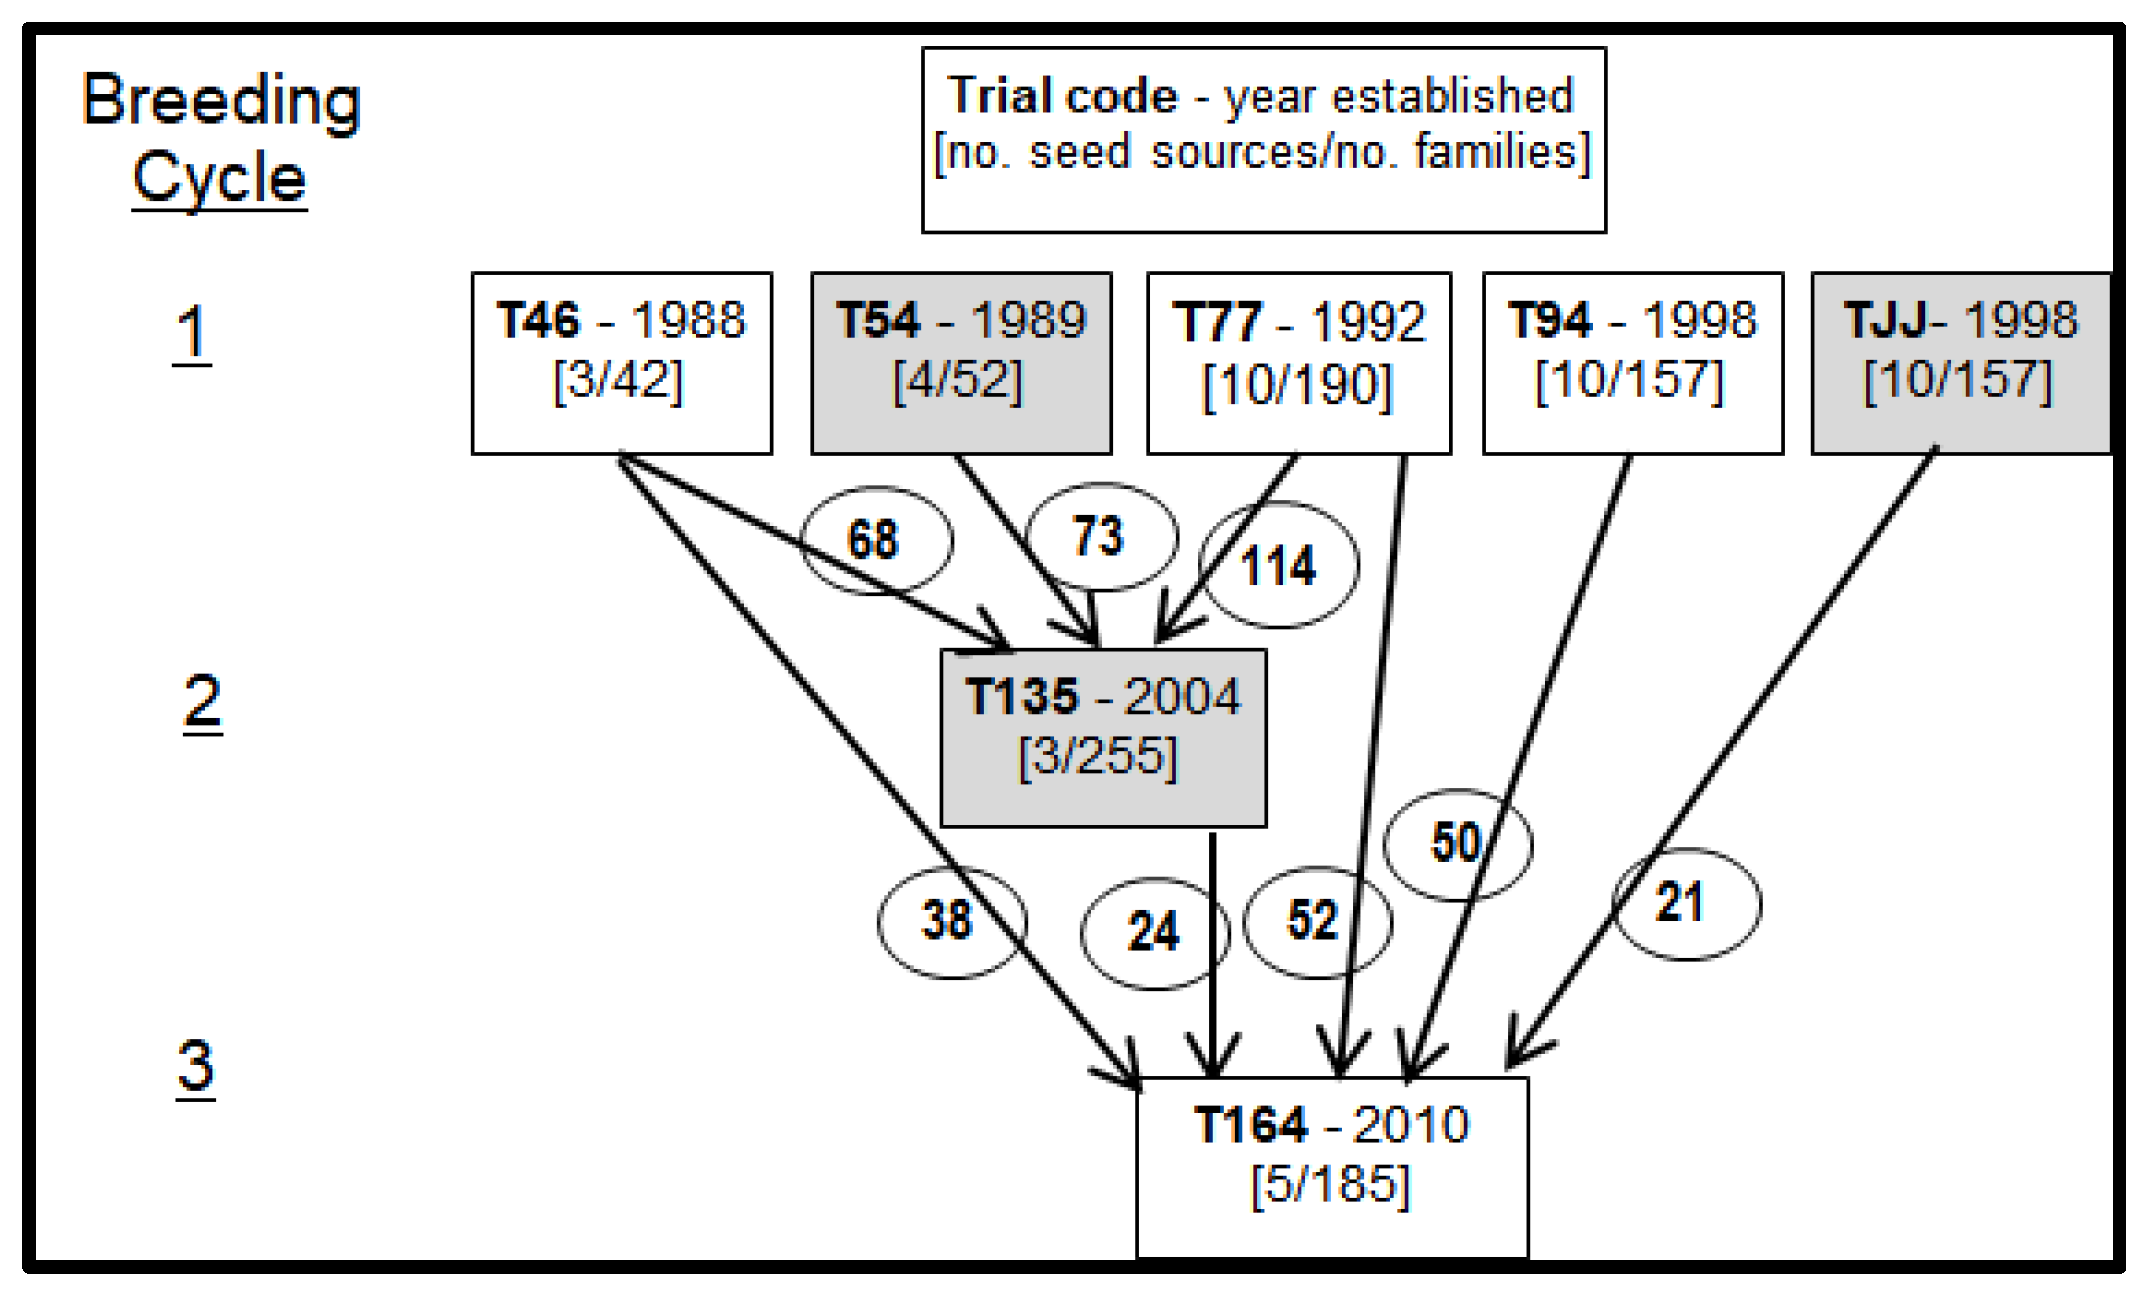
Samples were obtained from the first cycle breeding population of E. urophylla in China; see Table 1, Figure 1, and Supplementary Material Table S1 and Figure S1. In mid-2016 three out of the five field trials comprising this population (T46, T77 and T94) were sampled. Regarding the two other trials of the same cycle that were not sampled, trial T54 was terminated some years ago and therefore not available for sampling, and trial TJJ was just a duplicate of trial T94.
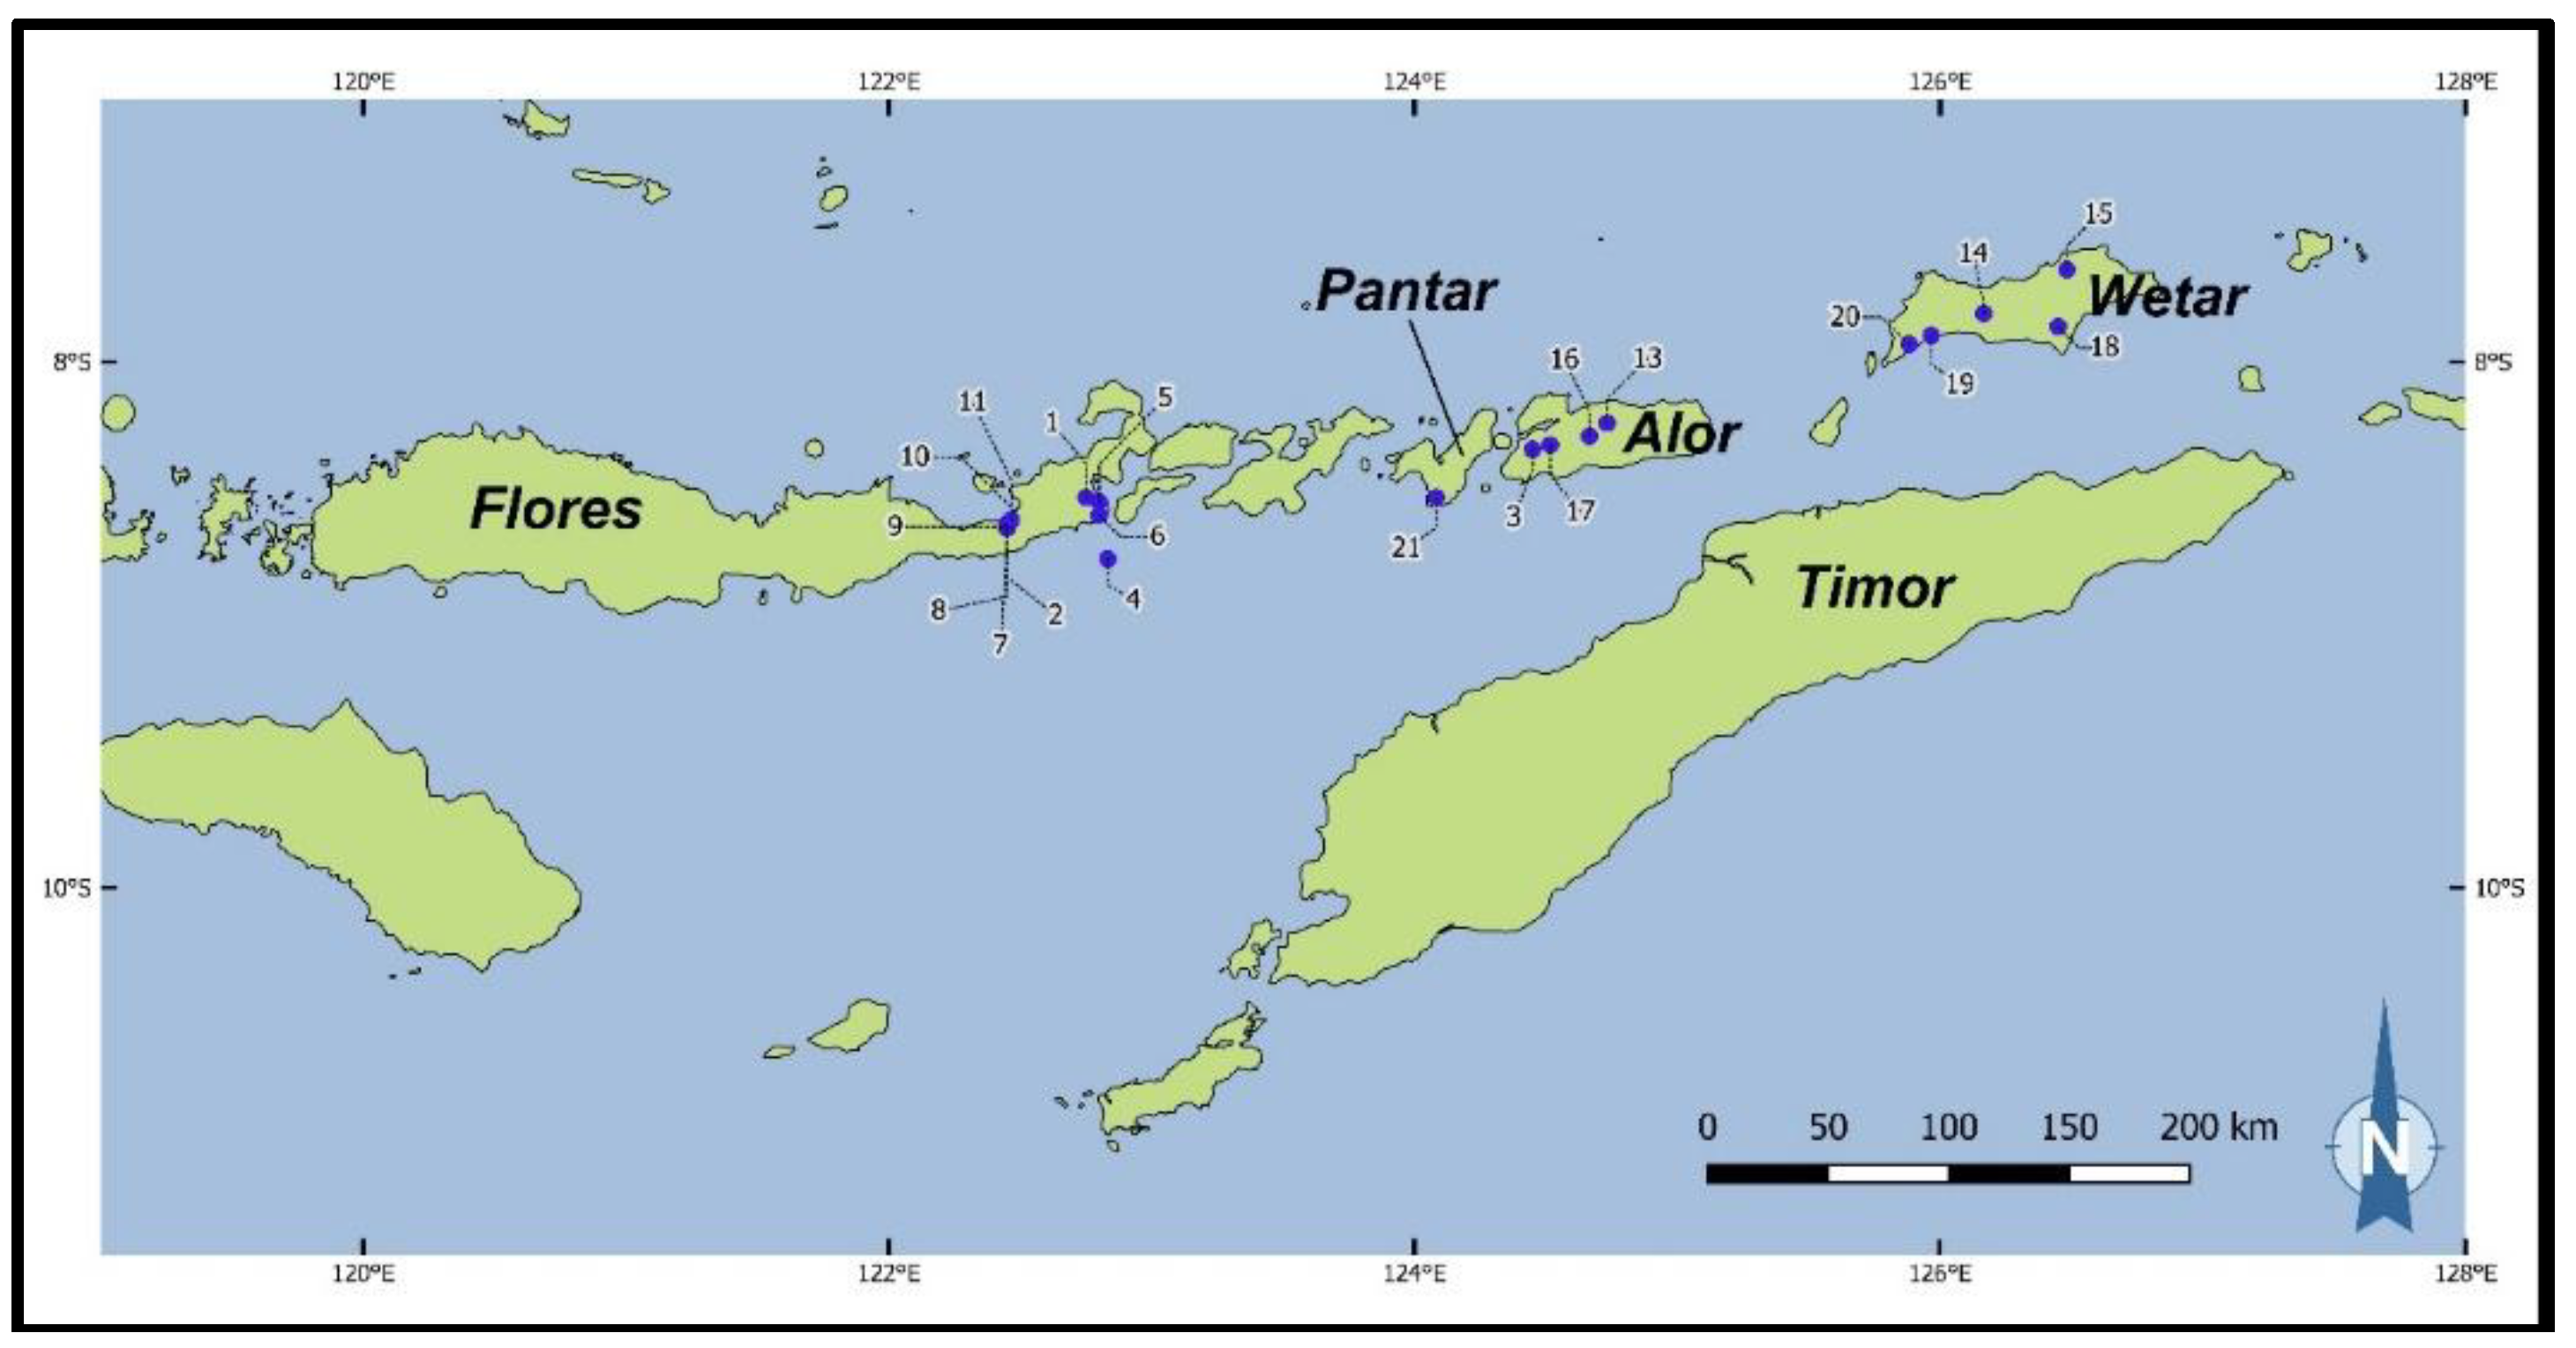
From the first cycle breeding population, 202 families were sampled; Table 1. Of these families, 170 were first generation progeny from mother trees originating from 20 natural stand provenances (i.e., provenances from the species’ native range) from 4 Indonesian Islands (see Figure 2), and 32 families were progeny from plus-trees selected in earlier trials at Dongmen Forest Farm in China and presumed to be second generation genetic material. Unfortunately, the origins of the latter material are now not known as clear records are not available. The provenance categorization across the native range of the species was based on designations provided originally by CSIRO (Commonwealth Scientific and Industrial Research Organization)’s Australian Tree Seed Centre, which was the supplier of the seedlots.
The single trial that comprised the second cycle breeding population (T135) had been intensively thinned and then suffered wind/typhoon damage over 5 years ago and was unsuitable for sampling. From the descendant third cycle breeding population, 125 families were sampled from one field trial (T164) that (initially) included almost a comprehensive set of the seed sources and families of third cycle breeding population, planted in 2010; Table 2 and Supplementary Material Table S1, Table S2 and Figure S1. Though this third cycle population comprised multiple field trials, each contained about the same set of families so just one trial was sampled for this study. Of the third cycle families sampled: 91 were progeny from mother trees selected in 4 trials of the first cycle breeding population (their mother trees represented 20 provenances from 4 Indonesian Islands of the species’ natural range); 20 were progeny from mother trees selected in the first cycle breeding population which themselves were progeny of plus-trees selected in earlier trials at Dongmen Forest Farm; 14 were progeny from mother trees selected in the trial (T135), which comprised the second cycle breeding population, that were maternal descendants of first cycle families not related (maternally) to other families sampled from the third cycle population.
Whilst each cycle of the breeding population might ‘nominally’ be considered as a generation, there is some variation among the families comprising each cycle with respect to the number of generations, at least on the maternal sides, and their descent from mother trees in natural stands in Indonesia and East Timor. The number of families sampled from the first and third cycles were a compromise between: (1) balancing the number of samples to represent the provenances/seed sources and their respective sizes (i.e., number of families from them) in each population; (2) trees available for sampling (considerations mostly for first cycle populations where thinning and some typhoon damage had reduced representation); and, (3) resources available for this study.
From each family sampled in each breeding cycle, fresh leaf tissue was collected from one tree (i.e., samples obtained from one tree per family, each family having originated from a different mother tree) for DNA extraction, in accordance with the methodologies used by Payn et al. [13], Payn et al. [14] and Tripiana et al. [15]. The one tree sampled per family in each cycle, was selected randomly, being the first tree found within each target family of the respective trials, starting from replicate 1 and working methodically through the replicates in numerical sequence.
2.2. DNA Isolation and Microsatellite PCR Amplification
Total genomic DNA was extracted from 300 mg of fresh leaf (from each tree sampled) using the modified cetyltrimethyl ammonium bromide (CTAB) method, following the methodology described by Wang [21]. DNA quality and quantity were determined by applying agarose gel electrophoresis and spectrophotometery, using a NanoDrop 2000 spectrophotometer (Thermo Fisher Scientific Inc., Waltham, MA, USA).
Sixteen microsatellite loci were used in the study, all of which had been previously described and used in Eucalyptus species (Table 3). These loci were selected from among a total of 608 published microsatellite loci, as described by He et al. [22] and Brondani et al. [23], for their high polymorphism and allelic frequency differences between pools selected for genotyping a ‘discovery’ population following procedures described by Wang et al. [24].
Polymerase chain reactions (PCRs) were performed in a total volume of 10 µL, following a touchdown PCR procedure, as described by Li and Gan [25]. This procedure involved: Incubation at 94 °C for 1 min; 20 cycles of incubation at 94 °C for 20 s, 66 °C for 30 s with a decrease of 0.5 °C per cycle, and 72 °C for 1 min; 25 cycles of 94 °C for 20 s, 56 °C for 30 s, 72 °C for 30 s; then, a final extension at 72 °C for 10 min. Fluorescein-12-dUTP1 mM aqueous solution (MBI Fermentas Inc., Burlington, ON, Canada) was added to facilitate subsequent detection of PCR products using an Applied Biosystems 3130xl Series Genetic Analyzer (Applied Biosystems, Foster City, CA, USA).
2.3. Statistical Analyses
GenePop v4.2 [26] software was used to test the breeding populations studied for Hardy-Weinberg equilibrium, heterozygote deficits and for heterozygote excesses based on the Markov chain method using 10,000 dememorizations, 20 batches and 5000 iterations per batch. The above provided probability test parameters for Hardy-Weinberg equilibrium (PHWE) separately for each one of the 16 microsatellite loci. Analyses with this software also provided estimates of the frequencies of null alleles at each locus.
The polymorphism information content (PIC) for every microsatellite locus was estimated separately for each breeding population by using the software PowerMarker v3.25 [27]. The number of alleles (Na), effective number of alleles (Ne), Shannon’s Information Index (I), observed heterozygosity (Ho), expected heterozygosity (He), and Wright’s fixation index (FIS) were also calculated separately for each locus (by population) using the software GenAlEx v6.4.1 [28], and then averaged across loci for each population. The same software was also used to determine counts of the number of private alleles (Npa) for each provenance and seed source [29]. Meanwhile, FSTAT v2.9.3.2 [30] software was used to evaluate genetic differentiation index (Fst) values on a pairwise basis between provenances of the first cycle breeding population.
2.4. Population Genetic Structure
Analyses of molecular variance (AMOVA) were carried out separately for the first and third cycle populations using GenAlEx v6.4.1 to apportion genetic variance within each population, based on 999 permutations. For the first cycle population, data from provenances represented by four or fewer families was omitted (i.e., 5 provenances omitted), and across the other 15 provenances the genetic variance was apportioned into that attributed to variation among provenances, where ‘provenance’ refers to both natural stand provenances and exotic seed sources (i.e., collections from trials at Dongmen), and to variation among individuals within provenances. As origins of two provenances included in the first cycle—DMFF I and DMFF II—were somewhat uncertain, the AMOVA was then repeated for the first cycle population without these two provenances. For the third cycle population, genetic variance was attributed to variation among seed sources, with each trial contributing material designated as a separate seed source, and to variation among individuals within seed sources.
Nei’s genetic distance between the 15 provenances that contributed to the first cycle population (represented by ≥5 or more families in our sample), was estimated using Powermarker v3.25. These estimates were then used to create a neighbor-joining (NJ) dendrogram by applying cluster analysis using the unweighted pair group method with arithmetic means (UPGMA) and a bootstrap resampling number of 1000. MEGA v7 software [31] was used to edit the UPGMA-NJ dendrogram.
The number of genetically homogeneous clusters (K) in both the first and third cycle populations, were estimated using the software STRUCTURE v2.3.4 [32], which uses a Bayesian model-based clustering method that does not require prior information on either the number of sampling sites or the locations from which the individuals were sampled. The program parameters in STRUCTURE v2.3.4 were set as recommended by Pritchard et al. [33], including the assumption of admixture among populations and correlated allele frequencies. A burn-in period of 50,000 iterations was followed by 100,000 iterations of the Markov Chain Monte Carlo model (MCMC). The model was run for a range of K values varying from 2 to 16 and with 5 replications in each iteration. The optimal K value supported by the data was assessed according to the recommendations of Evanno et al. [34], whereby the statistic ΔK was calculated based on the rate of change in the log probability of data between successive K values. The optimal K value was determined with the highest ΔK method, and this was carried out using the software STRUCTURE Harvester v0.6 [35].
3. Results
3.1. Microsatellite Loci Diversity and Polymorphism
In total 459 and 428 alleles were identified across the 16 microsatellite loci examined in the first and third cycle populations respectively (Table 4). The average number of alleles per locus (Na) and the average effective number alleles per locus (Ne) were similar in both populations at 28.7 and 10.6 respectively for the first cycle, and at 26.8 and 10.4 respectively for the third cycle. Averaged across loci, both the polymorphism information content (PIC) and Shannon’s information index (I) values for the third cycle population, being 0.87 and 2.58 respectively, showed little change from the first cycle population (0.86 and 2.56 respectively). Similarly, the values of average observed heterozygosity (Ho) and average expected heterozygosity (He) remained similar from the first to third cycle population, as did the values of Wright’s fixation index (FIS) (0.32 and 0.31 respectively) (Table 4); values which suggest an excess of homozygotes in both populations.
3.2. Hardy-Weinberg Equilibrium and Null Alleles
Both the first and third cycle populations showed marked deviations from Hardy-Weinberg equilibrium; at all 16 loci analyzed, the probabilities of Hardy–Weinberg equilibrium were non-significant (probability test parameters for Hardy-Weinberg equilibrium—PHWE—were less than 0.01 at each of the 16 loci). These results are in agreement with the excess of homozygotes suggested by some of the indices presented for both populations in Table 4.
Together with the indications of deviations from equilibrium at each locus, relatively high estimated frequencies of null alleles (from over 0.10 up to 0.36) were found at some loci in both populations studied (9 loci in both the first and third cycle populations). Although such null alleles were likely to have biased homozygote frequencies and hence the magnitudes of departure from the Hardy–Weinberg equilibrium, it is worth noting that all loci with low frequencies of null alleles (<0.05) also showed a departure from Hardy–Weinberg equilibrium.
3.3. Population Diversity and Variation
The portion of the first cycle population sampled in this study comprised predominantly first generation progeny (170 out of 202 families, representing 20 provenances) from the species’ native range. The other families sampled (32 out of 202) were from mother trees selected at Dongmen Forest Farm (DMFF) and assumed to be second generation progeny. Among the 15 provenances represented by ≥5 families, Na by provenance (over all loci) ranged from 5.7 (Ilwaki) to 16.0 (Mt Egon) and Ne ranged from 3.8 (Ulanu River) to 8.3 (Mt Egon) and Shannon’s information index (I) ranged from 1.44 (Ulanu River) to 2.25 (Mt Egon) (Table 5). Three of these 15 provenances—Andalan, Bangat and Wukoh—had no private alleles (i.e., Npa = 0) whilst in the other 12 of these provenances Npa varied from 2 (Jawaghar and Mt Lewotobi I) up to 18 (Mt Egon). Expected heterozygosity (He) by provenance ranged from 0.71 (Ulanu River) to 0.88 (Andalan) and observed heterozygosity (Ho) ranged from 0.33 (Ulanu River) to 0.69 (Jawaghar). The average of Wright’s fixation index (FIS) across the 15 provenances was 0.28, and by provenance this parameter ranged from 0.13 (Jawaghar) to 0.54 (Ulanu River) indicating significant heterozygotic deficits and excesses of homozygotes for most provenances.
For all the above genetic diversity indices, the two second generation seed sources were not exceptional; though DMFF I indices values were generally above those of DMFF II, both of them were only slightly above average. However, differences between these two sources may have been affected somewhat by the sample sizes; 23 families sampled represented DMFF I, but only 9 families represented DMFF II.
An AMOVA of hierarchical genetic variance across the 15 provenances of the first cycle breeding population represented by 5 or more families, revealed that only 3.4% of the total variance was attributed to variation among provenances, whilst most of the variance was due to variation among individuals within provenances (Table 6). When the AMOVA for the first cycle population was repeated after the two provenances of uncertain origins were removed—DMFF I and DMFF II—it yielded almost identical results to the previous one, indicating that those two sources, despite being potentially homogeneous with respect to provenance origins, had little effect on the AMOVA estimate regarding the level of among provenance variation. A separate AMOVA, based on the same loci, was carried out for the third cycle population and revealed similar results; genetic variation among individuals within seed sources accounted for almost 99% of the total molecular variance, whilst only 1% was attributed to variation among the seed sources (i.e., the five field trials of the first and second cycles from which the families were sourced).
3.4. Genetic Structure of Populations
The average genetic differentiation index values (Fst) for all pairwise provenance comparisons in the first cycle population was 0.044 and between any two provenances this index ranged from 0.012 (Egon vs. DMFF I) to 0.108 (Ulanu River vs. Jawaghar) (Table 7), suggesting a low degree of genetic differentiation among these E. urophylla provenances. The highest value achieved for this index was between two provenances from geographically distant origins; Ulanu River (Alor) and Jawaghar (Flores) which have a straight line distance of separation of approximately 220 km. Similarly, the Fst values of Ulanu River vs. Iling Gele, Ulanu River vs. Mandiri, and Ulanu River vs. Wukoh were also higher than other pairwise provenance comparisons and in each of these pairs the provenances had straight line distances of separation varying from around 184 to 222 km.
3.5. Structure
Relationships between the 15 provenances from the first cycle population (that had 5 or more families sampled for this study) are summarized in an unrooted neighbor-joining dendrogram, which is based on Nei’s genetic distance estimates, as shown in Figure 3. While the dendrogram generally does not show a strong connection to provenance geographic origins, it must be noted that many clusters and nodes identified in this are poorly supported (i.e. bootstrap values <50—see [36]). On account of this there can be little confidence in the patterns and genetic associations observed in the dendrogram. Of the two seed sources originating from previous trials (of exotic genetic material), DMFF I was closest to the provenances of Anadalan, Bangat and Iling Gele from the island of Flores, whilst DMFF II was closest to the provenance Ulanu from Alor Island, but these associations are dubious and uncertain on account of low bootstrap values associated with their branches.
Bayesian cluster analysis performed using STRUCTURE software on the first cycle population (all provenances and families sampled) initially suggested the existence of 12 genetically homogenous clusters within this population; log-likelihoods of the number of clusters plateaued at K = 12. However, methodology of Evanno et al. [34] strongly supported K = 4 as the correct number of clusters within this population. As STRUCTURE has been found to work “extremely well for inferring the number of clusters” even with Fst values down as low as 0.02 [37], there can be reasonable confidence in these cluster numbers; in the present study only 5 of the 231 relevant pair-wise provenance comparisons (first cycle population) had Fst values of less than 0.02.
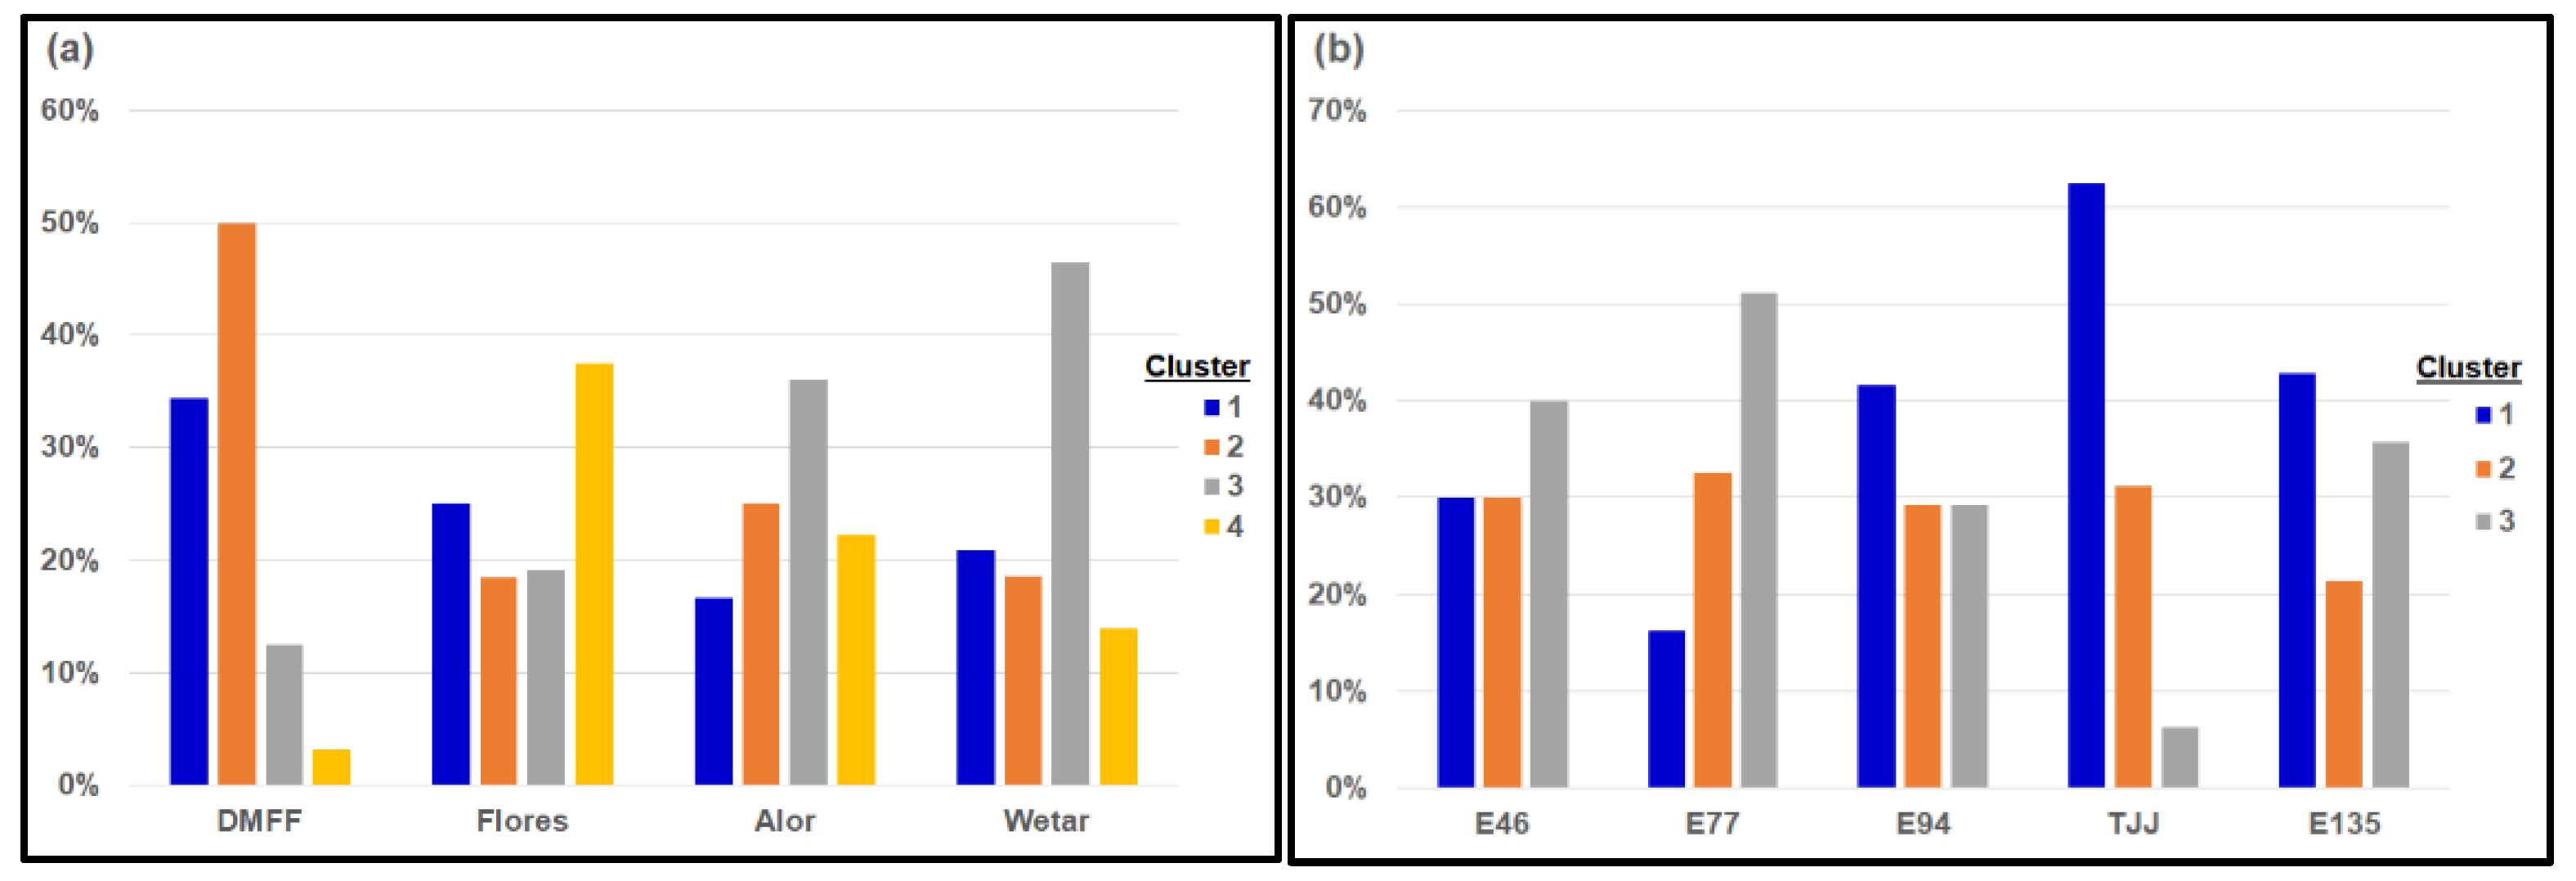
Whilst the 12 clusters indicated by the initial analysis showed no discernible associations with geographic origins, the subsequently indicated 4 clusters aligned somewhat weakly with geographic provenance origins (Figure 4a). Individuals originating from earlier trials in China (i.e., DMFF I and DMFF II) were predominantly allocated to cluster 2, individuals from Flores Island were predominantly allocated to cluster 4 and those from Alor and Wetar were predominantly allocated to cluster 3. The members of cluster 1 were mixed, with only 34% or less of individuals originating from any particular island/seed source being allocated to this cluster. However, it must be noted that some individuals might have been assigned to the wrong cluster, as Fst needs to be over 0.05 to achieve an assignment accuracy of 95% or more [37]; in the present study, the average of Fst across all relevant pair wise provenance comparisons was 0.044.
Similar cluster analyses conducted on the third cycle population suggested that it could be separated into just three genetically homogeneous clusters, i.e., K = 3 from the methodology of Evanno et al. [34] (Figure 4b). Weak patterns were also evident in the membership of these three clusters, with progeny from trials E94, TJJ and E135 being predominantly assigned to cluster 1; the former two of these trials comprised predominantly provenances from the islands of Wetar and Alor, whilst the latter trial itself comprised the second cycle population (and was predominantly second generation trees). Progeny from trials E46 and E77 were predominantly allocated to cluster 3; both of these trials contained predominantly progeny from provenances originating from the island of Flores. For cluster 2, membership was mixed with only 33% or less of individuals from any source (field trial) being allocated to this cluster.
4. Discussion
4.1. First Cycle Population
The first cycle breeding population, which included over 25 E. urophylla provenances originating from its natural distribution and 5 or possibly more exotic seed sources (though only 20 provenances and 2 exotic seed sources sampled in this study), was established to provide a foundation for long term breeding through recurrent cycles of selection and inter-mating. The intentionally broad selection of provenances, representing 5 of the 7 islands where the species grows naturally in Indonesia and East Timor, was anticipated to provide broad genetic diversity and hence a solid foundation for long term genetic gains.
The diversity indices estimated in this study for the provenances included in the first cycle population, Na = 5.7–16.0 alleles/locus and average Ho and He of 0.58 and 0.84 respectively, indicate that it harbors reasonable levels of genetic diversity. While these results provide clear insights on the breeding population, it must be emphasized that they do not necessarily reflect the population genetic parameters of the 20 provenances of the natural range, nor when considered collectively do they reflect the genetic diversity within the species’ entire natural range. Five of the provenances were represented by four or fewer families (thus DNA samples were only collected from four or less trees per provenance), and the trees that were sampled as representatives of those provenances had been subject to intensive artificial selection well before the sampling for this study was carried out.
Despite the above limitations, the genetic diversity parameters estimated for the first cycle breeding population were similar to those found by previous studies carried out on natural populations of this species not subjected to prior selection. The values estimated were also higher than those estimated for a number of other Eucalyptus species. For example, Jones et al. [38] obtained a He estimate of 0.62 from an E. globulus study that included 158 trees from four natural populations of the species, and Elliot and Byrne [39] reported He estimates, by population, in E. occidentalis ranging from 0.30 to 0.41.
The relatively low genetic differentiation observed for the first cycle population, as indicated by the pairwise Fst values that ranged from 0.008 to 0.108, was not unexpected. Similar values (for Fst) have been reported for natural populations of a range of other Eucalyptus species; i.e., Fst = 0.03 in E. populnea [40], Fst = 0.045 in E. marginata [41], Fst = 0.044–0.065 in E. camaldulensis [42], and Fst = 0.08 in E. globulus [38]. In the case of the species involved in the current study, House and Bell [4] suggested that pollen flow among populations and even among islands, mediated by birds and bats, may have contributed to the low differentiation between its geographically disparate populations.
The diversity indices estimated in this study from material sampled from the first cycle population (Table 5) were generally slightly lower than those found for “populations” of E. urophylla’s native range by two previous studies, though most “populations” in those previous studies encompassed multiple natural stand provenances. Payn et al.’s [13] study of 357 families from 19 populations (encompassing 45 natural stand provenances), representing all 7 islands, reported average number of alleles (Na) per locus per population of 7.7 to 12.0, expected heterozygosities (He) per population of 0.44 to 0.90 and observed heterozygosities (Ho) per population of 0.44 to 0.78. Tripiana et al.’s [15] study of 17 populations (encompassing 49 natural stand provenances) found Ho’s per population of 0.51 to 0.72 and average Na’s per marker loci, by population, of 5.2 to 10.6. As well as sampling differences arising from examination of populations (each comprising multiple provenances) vs. individual provenances, the lower indices of the present study might also be due to the use of different microsatellite markers than what were used by the earlier studies and/or the effects of artificial selection (prior to sampling) on the provenances examined in this present study.
Notable differences between this current study and both Payn et al.’s [13] and Tripiana et al.’s [15] studies regarding the indices estimated, were for Wright’s fixation index (FIS). In the current study the estimates for this index for the first cycle population ranged from 0.13 to 0.54 at a provenance level (while when averaged across the 15 provenances represented by ≥5 families it was 0.28), and were generally higher than those reported by Payn et al. [13], who found values (per population) of just 0.017 to 0.150 and a little higher than those of Tripiana et al. [15], who reported values (per population) of 0.13 to 0.31. It is noteworthy that the latter authors suggested that the fixation index (FIS) values they reported could have been overestimated, as their DNA samples were extracted from non-selected seedlings that might have also included some seedlings originating from selfed seed. Given that intensive selection for growth and form had been a factor in the breeding populations sampled in this study, such a factor is quite unlikely to have contributed to our results.
Several factors might have contributed to the elevated fixation index values of the current study, compared to natural stand populations not subjected to artificial selection. In the first cycle population a number of provenances had relatively high and positive fixation index (FIS) values (>0.30), suggesting possible inbreeding; the provenance with the highest FIS value (Ulanu River, FIS = 0.54) had the lowest observed heterozygosity (Ho = 0.33).
The positive and relatively high fixation index values (FIS) found in the first cycle population of this study indicate a marked deviation from Hardy-Weinberg expectations, corroborating the Hardy-Weinberg test results obtained by individual loci. The latter result was not unexpected; both Tripiana et al. [15] and Faria et al. [43] had previously observed deviations from the Hardy-Weinberg equilibrium in natural stand genetic material of this species, a situation they attributed to an excess of homozygotes across most microsatellite loci they examined. At least three factors may have contributed to this situation in the first cycle population studied here. Firstly, the presence of directional selection: a key requirement for equilibrium to be reached is the absence of directional selection [44], yet when sampled for this study, prior heavy selective thinning had already been performed on the population resulting in less than 15% of the trees originally planted (and 75% of families) remaining. But while such selection may have contributed to deviation from the Hardy-Weinberg equilibrium, it’s hard to explain how the selection for traits of relatively low heritabilities—Kien et al. [12] and Hodge and Dvorak [11] reported within provenance narrow sense heritabilities for growth traits of mostly less than 0.25—could have resulted in marked selective pressure on the alleles of the 16 microsatellite loci examined in this study, as most or all of these loci were likely neutral for traits of selection (growth and form). Secondly, the Wahlund effect; such an effect was suggested by Tripiana et al. [15] based on results of their study on 17 “natural populations” of E. urophylla which included 49 provenances. Their aggregation of provenances resulted in their “populations” (within the total population they studied) having originated from wide geographical ranges and each likely “consisted of several possibly differentiated subpopulations”. But, for the present study, any Wahlund effect could not have come from lumping of geographically distinct groups into single sampling units: we examined heterozygosity (in the first cycle) by provenance (Table 5) and all but two of the provenances were natural stand provenances. But rather than being due to lumping, it’s possible that variable levels of inbreeding and/or hybrid introgression within provenances might have resulted in some unknown substructuring within provenances resulting in an apparent Wahlund effect. On all of the islands of E. urophylla’s natural range except Timor, the species and E. alba are sympatric at elevations between 400 and 800 m, and occasional natural hybrids between these two species have been recorded in their natural ranges [3,45]. On the island of Timor the two species occasionally co-occur [45]. Dvorak et al. [46] suggested that natural introgression with E. alba, may have had great influence on the genetic architecture of E. urophylla, as natural hybridization and introgression is often apparent in field trials. Indeed, Hodge and Dvorak [11] noted that some E. urophylla provenances in their extensive trials had up to 50% of progeny being white-barked trees, which they considered as indicating high levels of introgression with E. alba. Bark characteristics of the two ‘pure’ species are distinct, with E. alba having a smooth white bark and E. urophylla having rough brown fibrous bark that varies from a short basal stocking through to covering the trunk and extending to small branches [3,46]. Besides such introgression, inbreeding might also have been a factor contributing to an apparent Wahlund effect in the first cycle E. urophylla population (as well as directly contributing to a violation of Hardy-Weinberg Equilibrium through creating homozygotic excesses). While inbreeding due to selfing was unlikely, as House and Bell [4] found E. urophylla to be predominantly outcrossing (at least in natural stands) with mean multi-locus outcrossing rates (t) of around 0.90 and low variations between individual trees in outcrossing rates, the species’ mixed mating system could have contributed to inbreeding. The latter authors had found high levels of Wright’s fixation index (FIS), as is the case in the current study, a situation they attributed to breeding among close relatives (individuals with high coancestry) being prevalent in natural stands that had resulted in a lower level of inbreeding compared to actual selfing. Thirdly, the amplification failure of certain alleles at individual loci resulted in some null alleles and likely led to some heterozygotes being genotyped as homozygotes [17]. We estimated that null alleles occurred at frequencies (per locus) of 0.00 to 0.36 across the 16 microsatellite loci examined in the first cycle population. However, it must be noted that even at the seven loci where the frequencies of null alleles were low (below 0.05), significant deviations from the Hardy–Weinberg Equilibrium still occurred.
Out of the total molecular genetic variance recorded in the first cycle population, the vast majority (96.6%) was associated with variation among individuals within provenances. Despite the artificial selection that this population had been subject to, the percentage of variance attributed to variation among individuals was almost the same as that reported by Payn et al. [13], whose AMOVA showed that variation among unselected individuals within populations (most of which incorporated a range of geographically proximal provenances) also accounted for around 96.6% of the total molecular variance.
Even so, artificial selection probably played some role in the generally poor support (low bootstrap values), and hence lack of clear patterns, in the topology of the dendrogram illustrating genetic distances and clustering of the provenances, that was generated for the first cycle population. This result was contrary to results obtained by Payn et al. [13], whose dendrogram generated for 19 E. urophylla ‘populations’ of the species’ native range coincided to a large extent with the geographic origins; their populations were generally clustered by island of origin. The latter authors identified two genetically homogenous groups (clusters), with strong geographic patterns; one of the clusters was clearly dominated by populations from the western islands (i.e., Flores, Pantar, Alor, Lomblen and Adanara) and the other one by populations from the eastern islands (Wetar and Timor). A number of factors in addition to artificial selection likely contributed to the differences between Payn et al.’s [13] cluster analysis results and those obtained from the present study (for the first cycle population), including sampling differences and loci differences, besides the fact that alignment of genetic differentiation with geographic origins is generally weak for E. urophylla for a variety of traits [4,13].
4.2. Third Cycle Population
The third cycle E. urophylla population involved in this study included families selected from the populations of both preceding cycles. This strategy was implemented in order to capture more genetic diversity than would have likely been available from just the single somewhat limited trial that comprised the second cycle population (it omitted selections from two of the first cycle trials). Indeed, the genetic diversity indices estimated for the third cycle population, with the total number of alleles (Na) being 26.8, observed heterozygosity (Ho) being 0.60 and expected heterozygosity (He) being 0.88, indicate that it does indeed contain a reasonable amount of genetic diversity which is very close to what was found in the first cycle population. This result was obtained even though the third population (and the sample obtained from it) was smaller, with respect to the number of families, than the first cycle population (and the sample obtained from it).
Departure from Hardy-Weinberg Equilibrium persisted in the third cycle too. This was indicated by the expected and observed heterozygosity estimates, along with the value estimated for Wright’s fixation index (FIS), and the Hardy-Weinberg equilibrium probability test parameters for each one of the 16 microsatellite loci. But, had panmixia been achieved among the individuals selected for retention in the trials of the first and second cycle populations, the descendent third cycle population would have been expected to have a somewhat closer approximation to equilibrium. But this was not the case and we need to consider the reasons for this outcome.
One factor contributing to the third cycle population’s deviation from Hardy-Weinberg equilibrium would have been artificial selection. Parents of all families included were superior trees selected within the field trials comprising the first and second cycle populations. Then, within the third cycle population, additional selection had been carried out prior to sampling: at the time of sampling for this study only 25% of trees originally planted remained in the trials, representing 158 out of the 195 families initially included.
Could the Wahlund effect, whatever its actual cause, also have persisted through to the third cycle and contributed to the observed departure from Equilibrium? This population comprised families that were second and third generation descendants from a wide range of provenances that exhibited generally limited genetic differentiation, while a range of factors discussed above could have contributed to a substructuring of the population groups examined into gene pools differing in their allele frequencies. Substructuring might have arisen due to provenance origins, with effects persisting through the cycles on account of inadequate panmixia, and/or due to some individuals having originated through hybridization with E. alba, and/or having varying levels of inbreeding.
Panmixia might not been achieved in the first and second cycle populations due to a combination of differences in phenology associated with geographic ancestral origins (i.e., between islands of origin and even between provenances within islands) and/or spatial separation of the separate field trials comprising the first cycle population. Swain et al. [47] found that ancestral provenance origins had a significant influence on genetic parameters into at least the second generation of an E. nitens breeding population (i.e., grand-maternal provenances effects were evident). Differences in phenology could have been a factor in maintenance of provenances effects through generations of open pollinated breeding.
Differences between the field trials of origin (i.e., immediate parents) in regards to average effective outcrossing rates between the selected parental plus-trees may also have been a contributor to substructuring. It is well known that outcrossing rates can affect the genetic quality of seed from Eucalyptus species [48], and despite that the overall genetic diversity of the third cycle population seemed reasonable (compared to the first cycle population), outcrossing rates weren’t examined specifically.
Also, even into the third cycle population differential introgression (from E. alba) might still be leading to some substructuring. Parent tree selection in the first and second cycles was based on growth and form, irrespective of bark characteristics and/or leaf morphology, and thus some of the parent trees selected could well have carried significant amounts of E. alba alleles. In an intensive, well advanced breeding program (>3 generations) for E. urophylla in Indonesia, it was found that even after several generations of selection as E. urophylla, distinct E. alba traits were still present in some individuals [49].
Results from the cluster analyses of the third cycle population, when considered together with those from the first cycle population, accord somewhat with results from the studies of House and Bell [4] and Payn et al. [13], in that populations from the island Wetar exhibited a level of genetic differentiation from populations on Flores and closely adjacent islands, i.e., on Payn et al.’s [13] “western islands”. However, the cluster analysis together with the AMOVA carried out in the current study also generally concur with House and Bell’s [4] conclusions in that genetic differences and differentiation between populations originating across E. urophylla’s natural range are generally small.
While the observed heterozygosity was around 30% below the expected heterzogosity in the third cycle population, there was almost no change in the fixation index estimated for the first cycle population. This lack of change suggests no change in genetic variability between the studied populations. Reasons for the discrepancy between the observed and expected heterozygosity are uncertain, and even if inbreeding might have been expected to be a factor contributing to such discrepancies in the first cycle population (as it mainly comprised natural stand progeny), in the third cycle population lower rates of inbreeding were expected due to the crossing between unrelated individuals in the preceding one to two generations.
4.3. Practical Implications
Domesticated populations of many forest tree species have been found to show relatively little reduction in overall expected heterozygosity compared to the native distributions from which they were derived [50]. The current study shows that this also holds for the E. urophylla breeding populations in China, at least up to the third cycle. Lefevre [50] also suggested that apparent genetic diversity in the breeding population of a domesticated tree species might be increased, relative to the original populations, due to crossing between differentiated native populations. However, results from House and Bell [4], Tripiana et al. [15] and Payn et al. [13], as well as the current study, suggest that the differentiation between the native populations of E. urophylla is relatively minor. Payn et al. [13] found that significant gene flow among E. urophylla’s geographically separate island populations has had continuous influence on the genetic diversity of the species in its natural range. Thus, crossing, within a diverse breeding population of this species, between geographically disparate native provenances, might be unlikely to result in much change to genetic diversity. Indeed the results obtained from the third cycle population of this current study support this.
Even so, evidence from other studies attest to real prospects for increasing diversity somewhat through future E. urophylla breeding cycles in China. Across 4 generations of E. urophylla breeding in Brazil, Pigato and Lopes [51] found genetic distances between individuals to be markedly higher in their third and fourth generations than their first and second generations, which they took as indicating an increase in genetic variability with the advance of their program. In an E. regnans program in New Zealand that had progressed through three cycles of breeding, Suontama et al. [52] found that some of their third cycle field trials provided the largest heritabilities and additive genetic variances (for height at age 3 years).
In order to better understand the genetic architecture of the current and future cycles of the E. urophylla breeding program in China, it would be of value in the future assessments to score trees selected (as parents for a subsequent cycle) for E. alba characteristics. Such characteristics include large and roundish leaves with a blunt tip and/or smooth white bark on the mature tree stems, compared to E. urophylla with broad-lanceolate leaves narrowing abruptly to a short point and a variable stocking of rough, sub-fibrous bark [3,45]. Such phenotypic data would enable some examination of the potential proportion of individuals that potentially express some level of introgression, and hence enable a better understanding of sources of variation within the breeding population.
The question of whether panmixia can be achieved in the E. urophylla breeding populations studied is also of critical importance; results from the current study suggest that it has not been achieved in at least the first and/or second cycles. An assessment of phenology to understand any temporal differences on account of ancestral geographical origins (i.e., island and provenances within island origins) is needed to understand if there is asynchronous flowering within the third cycle population, a process that might be creating unwanted substructure within the population. If real substructures and/or barriers to free interbreeding do exist, then measures such as controlled pollinations and/or sublining of the main population might be required to manage barriers to panmixia and prevent unwanted substructures limiting the potential for future genetic gains.
That null alleles were recorded at relatively high frequencies at some of the loci examined in both the first and third cycle populations, indicates a possible shortcoming in the current study’s methodology. Such null alleles might be biasing some parameter estimates as they can result in inflated heterozygote deficits, and decreased estimates of Ho, He, and even genetic diversity [53]. For all or at least a random subset of the samples examined in the current study, no repeated marker amplifications were carried out, so estimation of error rates on locus scoring was not possible. Although this shortcoming is common among the majority of published studies on microsatellites in eucalypts, as well as in other plants (see [17]), it would be better if it was avoided. In any future work on E. urophylla and/or other species, we would undertake repeated marker amplification of at least a random subset (10–15%) of samples, to enable error rates to be calculated from the number of inconsistent genotypes between the first and second amplification attempts [54].
5. Conclusions
On account of a number of factors, including the origin of genetic materials used to develop the founding (first cycle) population for the E. urophylla breeding program in China, deficits of heterozygotes were found for the 16 microsatellite loci examined in both the founding (first cycle) and the descendant (third cycle) breeding populations of E. urophylla. Even so, the high allelic diversity observed in the founding population was maintained through cycles of intensive selection into the descendant third cycle population.
Most of the genetic variation within the two populations examined in this study existed among individuals, rather than between provenances or seed sources. This finding reaffirms that the number of (unrelated) individuals included in the populations was the key to capturing adequate genetic variation, rather than the number of seed sources/provenances represented by such individuals. Similarly, the results suggested that maintaining a high number of unrelated individuals in descendant populations should contribute to maintenance of genetic variation.
In general, the level of genetic diversity was maintained through the successive cycles observed in the current study. This indicates good prospects for maintaining if not increasing diversity through future descendant cycles of breeding E. urophylla.
6. Data Archiving
The data obtained in the course of this study, consisting of genotypic data for 16 microsatellite loci from 202 individuals of the first cycle population and 125 individuals from the third cycle population along with the necessary pedigree data, will be submitted to an appropriate online data repository upon article acceptance.
Supplementary Materials
The following are available online at https://www.mdpi.com/1999-4907/9/7/372/s1, Table S1: Details of the E. urophylla trials comprising the first, second and third cycle breeding populations for this species in China. Table S2: Additional details on Trial T164 (third cycle breeding population). Figure S1: Locations of the E. urophylla trials comprising the first, second and third cycle breeding populations for this species in China.
Author Contributions
W.L. and J.L. conceived and designed the study; W.L. and L.Z. organized and conducted the trial sampling and managed the samples; W.L. carried out the laboratory analyses; W.L., L.Z., J.L. and R.J.A. collated, managed and analyzed data; W.L. and R.J.A. wrote the paper.
Funding
This research was funded by Fundamental Research Funds of Chinese Academy of Forestry project [project number CAFYBB2017MA022], National Natural Science Foundation of China (project number 31700599).
Acknowledgments
We are grateful to Lan Jun from Dongmen State Forest Farm for the assistance in accessing the field trials sampled in this study, and to Paul Macdonell from Queensland, Australia, for preparation of Figure 1. Two anonymous reviewers provided numerous suggestions for significantly improving the content of this paper and we greatly appreciate their guidance.
Conflicts of Interest
The authors declare no conflict of interest.
References
- Pryor, L.D.; Williams, E.R.; Gunn, B.V. A morphometric analysis of Eucalyptus urophylla and some related taxa with descriptions of two new species. Aust. Syst. Bot. 1995, 8, 57–70. [Google Scholar] [CrossRef]
- Eldridge, K.; Davidson, J.; Harwood, C.; Van Wyk, G. Eucalypt Domestication and Breeding; Oxford University Press: Oxford, UK, 1993; ISBN 019854149X9780198541493. [Google Scholar]
- Centre for Agriculture and Biosciences International. Eucalyptus urophylla. In The Forestry Compendium: Global Module; CAB International: Oxon, UK, 2000. [Google Scholar]
- House, A.P.N.; Bell, J.C. Isozyme variation and mating system in Eucalyptus urophylla S.T. Blake. Silvae Genetica 1994, 43, 167–176. [Google Scholar]
- Pepe, B.; Surata, K.; Suhartono, F.; Sipayung, M.; Purwanto, A.; Dvorak, W.S. Conservation status of natural populations of Eucalyptus urophylla in Indonesia and international efforts to protect dwindling genepools. For. Gen. Res. 2004, 31, 62–64. [Google Scholar]
- Arnold, R.J.; Xie, Y.J.; Midgley, S.J.; Luo, J.Z.; Chen, X.F. Emergence and rise of eucalypt veneer production in China. Int. For. Rev. 2013, 15, 33–47. [Google Scholar] [CrossRef]
- Turnbull, J.W. Eucalypts in China. Aust. For. 1981, 44, 222–234. [Google Scholar] [CrossRef]
- Wei, J. Research achievements of the Dongmen Eucalyptus demonstration project, Guangxi State Forest Farm Company, Guangxi, China. In Proceedings of the Regional Expert Consultation on Eucalyptus, Bangkok, Thailand, 4–8 October 1996; Kashio, M., White, K., Eds.; FAO Regional Office for Asia and the Pacific: Bangkok, Thailand, 1996; Volume II, pp. 33–45. [Google Scholar]
- Turnbull, J.W. Development of Sustainable Forestry Plantations in China: A Review; ACIAR Impact Assessment Series Report No. 45; Australian Centre for International Agricultural Research: Canberra, Australia, 2007; ISBN 1832-1879.
- Xie, Y.; Arnold, R.J.; Wu, Z.; Chen, S.; Du, A.; Luo, J. Advances in eucalypt research in China. Front. Agric. Sci. Eng. 2017, 4, 380–390. [Google Scholar] [CrossRef]
- Hodge, G.R.; Dvorak, W.S. Provenance variation and within-provenance genetic parameters in Eucalyptus urophylla, across 125 test sites in Brazil, Colombia, Mexico, South Africa and Venezuela. Tree Genet. Genomes 2015, 11, 57. [Google Scholar] [CrossRef]
- Kien, N.D.; Jansson, G.; Harwood, C.; Thinh, H.H. Genetic control of growth and form in Eucalyptus urophylla in northern Vietnam. J. Trop. For. Sci. 2009, 21, 50–65. [Google Scholar]
- Payn, K.G.; Dvorak, W.S.; Janse, B.J.H.; Myburg, A.A. Microsatellite diversity and genetic structure of the commercially important tropical tree species Eucalyptus urophylla, endemic to seven islands in eastern Indonesia. Tree Genet. Genomes 2008, 4, 519–530. [Google Scholar] [CrossRef]
- Payn, K.G.; Dvorak, W.S.; Myburg, A.A. Chloroplast DNA phylogeography reveals the island colonisation route of Eucalyptus urophylla (Myrtaceae). Aust. J. Bot. 2007, 55, 673–683. [Google Scholar] [CrossRef]
- Tripiana, V.T.; Bourgeoi, S.M.; Verhaegen, D.V.; Vigneron, P.V.; Bouvet, J.M.M. Combining microsatellites, growth, and adaptive traits for managing in situ genetic resources of Eucalyptus urophylla. Can. J. For. Res. 2007, 37, 773–785. [Google Scholar] [CrossRef]
- Wahlund, S. Zusammensetzung von population und correlation serscheinung vom standpunkt der vererbungslehre aus betrachtet. Hereditas 1928, 11, 65–106. [Google Scholar] [CrossRef]
- Selkoeobe, K.A.; Toonen, R.J. Microsatellites for ecologists: A practical guide to using and evaluating microsatellite markers. Ecol. Lett. 2006, 9, 615–629. [Google Scholar] [CrossRef] [PubMed]
- Nicolle, D. Classification of the Eucalypts (Angophora, Corymbia and Eucalyptus) Version 3. Available online: http://www.dn.com.au/Classification-Of-The-Eucalypts.pdf (accessed on 19 March 2018).
- Arnold, R.J.; Luo, J.Z.; Lu, W.H.; Wang, C.B.; Lin, Y. Co-operative Improvement of Key Eucalypt Species in China. In Scientific Cultivation and Green Development to Enhance the Sustainability of Eucalypt Plantations, Proceedings of IUFRO Eucalypt Conference, Zhanjiang, China, 21–24 October 2015; IUFRO: Vienna, Austria, 2015; p. 53. [Google Scholar]
- Brooker, M.I.H. A new classification of the genus Eucalyptus L’Hér. (Myrtaceae). Aust. Syst. Bot. 2000, 13, 79–148. [Google Scholar] [CrossRef]
- Wang, Y. Development of EST-SSR markers and their application to construction of genetic maps in Eucalyptus. Ph.D. Thesis, Nanjing Forestry University, Nanjing, China, 2009. [Google Scholar]
- He, X.; Wang, Y.; Li, F.; Weng, Q.; Li, M.; Xu, L.; Shi, J.; Gan, S. Development of 198 novel EST-derived microsatellites in Eucalyptus (Myrtaceae). Am. J. Bot. 2012, 99, e134–e148. [Google Scholar] [CrossRef] [PubMed]
- Brondani, R.P.V.; Williams, E.R.; Brondani, C.; Grattapaglia, D. A microsatellite-based consensus linkage map for species of Eucalyptus and a novel set of 230 microsatellite markers for the genus. BMC Plant Biol. 2006, 6, 20. [Google Scholar] [CrossRef] [PubMed]
- Wang, Y.H.; Bible, P.; Loganantharaj, R.; Upadhyaya, H.D. Identification of SSR markers associated with height using pool-based genome-wide association mapping in sorghum. Mol. Breed. 2012, 30, 281–292. [Google Scholar] [CrossRef] [Green Version]
- Li, F.; Gan, S. An optimised protocol for fluorescent-dUTP based SSR genotyping and its application to genetic mapping in Eucalyptus. Silvae Genetica 2011, 60, 18–25. [Google Scholar] [CrossRef]
- Rousset, F. Genepop’007: A complete reimplementation of the Genepop software for Windows and Linux. Mol. Ecol. Resour. 2008, 8, 103–106. [Google Scholar] [CrossRef] [PubMed]
- Liu, K.; Muse, S.V. PowerMarker: An integrated analysis environment for genetic marker analysis. Bioinformatics 2005, 21, 2128–2129. [Google Scholar] [CrossRef] [PubMed]
- Peakall, R.; Smouse, P. GenAlEx 6: Genetic analysis in Excel. Population genetic software for teaching and research. Mol. Ecol. Notes 2006, 6, 288–295. [Google Scholar] [CrossRef]
- Song, Z.J.; Yang, H.Y.; Weng, Q.J.; Zhou, C.P.; Li, F.G.; Li, M.; Lu, W.H.; Luo, J.Z.; Gan, S.M. Genetic Diversity and Selective Loci in Eucalyptus tereticornis Populations. Sci. Silvae Sin. 2016, 52, 39–47. [Google Scholar] [CrossRef]
- FSTAT v2.9.3.2. Available online: http://www2.unil.ch/popgen/softwares/fstat.htm (accessed on 14 October 2016).
- Kumar, S.; Stecher, G.; Tamura, K. MEGA7: Molecular Evolutionary Genetics Analysis Version 7.0 for Bigger Datasets. Mol. Biol. Evol. 2016, 33, 1870–1874. [Google Scholar] [CrossRef] [PubMed]
- Pritchard, J.K.; Stephens, M.; Donnelly, P. Inference of population structure using multilocus genotype data. Genetics 2000, 155, 945–959. [Google Scholar] [PubMed]
- Pritchard, J.K.; Wen, X.; Falush, D. Documentation for structure software: Version 2.3. J. Pediatr. Surg. 2010, 41, 55–63. [Google Scholar]
- Evanno, G.; Regnaut, S.; Goudet, J. Detecting the number of clusters of individuals using the software STRUCTURE: A simulation study. Mol. Ecol. 2005, 14, 2611–2620. [Google Scholar] [CrossRef] [PubMed]
- Earl, D.A.; von Holdt, B.M. STRUCTURE HARVESTER: A website and program for visualizing STRUCTURE output and implementing the Evanno method. Conserv. Genet. Resour. 2012, 4, 359–361. [Google Scholar] [CrossRef]
- Hillis, D.M.; Bull, J.J. An empirical test of bootstrapping as a method for assessing confidence in phylogenetic analysis. Syst. Biol. 1993, 42, 82–192. [Google Scholar] [CrossRef]
- Latch, E.K.; Dharmarajan, G.; Glaubitz, J.C.; Rhodes, O.E. Relative performance of Bayesian clustering software for inferring population substructure and individual assignment at low levels of population differentiation. Conserv. Genet. 2006, 7, 295–302. [Google Scholar] [CrossRef]
- Jones, R.C.; Steane, D.A.; Potts, B.M.; Vaillancourt, R.E. Microsatellite and morphological analysis of Eucalyptus globulus populations. Can. J. For. Res. 2002, 32, 59–66. [Google Scholar] [CrossRef]
- Elliott, C.; Byrne, M. Genetic diversity within and between natural populations of Eucalyptus occidentalis (Myrtaceae). Silvae Genetica 2003, 52, 169–173. [Google Scholar]
- Holman, J.E.; Hughes, J.M.; Fensham, R.J. A morphological cline in Eucalyptus: A genetic perspective. Mol. Ecol. 2003, 12, 3013–3025. [Google Scholar] [CrossRef] [PubMed]
- Wheeler, M.A.; Byrne, M.; McComb, J.A. Little genetic differentiation within the dominant forest tree, Eucalyptus marginata (Myrtaceae) of south-western Australia. Silvae Genetica 2003, 52, 254–259. [Google Scholar]
- Butcher, P.A.; Otero, A.; McDonald, M.W.; Moran, G.F. Nuclear RFLP variation in Eucalyptus camaldulensis Dehnh. from northern Australia. Heredity 2002, 88, 402–412. [Google Scholar] [CrossRef] [PubMed]
- Faria, D.A.; Mamani, E.M.C.; Pappas, M.R.; Pappas, G.J.; Grattapaglia, D. A selected set of EST-derived microsatellites, polymorphic and transferable across 6 species of Eucalyptus. J. Heredity 2010, 101, 512–520. [Google Scholar] [CrossRef] [PubMed]
- Hartl, D.L.; Clarke, A.G. Principles of Population Genetics; Sinauer Associates: Sunderland, MA, USA, 2007; ISBN 9780878933068. [Google Scholar]
- Martin, B.; Cossalter, C. Les Eucalyptus des îles de la Sonde. Bois For. Trop. 1975, 164, 3–14. [Google Scholar]
- Dvorak, W.S.; Hodge, G.R.; Payn, K.G. The conservation and breeding of Eucalyptus urophylla: A case study to better protect important populations and improve productivity. South For. 2008, 70, 77–85. [Google Scholar] [CrossRef]
- Swain, T.L.; Verryn, S.D.; Laing, M.D. An investigation of assumptions made in estimating genetic parameters and predicting genetic gain in a Eucalyptus nitens breeding programme in South Africa. New For. 2014, 46, 7–21. [Google Scholar] [CrossRef]
- Burgess, I.P.; Williams, E.R.; Bell, J.C.; Harwood, C.E.; Owen, J.V. The effect of outcrossing rate on the growth of selected families of Eucalyptus grandis. Silvae Genetica 1996, 45, 97–100. [Google Scholar]
- Clegg, P.A.; Toba Pulp Lestari, Medan, Sumatra, Indonesia. Personal communication, 2018.
- Lefevre, F. Human impacts on forest genetic resources in the temperate zone: An updated review. For. Ecol. Manag. 2004, 197, 257–271. [Google Scholar] [CrossRef]
- Pigato, S.M.P.C.; Lopes, C.R. The evaluation of genetic variability in four generations of Eucalyptus urophylla S.T. Blake by RAPD marker. Sci. For. 2001, 60, 119–133. [Google Scholar]
- Suontama, M.; Low, C.B.; Stovold, G.T.; Miller, M.A.; Fleet, K.R.; Li, Y.; Dungey, H.S. Genetic parameters and genetic gains across three breeding cycles for growth and form traits of Eucalyptus regnans in New Zealand. Tree Genet. Genomes 2015, 11, 133. [Google Scholar] [CrossRef]
- Paetkau, D.; Waits, L.P.; Clarkson, P.L. An empirical evaluation of genetic distance statistics using microsatellite data from bear (Ursidae) populations. Genetics 1997, 147, 1943–1957. [Google Scholar] [PubMed]
- Hoffman, J.I.; Amos, W. Microsatellite genotyping errors: Detection approaches, common sources and consequences for paternal exclusion. Mol. Ecol. 2005, 14, 599–612. [Google Scholar] [CrossRef] [PubMed]
Figure 1.
Development of three successive cycles of Eucalyptus urophylla S.T.Blake breeding in China. Trials shaded in grey were not sampled for this study; circled numbers indicate number of families contributing to the succeeding trial indicated by the associated arrow.
Figure 1.
Development of three successive cycles of Eucalyptus urophylla S.T.Blake breeding in China. Trials shaded in grey were not sampled for this study; circled numbers indicate number of families contributing to the succeeding trial indicated by the associated arrow.

Figure 2.
Geographic locations of E. urophylla natural stand provenances in Indonesia from which the genetic material included in the trials of the first cycle breeding population originated—the numbers linked to blue dots indicate the locations of the numbered provenances listed in Table 1.
Figure 2.
Geographic locations of E. urophylla natural stand provenances in Indonesia from which the genetic material included in the trials of the first cycle breeding population originated—the numbers linked to blue dots indicate the locations of the numbered provenances listed in Table 1.

Figure 3.
Unrooted neighbor joining (NJ) dendrogram for the 15 E. urophylla provenances (from which 5 or more families were sampled) represented in the first cycle breeding population in China, numbers placed at the head of branches are bootstrap values (based on 1000 iterations).
Figure 3.
Unrooted neighbor joining (NJ) dendrogram for the 15 E. urophylla provenances (from which 5 or more families were sampled) represented in the first cycle breeding population in China, numbers placed at the head of branches are bootstrap values (based on 1000 iterations).

Figure 4.
Proportions from each source group belonging to genetically homogenous clusters, determined by Bayesian cluster analyses with number of clusters determined by methods of Evanno et al. [34], for: (a) the first cycle population (presented by source groups comprising island/country of origin); and, (b) the third cycle population (presented by source groups comprising field trials of origin) of E. urophylla. Categories on X-axes represent geographic origins (parent locations), and these are for: (a) DMFF = Dongmen Forest Farm, China; Flores = Flores Island, Indonesia; Alor = Alor Island, Indonesia; Wetar = Wetar Island, Indonesia; for (b) E46, E77, E94 and TJJ are first cycle family trials, and E135 is the second cycle family trial.


Table 1.
Details of the samples obtained from 3 field trials (T46, T77 and T94) of the first cycle breeding population of E. urophylla.
Table 1.
Details of the samples obtained from 3 field trials (T46, T77 and T94) of the first cycle breeding population of E. urophylla.
| Trial (year) | Provenance Origins of Families in Trial * (Locations of the Mothers of Trees Sampled) | No. Families Sampled (in Trial) | |||
|---|---|---|---|---|---|
| Provenance Geographic Location ** | Island, Country | Latitude & Longitude | Altitude (m a.s.l.) | ||
| T46 (1988) | 1. Mt Lewotobi I | Flores, Ind. | 8°31′ S, 122°45′ E | 398 | 10 (14) |
| 2. Mt Egon *** | Flores, Ind. | 8°38′ S,122°27′ E | 450 | 14 (17) | |
| 3. Ulanu River | Alor, Ind. | 8°20′ S,124°27′ E | 500 | 9 (11) | |
| subtotals | 3 provenances | 33 (42) | |||
| T77 (1992) | 4. Mandiri | Flores, Ind. | 8°45′ S,122°50′ E | 410 | 9 (15) |
| 5. Mt Lewotobi II | Flores, Ind. | 8°32′ S,122°48′ E | 375 | 25 (30) | |
| 6. Wukoh | Flores, Ind. | 8°35′ S,122°48′ E | 375 | 9 (14) | |
| 2. Mt Egon *** | Flores, Ind. | 8°38′ S,122°27′ E | 450 | 22 (31) | |
| 7. Bangat | Flores, Ind. | 8°38′ S,122°27′ E | 330 | 10 (14) | |
| 8. Wairteban | Flores, Ind. | 8°38′ S,122°27′ E | 525 | 10 (13) | |
| 9. Iling Gele | Flores, Ind. | 8°37′ S,122°27′ E | 600 | 7 (14) | |
| 10. Andalan | Flores, Ind. | 8°36′ S,122°28′ E | 725 | 10 (13) | |
| 11. Jawaghar | Flores, Ind. | 8°36′ S,122°28′ E | 725 | 10 (14) | |
| 12. DMFF I | China | 22°23′ N,107°30′ E | 200 | 23 (29) | |
| subtotals | 10 provenances | 135 (190) | |||
| T94 (1998) | 13. Waikui | Alor, Ind. | 8°14′ S,124°44′ E | 540 | 2 (7) |
| 14. Arnau | Wetar, Ind. | 7°49′ S, 126°10′ E | 315 | 3 (7) | |
| 15. Uhak | Wetar, Ind. | 7°39′ S, 126°29′ E | 350 | 5 (27) | |
| 16. Apui | Alor, Ind. | 8°17′ S, 124°40′ E | 1115 | 2 (19) | |
| 17. Piritumas | Alor, Ind. | 8°19′ S, 124°31′ E | 355 | 4 (24) | |
| 18. Ilwaki | Wetar, Ind. | 7°52′ S, 126°27′ E | 515 | 5 (35) | |
| 19. Telemar | Wetar, Ind. | 7°54′ S, 125°58′ E | 180 | 1 (3) | |
| 20. Carbubu | Wetar, Ind. | 7°56′ S, 125°53′ E | 175 | 1 (3) | |
| 21. Dalaki | Pantar, Ind. | 8°31′ S, 124°5′ E | 440 | 2 (8) | |
| 22. DMFF II | China | 22°23′ N,107°30′ E | 200 | 9 (24) | |
| subtotals | 10 provenances | 34 (157) | |||
| Totals | 22 provenances/seed sources | 202 (389) families | |||
Note: * Key to abbreviations: Mt = Mount; DMFF = Dongmen State Forest Farm, Guangxi, China; Ind. = Indonesia. ** numerical ID’s of provenances relate to locations indicated by numbered blue dots in Figure 2; *** The Mt Egon provenance was included in both T46 and T77 trials, but was represented by different families each trial (i.e., families in the 2 trials were mutually exclusive).
Table 2.
Details of the samples obtained from one of the field trials (T164), planted in 2010, of the third cycle breeding population of E. urophylla.
Table 2.
Details of the samples obtained from one of the field trials (T164), planted in 2010, of the third cycle breeding population of E. urophylla.
| Mothers of Trees Sampled | Origins of Grandmothers of Families Sampled * | |||
|---|---|---|---|---|
| Trial ID | No. Families Sampled (in Trial) | No. Families Sampled (in Trial) | Provenance Geographic Location ** | Island, Country |
| T46 | 20 (38) | 6 (11) | 2. Mt Egon | Flores, Ind. ** |
| 6 (14) | 1. Mt Lewotobi I | Flores, Ind. | ||
| 5 (5) | 3. Ulanu River | Alor, Ind. | ||
| 3 (9) | 23. DMFF III | China | ||
| T77 | 43 (52) | 1 (1) | 4. Mandiri | Flores, Ind. |
| 20 (21) | 5. Mt Lewotobi II | Flores, Ind. | ||
| 9 (10) | 2. Mt Egon | Flores, Ind. | ||
| 2 (2) | 8. Wairteban | Flores, Ind. | ||
| 2 (2) | 9. Iling Gele | Flores, Ind. | ||
| 1 (1) | 10. Andalan | Flores, Ind. | ||
| 8 (12) | 12. DMFF I | China | ||
| T94 | 32 (50) | 1 (7) | 13. Waikui | Alor, Ind. |
| 1 (7) | 14. Arnau | Wetar, Ind. | ||
| 1 (27) | 15. Uhak | Wetar, Ind. | ||
| 1 (19) | 16. Apui | Alor, Ind. | ||
| 2 (24) | 17. Piritumas | Alor, Ind. | ||
| 2 (35) | 18. Ilwaki | Wetar, Ind. | ||
| 1 (3) | 19. Telemar | Wetar, Ind. | ||
| 1 (3) | 20. Carbubu | Wetar, Ind. | ||
| 9 (32) | 22. DMFF II | China | ||
| TJJ | 16 (21) | 0 (7) | 13. Waikui | Alor, Ind. |
| 2 (7) | 14. Arnau | Wetar, Ind. | ||
| 5 (27) | 15. Uhak | Wetar, Ind. | ||
| 0 (19) | 16. Apui | Alor, Ind. | ||
| 0 (24) | 17. Piritumas | Alor, Ind. | ||
| 9 (35) | 18. Ilwaki | Wetar, Ind. | ||
| 0 (3) | 19. Telemar | Wetar, Ind. | ||
| 0 (3) | 20. Carbubu | Wetar, Ind. | ||
| 0 (32) | 22. DMFF II | China | ||
| T135 | 14 (24) | 6 (22) | Trial T77 | China |
| 4 (14) | Trial T54 | China | ||
| 4 (9) | Trial T46 | China | ||
| 125 (185) families | Grandmothers represent 22 provenances/seed sources | |||
Note: * Key to abbreviations: Mt = Mount; DMFF = Dongmen State Forest Farm, Guangxi, China; Ind. = Indonesia. ** numerical ID’s of provenances relate to locations indicated by numbered blue dots in Figure 2.
Table 3.
Details of 16 microsatellite loci examined in this study.
| No. | Locus | Reference | No. | Locus | Reference |
|---|---|---|---|---|---|
| 1 | EUCeSSR805 | [22] | 9 | Embra165 | [23] |
| 2 | Embra57 | [23] | 10 | Embra186 | [23] |
| 3 | Embra78 | [23] | 11 | Embra192 | [23] |
| 4 | Embra86 | [23] | 12 | Embra198 | [23] |
| 5 | Embra94 | [23] | 13 | Embra226 | [23] |
| 6 | Embra119 | [23] | 14 | Embra333 | [23] |
| 7 | Embra130 | [23] | 15 | Embra368 | [23] |
| 8 | Embra145 | [23] | 16 | Embra377 | [23] |
Note: EUCeSSR805 is an expressed sequence tag marker while all others are neutral markers across the whole genome.
Table 4.
Loci genetic diversity indices for the first and third cycle breeding populations of E. urophylla; except for ‘N’ and ‘Na total’ the numbers for each trait in each population represent means across the 16 loci analyzed with standard deviations of these means given in brackets.
Table 4.
Loci genetic diversity indices for the first and third cycle breeding populations of E. urophylla; except for ‘N’ and ‘Na total’ the numbers for each trait in each population represent means across the 16 loci analyzed with standard deviations of these means given in brackets.
| Population | N | Na Total | Na | Ne | PIC | I | Ho | He | FIS |
|---|---|---|---|---|---|---|---|---|---|
| 1st | 202 | 459 | 28.7 (2.7) | 10.6 (1.8) | 0.86 (0.02) | 2.56 (0.14) | 0.59 (0.06) | 0.87 (0.02) | 0.32 (0.07) |
| 3rd | 125 | 428 | 26.8 (2.0) | 10.4 (1.5) | 0.87 (0.02) | 2.58 (0.12) | 0.60 (0.06) | 0.88 (0.01) | 0.31 (0.07) |
Note: N, number of trees and families sampled; Na Total, total number of alleles observed across all loci; Na, observed number of alleles per locus averaged across the 16 loci for each population; Ne, effective number of alleles per locus averaged across loci; PIC, polymorphism information content, averaged across loci; I, Shannon’s information index, averaged across loci; Ho, observed heterozygosity averaged across loci; He, expected heterozygosity, averaged across loci; FIS, Wright’s fixation index averaged across loci.
Table 5.
Genetic diversity indices for the provenances comprising the first cycle breeding population of E. urophylla—results presented only for the 15 provenances which had 5 or more families sampled.
Table 5.
Genetic diversity indices for the provenances comprising the first cycle breeding population of E. urophylla—results presented only for the 15 provenances which had 5 or more families sampled.
| Provenance | N | Na | Ne | I | Npa | Ho | He | FIS |
|---|---|---|---|---|---|---|---|---|
| Andalan, Flores | 10 | 9.4 | 7.2 | 2.03 | 0 | 0.62 | 0.88 | 0.26 |
| Bangat, Flores | 10 | 8.9 | 6.5 | 1.96 | 0 | 0.64 | 0.87 | 0.23 |
| DMFF I, China | 18 | 11.9 | 7.4 | 2.14 | 6 | 0.62 | 0.87 | 0.28 |
| DMFF II, China | 14 | 9.2 | 6.0 | 1.89 | 8 | 0.53 | 0.83 | 0.35 |
| Iling Gele, Flores | 7 | 6.9 | 5.4 | 1.74 | 3 | 0.61 | 0.85 | 0.23 |
| Ilwaki, Wetar | 5 | 5.7 | 4.7 | 1.57 | 7 | 0.58 | 0.84 | 0.26 |
| Jawaghar, Flores | 10 | 9.1 | 6.8 | 1.91 | 2 | 0.69 | 0.84 | 0.13 |
| Mandiri, Flores | 9 | 7.4 | 5.4 | 1.74 | 4 | 0.55 | 0.82 | 0.31 |
| Mt Egon, Flores | 36 | 16.0 | 8.3 | 2.25 | 18 | 0.59 | 0.85 | 0.30 |
| Mt Lewotobi I, Flores | 10 | 8.4 | 6.1 | 1.86 | 2 | 0.63 | 0.84 | 0.20 |
| Mt Lewotobi II, Flores | 25 | 13.2 | 8.3 | 2.19 | 14 | 0.66 | 0.86 | 0.23 |
| Uhak, Wetar | 5 | 5.8 | 4.8 | 1.59 | 9 | 0.61 | 0.84 | 0.21 |
| Ulanu River, Alor | 9 | 6.1 | 3.8 | 1.44 | 10 | 0.33 | 0.71 | 0.54 |
| Wairteban, Flores | 10 | 8.6 | 6.2 | 1.89 | 5 | 0.56 | 0.85 | 0.32 |
| Wukoh, Flores | 9 | 7.6 | 5.6 | 1.80 | 0 | 0.54 | 0.84 | 0.33 |
| Average | 12.5 | 8.9 | 6.2 | 1.87 | 5.9 | 0.58 | 0.84 | 0.28 |
| Std. dev. | 8.2 | 2.9 | 1.3 | 0.23 | 5.3 | 0.08 | 0.04 | 0.09 |
Note: N, number of trees and families sampled; Na, number of alleles per locus averaged across the 16 loci; Ne, number of effective alleles per locus averaged across loci; I, Shannon’s information index, averaged across loci; Npa, total number of private alleles across all 16 loci; Ho, observed heterozygosity averaged across loci; He, expected heterozygosity averaged across loci; FIS, Wright’s fixation index averaged across loci; Mt: Mount; Std. dev.: standard deviation.
Table 6.
Analyses of molecular variance (AMOVA) based on 16 microsatellite loci across: 15 provenances of the first cycle breeding population of E. urophylla that were represented by 5 or more families; and, across the five field trial sources that contributed to the third cycle breeding population of E. urophylla.
| Source of Variation | Degrees of Freedom | Sum of Squares | Variance Components 1 | Percentage of Variation |
|---|---|---|---|---|
| 1st cycle population | ||||
| Among provenances | 14 | 174.9 | 0.24 * | 3.4 |
| Among Individuals within provenances | 359 | 2423.5 | 6.75 * | 96.6 |
| Total | 373 | 2598.4 | 6.99 | 100 |
| 3rd cycle population | ||||
| Among seed sources | 4 | 85.7 | 0.13 * | 1 |
| Among Individuals within seed sources | 120 | 2212.4 | 18.44 * | 99 |
| Total | 124 | 2298.1 | 18.56 | 100 |
1 Significance levels of variance components were based on 999 permutations; * indicates significant at p < 0.001.
Table 7.
Pairwise genetic differentiation indices (Fst) for the provenances comprising the first cycle breeding population of E. urophylla—grey shading.
Table 7.
Pairwise genetic differentiation indices (Fst) for the provenances comprising the first cycle breeding population of E. urophylla—grey shading.
| Provenance | Andalan | Apui | Arnau | Bangat | Carbubu | Dalaki | DMFF I | DMFF II | Mt Egon | Iling Gele | Ilwaki | Jawag-har | Lewotobi I | Lewotobi II | Man-diri | Pirit-umas | Tele-mar | Uhak | Ulanu R | Waikui | Wair-teban |
|---|---|---|---|---|---|---|---|---|---|---|---|---|---|---|---|---|---|---|---|---|---|
| Apui | 0.032 | ||||||||||||||||||||
| Arnau | 0.030 | 0.042 | |||||||||||||||||||
| Bangat | 0.024 | 0.034 | 0.034 | ||||||||||||||||||
| Carbubu | 0.035 | 0.044 | 0.046 | 0.041 | |||||||||||||||||
| Dalaki | 0.036 | 0.046 | 0.034 | 0.041 | 0.047 | ||||||||||||||||
| DMFF I | 0.018 | 0.024 | 0.027 | 0.022 | 0.029 | 0.030 | |||||||||||||||
| DMFF II | 0.028 | 0.040 | 0.022 | 0.033 | 0.033 | 0.026 | 0.023 | ||||||||||||||
| Mt Egon | 0.018 | 0.031 | 0.027 | 0.024 | 0.027 | 0.029 | 0.012 | 0.018 | |||||||||||||
| Iling Gele | 0.031 | 0.049 | 0.034 | 0.033 | 0.049 | 0.041 | 0.032 | 0.038 | 0.030 | ||||||||||||
| Ilwaki | 0.037 | 0.040 | 0.050 | 0.047 | 0.046 | 0.055 | 0.034 | 0.042 | 0.030 | 0.059 | |||||||||||
| Jawaghar | 0.037 | 0.044 | 0.045 | 0.047 | 0.040 | 0.045 | 0.035 | 0.039 | 0.024 | 0.047 | 0.050 | ||||||||||
| LewotobiI | 0.037 | 0.038 | 0.042 | 0.037 | 0.041 | 0.043 | 0.031 | 0.035 | 0.027 | 0.057 | 0.048 | 0.036 | |||||||||
| LewotobiII | 0.026 | 0.031 | 0.030 | 0.027 | 0.031 | 0.029 | 0.022 | 0.026 | 0.018 | 0.031 | 0.039 | 0.020 | 0.026 | ||||||||
| Mandiri | 0.046 | 0.043 | 0.054 | 0.049 | 0.054 | 0.053 | 0.039 | 0.051 | 0.037 | 0.066 | 0.044 | 0.062 | 0.045 | 0.043 | |||||||
| Piritumas | 0.036 | 0.042 | 0.054 | 0.046 | 0.039 | 0.056 | 0.021 | 0.031 | 0.024 | 0.054 | 0.047 | 0.040 | 0.045 | 0.039 | 0.054 | ||||||
| Telemar | 0.043 | 0.046 | 0.049 | 0.054 | 0.058 | 0.047 | 0.032 | 0.044 | 0.035 | 0.057 | 0.049 | 0.052 | 0.054 | 0.042 | 0.038 | 0.044 | |||||
| Uhak | 0.043 | 0.045 | 0.049 | 0.040 | 0.045 | 0.049 | 0.034 | 0.035 | 0.028 | 0.057 | 0.041 | 0.059 | 0.043 | 0.042 | 0.047 | 0.051 | 0.055 | ||||
| Ulanu R | 0.086 | 0.093 | 0.096 | 0.081 | 0.105 | 0.075 | 0.067 | 0.069 | 0.068 | 0.101 | 0.096 | 0.108 | 0.085 | 0.088 | 0.097 | 0.082 | 0.091 | 0.070 | |||
| Waikui | 0.036 | 0.038 | 0.050 | 0.044 | 0.043 | 0.043 | 0.030 | 0.037 | 0.024 | 0.057 | 0.041 | 0.045 | 0.038 | 0.037 | 0.035 | 0.043 | 0.044 | 0.037 | 0.083 | ||
| Wairteban | 0.040 | 0.040 | 0.043 | 0.048 | 0.046 | 0.036 | 0.029 | 0.034 | 0.026 | 0.053 | 0.047 | 0.047 | 0.042 | 0.041 | 0.042 | 0.038 | 0.027 | 0.048 | 0.079 | 0.022 | |
| Wukoh | 0.035 | 0.044 | 0.042 | 0.031 | 0.040 | 0.047 | 0.032 | 0.036 | 0.028 | 0.041 | 0.035 | 0.051 | 0.051 | 0.035 | 0.056 | 0.050 | 0.058 | 0.031 | 0.095 | 0.043 | 0.050 |
© 2018 by the authors. Licensee MDPI, Basel, Switzerland. This article is an open access article distributed under the terms and conditions of the Creative Commons Attribution (CC BY) license (http://creativecommons.org/licenses/by/4.0/).
Share and Cite
MDPI and ACS Style
Lu, W.; Arnold, R.J.; Zhang, L.; Luo, J. Genetic Diversity and Structure through Three Cycles of a Eucalyptus urophylla S.T.Blake Breeding Program. Forests 2018, 9, 372. https://doi.org/10.3390/f9070372
AMA Style
Lu W, Arnold RJ, Zhang L, Luo J. Genetic Diversity and Structure through Three Cycles of a Eucalyptus urophylla S.T.Blake Breeding Program. Forests. 2018; 9(7):372. https://doi.org/10.3390/f9070372
Chicago/Turabian StyleLu, Wanhong, Roger J. Arnold, Lei Zhang, and Jianzhong Luo. 2018. "Genetic Diversity and Structure through Three Cycles of a Eucalyptus urophylla S.T.Blake Breeding Program" Forests 9, no. 7: 372. https://doi.org/10.3390/f9070372
Note that from the first issue of 2016, this journal uses article numbers instead of page numbers. See further details here.