Different Influences of Vegetation Greening on Regional Water-Energy Balance under Different Climatic Conditions

1
Key Laboratory of Watershed Geographic Sciences, Nanjing Institute of Geography and Limnology, Chinese Academy of Sciences, Nanjing 210008, China
2
Institute of Geographic Sciences and Natural Resources Research, Chinese Academy of Sciences, Chaoyang District, Beijing 100011, China
*
Author to whom correspondence should be addressed.
Forests 2018, 9(7), 412; https://doi.org/10.3390/f9070412
Submission received: 4 June 2018
/
Revised: 4 July 2018
/
Accepted: 5 July 2018
/
Published: 9 July 2018
(This article belongs to the Special Issue Afforestation and Reforestation: Drivers, Dynamics, and Impacts)
Abstract
:Vegetation serves as a key element in the land-atmospheric system, and changes in vegetation can impact the regional water-energy balance via several biophysical processes. This study proposes a new water-energy balance index that estimates the available-water-to-available-energy ratio (WER) by improving upon the Budyko framework, which evaluates climate variation and vegetation change. Moreover, the impact of vegetation greening on WER is quantified in 34 catchments under different climatic conditions. The results show that the normalized difference vegetation index (NDVI) increased at all the catchments, which indicates that there was a vegetation greening trend in the study area. There are negative relationships between the NDVI and runoff at both water-limited and energy-limited catchments, which demonstrates that both types of catchments became drier due to vegetation greening. Four numerical experiments were executed to quantify the contribution of vegetation greening and climate variations to WER changes. The results show that the calculated WER trends by numerical tests fit well with the observed WER trends (R2 = 0.96). Vegetation greening has positive influences on WER changes under energy-limited conditions, which indicates that residual energy decreases faster than water availability, resulting in less energy for sensible heat, i.e., a cooling effect. Nevertheless, vegetation greening has negative influences on WER under water-limited conditions, which indicates that water availability decreases faster than residual energy, resulting in more energy for sensible heat. Notably, the WER decrease in water-limited catchments is dominated by potential evapotranspiration and NDVI variation, whereas the WER change in energy-limited catchments is dominated by climate variation. This study provides a comprehensive understanding of the relationships among water, energy and vegetation greening under different climatic conditions, which is important for land-atmosphere-vegetation modeling and designing strategies for ecological conservation and local water resource management.
1. Introduction
Water and energy are essential elements of regional hydrology and are closely connected via evapotranspiration [1,2,3]. Vegetation is a crucial component of the land-atmospheric system, and changes in vegetation alter the regional water and energy balance through several biophysical processes [4,5,6]. Large-scale vegetation variation would lead to changes in climate dynamics, atmospheric-land surface interaction and global hydrological processes. According to reports from around the world, vegetation greening occurs in response to the effects of climate change and the impact of policies on ecological conservation and restoration in recent decades [7,8], including increased growth of the savannas in Australia, Africa and South America due to increased rainfall, the reforestation of abandoned farmlands in Russia and tree planting projects in China [9,10,11]. Investigating the impact of vegetation greening on the regional water-energy balance is an important issue in Earth system science with impacts in the present and in the future [12,13].
The regional water-energy balance is determined by the water supply (precipitation) and the energy availability (evaporative demand, PET) and is modified by land-surface characteristics, such as vegetation, soil and topography [14,15]. The Budyko framework, which is the primary approach used to investigate the regional water-energy balance, considers both climatic conditions and the underlying characteristics using a land-surface parameter w [16,17], which is related to vegetation, soil type, soil infiltration capacity, topography, etc. Recently, Liu et al. [18] proposed a new water-balance index (the available-water-to-available-energy ratio, WER) to reflect the regional energy balance and hydrological processes based on the Budyko framework and further investigated the impact of land-surface changes on WER. However, the impact of vegetation change on WER remains unknown because the study by Liu et al. [18] did not provide data on the relationships between vegetation greening and WER.
Several previous studies have noted the importance of considering vegetation dynamics when using the Budyko framework to evaluate the water-energy balance [19,20,21]. For example, Donohue et al. [22] concluded that the accuracy of runoff estimation was improved by incorporating dynamic vegetation into the Budyko framework when it was applied at finer spatial timescales. In addition, some researchers attempted to establish relationships between the variations in vegetation and the land-surface parameter w [23,24,25]. Li et al. [23] found that w was linearly correlated with vegetation coverage at long timescales in large river basins. Zhang et al. [25] presented an exponential relationship between the change in w and the vegetation variation using the Budyko framework. In general, these studies found positive relationships between changes in w and variations in vegetation under all climatic conditions; in other words, vegetation greening leads to an increase in evapotranspiration (i.e., a decrease in runoff), and the inverse is also true. This phenomenon is known as the “trade-off relationship” between vegetation and water [26]. The essence of this “trade-off relationship” is that precipitation and energy are redistributed via evapotranspiration because of vegetation changes.
Vegetation in China has increased considerably during the past 30 years because of the large-scale soil and water conservation projects implemented by the Chinese government [27,28]. The coverage of forest increased from 11% in the 1980s to 22% in 2010, especially in the Yangtze River and Yellow River basins [29,30]. Although some studies have investigated the influence of vegetation greening on evapotranspiration and runoff in China, no consensus regarding this subject has yet been achieved [31,32]. This study aims to propose a comprehensive approach to quantify the contribution of vegetation greening to the water-energy balance index (WER). Furthermore, the new approach is used to study 34 catchments under different climatic conditions in China. The results are expected to provide a comprehensive understanding of the interactions among vegetation, energy and water, which would be helpful for ecological restoration, forest protection and water resources management. The objectives of this study are (1) to investigate the relationships among WER changes, vegetation greening and climate variation under different climatic conditions, and (2) to quantify the contribution of vegetation greening and climate variation to WER changes.
2. Study Area
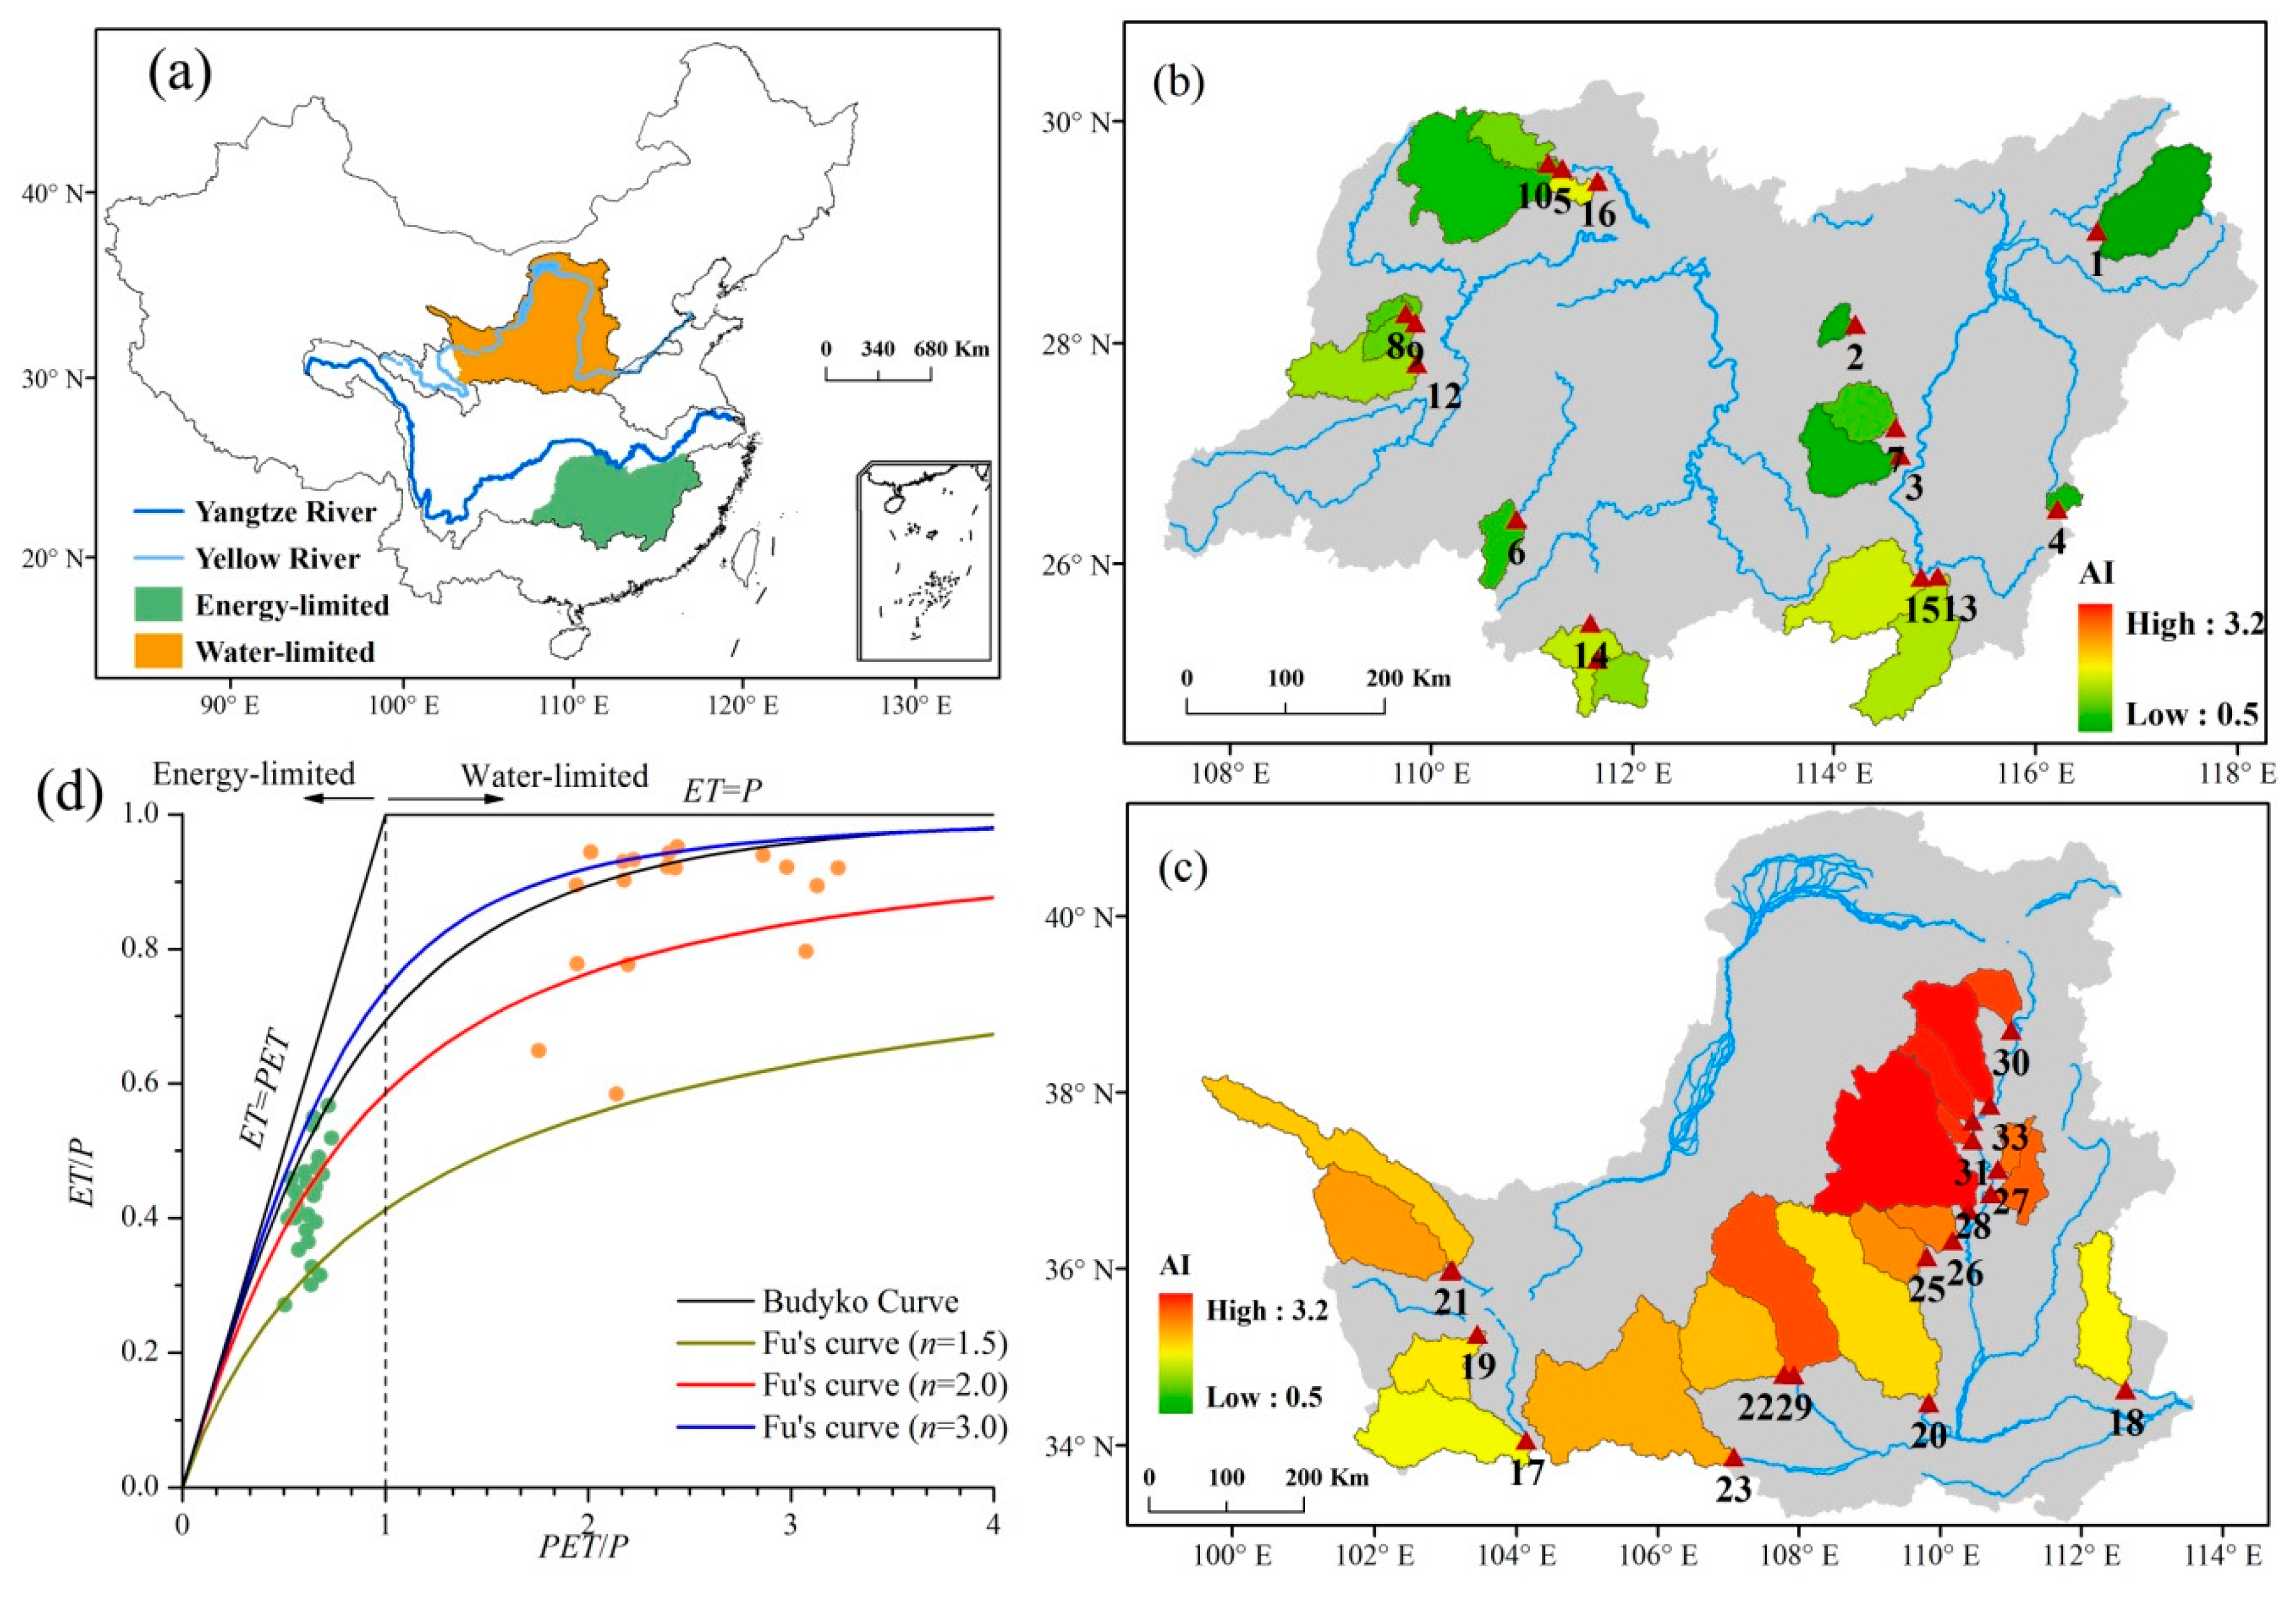
In this study, 34 catchments located in the middle reaches of the Yangtze River and Yellow River in China are selected to investigate the impact of vegetation greening on WER under different climatic conditions (Figure 1). The drainage areas range from 656 to 30,661 km2, and the aridity index (AI) values range from 0.5 to 3.2. Catchments in the Yangtze River (nos. 1–16) belong to an energy-limited condition (PET < precipitation), and catchments in the Yellow River (nos. 17–34) belong to a water-limited condition (PET > precipitation) [33]. The details are shown in Table 1. The dominant vegetation of the energy-limited catchments is forest, and the dominant vegetation of the water-limited catchments is grass [34,35].
3. Materials and Methods
3.1. Materials
Monthly runoff datasets from 1982 to 2013 under energy-limited conditions were collected from the Hydrological Yearbook of the Yangtze River in China. These energy-limited catchments are in the headwaters of the tributaries of the Yangtze River, and human influences, such as dams and reservoirs, on runoff are limited. Runoff under water-limited conditions in the Yellow River is influenced by intensive human activities, such as irrigation and water impoundment by dams. As a result, monthly naturalized runoff time series were provided by the Hydrological Bureau of the Yellow River. Monthly precipitation data from 1954 rainfall stations were obtained from the National Climate Center of the China Meteorological Administration. The maximum and minimum air temperatures, sunshine duration, relative humidity, and wind speed from 753 meteorological stations are used to calculate the PET based on the Penman formula, which has been shown to be the most appropriate form when considering a changing climate [36,37,38]. The AI is calculated as the ratio of the mean annual PET to the mean annual precipitation averaged from 1982–2013 and therefore reflects the average conditions of the regional climate. The climate variables and PET for each catchment are weighted by the Thiessen polygon method.
Monthly Advanced Very High Resolution (AVHRR) NDVI (normalized difference vegetation index)datasets processed by the Global Inventory Modeling and Mapping Studies are employed to explore the trends in vegetation during the past 30 years and are provided by the Global Land Cover Facility of the University of Maryland [39,40]. These data have a good accuracy and have been used widely in hydrological and ecological research [40]. The spatial resolution is 8 km × 8 km. The NDVI data are averaged over all grid cells whose centers are in the corresponding catchment.
3.2. Water-Energy Balance Index Considering Vegetation Change
The water-energy balance index proposed by Liu et al. [18] is defined as the ratio of water availability to energy availability, which is written as:
Where P is precipitation, PET is potential evapotranspiration and ET is actual evaporation. WER reflects the regional dryness and wetness condition comprehensively, which is the balanced state of the catchment’s energy and water. ET is estimated by Fu’s equation based on the Budyko framework [17]:
Where AI is the aridity index, which is the ratio of precipitation to potential evapotranspiration. The parameter w is related to the land-surface characteristics and can be estimated using long-term hydroclimatic data. Previous studies have demonstrated that the Budyko-based Fu’s equation is appropriate for ET estimation at different timescales [31,41]. For a reasonable application of Fu’s equation and to better use the available data, a 60-month (5-year timescale) moving average is adopted for water balance analysis.
Substituting Equation (2) into Equation (1), WER can be simplified as:
Previous studies have indicated that w is related to vegetation, soil type, soil infiltration capacity, topography, and other factors. When all the affecting factors for w are considered, w can be estimated. Li et al. [23] found a linear relationship between w and NDVI over a wide range of river basins, which is expressed as:
Where a and b are the regression coefficients. Substituting Equation (4) into Equation (3), WER can be simplified as:
Equation (5) shows the nonlinear correlations among WER, vegetation and climate variables (precipitation and PET). There are three advantages of WER. First, it considers both the regional climatic condition and the land-surface features and is therefore closer to the actual condition than the standardized precipitation index, standardized precipitation evapotranspiration index or Palmer drought severity index. Second, it provides a nonlinear relationship between WER changes and NDVI changes, as well as AI, which can be used to quantify WER changes. Third, the index has a simple form and can be easily combined with remote sensing products, making it appropriate for use in data-scarce catchments.
3.3. Sensitivity Analysis
The sensitivity of WER to climate variation and vegetation change is evaluated by the following equation [42,43]:
Where ∂WER/∂xi is the partial derivative of WER to the influencing factor xi (precipitation, PET and NDVI). A positive sensitivity coefficient indicates WER will increase as xi increases, whereas a negative sensitivity coefficient indicates WER will decrease as xi increases. A sensitivity coefficient of 0.1 indicates that a 10% increase of xi will lead to an increase in WER by 1%. The larger the absolute value of εxi the larger the influence of change in xi on WER.
3.4.Contribution Method
In this study, a numerical experiment approach is employed to quantify the impacts of vegetation changes and climate variation on WER. Four numerical experiments are designed, including one control experiment and three sensitivity experiments (Table 2). The WER values calculated by the control experiment represent the combined influence of climate and vegetation changes, and the WER values calculated by each sensitivity experiment represent the influence of the two factors other than the unchanged factor. Thus, the impact of each factor on WER changes can be estimated as:
Where xi represents precipitation, PET or NDVI, C_xi is the contribution of the corresponding factor to WER changes, TWER_ctr is the slope of WER_ctr based on linear regression, and TWER_xi is the slope of WER based on the ith sensitivity experiment.
4. Results
4.1. Relationship between Vegetation and the Land-Surface Parameter w
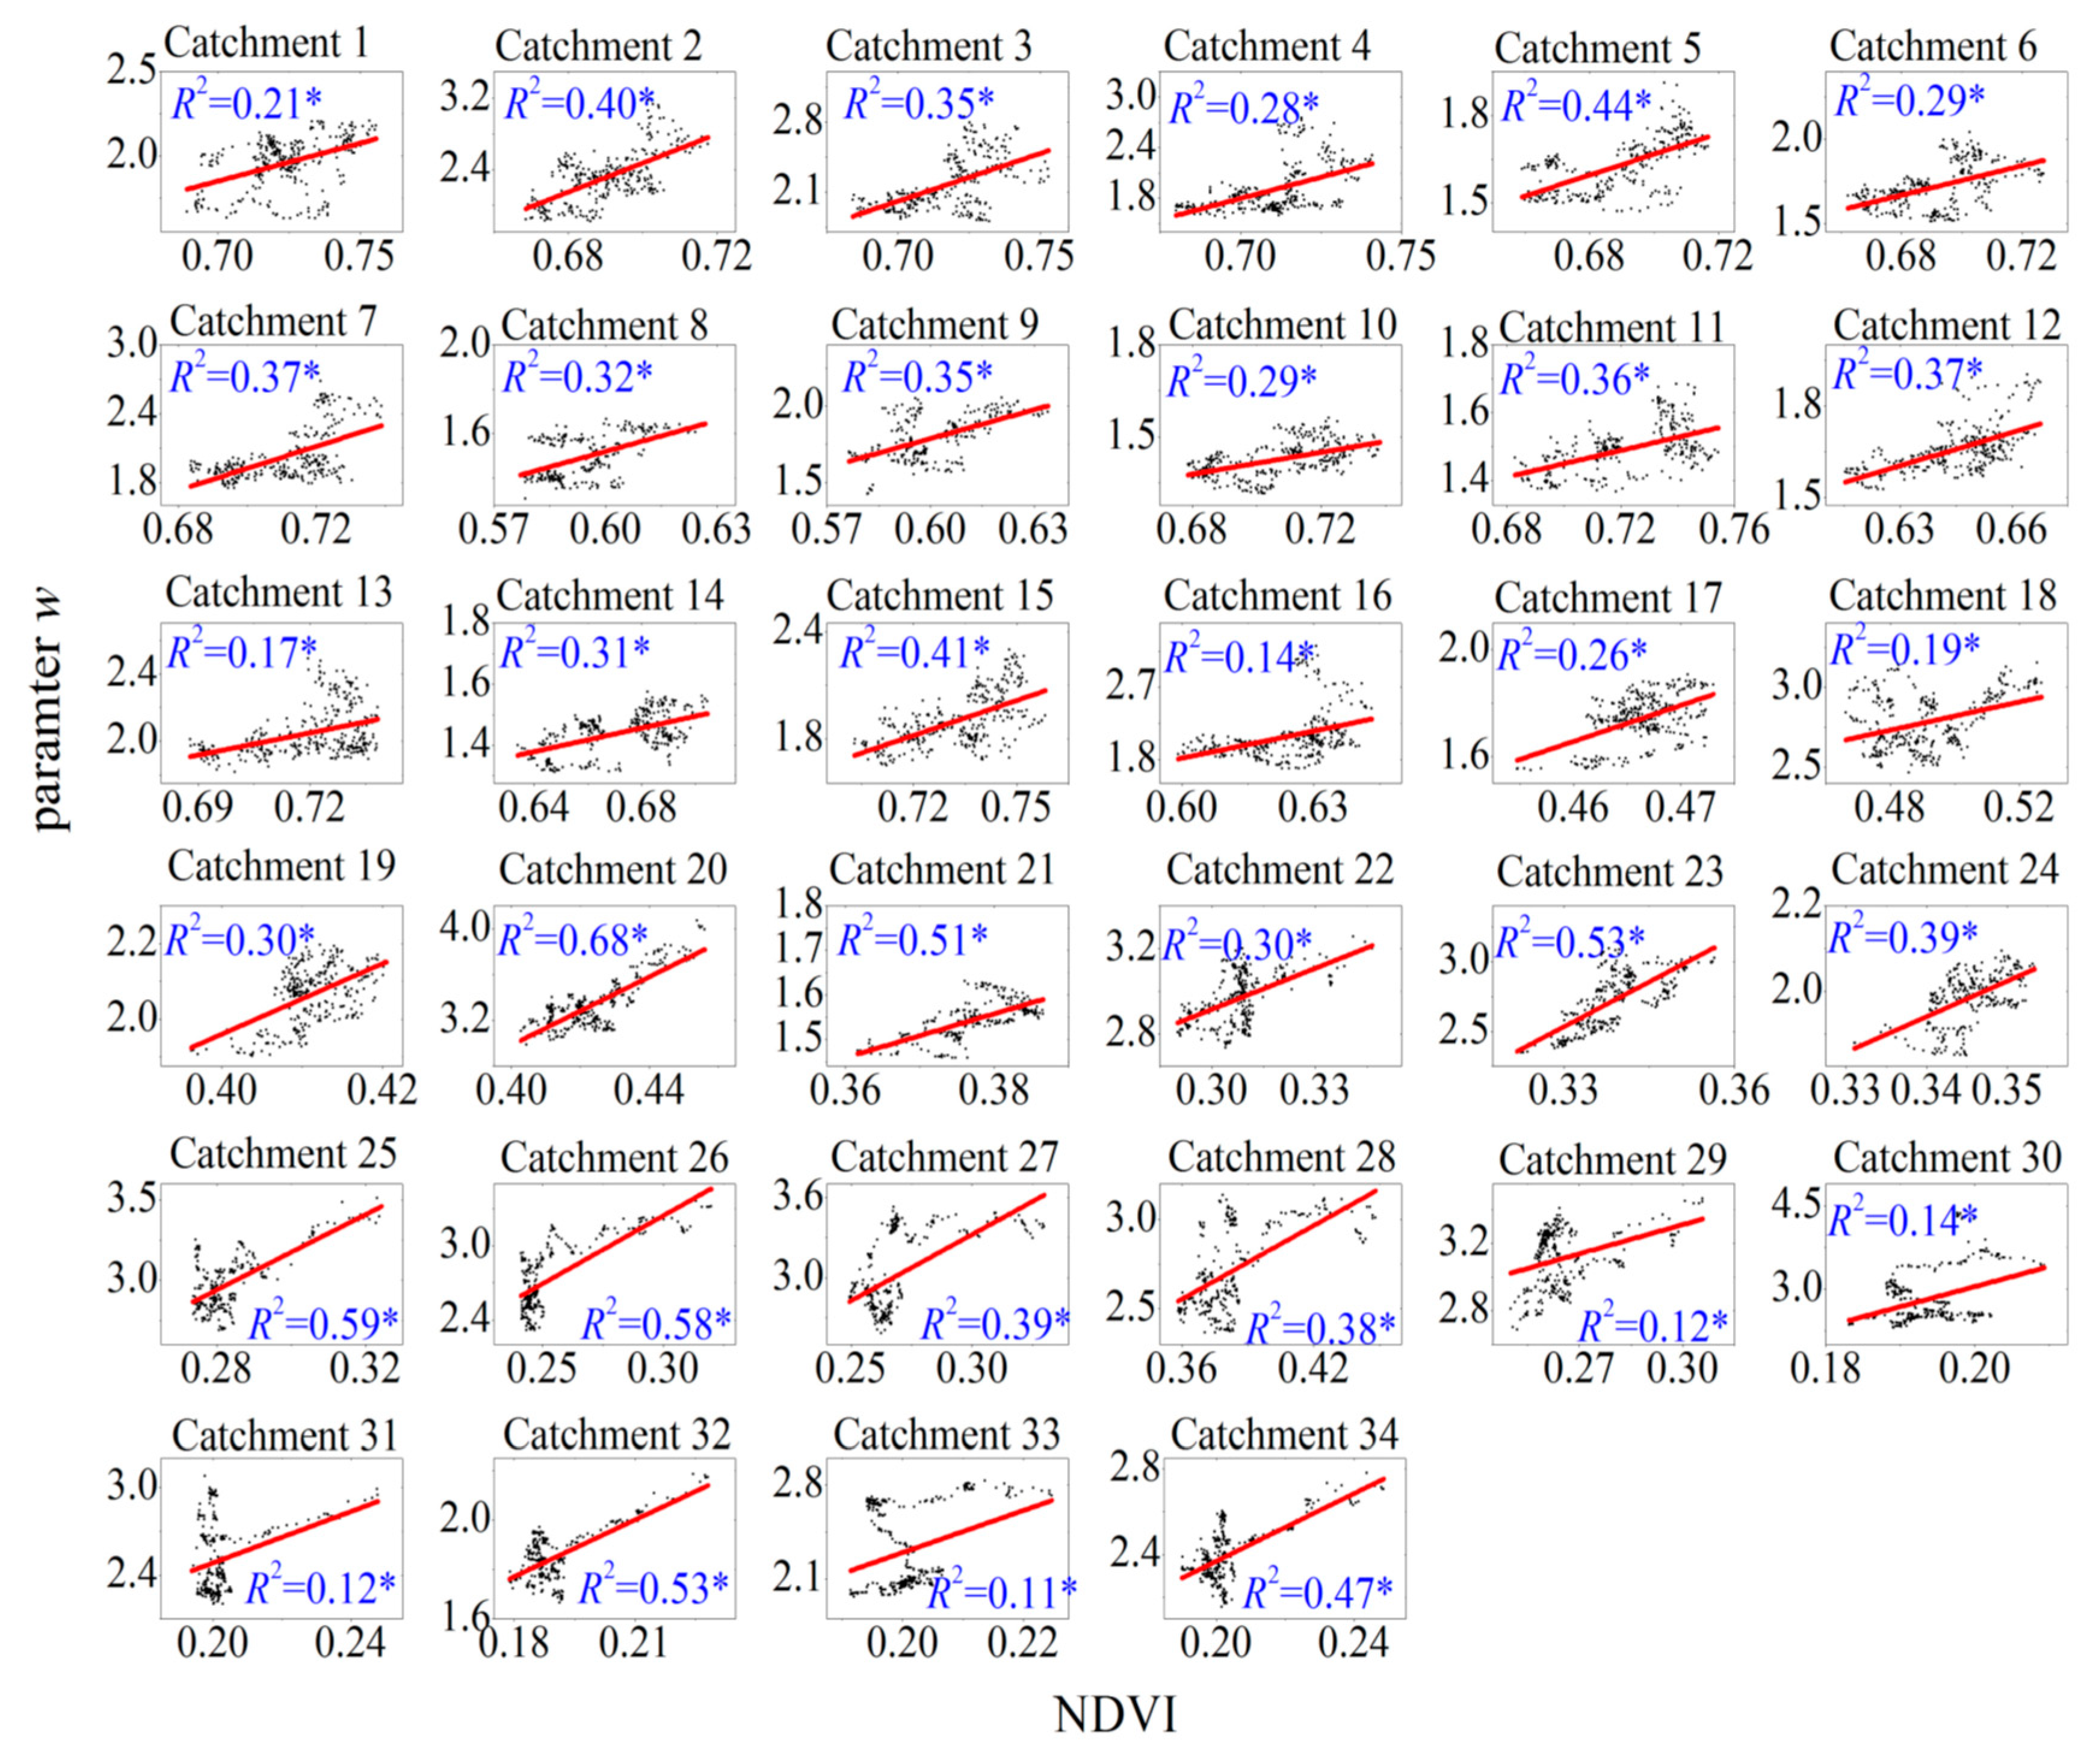
Figure 2 shows the relationships between w and NDVI for the selected catchments. The coefficient of determination R2 ranges from 0.11 to 0.68, and all catchment values are significant at the level of 0.01 by the t-test, which indicates that changes in NDVI explain 11–68% of the changes in w (Table 3). Parameter a is positive in all 34 catchments, indicating that evapotranspiration increases with vegetation greening. The average value of a in energy-limited catchments is 6.3, whereas the average value of a in water-limited catchments is 11.4. This difference indicates that the impact of vegetation greening on w (e.g., evapotranspiration) is larger under a water-limited condition than under an energy-limited condition. Parameter b ranges from −9.22 to 0.16 under an energy-limited condition, whereas it ranges from −4.55 to 1.58 under a water-limited condition.
4.2. Changes in WER, Climate Variables and Vegetation
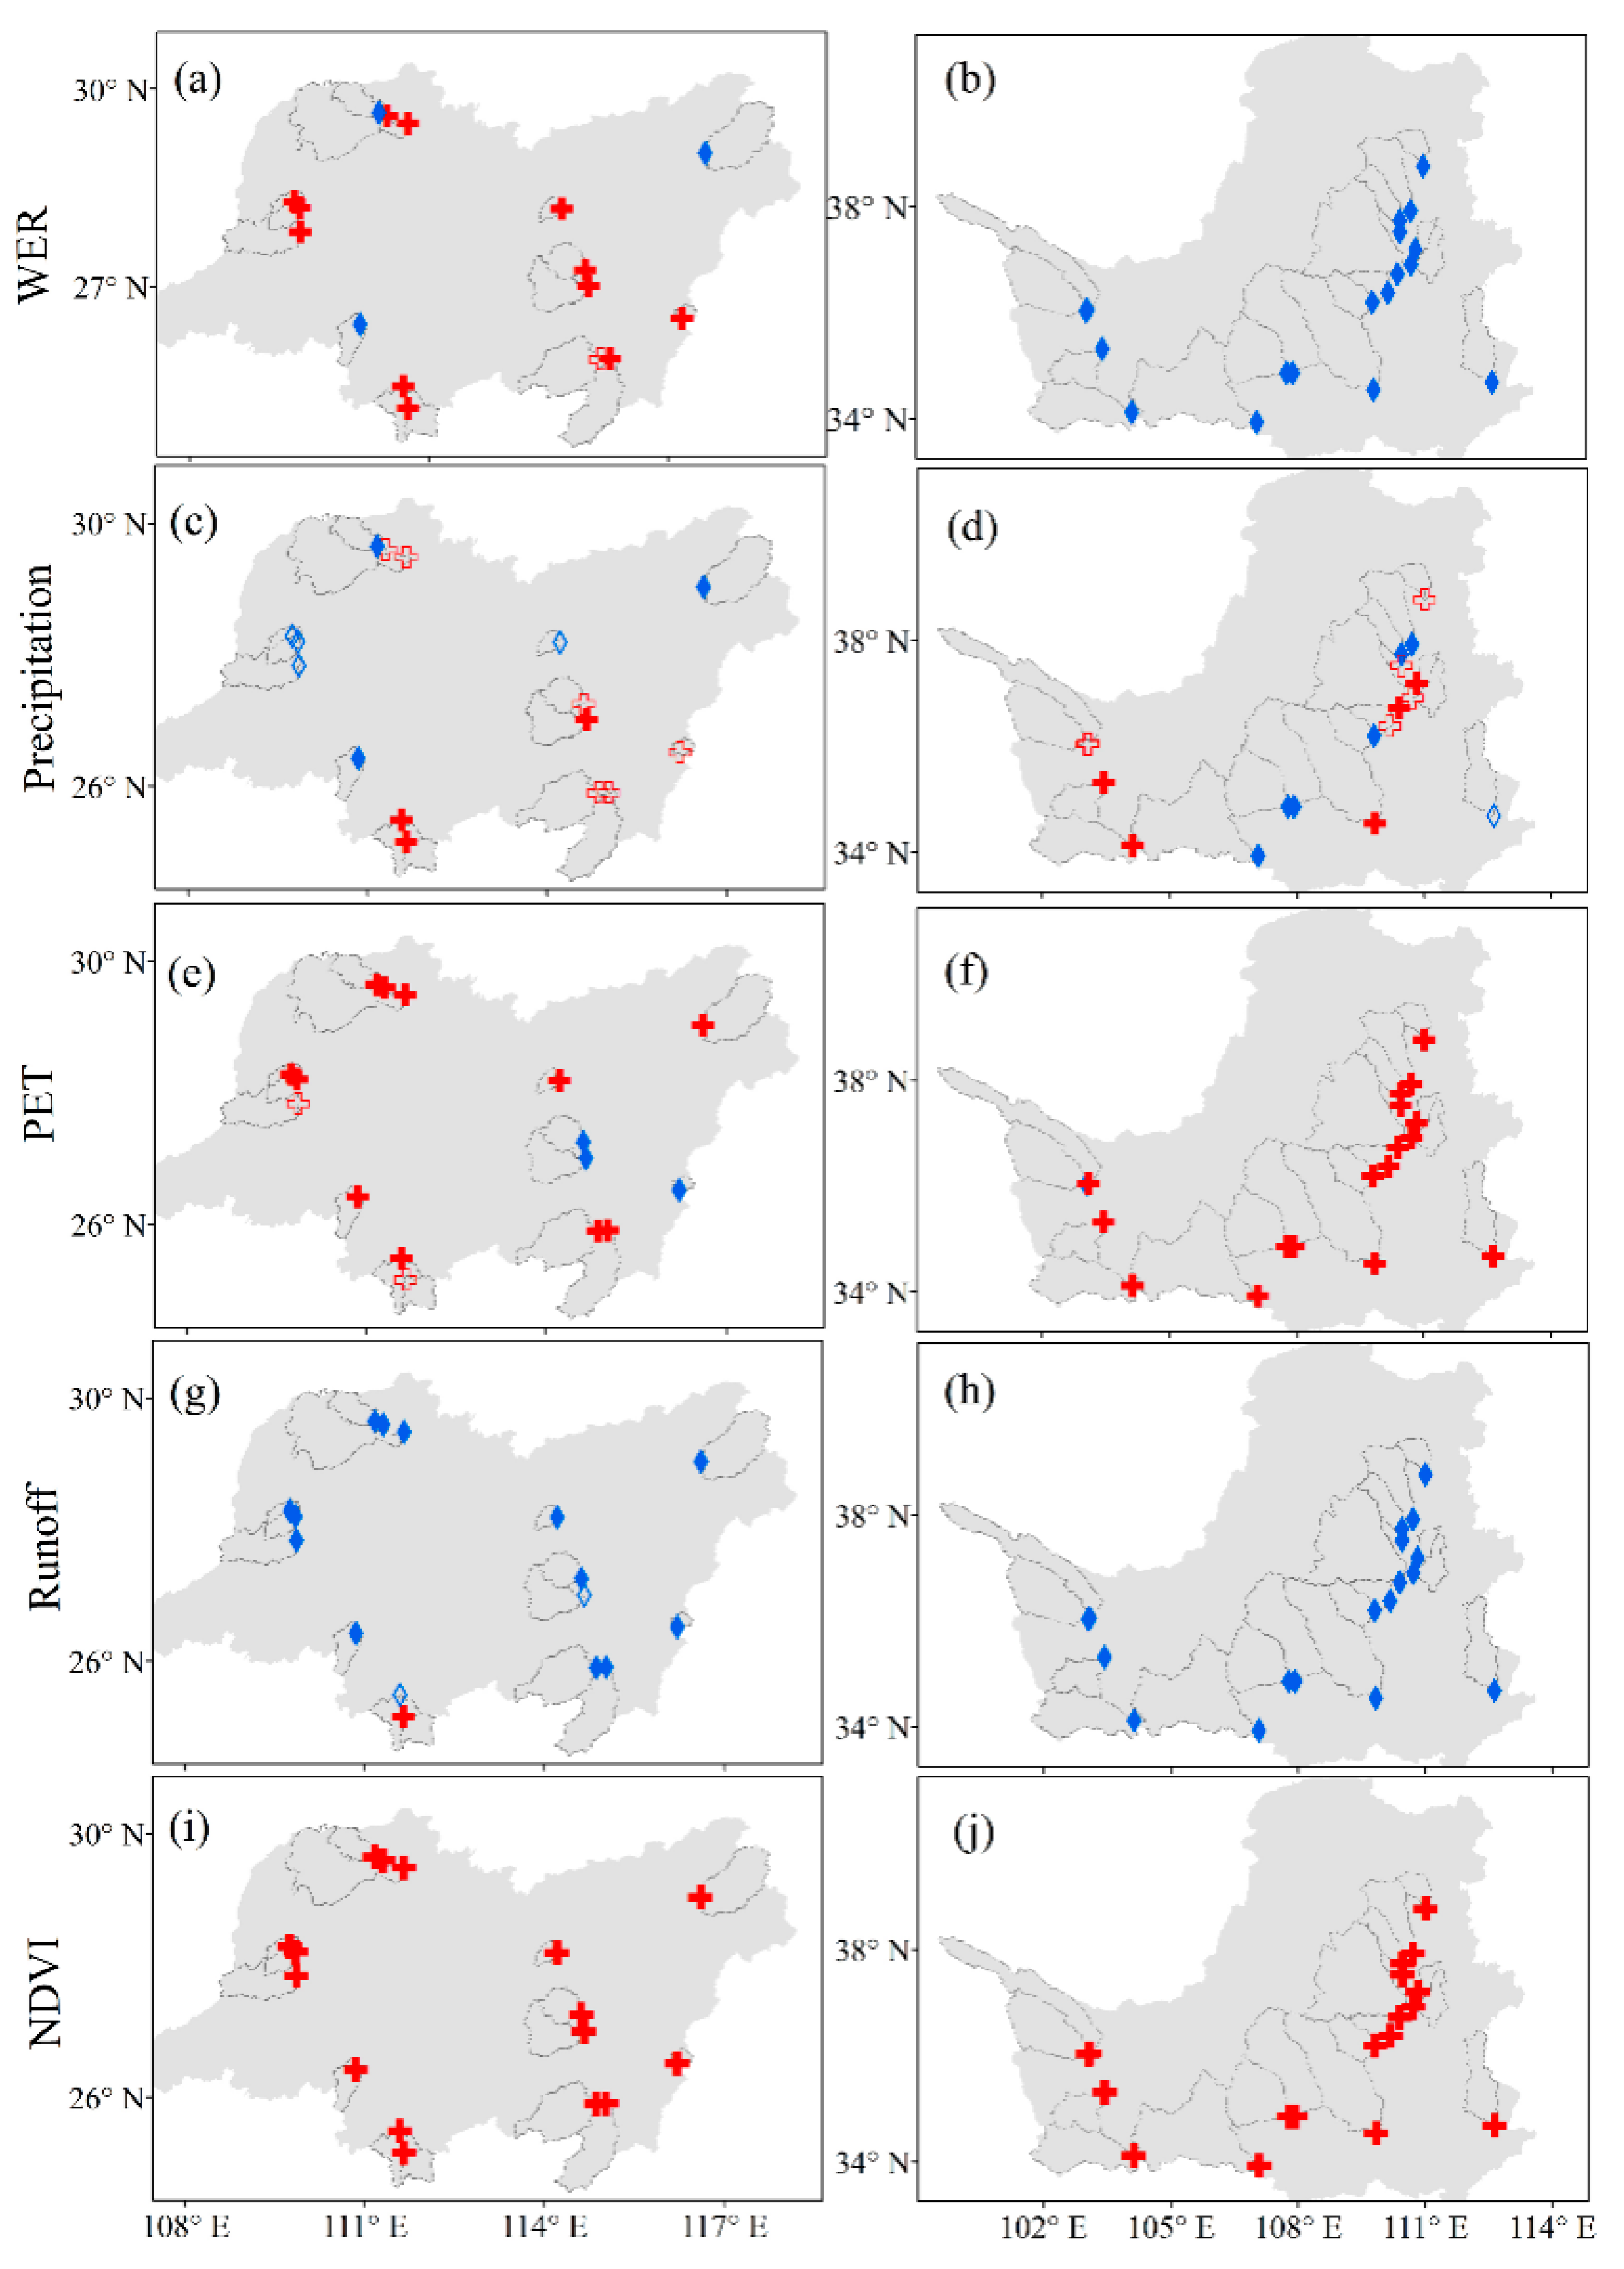
Figure 3 show the changes in WER in the 34 catchments during the past three decades. WER decreased significantly in 21 catchments (p < 0.01) (Table 4), whereas WER increased significantly (p < 0.01) in 12 catchments, and all the increasing trends were present in energy-limited catchments. Precipitation increased significantly (p < 0.01) in 8 catchments and decreased significantly (p < 0.01) in 9 catchments. PET increased significantly (p < 0.01) in 28 catchments and decreased significantly (p < 0.01) in 4 catchments. Overall, runoff decreased significantly (p < 0.01) in 31 catchments and only increased significantly (p < 0.01) in 1 catchment, in which precipitation increased significantly (p < 0.01). The NDVI values in all 34 catchments increased significantly (p < 0.01), which means that the vegetation recovered during the last 30 years in the selected catchments. The general conclusion that vegetation greening leads to a decrease in runoff was observed in almost all catchments [25].
4.3. Sensitivity of WER to Climate Variables and Vegetation
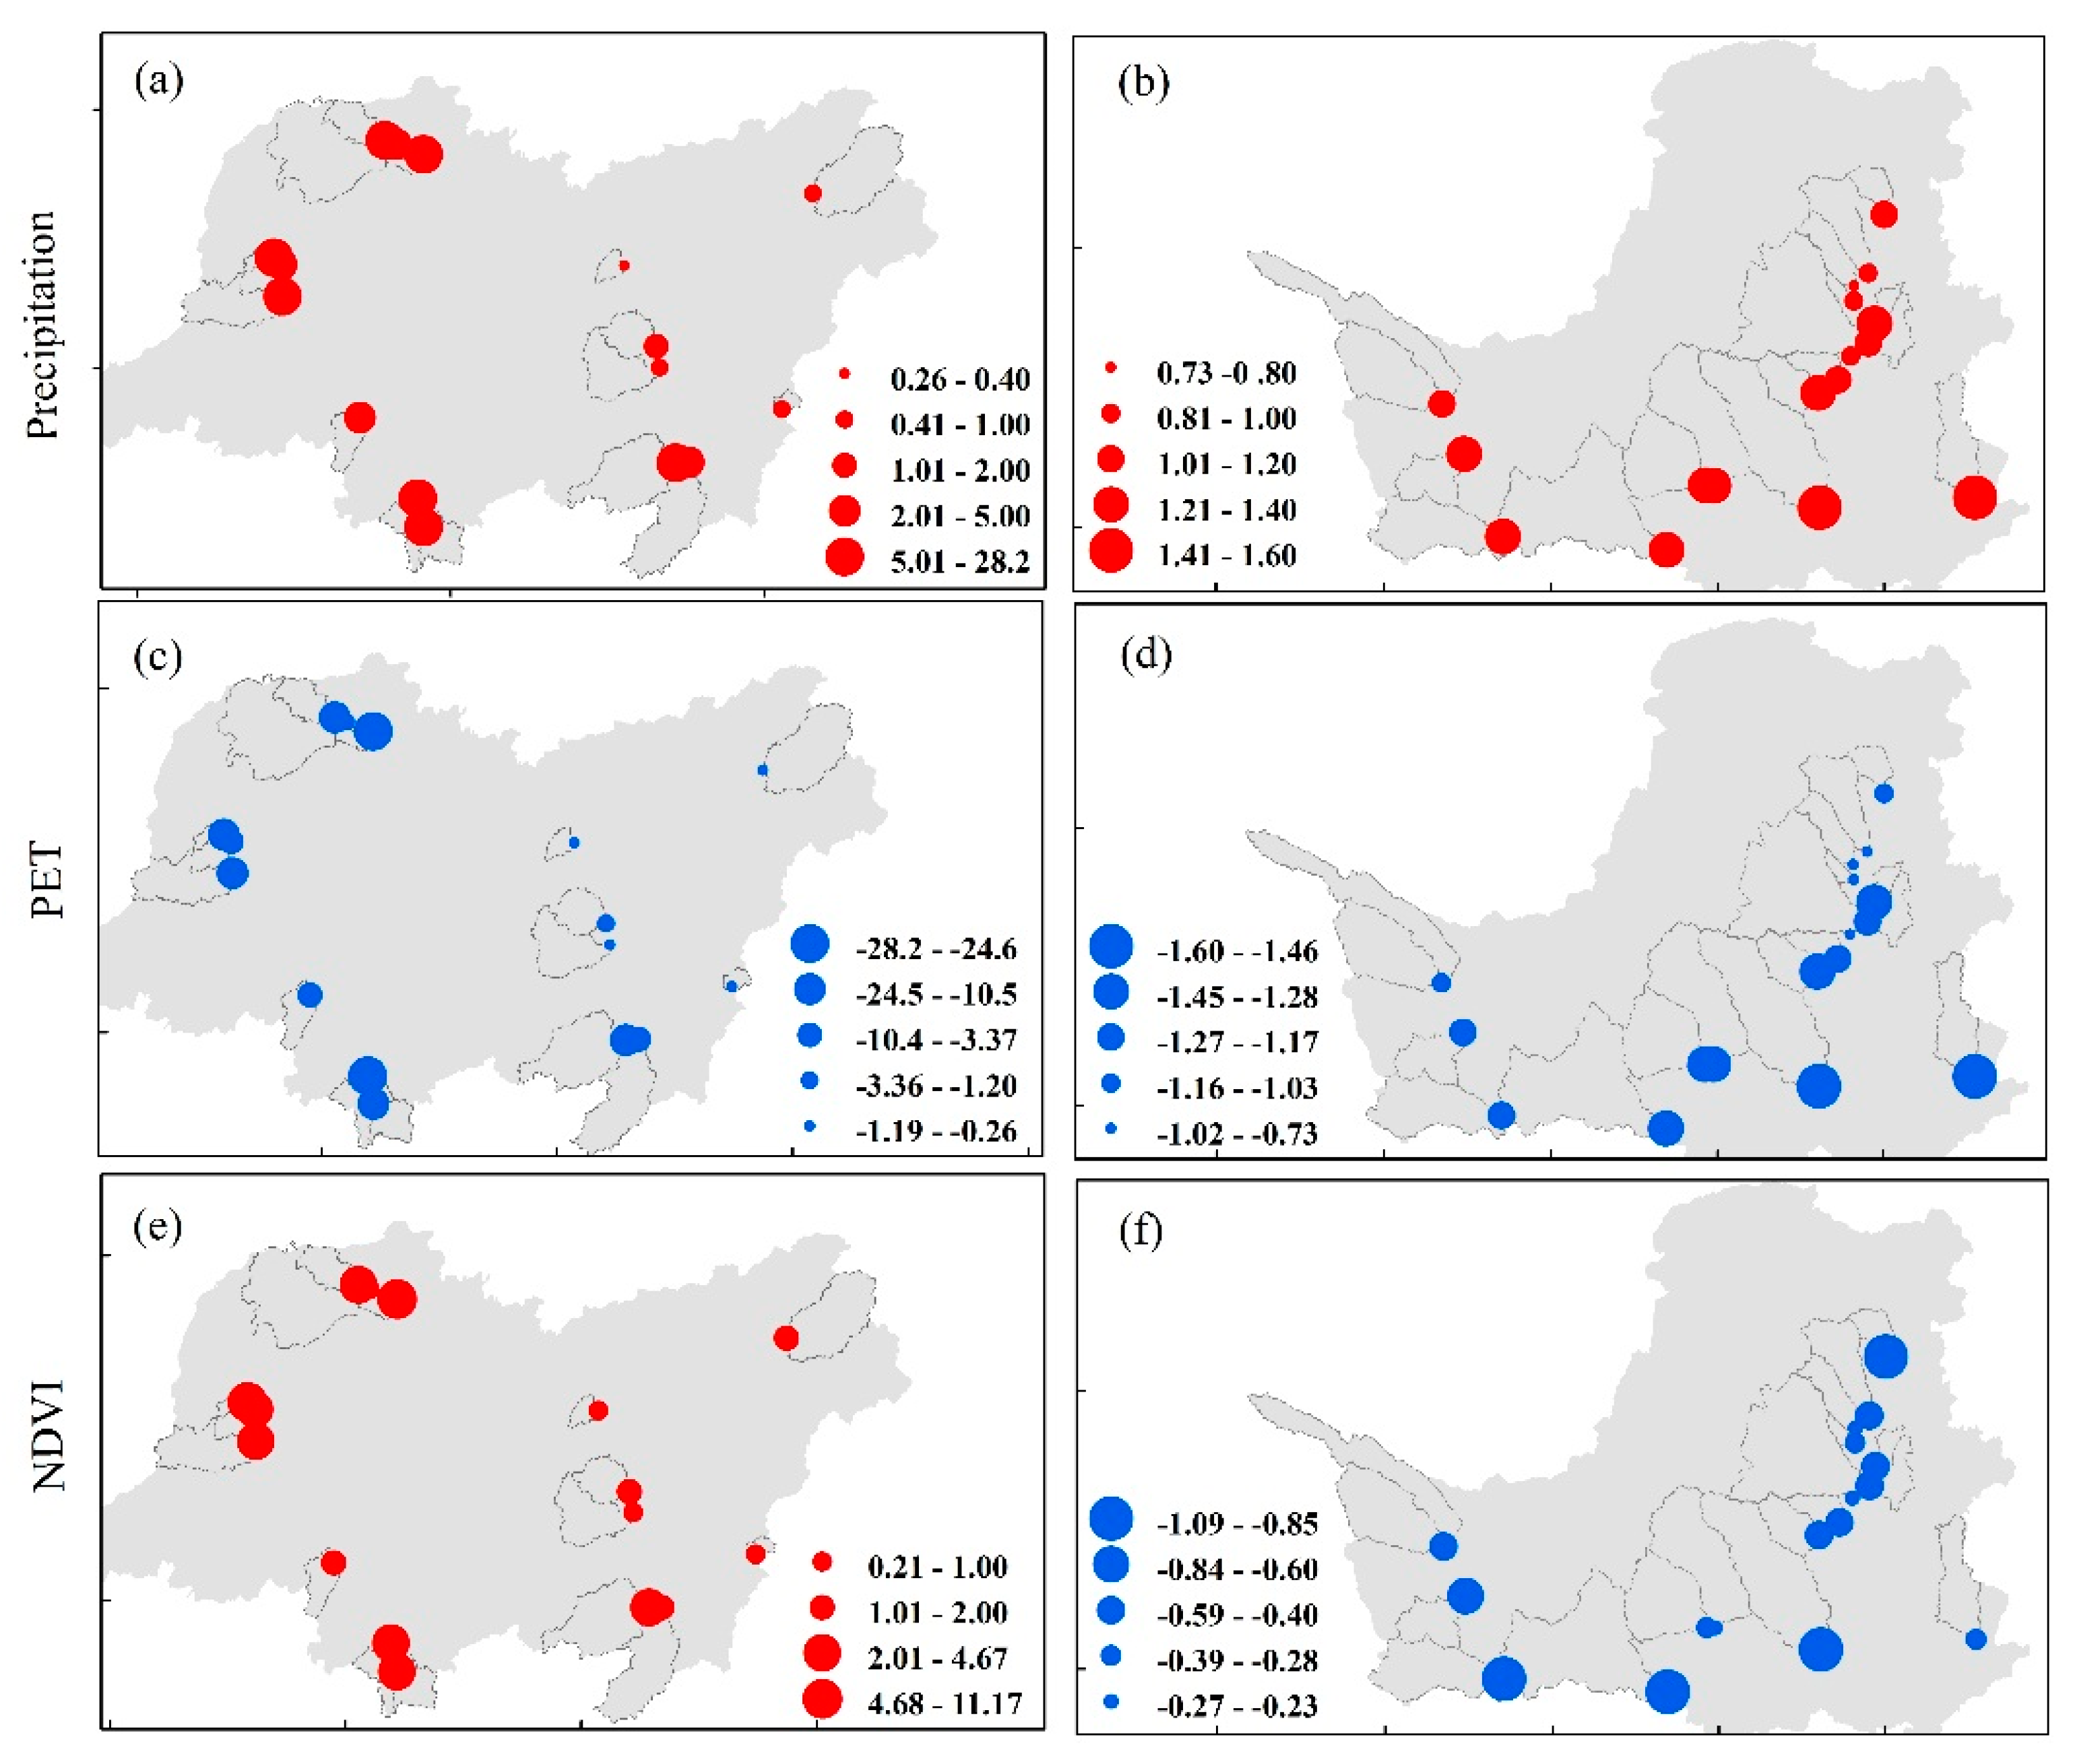
Figure 4 shows the sensitivities of WER to precipitation, PET and NDVI in the 34 catchments. Under the energy-limited condition, the sensitivity of WER to precipitation (εprcp) ranges from 0.26 to 28.2, which means a 10% increase in precipitation would result in WER decreasing by 2.6% to 282%. However, εprcp ranges from 0.73 to 1.60 under the water-limited condition, which would result in a much smaller WER change than that under the energy-limited condition. Because the sensitivity of WER to PET (εPET) is the inverse of the sensitivity of WER to precipitation, its spatial distribution is similar to that of precipitation. The sensitivity of WER to NDVI (εNDVI) under the energy-limited condition ranges from 0.21 to 11.2, which means a 10% increase in NDVI would result in WER increasing by 2.1 to 112%. However, εNDVI under the water-limited condition ranges from −0.23 to −1.09, which means a 10% increase in NDVI would result in WER decreasing by 2.3% to 10.9%. Moreover, the absolute value of the sensitivity of WER to NDVI under the water-limited condition is much smaller than that under the energy-limited condition, indicating that WER changes in energy-limited catchments are more sensitive to vegetation greening.
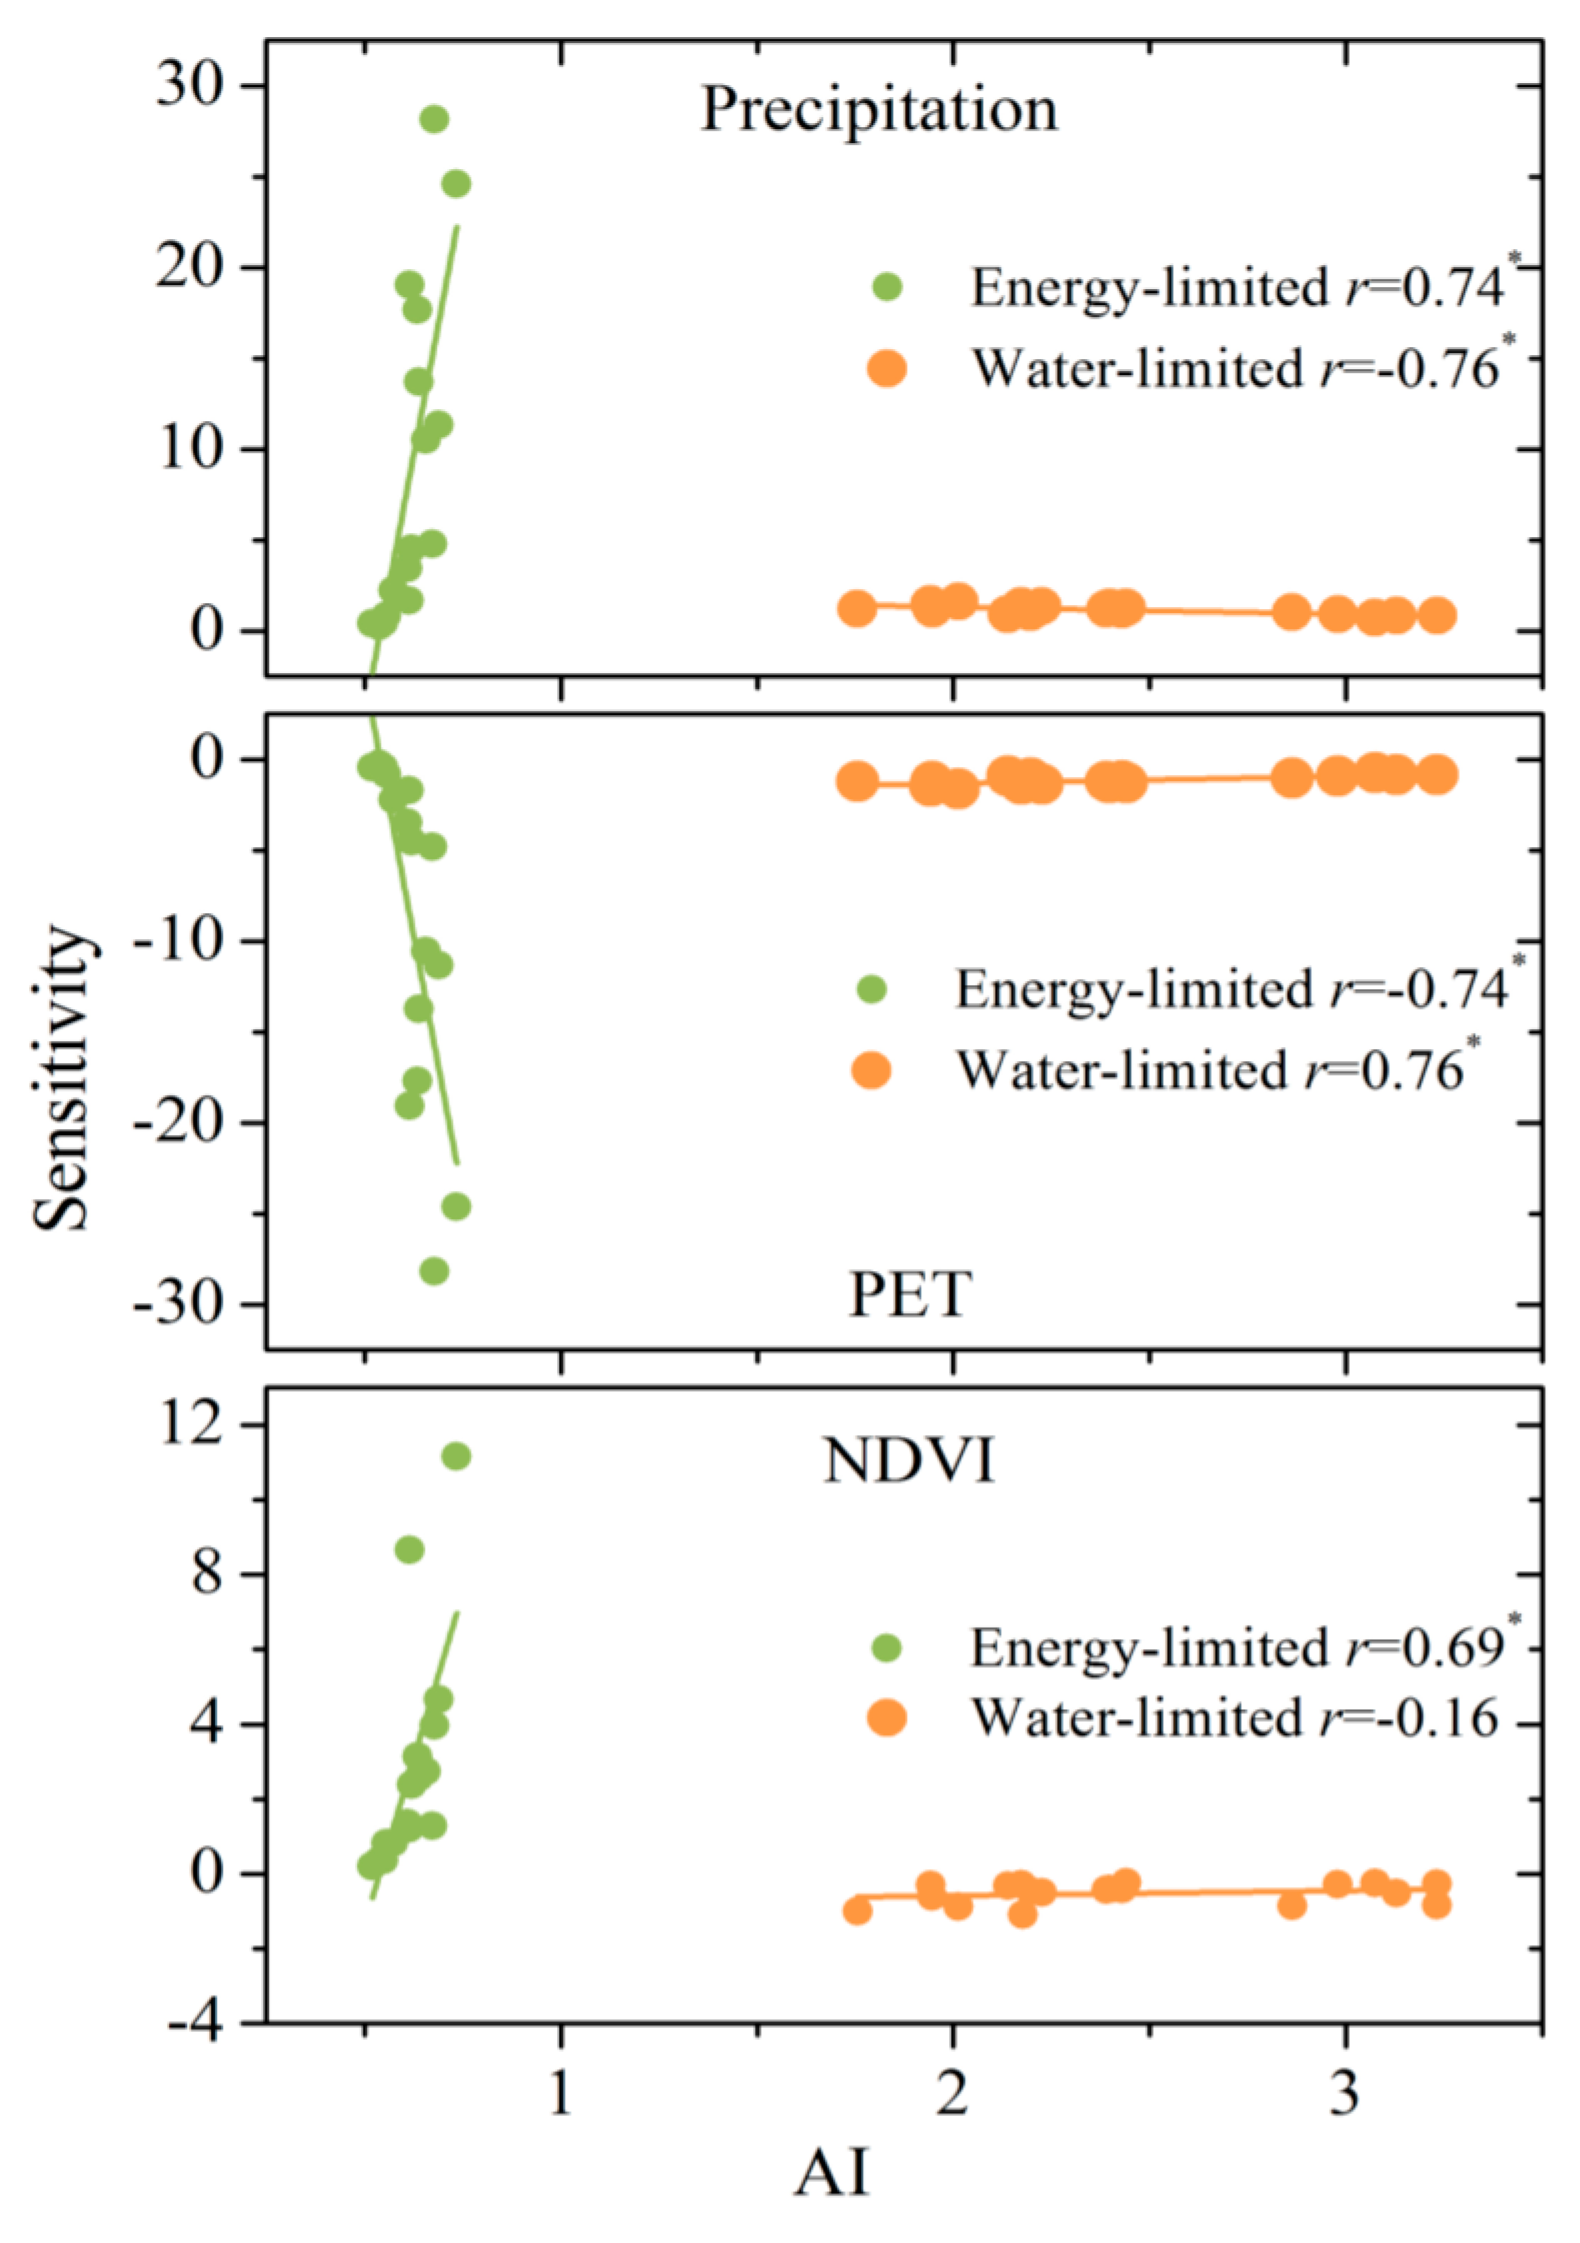
Interestingly, there are positive relationships between sensitivity coefficients and AI (Figure 5). εprcp increases with AI under an energy-limited condition (r = 0.74, p < 0.01), whereas εprcp decreases with AI under a water-limited condition (r = −0.76, p < 0.01). The relationship between εPET and AI is the inverse of that between εprcp and AI. There are negative relationships between εNDVI and AI under a water-limited condition (r = −0.16, p > 0.01), whereas there are positive relationships between them under an energy-limited condition (r = 0.69, p < 0.01). Please note that there is a large absolute value of the sensitivities when AI is approaching 1 because WER is the ratio of water availability to energy availability. When AI is approaching 1, evapotranspiration is close to precipitation and PET. A small change in water availability and energy availability will lead to a substantial change in WER.
4.4. Quantification of Climate Variation and Vegetation Greening to WER
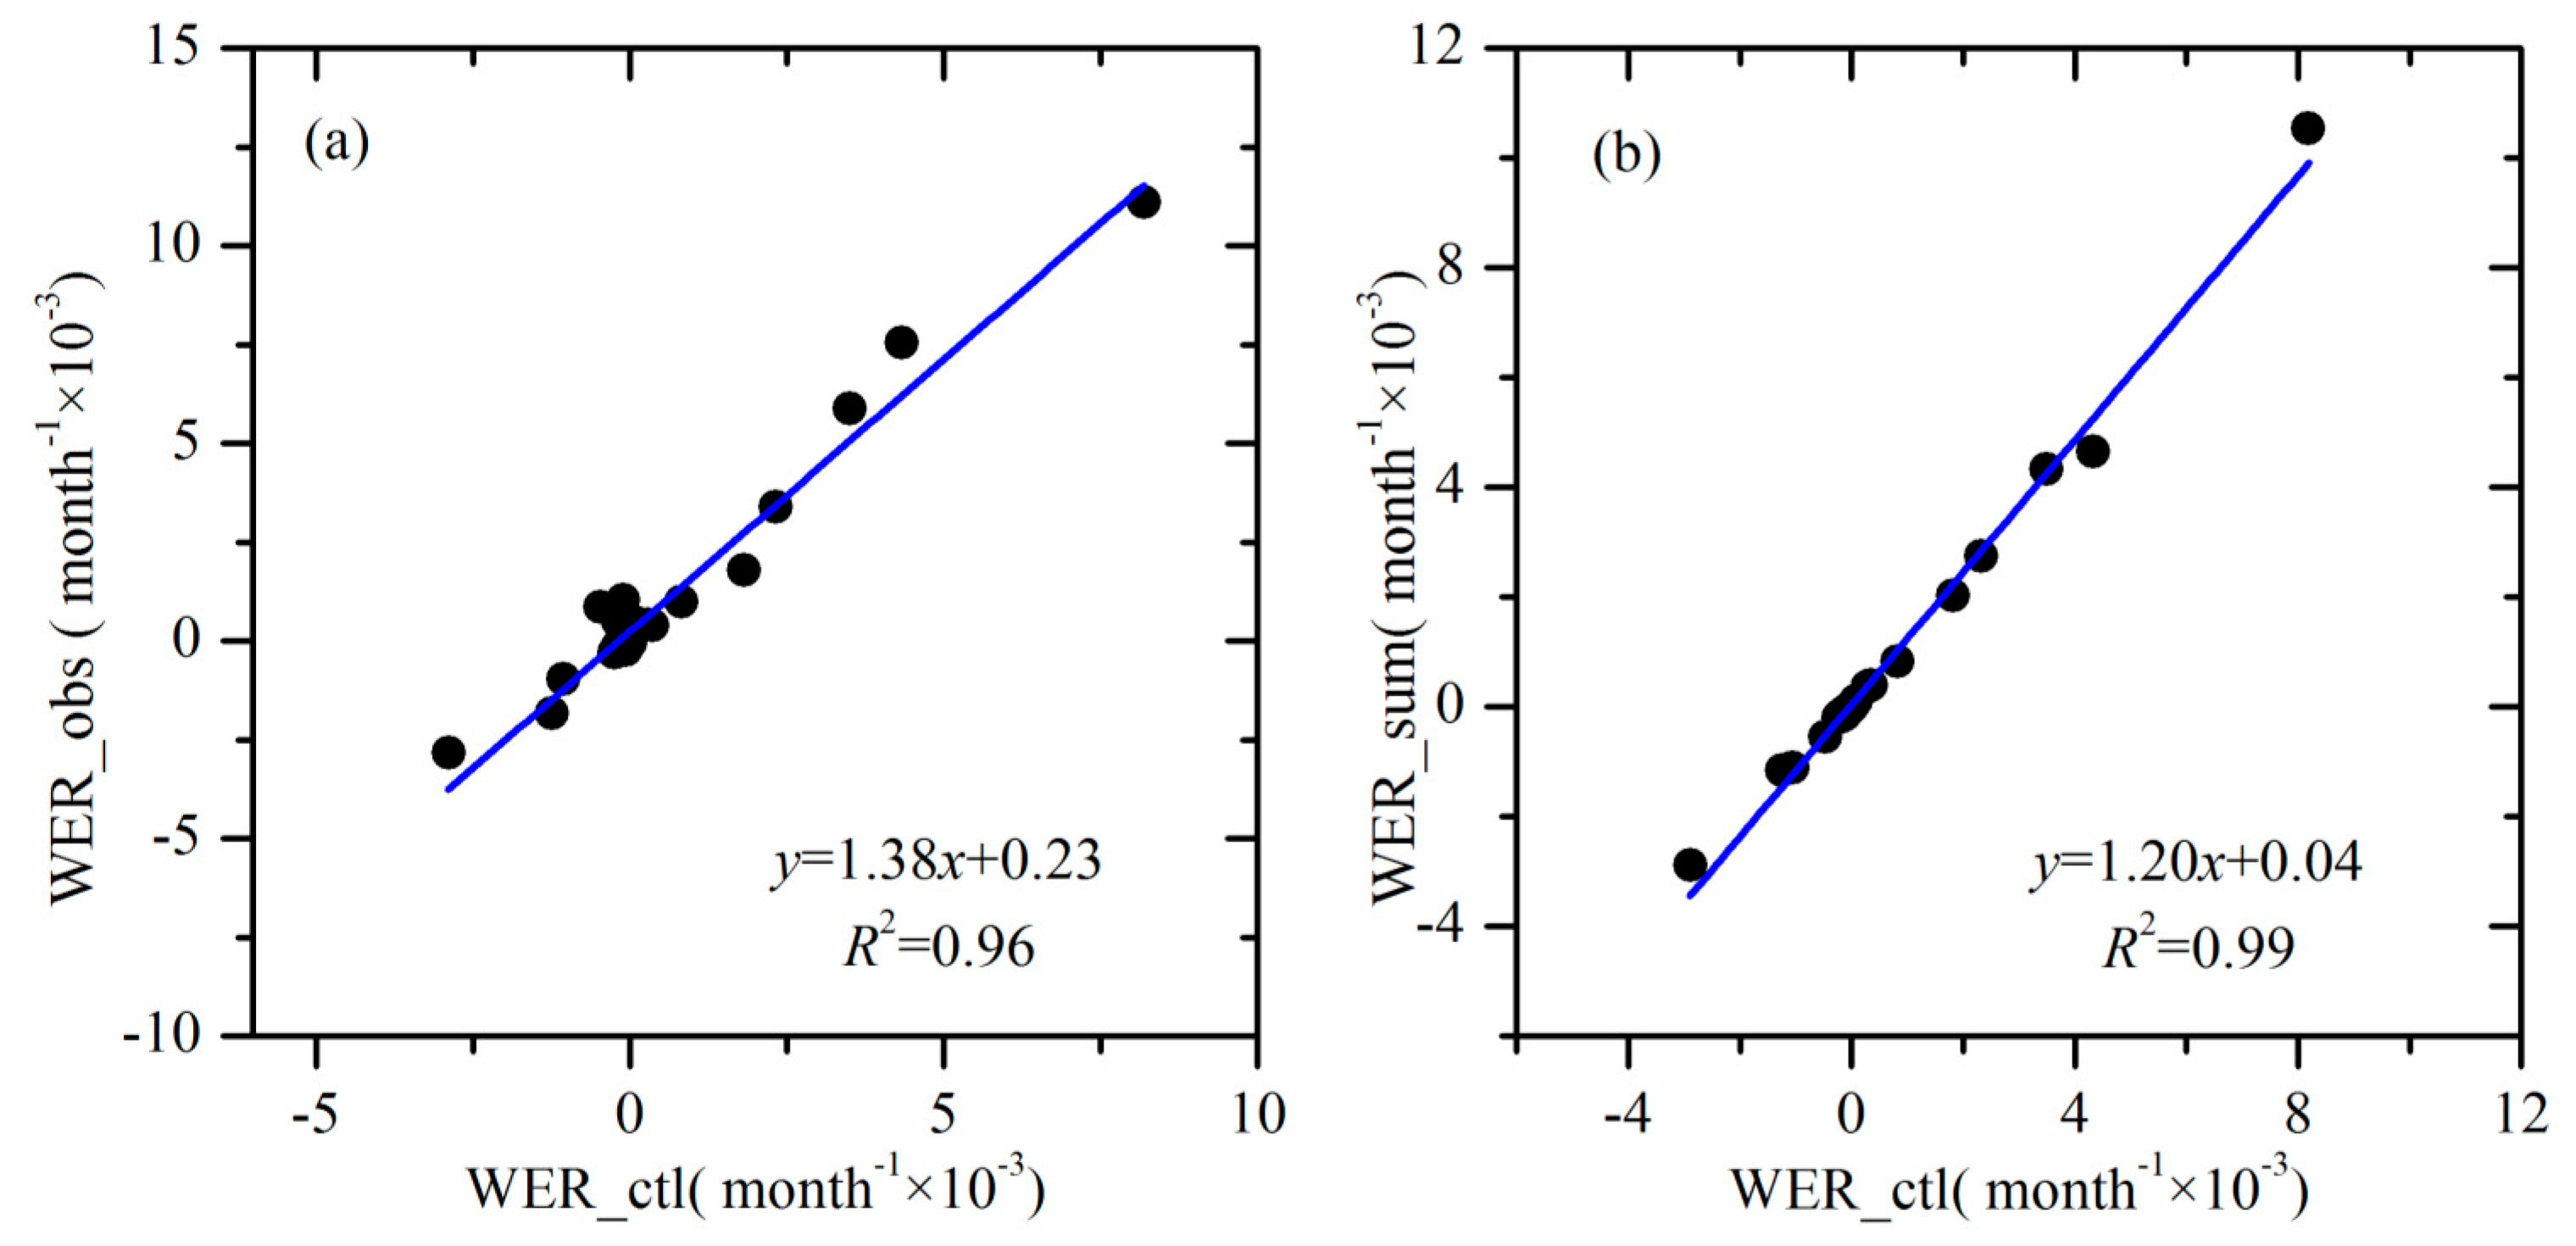
The contributions of precipitation, PET and NDVI changes to the WER variation were quantified via numerical experiments. As shown in Figure 6a, the calculated WER trends based on the control test fit well with the detected WER trends based on linear regression for the 34 catchments (R2 = 0.96). Figure 6b shows the relationship between WER changes based on the control test and the cumulative WER trends based on the three sensitivity tests. Please note that the two trends are very close to the 1:1 line (R2 = 0.99). This result confirms the effectiveness of the proposed approach based on the numerical experiments.
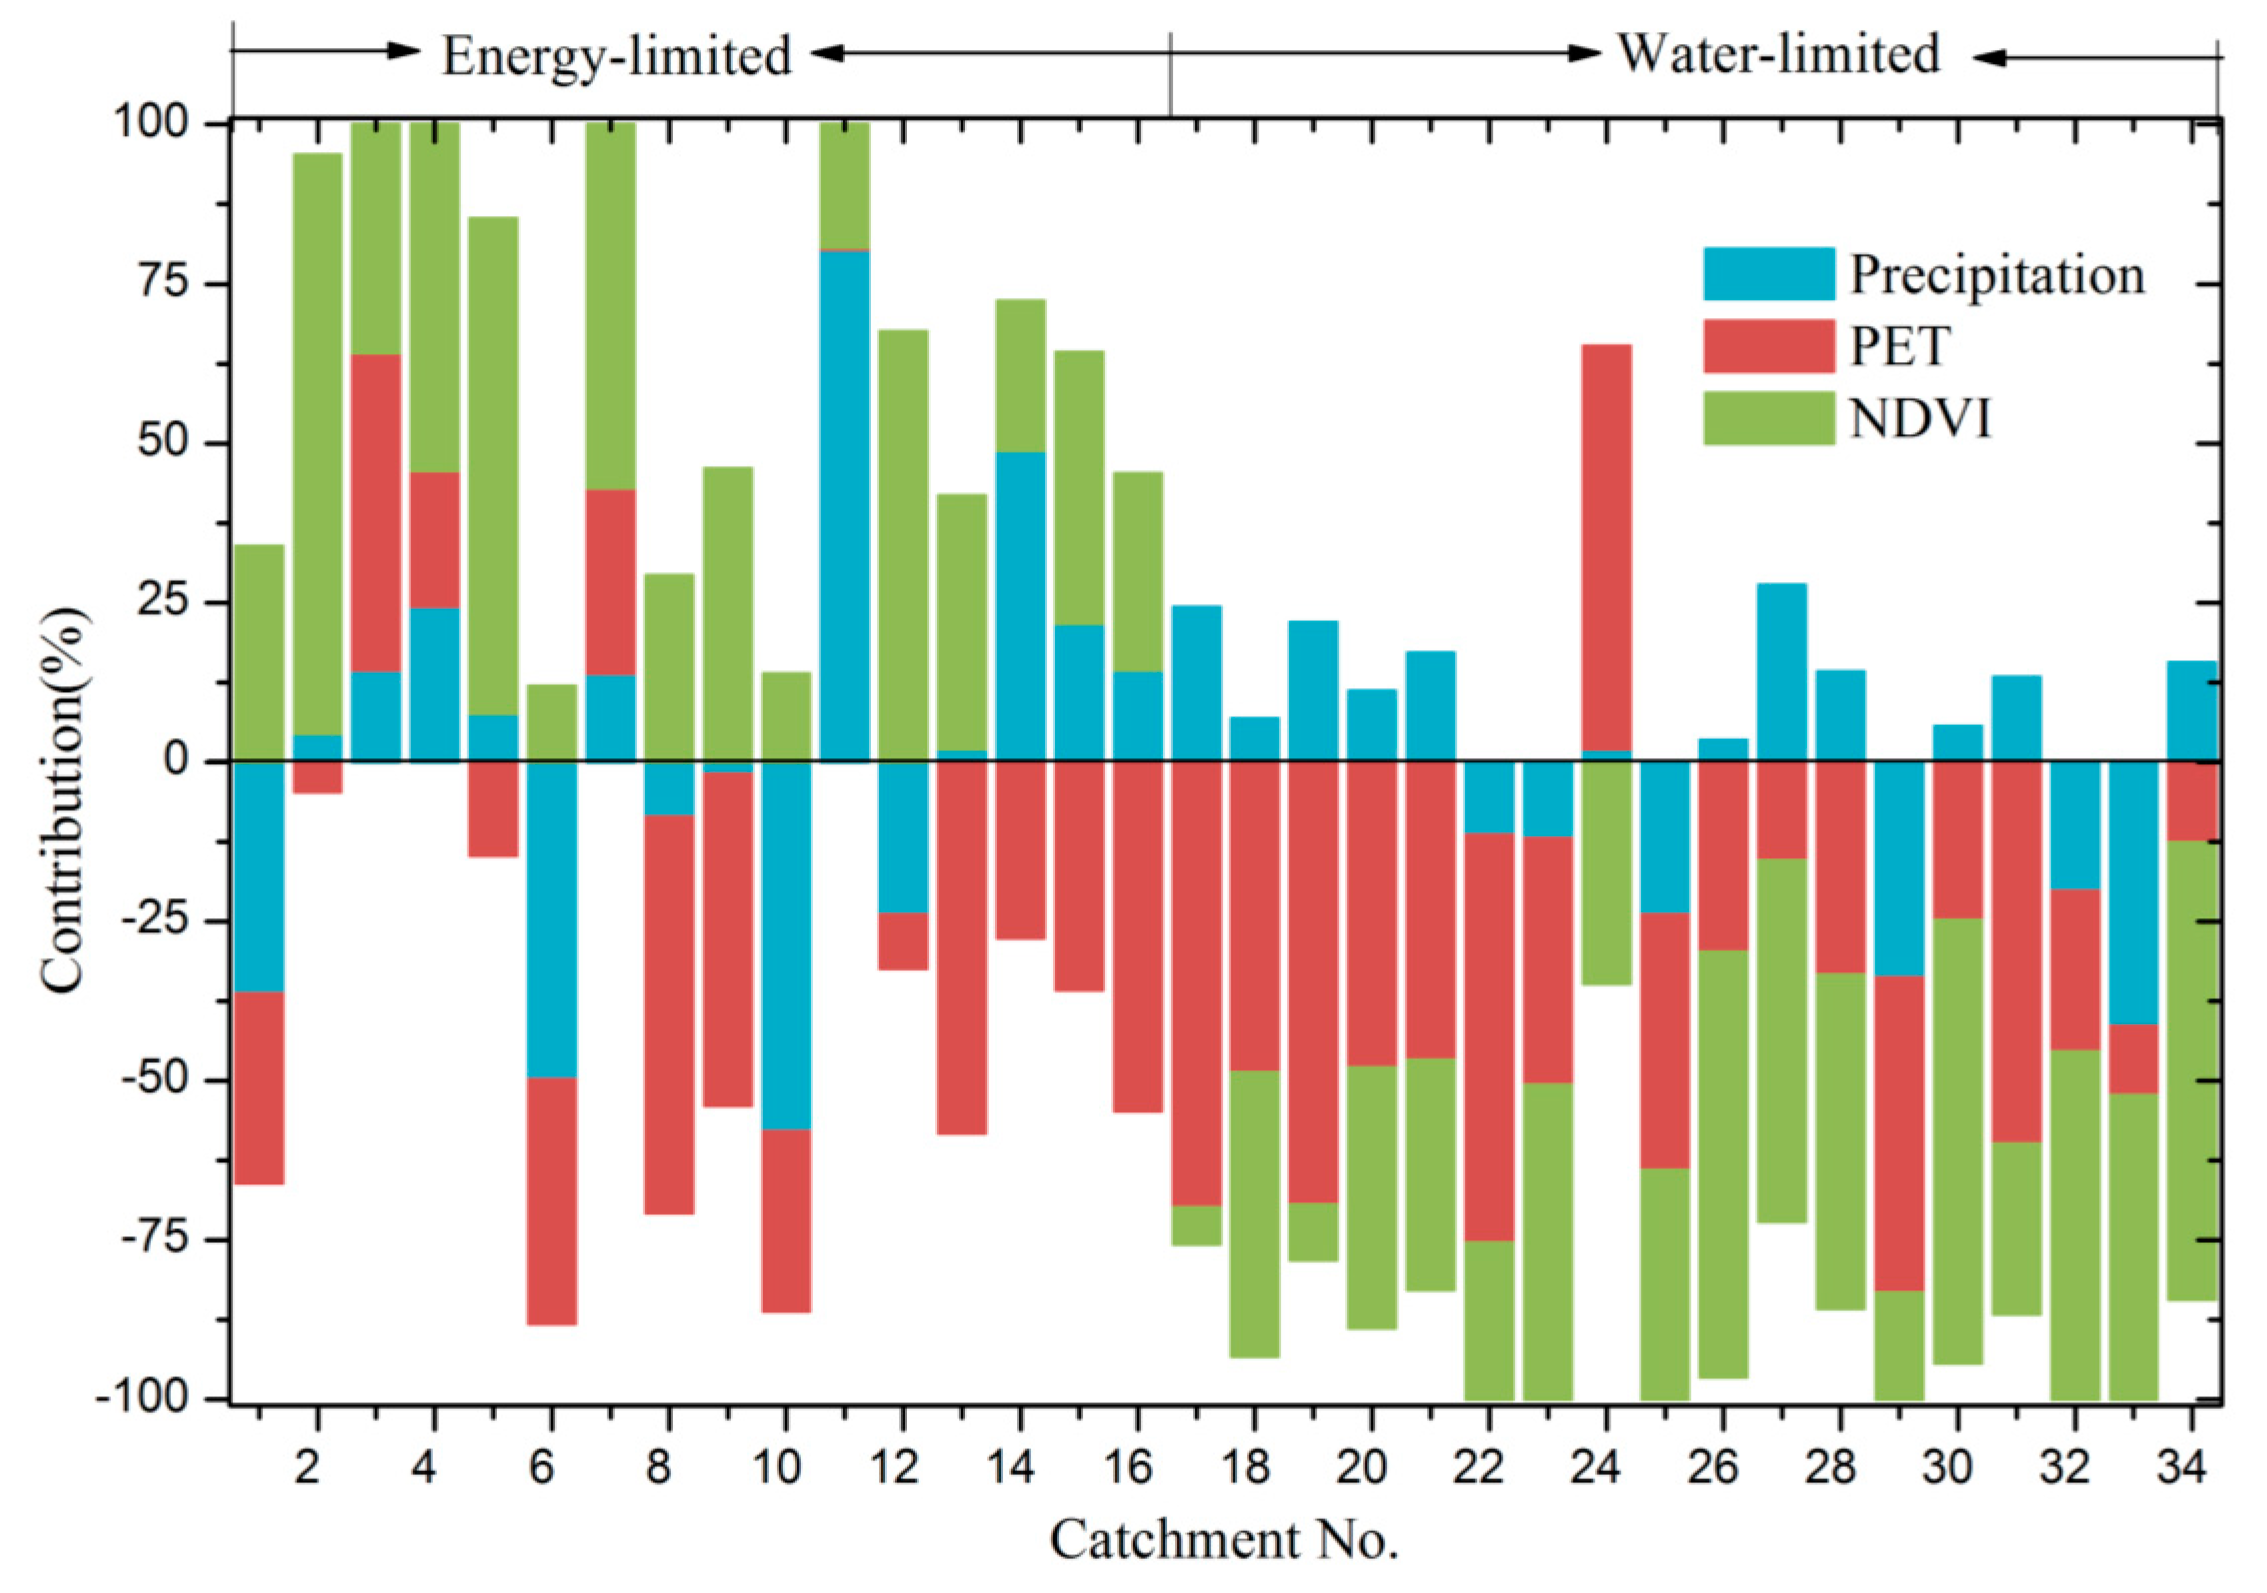
Under the energy-limited condition, the contributions of precipitation, PET and NDVI to WER changes are −57.9~80.4%, −62.1~49.7% and 11.8~90.8%, respectively (Figure 7). The WER changes are dominantly influenced by precipitation, PET and NDVI in five, five and six of the 34 catchments, respectively. Climate variation is the major factor controlling WER changes. Under the water-limited condition, the contributions of precipitation, PET and NDVI to WER changes are −41.4~27.8%, −69.9~63.2% and −71.7~−5.7%, respectively. Increased PET and NDVI are the dominant factors responsible for the WER decreases in ten and eight of the 34 catchments, respectively.
Notably, although NDVI increased in all the catchments, the relationship between NDVI and WER varied under different climatic conditions. Positive relationships between NDVI and w existed under both energy-limited and water-limited conditions. However, an increased NDVI resulted in a WER increase in energy-limited catchments, whereas the increase in NDVI resulted in a WER decrease in water-limited catchments. This pattern exists because, although increasing NDVI results in increasing evapotranspiration under both water-limited and energy-limited conditions, the sensitivity of WER to increasing evapotranspiration is different. WER is more sensitive to water availability changes under a water-limited condition but is more sensitive to energy availability changes under an energy-limited condition.
5. Discussion
5.1. Why Do the Influences of Vegetation Greening on WER Vary?
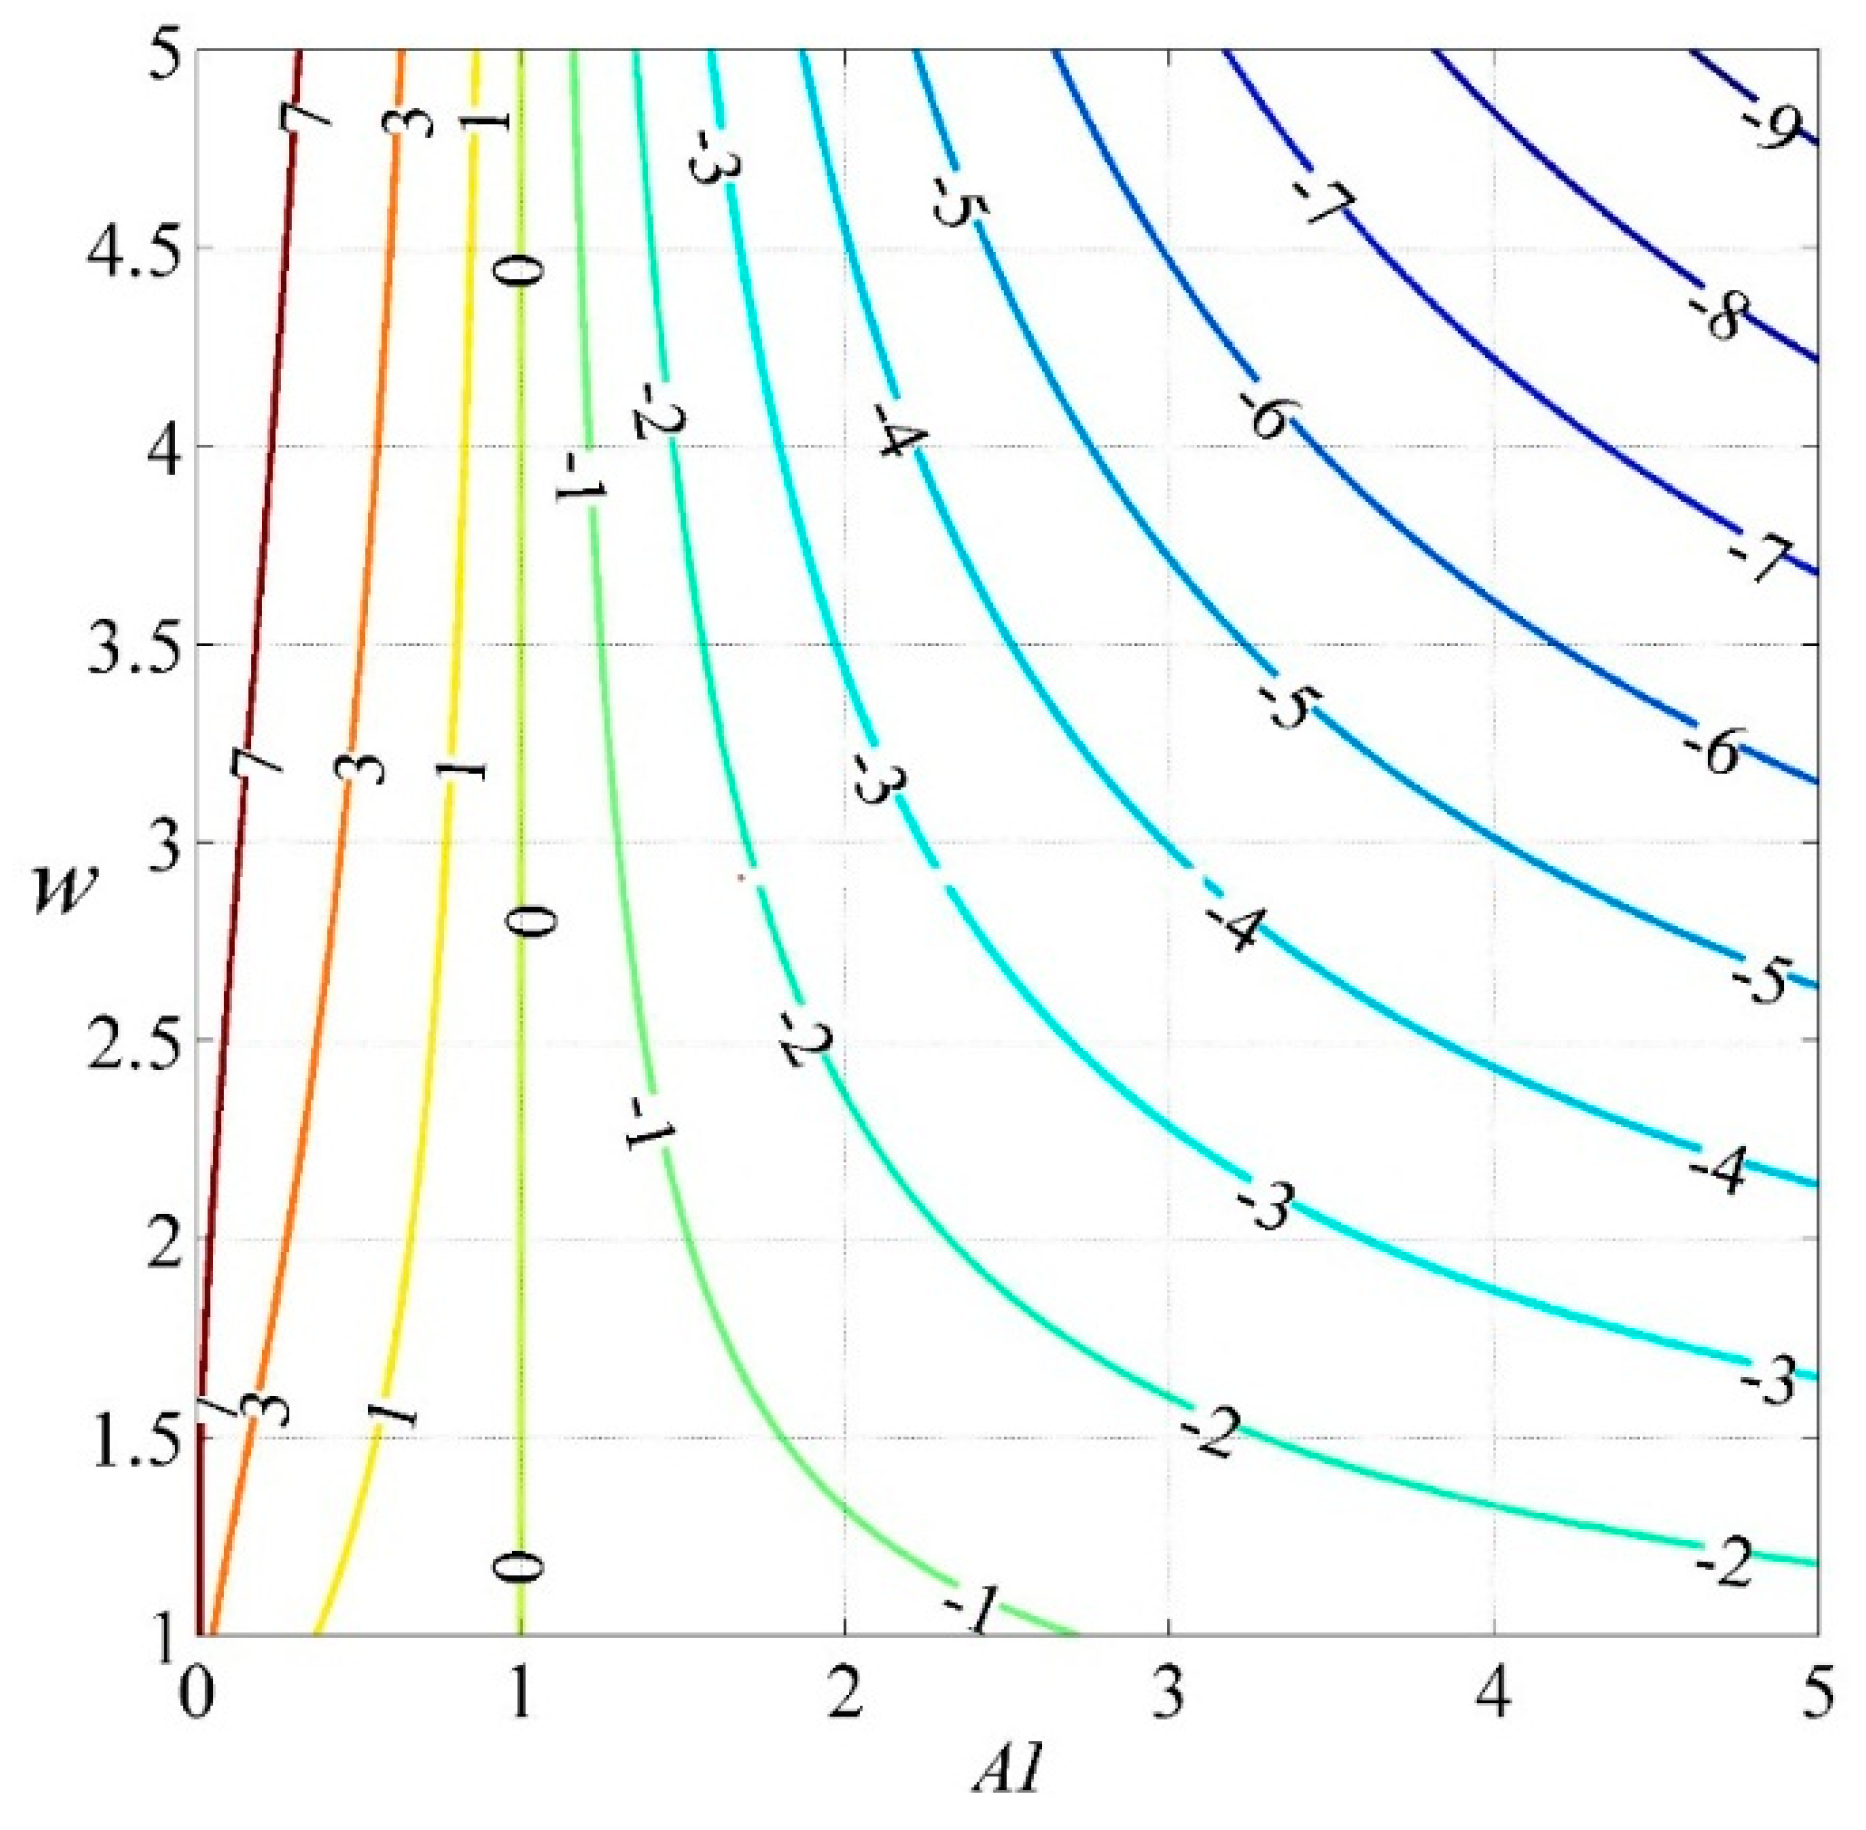
This study employed the new water-energy balance index WER to reflect regional dryness/wetness conditions, which is similar in form to AI. However, WER is more suitable to reflect the regional water-energy balance than AI. Under climatic conditions with the same AI value, regional water and energy availability vary because of different land-surface characteristics, such as vegetation, soil, and topography [44,45,46,47]. The isolines among WER, parameter w and AI are helpful for understanding WER changes and land-surface changes under different climatic conditions. Figure 8 shows the ln(WER) changes along with the land-surface parameter w variations under different climatic conditions. WER increases as w increases under the energy-limited condition, while WER decreases as w increases under the water-limited condition. When AI approaches 1, the isolines of WER become dense, which indicates that WER would be sensitive to AI changes. WER directly reflects the regional water and energy balance conditions by considering both the climate and land-surface features.
Because of ecological protection and restoration in recent decades, the coverage of vegetation is increasing [28,30]. The quantitative contribution of vegetation greening on water-energy balance under different climatic conditions has not been assessed; such assessment is necessary for evaluating the effectiveness of ecological management on water resources in China. Vegetation greening impacts the water and energy balance via the linkage of evapotranspiration. This study found that WER decreases in water-limited catchments with vegetation greening. Generally, vegetation greening enhances the capacity of soil water storage. Water stored in the soil is finally consumed through actual evaporation, given a sufficient energy supply [6]. The amount of water available changes more quickly than the amount of energy available in these catchments, which results in more energy for sensible heat, i.e., a warming effect. However, WER increases because of vegetation greening under an energy-limited condition. Evapotranspiration increases with vegetation greening, which is similar to what occurs under the water-limited condition. Nevertheless, the amount of energy available changes more quickly than the amount of water available, resulting in less energy for sensible heat, which known as a cooling effect. This reflects a synergistic reaction mechanism between water availability and energy availability. However, the dominant factor for the WER change is different under the two types of climatic conditions. The primary tree species involved in forest recovery are coniferous (Pinus massoniana) in the middle reaches of the Yangtze River Basin. Many studies have indicated that this low-quality and low-efficiency tree type, planted because of insufficient management, has a limited ability to control water loss and soil erosion [48]. Therefore, the impacts of vegetation greening on WER in the Yangtze River are not as obvious as those in the Yellow River.
However, vegetation cannot continue to green persistently under certain climatic conditions. For example, Feng et al. [29] indicated that vegetation recovery has already reached its maximum in the middle reaches of the Yellow River, which features an arid climate. In populous and developing regions, vegetation greening can enhance drought conditions and exacerbate the scarcity of water resources. Determining how to balance vegetation recovery and water resources requires further investigation.
5.2. Uncertainties
Uncertainties exist in this study. First, this study quantifies the impact of vegetation greening on a new water-energy balance index that considers both the climatic condition and the vegetation, which are assumed to be independent. However, these factors are not independent of each other. For example, regional greening of vegetation can affect regional precipitation and PET. Moreover, changes in regional precipitation and PET will influence the distribution of vegetation. Thus, complex interactions exist between the vegetation the and climatic condition [49,50]. Second, the land-surface parameter w in the control test is estimated via NDVI, which only reflects the impact of vegetation greening on WER. This process thus introduces a difference between WER estimated by the control test and WER based on observations (Figure 6a). This difference between the two trends is caused by the influence of the other factors on WER [41,51] Third, the total water storage change can be neglected for long-term timescales, such as 10 years or longer. To determine the optimal use of the available data for detecting the relationship between vegetation and the hydrological cycle, a 60-month (five-year) moving window is applied to the hydrometeorological data.
6. Conclusions
In this study, the changes evaluated by the new water-energy balance index (WER) were quantified in terms of vegetation greening and climate variation in 34 catchments under different climatic conditions. Negative relationships were detected between vegetation greening and WER in water-limited catchments, whereas positive relationships were detected between those factors in energy-limited catchments. The results of numerical experiments showed that climate variations (precipitation and PET) were the dominant factors controlling WER changes under the energy-limited condition, whereas increased PET and NDVI were the dominant factors responsible for WER decreases under the water-limited condition.
In general, vegetation greening had negative influences on WER under the water-limited condition, indicating that water availability decreases faster than residual energy, which would result in more energy for sensible heat. However, vegetation greening had positive influences on WER changes under the energy-limited condition, which indicated that the amount of residual energy decreases faster than the amount of water availability, which would result in less energy for sensible heat. This study provides a comprehensive understanding of the relationship between water-energy balance and vegetation greening under different climatic conditions and highlights the complex relationships among water, energy and vegetation, especially under an energy-limited condition. Our results are helpful for land-atmosphere-vegetation modeling, hydrological prediction under changing environments, and designing strategies to account for ecological environmental construction and local water resource management.
Author Contributions
D.Z. performed the design of experiments and the data processing as well as wrote the manuscript. X.m.L. provided constructive suggestions towards the whole structure and edited the manuscript. P.B. processed the NDVI dataset and provided useful comments on the results.
Funding
This research was funded by the Natural Science Foundation of China (41771039, 41330529 and 41571023) and Youth Innovation Promotion Association, CAS (2018067).
Acknowledgments
The authors appreciate the Hydrological Bureau of the Yellow River by providing the runoff data used in this study. The meteorological data is provided by the National Climate Center of the China Meteorological Administration. We also appreciate the Editor, Associate Editor, and the two anonymous reviewers for their efforts and constructive comments on the manuscript.
Conflicts of Interest
The authors declare no conflict of interest.
References
- Ivanov, V.Y.; Bras, R.L.; Vivoni, E.R. Vegetation-hydrology dynamics in complex terrain of semiarid areas: 2. Energy-water controls of vegetation spatiotemporal dynamics and topographic niches of favorability. Water Resour. Res. 2008, 44, 380–384. [Google Scholar] [CrossRef]
- Liu, X.; Liu, C.; Brutsaert, W. Investigation of a generalized nonlinear form of the complementary principle for evaporation estimation. J. Geophys. Res. Atmos. 2018, 123, 3933–3942. [Google Scholar] [CrossRef]
- Zhang, D.; Hong, H.; Zhang, Q.; Nie, R. Effects of climatic variation on pan-evaporation in the Poyang Lake Basin, China. Clim. Res. 2014, 61, 29–40. [Google Scholar] [CrossRef]
- Arneth, A. Climate science: Uncertain future for vegetation cover. Nature 2015, 524, 44–45. [Google Scholar] [CrossRef] [PubMed]
- Richardson, A.D.; Keenan, T.F.; Migliavacca, M.; Ryu, Y.; Sonnentag, O.; Toomey, M. Climate change, phenology, and phenological control of vegetation feedbacks to the climate system. Agric. For. Meteorol. 2013, 169, 156–173. [Google Scholar] [CrossRef]
- Zhang, M.; Liu, N.; Harper, R.; Li, Q.; Liu, K.; Wei, X.; Ning, D.; Hou, Y.; Liu, S. A global review on hydrological responses to forest change across multiple spatial scales: Importance of scale, climate, forest type and hydrological regime. J. Hydrol. 2016, 546, 44–59. [Google Scholar] [CrossRef]
- Hansen, M.; Potapov, P.; Margono, B.; Stehman, S.; Turubanova, S.; Tyukavina, A. High-resolution global maps of 21st-century forest cover change. Science 2013, 342, 850–853. [Google Scholar] [CrossRef] [PubMed]
- Zhu, Z.; Piao, S.; Myneni, R.B.; Huang, M.; Zeng, Z.; Canadell, J.G.; Ciais, P.; Sitch, S.; Friedlingstein, P.; Arneth, A. Greening of the Earth and its drivers. Nat. Clim. Chang. 2016, 6, 791–795. [Google Scholar] [CrossRef] [Green Version]
- Liu, Y.Y.; de Jeu, R.A.; McCabe, M.F.; Evans, J.P.; van Dijk, A.I. Global long-term passive microwave satellite-based retrievals of vegetation optical depth. Geophys. Res. Lett. 2011, 38. [Google Scholar] [CrossRef] [Green Version]
- Liu, Y.Y.; Dijk, A.I.; McCabe, M.F.; Evans, J.P.; Jeu, R.A. Global vegetation biomass change (1988–2008) and attribution to environmental and human drivers. Glob. Ecol. Biogeogr. 2013, 22, 692–705. [Google Scholar] [CrossRef]
- Piao, S.; Wang, X.; Ciais, P.; Zhu, B.; Wang, T.; Liu, J. Changes in satellite-derived vegetation growth trend in temperate and boreal Eurasia from 1982 to 2006. Glob. Chang. Biol. 2011, 17, 3228–3239. [Google Scholar] [CrossRef]
- McDowell, N.G.; Coops, N.C.; Beck, P.S.; Chambers, J.Q.; Gangodagamage, C.; Hicke, J.A.; Huang, C.Y.; Kennedy, R.; Krofcheck, D.J.; Litvak, M.; et al. Global satellite monitoring of climate-induced vegetation disturbances. Trends Plant Sci. 2015, 20, 114–123. [Google Scholar] [CrossRef] [PubMed]
- Piao, S.; Nan, H.; Huntingford, C.; Ciais, P.; Friedlingstein, P.; Sitch, S.; Peng, S.; Ahlström, A.; Canadell, J.G.; Cong, N. Evidence for a weakening relationship between interannual temperature variability and northern vegetation activity. Nat. Commun. 2014, 5. [Google Scholar] [CrossRef] [PubMed] [Green Version]
- Gerten, D.; Schaphoff, S.; Haberlandt, U.; Lucht, W.; Sitch, S. Terrestrial vegetation and water balance—Hydrological evaluation of a dynamic global vegetation model. J. Hydrol. 2004, 286, 249–270. [Google Scholar] [CrossRef]
- Sivapalan, M.; Yaeger, M.A.; Harman, C.J.; Xu, X.; Troch, P.A. Functional model of water balance variability at the catchment scale: 1. Evidence of hydrologic similarity and space-time symmetry. Water Resour. Res. 2011, 47, 2144–2150. [Google Scholar] [CrossRef]
- Budyko, M.I. Climate and Life; Academic Press: London, UK, 1974. [Google Scholar]
- Zhang, L.; Dawes, W.R.; Walker, G.R. Response of mean annual evapotranspiration to vegetation changes at catchment scale. Water Resour. Res. 2001, 37, 701–708. [Google Scholar] [CrossRef] [Green Version]
- Liu, M.; Xu, X.; Xu, C.; Sun, A.Y.; Wang, K.; Scanlon, B.R.; Zhang, L. A new drought index that considers the joint effects of climate and land surface change. Water Resour. Res. 2017, 53. [Google Scholar] [CrossRef]
- Azzali, S.; Menenti, M. Mapping vegetation-soil-climate complexes in southern Africa using temporal Fourier analysis of NOAA-AVHRR NDVI data. Int. J. Remote Sens. 2000, 21, 973–996. [Google Scholar] [CrossRef]
- Donohue, R.J.; Roderick, M.L.; Mcvicar, T.R. On the importance of including vegetation dynamics in Budyko’s hydrological model. Hydrol. Earth Syst. Sci. 2006, 3, 983–995. [Google Scholar] [CrossRef]
- Gentine, P.; D’Odorico, P.; Lintner, B.R.; Sivandran, G.; Salvucci, G. Interdependence of climate, soil, and vegetation as constrained by the Budyko curve. Geophys. Res. Lett. 2012, 39. [Google Scholar] [CrossRef] [Green Version]
- Donohue, R.J.; Roderick, M.L.; Mcvicar, T.R. Can dynamic vegetation information improve the accuracy of Budyko’s hydrological model? J. Hydrol. 2010, 390, 23–34. [Google Scholar] [CrossRef]
- Li, D.; Pan, M.; Cong, Z.; Zhang, L.; Wood, E. Vegetation control on water and energy balance within the Budyko framework. Water Resour. Res. 2013, 49, 969–976. [Google Scholar] [CrossRef] [Green Version]
- Yang, D.; Sun, F.; Liu, Z.; Cong, Z.; Ni, G.; Lei, Z. Analyzing spatial and temporal variability of annual water-energy balance in nonhumid regions of China using the Budyko hypothesis. Water Resour. Res. 2007, 43, 436–451. [Google Scholar] [CrossRef]
- Zhang, S.; Yang, H.; Yang, D.; Jayawardena, A.W. Quantifying the effect of vegetation change on the regional water balance within the Budyko framework. Geophys. Res. Lett. 2016, 43. [Google Scholar] [CrossRef]
- Jackson, R.B.; Jobbágy, E.G.; Avissar, R.; Roy, S.B.; Barrett, D.J.; Cook, C.W.; Farley, K.A.; Maitre, D.C.L.; Mccarl, B.A.; Murray, B.C. Trading Water for Carbon with Biological Carbon Sequestration. Science 2005, 310, 1944–1947. [Google Scholar] [CrossRef] [PubMed] [Green Version]
- Lü, Y.; Zhang, L.; Feng, X.; Zeng, Y.; Fu, B.; Yao, X.; Li, J.; Wu, B. Recent ecological transitions in China: Greening, browning, and influential factors. Sci. Rep. 2015, 5. [Google Scholar] [CrossRef] [PubMed]
- Wei, X.; Sun, G.; Liu, S.; Jiang, H.; Zhou, G.; Dai, L. The forest-streamflow relationship in China: A 40-year retrospect. J. Am. Water Resour. Assoc. 2008, 44, 1076–1085. [Google Scholar] [CrossRef]
- Feng, X.; Fu, B.; Piao, S.; Wang, S.; Ciais, P.; Zeng, Z.; Lü, Y.; Zeng, Y.; Li, Y.; Jiang, X. Revegetation in China[rsquor]s Loess Plateau is approaching sustainable water resource limits. Nat. Clim. Chang. 2016, 6, 1019–1022. [Google Scholar] [CrossRef]
- Piao, S.; Yin, G.; Tan, J.; Cheng, L.; Huang, M.; Li, Y.; Liu, R.; Mao, J.; Myneni, R.B.; Peng, S. Detection and attribution of vegetation greening trend in China over the last 30 years. Glob. Chang. Biol. 2015, 21, 1601–1609. [Google Scholar] [CrossRef] [PubMed] [Green Version]
- Huang, S.; Huang, Q.; Leng, G.; Zhao, M.; Meng, E. Variations in annual water-energy balance and their correlations with vegetation and soil moisture dynamics: A case study in the Wei River Basin, China. J. Hydrol. 2017, 546, 515–525. [Google Scholar] [CrossRef]
- Ning, T.; Li, Z.; Liu, W. Vegetation dynamics and climate seasonality jointly control the interannual catchment water balance in the Loess Plateau under the Budyko framework. Hydrol. Earth Syst. Sci. 2017, 21, 1–25. [Google Scholar] [CrossRef]
- Zhang, D.; Liu, X.; Zhang, Q.; Liang, K.; Liu, C. Investigation of factors affecting intra-annual variability of evapotranspiration and streamflow under different climate conditions. J. Hydrol. 2016, 543, 759–769. [Google Scholar] [CrossRef]
- Foley, J.A.; DeFries, R.; Asner, G.P.; Barford, C.; Bonan, G.; Carpenter, S.R.; Chapin, F.S.; Coe, M.T.; Daily, G.C.; Gibbs, H.K. Global consequences of land use. Science 2005, 309, 570–574. [Google Scholar] [CrossRef] [PubMed]
- Liu, J.; Liu, M.; Zhuang, D.; Zhang, Z.; Deng, X. Study on spatial pattern of land-use change in China during 1995–2000. Sci. China Ser. D Earth Sci. 2003, 46, 373–384. [Google Scholar]
- McVicar, T.R.; Roderick, M.L.; Donohue, R.J.; Li, L.T.; Van Niel, T.G.; Thomas, A.; Grieser, J.; Jhajharia, D.; Himri, Y.; Mahowald, N.M. Global review and synthesis of trends in observed terrestrial near-surface wind speeds: Implications for evaporation. J. Hydrol. 2012, 416, 182–205. [Google Scholar] [CrossRef]
- Penman, H.L. Natural Evaporation from Open Water, Bare Soil and Grass; The Royal Society: London, UK, 1948; pp. 120–145. [Google Scholar]
- Shuttleworth, W.J. Evaporation. In Handbook of Hydrology; Maidment, D.R., Ed.; McGRaw Hill: New York, NY, USA, 1993. [Google Scholar]
- Beck, H.E.; McVicar, T.R.; van Dijk, A.I.; Schellekens, J.; de Jeu, R.A.; Bruijnzeel, L.A. Global evaluation of four AVHRR–NDVI data sets: Intercomparison and assessment against Landsat imagery. Remote Sens. Environ. 2011, 115, 2547–2563. [Google Scholar] [CrossRef]
- Pinzon, J.E.; Tucker, C.J. A non-stationary 1981–2012 AVHRR NDVI3g time series. Remote Sens. 2014, 6, 6929–6960. [Google Scholar] [CrossRef]
- Carmona, A.; Poveda, G.; Sivapalan, M.; Vallejo-Bernal, S.; Bustamante, E. A scaling approach to Budyko’s framework and the complementary relationship of evapotranspiration in humid environments: Case study of the Amazon River basin. Hydrol. Earth Syst. Sci. 2016, 20, 589–603. [Google Scholar] [CrossRef]
- Arora, V.K. The use of the aridity index to assess climate change effect on annual runoff. J. Hydrol. 2002, 265, 164–177. [Google Scholar] [CrossRef]
- Liu, X.; Zhang, D. Trend analysis of reference evapotranspiration in Northwest China: The roles of changing wind speed and surface air temperature. Hydrol. Process. 2013, 27, 3941–3948. [Google Scholar] [CrossRef]
- Ukkola, A.; Keenan, T.; Kelley, D.I.; Prentice, I. Vegetation plays an important role in mediating future water resources. Environ. Res. Lett. 2016, 11. [Google Scholar] [CrossRef]
- Bai, P.; Liu, X.; Liu, C. Improving hydrological simulations by incorporating GRACE data for model calibration. J. Hydrol. 2018, 557, 291–304. [Google Scholar] [CrossRef]
- Miao, C.; Ashouri, H.; Hsu, K.L.; Sorooshian, S.; Duan, Q. Evaluation of the PERSIANN-CDR Daily Rainfall Estimates in Capturing the Behavior of Extreme Precipitation Events over China. J. Hydrometeorol. 2015, 16, 1387–1396. [Google Scholar] [CrossRef]
- Miao, C.; Kong, D.; Wu, J.; Duan, Q. Functional degradation of the water–sediment regulation scheme in the lower Yellow River: Spatial and temporal analyses. Sci. Total Environ. 2016, 551, 16–22. [Google Scholar] [CrossRef] [PubMed]
- Yan, F.; Wang, Q. Characterization and causes of low-quality and low-efficiency forest in Ganzhou of Jiangxi Province. Prot. For. Sci. Technol. 2016. [Google Scholar] [CrossRef]
- Behling, H. Late Quaternary vegetation, climate and fire history of the Araucaria forest and campos region from Serra Campos Gerais, ParanáState (South Brazil). Rev. Palaeobot. Palynol. 1997, 97, 109–121. [Google Scholar] [CrossRef]
- Lehmann, C.E.; Anderson, T.M.; Sankaran, M.; Higgins, S.I.; Archibald, S.; Hoffmann, W.A.; Hanan, N.P.; Williams, R.J.; Fensham, R.J.; Felfili, J. Savanna vegetation-fire-climate relationships differ among continents. Science 2014, 343, 548–552. [Google Scholar] [CrossRef] [PubMed]
- Hundecha, Y.; Bárdossy, A. Modeling of the effect of land use changes on the runoff generation of a river basin through parameter regionalization of a watershed model. J. Hydrol. 2004, 292, 281–295. [Google Scholar] [CrossRef]
Figure 1.
(a) Sketch map of the study area, (b) catchments under energy-limited condition, (c) catchments under water-limited condition, and (d) the long-term hydroclimatological characteristics of the 34 selected catchments based on the Budyko hypothesis. AI is the aridity index, P is precipitation, PET is potential evapotranspiration and ET is actual evaporation. Triangle in (b,c) represents the location of hydrological station.

Figure 2.
Relationships between NDVI and the land-surface parameter w in the 34 catchments. The red line is the fitting curve of scatters, and * indicates that the relationship is significant at the level of 0.01 by the t-test. NDVI: normalized difference vegetation index.
Figure 2.
Relationships between NDVI and the land-surface parameter w in the 34 catchments. The red line is the fitting curve of scatters, and * indicates that the relationship is significant at the level of 0.01 by the t-test. NDVI: normalized difference vegetation index.

Figure 3.
Changes in WER, climate variables and NDVI in the 34 selected catchments. Red indicates increase trends, and blue indicates decrease trends. Solid indicates that the trend is significant (p < 0.01), and hollow indicates that the trend is insignificant (p > 0.01). The left column, from (a–i), represents the energy-limited condition, and the right column, from (b–j), represents the water-limited condition. WER: available-water-to-available-energy ratio.

Figure 4.
Spatial distribution of the sensitivity of WER to precipitation, PET and NDVI. The left column, from (a–e), represents the energy-limited condition, and the right column, from (b–f), represents the water-limited condition.
Figure 4.
Spatial distribution of the sensitivity of WER to precipitation, PET and NDVI. The left column, from (a–e), represents the energy-limited condition, and the right column, from (b–f), represents the water-limited condition.

Figure 5.
Correlations between the sensitivity of WER to precipitation, PET, NDVI and AI. * indicates that the relationship is significant at the level of 0.01 by the t-test.
Figure 5.
Correlations between the sensitivity of WER to precipitation, PET, NDVI and AI. * indicates that the relationship is significant at the level of 0.01 by the t-test.

Figure 6.
Comparisons between (a) trends in WER based on the control test and observations, and (b) trends in WER based on the control test and the cumulative contributions of the three sensitivity tests.
Figure 6.
Comparisons between (a) trends in WER based on the control test and observations, and (b) trends in WER based on the control test and the cumulative contributions of the three sensitivity tests.

Figure 7.
Contributions (%) of precipitation, PET and NDVI variations to WER changes in the 34 selected catchments.
Figure 7.
Contributions (%) of precipitation, PET and NDVI variations to WER changes in the 34 selected catchments.

Figure 8.
Isoline among WER, parameter w and AI under different climatic conditions.


Table 1.
Information of the studied catchments under different climatic conditions.
| Catchments Characteristics | Energy-Limited | Water-Limited |
|---|---|---|
| number | 16 | 18 |
| catchment area (km2) | 656–15,307 | 1121–30,661 |
| air temperature (°C) | 14.8–19.7 | 0.9–11.3 |
| annual rainfall (mm) | 1279–1852 | 388–683 |
| aridity index | 0.5–0.8 | 1.7–3.2 |
Table 2.
Numerical experiment design for WER contributions.
| Experiment | Description |
|---|---|
| Control test:WER_ctr | Precipitation, PET and NDVI from 1982–2013 |
| Sensitivity test:WER_Prcp | Precipitation maintained at the initial year, the others same as the control test |
| Sensitivity test:WER_PET | PET maintained at the initial year, the others same as the control test |
| Sensitivity test:WER_NDVI | NDVI maintained at the initial year, the others same as the control test |
NDVI: normalized difference vegetation index; PET: potential evapotranspiration.
Table 3.
Relationship between NDVI and the land surface parameter w.
| Catchment No. | AI | R2 | a | b | Catchment No. | AI | R2 | a | b |
|---|---|---|---|---|---|---|---|---|---|
| 1 | 0.52 | 0.21 * | 4.5 | −1.3 | 18 | 1.94 | 0.19 * | 4.39 | 0.61 |
| 2 | 0.54 | 0.40 * | 16.71 | −9.22 | 19 | 1.95 | 0.30 * | 9.38 | −1.79 |
| 3 | 0.55 | 0.35 * | 9.44 | −4.59 | 20 | 2.01 | 0.68 * | 14.9 | −2.98 |
| 4 | 0.56 | 0.28 * | 10.09 | −5.26 | 21 | 2.14 | 0.51 * | 4.91 | −0.31 |
| 5 | 0.57 | 0.44 * | 3.6 | −0.85 | 22 | 2.17 | 0.30 * | 6.41 | 0.99 |
| 6 | 0.61 | 0.29 * | 4.39 | −1.32 | 23 | 2.18 | 0.53 * | 21.44 | −4.54 |
| 7 | 0.61 | 0.37 * | 9.47 | −4.7 | 24 | 2.2 | 0.39 * | 8.29 | −0.88 |
| 8 | 0.61 | 0.32 * | 4.66 | −1.28 | 25 | 2.23 | 0.59 * | 11.7 | −0.36 |
| 9 | 0.62 | 0.35 * | 6.99 | −2.42 | 26 | 2.39 | 0.58 * | 11.02 | −0.06 |
| 10 | 0.64 | 0.29 * | 1.79 | 0.16 | 27 | 2.4 | 0.39 * | 9.91 | 0.35 |
| 11 | 0.64 | 0.36 * | 1.96 | 0.08 | 28 | 2.43 | 0.38 * | 6.86 | 0.08 |
| 12 | 0.66 | 0.37 * | 3.63 | −0.68 | 29 | 2.44 | 0.12 * | 5.76 | 1.58 |
| 13 | 0.67 | 0.17 * | 4.36 | −1.09 | 30 | 2.86 | 0.14 * | 36.12 | −4.18 |
| 14 | 0.68 | 0.31 * | 1.97 | 0.11 | 31 | 2.98 | 0.12 * | 8.81 | 0.72 |
| 15 | 0.69 | 0.41 * | 6.54 | −2.89 | 32 | 3.07 | 0.53 * | 7.66 | 0.39 |
| 16 | 0.73 | 0.14 * | 11.28 | −4.95 | 33 | 3.13 | 0.11 * | 15.72 | −0.85 |
| 17 | 1.76 | 0.26 * | 13.49 | −4.55 | 34 | 3.23 | 0.47 * | 7.92 | 0.79 |
Note: * indicates the relationship is significant at the level of 0.01 by thet-test.AI: aridity index.
Table 4.
Numbers of catchments in four categories of trends for WER, climate variables and NDVI.
| Group | Trend | WER | Precipitation | PET | Runoff | NDVI |
|---|---|---|---|---|---|---|
| Energy-limited | Increase (p < 0.01) | 12 | 3 | 11 | 1 | 16 |
| Increase | 1 | 6 | 2 | 0 | 0 | |
| Decrease | 0 | 4 | 0 | 2 | 0 | |
| Decrease (p < 0.01) | 3 | 3 | 3 | 13 | 0 | |
| Water-limited | Increase (p < 0.01) | 0 | 5 | 17 | 0 | 18 |
| Increase | 0 | 6 | 0 | 0 | 0 | |
| Decrease | 0 | 1 | 0 | 0 | 0 | |
| Decrease (p < 0.01) | 18 | 6 | 1 | 18 | 0 |
© 2018 by the authors. Licensee MDPI, Basel, Switzerland. This article is an open access article distributed under the terms and conditions of the Creative Commons Attribution (CC BY) license (http://creativecommons.org/licenses/by/4.0/).
Share and Cite
MDPI and ACS Style
Zhang, D.; Liu, X.; Bai, P. Different Influences of Vegetation Greening on Regional Water-Energy Balance under Different Climatic Conditions. Forests 2018, 9, 412. https://doi.org/10.3390/f9070412
AMA Style
Zhang D, Liu X, Bai P. Different Influences of Vegetation Greening on Regional Water-Energy Balance under Different Climatic Conditions. Forests. 2018; 9(7):412. https://doi.org/10.3390/f9070412
Chicago/Turabian StyleZhang, Dan, Xiaomang Liu, and Peng Bai. 2018. "Different Influences of Vegetation Greening on Regional Water-Energy Balance under Different Climatic Conditions" Forests 9, no. 7: 412. https://doi.org/10.3390/f9070412
Note that from the first issue of 2016, this journal uses article numbers instead of page numbers. See further details here.