Synergies and Trade-Offs in the Production of NWFPs Predicted in Boreal Forests


1
Natural Resources Institute Finland (Luke), Yliopistokatu 6, FI-80100 Joensuu, Finland
2
Faculty of Science and Forestry, School of Forest Sciences, University of Eastern Finland, P.O. Box 111, FI-80101 Joensuu, Finland
*
Author to whom correspondence should be addressed.
Forests 2018, 9(7), 417; https://doi.org/10.3390/f9070417
Submission received: 4 June 2018
/
Revised: 6 July 2018
/
Accepted: 9 July 2018
/
Published: 11 July 2018
(This article belongs to the Special Issue Decision Support to Address Multiple Ecosystem Services in Forest Management Planning)
Abstract
:The global growth of the consumption of non-wood forest products (NWFPs) is evident due to the current trends in lifestyle and consumption. Alongside the increased popularity and commercial use of NWFPs, their yields are also more often taken into account in forest management planning. Empirical yield models recently developed for different NWFPs enable forest managers to include their predicted yields in multi-objective optimization. However, knowledge on the synergies and trade-offs between timber production and different NWFPs is scanty. In this study, we analyzed these relationships through correlation matrices and production possibility frontiers in two case study forest holdings from Finland. A large number of Pareto optimal forest holding level plans were produced by multi-objective optimization and used to analyze trade-offs and synergies. Empirical yield models for 12 NWFPs, representing different berries, mushrooms, and tree-based products, were utilized in the analyses. The results revealed synergies and possibilities for joint-production for NWFPs, but also trade-offs between NWFPs and timber production. NWFPs often had a negative correlation with cutting removals, with the only exception being cowberry. Despite the overall negative correlation, the maximum yields of NWFPs called for some cuttings. Negative correlations with the net present value of timber production were weaker. The results are valuable when the aim is to diversify the use of boreal forests and open avenues for truly multi-objective decision support services to facilitate the decision making of forest owners.
1. Introduction
Boreal forest ecosystems provide a broad range of different tangible and intangible goods and services with different uses and economic values. Forests are often managed for the efficient production of a limited number of products. The obvious justification for managing forests for timber production is that functional markets exist for timber, and forest owners get monetary benefits from timber sales. The lack of markets for the other products and difficulties in measuring the benefits obtained from them has led to a situation in which many forest goods are regarded as side-products when decisions on forest management are made, which is directly indicated by the fact that the value of hand-picked nature products is only about 1% of the value of the wood from forests [1]. A typical example of these kinds of products is various non-wood forest products (NWFPs) or non-timber forest products (NTFPs), such as berries and mushrooms, that in boreal conditions, are freely collected because of broad everyman’s rights.
Sustainable multi-product forest management is a diverse and complex matter. In the global context, Shackleton et al. [2] have reviewed the history and potential involvement in managing both timber and non-timber products from forests, especially in tropical areas. In Europe, consumers’ interests towards the utilization of NWFPs have increased [3], which has led to attempts to start managing forests for the production of NWFPs. As a result, there have been efforts to develop yield models for different NWFPs and link them in forest simulators (see, e.g., Kurttila and Tahvanainen [4] for a European review). Earlier studies indicate that valuing NWFPs can increase the profitability of stand management and modify the timber-oriented forest management for promoting NWFPs [5,6,7,8,9,10]. For example, according to Palahí et al. [5], the additional incomes from mushroom picking made the management of Pinus sylvestris L. and P. nigra Arn. stands in Catalonia profitable due to a positive effect of thinnings on mushroom production. In Pinus brutia Ten. stands in the eastern Mediterranean area, the joint-production of pine honey and timber led to longer rotation periods [6]. In Mediterranean Pinus pinea L. stands, optimizing the production of timber and edible pine seeds simultaneously resulted in delayed thinnings [8]. Tahvanainen et al. [10] observed that the production of timber and marketed mushrooms in Picea abies (L.) Karst. stands in eastern Finland was mostly in synergy, with mushroom harvesting creating significant additional incomes from forests.
The majority of the above-mentioned studies have been implemented at the individual stand level, and only a single NWFP was included in these calculations. An example of multi-product forest management has been given by Miina et al. [7], who optimized the stand management for the joint production of timber, bilberry (Vaccinium myrtillus L.), and cowberry (V. vitis-idaea L.).
Stand level calculations are beneficial for finding out how the stands could be efficiently managed for the joint production of NWFPs and timber. However, holding level examinations are also needed to reveal stands where the production should be directed towards NWFPs when the goals of the forest landowner are maximized under the production possibilities of the whole forest holding. In holding level planning, the examination starts from the current forest structure of the holding, and thus more closely resembles those decision-making situations that the forest owners are facing. In addition, a major difference between holding- and stand-level examinations is that the forest plan is typically prepared for a fixed period of one or a few decades, whereas the stand-level calculations commonly cover the whole rotation period.
Gamfeldt et al. [11] found that, in boreal and temperate forests, there was a trade-off between tree biomass production and bilberry production. A negative relationship between tree biomass production and the production of bilberry was calculated to be due to excessive shading in closed productive forests. Gamfeldt et al. [11] concluded that, due to the trade-offs, it would be difficult to maximize all ecosystem services simultaneously at the stand scale. Their analyses were based on the Swedish national forest inventory data, and thus they did not consider the future production possibilities of the forests in Sweden. Pohjanmies et al. [12] also found that strong conflicts exist between timber production and non-timber benefits. Conflicts among timber and NWFPs production could be mitigated, for example, by modifying forest management in stands that are the most suitable for NWFPs and applying timber-production-oriented management in stands that do not produce NWFPs.
In addition, Pukkala [13] used data envelopment to analyze the efficiency of the simultaneous production of several ecosystem services in even-aged and continuous cover forestry at the holding level. The NWFPs included in this study were bilberry and cowberry yields. It was found that increasing the discount rate, leading to increased cuttings and lower growing stock volumes, decreased the production of other ecosystem services in both silvicultural systems, but the effect was stronger in even-aged forestry. This difference was mainly explained by the use of clear-fellings in even-aged forestry, which had a long-lasting negative impact on several ecosystem services.
In a production system like forest holding, the marginal rate of transformation is typically not constant throughout the range of the holding’s production possibilities. Starting from a low initial level, a small increase in the production of certain NWFP may have no effect on the production of other goods. When more is demanded from the production system, trade-offs between different products start to emerge. For these purposes, the efficient joint-production possibilities of given outputs can be illustrated and analyzed by using production possibility curves or frontiers [14,15]. These frontiers indicate the technically efficient combinations of the selected outputs with given inputs; any point inside the curve implies that the resources available are not fully used or are being utilized inefficiently [15]. A concave shape of the production possibility frontier indicates a competing relationship, and the curvature of the curve indicates the degree of competitiveness between the outputs, i.e., the marginal rate of transformation [15].
Some forest planning-related studies have used approaches based on production possibility frontiers. For example, Toth and McDill [16] extended four multiobjective programming methods to generate spatially explicit forest plan alternatives and illustrated the results using Pareto frontiers. In addition, Kärkkäinen et al. [17] applied a production possibility frontier-based approach when they evaluated the effects of energy wood production on timber production potential and forest biodiversity. Borges et al. [18] presented a decision support system that included interactive visualization of the Pareto frontier and evaluated the trade-offs at a regional level between cork and wood products. They also studied the tradeoffs of different ecosystem services at a landscape level with multiple ownership [19].
Surprisingly little is known about the synergies and trade-offs between different forest products. If the joint-production of various NWFPs is considered, it is important to know if it is possible to achieve synergies where an increasing production of a certain NWFP also results in an increasing production of some other NWFPs. Alternatively, it is also important to know the degree of trade-offs between NWFPs, i.e., how much an increase in the production of certain NWFPs decreases the production of other forest products. The relationships between timber production and NWFPs are critically important for most forest landowners and many of them are interested in knowing whether it would be possible to achieve higher incomes from NWFPs than from timber.
The objective of this study was to examine the relationships among various NWFPs and timber production at the forest holding scale. The relationships were studied with correlation analyses that were based on a large number of efficient forest plans created for two forest holdings. In addition, the relationships were studied with production possibility frontiers. The positive or negative correlations between different products reveal, respectively, the synergistic or competitive relation between NWFPs and timber, whereas the production possibility frontiers give information on how the relationship develops when the production of a given NWFP is increased within the planning area studied. In this study, empirical yield models were used to predict the production of the selected NWFPs and timber within two forest holdings having different growing stocks and growing site conditions, but typical to Finnish forests.
2. Materials and Methods
2.1. Description of Yield Models for Selected NWFPs and Timber
2.1.1. Bilberry Shoots
The fresh weight of bilberry shoots was predicted as a function of site and stand characteristics by using a bilberry coverage model. The following model (without stand age as a predictor) was fitted based on the same data that were used by Turtiainen et al. [20]:
where Coverage is the mean coverage of bilberry in the stand (%); G is the stand basal area (m2 ha−1); Pine and Birch are indicator variables for Scots pine (Pinus sylvestris L.) and deciduous trees as the dominant tree species, respectively (otherwise the dominant species is Norway spruce, Picea abies (L.) Karst.); and Alt is the altitude (m). The effect of the fertility of the mineral soil site is described by indicator variables as follows [21]: OMaT = Oxalis-Maianthemum type, OMT = Oxalis-Myrtillus type, VT = Vaccinium type, CT = Calluna type, and PoorlyProdLand = poorly productive land and unproductive land (according to [22]) (otherwise the site is MT = Myrtillus type). The peatland sites for spruce (SpruceMire) and pine (PineMire) mire are defined as follows [23]: I = eutrophic, II = herb-rich (mesotrophic), III = Vaccinium myrtillus and tall-sedge (meso-oligotrophic), IV = Vaccinium vitis-idaea and small-sedge (oligotrophic), and V = cotton grass and dwarf-shrub (poor ombro-oligotrophic bogs). ArtRegen and FormerAgrLand are indicator variables for artificial regeneration methods (otherwise natural regeneration is used) and former agricultural land (otherwise the site is former forest), respectively.
In a mixed stand, the coverage of bilberry was predicted first for each tree species using the total stand basal area as a predictor in the models, and then the coverage of bilberry was calculated as the weighted average of the species-specific predictions. The proportions of tree species of stand basal area were used as weights.
The fresh weight of bilberry shoots per hectare was calculated by assuming that shoot harvesting removes on average 36 g dry weight per m2 covered by bilberry [24] and shoot dry matter content is one third of fresh weight.
2.1.2. Bilberries and Cowberries
Several models for bilberry and cowberry yields have already been published in Finland (see [21]). Since the predictions of different models do not always correlate strongly [25] and it is difficult to say which model is the most reliable, new meta models were fitted in the current study for bilberry and cowberry yields. Five previous models for bilberry [26,27,28,29,30] and five models for cowberry [26,27,28,29,31] were used to calculate predictions for 12,441 stands growing on mineral soils sites. The stands belonged to four large forest holdings, located in different parts of Finland. The temperature sum of the four holdings ranged from 800 d.d. (d.d. stands for “degree days”, which is the accumulated sum of mean daily temperature minus 5 °C on those days when the mean temperature is over 5 °C) to 1300 d.d. Since each stand had five different predictions for both berry species, the number of observations for fitting the meta models was 62,205 (5 × 12,441) for both wild berry species.
Since the unit of the “yield” was different in different models (score, priority, or yield in kg ha−1), the berry yield predictions of each model were standardized by subtracting the mean from the prediction and dividing the difference by the standard deviation of the predictions. After this step, the mean prediction was equal to zero with standard deviation equal to one for all models. Then, the standardized predictions were de-standardized based on the average prediction and standard deviation of the models of Miina et al. [30] and Turtiainen et al. [25]. After this step, all yields were expressed in kg ha−1.
Variables used as potential predictors were site and growing stock variables that are normally measured or assessed in forest inventories: forest site type, temperature sum, mean tree height, mean diameter, stand age, stand basal area, and proportions of different tree species of stand basal area.
The following berry yield models were fitted using the predictions of earlier berry yield models as observations:
where Bilberry and Cowberry are, respectively, the yield of bilberry and cowberry in the stand (kg ha−1 year−1); D is the mean breast height diameter (cm); and PBirch, PSpruce, and PPine are the proportions of broadleaves, spruce, and pine of stand basal area, respectively.
The meta models predict that both bilberry and cowberry yields are the highest on sub-xeric sites (VT) and in pine-dominated stands. A low stand density is associated with high cowberry yields, but low bilberry yields.
2.1.3. Mushrooms
The yields of commercial mushrooms (Mushrooms), Boletus edulis Bull. and Lactarius spp., were predicted as a function of stand volume increment as it has been found that the yields of mycorrhizal fungi correlate positively with the growth rate of trees [32]. The following models were fitted using the fresh weight (kg ha−1) of mushrooms as a dependent variable and the volume increment predicted for the growing stocks of the sample plots in the data set of Tahvanainen et al. [33] as an independent variable:
where gro = five-year stand volume increment (m3 ha−1) predicted by Monsu forest planning software [34].
2.1.4. Spruce Shoots
Spruce shoots were collected from young spruces with a height of 3–6 m. The fresh weight of spruce shoots (g tree−1) was calculated using the model of Miina et al. [35]:
where dbh = tree diameter at breast height (cm).
2.1.5. Birch Leaves
Birch leaves were collected from silver birches (Betula pendula Roth) with a height of 0.5–6 m. The dry weight of birch leaves (g tree−1) was calculated using the following biomass model of Repola [36]:
where ds = tree diameter at stump height (cm); ds = 2.0 + 1.25dbh. The fresh weight of birch leaves was calculated by multiplying the model prediction by five since the dry matter content of the leaves was assumed to be approximately 20%.
2.1.6. Pine Bark
Thin pine bark was peeled off the boles of pines that were removed in cuttings and have a dbh of 8–18 cm. Based on the biomass models for pine [37], it was assumed that the fresh weight of bark peeled off one cubic meter of such pines is 25 kg.
2.1.7. Resin
Spruce and pine resin was collected from trees with a dbh of at least 22 cm and growing on more fertile or typical mineral and peatland site types for spruce (Myrtillus type and spruce mire III) and pine (Vaccinium type and pine mire IV). The fresh weight of pine and spruce resin (g tree−1) was calculated using the models of Kietäväinen and Salminen [38] as follows:
2.1.8. Birch Sap
Birch sap was collected from mature silver birches stands with a mean diameter of at least 20 cm and growing on Myrtillus type or more fertile sites. The sap model was modified from the sap yield equations presented by Maher [39], assuming that a birch having a dbh of 30 cm yields 75 liters of sap year−1 [40]. The volume of sap (liters tree−1) was calculated for silver birches with a dbh of at least 10 cm using the following model:
2.2. Case Study Holdings
We used two case study forest holdings in our analyses. The major difference between the case study holdings was the site fertility and the resulting dominance of tree species (Table 1). The more fertile forest holding was spruce dominated and it also included a rather high volume of birch. The other holding was less fertile, the total volume of trees was clearly lower, and the forests were pine dominated. The justification for including these two holdings for our analyses was that different NWFPs can be typically found in forests with different fertility rates and they are also related to different tree species.
2.3. Use of the Monsu Planning System
The stand inventory data was used in the Monsu forest planning software [34]. The length of the planning period applied in our calculations was 30 years, and it was divided into three 10-year sub-periods. The automatic event simulator of Monsu simulated alternative treatment schedules for all stands of the holding. The simulations included both even-aged management alternatives and continuous cover forest management alternatives. In the latter management strategy, the forests are managed by different kinds of thinnings, mainly from above. In even-aged management, the thinning is more often done from below. At the end of rotation, the forests are regenerated (with clear-felling or seed-tree cutting).
Several alternative management schedules were simulated for the stands by changing the timing of cuttings. A no-cutting schedule was also simulated for every stand. In even-aged forestry, the regeneration method was clear-felling and planting in mesic and better sites, clear-felling and sowing pine seed in sub-xeric sites, and natural regeneration for pine via seed trees in xeric sites.
Stand dynamics were simulated by using the models of Pukkala et al. [41] for tree survival, diameter increment, and ingrowth (gradual advance regeneration). The assortment volumes of harvested trees were calculated with the taper models of Laasasenaho [42]. Quality deductions were made on saw log volume, based on the models of Mehtätalo [43] and the results of Malinen et al. [44]. The deduction was implemented by moving a part of saw log volume into pulpwood assortment. The net income from a timber sale was calculated by subtracting the harvesting costs from the roadside value of the harvested trees. Harvesting costs were calculated with the models of Rummukainen et al. [45].
Stand development was simulated in five-year steps, and cuttings and other treatments were simulated in the middle of each of the three 10-year periods, i.e., in years 5, 15, and 25. The yields of NWFPs were calculated for the starting year and at the end of each 10-year period, i.e., in years 10, 20, and 30. These yields describe the amounts of biological production of the various NWFPs in these particular years. The predictions can be regarded as NWFP potentials. Actual harvesting of some products (e.g., resin) has an impact on the trees and cannot be repeated every year. Some other NWFPs, such as berries and mushrooms, have no impact on the tree stock, and harvesting can be repeated every year.
The management schedules simulated for the stands formed a decision space from where a high number of plans were generated using multi-objective optimization. The maximized objective function was an additive utility function [46], which included all the NWFPs analyzed in this study, the volume of harvested timber, and the NPV of timber production. NPV was calculated from the incomes and costs of the treatments simulated during the 30-year period, and the value (NPV) of the final growing stock. The NPV of the final growing stock was predicted with models as explained by Pukkala [13]. NPV was calculated with a standard real discount rate of 3%.
The amount of each product was divided by the maximum possible amount of the product. The same was done for NPV. This conversion removed the effect of the units of the products and NPV, i.e., converted the yields and NPVs into relative values. The maximum possible amounts were found by single-objective optimizations. The yield of the NWFP in the last simulation year (year 30) was used as the objective variable in optimization.
The weights of different products in the utility function were drawn from uniform distribution and scaled so that the sum of the weights was equal to one. The number of random combinations of weights was 200. Together with the single-optimum solutions, the number of solutions used to analyze the correlations among NPV, harvested volume, and NWFPs was 214. All these solutions are pareto-optimal when all NWFPs are assumed to be management objectives in addition to harvested volume and NPV.
The amounts of different outputs in the 214 solutions were used as the dataset in correlation analysis. Then, some example NWFPs were selected for a more detailed analysis through production possibility frontiers between harvested timber volume and production potential of the NWFP. The results of correlation analysis were used to pick the NWFPs for this analysis: one NWFP correlated positively with harvested volume, the other showed no correlation, and the third and fourth had a weak or strong negative correlation with the volume of harvested timber. Then, production possibility frontiers were also created for selected pairs of NWFPs. These pairs were also selected based on correlation coefficients: positive correlation, no correlation, weak negative correlation, and strong negative correlation. When the production possibility frontiers were created between two products, no other products in addition to these two were included in the objective function.
3. Results
3.1. Production Possibilities
The production possibilities of different NWFPs and timber in spruce- and pine-dominated forest holdings are presented in Table 2. The 30-year drain ranged from 0 to 66,661 m3 in the spruce-dominated forest and from 0 to 122,261 m3 in the pine-dominated forest. The range of net present value (3%) was 1,101,936–1,583,157 € in the spruce-dominated forest and 2,081,733–2,584,536 € in the pine-dominated forest. The predicted yields of the NWFPs varied a lot among the 200 alternative plans with random weights of objectives. Comparisons of the maximum yields of the 200 alternative plans to the single-objective maximums revealed that the alternative plans captured the total range of variation in production possibilities well. When considering the minimum values of NWFPs, it must be noticed that achieving a zero production in the biological yields of, e.g., berries, is practically impossible.
3.2. Correlations among Different Products
The correlations among timber drain and yields of NWFPs were mainly negative (Table 3 and Table 4). This is due to the fact that many NWFPs are either directly collected from trees (resin, sap, and bark), are in a symbiotic relationship with trees (mushrooms), or are collected indirectly depending on the existence of trees (berries). Spruce shoots and birch leaves are collected from young stands, and thus the yields of these NWFPs depend on the age-class structure of holdings. In the spruce-dominated forest holding, considerable amounts of regeneration cuttings were done in the beginning of the 30-year period in some of the 214 solutions. As a result of that, stands regenerated for spruce were no more suitable for spruce shoot harvesting at the end of the 30-year period and the correlation between timber drain (and NPV) and spruce shoots was negative. The negative correlations were stronger in the pine-dominated forest than in the spruce-dominated forest.
Timber drain only correlated positively with cowberry and birch leaf production (Table 3 and Table 4). This is due to the fact that good cowberry yields are found also after regeneration cuttings [7] and birch regenerates naturally on cutting areas [47,48].
The signs and magnitudes of correlations were very similar in both spruce and pine-dominated forest holdings. However, one clear difference between holdings was found: the correlation between the production potentials of bilberry (shoots and berries) and spruce shoots was only statistically significant and negative in spruce-dominated forest holding (Table 3 and Table 4). Bilberry is abundant on sites which are usually regenerated for spruce. Regeneration cuttings are harmful to bilberry, but at the same time, regeneration for spruce will increase the production of spruce shoots.
3.3. Production Possibility Frontiers
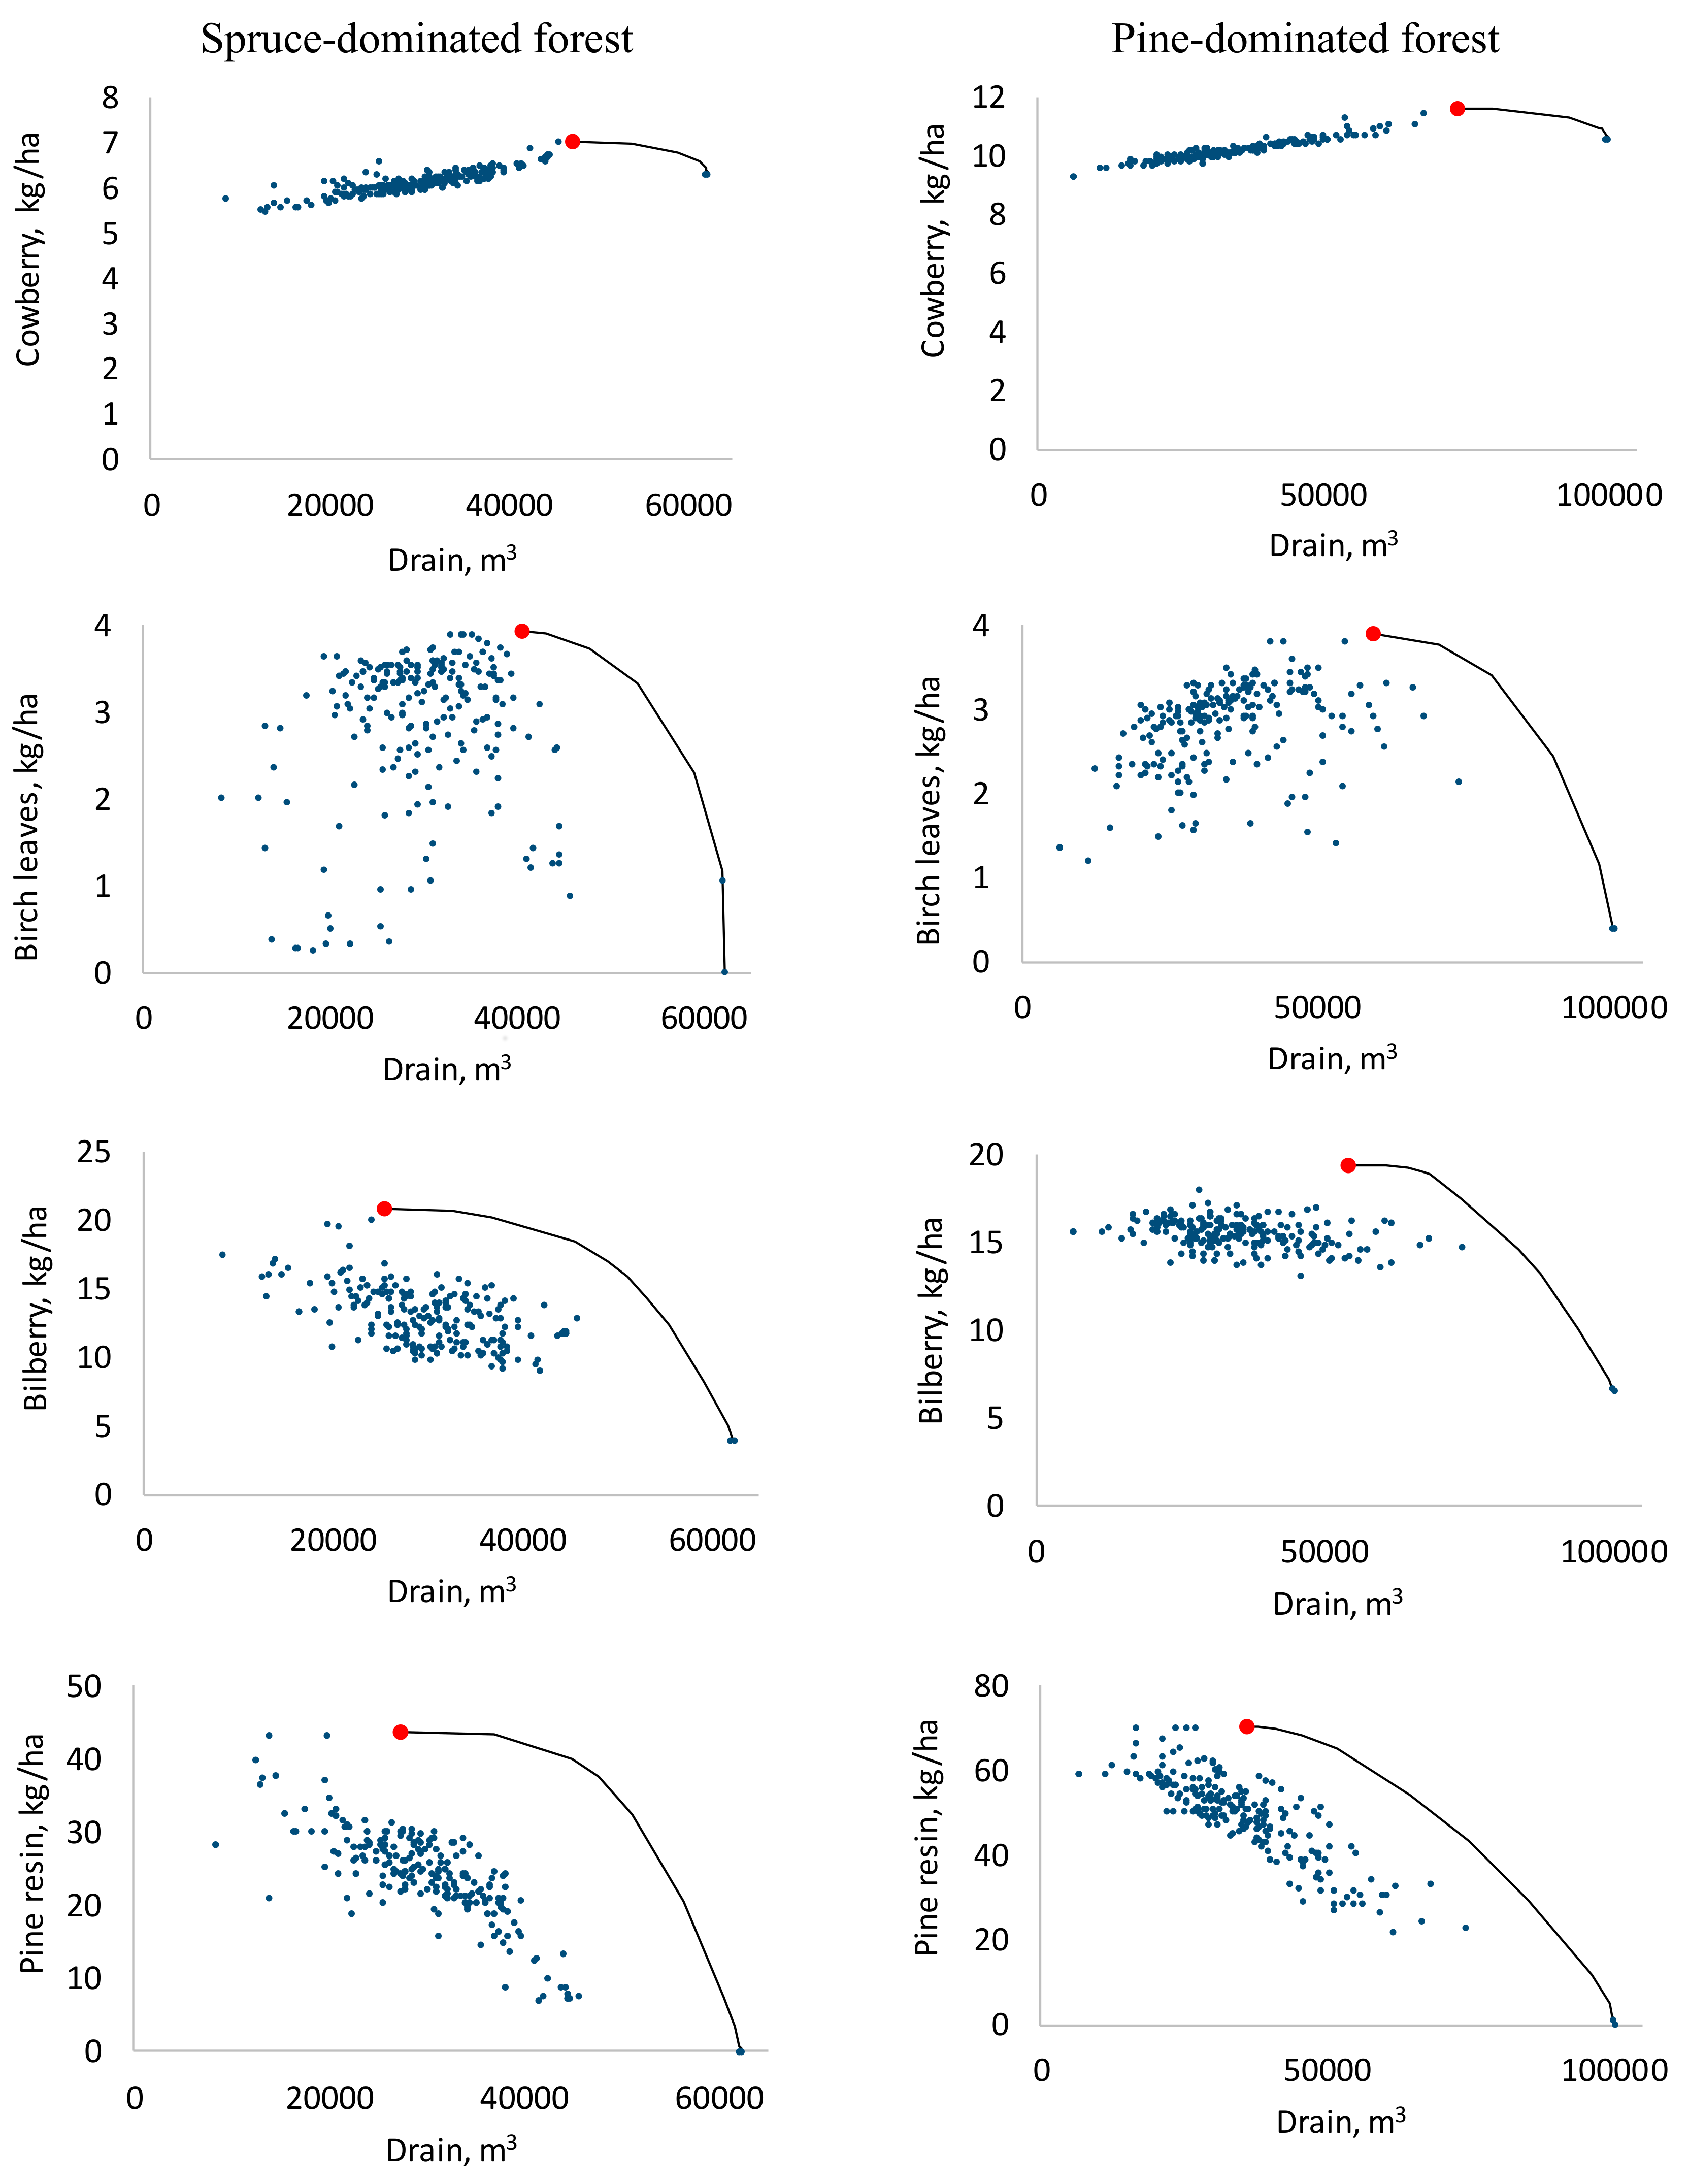
The timber drain and cowberry yield had a strong positive correlation (Table 3 and Table 4). The shape of the production possibility frontier reveals that when only these two products were considered, maximizing the drain only had a small negative effect on cowberry yield (Figure 1). For the yield of birch leaves, which was not correlated with the timber drain, the situation was clearly different. When the timber drain was increased, it finally led to zero birch leaf yield in both holdings. The shape of the frontier was concave. The production possibility frontiers of pine resin and bilberry, which had a negative correlation with drain, were similar to that of birch leaves. Increasing the drain led to a drastic decrease in pine resin and bilberry yields. However, the yield of bilberry was never zero. In general, the production possibility frontiers were very similar for both forest holdings. It is also noteworthy that although the correlation coefficient between drain and NWFP was often negative, some cuttings were necessary for the maximum yield of the NWFP.
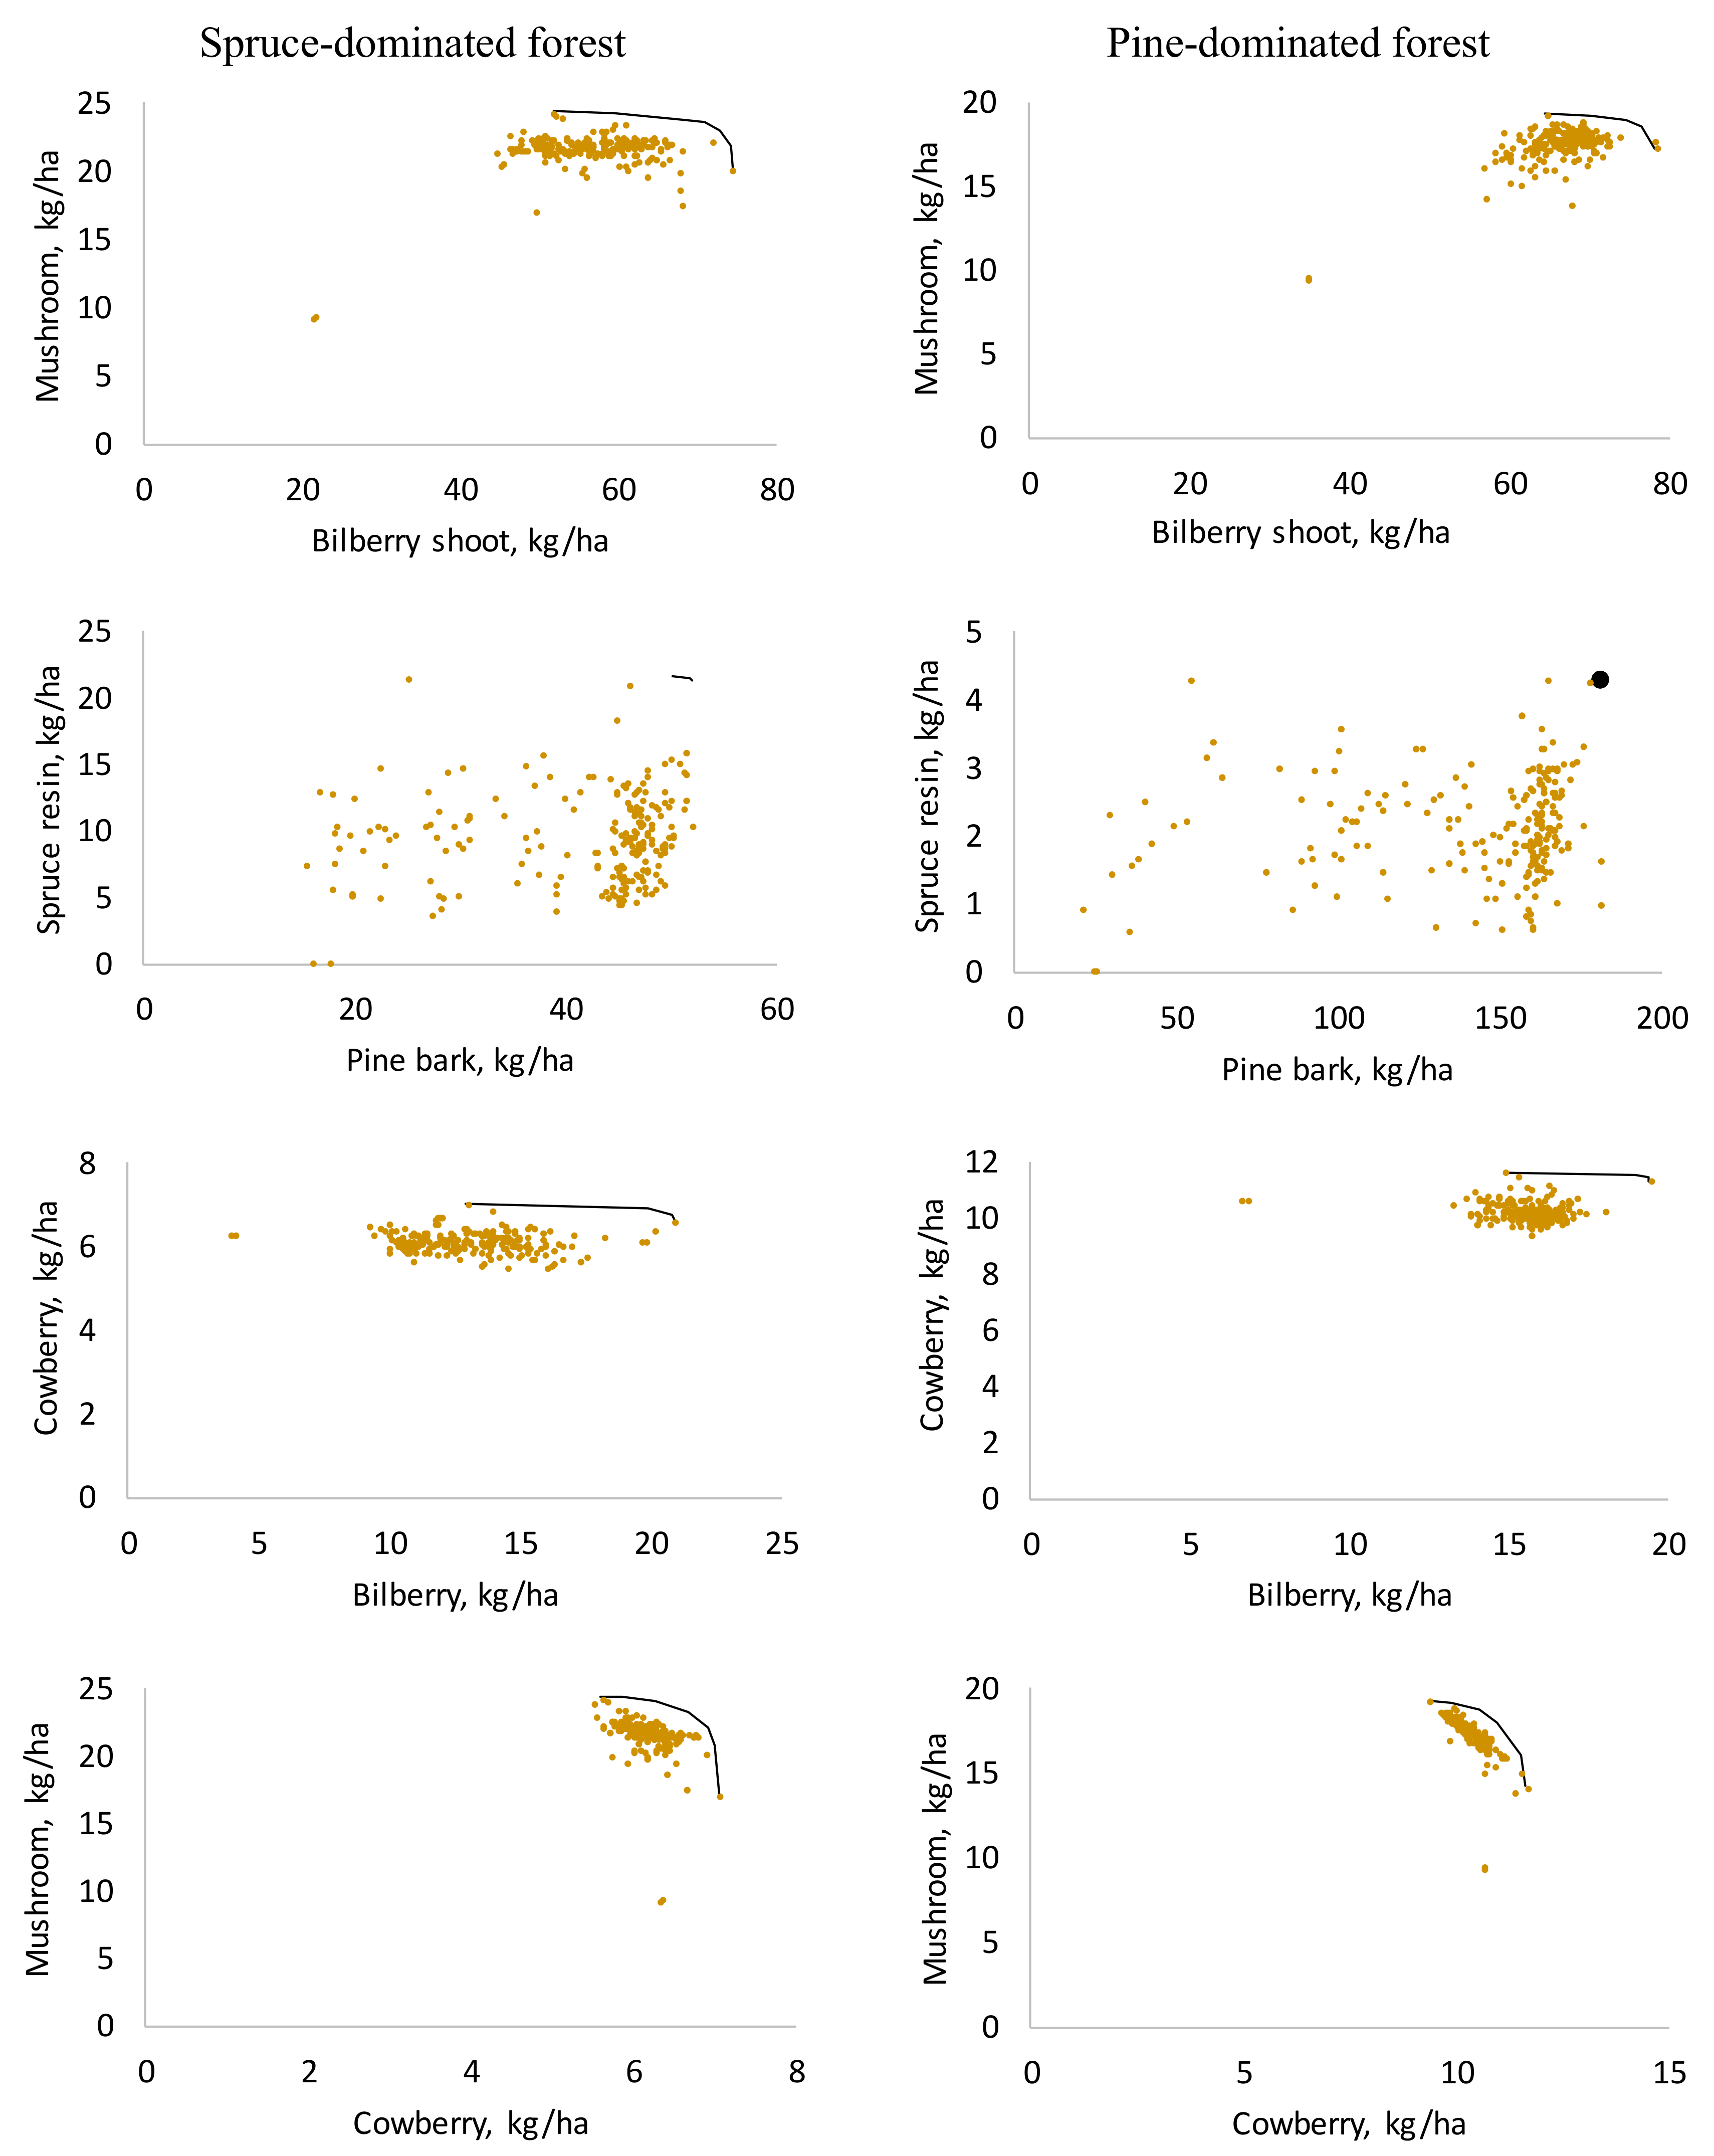
Among the NWFPs, a strong positive correlation was found between the yields of commercial mushrooms and bilberry shoots (Table 3 and Table 4). In both forest holdings, the shape of the production possibility frontier revealed that increasing the production of bilberry shoots did not affect the mushroom yields at first (frontier is horizontal), but near the maximal production levels, a negative transformation rate was detected (Figure 2). This was observed for many pairs of NWFPs. Pine bark is peeled off and spruce resin is extracted from different tree species, and thus the production frontier was a single point in the pine-dominated forests and a short line in the spruce-dominated forests.
The production possibility frontier between bilberry and cowberry was practically horizontal (Figure 2). Increasing the bilberry production had no effect on the cowberry production, because the highest yields of these berries are obtained in similar stands (mature pine-dominated sub-xeric stands). Cutting decreases bilberry yields but has no major effect on cowberry yields. Therefore, bilberry yield varies much more than cowberry yield. Thinning a stand increases the yield of both berries. On the other hand, a concave frontier was found between cowberry and mushroom yields due to the fact that regeneration cuttings promote cowberry yields but are harmful for mushrooms. Again, the shapes of the production possibility frontiers among the NWFPs were similar in spruce and pine-dominated forest holdings.
4. Discussion
The main results of this study are in concordance with earlier studies [16,18,19] and show that the yields of NWFPs were often negatively correlated with cutting removals, although a certain amount of cutting was required to maximize the yield of the NWFP. The correlations between the NPV of timber production and the yields of NWFPs were also negative, but clearly weaker. Maximizing NPV resulted in lower harvesting levels as it is profitable to extend the rotation of some stands instead of regenerating all the stands immediately when it becomes possible. Our results also indicated that the maximum yields of NWFPs were achieved with rather high cutting removal levels (Figure 1). This means that NWFPs benefit from some cuttings. However, trade-offs between cutting drain and the yields of NWFPs existed at near-maximum cutting removal levels; except with cowberry, which does not suffer from clear-felling.
When considering the relationships among NWFPs, the main result is that the severe trade-offs were only found at near-maximal production levels. At lower production levels, the yields of NWFPs were not much affected by each other. Also, many positive correlations among NWFPs were found in our holding level analyses (Table 3 and Table 4). At an individual stand level, the relationships among NWFPs may be different.
When interpreting the results, it must be noted that the uncertainties in the predictions of NWFPs’ yield models—being less reliable than those for timber—were not accounted for in this study. In the future, more reliable models for NWFPs, especially for berries and mushrooms, should be prepared. For example, information on ground vegetation cover would improve the yield predictions of cowberries, bilberries, and bilberry shoots, because the site classification system applied in Finland does not describe the abundance and yield of bilberry and cowberry accurately enough [49].
In our analyses, only the biological production potentials of NWFPs were used because of insufficient experience calculating the economic value of, and consequently economic trade-offs among, NWFPs. Examples of the first attempts to also include the economic value of NWFPs in the optimization of multi-product management of boreal forests have been presented by Miina et al. [7] for berries and Tahvanainen et al. [10] for mushrooms. In the same way as already done with berries and mushrooms, the economic value of harvestable yields of other NWFPs could be calculated by using the market prices and harvesting costs. However, as knowledge on harvestable yields, labor costs etc. is currently scanty, the economic values of NWFPs were not considered in this study.
The yields of different NWFPs typically vary at temporal and spatial scales [50]. For example, spring weather conditions greatly affect the yields of berries, whereas temperature and rainfall affect the yields of mushrooms [33]. In our case, the temporal scale covered the 30-year planning horizon, but the annual yields of NWFPs were only calculated at the end of the 30-year period.
It was a promising result that fewer or weaker negative correlations were found between NWFPs and NPV than between NWFPs and timber drain. Including the incomes from NWFPs in NPV would have resulted in forest management that is more profitable for the joint-production of NWFPs and timber. At a stand level, increasing the incomes through the sales of harvested NWFPs is a rational option for forest owners [5,6,7,8,10]. In future studies, not only the economic value of timber, but also that of NWFPs, should be included in the analysis of the synergies and trade-offs of the production of NWFPs in boreal forests.
5. Conclusions
This study examined the correlations and trade-offs among the future production possibilities of a total of twelve NWFPs and timber through a novel use of empirical yield models, using a modern multi-objective simulation-optimization system. Correlations between NWFPs and timber harvesting were mainly negative, indicating that trade-offs existed at the forest holding level. The negative correlations between NWFPs and timber harvesting are logical as most of the NWFPs depend either directly or indirectly on trees.
Multiple-use of forests is a feasible and recommendable compromise among different NWFPs and timber production because timber production drastically decreases the yields of NWFPs only near maximal cutting levels. In optimization, when the weight of timber production is increased, a management schedule(s) which results in the highest increase in timber production with the smallest sacrifice in the production of NWFPs will become optimal for some stand(s). Similar to the result of Peura et al. [51], instead of aiming at maximizing the yields of all NWFPs and timber in the same stands, a more feasible approach in holding and landscape level planning is to apply timber production oriented forest management in those stands that never produce high amounts of NWFPs. Further, severe trade-offs can be avoided by appropriate silvicultural measures, for example, by applying continuous cover forest management [13].
Author Contributions
M.K., T.P., and J.M. designed the study; T.P. performed the analysis; M.K., T.P., and J.M. contributed to data analysis and interpretation, and wrote the paper.
Acknowledgments
This study was partly supported by the project New Products from Forests executed by the Natural Resources Institute Finland (Luke), the University of Eastern Finland, Lapland University of Applied Sciences, the Finnish Forest Centre and Oulu University of Applied Sciences. The project was funded by the European Regional Development Fund.
Conflicts of Interest
The authors declare no conflicts of interest.
References
- Finnish Statistical Yearbook of Forestry; Finnish Forest Research Institute: Helsinki, Finland, 2014; p. 428.
- Shackleton, S.; Shackleton, C.; Shanley, P. (Eds.) Non-Timber Forest Products in The Global Context, Tropical Forestry No. 7; Springer: Amsterdam, The Netherlands, 2011; p. 285. [Google Scholar]
- Vidale, E.; Da Re, R.; Lovric, M.; Corradini, G.; Pettenella, D. International trade of the NWFP: Any Opportunity for the Italian Forest Sector? In Proceedings of the Second International Congress of Silviculture, Designing the Future of the Forestry Sector, Florence, Italia, 26–29 November 2014; Ciancio, O., Ed.; Italian Academy of Forest Sciences: Florence, Italy, 2015; Volume 2, pp. 734–753. [Google Scholar]
- Kurttila, M.; Tahvanainen, V. (Eds.) Description of New Decision Support Tools for Optimization of MPT and NWFP Management. Deliverable 2.4 of the Startree Project; Technical Report for European Commission; European Commission: Brussels, Belgium, 2016; p. 106. [Google Scholar]
- Palahí, M.; Pukkala, T.; Bonet, J.A.; Colinas, C.; Fischer, C.R.; Martínez de Aragón, J. Effect of the inclusion of mushrooms values on the optimal management of even-aged pine stands of Catalonia. For. Sci. 2009, 55, 503–511. [Google Scholar]
- De-Miguel, S.; Pukkala, T.; Yeşil, A. Integrating pine honeydew honey production into forest management optimization. Eur. J. For. Res. 2014, 133, 423–432. [Google Scholar] [CrossRef]
- Miina, J.; Pukkala, T.; Kurttila, M. Optimal multi-product management of stands producing timber and wild berries. Eur. J. For. Res. 2016, 135, 781–794. [Google Scholar] [CrossRef]
- Pasalodos-Tato, M.; Pukkala, T.; Calama, R.; Cañellas, I.; Sánchez-González, M. Optimal management of Pinus pinea stands when cone and timber production are considered. Eur. J. For. Res. 2016, 135, 607–619. [Google Scholar] [CrossRef]
- Küçüker, D.M.; Başkent, E.Z. Sustaining the joint production of timber and Lactarius mushroom: A case study of a forest management planning unit in Northwestern Turkey. Sustainability 2017, 9, 92. [Google Scholar] [CrossRef]
- Tahvanainen, V.; Miina, J.; Pukkala, T.; Kurttila, M. Optimizing the joint production of timber and marketed mushrooms in Picea abies stands in eastern Finland. J. For. Econ. 2018, 32, 34–41. [Google Scholar] [CrossRef]
- Gamfeldt, L.; Snäll, T.; Bagchi, R.; Jonsson, M.; Gustafsson, L.; Kjellander, P.; Ruiz-Jaen, M.C.; Fröberg, M.; Stendahl, J.; Philipson, C.D.; et al. Higher levels of multiple ecosystem services are found in forests with more tree species. Nat. Commun. 2013, 4, 1340. [Google Scholar] [CrossRef] [PubMed] [Green Version]
- Pohjanmies, T.; Triviño, M.; Le Tortorec, E.; Salminen, H.; Mönkkönen, M. Conflicting objectives in production forests pose a challenge for forest management. Ecosyst. Serv. 2017, 28 Pt C, 298–310. [Google Scholar] [CrossRef]
- Pukkala, T. Which type of forest management provides most ecosystem services? For. Ecosyst. 2016, 3:9, 16. [Google Scholar] [CrossRef]
- Nautiyal, J.C. Forest Economics: Principles and Applications; Canadian Scholars’ Press Inc.: Toronto, ON, Canada, 1988; p. 581. [Google Scholar]
- Zhang, D.; Pearse, P.H. Forest Economics; UBC Press: Vancouver, BC, Canada, 2011; p. 412. [Google Scholar]
- Toth, S.F.; McDill, M.E. Finding efficient harvest schedules under three conflicting objectives. For. Sci. 2009, 55, 117–131. [Google Scholar]
- Kärkkäinen, L.; Kurttila, M.; Salminen, O. Effects of Energy Wood Harvesting on Timber Production Potential and Biological Diversity in North Karelia, Finland. For. Sci. 2014, 60, 1077–1088. [Google Scholar] [CrossRef]
- Borges, J.G.; Garcia-Gonzalo, J.; Bushenkov, V.A.; McDill, M.E.; Marques, S.; Oliveira, M.M. Addressing multi-criteria forest management with Pareto Frontier methods: An application in Portugal. For. Sci. 2014, 60, 63–72. [Google Scholar]
- Borges, J.G.; Marques, S.; Garcia-Gonzalo, J.; Rahman, A.U.; Bushenkov, V.A.; Sottomayor, M.; Carvalho, P.O.; Nordström, E.-M. A multiple criteria approach for negotiating ecosystem services supply targets and forest owners’ programs. For. Sci. 2017, 63, 49–61. [Google Scholar] [CrossRef]
- Turtiainen, M.; Miina, J.; Salo, K.; Hotanen, J.-P. Modelling the coverage and annual variation in bilberry yield in Finland. Silva Fenn. 2016, 50, 1–12. [Google Scholar] [CrossRef]
- Cajander, A.K. Forest types and their significance. Acta For. Fenn. 1949, 56, 1–71. [Google Scholar] [CrossRef]
- Yli-Kojola, H.; Ahola, A. Pysyvien Koealojen 3. Mittaus 1995, Maastotyön Ohjeet; The Finnish Forest Research Institute: Helsinki, Finland, 1995; p. 104. [Google Scholar]
- Laine, J.; Vasander, H. Suotyypit, 3rd ed.; Kirjayhtymä: Helsinki, Finland, 1993; p. 80. [Google Scholar]
- Stark, S.; Niva, A.; Martz, F.; Vuorela, E. Sustainable gathering of juniper and bilberry shoots for natural product industry. MTT Raportti 2010, 3, 27. [Google Scholar]
- Turtiainen, M. Modelling bilberry and cowberry yields in Finland: Different approaches to develop models for forest planning calculations. Dissertationes Forestales 2015, 185, 56. [Google Scholar] [CrossRef]
- Ihalainen, M.; Pukkala, T. Modelling cowberry (Vaccinium vitis-idaea) and bilberry (Vaccinium myrtillus) yields from mineral soils and peatlands on the basis of visual field estimates. Silva Fenn. 2001, 35, 329–340. [Google Scholar] [CrossRef]
- Ihalainen, M.; Alho, J.; Kolehmainen, O.; Pukkala, T. Expert models for bilberry and cowberry yields in Finnish forests. For. Ecol. Manag. 2002, 157, 15–22. [Google Scholar] [CrossRef]
- Ihalainen, M.; Salo, K.; Pukkala, T. Empirical prediction models for Vaccinium myrtillus and V. vitis-idaea berry yields in North Karelia, Finland. Silva Fenn. 2003, 37, 95–108. [Google Scholar] [CrossRef]
- Ihalainen, M.; Pukkala, T.; Saastamoinen, O. Regional expert models for bilberry and cowberry yields in Finland. Boreal Envir. Res. 2005, 10, 145–158. [Google Scholar]
- Miina, J.; Hotanen, J.-P.; Salo, K. Modelling the abundance and temporal variation in the production of bilberry (Vaccinium myrtillus L.) in Finnish mineral soil forests. Silva Fenn. 2009, 43, 577–593. [Google Scholar] [CrossRef]
- Turtiainen, M.; Miina, J.; Salo, K.; Hotanen, J.-P. Empirical prediction models for the coverage and yields of cowberry in Finland. Silva Fenn. 2013, 47, 1005. [Google Scholar] [CrossRef]
- Egli, S.; Ayer, F.; Peter, M.; Eilmann, B.; Rigling, A. Is forest mushroom productivity driven by tree growth? Results from a thinning experiment. Ann. For. Sci. 2010, 67, 9. [Google Scholar] [CrossRef]
- Tahvanainen, V.; Miina, J.; Kurttila, M.; Salo, K. Modelling the yields of marketed mushrooms in Picea abies stands in eastern Finland. For. Ecol. Manag. 2016, 362, 79–88. [Google Scholar] [CrossRef]
- Pukkala, T. Dealing with ecological objectives in the Monsu planning system. Silva Lusitana 2004, 12, 1–15. [Google Scholar]
- Miina, J.; Niemistö, P.; Potila, H.; Savonen, E.-M. Kuusentaimikon kerkkäsato ja kerkkien keruun vaikutus kuusten kasvuun. Metsätieteen aikakauskirja 2018, 7802, 12. [Google Scholar]
- Repola, J. Biomass equations for birch in Finland. Silva Fenn. 2008, 42, 605–624. [Google Scholar] [CrossRef]
- Repola, J. Biomass equations for Scots pine and Norway spruce in Finland. Silva Fenn. 2009, 43, 625–647. [Google Scholar] [CrossRef]
- Kietäväinen, A.; Salminen, H. Kuusen ja männyn pihkominen Lapissa–alustavia tuloksia. In Luonnontuotealan Valtakunnallinen Tutkimusseminaari; Peltola, R., Soppela, K., Eds.; MTT Raportti: Helsinki, Finland, 2013; pp. 29–32. [Google Scholar]
- Maher, K. Production and Quality of Spring Sap from Alaskan Birch (Betula neoalaskana Sargent) in Interior Alaska. Master’s Thesis, University of Alaska Fairbanks, Fairbanks, AK, USA, 2005; p. 76. Available online: https://scholarworks.alaska.edu/bitstream/handle/11122/6148/Maher_K_2005.pdf (accessed on 1 July 2018).
- Salo, K. Kaskikoivun mahla virtaa. In Kolin perintö. Kaskisavusta kansallismaisemaan; Lovén, L., Rainio, H., Eds.; Finnish Forest Research Institute & Geological Survey of Finland: Helsinki, Finland, 2000; pp. 78–83. Available online: http://tupa.gtk.fi/julkaisu/erikoisjulkaisu/ej_038.pdf (accessed on 1 July 2018).
- Pukkala, T.; Lähde, E.; Laiho, O. Species interactions in the dynamics of even- and uneven-aged boreal forests. J. Sustain. For. 2013, 32, 371–403. [Google Scholar] [CrossRef]
- Laasasenaho, J. Taper curve and volume equations for pine spruce and birch. Communicationes Instituti Forestalis Fenn. 1982, 108, 74. [Google Scholar]
- Mehtätalo, L. Valtakunnalliset puukohtaiset tukkivähennysmallit männylle, kuuselle, koivulle ja haavalle. Metsätieteen aikakauskirja 2002, 4, 575–591. [Google Scholar]
- Malinen, J.; Kilpeläinen, H.; Piira, T.; Redsven, V.; Wall, T.; Nuutinen, T. Comparing model-based approaches with bucking simulation-based approach in the prediction of timber assortment recovery. For. 2007, 80, 309–321. [Google Scholar] [CrossRef] [Green Version]
- Rummukainen, A.; Alanne, H.; Mikkonen, E. Wood procurement in the pressure of change: Resource evaluation model till year 2010. Acta For. Fenn. 1995, 248, 98. [Google Scholar] [CrossRef]
- Kangas, A.; Kurttila, M.; Hujala, T.; Eyvindson, K.; Kangas, J. Decision Support for Forest Management, 2nd ed.; Springer: Amsterdam, The Netherlands, 2015; p. 307. [Google Scholar]
- Miina, J.; Saksa, T. Predicting establishment of tree seedlings for evaluating methods of regeneration for Pinus sylvestris. Scand. J. For. Res. 2008, 23, 12–27. [Google Scholar] [CrossRef]
- Miina, J.; Saksa, T. Predicting establishment of tree seedlings in regeneration areas of Picea abies in southern Finland. Balt. For. 2013, 19, 187–200. [Google Scholar]
- Kilpeläinen, H.; Miina, J.; Store, R.; Kurttila, M.; Salo, K. Evaluation of bilberry and cowberry yield models by comparing model predictions with field measurements from North Karelia, Finland. For. Ecol. Manag. 2016, 363, 120–129. [Google Scholar] [CrossRef]
- Chen, S.; Shahi, C.; Chen, H.Y.H. Economic and ecological trade-off analysis of forest ecosystems: Options for boreal forests. Envir. Rev. 2016, 24, 348–361. [Google Scholar] [CrossRef]
- Peura, M.; Burgas, D.; Eyvindson, K.; Repo, A.; Mönkkönen, M. Continuous cover forestry is a cost-efficient tool to increase multifunctionality of boreal production forests in Fennoscandia. Biological Conserv. 2018, 217, 104–112. [Google Scholar] [CrossRef]
Figure 1.
The production possibility frontiers between drain and selected NWFPs (lines) for spruce and pine-dominated forest holdings and the solutions from the 200 alternative pareto-optimal forest plans (dots). The red point is the single-objective maximum of the NWFP.
Figure 1.
The production possibility frontiers between drain and selected NWFPs (lines) for spruce and pine-dominated forest holdings and the solutions from the 200 alternative pareto-optimal forest plans (dots). The red point is the single-objective maximum of the NWFP.

Figure 2.
Production possibility frontiers between selected NWFPs (lines) for spruce and pine-dominated forest holdings and the solutions from the created 214 alternative forest plans (dots).
Figure 2.
Production possibility frontiers between selected NWFPs (lines) for spruce and pine-dominated forest holdings and the solutions from the created 214 alternative forest plans (dots).


Table 1.
The characteristics of two case study forest holdings.
| Spruce-Dominated Forest | Pine-Dominated Forest | |
|---|---|---|
| Area, ha | 210 | 542 |
| Number of stands | 275 | 415 |
| Temperature sum, d.d. > 5 °C | 1200 | 1100 |
| Growing sites (%) | ||
| Herb-rich or better | 41.6 | 6.3 |
| Mesic | 38.2 | 42.8 |
| Sub-xeric | 16.4 | 33.2 |
| Poorer than sub-xeric | 3.8 | 17.8 |
| Tree species (volume, m3 ha−1) | ||
| Pine | 48.6 | 58.6 |
| Spruce | 92.0 | 15.8 |
| Broadleaf | 47.4 | 24.3 |
| Assortments (volume, m3 ha−1) | ||
| Saw log | 101.9 | 24.4 |
| Small log | 6.5 | 8.9 |
| Pulpwood | 79.9 | 66.3 |
| Stage of stand development (%) | ||
| Seedling & sapling stand | 2.1 | 14.2 |
| Seed & shelter tree stand | 8.0 | 0 |
| Pulpwood-sized forest | 11.9 | 23.2 |
| Saw-log sized thinning forest | 41.5 | 56.5 |
| Mature forest | 36.5 | 6.0 |
All stands represented mineral soil sites.
Table 2.
Initial yield and minimum, mean, and maximum yields of non-wood forest products at the end of the 30-year period obtained by following a total of 200 holding-level forest plans in which the weights of the objective variables were assigned randomly, or by setting only a single objective.
Table 2.
Initial yield and minimum, mean, and maximum yields of non-wood forest products at the end of the 30-year period obtained by following a total of 200 holding-level forest plans in which the weights of the objective variables were assigned randomly, or by setting only a single objective.
| Objective Variable | Initial Yield | 200 Forest Plans with Random Weights of Objectives | Single-Objective maximum | ||
|---|---|---|---|---|---|
| Minimum | Mean | Maximum | |||
| Spruce-dominated forest | |||||
| Bilberry (kg ha−1) | 14.2 | 4.0 | 13.0 | 20.1 | 20.9 |
| Cowberry (kg ha−1) | 6.3 | 5.5 | 6.2 | 6.9 | 7.0 |
| Mushroom (kg ha–1) | 23.2 | 9.5 | 21.9 | 24.0 | 24.4 |
| Boletus (kg ha–1) | 7.2 | 2.4 | 6.6 | 7.6 | 7.8 |
| Lactarius (kg ha–1) | 15.3 | 6.1 | 14.6 | 16.0 | 16.2 |
| Bilberry shoot (kg ha–1) | 63.4 | 21.6 | 56.6 | 72.1 | 74.5 |
| Spruce shoot (kg ha–1) | 52.3 | 9.1 | 87.7 | 152.7 | 155.5 |
| Birch leaves (kg ha–1) | 0.3 | 0.4 | 3.0 | 3.9 | 3.9 |
| Pine bark (kg ha–1) | 68.9 | 17.5 | 41.9 | 51.4 | 52.0 |
| Pine resin (kg ha–1) | 15.5 | 0.3 | 24.5 | 43.5 | 43.7 |
| Spruce resin (kg ha–1) | 9.3 | 0.2 | 9.4 | 21.1 | 21.6 |
| Birch sap (liter ha–1) | 2593.4 | 389.3 | 5019.6 | 7519.0 | 7653.9 |
| Pine-dominated forest | |||||
| Bilberry (kg ha–1) | 12.2 | 6.8 | 15.6 | 17.4 | 19.4 |
| Cowberry (kg ha–1) | 10.6 | 9.6 | 10.2 | 11.5 | 11.6 |
| Mushroom (kg ha–1) | 17.4 | 9.4 | 17.6 | 18.9 | 19.3 |
| Boletus (kg ha–1) | 5.1 | 2.2 | 4.8 | 5.4 | 5.5 |
| Lactarius (kg ha–1) | 11.6 | 6.1 | 11.8 | 12.7 | 13.0 |
| Bilberry shoot (kg ha–1) | 62.9 | 34.7 | 66.6 | 77.9 | 78.2 |
| Spruce shoot (kg ha–1) | 33.9 | 12.0 | 41.0 | 66.4 | 67.3 |
| Birch leaves (kg ha–1) | 4.5 | 0.4 | 2.9 | 3.8 | 3.8 |
| Pine bark (kg ha–1) | 155.9 | 25.0 | 145.1 | 180.6 | 180.7 |
| Pine resin (kg ha–1) | 6.1 | 1.4 | 50.1 | 70.6 | 70.6 |
| Spruce resin (kg ha–1) | 1.3 | 0.0 | 2.1 | 4.2 | 4.3 |
| Birch sap (liter ha–1) | 546.0 | 1711.9 | 3707.7 | 4285.0 | 4285.0 |
Table 3.
Correlation matrix among timber drain and net present value (NPV) and yields of non-wood forest products obtained by following a total of 214 holding-level forest plans in spruce-dominated forest holding.
Table 3.
Correlation matrix among timber drain and net present value (NPV) and yields of non-wood forest products obtained by following a total of 214 holding-level forest plans in spruce-dominated forest holding.
| NPV | Bilberry | Cowberry | Mushroom | Boletus | Lactarius | Bilberry Shoots | Spruce Shoots | Birch Leaves | Pine Bark | Pine Resin | Spruce Resin | Birch Sap | |
|---|---|---|---|---|---|---|---|---|---|---|---|---|---|
| 0.656 ** | −0.607 ** | 0.814 ** | −0.494 ** | −0.536 ** | −0.504 ** | −0.487 ** | 0.014 | 0.028 | −0.384 ** | −0.824 ** | −0.879 ** | −0.732 ** | Drain |
| −0.344 ** | 0.605 ** | 0.231 ** | 0.161 * | 0.222 ** | −0.014 | 0.071 | 0.446 ** | -0.046 | –0.487 ** | –0.615 ** | –0.393 ** | NPV | |
| −0.169 * | 0.183 ** | 0.143 * | 0.197 ** | 0.905 ** | −0.611 ** | 0.276 ** | –0.044 | 0.375 ** | 0.807 ** | 0.240 ** | Bilberry | ||
| −0.393 ** | −0.498 ** | −0.394 ** | −0.083 | −0.184 ** | 0.129 | –0.573 ** | –0.866 ** | –0.557 ** | –0.620 ** | Cowberry | |||
| 0.985 ** | 0.999 ** | 0.357 ** | 0.285 ** | 0.175 ** | 0.452 ** | 0.483 ** | 0.291 ** | 0.413 ** | Mushroom | ||||
| 0.983 ** | 0.305 ** | 0.268 ** | 0.127 | 0.479 ** | 0.533 ** | 0.325 ** | 0.466 ** | Boletus | |||||
| 0.369 ** | 0.285 ** | 0.184 ** | 0.448 ** | 0.492 ** | 0.302 ** | 0.423 ** | Lactarius | ||||||
| –0.523 ** | 0.539 ** | –0.038 | 0.329 ** | 0.674 ** | 0.210 ** | Bilberry shoots | |||||||
| –0.163 * | 0.291 ** | 0.167 * | –0.388 ** | 0.216 ** | Spruce shoots | ||||||||
| 0.089 | 0.098 | 0.044 | 0.093 | Birch leaves | |||||||||
| 0.498 ** | 0.119 | 0.398 ** | Pine bark | ||||||||||
| 0.570 ** | 0.585 ** | Pine resin | |||||||||||
| 0.552 ** | Spruce resin |
Positive correlations are displayed in blue (the four tones corresponding to correlations (0.8, 1), (0.6, 0.8), (0.4, 0.6) and (0.2, 0.4), respectively; darker colors denote stronger correlations) and negative correlations in a red color (the four tones corresponding to correlations (−0.8, −1), (−0.6, −0.8), (−0.4, −0.6) and (−0.2, −0.4), respectively; darker colors denote stronger correlations). Statistical significance is denoted by asterisks (* p < 0.1; ** p < 0.05).
Table 4.
Correlation matrix among timber drain and net present value (NPV) and yields of non-wood forest products obtained by following a total of 214 holding-level forest plans in pine-dominated forest holding.
Table 4.
Correlation matrix among timber drain and net present value (NPV) and yields of non-wood forest products obtained by following a total of 214 holding-level forest plans in pine-dominated forest holding.
| NPV | Bilberry | Cowberry | Mushroom | Boletus | Lactarius | Bilberry Shoots | Spruce Shoots | Birch Leaves | Pine Bark | Pine Resin | Spruce Resin | Birch Sap | |
|---|---|---|---|---|---|---|---|---|---|---|---|---|---|
| 0.550 ** | –0.511 ** | 0.888 ** | –0.865 ** | –0.898 ** | –0.868 ** | –0.557 ** | –0.395 ** | 0.108 | –0.509 ** | –0.875 ** | –0.721 ** | –0.505 ** | Drain |
| –0.231 ** | 0.509 ** | –0.111 | –0.191 ** | –0.119 | –0.116 | –0.222 ** | 0.545 ** | 0.180 ** | –0.587 ** | –0.626 ** | –0.248 ** | NPV | |
| –0.138 * | 0.522 ** | 0.399 ** | 0.521 ** | 0.881 ** | –0.064 | 0.461 ** | 0.028 | 0.614** | 0.557 ** | 0.214 ** | Bilberry | ||
| –0.707 ** | –0.816 ** | –0.712 ** | –0.251 ** | –0.336 ** | 0.263 ** | –0.601 ** | –0.712** | –0.561 ** | –0.364 ** | Cowberry | |||
| 0.977 ** | 1.000 ** | 0.649 ** | 0.399 ** | 0.155* | 0.619 ** | 0.713** | 0.525 ** | 0.514 ** | Mushroom | ||||
| 0.979 ** | 0.551 ** | 0.388 ** | 0.022 | 0.646 ** | 0.729** | 0.553 ** | 0.525 ** | Boletus | |||||
| 0.650 ** | 0.397 ** | 0.149* | 0.615 ** | 0.718** | 0.531 ** | 0.517 ** | Lactarius | ||||||
| 0.071 | 0.527 ** | 0.078 | 0.642** | 0.523 ** | 0.331 ** | Bilberry shoots | |||||||
| –0.170 * | 0.255 ** | 0.362** | 0.008 | 0.315 ** | Spruce shoots | ||||||||
| 0.089 | 0.035 | –0.176 ** | –0.107 | Birch leaves | |||||||||
| 0.208** | 0.126 | 0.312 ** | Pine bark | ||||||||||
| 0.616 ** | 0.348 ** | Pine resin | |||||||||||
| 0.364 ** | Spruce resin |
Positive correlations are displayed in blue and negative correlations in a red color (darker colors denote stronger correlations). Statistical significance is denoted by asterisks (* p < 0.1; ** p < 0.05).
© 2018 by the authors. Licensee MDPI, Basel, Switzerland. This article is an open access article distributed under the terms and conditions of the Creative Commons Attribution (CC BY) license (http://creativecommons.org/licenses/by/4.0/).
Share and Cite
MDPI and ACS Style
Kurttila, M.; Pukkala, T.; Miina, J. Synergies and Trade-Offs in the Production of NWFPs Predicted in Boreal Forests. Forests 2018, 9, 417. https://doi.org/10.3390/f9070417
AMA Style
Kurttila M, Pukkala T, Miina J. Synergies and Trade-Offs in the Production of NWFPs Predicted in Boreal Forests. Forests. 2018; 9(7):417. https://doi.org/10.3390/f9070417
Chicago/Turabian StyleKurttila, Mikko, Timo Pukkala, and Jari Miina. 2018. "Synergies and Trade-Offs in the Production of NWFPs Predicted in Boreal Forests" Forests 9, no. 7: 417. https://doi.org/10.3390/f9070417
Note that from the first issue of 2016, this journal uses article numbers instead of page numbers. See further details here.