Simulating Climate Change Impacts on Hybrid-Poplar and Black Locust Short Rotation Coppices


1
Soil Protection and Recultivation, Institute of Environmental Sciences, Brandenburg University of Technology Cottbus–Senftenberg, Konrad-Wachsmann-Allee 8, 03046 Cottbus, Germany
2
Environmental and Biochemical Sciences, The James Hutton Institute, Craigiebuckler, Aberdeen AB15 8QH, UK
3
Hydrology and Water Resources Management, Institute of Environmental Sciences, Brandenburg University of Technology Cottbus–Senftenberg, Siemens-Halske-Ring 8, 03046 Cottbus, Germany
4
Institute of Botany, Faculty of Natural Sciences, University of Hohenheim, Garbenstrasse 30, 70599 Stuttgart-Hohenheim, Germany
5
CEBra—Centrum for Energy Technology Brandenburg e.V., Friedlieb-Runge-Strasse 3, 03046 Cottbus, Germany
*
Author to whom correspondence should be addressed.
Forests 2018, 9(7), 419; https://doi.org/10.3390/f9070419
Submission received: 20 June 2018
/
Revised: 8 July 2018
/
Accepted: 9 July 2018
/
Published: 12 July 2018
(This article belongs to the Section Forest Ecophysiology and Biology)
Abstract
:In Brandenburg, north-eastern Germany, climate change is associated with increasing annual temperatures and decreasing summer precipitation. Appraising short rotation coppices (SRCs), given their long-time planning horizon demands for systematic assessments of woody biomass production under a considerable spectrum of climate change prospects. This paper investigates the prospective growth sensitivity of poplar and black locust SRCs, established in Brandenburg to a variety of weather conditions and long-term climate change, from 2015 to 2054, by a combined experimental and simulation study. The analysis employed (i) a biophysical, process-based model to simulate the daily tree growth and (ii) 100 realisations of the statistical regional climate model STAR 2K. In the last growing period, the simulations showed that the assumed climate change could lead to a decrease in the woody biomass of about 5 Mg ha−1 (18%) for poplar and a decrease of about 1.7 Mg ha−1 (11%) for black locust trees with respect to the median observed in the reference period. The findings corroborate the potential tree growth vulnerability to prospective climatic changes, particularly to changes in water availability and underline the importance of coping management strategies in SRCs for forthcoming risk assessments and adaptation scenarios.
1. Introduction
As outlined by the European Commission in the Energy Roadmap 2050 [1], the share of renewable energy sources must increase in gross final energy consumption to at least 55% and in electricity consumption to at least 64%, while simultaneously striving for a low-carbon goal. Stemming from these efforts to reduce energy wastage, fossil fuels, and greenhouse gas emissions, to mitigate climate change and the availability of natural resources, the potential of raw materials for bio-based sectors is growing in recognition progressively [1].
Since biomass is regarded as a flexible primary energy for the generation of energy, heat, fuel, bio-based materials, and chemicals, it can play an important role in achieving the renewable energy goal set by 2050 [2,3]. Biomass generated from dedicated energy crops such as short rotation coppices (SRCs) is accompanied by many advantages such as efficient nutrient utilization, low erosion potential [4], and low to no requirement for pesticide and fertilizer [5]. Furthermore, SRCs have shown high biomass yields [6], adequate fuel properties [7], and low emissions from alternative fuels and flexibility to consumer demand [5]. In Europe, the high demand for woody biomass for energy purposes increased the planting popularity of fast-growing tree species belonging to the genera Populus, Eucalyptus, Pinus, Acacia, and Salix [8,9,10,11,12,13,14].
Understanding whether SRCs are economically profitable and environmentally sustainable requires long-term assessments of woody biomass production in strong relation to changes in environmental conditions like the ongoing climate change [5,15,16]. During the past decade, increasing annual temperature and tendencies towards decreasing summer and increasing winter precipitation were reported in north-eastern Germany [17,18]. In Central Europe, projections of future climate assume increasing climate variability and number of extreme weather events [19,20].
However, evaluating the climate change impacts on the tree woody biomass from observational and experimental studies has been subject to various limitations regarding the influence of interacting factors. Moreover, potential future climate changes have been reported to go beyond historical observations [21].
Therefore, simulation studies have been widely applied to model the tree growth in relation to environmental factors [22,23], assessing climate change impacts on the growth performance of aspen (Populus tremula L.), Norway spruce (Picea abies L. Karst.), Scots pine (Pinus sylvestris L.), European beech (Fagus sylvatica L.), oak (Quercus robur L. × Quercus petraea Liebl.), and Douglas fir (Pseudotsuga menziesii (Mirb.) Franco) [24,25,26,27]. Field experiments for short rotation forestry were carried for Populus and Salix and for breeding of clones [28,29]. However, long-term studies on the variability of woody biomass production under different climatic conditions for certain tree species such as black locust (Robinia pseudoacacia L.) and for management practices such as short-term forestry are rare [8].
The objective of this paper was to evaluate the potential growth vulnerability of two fast-growing tree species established in Brandenburg, Germany and managed as short rotation coppices (SRCs), to a considerable spectrum of weather conditions and long-term climate change. By a combined experimental and simulation study, we investigated the prospective growth of hybrid poplar clone “Max I” (Populus nigra L. × P. maximowiczii Henry) and black locust (Robinia pseudoacacia L.) trees in terms of above-ground woody biomass production, from 2015 to 2054.
Based on the implications of this study for the studied clones, it will be possible to develop and optimize the designs of SRCs and to provide a reliable estimation of achievable woody biomass yields according to tree species, management, and climate change effects.
2. Materials and Methods
In order to handle uncertainties in assessing the climate change impacts on tree growth due to interrelations between various factors, Medlyn et al. [30] suggested an integration of experimental and simulation studies. Thus, our methodology to investigate the impacts of weather conditions and long-term climate change on the above-ground woody biomass of poplar and black locust trees employed (i) an experimental site with SRCs in Brandenburg, Germany, (ii) a biophysical, process-based model to simulate the daily tree growth on the basis of tree parameters, soil physical characteristics, and weather data [31], and (iii) 100 realisations of a scenario of the statistical regional climate model STAR, which assumed an increase in annual temperature of 2K, as well as a decreasing annual precipitation by 30–40 mm, between 2000 and 2055 [16,32,33].
2.1. Site Description
The study site at Neu Sacro (51°46′54″ N, 14°37′18″ E, 67 m a.s.l.) is situated in Lower Lusatia, in the south of the German Federal State of Brandenburg. The SRC is established 500 m away from the Lusatian Neisse river, comprising around 5 ha, out of which black locust trees (planted in spring 2010) spread over 2 ha and poplar trees (re-planted in spring 2011) spread over 2.5 ha. These two tree species were planted in double rows, resulting in a planting density of about 8700 trees per hectare (0.75 m × 0.90 m spacing with a 1.80 m tree strip along the tree row) [34].
The climate in the area has an average temperature of about 8.9 °C and an average annual precipitation of 563 mm a−1 (standard reference period: 1960–1990; weather station Cottbus of the German Weather Service, about 25 km west of the site) and an average temperature of about 9.9 °C and an average annual precipitation of 577 mm a−1 (current period: 1990–2015).
The site is characterized by a Gley-Vega and Pseudogley-Vega soil with a sandy loam texture. The ploughing horizon (0–30 cm depth) is characterized by a mean particle size distribution of 65% sand, 29% silt, and 6% clay, a content of soil total organic carbon of 10.44%, a content of total nitrogen of 0.95%, and a pH (CaCl2) value of 5.75. The groundwater level varies between 0.8 m and 2.0 m below the surface [34].
2.2. Yearly Measurements of Above-Ground Woody Biomass
The rotations were five years (2010–2014) for black locust and four years (2011–2014) for poplar. These growing periods correspond to the length of a medium rotation cycle [35]. Tree shoot basal diameters were measured at the end of every year. At the end of the vegetation period, in 2014, fifty poplar and fifty black locust trees were harvested about 10 cm above the ground for the measurement of fresh weight. The stem and branches of these trees were shredded into wood chips, and sub-samples of every shredded tree were taken to the laboratory for the determination of above-ground tree dry woody biomass by drying at 105 °C until constant weight [36].
Subsequently, the above-ground woody biomass was estimated for the earlier years by using an allometric equation, as given in Equation (1) [37,38]:
where B is the above-ground tree dry woody biomass (kg), D is the shoot basal diameter (cm), and a and b are constants. By applying a least-square linear regression of natural-logarithmic-transformed data for the diameter and tree biomass measured in 2014, a and b were determined as the intercept and slope of the regression, respectively. Thus, the obtained values were a = 0.0551, b = 2.2963 for poplar (R2 = 0.98, RMSE = 0.92) and a = 0.0396, b = 2.5594 for black locust (R2 = 0.96, RMSE = 1.91).
For comparison purposes, this study focused on the above-ground woody biomass over the growing period of four years from 2010 to 2013 for black locust and from 2011 to 2014 for poplar.
2.3. Modelling the Above-Ground Woody Biomass
2.3.1. Description of the Yield-SAFE Model
For the simulations of site-specific, long-term tree yields under competitive conditions, we used the Yield-SAFE model (Yield Estimator for Long-term Design of Silvoarable AgroForestry in Europe), a parameter-sparse, eco-physiologically based model [31,39,40], as implemented in MATLAB [41].
Heretofore, the performance of the Yield-SAFE model was evaluated with respect to long-term tree yields measured across 19 landscape test sites in Spain, France, and the Netherlands [42]. Yield-SAFE was parameterized and validated for cherry, poplar, walnut, and oak trees given data from the Atlantic and Mediterranean regions of Europe [31,39,40,42,43,44].
The model requires information about the trees (species, dimensions, planting density, day of budburst, day of leaf-fall), soil physical characteristics (soil texture, bulk density), and daily weather data (global radiation (W m−2), air temperature (°C), and precipitation (mm)). The potential tree growth is modelled in terms of resource use efficiency of primarily air temperature (due to the developmental and phenological processes), global radiation (as the main driver for photosynthesis), and, to a lesser extent, water [31]. Under this potential growth assumption, nutrient availability is not considered to be a yield-limiting factor [45].
Consequently, the Yield-SAFE simulations require four state equations regarding: (1) the tree biomass, used to derive temporally-integrated timber volumes by means of tree harvest index, dry wood density, and a factor accounting for the proportion of biomass that produces timber; (2) the tree leaf area, for the regulation of the radiation capture, thus of the dry matter production and the water losses through transpiration; (3) the number of shoots per tree, for the annual potential leaf area; and (4) the soil water content, with respect to the water holding properties of the given soil and the degree of water limitation (such as precipitation, soil depth).
In the Yield-SAFE model, the water uptake is implemented by means of a root inter-zone between trees. The model assumes one soil layer, homogeneous in its physical characteristics, whose volumetric water content is calculated in terms of precipitation, drainage of soil water below the potential tree rooting zone, and the actual soil evaporation. The evaporation is calculated in terms of heat of vaporization, radiation incident on the soil, and a factor that accounts for the reduction in soil evaporation. Altogether, the water used by the trees per unit area per day is implemented so that it accounts for the biomass reductions due to respiration losses or senescence and is calculated by multiplying the water-limited growth rate per tree with the tree density and the transpiration coefficient [31,39].
2.3.2. Sensitivity Analysis of the Yield-SAFE Model
In order to minimize uncertainties and gain insight into which parameters influence the model output the most, a one-at-a-time sensitivity analysis was conducted (Equation (2)). This meant that the nominal value of each previously calibrated parameter was changed by ±10% while fixing the other parameters at their default values [39]. The sensitivity, S was calculated by:
where Bt is the modelled tree biomass (g tree−1) obtained through Yield-SAFE simulations with a ±10% change in parameter X. In order to compare the parameter sensitivity independently of scale, a relative, normalized sensitivity was computed (Equation (3)):
Accordingly, all parameters with an absolute normalized sensitivity higher than 0.1 were labelled as dominant, as they exhibited a comparative high influence on the model output. The sensitivity analysis regarding the climatic inputs was performed using weather data from the German Weather Service, station Cottbus. Throughout this paper, this weather data is referred to as a reference timeframe.
2.3.3. Parameterization and Validation of the Yield-SAFE Model
The Yield-SAFE model was parametrized separately for poplar and black locust trees, given their distinct growth behaviour and the site-specific conditions, such as weather and edaphic conditions. Initial estimates of tree and soil parameters were adapted from field measurements and studies performed by Keesman et al. [39], Graves et al. [41], and Wösten et al. [45] (Table A1).
The start and end of vegetation period were given as static inputs (poplar: DOYbudburst = 105, DOYleaf-fall = 280; black locust: DOYbudburst = 125; DOYleaf-fall = 310; [46]). Therefore, the weather data have been analysed for the distinctive vegetation periods of the tree species.
The historical weather data were taken from the weather station Cottbus. As global radiation was not measured at this weather station, it was estimated for the years 2010–2015, according to the Ångström regression equation modified by Page [47] (Equation (4)):
where is the monthly average daily radiation on the horizontal surface, is the monthly average daily extra-terrestrial solar radiation, is the monthly mean daily sunshine duration, and is the monthly mean maximum possible sunshine duration. The empirical coefficients a and b were derived from the German Weather Service station Lindenberg (52°20′85″ N, 14°11′80″ E; 98 m a.s.l., about 90 km north-west of the experimental site) and transferred to the weather station Cottbus. Accordingly, a = 0.14 and b = 0.47 for the months between November and February, a = 0.24 and b = 0.40 for June, July, and August, and a = 0.36 and b = 0.23 for the rest of the months.
As a reference basis, a growing period from 2010 to end of 2013 for black locust and from 2011 to end of 2014 for poplar was simulated. The resulted values for the modelled tree woody biomass were validated against the measured values in order to test the applicability of the Yield-SAFE model to simulate and subsequently project the tree woody biomass production under various prospective weather conditions. The performance of the model was evaluated visually by comparing the measured and modelled tree woody biomass, as well as by the normalized root-mean-square error (NRMSE), the coefficient of determination (R2), and the bias function of the modelled woody tree biomass.
For comparison purposes, the projected timeframe 2015–2054 was divided into ten hypothetical four-year growing periods under the assumption that shoots and seedlings were replanted at the beginning of each growing period in the same system and under the same management and soil conditions. Accordingly, the trees were assumed to grow within the characteristics of a first rotation. This was implemented in the Yield-SAFE model by reducing the above-ground biomass and number of shoots to their initial values every four years (similar to pruning).
2.4. Prospective Climate Change
Once validated, the Yield-SAFE model simulated the tree woody biomass production under prospective weather conditions from the statistical regional climate model Statistical Analogue Resampling scheme (STAR, scenario STAR 2K) [32,33].
STAR generates daily time series of meteorological variables by stochastically resampling segments of daily observations at climate stations. The resampling is conditioned by a predefined air temperature increase. The scenario STAR 2K assumes a linear increase of the mean annual temperature of 2K from 2000 to 2055 [16,33]. Under the assumption that the relationships between meteorological variables will persist in the future, the scenario is associated with decreases of the mean annual precipitation in the wider region of the experimental site of interest for this study. In a comparison study on the Lusatian river catchments of Spree, Schwarze Elster, and Weißer Schöps in North-Eastern Germany [48], the outcomes of STAR have been evaluated as warm and dry, compared to results of dynamic regional climate models, such as REMO or CCLM. STAR has been widely applied as climate input to simulate potential climate change impacts on hydrology and plant growth [24,49].
We performed model simulations driven by air temperature, global radiation, and precipitation of 100 realisations of STAR 2K for the time period from 2015 to end of 2054, with respect to the vegetation period of both tree species, and taking into consideration a first rotation lasting four years.
Consequently, the 100 realisations were adjusted given the specific vegetation period of each tree species and classified according to their intent as follows: identifying realisations with minimum, mean, and maximum (1) average precipitation sum and (2) mean temperature values for the timeframe 2015–2054 compared to 1974–2014, as a base period, and analyzing the correspondences with the tree woody biomass; identifying realisations with minimum and maximum (3) average precipitation sum and (4) mean temperature values with respect to the ten hypothetical four-year growing periods, and analyzing the correspondences with the tree biomass; (5) identifying the main realisations that rendered minimum and maximum woody biomass after each of the ten growing periods; and (6) identifying realisations that rendered minimum and maximum woody biomass increments over the 2015–2054 timeframe.
3. Results
3.1. Observed Woody Biomass Productivity of Poplar and Black Locust Trees
The dry woody biomass observations showed considerable differences between the tree species over the investigated four years of growth (Table 1). The tree sampling intensity was taken into consideration for the determination of the standard deviation and was chosen according to the diameter classes, which were estimated from year to year using the same methods, on the same field, and on the same tree species managed in the same way.
The growth difference between the two tree species in terms of woody biomass varied inter-annually, but after four years, poplar trees grew almost twice as much as black locust trees in terms of woody biomass. The standard deviations obtained for each year and with respect to the number of samples showed large differences, underlying the variability of observations.
3.2. Sensitivity Analysis of the Yield-SAFE Model
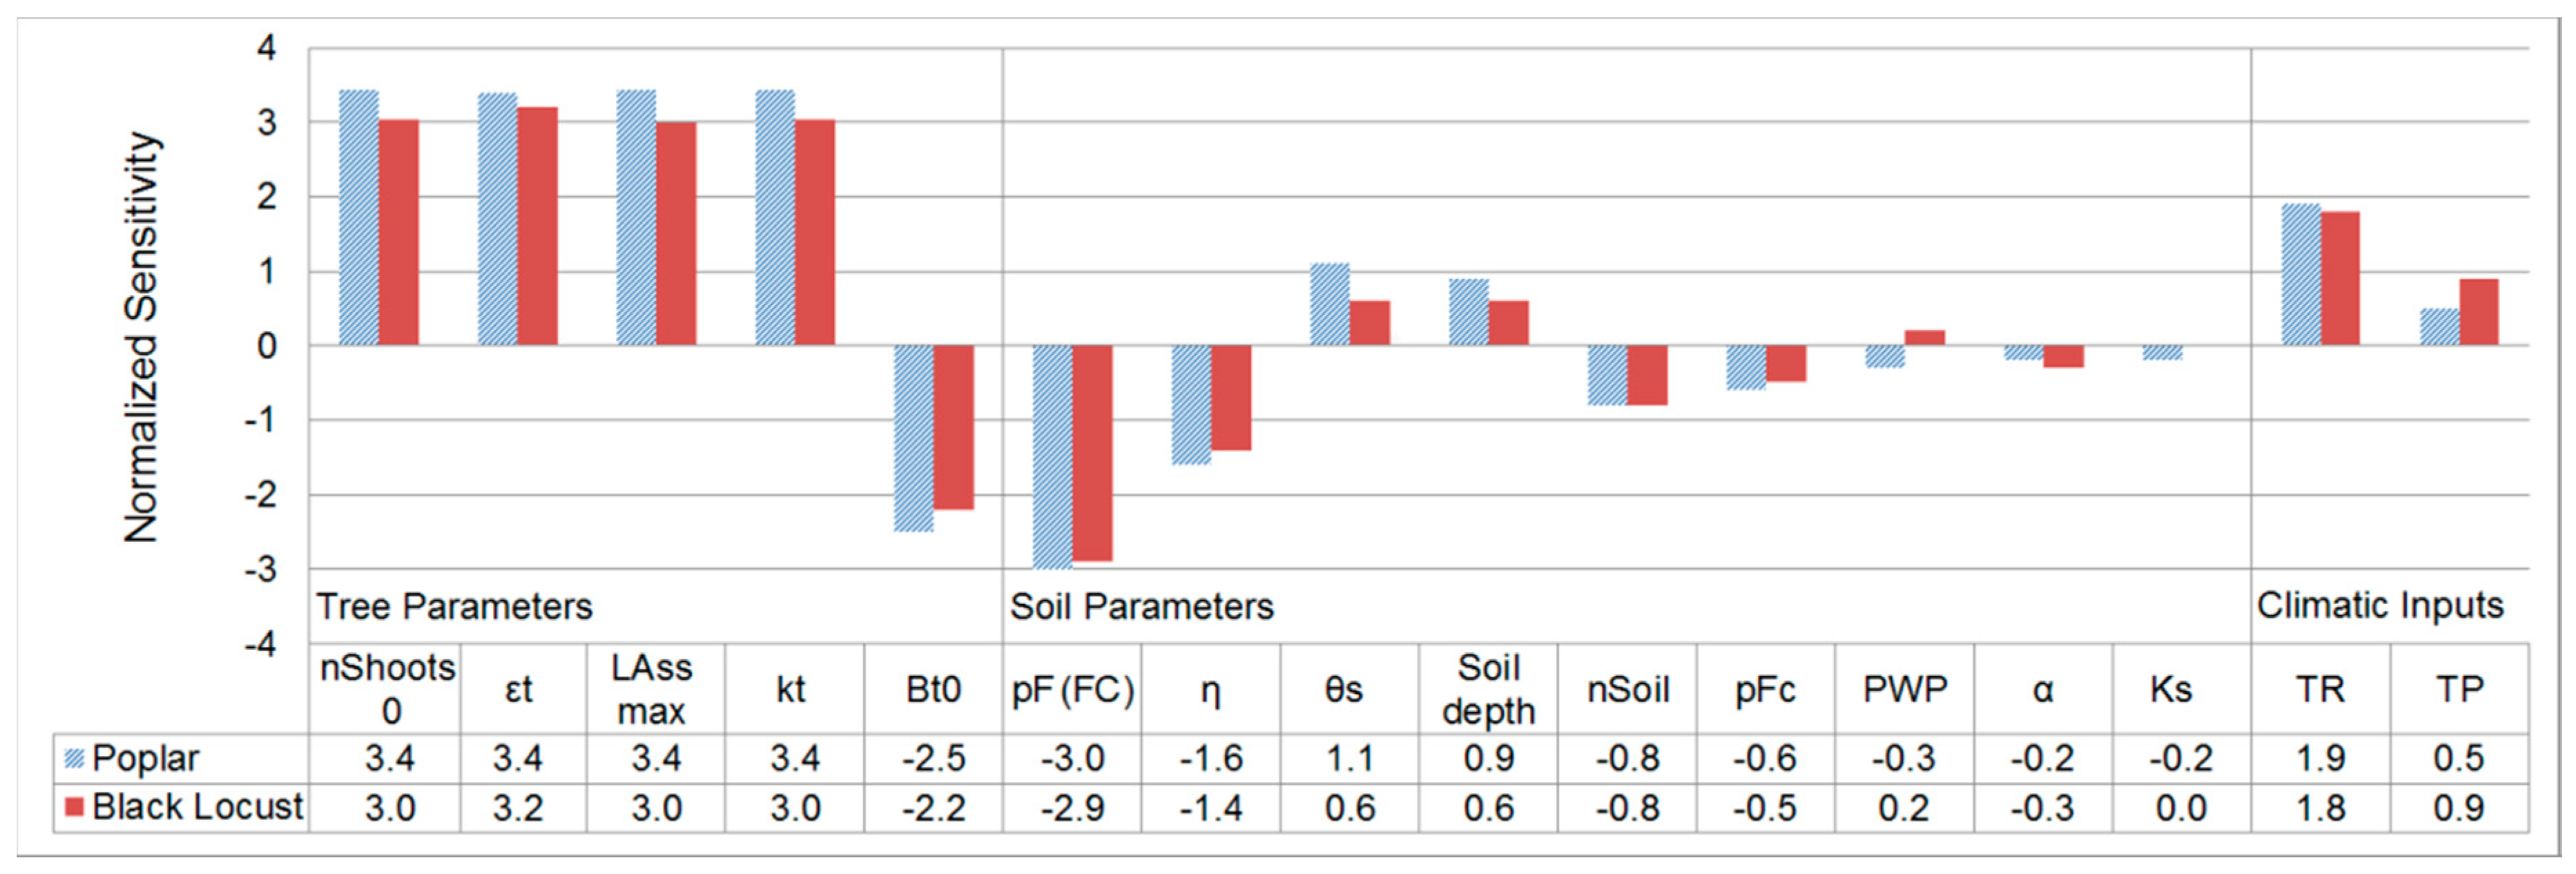
Parameters with an absolute value of the normalized sensitivity in the model output higher than 0.1 were considered as main influencing parameters and are presented in Figure 1. Conversely, all parameters with a normalized sensitivity <0.1 were considered as being of minor importance due to a comparably small influence on the model output and thus were not included in a deeper evaluation.
The model output displayed high sensitivities to the tree parameters: initial number of shoots (nShoot0), radiation use efficiency (εt), radiation extinction coefficient (kt), and maximum leaf area for a single shoot (LAssmax) in descending order. Dominant soil parameters in descending order were: pF value at field capacity (pF(FC)), potential evaporation (η), saturated volumetric water content (θs), and soil depth. Regarding the climate inputs, the modelled output was highly sensitive to global radiation (TR) and precipitation (TP) but unresponsive to changes in average air temperature, which had a null value. A negative normalized sensitivity value for a parameter indicated that an increase of the said parameter value would lead to a decrease in the modelled woody biomass. Conversely, a positive normalized sensitivity implied that an increase in said parameter would lead to an increase in the modelled woody biomass [41].
Minor important tree parameters were the time constant of leaf area growth after budburst until reaching maximum leaf area (tt), with a normalized sensitivity value of −0.1 and 0.0 for poplar and black locust, respectively, the maximum number of shoots (nShootmax), and the transpiration coefficient of the trees (γt), both of which had null values. The soil parameters that had a small influence on the model output were the residual volumetric water content (θr), with a normalized sensitivity value of −0.1 and 0.0 for poplar and black locust, respectively, the initial volumetric water content (θ0), and a factor affecting the drainage rate below the root zone (δ), both of which had null values.
3.3. Model Validation
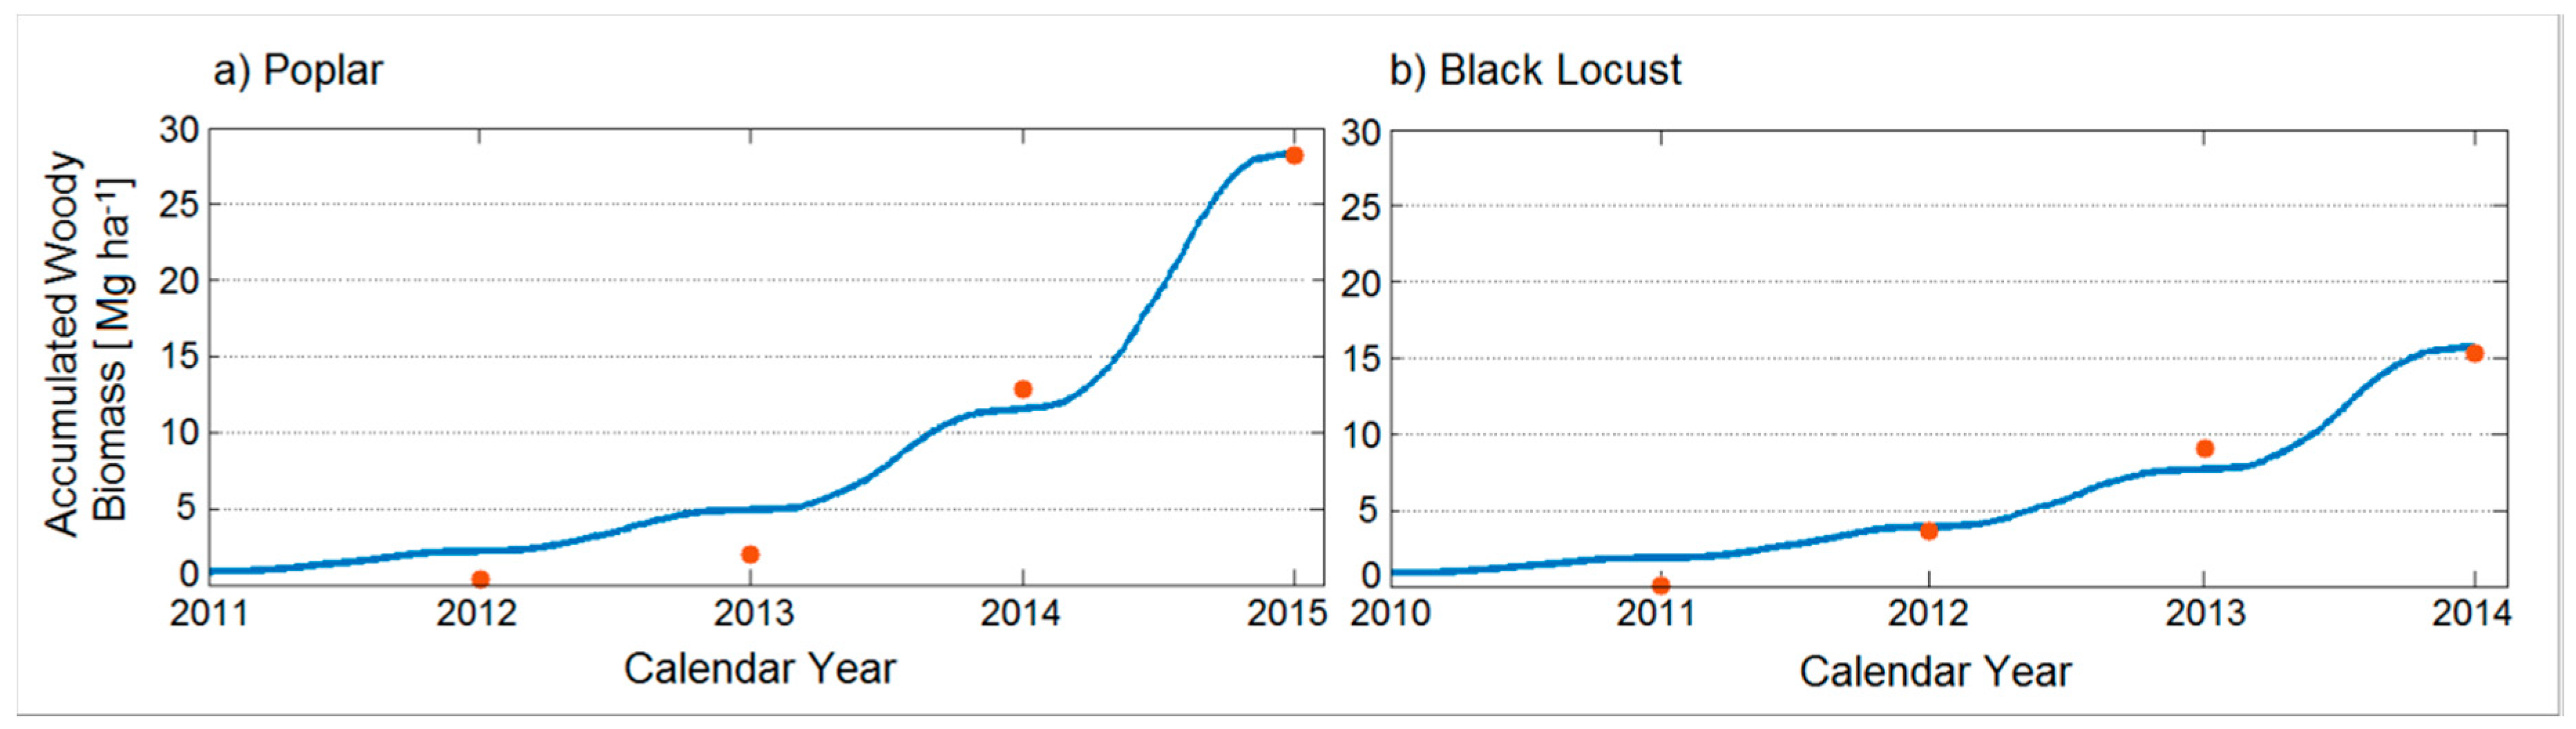
Concerning the above-ground tree woody biomass production accumulated after four years of growth, the Yield-SAFE model rendered good correspondences with the measured tree woody biomass (Figure 2).
The modelled tree woody biomass values accumulated during the four years of growth nearly matched the measured biomass values for both tree species, except for a higher deviation in the second growing year of poplar. However, at the end of the investigation period, the deviation of measured to modelled biomass values accounted for +0.3% for poplar and +2.8% for black locust, implying very small overestimations of modelled accumulated tree woody biomass.
The relative errors of the modelled fits were low (NRMSE values of 4.6% and 5.5% for the Yield-SAFE validations of poplar and black locust, respectively, always with a p value < 0.0001) and the fit was highly significant (R2 values of 0.99 and 0.97 for poplar and black locust, respectively).
3.4. Modelled Woody Biomass under STAR 2K Weather Realisations
3.4.1. A Forty-Year Comparison with Respect to the Average Precipitation Sum
Our analysis was performed with both varying precipitation and temperature values. Table 2 presents the categorized realisations in terms of minimum, mean, and maximum average precipitation sum and air temperature for the timeframe 2015–2054 compared to the values for the timeframe 1974–2014, which served as a base period in this study, and with respect to the vegetation period of each tree species. In order to gain a deeper insight into the chosen realisations, Table 2 provides the values for both precipitation and air temperature, the subsidiary value being starred below the values of interest.
The average precipitation sum during the vegetation period of the base period corresponded to the maximum values indicated by the projected time period in the case of both poplar and black locust. This would suggest that, taking into account all 100 realisations over a forthcoming timeframe of forty years, a maximum of 2.5 mm more precipitation would be achieved in the vegetation period of poplar and only 0.8 mm less in the vegetation period of black locust. The long-term average precipitation of the realisations representing mean values is about 10% lower than the base period (28 mm in case of poplar, 33 mm in case of black locust). Also, it was noticed that the values for the average precipitation sum were revealed by different realisations for the two considered tree species, which made the usage of vegetation periods specific to each tree species relevant. The long-term average precipitation in the vegetation period for the driest realisation, R13, is approximately 20% lower than the average of the base period (poplar: 70 mm, black locust: 65 mm).
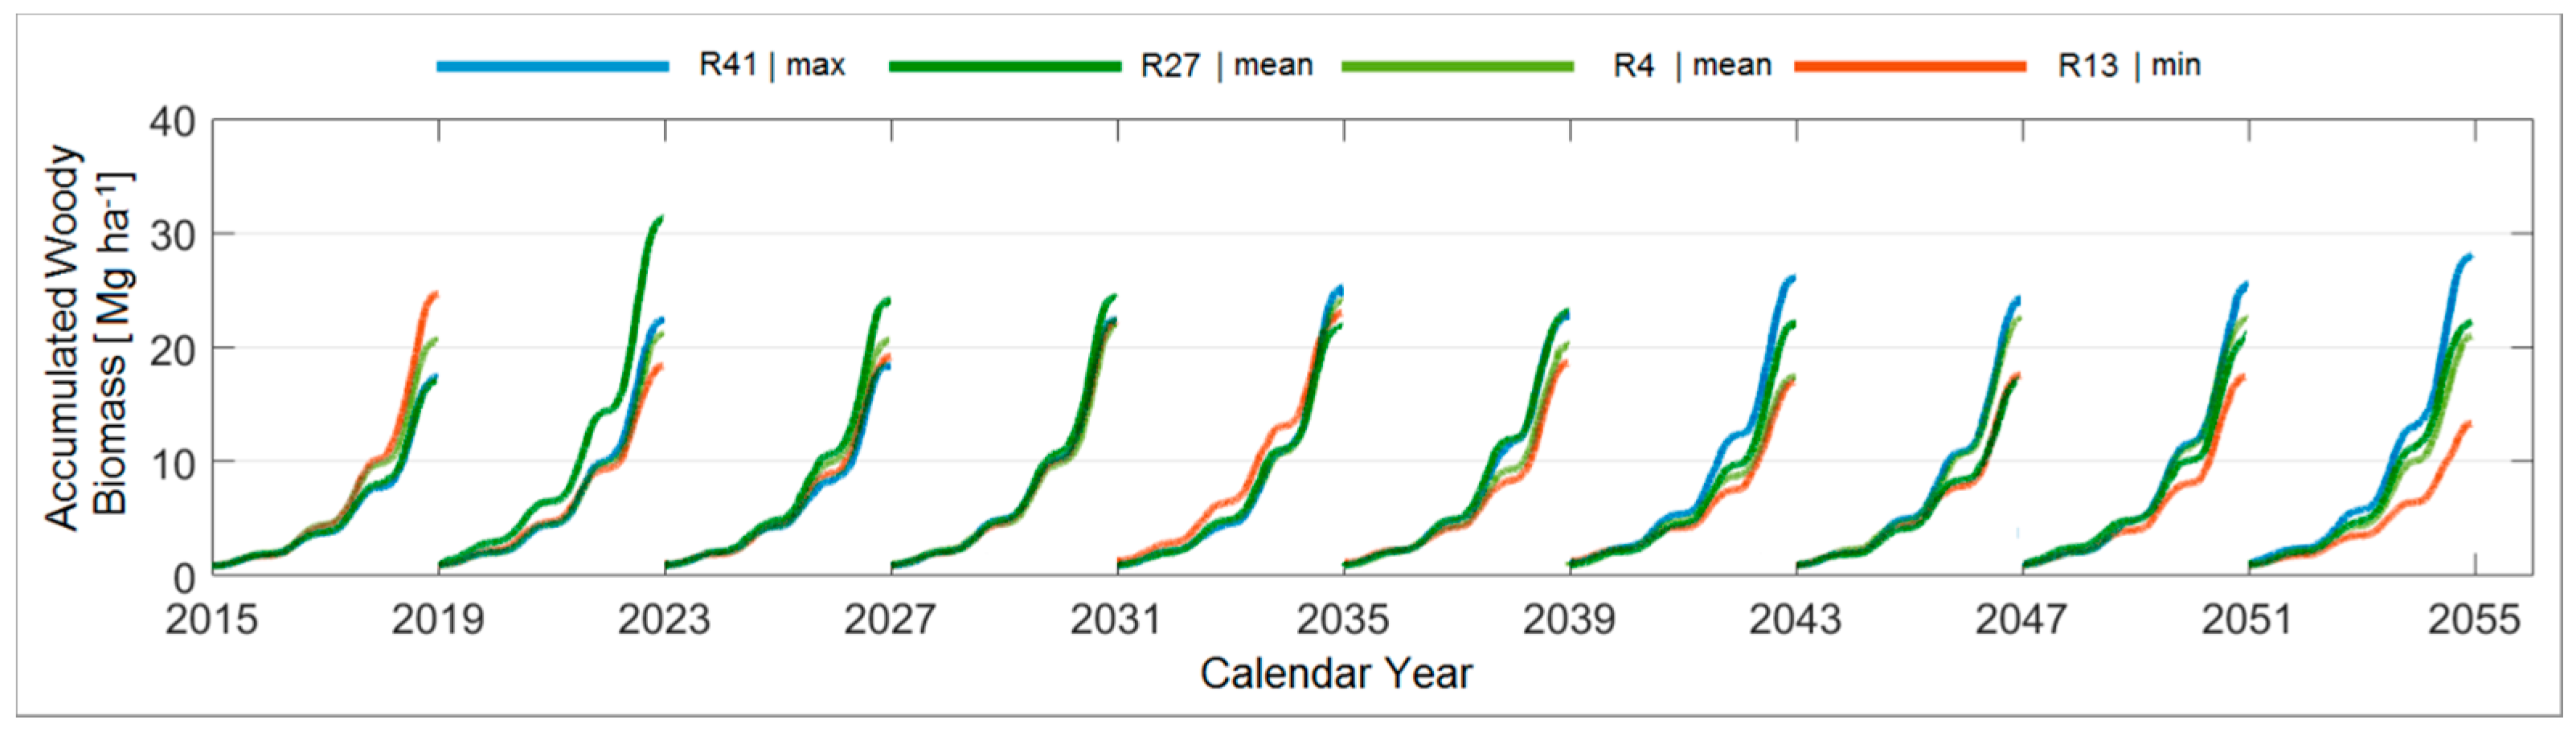
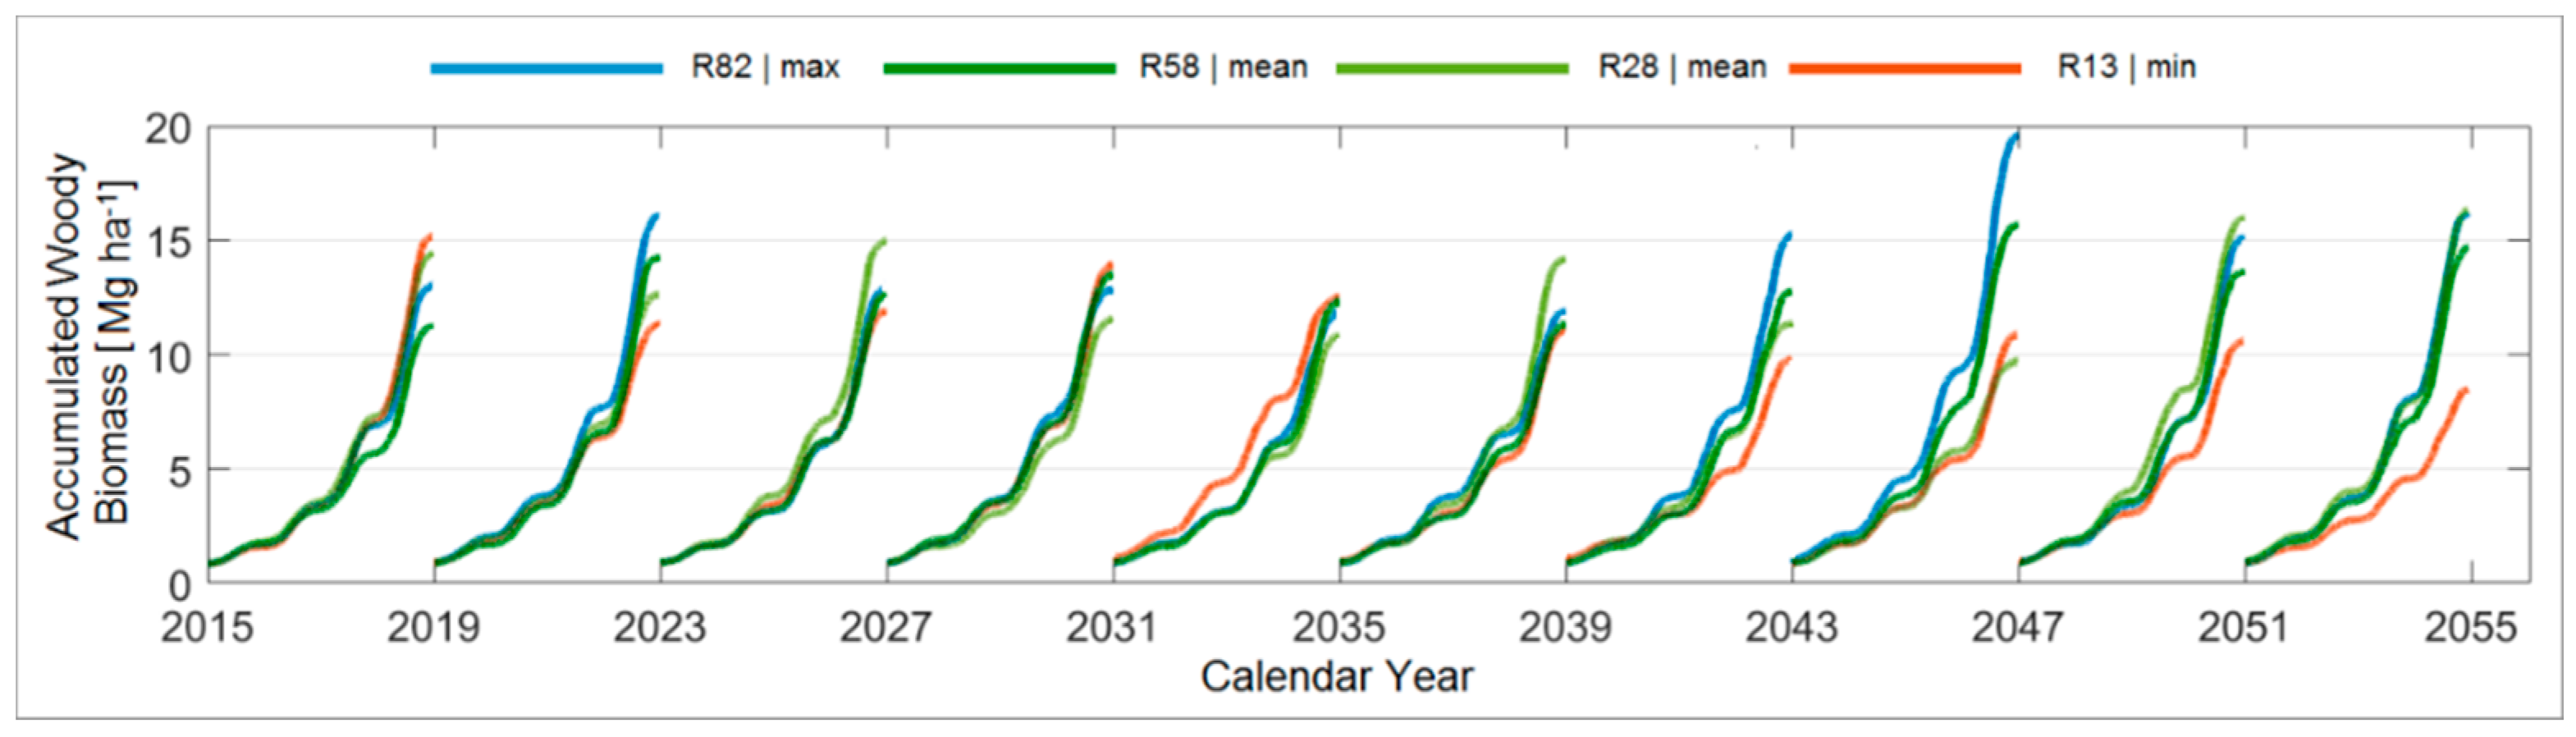
Simulations of tree growth under the aforementioned realisations with minimum, mean, and maximum average precipitation sum values were performed in terms of woody biomass for poplar (Figure 3) and black locust (Figure 4) in order to visually analyze the correspondences with the tree woody biomass accumulated after four years of growth.
While it could be generally said that a lack of precipitation leads to lower woody biomass and that a higher amount of precipitation leads to a higher woody biomass accumulated in four growing years, it was not always the case. Realisation 13, for example, had the lowest average precipitation sum in the forty-year timeframe but rendered the maximum accumulated biomass in the first period (2015–2018) for both tree species as well as in the fourth (2027–2030) and fifth period (2031–2034) for black locust. This result implied that in order to find a clear correlation between a climatic input and the production of tree woody biomass, the established growing periods or even the individual vegetation periods should be evaluated.
3.4.2. A Forty-Year Comparison with Respect to the Mean Temperature
The mean temperature during the vegetation period of the base period (poplar: 16 °C, black locust: 15.3 °C) was 1.2 °C lower than the mean values and 1.5 °C lower than the maximum values indicated by the 100 realisations under the projected time period, in the case of both poplar and black locust (Table 2). Also, it was noticed that the values for the mean, minimum, and maximum temperature were revealed by different realisations each for the two considered tree species, which made the usage of vegetation periods specific to each tree species relevant.
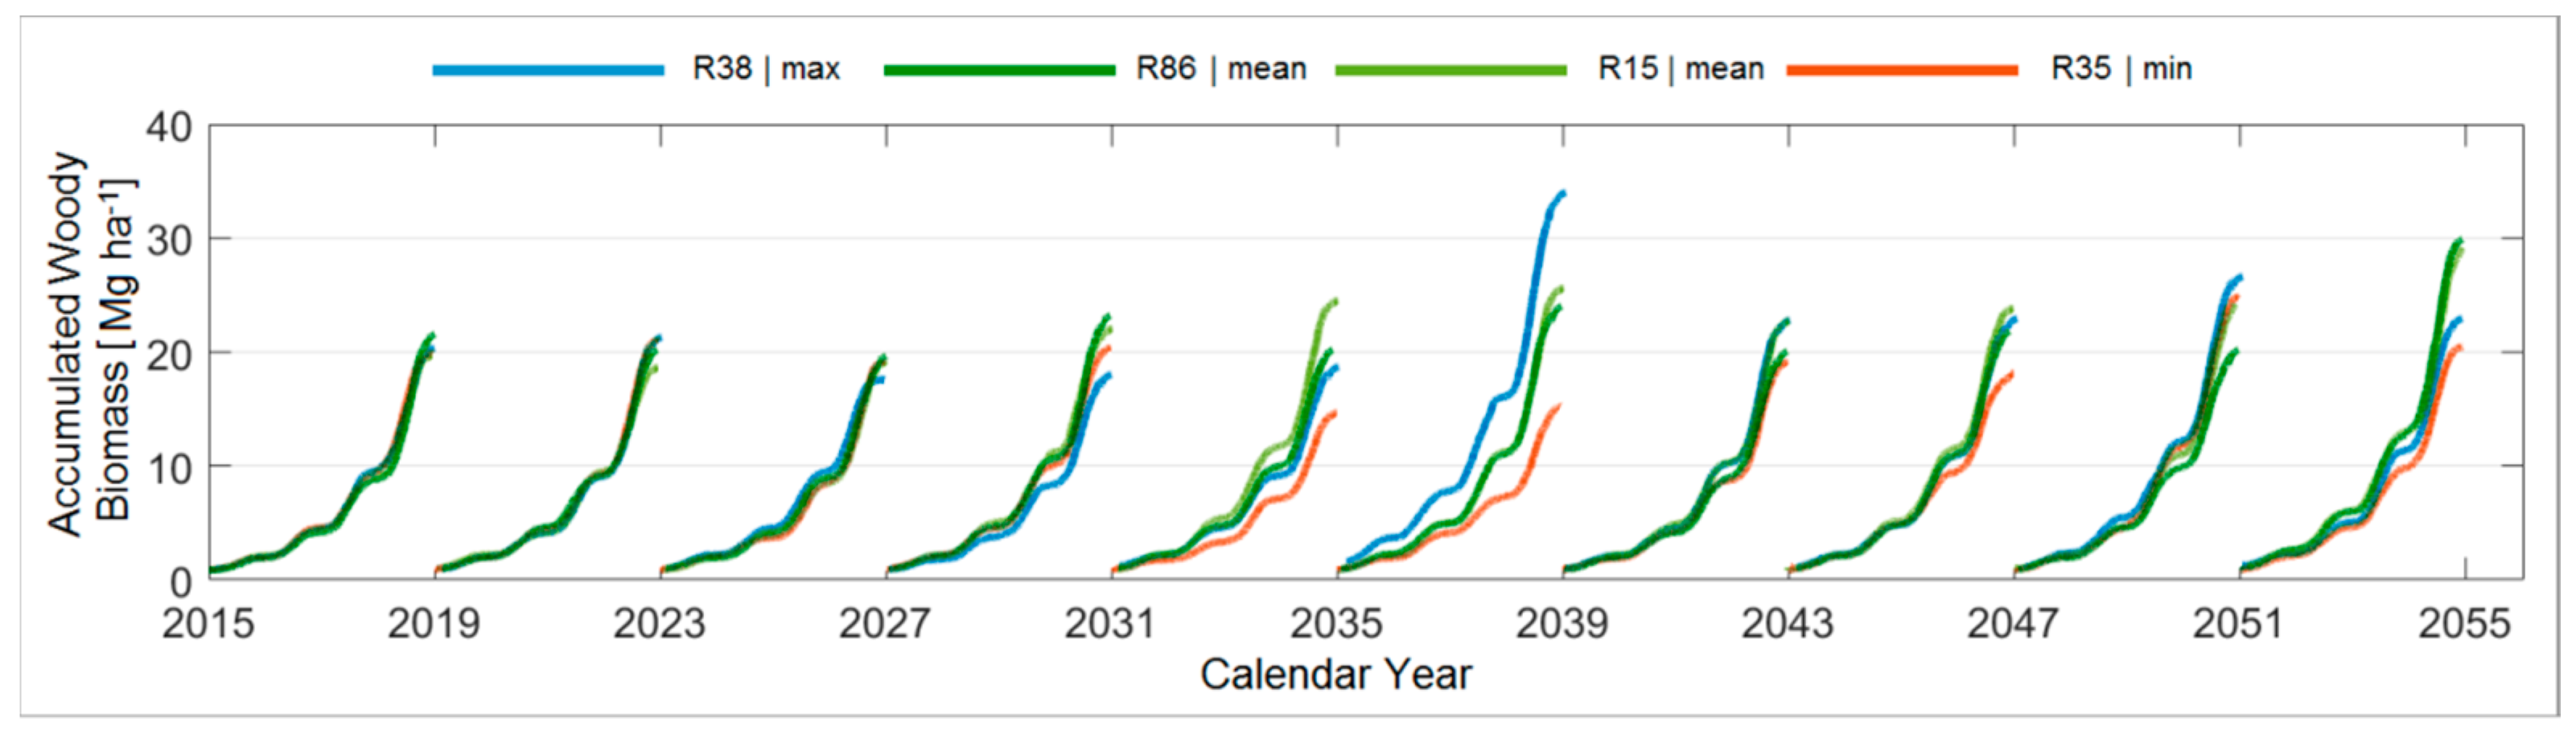
Consequently, simulations of tree growth under aforementioned realisations with minimum, mean, and maximum mean temperature values were performed in terms of woody biomass for poplar (Figure A1) and black locust (Figure A2) in order to visually analyse the correspondences with the tree woody biomass accumulated after four years of growth.
For poplar, it seemed that medium average temperature values during the vegetation period rendered the highest woody biomass, with the exception of the sixth period (2035–2038), where the realisation with a maximum value for temperature also achieved a maximum accumulated woody biomass.
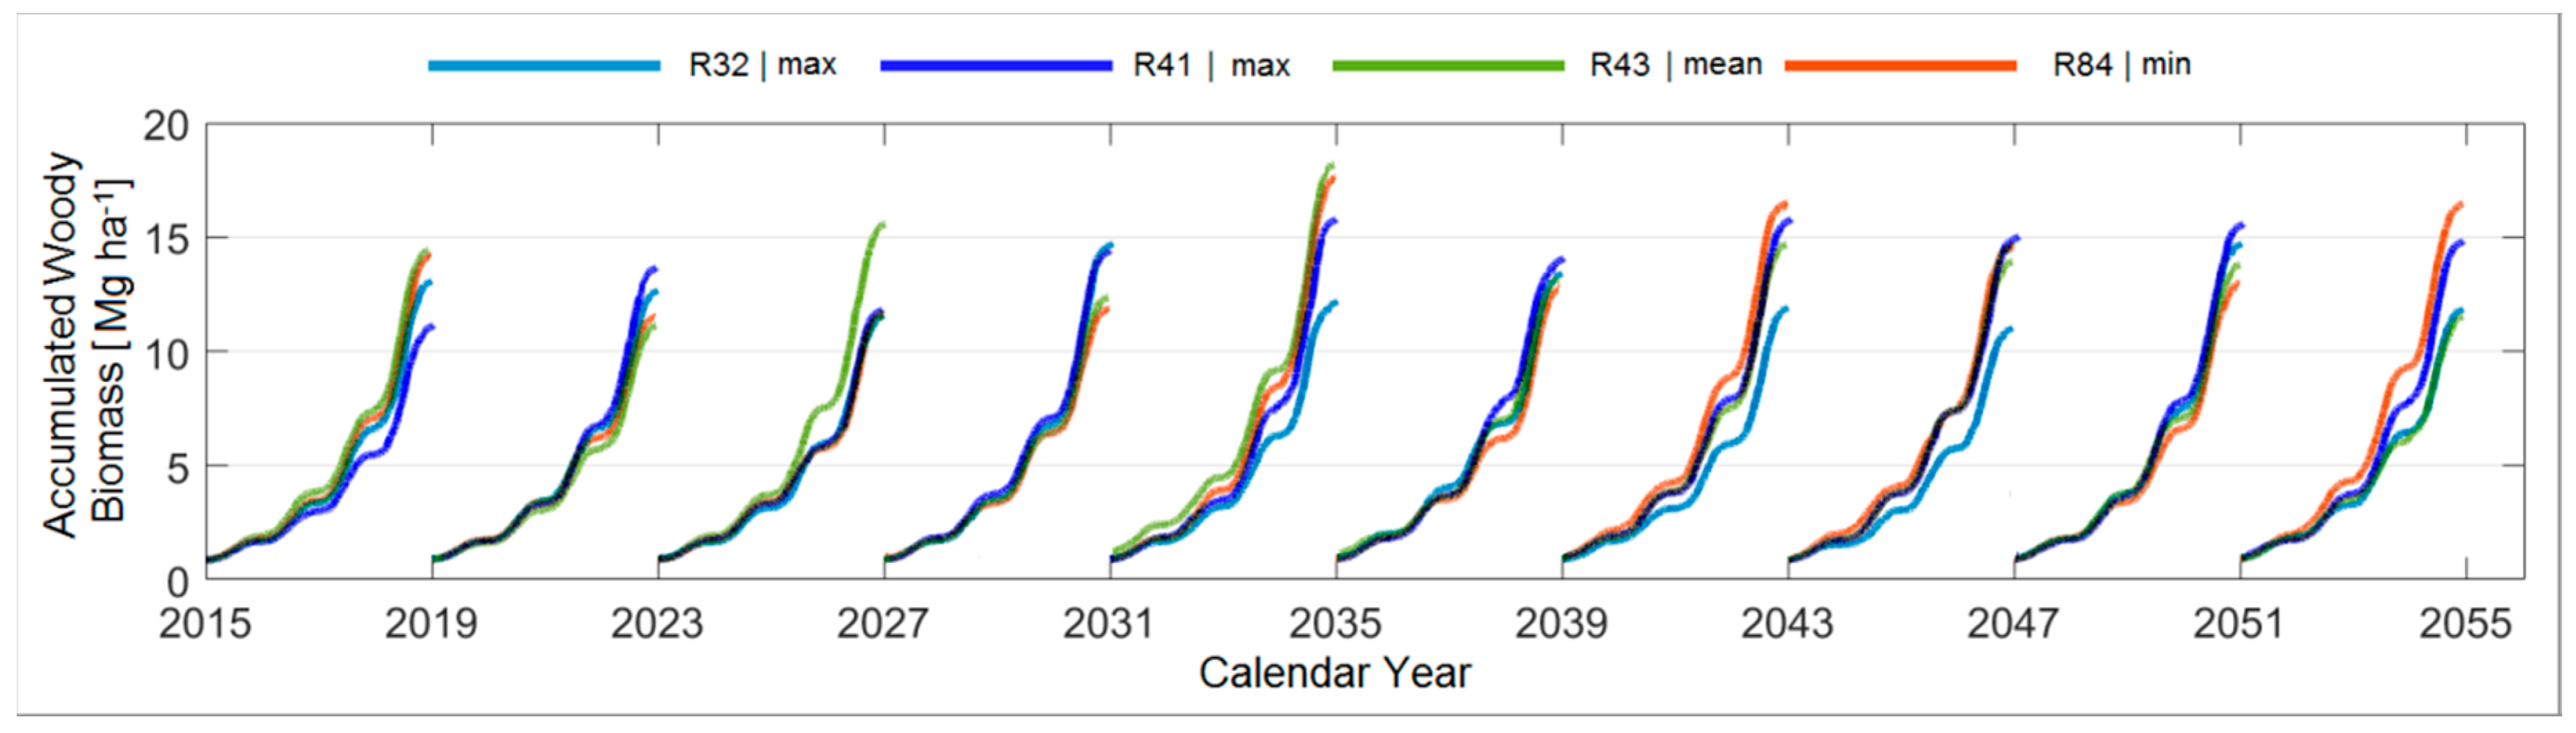
Generally, the results showed that extremities in mean temperature rendered lower accumulated woody biomass. For black locust, there seemed to be no explicit pattern correlating mean temperature with the production of tree woody biomass, as the highest woody biomass was achieved in different periods by realisations rendering both extreme and mean temperature values.
3.4.3. Comparison between the Ten Year Growing Periods in Terms of Average Precipitation Sum
In this step, ten hypothetical four-year growing periods from 2015 to 2054 were simulated under the assumption that shoots and seedlings were replanted at the beginning of each growing period, in the same system, and under the same management and soil conditions. Accordingly, two reference periods were created in terms of average precipitation sum, mean temperature, and global radiation accounting for the distinct vegetation period and planting year of poplar (2011) and black locust (2010) trees.
The main realisations with minimum and maximum values for the average radiation sum, precipitation sum, and temperature for the established growing periods from 2015–2054 are presented in Table A2 with respect to the vegetation period of each tree species.
A directly proportional relationship can be noticed between the average radiation sum and the mean temperature, as averaged over the vegetation period.
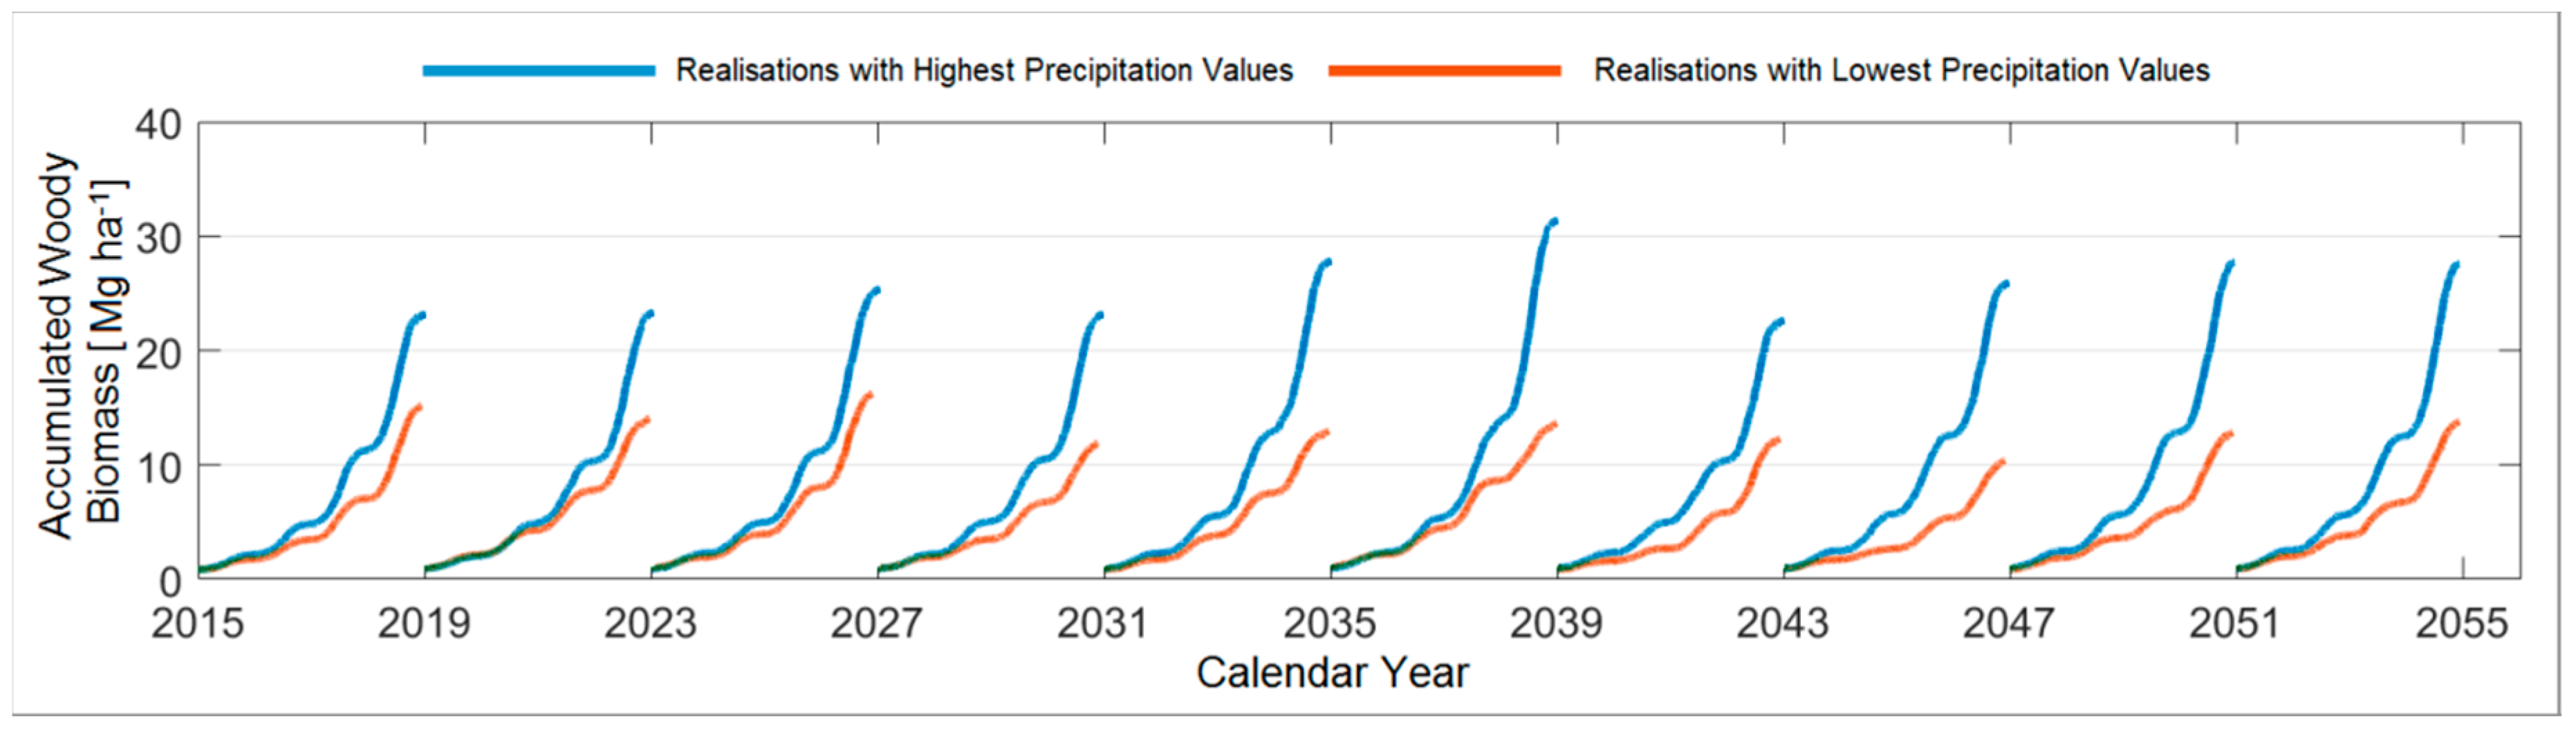
Subsequently, four compound-realisations were created by using realisations that rendered either a minimum or a maximum average precipitation sum in the given growing period. For example, the first compound-realisation, which contained the highest precipitation values for poplar, was made by putting together R31, R7, R43, R41, R98, R96, R60, R10, R78, and R39, from the first period (2015–2018) to tenth period (2051–2054), respectively. Simulations were carried out under these four compound-realisations for poplar (Figure 5) and black locust (Figure 6).
A strong, directly-proportional correlation between the average precipitation sum and the woody biomass accumulated after four years of growth was noticed for both tree species. However, even if the base period for both tree species had an average precipitation sum lower than any of the maximum values found for the projected periods, the accumulated biomass after four years of growth was sometimes higher in the base period than in the projected timeframes.
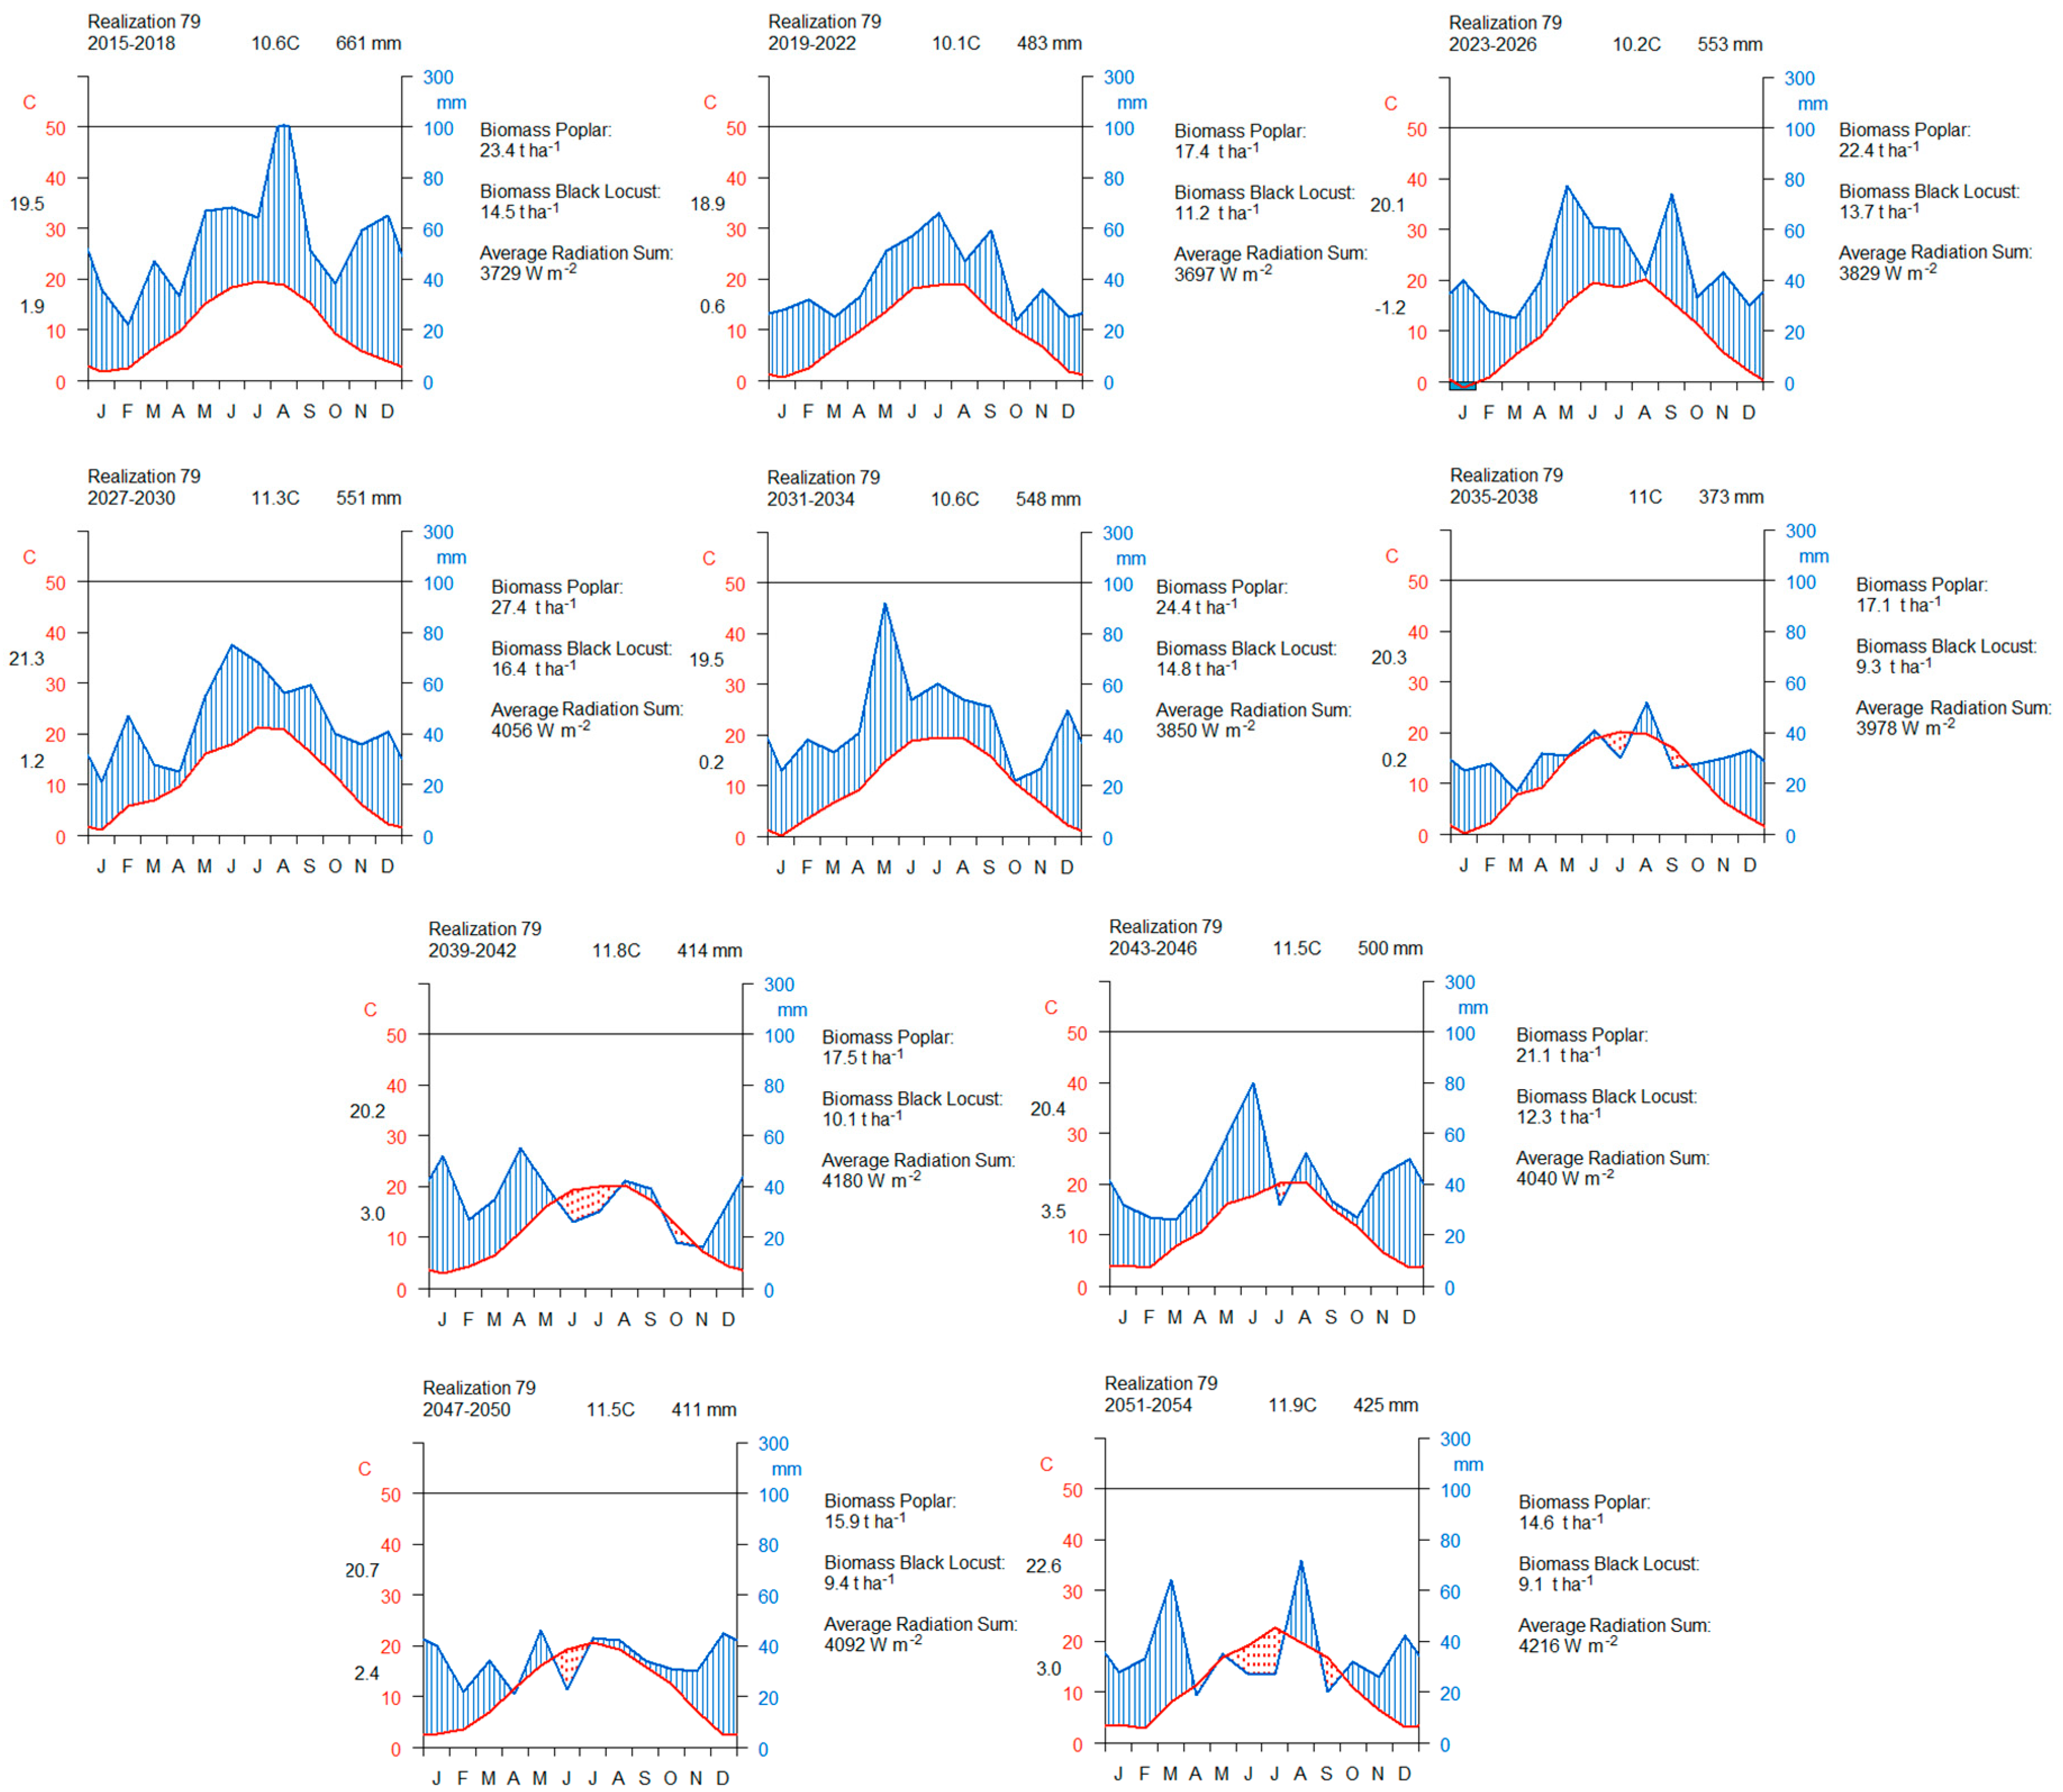
Additionally, it was noticed that R79 has a strong intra-annual variability of precipitation shown by a shift between the minimum and maximum values for precipitation over the vegetation period. However, this realisation does not seem to render marginal values for accumulated tree biomass, except for black locust, in period 6 (2035–2038). Therefore, a compilation of climographs was made for realisation 79 with respect to the established growing periods and according to the vegetation period (Figure A3). The average radiation sum and the accumulated biomasses for both tree species were added for comparison purposes.
Regarding the mean monthly temperature, it seemed that those growing periods with a warm April (≈12 °C) rendered lower biomass values than those periods that had a colder April (≈9 °C). This happened perhaps due to late April frosts that can affect tree growth. Alternatively, no strong influence of mean temperature on the accumulated tree biomass could be seen over the years. Concerning the average monthly precipitation, meaningful shifts were noticed, especially between earlier growing periods (2015–2018) and later growing periods (2047–2050). Accumulated tree biomass also seemed to have a noticeable increase in those periods where precipitation was high between May and July. The average radiation increased from period to period, albeit without enhancing the projected biomass.
3.4.4. Comparison between the Ten Year Growing Periods in Terms of Mean Temperature
Similarly to Section 3.4.3, four compound-realisations were created by using realisations that offered either a minimum or a maximum mean temperature in the given growing period (Table A2). The tree growth was simulated in terms of woody biomass under these four compound-realisations for poplar (Figure A4) and black locust (Figure A5).
3.4.5. Comparison between the Ten Year Growing Periods in Terms of Accumulated Woody Biomass
Table 3 presents the minimum and maximum woody biomass accumulated after four growing years for both tree species, with respect to the established growing periods, and together with their corresponding realisation.
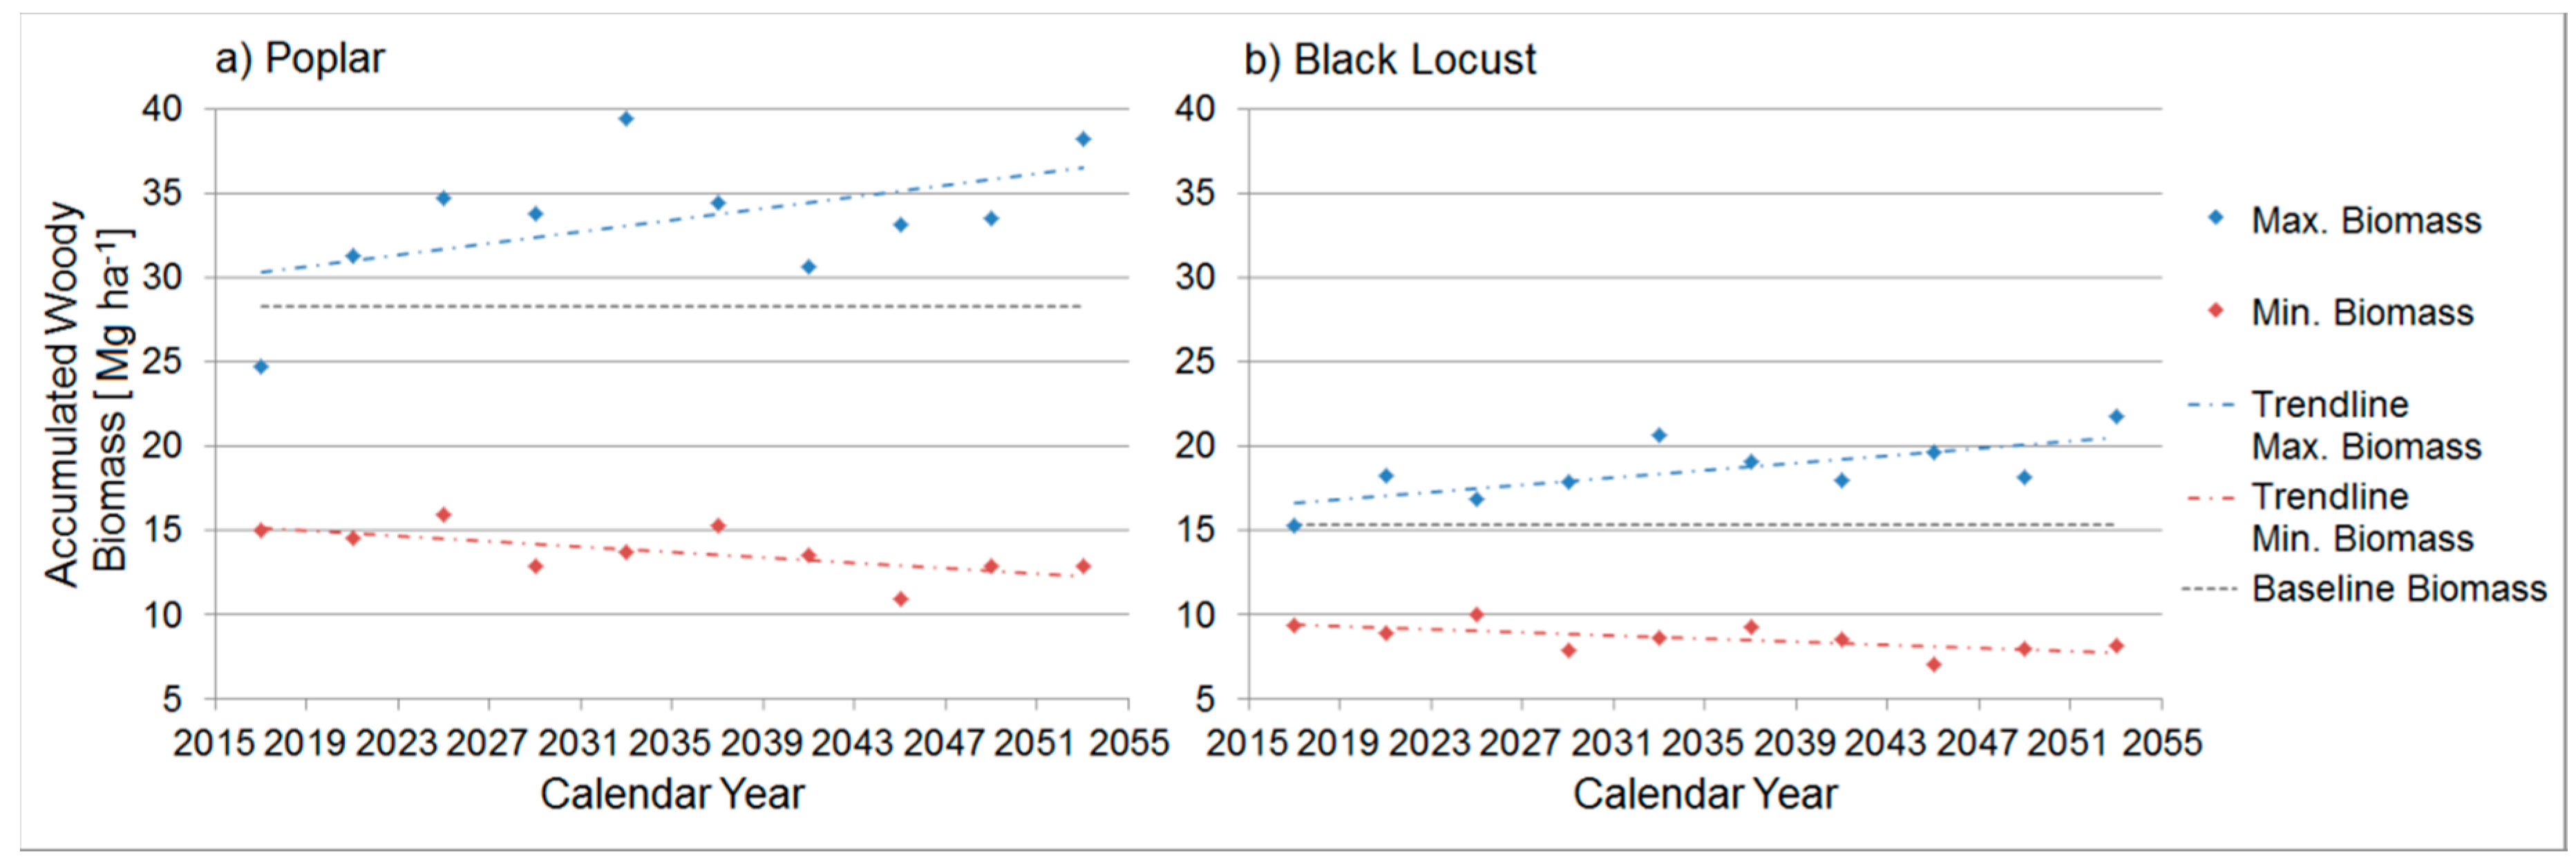
According to these results, Figure 7 was created for poplar and black locust, respectively, as a bandwidth of accumulated woody biomass from all realisations from 2015 to the end of 2054.
An initial decrease in accumulated woody biomass was noticed between the reference and the first projected period for both tree species. However, this was expected, as the realisations that rendered maximum values for accumulated biomass (R13 and R51 for poplar and black locust, respectively) had lower average values than those of the reference period for all climatic inputs.
Following the trend lines of biomass increase for poplar, it could be said that in the most optimistic case, an increase of about 10 Mg ha−1 (35%) would be achieved in the last period (2051–2054) compared to the reference period and in the most pessimistic case a decrease of about 15 Mg ha−1 (54%). For black locust, the accumulated woody biomass in the last period would be subjected to either an increase of about 7 Mg ha−1 (43%), in the most optimistic case, or a decrease of 7 Mg ha−1 (47%), in the most pessimistic case. However, when accounting for the variability of observations, the simulations showed that the assumed climate change could lead to a decrease in the median woody biomass accumulated in the last period of about 5 Mg ha−1 (18%) for poplar and 1.7 Mg ha−1 (11%) for black locust trees with respect to the median observed in the reference period.
Additionally, it was noticed that in the first period (2015–2018), the maximum accumulated biomass of poplar was given by realisation R13 (biomass value of 24.7 Mg ha−1; average radiation sum of 3284 W m−2), whereas the maximum precipitation input for the first period is given by realisation R31 (biomass value of 23.2 Mg ha−1; average radiation sum of 3023 W m−2). In order to establish what other climatic factors were involved in the tree woody biomass production, Figure A6 was created.
As also observed in Figure A3, the accumulated tree woody biomass seemed to have a noticeable increase in those periods where precipitation was high between May and July. Also, the average monthly radiation sum was significantly higher in realisation R13 than R31 with respect to the vegetation period, except for 2017, where values dropped slightly behind for realisation R13 than R31. Likewise, the average monthly temperature was significantly higher in realisation R13 than R31 with respect to the vegetation period, except for 2017, where values dropped slightly behind for realisation R13 than R31.
3.4.6. Comparison between the Ten Year Growing Periods in Terms of Woody Biomass Increment
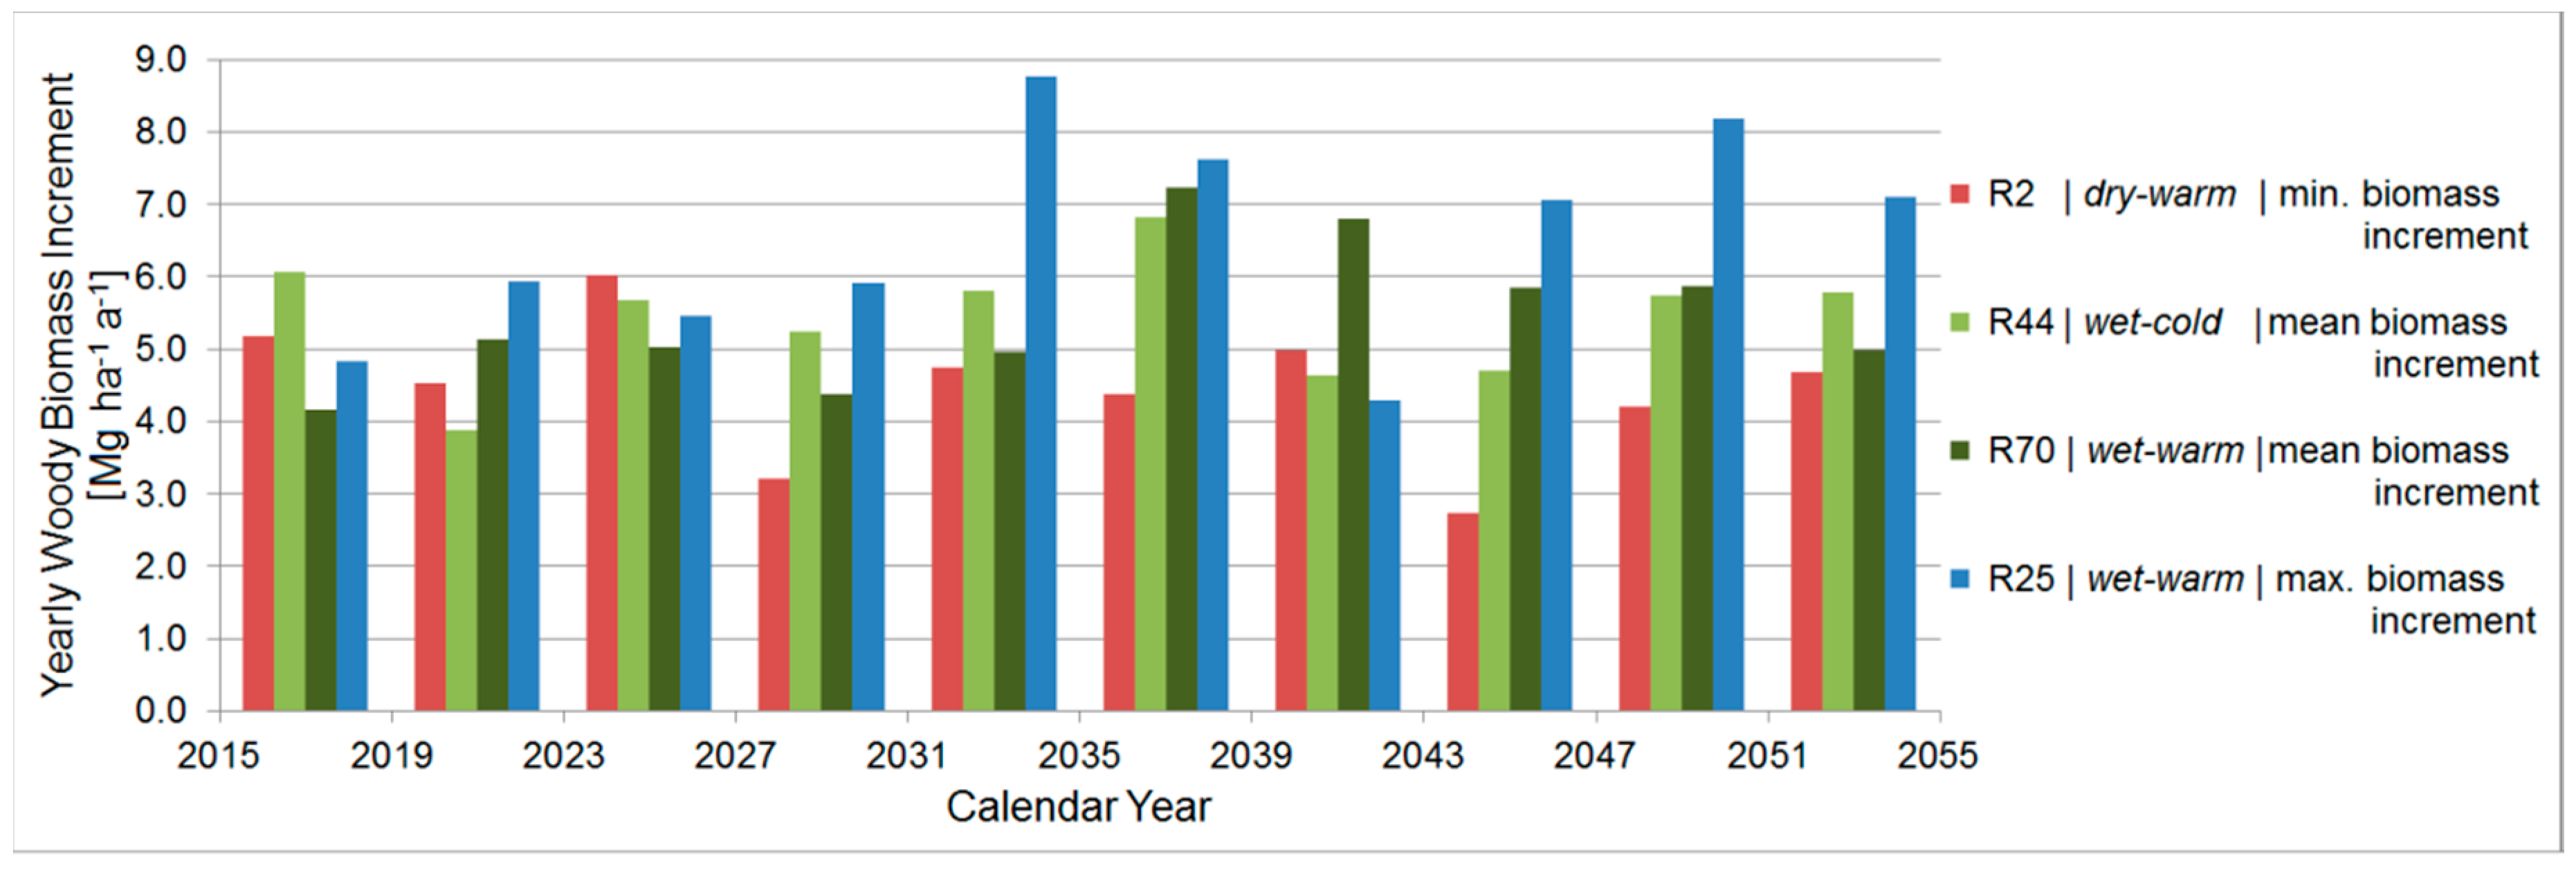
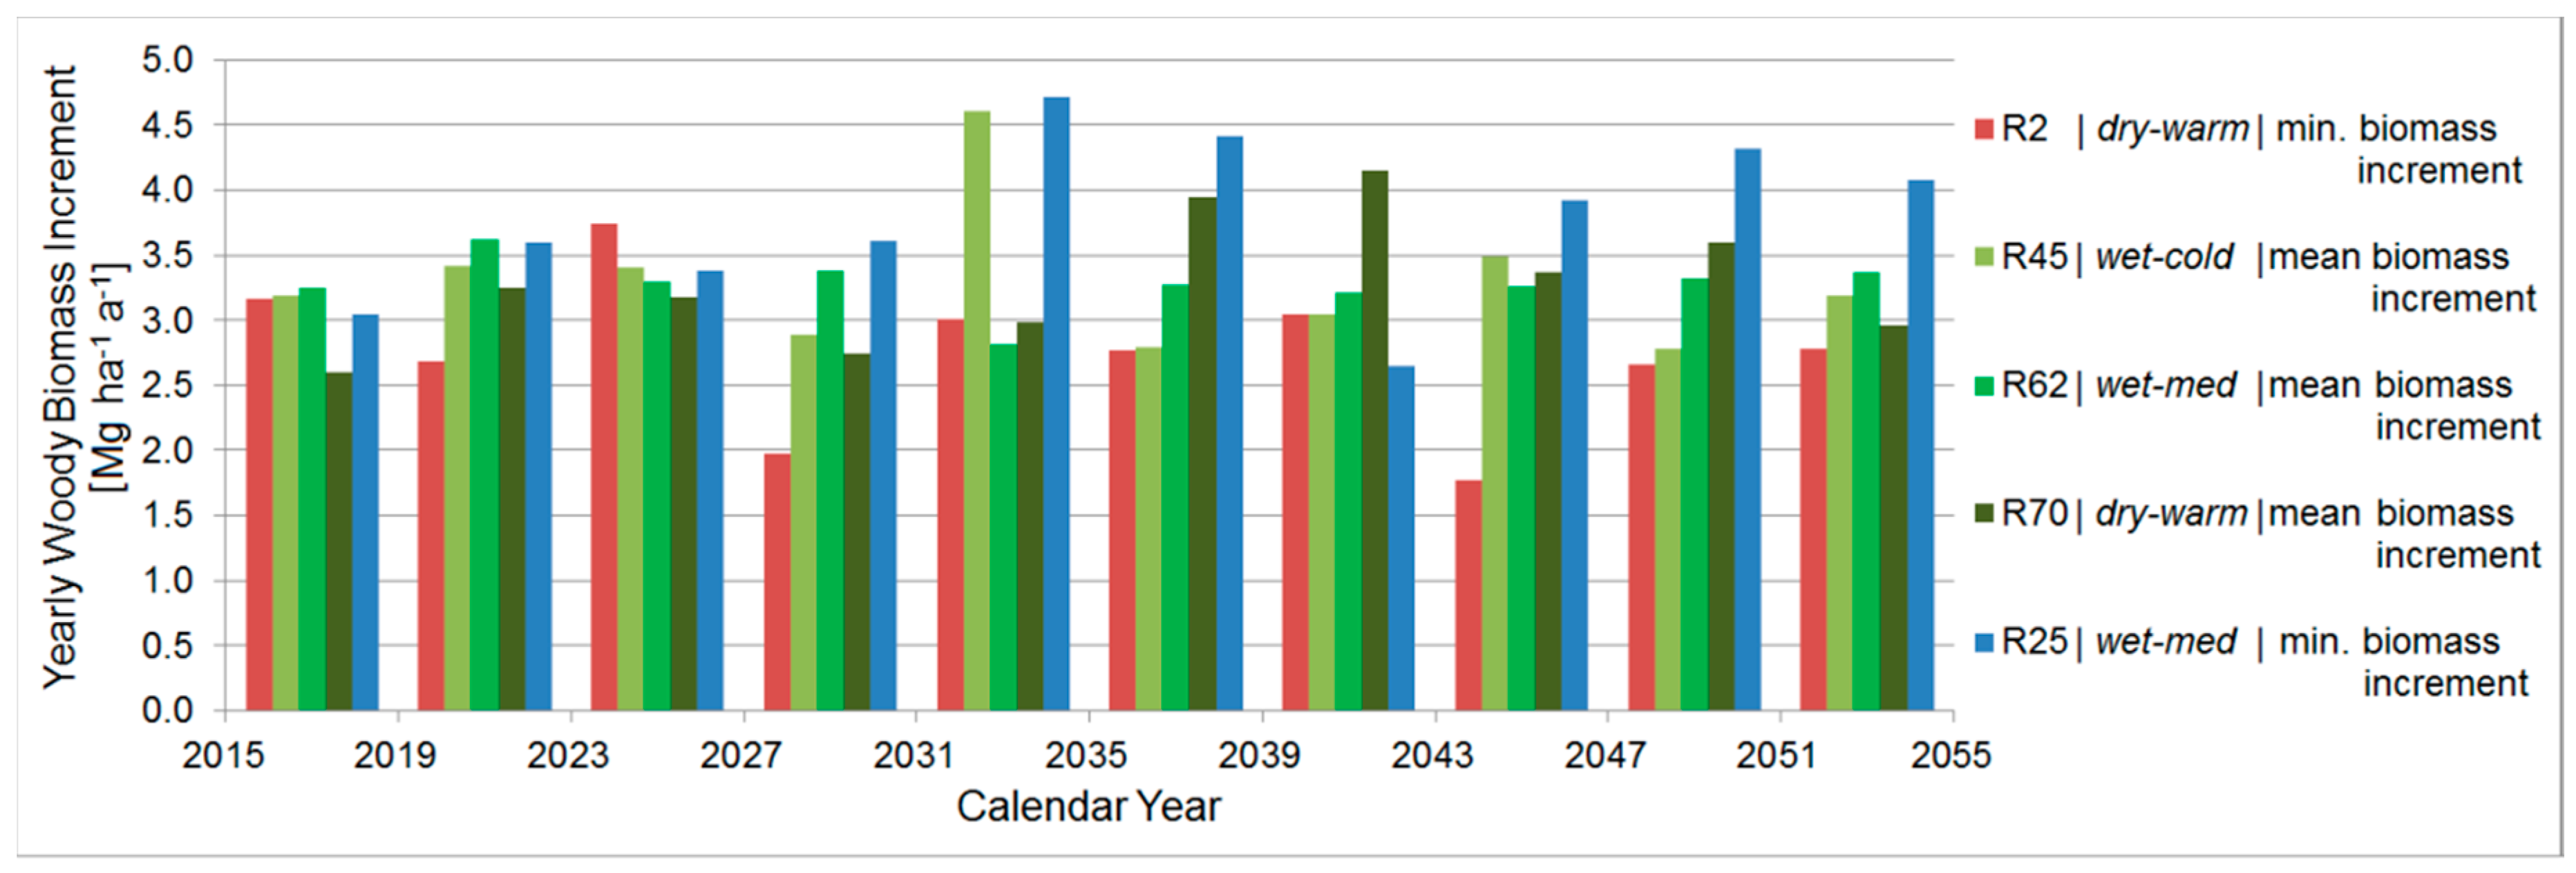
The minimum and maximum woody biomass increments for both tree species under a timeframe of forty years are presented in Table 4, together with their corresponding realisation. Taking into consideration the average values for precipitation and temperature of all realisations under the entire projected timeframe of forty years, an overall mean temperature and precipitation sum were established and highlighted.
Furthermore, labels were given to the realisations presented in Table 4 by comparing their average annual precipitation and temperature values with those values obtained for the entire projected timeframe from 2015 to the end of 2054. Consequently, R2 was regarded as dry-warm for both tree species, R44 as wet-cold, R45 as wet-cold, R70 as wet-warm for poplar and dry-warm for black locust, R62 as wet-medium, and R25 as wet-warm for poplar and wet-medium for black locust. The yearly woody biomass increments were projected for poplar (Figure 8) and black locust (Figure 9) trees under these realisations with respect to the ten established growing periods.
The empirical data for the yearly woody biomass increment, regarded as the reference period values, were significantly higher than the maximum values achieved under the timeframe of forty years. However, given the established growing periods, an increase in biomass increment was noticed after the fifth period. For poplar, this increase exceeded the reference period value with merely 1.7 Mg ha−1 a−1 (24%), whereas for black locust it decreased with at least 0.6 Mg ha−1 a−1 (11%). Regarding the mean temperature obtained for the given growing period, it seemed that realisations labelled as both cold and warm rendered minimum, medium, and maximum biomass increments.
4. Discussion
The results of this study corroborated the growth vulnerability of poplar and black locust trees in terms of woody biomass to prospective climate change and particularly to changes in water availability. Similar results were obtained by Weemstra et al. [50], who found that summer drought decreased tree growth of ten deciduous tree species at an experimental forest setting in The Netherlands. Using climate-tree-growth relationships for study sites in Mecklenburg-Vorpommern, north-eastern Germany, Scharnweber et al. [51] have identified a strong dependency of growth of common European beech (Fagus sylvatica L.) and pedunculated oak (Quercus robur L.) on water availability, especially during early summer. Comprehensive studies were conducted with Populus and Salix in field experiments for short-rotation forestry and for breeding of clones [28,29].
In contrast to the previous tree species, information about the implication of environmental and climatic factors on the growth performance of black locust is rare. As a pioneer tree, black locust is regarded as a drought-adapted tree species, showing high morphological and physiological plasticity and therefore, it is planted even in regions with annual precipitation sum values below 600 mm a−1 [52]. Subjected to water limitation, the leaf area of black locust reduces drastically in order to minimize transpiration, although affecting the growth performance [53,54], whereas the production of nodules for biological nitrogen fixation increases in order to overcome the limitation of nitrogen uptake from the soil [55].
Field investigations at our study site in Neu Sacro during a summer heat period in 2015 indicated that both poplar and black locust tree species maintained a high photosynthesis and growth performance under maximum daily temperatures of 30–34 °C due to the fact that water uptake from the groundwater was guaranteed [56]. Under such well-watered conditions, black locust did not down-regulate the transpiration and was regarded as a water-saving tree species [57]. However, long-term studies aiming to understand the biomass production under different climatic conditions do not exist for black locust and for management practices such as SRC.
4.1. Parameterization and Validation of the Yield-SAFE Model
The low relative errors of the woody biomass fits and the high coefficient of determination suggested a satisfactory agreement between the modelled and observed woody biomass yields and thus, a high model performance, accounting for a great proportion of the variance.
However, some differences existed between the modelled biomass and the measured one, which could be reduced by revising those parameters which influenced the modelled output the most. One of the parameters that would need a better appraisal would be the initial biomass, which was assumed to be 0.87 Mg ha−1 in the Yield-SAFE model, whereas the measured biomass was of 0.4 Mg ha−1 for poplar and 0.001 Mg ha−1 for black locust after the first year of growth. Evidently the initial biomass of the cuttings (poplar) and rooted seedlings (black locust) should be adjusted in the future to a more realistic situation.
Another solution would be to improve the Yield-SAFE model by a dynamic vegetation period determination depending on weather conditions rather than the static approach using tabulated values of the day of budburst and leaf fall of the year. The adaptation could be based on a weighting model determined by the atmospheric drivers (i.e., daily values for air temperature, precipitation, and global radiation), in order to boost or hinder the tree vegetation period to a more realistic situation. Shifts in the phenological phases have already been observed in the region [58,59] and further changes are expected for the future. Since this solution would use existing parameters, it would not increase the parameter range in the Yield-SAFE model and therefore, the model would remain parameter-sparse.
4.2. Evaluating the Woody Biomass Productivity under Prospective Climate Realisations
The above-ground woody biomass, as simulated by the Yield-SAFE model, was highly sensitive to global radiation and precipitation but to a lesser extent to changes in average air temperature. This was also supported by the results of the sensitivity analysis. However, strong correlations were detected between global radiation and air temperature and therefore, the variations noticed in the tree woody biomass production were attributed to various extents to all three climatic inputs.
In our comparison between realisations R13 and R31 under the first growing period (2015–2018) for example, a higher woody biomass production was provided by R13 than by R31. We firstly linked this difference to the monthly precipitation sum values, which were higher in R13 than in R31. This was especially important for the months May, June, and July, where the modelled output increased with increasing precipitation values, as also observed in experimental studies by Gallardo [60] for poplar trees and Mantovani et al. [57] for black locust trees.
Additionally, the average monthly radiation was significantly higher in realisation R13 than R31 with respect to the vegetation period, except for 2017, where values dropped slightly behind for realisation R13 than R31. Likewise, the average monthly temperature was significantly higher in realisation R13 than R31 with respect to the vegetation period, except for 2017. This indicated that the tree growth depended somewhat on global radiation, but most predominantly on precipitation.
Water availability during the main vegetation period has been confirmed to be an important factor in the determination of the eco-physiological and growth performance of trees [50,51,61,62,63]. Especially when subjected to extreme summer droughts, as expected for the ongoing climate change, the soil water availability can imprint a long-lasting effect on tree growth performance, forest functioning and management [64,65,66].
Numerous studies have emphasized the complex effects of climate change on common forest trees [65,67]. The increasing air temperature was reported to alter the plant phenology and length of the vegetation period, which in turn affects plant productivity [58,59]. Bud phenology of many temperate trees depends on air temperature and photoperiod [68,69,70]. Regional warming might increase the length of the growing period, albeit increasing evaporative demand, especially in combination with decreasing precipitation, may limit growth [9,71].
The climate change impacts on short rotation coppices with aspen were assessed by Lasch et al. [24] across Eastern Germany and increasing growth rates were reported on most sites together with high ranges based on three selected realisations of STAR 2K. A European-wide simulation study showed inconsistent tendencies of changes in tree growth in Central Europe with high uncertainties of climate change impacts on tree growth arising from climate models [26].
Due to the non-linear responses of tree growth to interacting factors such as global radiation, air temperature, precipitation, and soil moisture, estimating climate change impacts on tree growth is challenging and subject to large uncertainties [30,72,73].
As noted by Medlyn et al. [30], the comparability of simulation results of tree growth under climate change can be hampered by various uncertainties, many of those related to the underlying assumptions in the tree growth model. The simulations run by the Yield-SAFE model do not account for the tree mortality, nutrients or pests. In reality, however, these growth limiting factors hinder the overall tree woody biomass production. Our results also indicated that climate changes, as assumed in STAR 2K, may result in high uncertainties of the simulated tree growth, even for the same scenario and regional climate model. This might be attributed to the fact that different realisations of one scenario may cause more pronounced differences in forest productivity than different regional climate models or emission scenarios, as found by a European-wide comparison study [26].
STAR 2K has been used in several studies to estimate the potential climate change effects on hydrology whereby the direction of change was in agreement towards increasing potential evapotranspiration and declining discharge and groundwater recharge [48,49,74], but only the magnitude of change showed high differences between individual realisations. The potential tree growth might also be subjected to hindrance by the declining groundwater recharge, as investigated by Pohle et al. [49] for bio-energy crops in the wider study region under STAR and WettReg.
These results are in line with the findings of our study concerning the uncertainties in climate variability implications on the growth performance of poplar and black locust trees, both in terms of direction and magnitude of potential future changes.
5. Conclusions
By a combined experimental and simulation study, we investigated the potential growth vulnerability of two fast-growing tree species managed as short rotation coppices (SRCs) to a considerable spectrum of weather conditions and long-term climate change. We achieved this by means of field measurements in an SRC established in Brandenburg, Germany, and simulations using the Yield-SAFE model and 100 realisations of the regional climate model Statistical Analogue Resampling scheme STAR, scenario 2K.
The Yield-SAFE model simulated the daily above-ground woody biomass of poplar clone “Max I” and black locust with satisfactory accuracy and responded sensitively to changes in the meteorological input data. The model showed a strong sensitivity to tree parameters such as the initial number of shoots, the radiation use efficiency and the radiation extinction coefficient, as well as the maximum leaf area per shoot and to a lesser extent, to soil parameters. In terms of climatic inputs, the modelled output was highly sensitive to global radiation and precipitation but to a lesser extent to changes in average temperature.
Our findings showed that the tree yields in an SRC were positively impacted by air temperature increase and negatively by decreasing precipitation. Additionally, the notion that climate change impacts cannot be categorized as solely positive or negative was reinforced, as tree yield productivity has shown to react diametrically contrary to shifts in climate: higher temperature values might boost tree growth due to a prolonged vegetation period, or contrarily, it might hinder tree growth due to higher evapotranspiration and lower soil water availability.
However, as the extreme events are to be intensified in their frequency and intensity within the framework of the anticipated climate changes, the investigation of the effects of extreme weather conditions will be given more prominence in the future. Also, there may be some restrictions on production as groundwater levels might decline under climate change [49], restricting the future possibilities for the use of groundwater for irrigation, especially of agricultural land.
Based on the implications of this study for the studied clones, it will be possible to furthermore develop and optimize the SRC designs with respect to the specific field conditions and to provide a reliable estimation of achievable woody biomass yields according to tree species, management, and climate change effects.
A multi-rotation tree growth model is paramount for simulating the tree woody biomass production in SRCs and systematic monitoring of second, third, and following tree rotations managed as SRCs is a vital part for validating the performance of the model. In the future, the model of this study could be extended to situations that demand more details such as different nutrient levels, different species of trees, and interactions between plants. This is especially relevant with the current need for diversification of land-use and the generation of not only food, feed and fibre on arable land, but also fuel with respect to the water-energy-food nexus.
Author Contributions
The SIGNAL project was initiated and planned in relation to the proposal call “Soil as a Sustainable Resource for the Bioeconomy—BonaRes” (http://www.signal.uni-goettingen.de). D.-M.S. analysed the data together with I.P. and M.V. and wrote the manuscript. I.P., M.V., and D.F. contributed by revising the manuscript. Conceptualization, D.-M.S., I.P., M.V., and D.F.; Methodology, D.-M.S. and I.P.; Software, D.-M.S., I.P, and D.F.; Validation, D.-M.S. and I.P.; Formal Analysis, D.-M.S., I.P., and M.V.; Investigation, D.-M.S., I.P., and M.V.; Resources, I.P., M.V., and D.F.; Data Curation, D.-M.S. and I.P.; Writing—Original Draft Preparation, D.-M.S., I.P., and M.V.; Writing—Review & Editing, D.-M.S., I.P., M.V., and D.F.; Visualization, D.-M.S. and I.P.; Supervision, M.V. and D.F.; Project Administration, D.F.; Funding Acquisition, D.F.
Funding
This research was carried out as part of the BonaRes-SIGNAL project funded by the BMBF—German Federal Ministry of Education and Research (FKZ 031A562E).
Acknowledgments
We thank the Potsdam Institute for Climate Impact Research (PIK) for provision of the STAR 2K realisations and the German Weather Service (Deutscher Wetterdienst, DWD) for the provision of weather data. We gratefully acknowledge the various students for their help with the field work and the Agrargenossenschaft Forst e.G. for their promotion and management of the agroforestry systems at Neu Sacro. We would also like to thank the editor and reviewers for their assistance and helpful comments on the manuscript.
Conflicts of Interest
The authors declare no conflict of interest. The funding sponsors had no role in the design of the study; in the collection, analyses, or interpretation of data; in the writing of the manuscript; and in the decision to publish the results.
Appendix A

Table A1.
Tree and soil parameter values used for the parametrization of the Yield-SAFE model for the SRC in Forst (north-eastern Germany).
Table A1.
Tree and soil parameter values used for the parametrization of the Yield-SAFE model for the SRC in Forst (north-eastern Germany).
| Symbol | Description | Unit | Tree Species | Value | Source |
|---|---|---|---|---|---|
| Tree Parameters | |||||
| Initial Conditions | |||||
| nShoots0 | Initial number of shoots per tree | tree−1 | Poplar | 0.3362 | Own data |
| Black Locust | 0.2520 | ||||
| Bt0 | Initial tree biomass | g tree−1 | Poplar | 100 | [39,41] |
| Black Locust | |||||
| LAt0 | Initial tree leaf area | m2 tree−1 | Poplar | 0 | [39,41] |
| Black Locust | |||||
| Parameters | |||||
| εt | Radiation use efficiency | g MJ−1 | Poplar | 0.2137 | Own data |
| Black Locust | 0.4820 | ||||
| kt | Light extinction coefficient | – | Poplar | 0.8 | [39,41] |
| Black Locust | |||||
| tt | The number of days after budburst at which the leaf area has reached 63.2% of its maximum leaf area LAssmax | d | Poplar | 10 | [39,41] |
| Black Locust | |||||
| LAssmax | Maximum leaf area for a single shoot | m2 | Poplar | 0.05 | [39,41] |
| Black Locust | 0.025 | [54] | |||
| nShootsmax | Maximum number of shoots per tree | tree−1 | Poplar | 10000 | [39,41] |
| Black Locust | |||||
| Kmain | Relative attrition rate of tree biomass | d−1 | Poplar | 10−4 | [39,41] |
| Black Locust | |||||
| γt | Transpiration coefficient of the trees | m3 kg−1 | Poplar | 0.35 | [41] |
| Black Locust | 0.42 | [54] | |||
| (pFcrit)t | Critical pF value for trees | log (cm) | Poplar | 4.0 | [39] |
| Black Locust | [54] | ||||
| (pFpwp)t | pF value at permanent wilting point | log (cm) | Poplar | 4.2 | [39] |
| Black Locust | |||||
| Tree Leaf Behaviour | |||||
| DOYbudburst, DOYleaffall | Day of year for budburst and leaf fall | DOY | Poplar | 105, 280 | [46] |
| Black Locust | 125, 310 | ||||
| Management Tree Density | |||||
| ρt | Planting density | trees ha−1 | Poplar | 8700 | [34] |
| Black Locust | |||||
| Soil Parameters | |||||
| Initial Conditions | |||||
| θ0 | Initial volumetric water content | m3 m−3 | Poplar | 0.552 | [39,41] |
| Black Locust | |||||
| Parameters | |||||
| δeva | Potential evaporation per unit energy | mm MJ−1 | Poplar | 0.15 | [41] |
| Black Locust | |||||
| D | Depth of the soil compartment | mm | Poplar | 1500 | [45] |
| Black Locust | |||||
| α | Van Genuchten parameter | – | Poplar | 0.0383 | [45] |
| Black Locust | |||||
| nsoil | Van Genuchten parameter | – | Poplar | 1.3774 | [45] |
| Black Locust | |||||
| δ | Parameter affecting the drainage rate below root zone | – | Poplar | 0.07 | [45] |
| Black Locust | |||||
| PWP | Permanent wilting point | log (cm) | Poplar | 4.2 | [39,41] |
| Black Locust | |||||
| (pFcrit)E | Critical pF value for evaporation | log (cm) | Poplar | 2.3 | [39,41] |
| Black Locust | |||||
| pFFC | Water tension at field capacity | log (cm) | Poplar | 2.3 | [39,41] |
| Black Locust | |||||
| Ks | Soil hydraulic conductivity at saturation | mm d−1 | Poplar | 60 | [45] |
| Black Locust | |||||
| θs | Saturated volumetric water content | m3 m−3 | Poplar | 0.403 | [45] |
| Black Locust | |||||
| θr | Residual volumetric water content | m3 m−3 | Poplar | 0.025 | [45] |
Table A2.
Realisations (R, highlighted in parentheses) that rendered minimum and maximum average precipitation (Pmin, Pmax), air temperature (Tmin, Tmax), and global radiation (Rmin, Rmax) values in the established ten growing periods with respect to the vegetation period of both tree species. The reference period for poplar (2011–2014) and black locust (2010–2013) trees accounted for their distinct vegetation period.
| Average Values | Reference Period | 2015–2018 | 2019–2022 | 2023–2026 | 2027–2030 | 2031–2034 | 2035–2038 | 2039–2042 | 2043–2046 | 2047–2050 | 2051–2054 |
|---|---|---|---|---|---|---|---|---|---|---|---|
| Poplar | |||||||||||
| Pmax.[mm] T [°C] * | 366 | 389 16.0 * (R31) | 435 15.9 * (R7) | 413 17.3 * (R43) | 378 16.8 * (R41) | 442 16.8 * (R98) | 450 16.9 * (R96) | 376 17.6 * (R60) | 406 16.8 * (R10) | 413 17.3 * (R78) | 416 17.6 * (R39) |
| Pmin.[mm] T [°C] * | 225 16.5 * (R26) | 201 17.5 * (R56) | 211 16.9 * (R11) | 184 17.5 * (R2) | 212 16.8 * (R10) | 205 17.2 * (R79) | 203 17.4 * (R69) | 176 17.9 * (R2) | 197 17.1 * (R8) | 190 18.3 * (R79) | |
| Black Locust | |||||||||||
| Pmax.[mm] T [°C] * | 395 | 400 15.8 * (R79) | 440 15.4 * (R7) | 423 16.6 * (R43) | 408 16.3 * (R50) | 459 16.3 * (R98) | 445 16.4 * (R96) | 390 17.1 * (R60) | 413 17.0 * (R82) | 422 16.9 * (R78) | 429 17.1 * (R39) |
| Pmin.[mm] T [°C] * | 226 16.1 * (R19) | 207 17.0 * (R56) | 222 16.8 * (R11) | 188 17.1 * (R2) | 205 16.6 * (R10) | 209 17.1 * (R79) | 192 17.3 * (R79) | 196 17.2 * (R2) | 188 17.7 * (R46) | 200 16.9 * (R13) | |
| Poplar | |||||||||||
| Tmax. [°C] P [mm] * | 16.6 | 17.5 384 * (R16) | 17.6 269, 304 * (R33, R69) | 18.0 273 * (R55) | 17.9 274 * (R98) | 18.2 235 * (R62) | 18.3 247, 271 * (R1, R17) | 18.3 311 * (R97) | 18.3 234, 306 * (R36, R81) | 18.6 227 * (R37) | 18.5 327 * (R47) |
| Tmin. [°C] P [mm] * | 15.2 368 * (R71) | 15.9 435, 317 * (R7, R79) | 16.1 294 * (R75) | 15.9 324 * (R1) | 16.1 362 * (R3) | 16.5 325, 373 * (R42, R95) | 16.5 325 * (R26) | 16.8 406, 330 * (R10, R94) | 16.4 329 * (R66) | 17.1 289 * (R91) | |
| Black Locust | |||||||||||
| Tmax. [°C] P [mm] * | 15.6 | 16.6 257, 257 * (R64, R74) | 17.1 336 * (R41) | 17.1 344, 342 * (R27, R83) | 17.4 278 * (R4) | 17.3 277 * (R96) | 17.4 246 * (R26, R65) | 17.6 248 * (R22) | 17.7 336 * (R4) | 17.8 291 * (R51) | 17.8 265 * (R73) |
| Tmin. [°C] P [mm] * | 14.6 391 * (R71) | 15.3 267 * (R84) | 15.6 280 * (R67) | 15.4 324 * (R1) | 15.2 377 * (R3) | 15.9 361 * (R81) | 16.0 341 * (R26) | 16.1 334 * (R31) | 16.0 350 * (R66) | 16.5 285 * (R91) | |
| Poplar | |||||||||||
| Rmax. [Wm−2] | 3119 | 2926 (R64) | 3002 (R53) | 3017 (R22) | 3016 (R4) | 3069 (R13) | 3133 (R17) | 3082 (R24) | 3165 (R100) | 3146 (R37) | 3158 (R79) |
| Rmin. [Wm−2] | 2497 (R71) | 2640 (R34) | 2709 (R60) | 2701 (R1) | 2593 (R3) | 2653 (R95) | 2741 (R26) | 2745 (R67) | 2789 (R3) | 2738 (R3) | |
| Black Locust | |||||||||||
| Rmax. [Wm−2] | 2966 | 2812 (R11) | 2932 (R51) | 2887 (R22) | 2913 (R4) | 2898 (R6) | 2952 (R46) | 2958 (R79) | 3045 (R100) | 2981 (R13) | 3003 (R79) |
| Rmin. [Wm−2] | 2379 (R71) | 2560 (R79) | 2538 (R67) | 2573 (R41) | 2419 (R3) | 2517 (R95) | 2621 (R8) | 2597 (R67) | 2632 (R3) | 2559 (R3) | |
* These values are subsidiary to the values of interest presented above.
Appendix B
Figure A1.
Projected accumulated woody biomass of poplar trees under realisations that rendered minimum (R35, orange), mean (R15, light green; R86, dark green), and maximum (R38, blue) average temperature values during the vegetation period from 2015 to the end of 2054.
Figure A1.
Projected accumulated woody biomass of poplar trees under realisations that rendered minimum (R35, orange), mean (R15, light green; R86, dark green), and maximum (R38, blue) average temperature values during the vegetation period from 2015 to the end of 2054.

Figure A2.
Projected accumulated woody biomass of black locust trees under realisations that rendered minimum (R84, orange), mean (R43, light green), and maximum (R41, dark blue; R32, light blue) average temperature values during the vegetation period from 2015 to the end of 2054.
Figure A2.
Projected accumulated woody biomass of black locust trees under realisations that rendered minimum (R84, orange), mean (R43, light green), and maximum (R41, dark blue; R32, light blue) average temperature values during the vegetation period from 2015 to the end of 2054.

Figure A3.
Walter-Lieth climate diagrams for realisation 79 in terms of average annual air temperature, precipitation and global radiation, according to the established periods and with respect to the vegetation period and accumulated woody biomass for both tree species.
Figure A3.
Walter-Lieth climate diagrams for realisation 79 in terms of average annual air temperature, precipitation and global radiation, according to the established periods and with respect to the vegetation period and accumulated woody biomass for both tree species.

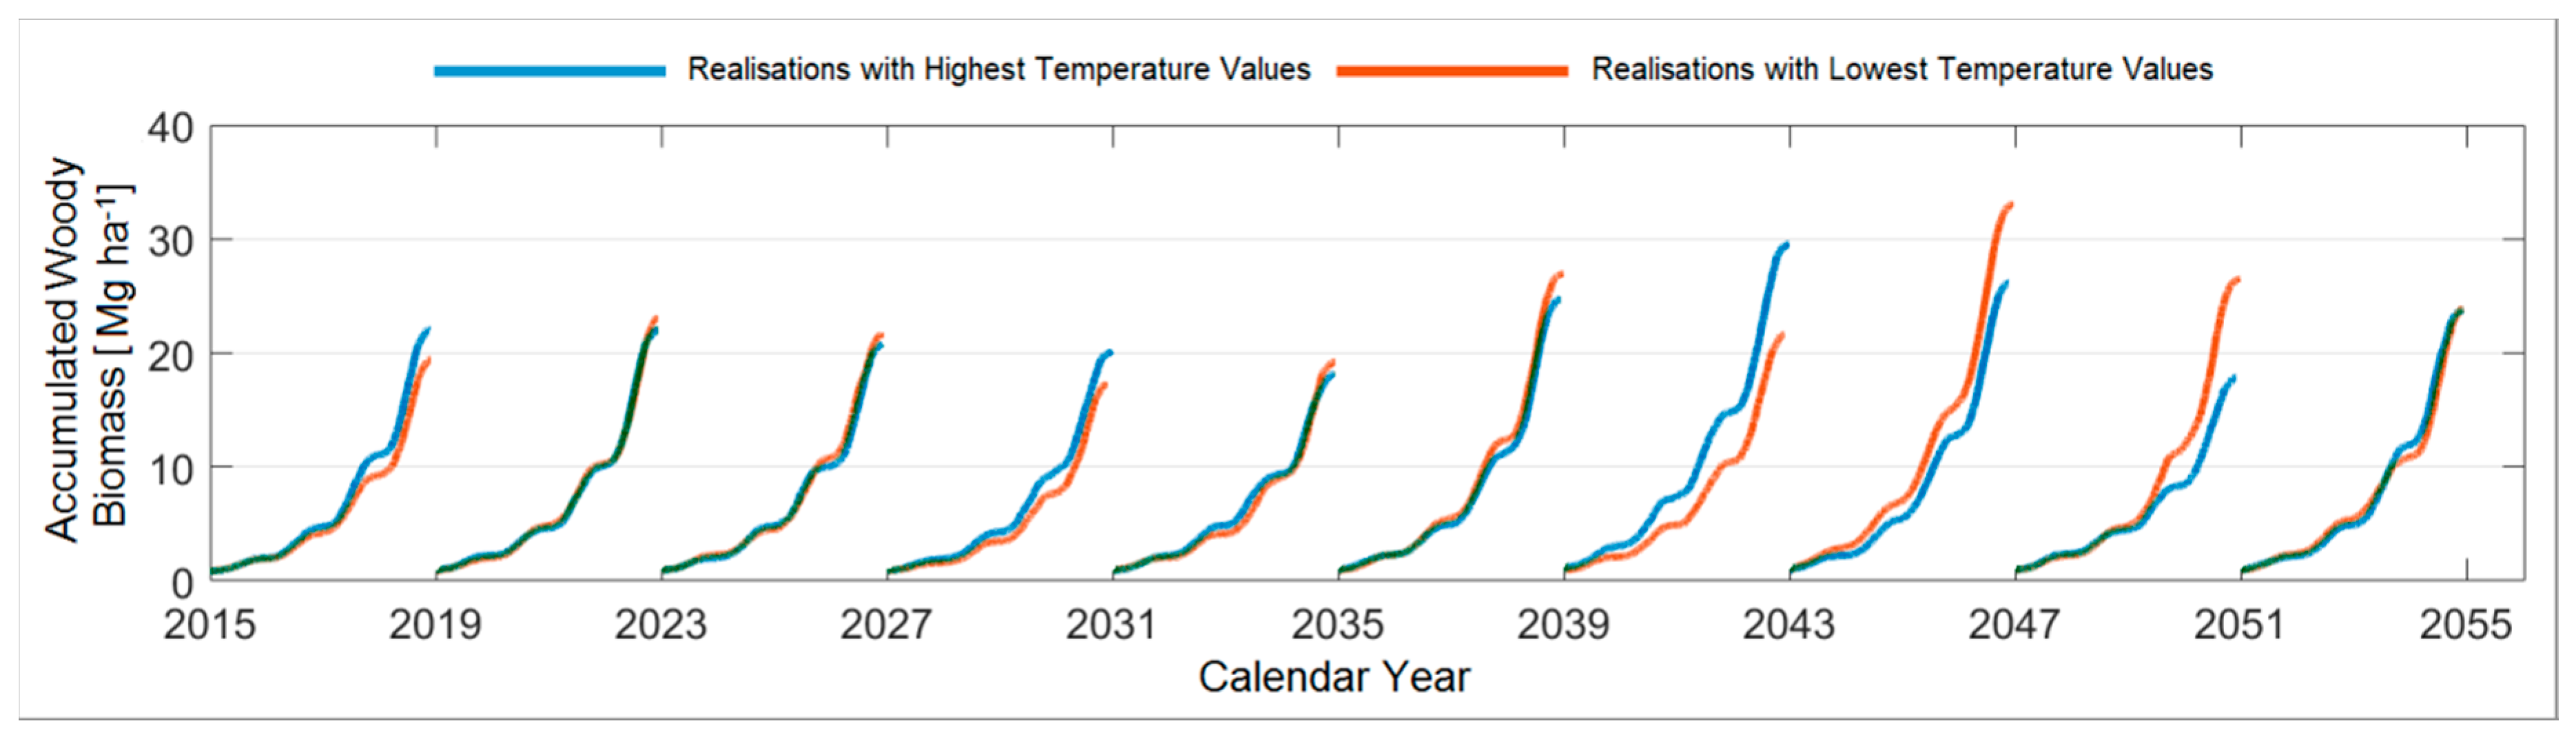
Figure A4.
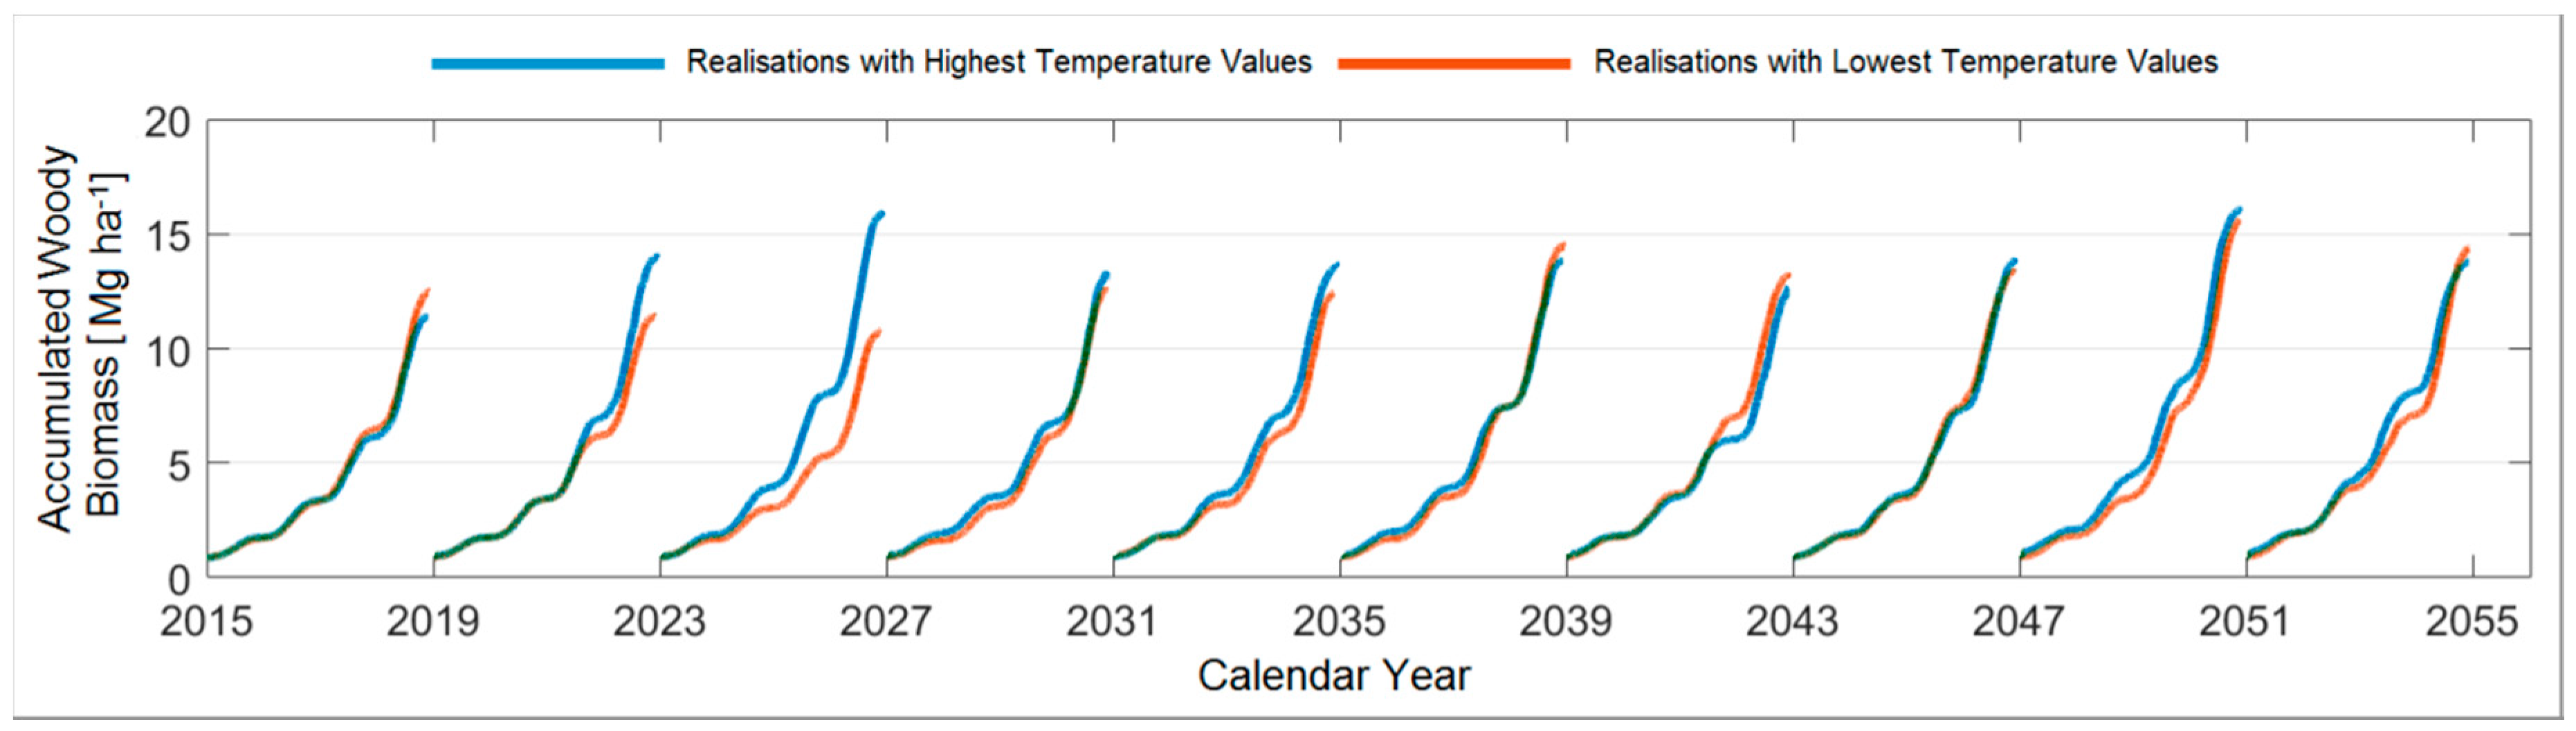
Projected woody biomass of poplar trees under special realisations describing either the highest temperature values (blue) or the lowest temperature values (orange) with respect to the ten established growing periods.
Figure A4.
Projected woody biomass of poplar trees under special realisations describing either the highest temperature values (blue) or the lowest temperature values (orange) with respect to the ten established growing periods.

Figure A5.
Projected woody biomass of black locust trees under special realisations describing either the highest temperature values (blue) or the lowest temperature values (orange) with respect to the ten established growing periods.
Figure A5.
Projected woody biomass of black locust trees under special realisations describing either the highest temperature values (blue) or the lowest temperature values (orange) with respect to the ten established growing periods.

Figure A6.
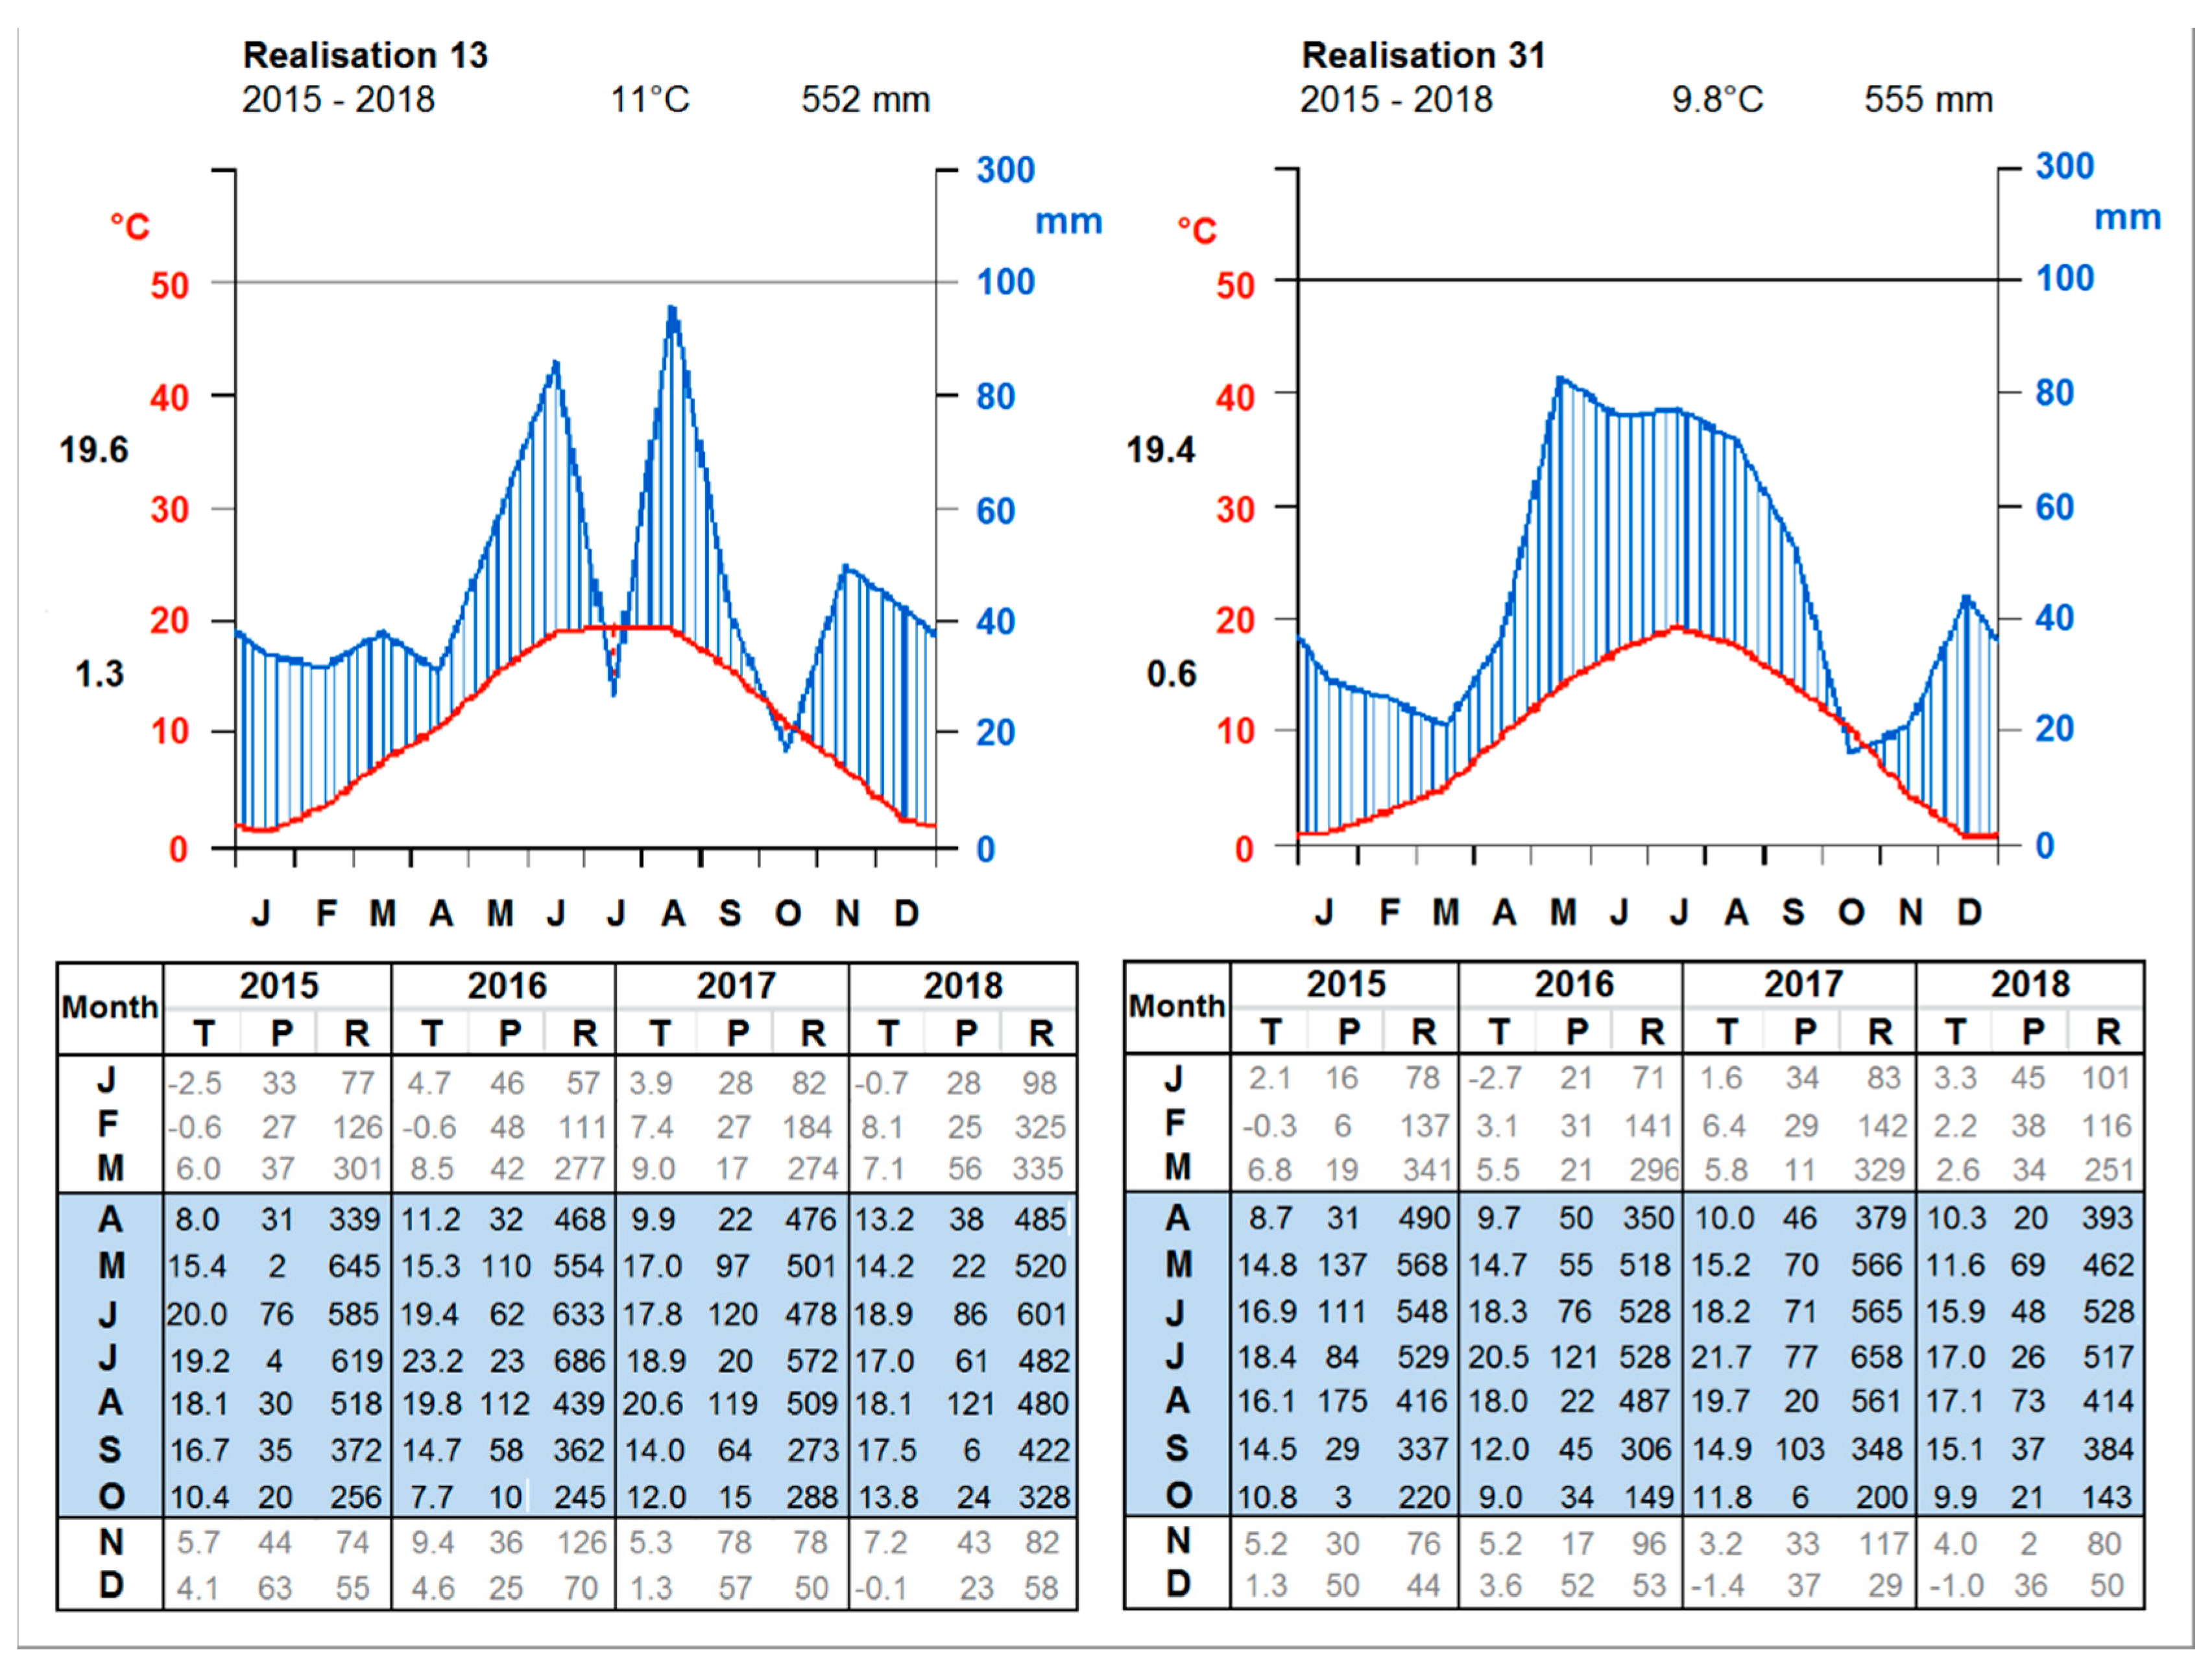
Comparison between realisation 31 and realisation 13 in terms of average monthly air temperature, precipitation and global radiation according to growing period 1 (2015–2018) and with respect to the accumulated biomass obtained by poplar.
Figure A6.
Comparison between realisation 31 and realisation 13 in terms of average monthly air temperature, precipitation and global radiation according to growing period 1 (2015–2018) and with respect to the accumulated biomass obtained by poplar.

References
- European Commission. Communication from The Commission to The European Parliament, The Council, The European Economic and Social Committee and The Committee of The Regions Energy Roadmap 2050. /* COM/2011/0885 final */. Available online: https://eur-lex.europa.eu/legal-content/EN/ALL/?uri=celex:52011DC0885 (accessed on 27 April 2018).
- Strelher, A. Technologies of wood combustion. Ecol. Eng. 2000, 16, 25–40. [Google Scholar] [CrossRef]
- BMWi Bekanntmachung über die Förderung von Forschung und Entwicklung zur kosten- und energieeffizienten Nutzung von Biomasse im Strom- und Wärmemarkt „Energetische Biomassenutzung“. BAnz AT 21.07.2015 B1, 1–7. Available online: https://www.ptj.de/lw_resource/datapool/systemfiles/cbox/604/live/lw_bekdoc/fbk_energetische_biomassenutzung.pdf (accessed on 27 April 2018).
- Abbasi, T.; Abbasi, S.A. Biomass energy and the environmental impacts associated with its production and utilization. Renew. Sust. Energ. Rev. 2010, 14, 919–937. [Google Scholar] [CrossRef]
- Evans, A.; Strezov, V.; Evans, T.J. Sustainability considerations for electricity generation from biomass. Renew. Sust. Energ. Rev. 2010, 14, 1419–1427. [Google Scholar] [CrossRef]
- Ceulemans, R.; Deraedt, W. Production physiology and growth potential of poplars under short-rotation forestry culture. Forest Ecol. Manag. 1999, 121, 9–23. [Google Scholar] [CrossRef]
- Hauck, S.; Knocke, T.; Wittkopf, S. Economic evaluation of short rotation coppice systems for energy from biomass—A review. Renew. Sust. Energ. Rev. 2014, 29, 435–448. [Google Scholar] [CrossRef]
- Carl, C.; Biber, P.; Landgraf, D.; Buras, A.; Pretzsch, H. Allometric models to predict aboveground woody biomass of black locust (Robinia pseudoacacia L.) in short rotation coppice in previous mining and agricultural areas in Germany. Forests 2017, 8, 328. [Google Scholar]
- Ceulemans, R.; McDonald, A.J.S.; Pereira, J.S.A. A comparison among eucalypt, poplar and willow characteristics with particular reference to a coppice, growth-modelling approach. Biomass Bioenerg. 1996, 11, 215–231. [Google Scholar] [CrossRef]
- Walle, I.V.; Camp, N.V.; Van de Casteele, L.; Verheyen, K.; Lemeur, R. Short-rotation forestry of birch, maple, poplar and willow in Flanders (Belgium) II. Energy production and CO2 emission reduction potential. Biomass Bioenerg. 2007, 31, 276–283. [Google Scholar]
- Sims, R.E.H.; Maiava, T.G.; Bullock, B.T. Short rotation coppice tree species selection for woody biomass production in New Zealand. Biomass Bioenerg. 2001, 20, 329–335. [Google Scholar] [CrossRef]
- Aravanopoulos, F.A.; Kimb, K.H.; Zsuffa, L. Genetic diversity of superior Salix clones selected for intensive forestry plantations. Biomass Bioenerg. 1999, 16, 249–255. [Google Scholar] [CrossRef]
- Zewdie, M.; Olsson, M.; Verwijst, T. Above-ground biomass production and allometric relations of Eucalyptus globulus Labill coppice plantations along a chronosequence in the central highlands of Ethiopia. Biomass Bioenerg. 2009, 33, 421–428. [Google Scholar] [CrossRef]
- Sochacki, S.J.; Harper, R.J.; Smettem, K.R.J. Estimation of woody biomass production from a short-rotation bio-energy system in semi-arid Australia. Biomass Bioenerg. 2007, 31, 608–616. [Google Scholar] [CrossRef]
- Van Vooren, L.; Reubens, B.; Broekx, S.; Pardon, P.; Reheul, D.; van Winsen, F.; Verheyen, K.; Wauters, E.; Lauwers, L. Greening and producing: An economic assessment framework for integrating trees in cropping systems. Agric. Syst. 2016, 148, 44–57. [Google Scholar] [CrossRef]
- Gerstengarbe, F.W.; Badeck, F.; Hattermann, F.; Krysanova, V.; Lahmer, W.; Lasch, P.; Stock, M.; Suckow, F.; Wechsung, F.; Werner, P.C. Studie zur klimatischen Entwicklung im Land Brandenburg bis 2055 und deren Auswirkungen auf den Wasserhaushalt, die Forst- und Landwirtschaft sowie die Ableitung erster Perspektiven. PIK 2003, 83, 77. [Google Scholar]
- Gädeke, A.; Pohle, I.; Koch, H.; Grünewald, U. Trend analysis for integrated regional climate change impact assessments in the Lusatian river catchments (North-Eastern Germany). Reg. Environ. Chang. 2017, 17, 1751–1762. [Google Scholar] [CrossRef]
- Rauthe, M.; Steiner, H.; Riediger, U.; Mazurkiewicz, A.; Gratzki, A. A Central European precipitation climatology—Part I: Generation and validation of a high-resolution gridded daily data set (HYRAS). Meteorol. Zeitschrift 2013, 22, 235–256. [Google Scholar] [CrossRef]
- Jacob, D.; Petersen, J.; Eggert, B.; Alias, A.; Bøssing Christensen, O.; Bouwer, L.M.; Braun, A.; Colette, A.; Déqué, M.; Georgievski, G.; et al. EURO-CORDEX: New high-resolution climate change projections for European impact research. Reg. Environ. Chang. 2014, 14, 563–578. [Google Scholar] [CrossRef]
- Christensen, J.; Hewitson, B.; Busuioc, A.; Chen, A.; Gao, X.; Held, I.; Jones, R.; Kolli, R.; Kwon, W.T.; Laprise, R.; et al. Regional climate projections. In Climate Change 2007: The Physical Science Basis. Contribution of Working Group I to the Fourth Assessment Report of the Intergovernmental Panel on Climate Change; Solomon, S., Qin, D., Manning, M., Chen, Z., Marquis, M., Averyt, K., Tignor, M., Miller, H., Eds.; Cambridge University Press: Cambridge, UK, 2007. [Google Scholar]
- Ruane, A.C.; Hudson, N.I.; Asseng, S.; Camarrano, D.; Ewert, F.; Martre, P.; Boote, K.J.; Thorburn, P.J.; Aggarwal, P.K.; Angulo, C.; et al. Multi-wheat-model ensemble responses to interannual climate variability. Environ. Modell. Softw. 2016, 81, 86–101. [Google Scholar] [CrossRef] [Green Version]
- Horemans, J.A.; van Gaelen, H.; Raes, D.; Zenone, T.; Ceulemans, R. Can the agricultural AquaCrop model simulate water use and yield of a poplar short-rotation coppice? GCB Bioenergy 2017, 9, 1151–1164. [Google Scholar] [CrossRef] [PubMed]
- de Vries, W.; Posch, M.; Simpson, D.; Reinds, G.J. Modelling long-term impacts of changes in climate, nitrogen deposition and ozone exposure on carbon sequestration of European forest ecosystems. Sci. Total Environ. 2017, 605–606, 1097–1116. [Google Scholar] [CrossRef] [PubMed]
- Lasch, P.; Kollas, C.; Rock, J.; Suckow, F. Potentials and impacts of short-rotation coppice plantation with aspen in Eastern Germany under conditions of climate change. Reg. Environ. Chang. 2010, 10, 83–94. [Google Scholar] [CrossRef]
- Lasch-Born, P.; Suckow, F.; Gutsch, M.; Reyer, C.; Hauf, I.; Murawski, A.; Pilz, T. Forests under climate change: Potential risks and opportunities. Meteorol. Zeitschrift 2015, 24, 157–172. [Google Scholar] [CrossRef]
- Reyer, C.; Lasch-Born, P.; Suckow, F.; Gutsch, M.; Murawski, A.; Pilz, T. Projections of regional changes in forest net primary productivity for different tree species in Europe driven by climate change and carbon dioxide. Ann. Forest Sci. 2014, 71, 211–225. [Google Scholar] [CrossRef]
- Wang, W.J.; He, H.S.; Thompson, F.R.; Fraser, J.S.; Dijak, W.D. Changes in forest biomass and tree species distribution under climate change in the northeastern United States. Landsc. Ecol. 2017, 32, 1399–1413. [Google Scholar] [CrossRef]
- Monclus, R.; Dreyer, E.; Delmotte, F.M.; Villar, M.; Delay, D.; Boudouresque, E.; Petit, J.M.; Marron, N.; Bréchet, C.; Brignolas, F. Productivity, leaf traits and carbon isotope discrimination in 29 Populus deltoides × P. nigra clones. New Phytol. 2005, 167, 53–62. [Google Scholar] [CrossRef] [PubMed]
- Calfapietra, C.; Gielen, B.; Karnosky, D.; Ceulemans, R.; Mugnozza, G.S. Response and potential of agroforestry crops under global change. Environ. Pollut. 2010, 158, 1095–1104. [Google Scholar] [CrossRef] [PubMed]
- Medlyn, B.E.; Duursma, R.A.; Zeppel, M.J.B. Forest productivity under climate change: A checklist for evaluating model studies. Wiley Interdiscip. Rev. Clim. Chang. 2011, 2, 332–355. [Google Scholar] [CrossRef]
- van der Werf, W.; Keesman, K.; Burgess, P.; Graves, A.; Pilbeam, D.; Incoll, L.D.; Metselaar, K.; Mayus, M.; Stappers, R.; van Keulen, H.; et al. Yield-SAFE: A parameter-sparse, process-based dynamic model for predicting resource capture, growth, and production in agroforestry systems. Ecol. Eng. 2007, 29, 419–433. [Google Scholar] [CrossRef] [Green Version]
- Werner, P.C.; Gerstengarbe, F.W. Proposal for the development of climate scenarios. Clim. Res. 1997, 8, 171–182. [Google Scholar] [CrossRef] [Green Version]
- Orlowsky, B.; Gerstengarbe, F.W.; Werner, P.C. A resampling scheme for regional climate simulations and its performance compared to a dynamical RCM. Theor. Appl. Climatol. 2008, 92, 209–223. [Google Scholar] [CrossRef]
- Kanzler, M.; Böhm, C. Nachhaltige Erzeugung von Energieholz in Agroforstsystemen (AgroForstEnergie II)—Abschlussbericht Teilvorhaben 2: Bodenschutz und Bodenfruchtbarkeit, Wasserhaushalt und Mikroklima; Brandenburgische Technische Universität Cottbus-Senftenberg: Cottbus, Germany, 2016. [Google Scholar]
- Bielefeldt, J.; Bolte, A.; Busch, G.; Dohrenbusch, A.; Kroiher, F.; Lamersdorf, N.; Schulz, U.; Stoll, B. Energieholzproduktion in der Landwirtschaft. Chancen und Risiken aus Sicht der Natur-und Umweltschutzes. NABU Bundesverb. 2008, 1, 17–19. [Google Scholar]
- Verwijst, T.; Telenius, B. Biomass estimation procedures in short rotation forestry. Forest Ecol. Manag. 1999, 121, 137–146. [Google Scholar] [CrossRef]
- Zianis, D.; Mencuccini, M. On simplifying allometric analyses of forest biomass. Forest Ecol. Manag. 2003, 187, 311–332. [Google Scholar] [CrossRef]
- Böhm, C.; Quinkenstein, A.; Freese, D. Yield prediction of young black locust (Robinia pseudoacacia L.) plantations for woody biomass production using allometric relations. Ann. For. Res. 2011, 54, 215–227. [Google Scholar]
- Keesman, K.J.; Graves, A.; van der Werf, W.; Burgess, P.; Palma, J.; Dupraz, C.; van Keulen, H. A system identification approach for developing and parameterising an agroforestry system model under constrained availability of data. Environ. Modell. Softw. 2011, 26, 1540–1553. [Google Scholar] [CrossRef]
- Stappers, R.; Keesman, K.J.; van der Werf, W. The SAFE-RESULT Equations: An Agro-Forestry Model; Technical Report for Wageningen University: Wageningen, The Netherlands, 2003. [Google Scholar]
- Graves, A.R.; Burgess, P.J.; Palma, J.; Keesman, K.J.; van der Werf, W.; Dupraz, C.; van Keulen, H.; Herzog, F.; Mayus, M. Implementation and calibration of the parameter-sparse Yield-SAFE model to predict production and land equivalent ratio in mixed tree and crop systems under two contrasting production situations in Europe. Ecol. Model. 2010, 221, 1744–1756. [Google Scholar] [CrossRef] [Green Version]
- Burgess, P.; Graves, A.; Palma, J.; Herzog, F.; Keesman, K.; van der Werf, W. EU SAFE Project Deliverable 6.4: Parametrization of the Yield-SAFE Model and Its Use to Determine Yields at the Landscape Test Sites; Cranfield University-Institute of Water and Environment: Silsoe, UK, 2005. [Google Scholar]
- Palma, J.H.N.; Graves, A.R.; Bunce, R.G.H.; Burgess, P.J.; de Filippi, R.; Keesman, K.J.; van Keulen, H.; Liagre, F.; Mayus, M.; Reisner, Y.; et al. Modeling environmental benefits of silvoarable agroforestry in Europe. Agr. Ecosyst. Environ. 2007, 119, 320–334. [Google Scholar] [CrossRef] [Green Version]
- Palma, J.H.N.; Paulo, J.A.; Tome, M. Carbon sequestration of modern Quercus suber L. silvoarable agroforestry systems in Portugal: A YieldSAFE-based estimation. Agroforest. Syst. 2004, 88, 791–801. [Google Scholar] [CrossRef]
- Wösten, J.H.M.; Lilly, A.; Nemes, A.; Le Bas, C. Development and use of a database of hydraulic properties of European soils. Geoderma 1999, 90, 169–185. [Google Scholar] [CrossRef]
- Küppers, M.; Schmitt, D.; Liner, S.; Böhm, C.; Kanzler, M.; Veste, M. Photosynthetic characteristics and simulation of annual leaf carbon gains of hybrid poplar (Populus nigra L. × P. maximowiczii Henry) and black locust (Robinia pseudoacacia L.) in a temperate agroforestry system. Agroforest. Syst. 2017, 1–20. [Google Scholar] [CrossRef]
- Page, J.K. The estimation of monthly mean values of daily total short-wave radiation of vertical and inclined surface from sunshine records for latitudes 40° N-40° S. In Proceedings of UN Conference on New Sources of Energy; Ruiz Elizondo, J., Ed.; United Nations: New York, NY, USA, 1964. [Google Scholar]
- Gädeke, A.; Hölzel, H.; Koch, H.; Pohle, I.; Grünewald, U. Analysis of uncertainties in the hydrological response of a model-based climate change impact assessment in a subcatchment of the Spree River, Germany. Hydrol. Process. 2014, 28, 3978–3998. [Google Scholar] [CrossRef]
- Pohle, I.; Koch, H.; Conradt, T.; Gädeke, A.; Grünewald, U. Potential impacts of climate change and regional anthropogenic activities in Central European mesoscale catchments. Hydrolog. Sci. J. 2015, 60, 912–928. [Google Scholar] [CrossRef]
- Weemstra, M.; Eilmann, B.; Sass-Klaassen, U.G.W.; Sterck, F.J. Summer droughts limit tree growth across 10 temperate species on a productive forest site. Forest Ecol. Manag. 2013, 306, 142–149. [Google Scholar] [CrossRef]
- Scharnweber, T.; Manthey, M.; Criegee, C.; Bauwe, A.; Schröder, C.; Wilmking, M. Drought matters—Declining precipitation influences growth of Fagus sylvatica L. and Quercus robur L. in north-eastern Germany. Forest Ecol. and Manag. 2011, 262, 947–961. [Google Scholar] [CrossRef]
- Veste, M.; Schillem, S.; Böhm, C. Baumarten für die Agrarholzproduktion. In Agrarholz—Schnellwachsende Bäume in der Landwirtschaft; Veste, M., Böhm, C., Eds.; Springer: Heidelberg, Germany, 2018. [Google Scholar]
- Veste, M.; Kriebitzsch, W.U. Einfluss von Trockenstress auf Photosynthese, Transpiration und Wachstum junger Robinien (Robinia pseudoacacia L.). Forstarchiv 2013, 84, 35–42. [Google Scholar]
- Mantovani, D.; Veste, M.; Böhm, C.; Vignudelli, M.; Freese, D. Spatial and temporal variation of growth performance and plant water status of black locust (Robinia pseudoacacia L.) in agroforestry systems in Lower Lusatia (Germany). iForest 2015, 8, 743–747. [Google Scholar] [CrossRef]
- Mantovani, D.; Veste, M.; Boldt-Burisch, K.; Fritsch, S.; Koning, L.; Freese, D. Carbon allocation, nodulation, and biological nitrogen fixation of black locust (Robinia pseudoacacia L.) under soil water limitation. Ann. For. Res. 2015, 58, 259–274. [Google Scholar] [CrossRef]
- Veste, M.; Halke, C. Ökophysiologische Plastizität der Photosynthese von Robinien (Robinia pseudoacacia L.) und Hybrid-Pappeln (Populus nigra L. × P. maximowiczii Henry) bei Hitzestress und Sommertrockenheit in der Niederlausitz. In Proceedings 5. Agroforstforum; Böhm, C., Ed.; Brandenburgische Technische Universität Cottbus-Senftenberg IKMZ—Universitätsbibliothek: Senftenberg, Germany, 2017. [Google Scholar]
- Mantovani, D.; Veste, M.; Freese, D. Black locust (Robinia pseudoacacia L.) ecophysiological and morphological adaptations to drought and their consequence on biomass production and water use efficiency. N. Z. J. For. Sci. 2014, 44, 29. [Google Scholar] [CrossRef]
- Chmielewski, F.M.; Müller, A.; Küchler, W. Possible impacts of climate change on natural vegetation in Saxony (Germany). Int. J. Biometeorol. 2005, 50, 96–104. [Google Scholar] [CrossRef] [PubMed]
- Menzel, A.; Sparks, T.H.; Estrella, N.; Koch, E.; Aasa, A.; Ahas, R.; Alm-Kübler, K.; Bissolli, P.; Braslavska, O.; Briede, A.; et al. European phenological response to climate change matches the warming pattern. Glob. Chang. Biol. 2006, 12, 1969–1976. [Google Scholar] [CrossRef] [Green Version]
- Gallardo, D.A. Standortbasierte Ertragsmodellierung von Pappel-und Weidenklonen in Kurzumtriebsplantagen. Available online: http://nbn-resolving.de/urn:nbn:de:bsz:14-qucosa-144670 (accessed on 5 December 2016).
- Leuzinger, S.; Zotz, G.; Asshoff, R.; Körner, C. Responses of deciduous forest trees to severe drought in Central Europe. Tree Physiol. 2015, 25, 641–650. [Google Scholar] [CrossRef]
- Gessler, A.; Keitel, C.; Kreuzwieser, J.; Matyssek, R.; Seiler, W.; Rennenberg, H. Potential risks for European beech (Fagus sylvatica L.) in a changing climate. Trees 2007, 21, 1–11. [Google Scholar] [CrossRef]
- Kriebitzsch, W.U.; Veste, M. Bedeutung trockener Sommer für die Photosynthese und Transpiration von verschiedenen Herkünften der Rotbuche (Fagus sylvatica L.). Landbauforschung 2012, 62, 193–209. [Google Scholar]
- Lindner, M.; Maroschek, M.; Netherer, S.; Kremer, A.; Barbati, A.; Garcia-Gonzalo, J.; Seidl, R.; Delzon, S.; Corona, P.; Kolström, M.; et al. Climate change impacts, adaptive capacity, and vulnerability of European forest ecosystems. Forest Ecol. Manag. 2010, 259, 698–709. [Google Scholar] [CrossRef]
- Anderegg, W.R.L.; Kane, J.M.; Anderegg, L.D.L. Consequences of widespread tree mortality triggered by drought and temperature stress. Nat. Clim. Chang. 2013, 3, 30–36. [Google Scholar] [CrossRef]
- Bolte, A.; Madsen, P.; Derkyi, M.A.A.; Stanturf, J.A. Forest adaptation and restoration under global change—Concept and status of an IUFRO Task Force. Flora Mediterr. 2017, 27, 6. [Google Scholar]
- Anderegg, W.R.L.; Hicke, J.A.; Fisher, R.A.; Allen, C.D.; Aukema, J.; Bentz, B.; Hood, S.; Lichstein, J.W.; Macalady, A.K.; McDowell, N.; et al. Tree mortality from drought, insects, and their interactions in a changing climate. New Phytol. 2015, 208, 674–683. [Google Scholar] [CrossRef] [PubMed] [Green Version]
- Körner, C.; Basler, D. Phenology under global warming. Science 2010, 327, 1461–1462. [Google Scholar]
- Vitasse, Y.; Basler, D. What role for photoperiod in the bud burst phenology of European beech. Eur. J. Forest Res. 2013, 132, 1–8. [Google Scholar] [CrossRef]
- Malyshev, A.V.; Henry, H.A.; Bolte, A.; Arfin Khan, M.A.; Kreyling, J. Temporal photoperiodic sensitivity and forcing requirements for budburst in temperate tree seedlings. Agr. Forest. Meteorol. 2018, 248, 82–90. [Google Scholar] [CrossRef]
- Lasch, P.; Lindner, M.; Erhard, M.; Suckow, F.; Wenzel, A. Regional impact assessment on forest structure and functions under climate change–the Brandenburg case study. Forest Ecol. Manag. 2002, 162, 73–86. [Google Scholar] [CrossRef]
- Asseng, S.; Ewert, F.; Rosenzweig, C.; Jones, J.W.; Hatfield, J.L.; Duane, A.C.; Boote, K.J.; Thorburn, P.J.; Rötter, R.P.; Cammarano, D.; et al. Uncertainty in simulating wheat yields under climate change. Nat. Clim. Chang. 2013, 3, 827–832. [Google Scholar] [CrossRef]
- Lindner, M.; Fitzgerald, J.B.; Zimmermann, N.E.; Reyer, C.; Delzon, S.; van der Maaten, E.; Schehaas, M.J.; Lasch, P.; Eggers, J.; van der Maaten-Theunissen, M.; et al. Climate change and European forests: What do we know, what are the uncertainties, and what are the implications for forest management? J. Environ. Manag. 2014, 146, 69–83. [Google Scholar] [CrossRef] [PubMed]
- Huang, S.; Krysanova, V.; Österle, H.; Hattermann, F.F. Simulation of spatiotemporal dynamics of water fluxes in Germany under climate change. Hydrol. Processes 2010, 24, 3289–3306. [Google Scholar] [CrossRef]
Figure 1.
The normalized sensitivity of the model’s output to tree and soil parameters, as well as to climatic inputs for both poplar and black locust. Tree parameters include the initial number of shoots (nShoot0), radiation use efficiency (εt), maximum leaf area for a single shoot (LAssmax), radiation extinction coefficient (kt), and the initial biomass (Bt0). The soil parameters consist of the pF value at field capacity (pF (FC)), potential evaporation (η), saturated volumetric water content (θs), soil depth, the critical pF value for evaporation (pFc), the permanent wilting point (PWP), the soil hydraulic conductivity at saturation (ks), and the van Genuchten parameters (α and nSoil).

Figure 2.
Measured woody biomass (dots) and modelled accumulated woody biomass (line) for: (a) poplar over a rotation period from 2011 to the end of 2014, and with regard to the planting density and number of samples (n = 50:333) and (b) black locust over a rotation period from 2010 to the end of 2013, and with regard to the planting density and number of samples (n = 50:360).

Figure 3.
Projected accumulated woody biomass of poplar trees under realisations that rendered minimum (R13, orange), mean (R4, light green; R27, dark green), and maximum (R41, blue) average precipitation sum values during the vegetation period from 2015 to the end of 2054.
Figure 3.
Projected accumulated woody biomass of poplar trees under realisations that rendered minimum (R13, orange), mean (R4, light green; R27, dark green), and maximum (R41, blue) average precipitation sum values during the vegetation period from 2015 to the end of 2054.

Figure 4.
Projected accumulated woody biomass of black locust trees under realisations that rendered minimum (R13, orange), mean (R28, light green; R58, dark green), and maximum (R82, blue) average precipitation sum values during the vegetation period from 2015 to the end of 2054.
Figure 4.
Projected accumulated woody biomass of black locust trees under realisations that rendered minimum (R13, orange), mean (R28, light green; R58, dark green), and maximum (R82, blue) average precipitation sum values during the vegetation period from 2015 to the end of 2054.

Figure 5.
Projected woody biomass of poplar trees under special realisations describing either the highest precipitation values (blue) or the lowest precipitation values (orange) with respect to the ten established growing periods.
Figure 5.
Projected woody biomass of poplar trees under special realisations describing either the highest precipitation values (blue) or the lowest precipitation values (orange) with respect to the ten established growing periods.

Figure 6.
Projected woody biomass of black locust trees under special realisations describing either the highest precipitation values (blue) or the lowest precipitation values (orange) with respect to the ten established growing periods.
Figure 6.
Projected woody biomass of black locust trees under special realisations describing either the highest precipitation values (blue) or the lowest precipitation values (orange) with respect to the ten established growing periods.

Figure 7.
The range of possible accumulated woody biomass shown by maximum (blue) and minimum (red) values obtained after four years of growth with respect to the ten established growing periods for (a) poplar and (b) black locust. Trend lines for the woody biomass are described by dash-dotted lines. The dashed lines represent the woody biomass, as per reference period.

Figure 8.
Projected minimum (orange), mean (green), and maximum (blue) yearly woody biomass increment of poplar trees with respect to the ten established growing periods.
Figure 8.
Projected minimum (orange), mean (green), and maximum (blue) yearly woody biomass increment of poplar trees with respect to the ten established growing periods.

Figure 9.
Projected minimum (orange), mean (green), and maximum (blue) yearly woody biomass increment of black locust trees with respect to the ten established growing periods.
Figure 9.
Projected minimum (orange), mean (green), and maximum (blue) yearly woody biomass increment of black locust trees with respect to the ten established growing periods.

Table 1.
Mean (±standard deviation) dry woody biomass for poplar and black locust trees with respect to the planting density and number of samples (n).
Table 1.
Mean (±standard deviation) dry woody biomass for poplar and black locust trees with respect to the planting density and number of samples (n).
| Species | Biomass after 1 Year (Mg ha−1) | Biomass after 2 Years (Mg ha−1) | Biomass after 3 Years (Mg ha−1) | Biomass after 4 Years (Mg ha−1) |
|---|---|---|---|---|
| Poplar | 0.4 ± 0.1 (n = 333) | 2.0 ± 0.5 (n = 150) | 12.9 ± 0.1 (n = 242) | 28.2 ± 2.7 (n = 50) |
| Black Locust | 0.1 ± 0.1 (n = 360) | 3.6 ± 0.5 (n = 306) | 9.1 ± 1.4 (n = 152) | 15.3 ± 3.4 (n = 219) |
Table 2.
Realisations (R, highlighted in parentheses) that rendered minimum, mean, and maximum average precipitation sum (P) and air temperature (T) values with respect to the vegetation period of both tree species and under a timeframe of forty years.
Table 2.
Realisations (R, highlighted in parentheses) that rendered minimum, mean, and maximum average precipitation sum (P) and air temperature (T) values with respect to the vegetation period of both tree species and under a timeframe of forty years.
| Average Values for the Vegetation Period | Poplar | Black Locust | ||||||
|---|---|---|---|---|---|---|---|---|
| Base Period (1974–2014) | Min. (2015–2054) | Mean (2015–2054) | Max. (2015–2054) | Base Period (1974–2014) | Min. (2015–2054) | Mean (2015–2054) | Max. (2015–2054) | |
| P [mm] T [°C] * | 324 | 254 17.3 * (R13) | 296 17.1, 17.4 * (R4, R27) | 327 17.5 * (R41) | 336 | 271 16.7 * (R13) | 303 17.1, 17.3 * (R28, R58) | 335 17.2 * (R82) |
| T [°C] P [mm] * | 16.0 | 17.0 283 * (R35) | 17.2 299, 299 * (R15, R86) | 17.5 283 * (R38) | 15.3 | 16.2 315 * (R84) | 16.6 298 * (R43) | 16.9 298, 332 * (R32, R41) |
* These values are subsidiary to the values of interest presented above.
Table 3.
Realisations (R, highlighted in parentheses) that rendered minimum and maximum accumulated woody biomass values for both tree species with respect to the ten established growing periods.
Table 3.
Realisations (R, highlighted in parentheses) that rendered minimum and maximum accumulated woody biomass values for both tree species with respect to the ten established growing periods.
| Accumulated Woody Biomass [Mg ha−1] | 2015–2018 | 2019–2022 | 2023–2026 | 2027–2030 | 2031–2034 | 2035–2038 | 2039–2042 | 2043–2046 | 2047–2050 | 2051–2054 |
|---|---|---|---|---|---|---|---|---|---|---|
| Poplar | ||||||||||
| Max. | 24.7 | 31.3 | 34.7 | 33.8 | 39.4 | 34.5 | 30.6 | 33.1 | 33.5 | 38.8 |
| Realisation | (R13) | (R27) | (R6) | (R49) | (R100) | (R37) | (R75) | (R82) | (R75) | (R62) |
| Min. | 15.0 | 14.6 | 15.9 | 12.9 | 13.7 | 15.3 | 13.5 | 10.9 | 12.9 | 12.9 |
| Realisation | (R26) * | (R56) * | (R18) | (R2) * | (R10) * | (R35) | (R69) * | (R2) * | (R16) | (R90) |
| Black Locust | ||||||||||
| Max. | 15.3 | 18.3 | 16.8 | 17.9 | 20.6 | 19.1 | 18.0 | 19.61 | 18.2 | 21.8 |
| Realisation | (R51) | (R27) | (R6) | (R74) | (R100) | (R96) * | (R75) | (R82) * | (R75) | (R63) |
| Min. | 9.4 | 8.9 | 10.0 | 7.9 | 8.6 | 9.3 | 8.5 | 7.1 | 8.0 | 8.2 |
| Realisation | (R19) * | (R56) * | (R18) | (R2) * | (R10) * | (R79) * | (R87) | (R2) * | (R16) | (R24) |
* Realisations that rendered low accumulated woody biomass while having a low precipitation input or on the contrary, that rendered a high accumulated woody biomass while having a high precipitation input.
Table 4.
Realisations that rendered minimum, mean, and maximum average woody biomass increment values for both tree species under a timeframe of forty years, together with their climatic characteristics in terms of average annual values for precipitation sum and air temperature.
Table 4.
Realisations that rendered minimum, mean, and maximum average woody biomass increment values for both tree species under a timeframe of forty years, together with their climatic characteristics in terms of average annual values for precipitation sum and air temperature.
| Average Woody Biomass Increment [Mg ha−1 a−1] | Projected Period (2015–2054) | R2 | R44 | R45 | R70 | R62 | R25 | ||||
|---|---|---|---|---|---|---|---|---|---|---|---|
| Poplar | Black Locust | Poplar | Black Locust | Poplar | Black Locust | Poplar | Black Locust | Black Locust | Poplar | Black Locust | |
| - | - | 4.5 | 2.8 | 5.4 | 3.3 | 5.4 | 3.3 | 3.3 | 6.5 | 3.8 | |
| P [mm a−1] | 296 | 303 | 270 | 279 | 313 | 316 | 304 | 301 | 310 | 306 | 313 |
| T [°C a−1] | 17.2 | 16.6 | 17.3 | 16.9 | 17.1 | 16.5 | 17.3 | 16.7 | 16.6 | 17.3 | 16.6 |
© 2018 by the authors. Licensee MDPI, Basel, Switzerland. This article is an open access article distributed under the terms and conditions of the Creative Commons Attribution (CC BY) license (http://creativecommons.org/licenses/by/4.0/).
Share and Cite
MDPI and ACS Style
Seserman, D.-M.; Pohle, I.; Veste, M.; Freese, D. Simulating Climate Change Impacts on Hybrid-Poplar and Black Locust Short Rotation Coppices. Forests 2018, 9, 419. https://doi.org/10.3390/f9070419
AMA Style
Seserman D-M, Pohle I, Veste M, Freese D. Simulating Climate Change Impacts on Hybrid-Poplar and Black Locust Short Rotation Coppices. Forests. 2018; 9(7):419. https://doi.org/10.3390/f9070419
Chicago/Turabian StyleSeserman, Diana-Maria, Ina Pohle, Maik Veste, and Dirk Freese. 2018. "Simulating Climate Change Impacts on Hybrid-Poplar and Black Locust Short Rotation Coppices" Forests 9, no. 7: 419. https://doi.org/10.3390/f9070419
Note that from the first issue of 2016, this journal uses article numbers instead of page numbers. See further details here.