Exploring the Use of Harvesters in Large-Diameter Hardwood-Dominated Stands


Department of Ecology and Ecosystem Management, Technical University of Munich, Hans-Carl-von-Carlowitz-Platz 2, 85354 Freising, Germany
*
Author to whom correspondence should be addressed.
Forests 2018, 9(7), 424; https://doi.org/10.3390/f9070424
Submission received: 21 June 2018
/
Revised: 6 July 2018
/
Accepted: 11 July 2018
/
Published: 15 July 2018
(This article belongs to the Section Forest Ecology and Management)
Abstract
:The use of fully-mechanized operations, normally targeted at coniferous species, has also been on the rise in mixed-species and continuous-cover forests comprised of a strong share of deciduous species. With special form characteristics (complex crowns, large-diameter branches, forks and sweeps, high wood density, etc.), deciduous trees can lead to wide-ranging harvesting productivities, often divergent from those originally derived from coniferous species. Due to the importance and growing interest in mechanizing operations in close-to-nature mixedwood and deciduous stands, obtaining insight on harvesting productivity in large-diameter deciduous trees was of interest. This study located in Bavaria, Germany, monitored four harvesters (two wheeled and two tracked machines) operated in four distinct harvest blocks (case studies), all of which had a high percentage of large-diameter European beech and oak trees. Harvesting productivity and volume recovery was assessed and quantified. Based on the field inventory of European beech and oak trees and continuous time-and-motion study, average harvesting productivity ranged from 29 to 43 m3/PMH0 (productive machine hours without delay), whereas volume recovery fluctuated between 73% and 85% for trees that were completely felled and processed by machines. Because of the rather limited sample size and the variable conditions between case studies, results should only be used as general orientation on the performance of the tested machines and additional research is suggested to further understand the influence of tree form characteristics on impediments to mechanized processing.
1. Introduction
The use of machines in forest operations has been on the rise in many countries. In German public forests, approximately half the wood volume harvested is with fully-mechanized systems, commonly comprised of (single-grip) harvesters and forwarders [1]. From the time of their development in the Nordic countries, single-grip harvesters and especially harvesting heads have been adapted to the characteristics of coniferous trees, for which they normally reach their highest productivity. With the higher shares of deciduous species being both naturally or artificially regenerated and managed under a close-to-nature forestry, the level of interest in expanding the use of mechanized cut-to-length (CTL) systems into mixedwood and deciduous stands is increasing. At a first glance, the advantages seem noteworthy; increased worker safety and improved ergonomics, but most of all, higher productivity compared to motor-manual operations. However, deciduous trees possess complex morphology exhibiting large branches, forks, severe crooks and sweeps, and overall more diverse crown architecture compared to coniferous species. Accordingly, Labelle et al. [2] reported a 20% reduction in harvesting productivity of a fully-mechanized CTL system operated in a sugar maple (Acer saccharum M.) stand with complex tree form as compared to those with simple architecture. Moreover, deciduous and coniferous trees have different physical characteristics, which significantly affect productivity of forest operations [3,4,5]. Specifically, deciduous trees have higher wood density: for example, for European beech (Fagus sylvatica L.), the most common deciduous species in Germany, a wood density in the order of 753 kg/m3 at 12% moisture content was reported by Gryc et al. [6], whereas for Norway spruce (Picea abies (L.) Karst.), the most commercially significant softwood species in Europe, oven-dry wood densities of around 438 kg/m3 have been found [7].
These considerable differences make the use of existing productivity functions, derived from coniferous species, misleading when attempting to anticipate the productivity of CTL harvesters operated in close-to-nature mixedwood or deciduous forest stands. While in recent decades, various studies of harvesting productivity under different conditions have been performed (e.g., [8,9,10,11,12]), studies on the performance of harvesters in central European hardwood-dominated stands are scarce, particularly when considering large-diameter trees. In a pilot study, Labelle and Windisch [13] investigated the performance and productivity of a high-powered harvester in a mixed beech/spruce stand, with a higher time required for beech processing compared to spruce. There is a need to further investigate the performance and, where applicable, the operational limits of available harvesting equipment more closely. Because of increased operational flexibility with regard to the time of harvesting, and especially because of work safety, the frequency of fully-mechanized operations in deciduous stands is increasing. The highest risks of life-threatening injuries occur during harvesting by motor-manual systems; therefore, the increased usage of machines makes the work conditions safer for the operators and reduces the amount of serious accidents [3]. The productivity of wood harvesting is affected by a number of factors such as tree size, tree characteristics, terrain, site conditions, operators’ skills [10,14], and machines or working techniques being used [4]. In this study, the objective was to quantify the harvesting productivity and volume recovery of four different CTL harvesters (two wheeled and two tracked machines) operated in mixed and pure beech stands in southern Germany.
2. Materials and Methods
2.1. Experimental Design and Tree Inventory
Four independent case studies were performed during regularly scheduled forest operations at four sites in Bavaria, Germany: Bad Brückenau (BB), Hammelburg (HA), Heigenbrücken (HG), and Rothenbuch (RO). European beech and pedunculate or sessile oak (Quercus robur L. or Q. petraea (Matt.) Liebl.) were the target species. In all four sites, the silvicultural treatment selected was a regeneration cut aimed at removing approximately 25% of the standing volume.
In each case study, test plots ranging from 100 to 200 m in length and about 30 m in width were established on pre-existing machine operating trails. The aim of the experimental design was to provide approximately 110 target trees (100 target trees plus 10% as a reserve for operational difficulties) for each case study, thus requiring between five and seven plots per study site. Beech and oak trees that had a diameter at breast height (dbh) of at least 20 cm and that were selected and marked for removal by a district forester were given a unique alpha-numeric code that was painted on two sides of the tree at a height of 2–3 m. The codes were oriented at about a 45-degree angle to the machine operating trail to facilitate visibility by the operator and the researcher performing time-and-motion studies. Additionally, every target tree was identified by species and measurements of dbh with centimeter accuracy done with a caliper, whereas total tree heights were recorded with a digital height, distance, and inclination instrument with meter accuracy. Standing merchantable volume per tree (>7 cm diameter) was calculated according to the equation provided by Franz et al. [15] using tree dbh and height as inputs. Due to changes or disruptions of the work processes in the ongoing operations and the loss of data in the recording of work elements, the number of experimental trees remaining in the evaluation decreased to 79 in BB, 67 in HA, 104 in HG, and 72 in RO. Data loss mainly occurred since the researcher performing the time-and-motion study of the mechanized operations needed to manage his personal safety (keep a safe distance from the harvester) while maintaining adequate visibility of the harvesting head, which made it very difficult to correctly and completely capture all work elements for each removal trees. In the case of fragmented data collection, a comment was inserted in the hand-held computer to identify the incomplete cycle, which was later removed from analyses. In some other cases, reference quantities (volume) could not be retrieved.
2.2. Machines Tested
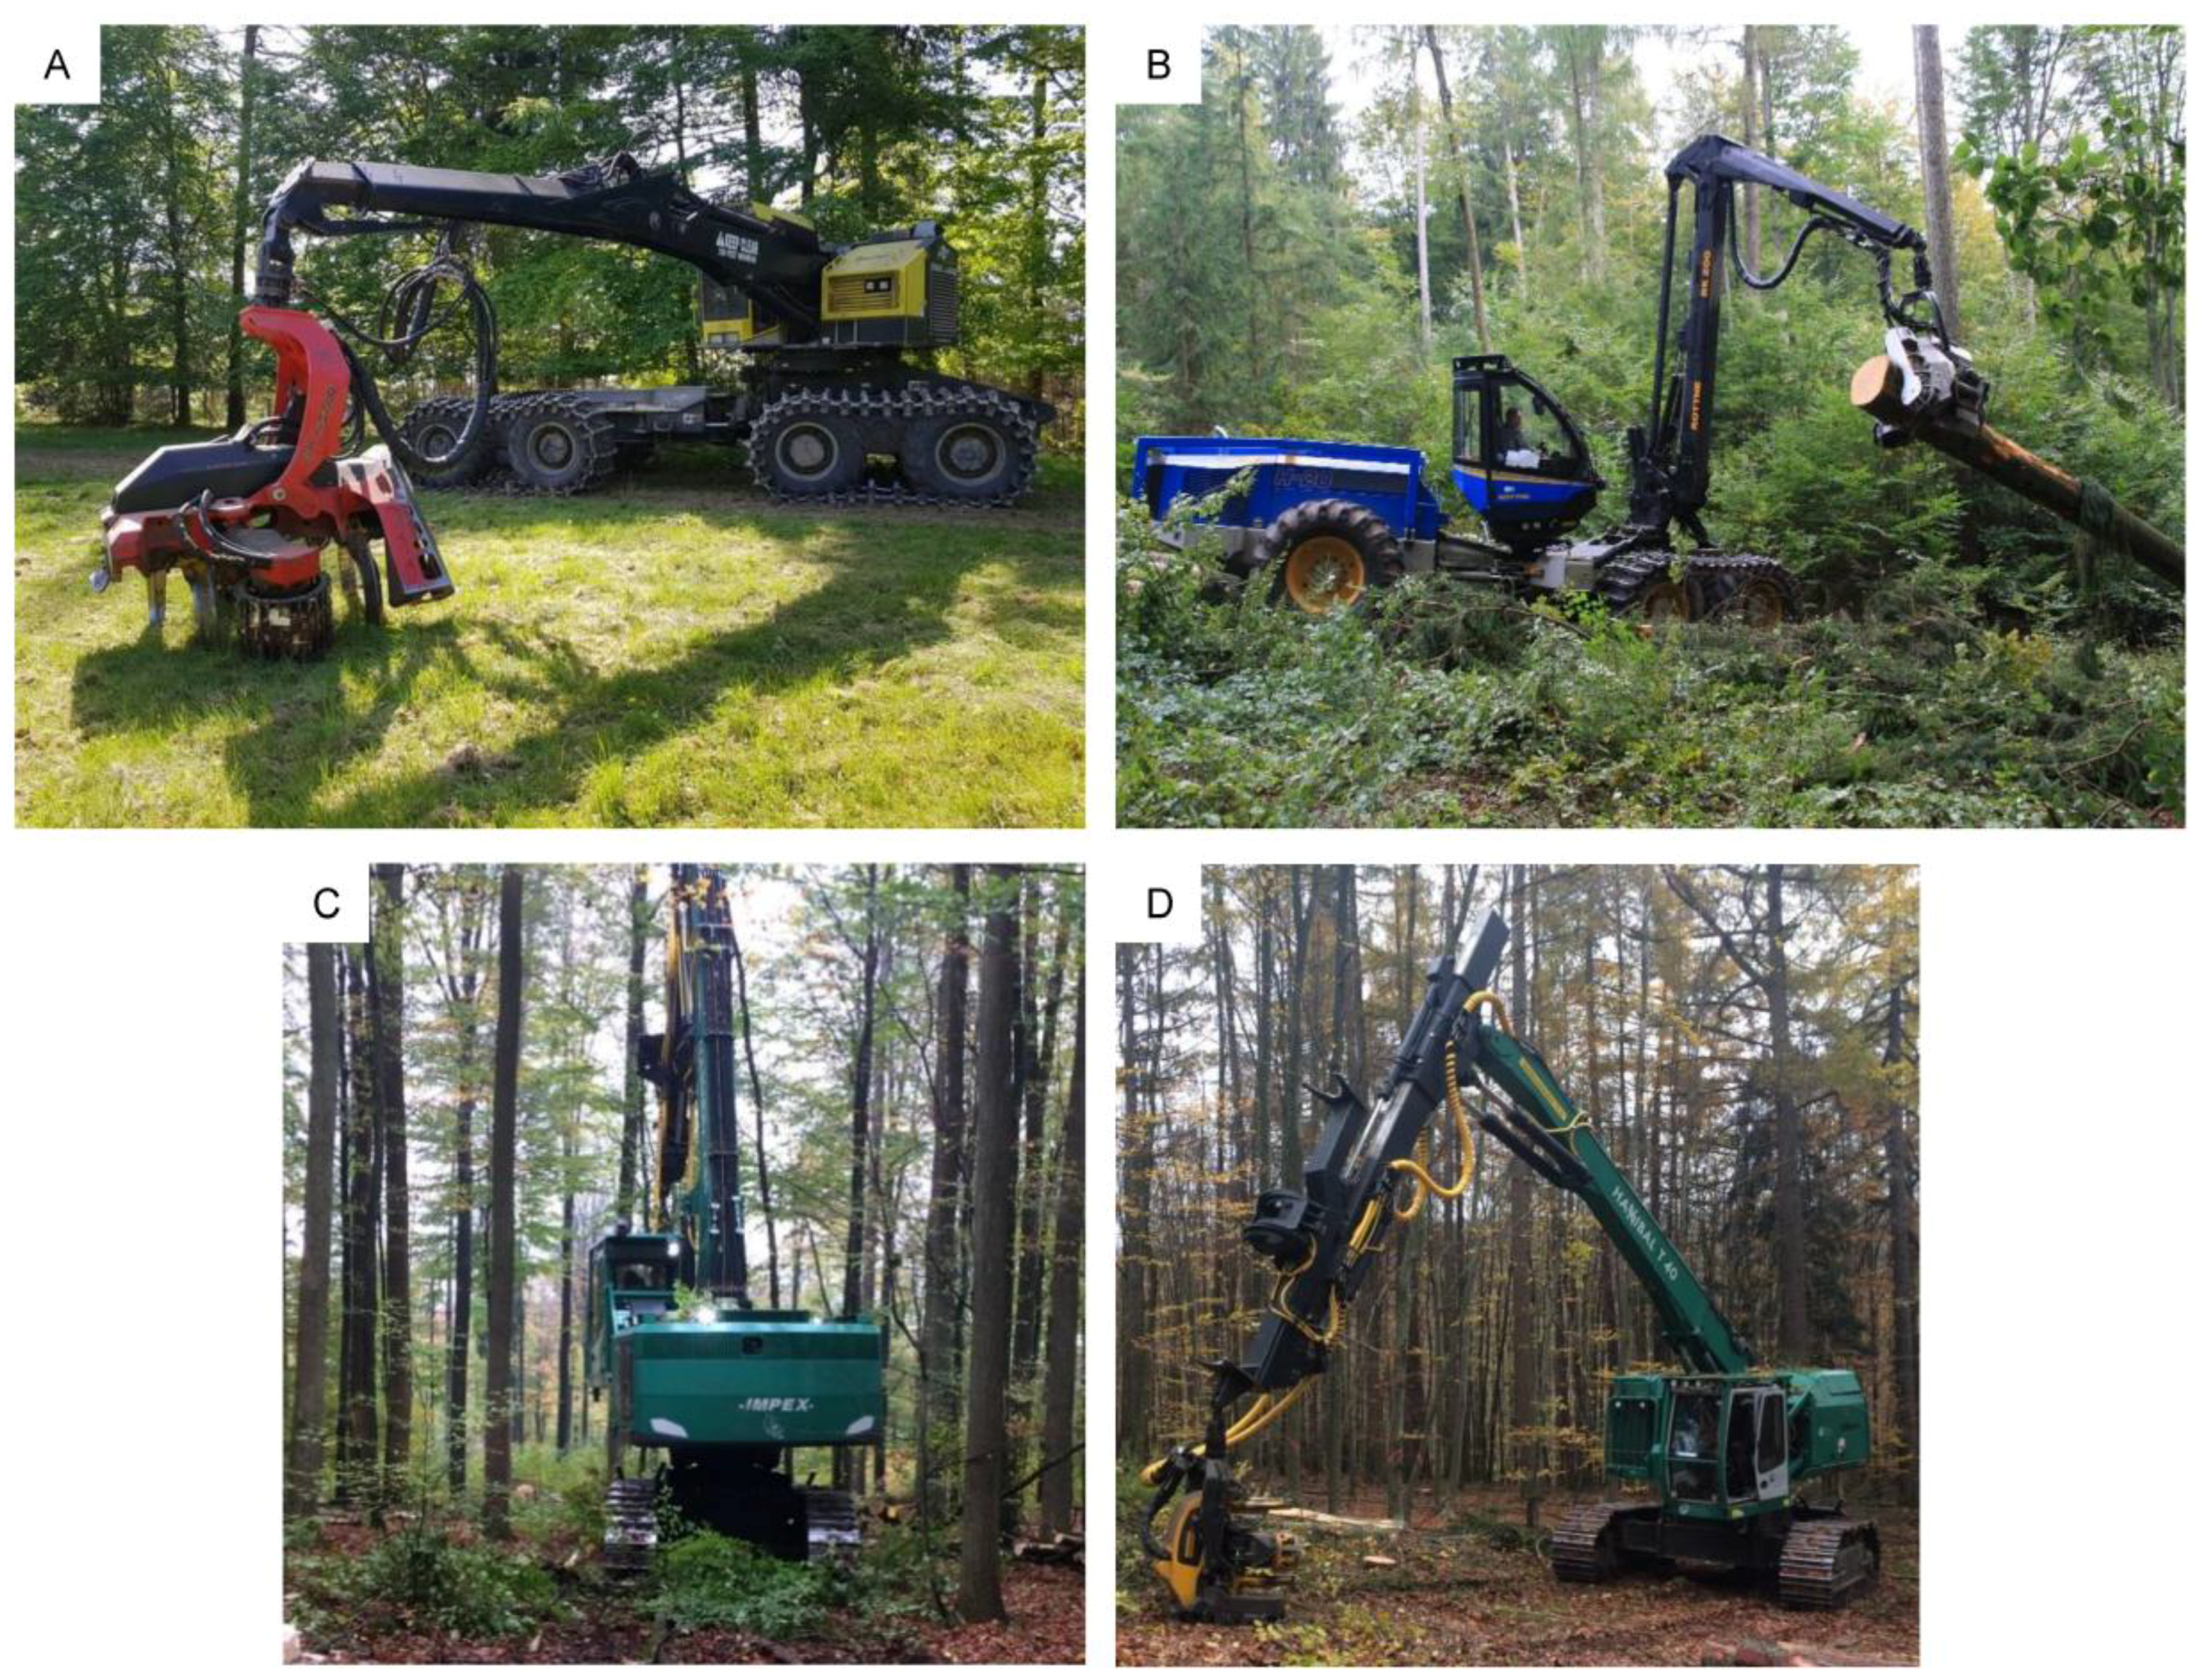
This project focused on two wheeled and two tracked machines operated in the four case studies previously mentioned. The wheeled machines were a TimberPro TF840-B (TimberPro Inc., Shawano, WI, USA) with SP861LF harvesting head (SP Maskiner, Ljungby, Sweden) equipped with a top-saw and a Rottne H20 (Rottne Industri AB, Rottne, Sweden) equipped with a Rottne EGS700 head (Rottne Industri AB, Rottne, Sweden) utilized at the BB and HA sites, respectively (Table 1 and Figure 1). Two tracked harvesters, specifically the Impex Hannibal T50 (Impex Forstmaschinen GmbH, Straubing, BY, Germany) with a Lako 1118 head (Lako Oy, Turku, Finland) as well as an Impex Hannibal T40 (Impex Forstmaschinen GmbH, Straubing, Germany) with a Ponsse H8 head (Ponsse Oyj, Vieremä, Finland) were operated at the HG and RO sites, respectively. The harvesters were also equipped with different measuring and control systems; only the two wheeled machines had the same system (Dasa5).
2.3. Time Study and Operational Data
To collect detailed information during live forest operations, a conventional time-and-motion study was performed with a handheld Juniper Allegro computer using the FPInnovations TS1000 software (FPInnovations, Montreal, QC, Canada). Each cycle, referring to the combined tasks required to reach, fell, and process a target tree, was divided into several work elements; moving, boom-out, felling, processing, manipulation, operational delays, and nonoperational delays (Table 2). All delays were removed for data analysis, and thus time shares and harvesting productivity are presented based on productive machine hours without delay (PMH0). Sequences that were not attributable to the individual tree (cycle), such as moving or manipulation, were standardized for the individual case studies; i.e., the times were summed up and equally allocated to all trial trees in a case study. In addition to conventional time-and-motion study, a video camera was mounted in the cabin of each harvester and aimed so that both the display of the measurement and control system and, if possible, the harvester head lay in the field of view. This enabled us to link the alpha-numeric code of each target tree to the number assigned by the measuring and control system located in the cabin of the machine. For the (frequent) case that the tree number was not in the field of view of the video camera, the machine operators were asked to announce aloud the number on the target trees, so that they were recorded on the soundtrack of the video.
All of the reports produced by the harvesters’ harvesting and control systems (files according to Standard for Forest Data and communications ) were collected after the completion of the respective operations and single-volume production reports (PRI files) were used to determine the reference quantities, e.g., diameter, length, and assortment of all produced logs. Since no PRI files were stored in the HA case study, the reference quantities had to be determined from video recordings of the operator’s cabin showing the display of the measurement and control system during the work.
2.4. Specifics of Case Studies and Data Groups
Because of the average spacing between adjacent machine operating trails (approximately 30 m) in conjunction with large tree dimensions in the BB and HG case studies, the TimberPro TF840-B and Impex Hannibal T50 harvesters required motor-manual operations outside the limits of the (usable) boom reach (Table 3). Time study data collected from the BB and HG test sites were therefore subdivided into two groups as these case studies also included trees harvested motor-manually. The “fully-mechanized” (FM) group includes data from all removal trees that were felled and processed entirely by the harvesters, whereas the “motor-manual” (MM) group summarizes the data of the removal trees that were motor-manually felled by forest workers and then processed by the harvesters. Because of stand and operational characteristics, work technique also varied between sites. In BB, trimming of butt flare and prenotching of larger diameter trees that were within harvester boom reach was performed by chainsaws to facilitate the felling process by the harvester.
Average tree dbh ranged from 35.6 to 46.9 cm for HA and HG sites, respectively, whereas average tree heights showed less variation and oscillated between 28.3 and 29.1 m for RO and BB sites, respectively (Table 4). Lowest average merchantable tree volume of 1.7 m3 on bark (o.b.) was calculated for HA, while the highest average merchantable volume of 2.9 m3 o.b. was calculated in HG.
2.5. Statistical Analyses
The statistic package IBM SPSS 21 was used for the statistical analyses. Prior to the analysis of the time study data, distributions of tree dbh in the individual case studies were examined for normality. Since normal distributions of dbh could not be assumed in all case studies, the nonparametric Kruskal–Wallis test was used to test for differences in dbh distribution between case studies. For the post-hoc tests, i.e., pairwise comparisons, Dunn tests with Bonferroni significance correction were applied. Simple mean comparisons were made with the two-sided t-test. Differences in productivity between the case studies were tested for statistical significance using analysis of covariance with the variable dbh as a covariate. A significance level of 5% was used throughout all statistical analyses.
3. Results and Discussion
3.1. Preharvest Inventory of Removal Trees
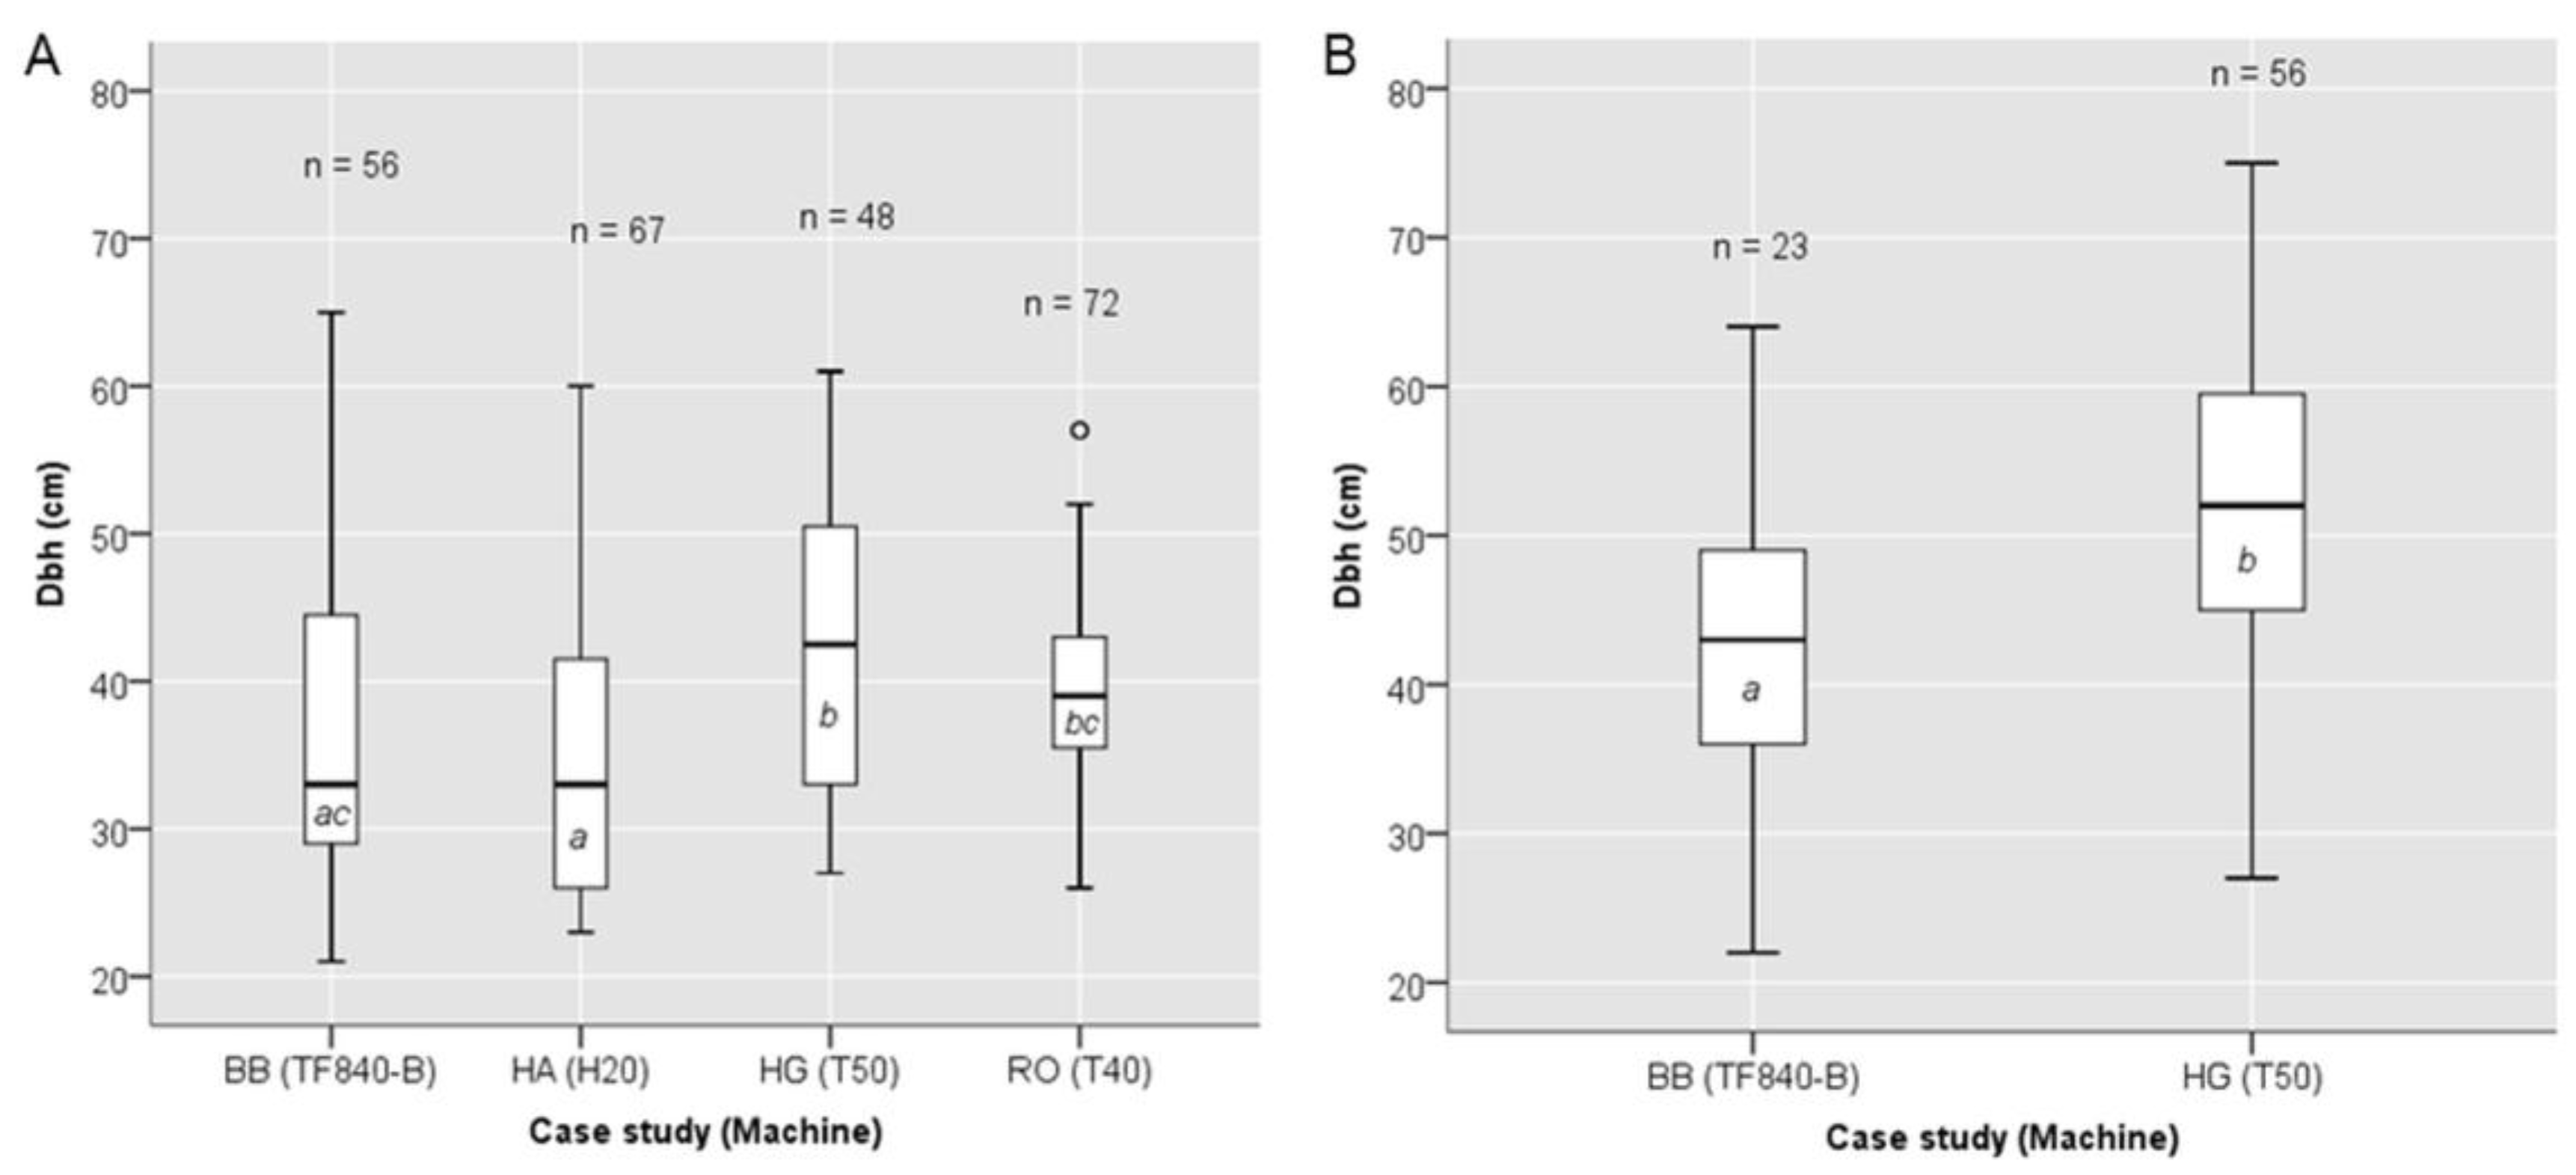
The dbh distributions of the removal trees were found to be significantly different between the four case studies. In the FM group, dbh distribution in BB differed significantly from dbh distribution in HG, while dbh distribution in HA differed significantly from dbh distributions in both HG and RO (Figure 2A). Concerning the MM group, dbh distributions in BB and HG differed significantly (Figure 2B). Due to these differences between the individual case studies, an influence of tree size on measured harvester productivity has to be taken into account when comparing the results of the case studies.
Total harvested volume was approximately 354 m³ under bark (u.b.) in the FM group and 109 m³ u.b. in the MM group. In the case of the MM group in HG, sawlog volume (amounting to 69 m³ u.b.) was not regarded in the analysis, since the sawlogs (butt logs of variable lengths) had been bucked off motor-manually at the time of prefelling and thus were not processed by the tested CTL harvester.
3.2. Duration of Cycles and Work Elements
3.2.1. FM Group
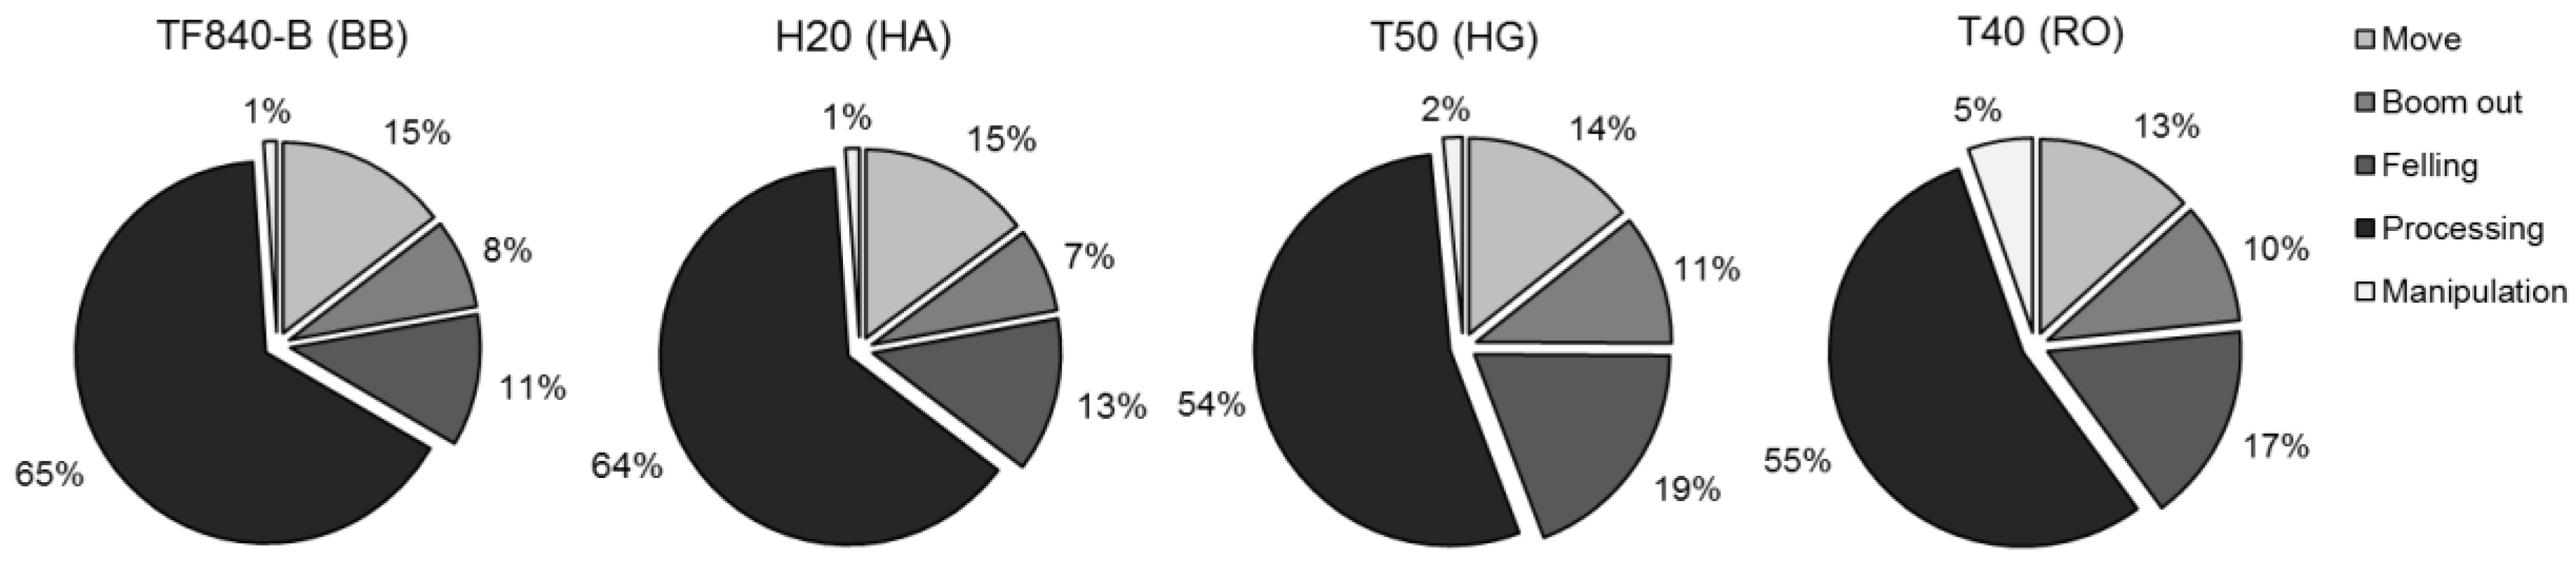
The average time required for a complete cycle in the FM group ranged from 1.97 to 2.78 min for the different case studies (Table 5). The shortest cycle time was observed for the TF840-B in BB, while for the other three case studies, the spread of cycle times was considerably narrower, with durations of 2.49 min (HA) to 2.78 min (RO). The relative shares of mean cycle duration for the individual work elements are presented in Figure 3. The most time-consuming work element was processing, which on average took between 54% and 65% of the entire cycle duration, while the least time-consuming was manipulation, with only 1–5% of cycle duration.
Considering the work element boom-out, a difference between the tracked machines with their long-reach booms and the wheeled machines was noticeable: While the wheeled machines showed mean durations of this work element of 0.15 and 0.18 min (8% and 7% relative share of cycle duration), boom-out took on average about 0.10 min longer for the tracked machines (11% and 10% of cycle duration). Whether this difference was caused by frequently exploiting the boom length of the tracked machines to reach trees farther away from the machine operating trails or rather by a slower boom speed of the tracked harvesters could not be clearly isolated. Equal time consumption for moving was recorded for the tracked machines and the H20 with about 0.37 min, whereas for the TF840-B, this work element took slightly less time. At least, with the given distribution of removal trees in this study, no time-saving effect of a long boom reach (due to the machine reaching more trees from a single position) could thus be noted. For the work element felling, the lowest average duration could be observed in the case of the TF840-B (BB) with 0.22 min; this was markedly lower compared to the time consumption of this work element in the other case studies. To some extent, this observation can be explained by the working technique applied in BB: In addition to prefelling beyond boom reach, large trees within the boom zone were also motor-manually prepared for the harvester by trimming root flares, cutting a felling notch, and indicating the predefined felling direction on the tree trunk. Regarding time shares of work elements in general, our findings are in line with those from Labelle et al. [2], who for example, reported a 71% share for the work element processing when using a purpose-built single-grip harvester operated in a sugar maple stand (avg. dbh of 33 cm) in Eastern Canada.
3.2.2. MM Group
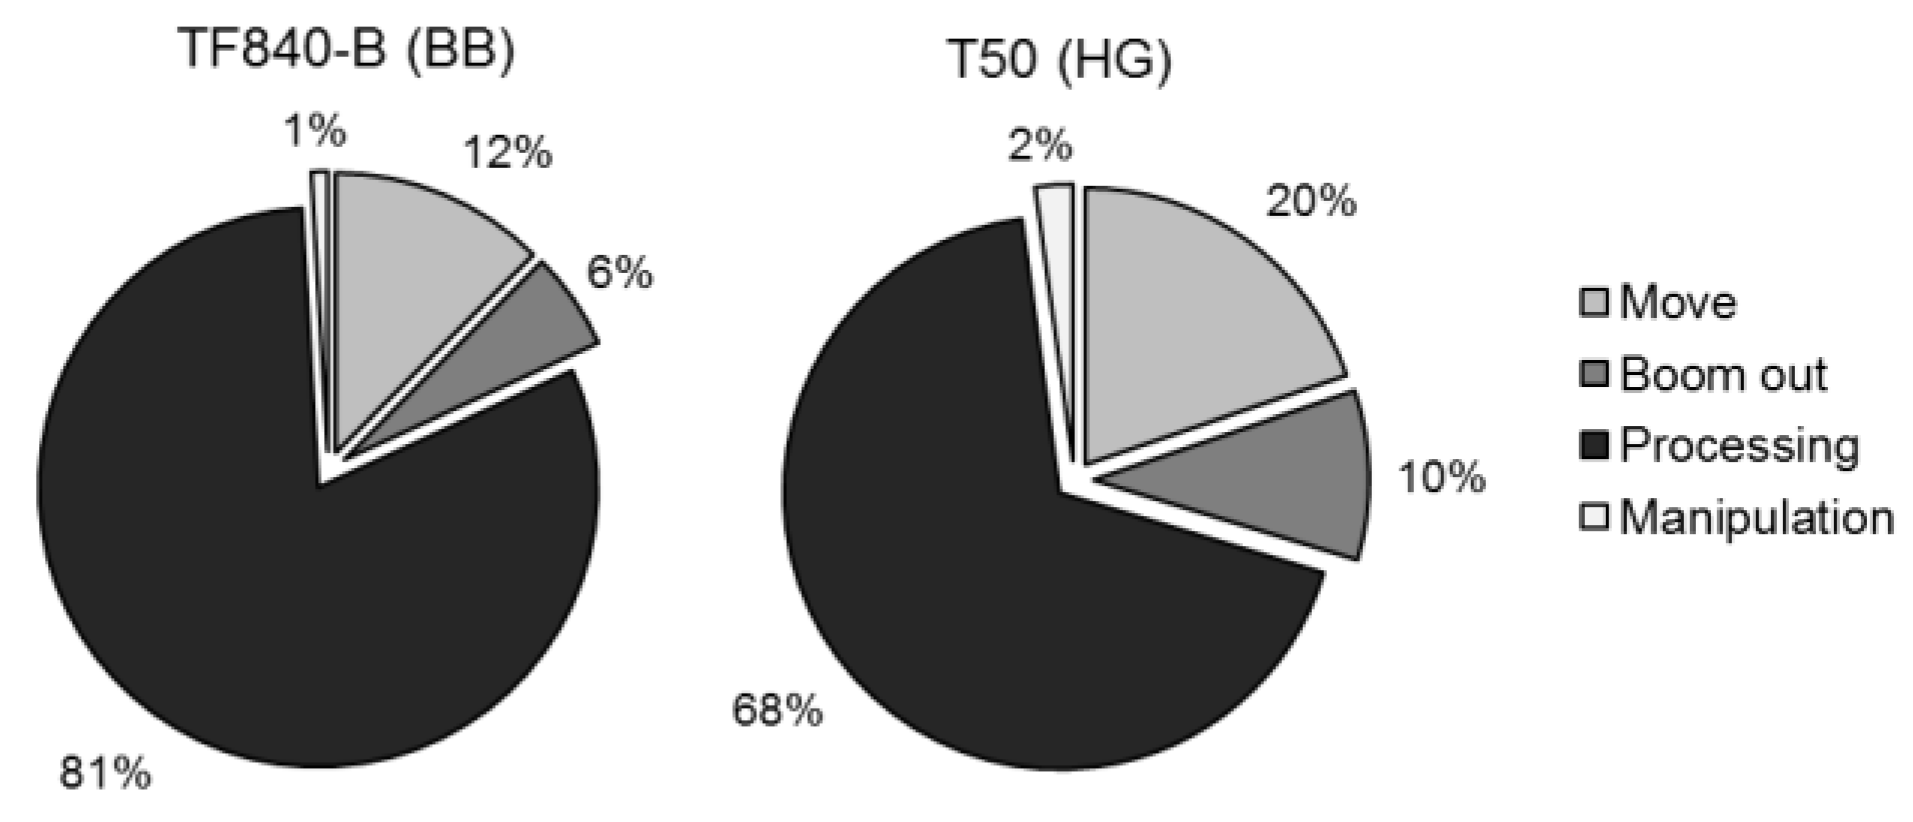
In the MM group, mean cycle durations were 2.30 min in the case of BB and 1.82 min in the case of HG (Table 6). Since the work element felling was not present here, the relative share of processing was considerably higher than in the FM group, with 68% of mean cycle duration in the case of HG and 81% in the case of BB (Figure 4). This large difference between the case studies, on average 0.62 min in absolute figures, can be largely attributed to the fact that in HG the butt logs, and thus a considerable part of the prefelled trees, were not processed by the harvester at all. Furthermore, a tendency to aim for short cycle times at the expense of wood recovery was observable in the video recordings from HG.
3.3. Harvesting Productivity
Productivity was calculated for each case study or data group, respectively, as an average of the ratio of harvest volume and time required for each cycle, extrapolated to one hour.
3.3.1. FM Group
Overall, the harvesting productivities observed in the four case studies were on a considerably high level, ranging from 28 to 49 m³/PMH0 (Table 7). In all four case studies, productivity of the tested harvesters increased with greater tree size as reported in two dbh classes (20 to 39 cm and 40 cm and above). However, while productivity was 26% and 40% higher with the larger tree size (dbh) class for the TF840-B and T50, respectively, less pronounced increases of 14% and 6% were observed for the H20 and T40, respectively. No apparent cause for this observation could be identified; however, we assume a combined effect of the operators’ working techniques and, probably more important, the harvesting heads of the H20 and T40 reaching their capacity limits.
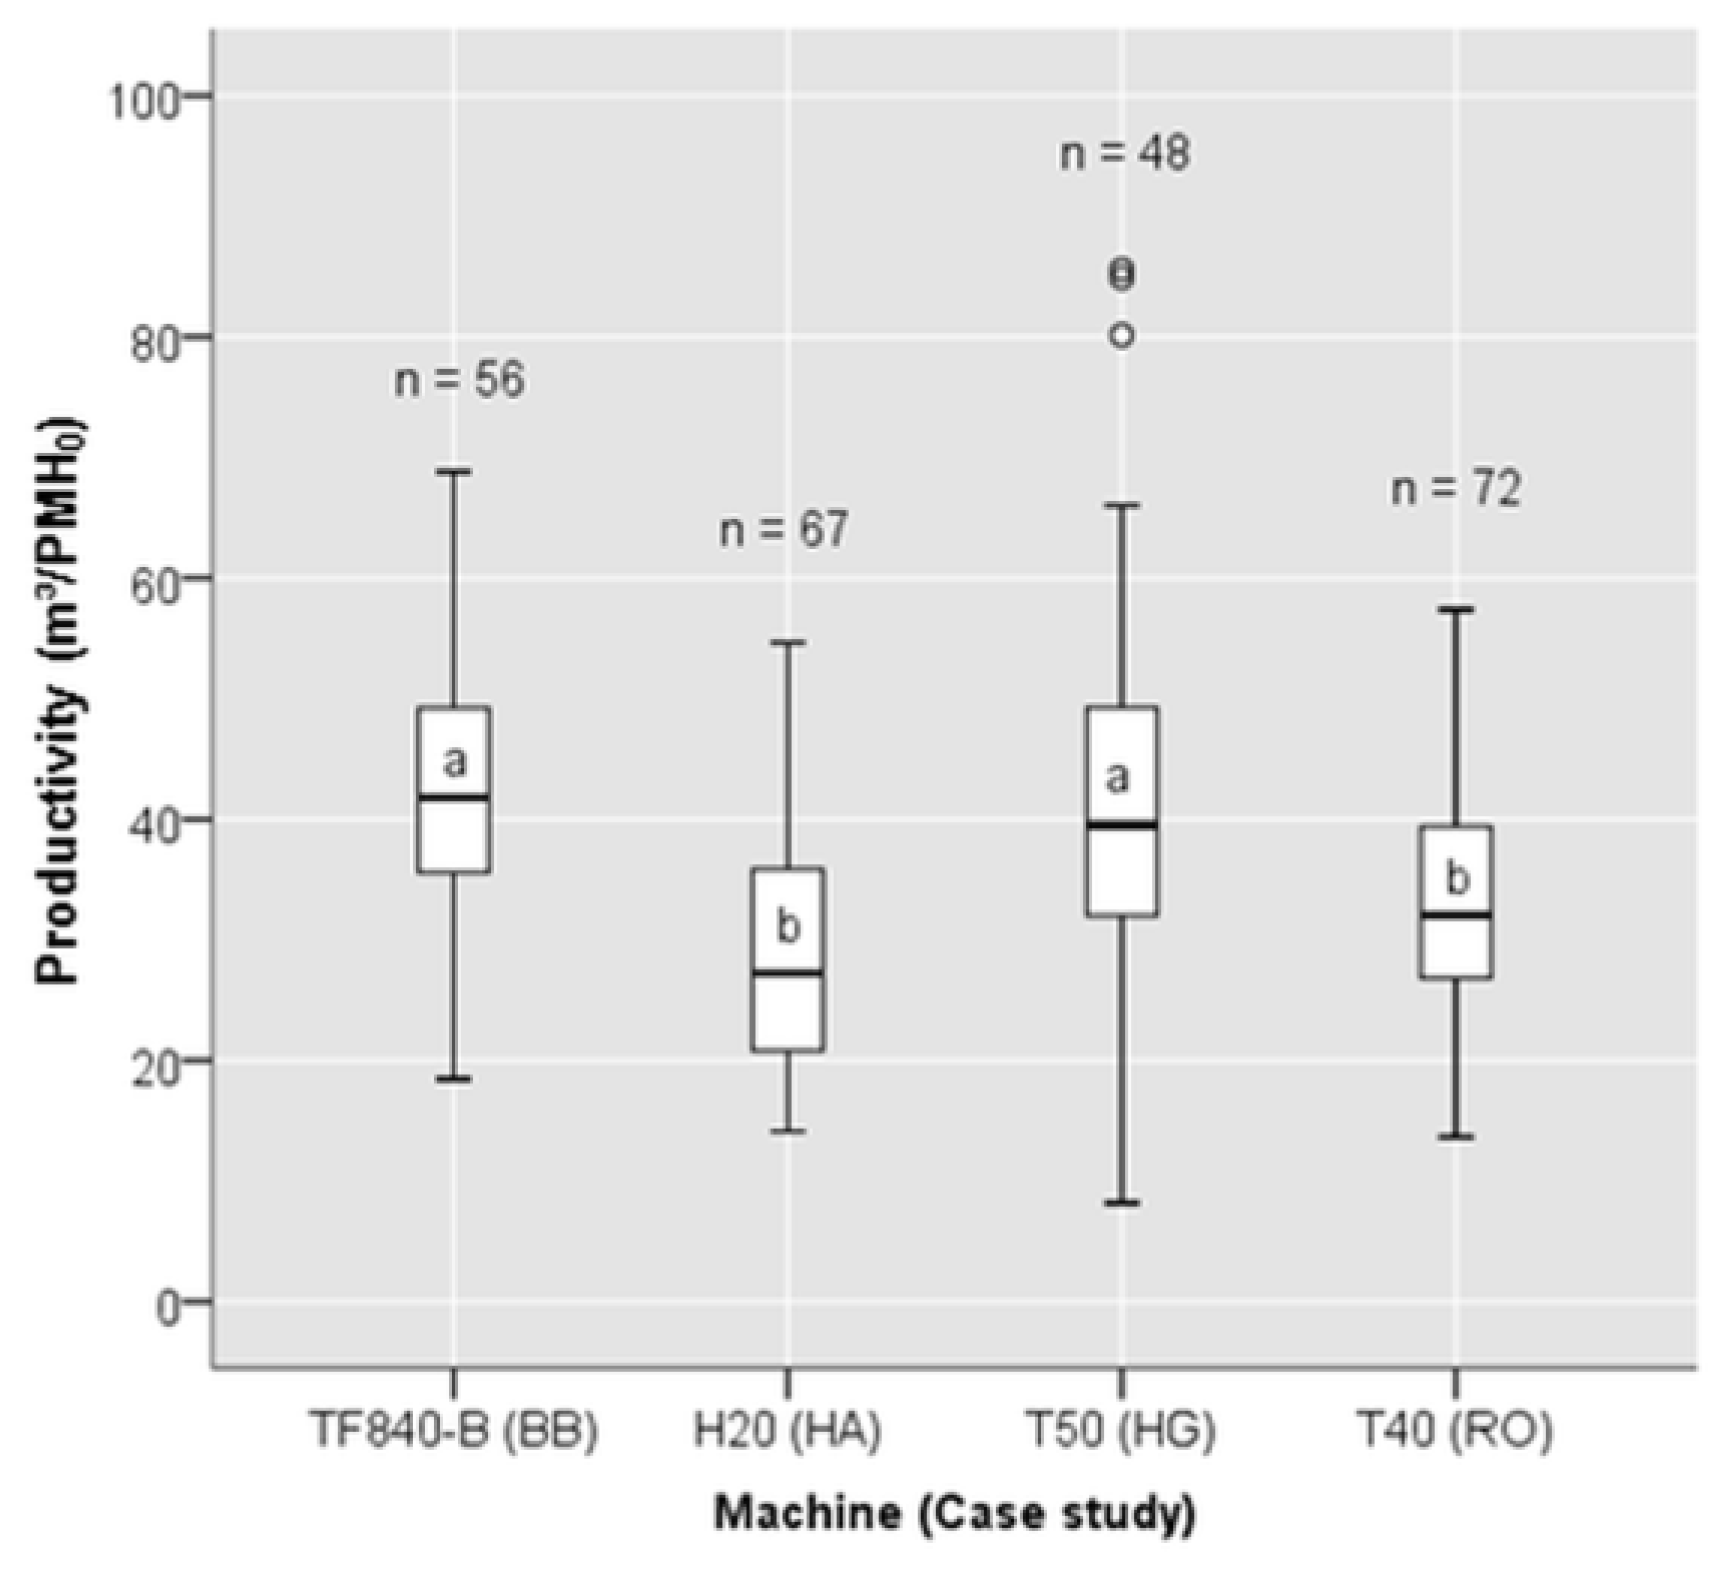
Regarding average harvesting productivity across all dbh classes, the TF840-B and T50 were on par with 43 m3/PMH0 and at the same time considerably higher than the average productivities of the other two harvesters, these being 29 m3/PMH0 for the H20 and 34 m3/PMH0 for the T40. The subdivision of the tested harvesters into two groups in terms of productivity, that these observations implied, was confirmed by the analysis of covariance performed: the productivities of the H20 and the T40 were significantly different from the productivities of the TF840-B and the T50 (Figure 5). Additionally, the analysis of covariance indicated that 31% of the variation of harvesting productivity (across all case studies) was explained by the combination of machine type (strictly speaking: case study) as factor and dbh as independent variable (covariate).
Given the constraint that sample size was rather low, the match in productivity by the TF840-B and the T50 can be explained, on the one hand, by the fact that the TF840-B was comparable to the tracked machines in terms of engine output and capacity of the harvesting head. On the other hand, the previously mentioned working technique of motor-manually preparing particularly large trees might also have contributed to the high productivity of this machine via the time savings during felling. The lower productivity observed for the H20 can be partly explained by the lowest average dbh of removal trees (35.8 cm) as compared to the other case studies and also due to the lowest capacity according to the technical specifications. However, no obvious explanation for the noticeable productivity difference between the very similar T40 and T50 harvesters could be found. The discrepancy, which was most pronounced for the larger trees, could be linked to the operators’ working technique and other factors difficult to capture quantitatively.
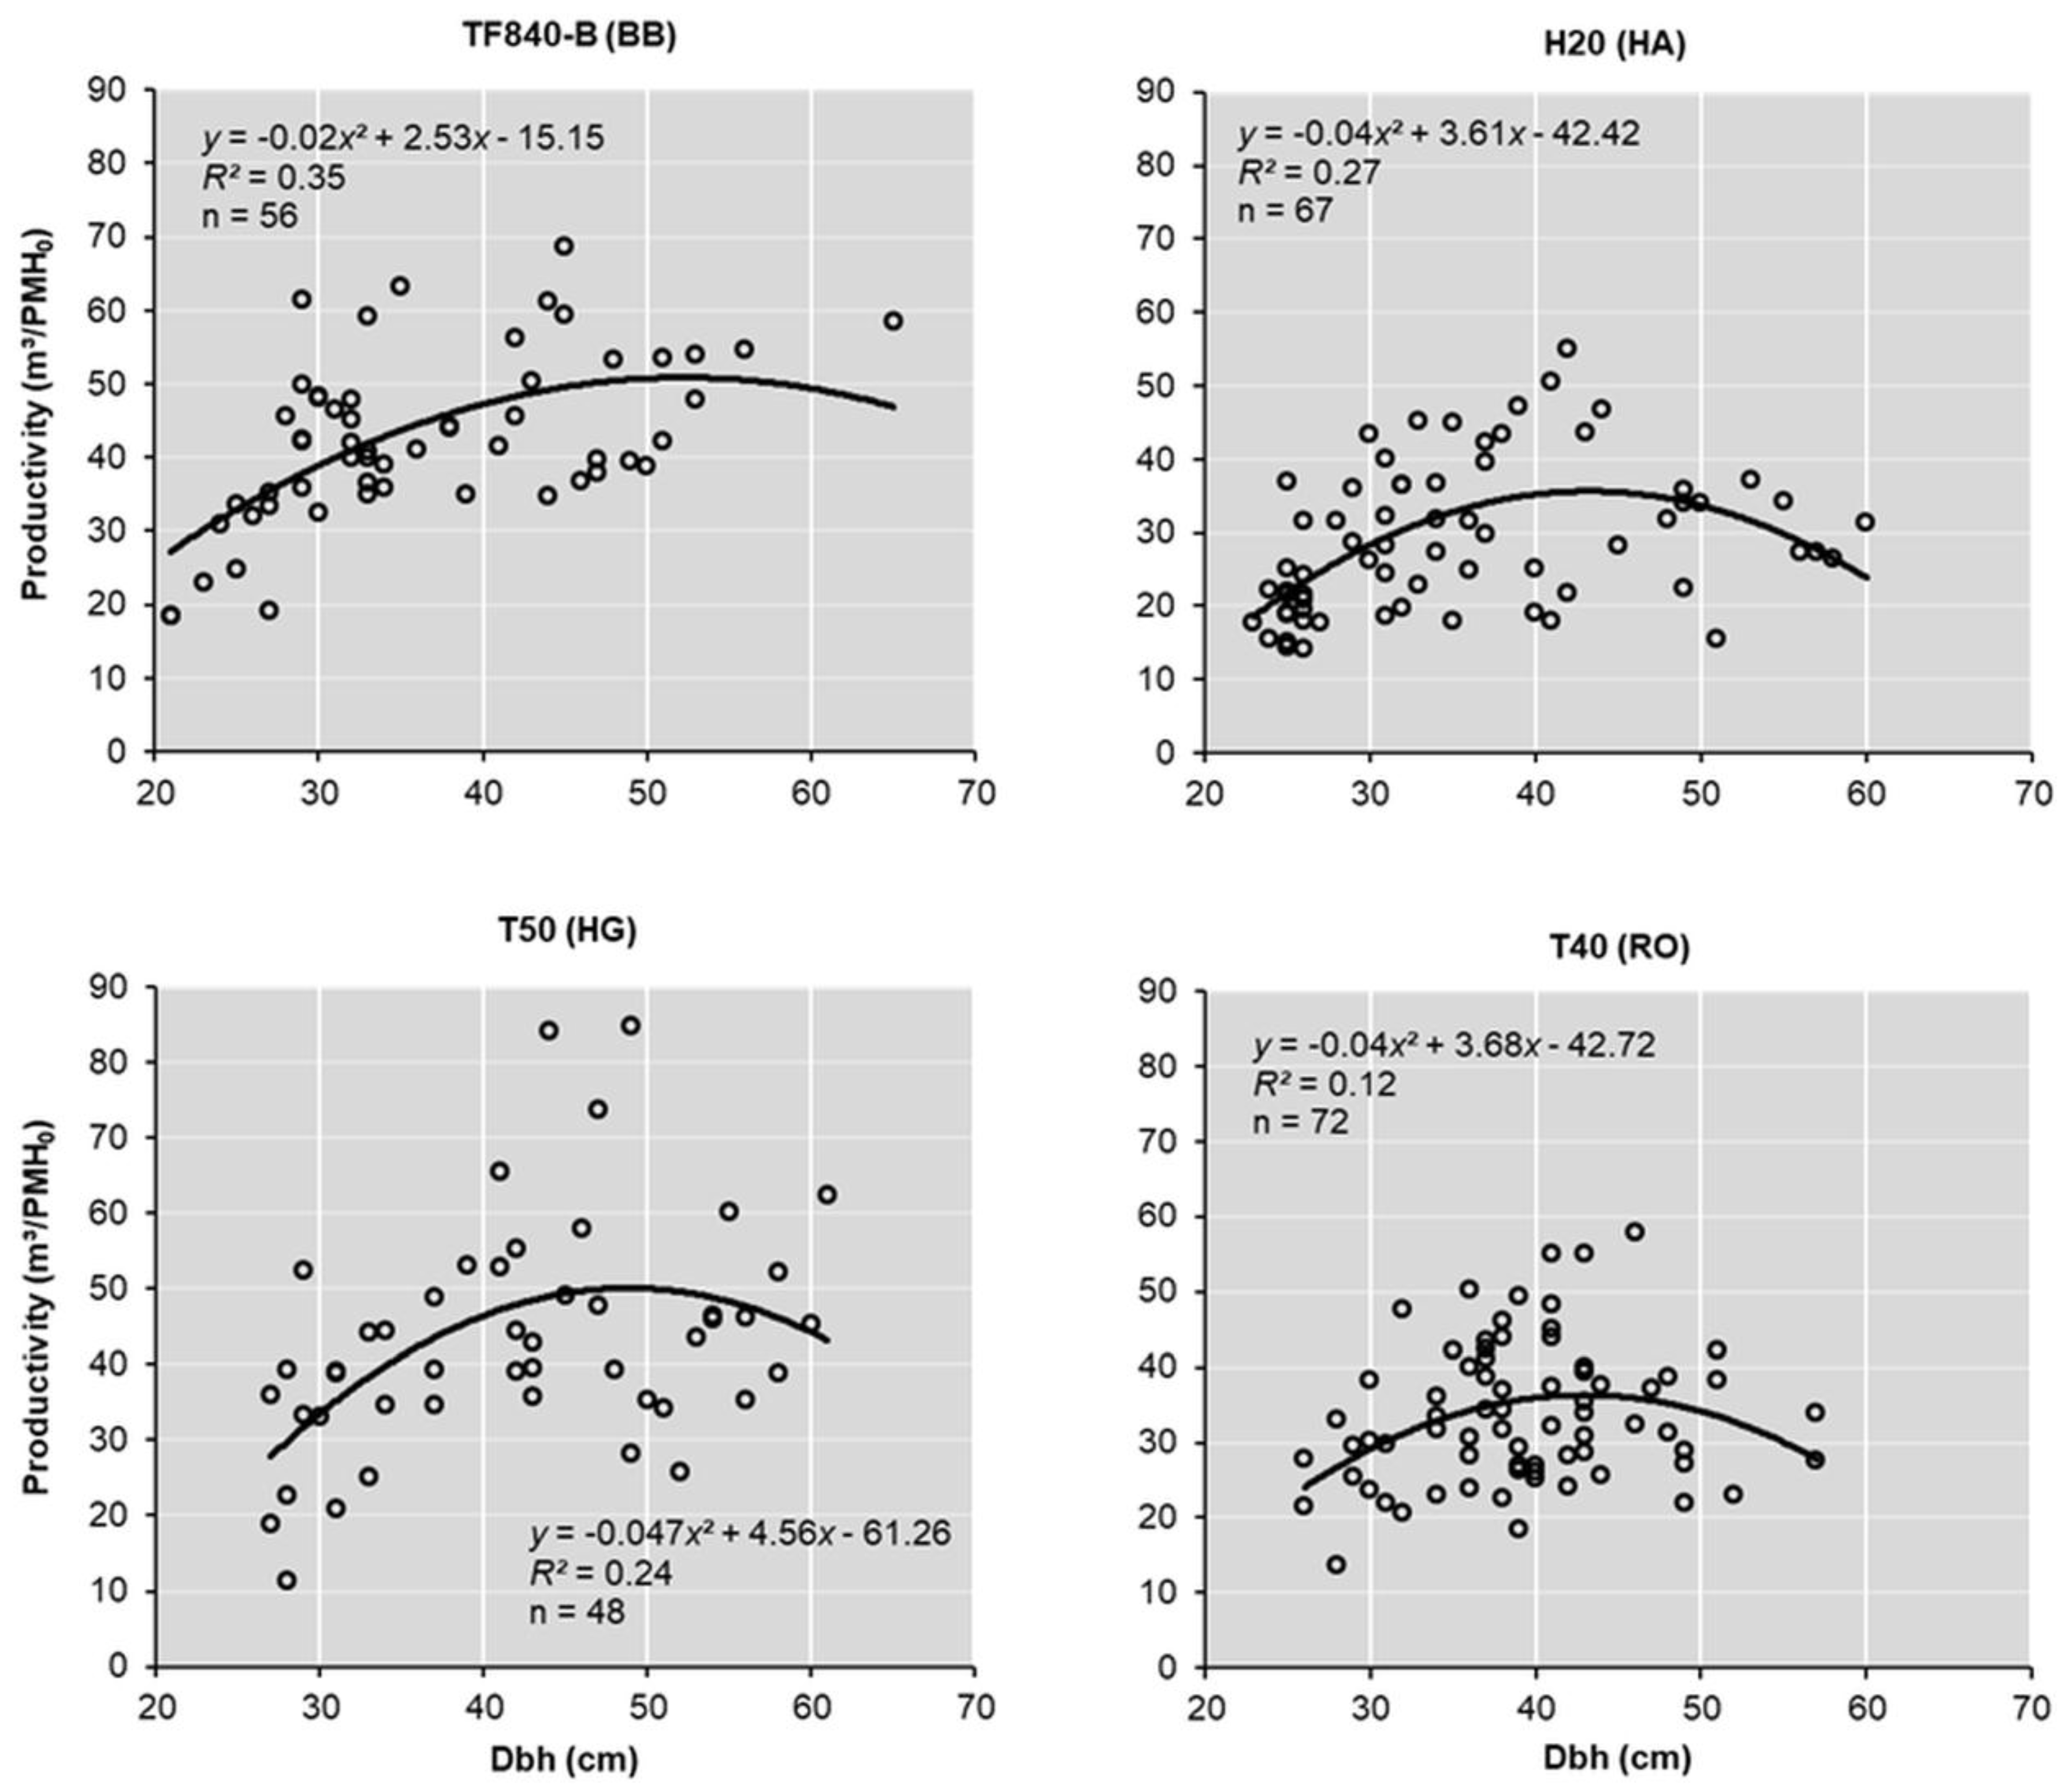
In the case of the TF840-B and the T50, regression curves show productivity maxima of approximately 50 m3/PMH0 at a dbh slightly above or below 50 cm; while in the case of the H20 and the T40, the maxima of about 35 m3/PMH0 were just below a dbh of 45 cm, as can be seen in Figure 6. The rather low coefficients of determination are in line with other published works performed in deciduous stands [2], while remaining lower than those normally reported in coniferous stands [18,19]. In the case of deciduous trees, other factors (tree morphology, single-tree volume) aside from dbh seem to strongly influence harvesting productivity.
Higher-than-expected harvesting productivities can also be explained by the fact that the deciduous trees removed in all four case studies were relatively tall (avg. of 28.8 m) and that the majority of the first two-thirds of the merchantable sections rarely exhibited large branches or other form characteristics that would hinder processing.
For large trees (merchantable stem volume > 1 m³) of mixed species, but mainly spruce and pine, Gerasimov et al. [20] found productivities by a John Deere 1270 that were even substantially higher (by a factor of 2) than those observed in our study. However, these productivities were based on so-called “stem processing time” that excluded the work elements moving, boom-out and manipulation and are thus not directly comparable. In line with our findings, Pajkoš et al. [21] reported average harvesting productivity of 35 m3/PMH (measured over bark) with two harvesters (Rottne H11 and John Deere 1270) operated in a spruce-dominated stand with an average stem volume of 1.3 m3.
3.3.2. MM Group
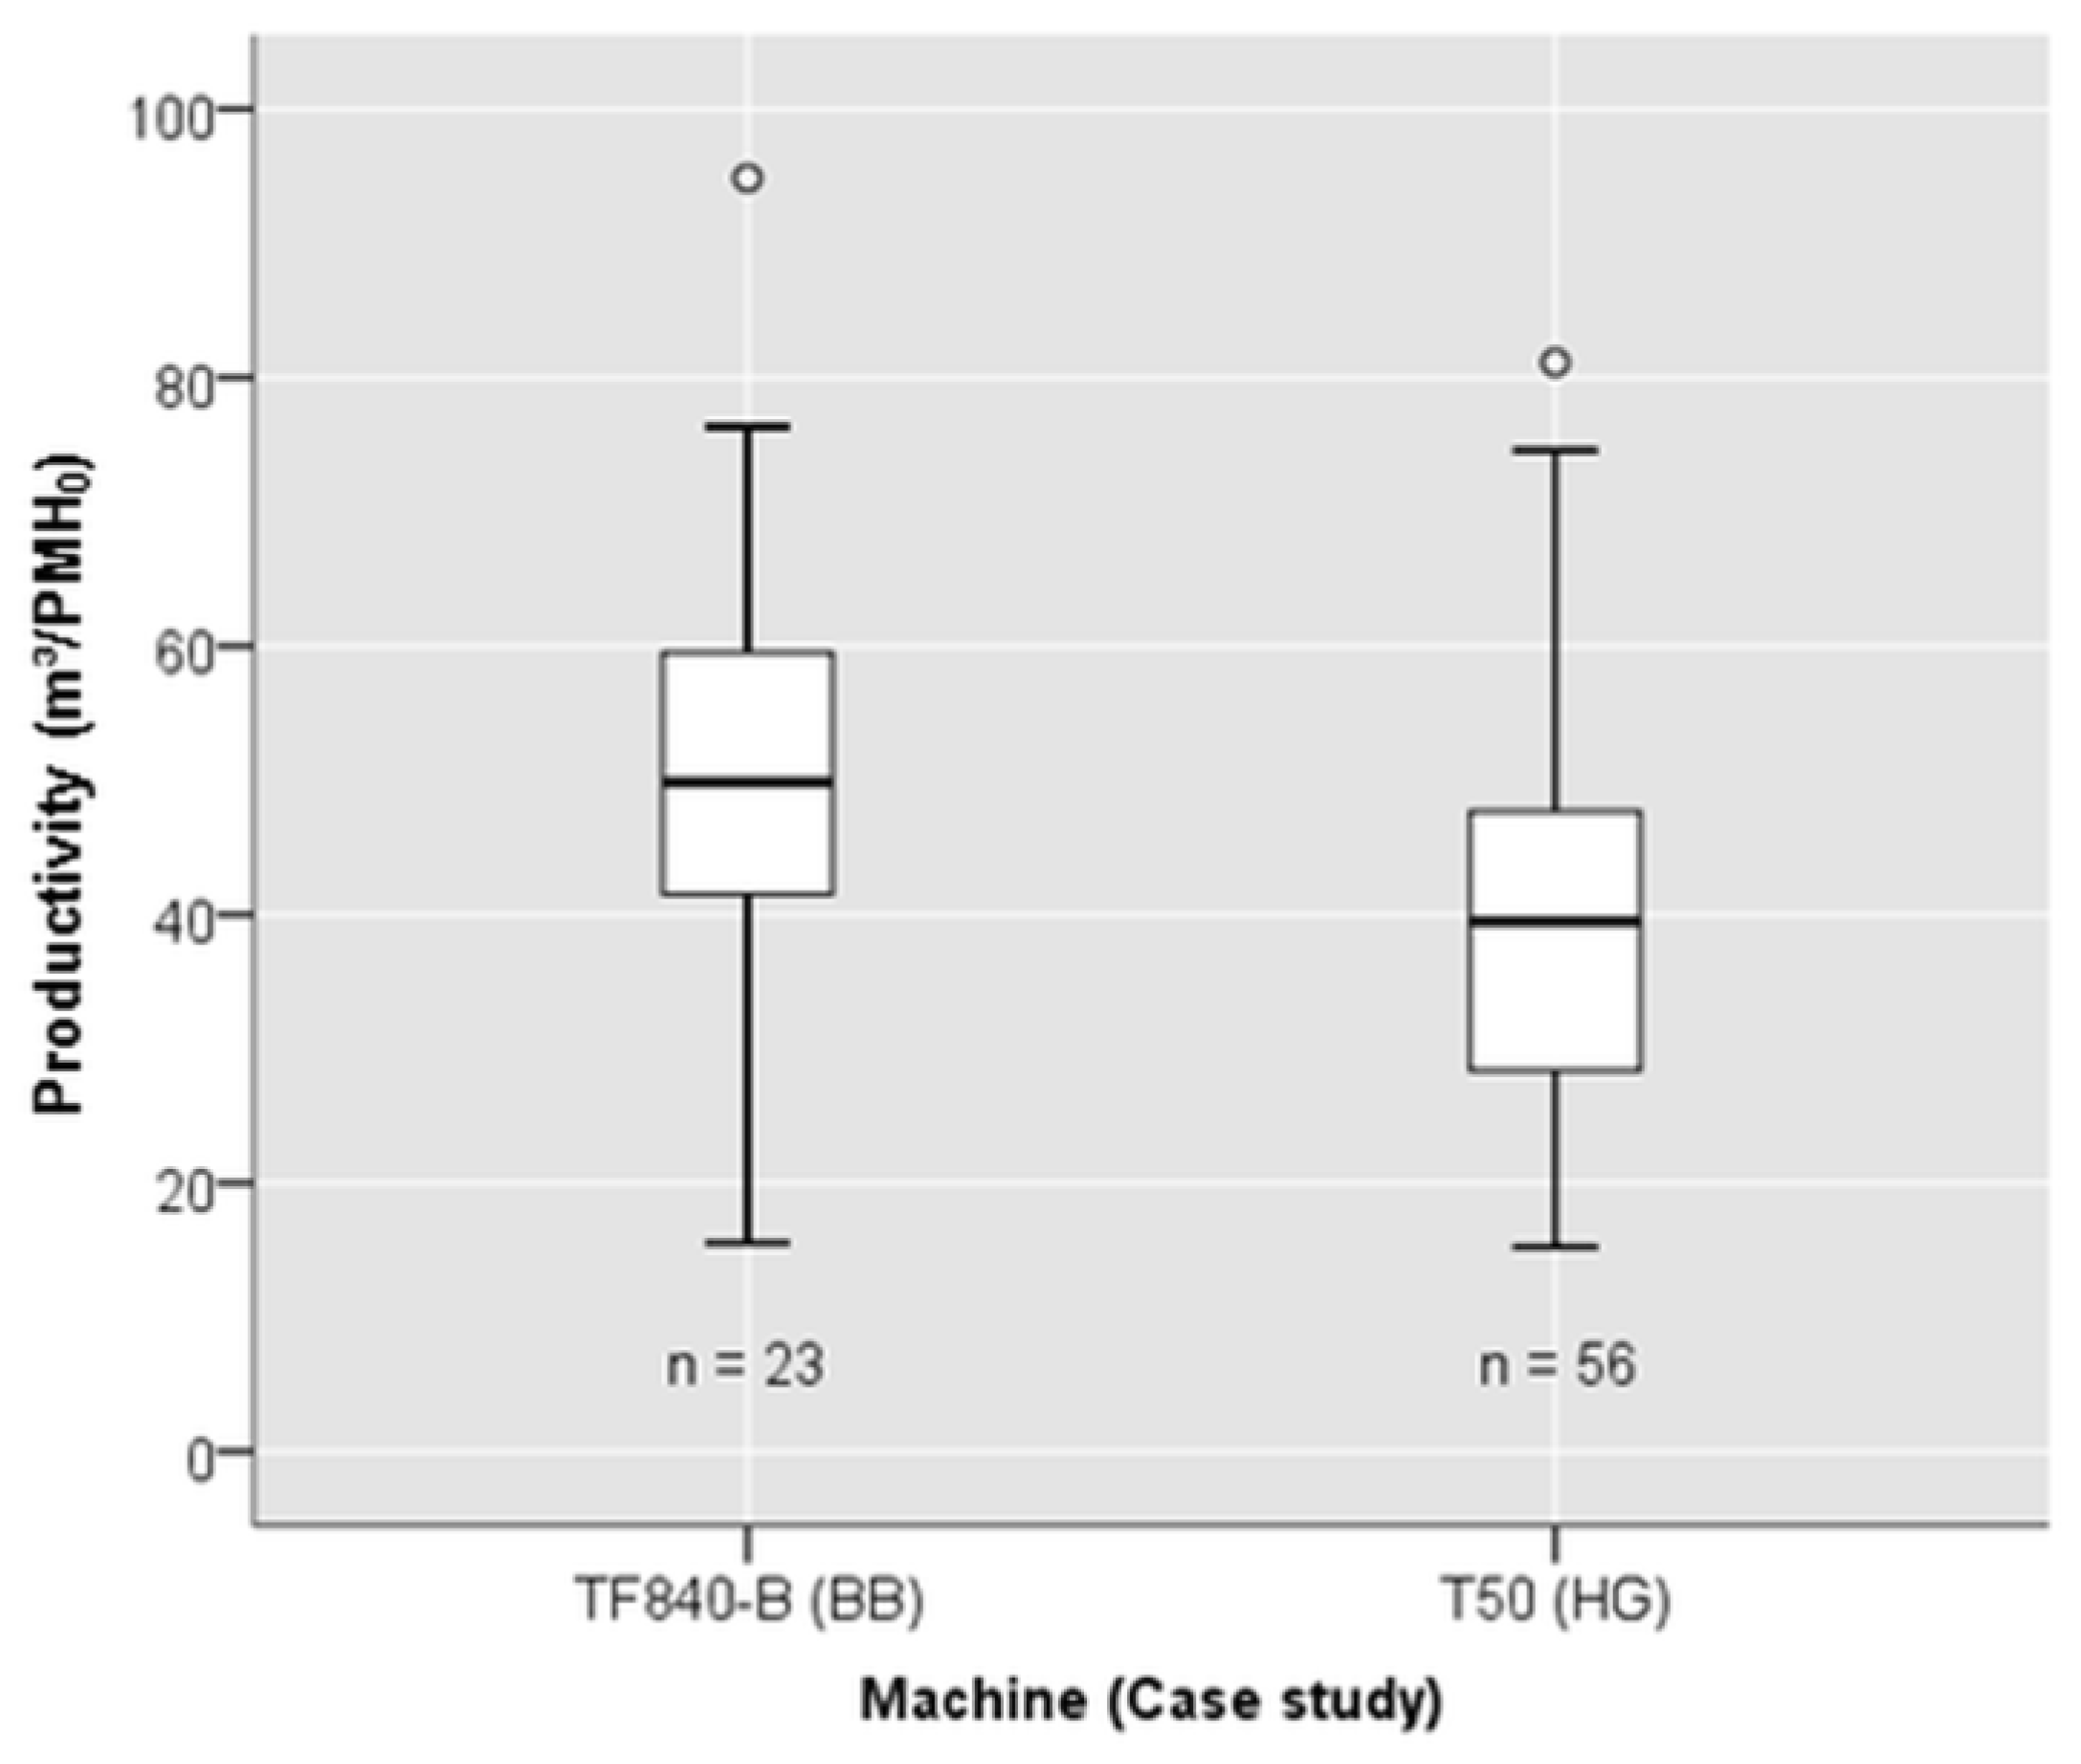
Observed productivity in the MM group was higher than in the FM group in the case of the TF840-B, while it was lower in the case of the T50 (Table 8). At first glance, this seems contradictory to the cycle durations presented in Table 6, especially the low time consumption for the work element processing in the case of the T50; but the same explanation, that is, the fact that the sawlogs were not processed by the T50 at all, applies here: while the T50 thus achieved considerable time savings, at the same time, it did not exploit the part of a tree that usually yields the highest product volumes in the shortest processing time. Even more than with the data in the FM group, here the small sample size (23 trees in the case of BB) must be considered together with any interpretations, and as indicated in Figure 7, the productivity difference between the two case studies was not significant.
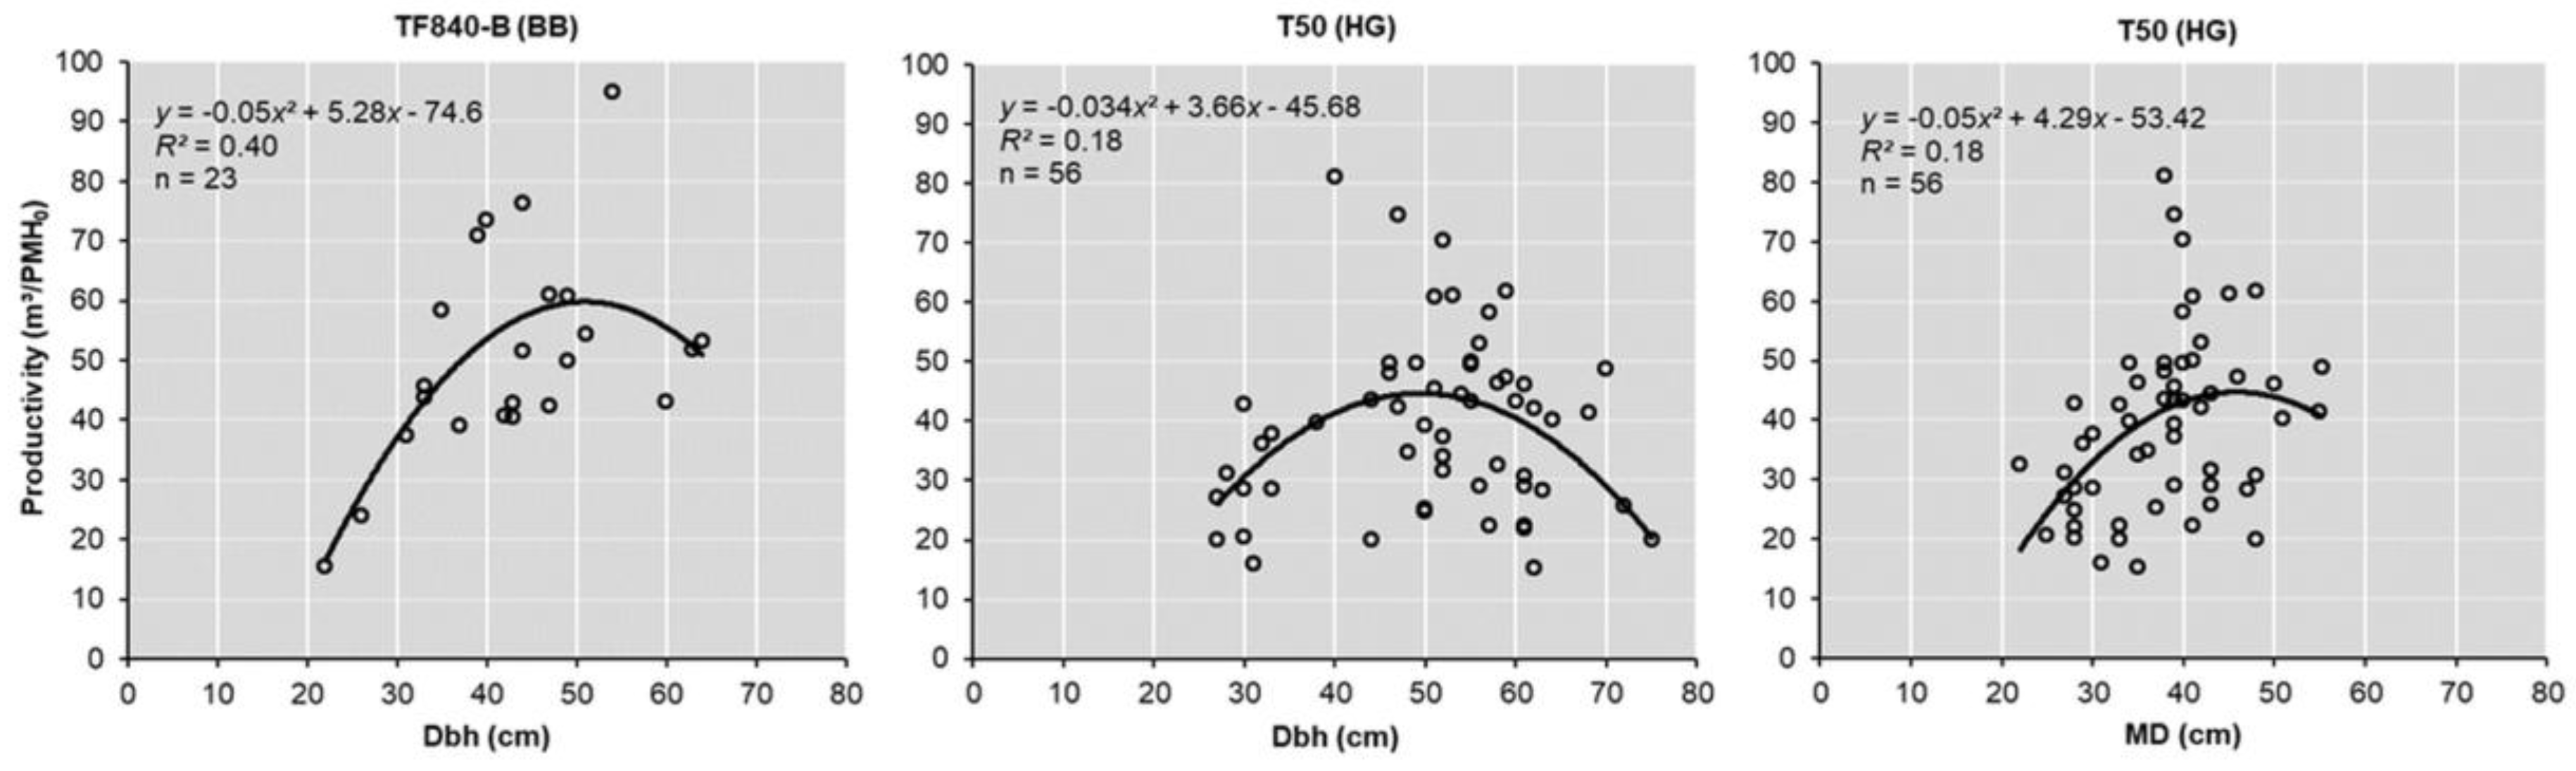
Productivity curves derived from the results in the MM group are presented in Figure 8. In the case of BB, the task of prefelling trees increased harvesting productivity compared to trees that were felled and processed entirely by the harvester. According to the highest vertex of the regression curve, maximum productivity reached 60 m3/PMH0, thus indicating a 20% increase compared to trees that were completely handled by the harvester. This finding is reasonable since with fully-mechanized operations, trees of this dimension (avg. dbh of 43.3 cm) would require one or several back-cuts prior to the final cut. As discussed previously, in the case of HG, observed productivity of the T50 with the prefelled trees was lower than with the trees in the FM group. This is also reflected in the corresponding productivity curves, which have their maxima at 45 m³/PMH0 as compared to 50 m³/PMH0 in the FM group. A potentially higher productivity of the harvester when processing only is thus masked by the fact that the sawlogs (i.e., butt logs) were not produced by the harvester, but rather motor-manually.
3.4. Volume Recovery
Volume recovery in the FM group, expressed in relative terms based on the merchantable standing volumes from the preharvest inventory, varied between 73% and 85% in HA and BB, respectively (Table 9). Despite the range observed, the volume recovery is considerably high for deciduous trees with rather complex tree form. One reason for the high values could be potential inaccuracies of the height measurements performed during preharvest inventory, which in some cases could underestimate the stem volume and in turn provide a higher volume recovery. While for case study BB in the MM group also a noticeably high volume recovery of 80% was calculated, a comparison with HG is not possible, since in HG, the sawlog volume could not be considered as sawlogs were not produced by the harvester. Again, the assumption that an overestimation of volume recovery resulted from height inaccuracies, that is, too-low measurements of tree height during inventory, is somewhat supported by the observations on processing quality, expressed as the thoroughness of processing tree crowns. Particularly in the case of BB, only partly complete processing of crowns based on visual assessment coincides with high volume recovery in both data groups. Another important point to mention is the fact that volume recovery is comparing standing volume (with bark) to recovered volume (without bark). According to the Bayerische Forstverwaltung [22], a 6% bark volume reduction for European beech is commonly used. Current techniques for acquisition of more accurate data on tree volume and morphology such as terrestrial laser scanning might provide a better basis for assessment of volume recovery and the relationships between tree form and processing quality.
4. Conclusions
With increasing shares of deciduous trees being managed under mixed-species stands and close-to-nature forestry, the interest in using fully-mechanized systems to perform forest operations is on the rise. From this study, two main trends emerged:
- (i)
- Average harvesting productivities (29 to 43 m3/PMH0) were high and should only be used as a general orientation on the operational capabilities of these machines.
- (ii)
- Motor-manual preparation of the butt flare and prenotching allowed for trees of large dimensions to be handled efficiently by the harvesters and thus contributed to the high harvesting productivity reported.
Despite some promising findings that support the use of mechanized systems in large-diameter deciduous stands, further research is required to comprehend, in particular, the influence of certain tree form characteristics on processing time, since tree dbh explained only a rather low proportion of the harvesting variability.
Author Contributions
Conceptualization, E.R.L. and L.B.; Formal analysis, E.R.L., L.B. and E.S.; Funding acquisition, E.R.L. and L.B.; Investigation, E.R.L., L.B. and E.S.; Methodology, E.R.L. and L.B.; Project administration and supervision, E.R.L.; Writing, E.R.L., L.B. and E.S.
Acknowledgments
The authors wish to extend gratitude to operational managers, field supervisors, and machine operators who made this study possible. We also wish to thank FPInnovations for the use of the software TS1000 for time-and-motion studies. This publication was supported by the German Research Foundation (DFG) and the Technical University of Munich (TUM) in the framework of the Open Access Publishing Program.
Conflicts of Interest
The authors declare no conflict of interest.
References
- Labelle, E.R.; Bergen, M.; Windisch, J. The effect of quality bucking and automatic bucking on harvesting productivity and product recovery in a pine-dominated stand. Eur. J. For. Res. 2017, 136, 639–652. [Google Scholar] [CrossRef]
- Labelle, E.R.; Soucy, M.; Cyr, A.; Pelletier, G. Effect of Tree Form on the Productivity of a Cut-to-Length Harvester in a Hardwood Dominated Stand. Croat. J. For. Eng. 2016, 37, 175–183. [Google Scholar]
- Huyler, N.K.; LeDoux, C.B. Performance of a Cut-to-Length Harvester in a Single-Tree and Group-Selection Cut. Research Paper NE-711. 1999. Available online: https://www.fs.fed.us/ne/newtown_square/publications/research_papers/pdfs/scanned/OCR/ne_rp711.pdf (accessed on 5 June 2018).
- Nurminen, T.; Korpunen, H.; Uusitalo, J. Time consumption analysis of the mechanized cut-to-length harvesting system. Silva Fenn. 2006, 40, 335–363. [Google Scholar] [CrossRef]
- Hiesl, P. Productivity Standards for Whole-Tree and Cut-to-Length Harvesting Systems in Maine. Master’s Thesis, University of Maine, Orono, ME, USA, 2013. [Google Scholar]
- Gryc, V.; Vavrčík, H.; Gomola, Š. Selected properties of European beech (Fagus sylvatica L.). J. For. Sci. 2008, 54, 418–428. [Google Scholar] [CrossRef]
- Bergqvist, G. Wood density traits in Norway spruce understorey: Effects of growth rate and birch shelterwood density. Ann. Sci. For. 1998, 55, 809–821. [Google Scholar] [CrossRef]
- Glöde, D. Single- and double-grip harvesters—Productive measurements in final cutting of shelterwood. Int. J. For. Eng. 1999, 10, 63–74. [Google Scholar]
- Kärhä, K.; Rökkö, E.; Gumse, S.-I. Productivity and cutting costs of thinning harvesters. Int. J. For. Eng. 2004, 15, 43–56. [Google Scholar]
- Jiroušek, R.; Klvač, R.; Skoupý, A. Productivity and costs of the mechanized cut-to-length wood harvesting system in clear-felling operations. J. For. Sci. 2007, 53, 476–482. [Google Scholar] [CrossRef]
- Eriksson, M.; Lindroos, O. Productivity of harvesters and forwarders in CTL operations in Northern Sweden based on large follow-up datasets. Int. J. For. Eng. 2014, 25, 179–200. [Google Scholar] [CrossRef]
- Mederski, P.S.; Bembenek, M.; Karaszewski, Z.; Łacka, A.; Szczepańska-Álvarez, A.; Rosińska, M. Estimating and modelling harvester productivity in pine stands of different ages, densities and thinning intensities. Croat. J. For. Eng. 2016, 37, 27–36. [Google Scholar]
- Labelle, E.R.; Windisch, J. Productivity of a single-grip TimberPro 620 harvester with a LogMax 7000 harvesting head in a beech dominated stand. In From Theory to Practice: Challenges for Forest Engineering, Proceedings of the 49th Symposium on Forest Mechanization, Warsaw, Poland, 4–7 September 2016; Warsaw University of Life Sciences: Warsaw, Poland, 2016; 9p. [Google Scholar]
- Purfürst, F.T. Learning curves of harvester operators. Croat. J. For. Eng. 2010, 31, 89–97. [Google Scholar]
- Franz, F.; Bachler, J.; Deckelmann, B.; Kennel, E.; Kennel, R.; Schmidt, A.; Wotschikowsky, U. Bayerische Waldinventur 1970/71; Inventurabschnitt I: Großrauminventur Aufnahme- und Auswertungsverfahren; Forstliche Versuchsanstalt: Munich, Germany, 1973; Volume 11, 143p. [Google Scholar]
- Gebrauchte Landmaschinen und Traktoren—Landwirt.com. Available online: https://www.landwirt.com/ (accessed on 17 May 2018).
- Wimberger, S.; Technical University of Munich, Bavaria, Germany. Personal communication, 2017.
- Kellogg, L.D.; Bettinger, P. Thinning productivity and cost for a mechanized cut-to-length system in the northwest Pacific coast region of the USA. Int. J. For. Eng. 1994, 5, 43–54. [Google Scholar] [CrossRef]
- Sirén, M.; Aaltio, H. Productivity and costs of thinning harvesters and harvester-forwarders. Int. J. For. Eng. 2013, 14, 39–48. [Google Scholar]
- Gerasimov, Y.; Senkin, V.; Väätäinen, K. Productivity of single-grip harvesters in clear-cutting operations in the northern European part of Russia. Eur. J. For. Res. 2012, 131, 647–654. [Google Scholar] [CrossRef]
- Pajkoš, M.; Klvač, R.; Neruda, J.; Mishra, P.K. Comparative time study of conventional cut-to-length and an integrated harvesting method—A case study. Forests 2018, 9, 194. [Google Scholar] [CrossRef]
- Bayerische Forstverwaltung. Hilfstafeln für die Forsteinrichtung; Bayerisches Staatsministerium für Ernährung, Landwirtschaft und Forsten: Munich, Germany, 2018; 352p. [Google Scholar]
Figure 1.
Harvesters used in the study: (A) TimberPro TF840-B, (B) Rottne H20, (C) Impex Hannibal T50, and (D) Impex Hannibal T40. Photo credit: (A) [16]; (B–D) [17].

Figure 2.
Boxplots of tree diameter at breast height (dbh) distributions in the individual case studies in the fully-mechanized (FM) (A) and motor-manual (MM) (B) groups. Bad Brückenau (BB), Hammelburg (HA), Heigenbrücken (HG), Rothenbuch (RO). Different letters indicate significant differences in dbh between case studies (p < 0.05).

Figure 3.
Mean share of cycle duration for the individual work elements in the fully-mechanized (FM) group.
Figure 3.
Mean share of cycle duration for the individual work elements in the fully-mechanized (FM) group.

Figure 4.
Mean share of cycle duration for the individual work elements in the motor-manual (MM) group.
Figure 4.
Mean share of cycle duration for the individual work elements in the motor-manual (MM) group.

Figure 5.
Distribution of productivity for the four machines (case studies) in the fully-mechanized (FM) group. Different letters indicate significantly different productivities between case studies according to an analysis of covariance (p < 0.05).
Figure 5.
Distribution of productivity for the four machines (case studies) in the fully-mechanized (FM) group. Different letters indicate significantly different productivities between case studies according to an analysis of covariance (p < 0.05).

Figure 6.
Productivity curves (2nd degree polynomial regressions) for the four machines (case studies) in the fully-mechanized (FM) group.
Figure 6.
Productivity curves (2nd degree polynomial regressions) for the four machines (case studies) in the fully-mechanized (FM) group.

Figure 7.
Distribution of productivity for the two machines (case studies) in the motor-manual (MM) group.
Figure 7.
Distribution of productivity for the two machines (case studies) in the motor-manual (MM) group.

Figure 8.
Productivity curves (2nd degree polynomial regressions) for the two machines (case studies) in the motor-manual (MM) group. Two plots are shown for the T50 where the abscissa is presented as dbh of harvested trees or mid diameter (MD) of the largest processed log by the machine.
Figure 8.
Productivity curves (2nd degree polynomial regressions) for the two machines (case studies) in the motor-manual (MM) group. Two plots are shown for the T50 where the abscissa is presented as dbh of harvested trees or mid diameter (MD) of the largest processed log by the machine.


Table 1.
Specifications of harvesters and associated harvesting heads used at the four study sites.
| Harvester (Case Study) | TimberPro TF840-B (BB) | Rottne H20 (HA) | Impex Hannibal T50 (HG) | Impex Hannibal T40 (RO) |
|---|---|---|---|---|
| Traction type | 8 wheels | 6 wheels | Rigid tracks | Rigid tracks |
| Total mass (t) | 26.1 | 23.0 | 54.0 | 51.4 |
| Engine power (kW) | 221 | 187 | 250 | 194 |
| Boom reach (m) | 7.9 | 10.0 | 15.0 | 14.5 |
| Harvesting head | SP Maskiner SP861LF with top-saw | Rottne EGS700 | Lako 1118 | Ponsse H8 |
| Maximum felling diameter (cm) | 80 | 75 | 110 | 80 |
| Measurement system | Dasa5 | Dasa5 | Motomit IT 6.5 | Ponsse Opti 4G |
Bad Brückenau (BB); Hammelburg (HA); Heigenbrücken (HG); Rothenbuch (RO).
Table 2.
Description of work cycle elements (from Labelle et al. [1]).
Table 2.
Description of work cycle elements (from Labelle et al. [1]).
| Work Element | Start | End |
|---|---|---|
| Moving | Traction system is activated | Traction system is deactivated or other elements dominate |
| Boom-out | Boom extending towards tree | Head is positioned at base of tree and saw is ready to be activated |
| Felling | Head is in vertical position and saw is activated | Tree crown touches the ground or feed rollers are activated |
| Processing | Feed rollers are activated with stem in harvesting head | Tree top is released |
| Manipulation | Other boom tasks (e.g., manipulating processed logs, building a brush mat, etc.) | Other work elements dominate |
| Operational delays | Any delay linked to organizational issues lasting more than a few seconds | Other work elements dominate |
| Nonoperational delays | Any delay linked to personal, mechanical, or study design issues lasting more than a few seconds | Other work elements dominate |
Table 3.
Description of the four case studies.
| Case Study | Felling and Processing | Data Groups | Work Technique a | Processing of Tree Crowns b |
|---|---|---|---|---|
| BB | Chainsaw and harvester | FM and MM | Motor-manual felling of trees beyond boom reach as well as butt flare trimming and prenotching of larger diameter trees to be felled by harvester | Partly complete |
| HA | Harvester | FM | All tasks performed by the harvester | Complete |
| HG | Chainsaw and harvester | FM and MM | Motor-manual felling and bucking of sawlogs of larger diameter trees at a longer distance from machine operating trail | Incomplete |
| RO | Harvester | FM | All tasks performed by the harvester | Complete |
a Not part of the experimental design, but occurred due to operational conditions (size of trees, distance to machine operating trail); b based on operational observations; fully-mechanized (FM); motor-manual (MM).
Table 4.
Results of the preharvest inventory of removal trees in all four case studies. Arithmetic means and standard deviations are indicated for diameter at breast height (dbh), height, and volume of the trees within one group and as a total (all trees combined per case study).
Table 4.
Results of the preharvest inventory of removal trees in all four case studies. Arithmetic means and standard deviations are indicated for diameter at breast height (dbh), height, and volume of the trees within one group and as a total (all trees combined per case study).
| Case Study | Group | N | Tree dbh (cm) a | Tree Height (m) | Tree Volume (m3 o.b.) b | Sum of Tree Volume (m3 o.b.) | Recovered Volume (m3 u.b.) c | |||
|---|---|---|---|---|---|---|---|---|---|---|
| Mean | Standard Deviation | Mean | Standard Deviation | Mean | Standard Deviation | |||||
| BB | MM | 23 | 43.3 | 10.9 | 30.6 | 5.4 | 2.7 | 1.7 | 61.7 | 45.0 |
| FM | 56 | 36.6 | 10.0 | 28.5 | 5.1 | 1.8 | 1.3 | 100.6 | 80.6 | |
| Total | 79 | 38.5 | 10.6 | 29.1 | 5.2 | 2.1 | 1.4 | 162.3 | 125.5 | |
| HA | Total | 67 | 35.6 | 10.0 | 29.0 | 4.2 | 1.7 | 1.2 | 114.9 | 80.6 |
| HG | MM | 56 | 50.8 | 12.1 | 29.2 | 3.0 | 3.4 | 1.6 | 189.6 | 63.6 |
| FM | 48 | 42.4 | 10.2 | 28.2 | 2.7 | 2.3 | 1.2 | 109.3 | 85.6 | |
| Total | 104 | 46.9 | 12.0 | 28.7 | 2.9 | 2.9 | 1.6 | 299.0 | 149.2 | |
| RO | Total | 72 | 39.3 | 6.9 | 28.3 | 2.7 | 1.9 | 0.7 | 134.6 | 107.6 |
| All trees | 322 | 40.8 | 11.1 | 28.8 | 3.8 | 2.2 | 1.4 | 710.8 | 462.9 | |
a On bark; b tree volume (merchantable volume) was calculated according to the equation for European beech reported by Franz et al. [15]; c recovered volume was calculated from log mid-diameters and lengths in the harvester production reports; sample size (N); on bark (o.b.); under bark (u.b.).
Table 5.
Mean duration of work elements per cycle (i.e., tree) in the fully-mechanized (FM) group.
| Machine (Case Study) | Mean Duration per Cycle (min) | |||||
|---|---|---|---|---|---|---|
| Moving | Boom-Out | Felling | Processing | Manipulation | Total | |
| TF840-B (BB) | 0.29 | 0.15 | 0.22 | 1.29 | 0.02 | 1.97 |
| H20 (HA) | 0.37 | 0.18 | 0.33 | 1.58 | 0.03 | 2.49 |
| T50 (HG) | 0.36 | 0.27 | 0.48 | 1.36 | 0.04 | 2.51 |
| T40 (RO) | 0.37 | 0.28 | 0.46 | 1.52 | 0.15 | 2.78 |
Table 6.
Mean duration of work elements per cycle (i.e., tree) in the motor-manual (MM) group.
| Machine (Case Study) | Mean Duration per Cycle (min) | ||||
|---|---|---|---|---|---|
| Moving | Boom-Out | Processing | Manipulation | Total | |
| TF840-B (BB) | 0.29 | 0.13 | 1.86 | 0.02 | 2.30 |
| T50 (HG) | 0.36 | 0.18 | 1.24 | 0.04 | 1.82 |
Table 7.
Mean harvesting productivity and standard deviation per dbh class for the four machines (case studies) in the fully-mechanized (FM) group.
Table 7.
Mean harvesting productivity and standard deviation per dbh class for the four machines (case studies) in the fully-mechanized (FM) group.
| Machine (Case Study) | Productivity (m3/PMH0) Per dbh Class (cm) (Sample Size) | |||||
|---|---|---|---|---|---|---|
| 20–39 | 40+ | All dbh Classes | ||||
| Mean | Standard Deviation | Mean | Standard Deviation | Mean | Standard Deviation | |
| TF840-B (BB) | 39.2 (36) | 10.6 | 48.7 (20) | 9.4 | 42.6 (56) | 11.2 |
| H20 (HA) | 27.9 (46) | 9.5 | 31.7 (21) | 10.3 | 29.1 (67) | 9.9 |
| T50 (HG) | 35.3 (19) | 11.1 | 48.7 (29) | 14.5 | 43.4 (48) | 14.8 |
| T40 (RO) | 32.6 (39) | 9.0 | 35.1 (33) | 9.3 | 33.7 (72) | 9.2 |
Table 8.
Mean productivity and standard deviations per dbh class for the two machines (case studies) in the motor-manual (MM) group.
Table 8.
Mean productivity and standard deviations per dbh class for the two machines (case studies) in the motor-manual (MM) group.
| Machine (Case Study) | Productivity (m3/PMH0) per dbh Class (cm) (Sample Size) | |||||
|---|---|---|---|---|---|---|
| 20–39 | 40+ | All dbh Classes | ||||
| Mean | Standard Deviation | Mean | Standard Deviation | Mean | Standard Deviation | |
| TF840-B (BB) | 41.8 (8) | 16.5 | 55.8 (15) | 15.0 | 50.9 (23) | 16.9 |
| T50 (HG) | 29.8 (11) | 8.3 | 41.5 (45) | 14.9 | 39.2 (56) | 14.6 |
Table 9.
Relative volume recovery in the different case studies, calculated as ratio of product volume (recovered volume under bark) and tree volume (merchantable volume on bark).
Table 9.
Relative volume recovery in the different case studies, calculated as ratio of product volume (recovered volume under bark) and tree volume (merchantable volume on bark).
| Machine (Case Study) | Relative Volume Recovery in the FM Group (Sample Size) | Relative Volume Recovery in the MM Group (Sample Size) |
|---|---|---|
| TF840-B (BB) | 85% (56) | 80% (23) |
| H20 (HA) | 73% (67) | - |
| T50 (HG) | 79% (48) | 42% a (56) |
| T40 (RO) | 82% (72) | - |
a Sawlogs are not considered since these were not processed by the harvester.
© 2018 by the authors. Licensee MDPI, Basel, Switzerland. This article is an open access article distributed under the terms and conditions of the Creative Commons Attribution (CC BY) license (http://creativecommons.org/licenses/by/4.0/).
Share and Cite
MDPI and ACS Style
Labelle, E.R.; Breinig, L.; Sycheva, E. Exploring the Use of Harvesters in Large-Diameter Hardwood-Dominated Stands. Forests 2018, 9, 424. https://doi.org/10.3390/f9070424
AMA Style
Labelle ER, Breinig L, Sycheva E. Exploring the Use of Harvesters in Large-Diameter Hardwood-Dominated Stands. Forests. 2018; 9(7):424. https://doi.org/10.3390/f9070424
Chicago/Turabian StyleLabelle, Eric R., Lorenz Breinig, and Ekaterina Sycheva. 2018. "Exploring the Use of Harvesters in Large-Diameter Hardwood-Dominated Stands" Forests 9, no. 7: 424. https://doi.org/10.3390/f9070424
Note that from the first issue of 2016, this journal uses article numbers instead of page numbers. See further details here.