Carbon Pools in a Hemiboreal Over-Mature Norway Spruce Stands


1
Latvian State Forest Research Institute Silava, Rīgas street 111, LV–2169 Salaspils, Latvia
2
Faculty of Biology, University of Latvia, Jelgavas street 1, LV–1004 Rīga, Latvia
*
Author to whom correspondence should be addressed.
Forests 2018, 9(7), 435; https://doi.org/10.3390/f9070435
Submission received: 21 June 2018
/
Revised: 9 July 2018
/
Accepted: 19 July 2018
/
Published: 20 July 2018
(This article belongs to the Section Forest Ecology and Management)
Abstract
:Old unmanaged forests are commonly assumed to be carbon neutral; however, there is still a lack of reference studies available to increase the recognition of carbon stock changes in these forests. Studies of old forest carbon storage from hemiboreal regions are very rare compared to temperate and boreal forests in Europe; therefore, the aim of this study was to quantify the carbon stock in hemiboreal over-mature (167–213 years) Norway spruce (Picea abies (L.) Karst.) stands. To explore the total ecosystem carbon pool, the carbon stock of tree biomass, deadwood, and soil in unmanaged (for at least the last 40 years) spruce stands was calculated and compared between different forest site types on dry, wet, and drained mineral soils. Total carbon stock of hemiboreal over-mature spruce stands ranged from 164.8 Mg C ha−1 to 386.7 Mg C ha−1, and 238.5 Mg C ha−1 on average, with no significant differences (p > 0.05) between the forest site types. The carbon stock of tree biomass was significantly affected by the basal area of the upper tree layer (p < 0.0001) and the interaction between the forest site type and proportion of spruce in the stand composition (p = 0.002). Tree biomass was the dominant carbon pool, followed by soil and deadwood in over-mature spruce stands.
1. Introduction
Climate change has been increasingly recognised as one of the greatest environmental issues and the international community is facing these challenges by implementing the United Nations Framework Convention on Climate Change (UNFCCC), Kyoto Protocol, and Paris Agreement [1]. Boreal forests are one of the biggest terrestrial carbon pools on Earth [2,3], storing carbon in the tree biomass and releasing it through decomposition, therefore playing a significant role in global climate change mitigation [4,5]. With increasing interest to promote carbon sequestration in forests, various new forest management practices are employed in managed even-aged stands [6,7,8,9] to meet the climate change targets and to reduce the carbon dioxide emissions in land use, land use change, and forestry (LULUCF) sector [1,10]. However, there is still a lack of reference studies of unmanaged over-mature forests [2].
Under unmanaged conditions, ageing forests slowly develop stand structures that are typical for old-growth forests [11]. In these conditions, species and age composition as well as the occurrence of natural disturbances play a key role in the formation of carbon stock and carbon fluxes [12,13,14]. Thus, only very limited review studies in old forests with a mixed-species, multi-cohort structure under various past-management practices are available to understand the carbon stock changes [7,15].
Old unmanaged forests are commonly assumed to be carbon neutral due to the decline of net primary productivity with increasing stand age [16,17]. However, some studies suggest that over-mature forests may serve as important carbon sinks [18,19]. Recent data of over-mature boreal forests revealed that when managed forests are left unmanaged, they become weak carbon sinks due to very low carbon accumulation in soil and living biomass [20].
Tree biomass comprised the largest carbon pool in forests along with soil organic matters [17,20]. Through the development of the stand, carbon is reallocated between the pools [12,21]; thus, it is still challenging to estimate soil and litter carbon stocks [3,21]. The analysis of carbon in the tree biomass shows that stands with older trees have lower carbon uptake rates, yet they have a large carbon stock [18,19,20], giving just a partial understanding of the total ecosystem carbon. Moreover, in the hemiboreal region, there are just a few studies of birch stands dealing with carbon stock estimations [4,22], where boreal and temperate forest species form a large heterogeneity in forest stands [23].
Hemiboreal forests, which occur in north and northeast Europe, are dominated by the mixture of Norway spruce (Picea abies (L.) Karst.) and Scots pine (Pinus sylvestris L.) with deciduous trees [24]. According to the national forest inventory, Norway spruce forests constitute 20% of the forest standing volume in Latvia, also being one of the most economically important and intensively managed tree species [25]. As sustainable forest management is considered the most efficient way to increase the forest carbon stock [9,20], there is a growing need for reference data from unmanaged spruce stands. Therefore, the aim of this study was to quantify hemiboreal old unmanaged Norway spruce forests carbon stock in the main carbon pools: tree biomass, deadwood, and soil organic carbon.
2. Materials and Methods
2.1. Study Area
The study was conducted in the hemiboreal mixed ageing Norway spruce (Picea abies (L.) Karst.) forests among various site types in Latvia between 56°14′ and 57°34′ between 21°3′ and 27°17′. The climate in Latvia is moderately cool and moist due to western winds, which bring cool and moist air masses from the Baltic Sea and Atlantic Ocean. According to the data from the Latvian Environment, Geology and Meteorology Centre, the mean annual temperature is +5 °C, ranging from around −5 °C in January to +17 °C in July. The mean annual precipitation is 550–850 mm; about 500 mm falls during the summer months. The vegetation period usually extends from late April to October.
Most common soil types in Latvia are podzols and gley soils [26]. In general, the forest site types vary from oligotrophic to meso-eutrophic and eutrophic site types, with different water regimes and species structures according to the Latvian forest ecosystem classification [26,27]. Forest site types used in this study were: Hylocomniosa, Oxalidosa (dry forests; fertile minerals with a normal moisture regime), Myrtilloso-sphagnosa, Myrtilloso-polytrichosa (wet mineral soils), Myrtillosa mel. (drained mineral soils). The forest types according to Bušs [27] are mostly dominated by Norway spruce stands.
2.2. Sampling and Measurements
Prior to the fieldwork, the potential sample stands were randomly selected from protected forests based on age limit (>160 years), dominance of Norway spruce (>50% from basal area), and location (>5 km from villages and >1 km from roads). Selected stands were inspected in the field for conformity of the dominated species occurrence. In the case of any signs of former logging (strip roads, stumps, etc.), they were discarded.
In total, 26 over-mature spruce dominated stands between 167 years and 213 years were sampled (Table 1). Altogether, 178 sample plots (6–8 sample plots in each stand) of 500 m2 were systematically established in these stands in 2016.
The diameter at the breast height (dbh) of all living trees ≥6.1 cm was measured. For all standing dead trees ≥6.1 cm, the dbh and length of the snags were recorded. The tree height for three to five living trees of each species and the layer of stand (upper tree layer, second tree layer) in each sample plot was measured to estimate tree height [28]. The site index (the height at age 100 years) for spruce in each of the forest site types was estimated [29]. The total (above- and belowground) tree biomass was calculated using dbh and height with equations for the main tree species in Latvia developed by Liepiņš et al. [30]. The carbon content of 50% was used for the tree biomass carbon stock estimation [5,31]. Lying deadwood with a diameter at the thicker end ≥14.1 cm was measured at both ends within the area of the sample plot. The decay stages of lying and standing dead trees were set using a five-class decay classification and ‘knife method’ (modified from Sandström et al. [32] and Köster et al. [33]). The volume of the lying deadwood and dead trees with broken tops was calculated using a truncated cone formula and converted to mass using the decay class-specific density. The values of the deadwood basic density and carbon content for the main tree species (Norway spruce, Scots pine (Pinus sylvestris L.), birch sp. (Betula pendula Roth. and Betula pubescens Ehrh.), European aspen (Populus tremula L.), grey alder (Alnus incana (L.) Moench.), and black alder (Alnus glutinosa (L.) Gaertn.)) were applied from recent studies in Estonia [33,34].
Soil samples (organic layer and four mineral soil layers 0–10 cm, 10–20 cm, 20–40 cm, and 40–80 cm) were taken from 16 stands at systematically located points outside the sample plots from the forests on dry and wet mineral soils. Obtained samples were returned to the Forest Environment Laboratory at the Latvian State Forest Research Institute Silava, where physical and chemical analyses were carried out following the reference methods outlined in Part X of the International Co-operative Programme on the Assessment and Monitoring of Air Pollution Effects on Forests Manual on Sampling and Analysis of Soil [35]. The soil samples were prepared for analyses according to the LVS ISO 11646: 2005 standard. In the soil samples, the following parameters were determined: bulk density (kg m−3) according to LVS ISO 11272:1998, total carbon content using elementary analysis (dry combustion) according to LVS ISO 10694:2006, and carbonate content using the Eijkelkamp calcimeter according to ISO 10693:1995. The organic carbon concentration (g kg−1) in the soil was calculated as the difference between the total carbon content and the inorganic carbon content.
2.3. Data Analysis
The carbon stock of the tree biomass and deadwood was studied using a linear mixed-effects model analysis as implemented in the program R 3.4.3 [36] library lme4 [37]. The predictor variables (forest site type, basal area of upper tree layer, proportion of spruce in stand composition, and interactions between forest site type and each of the factors) in the model were treated as fixed effects. The stand was treated as a random effect to account for possible correlation between plots of one stand. Linear mixed-effects models were used also to test the effect of forest site types on stand parameters. Pairwise comparison of estimated marginal means, as implemented in the library emmeans [38], was used as PostHoc test. To test the effect of the predictor variable on soil carbon, separate analysis of variance (ANOVA) or linear regression models were performed for each predictor, as there was only one sample per stand.
3. Results
3.1. Tree Biomass Carbon Stock
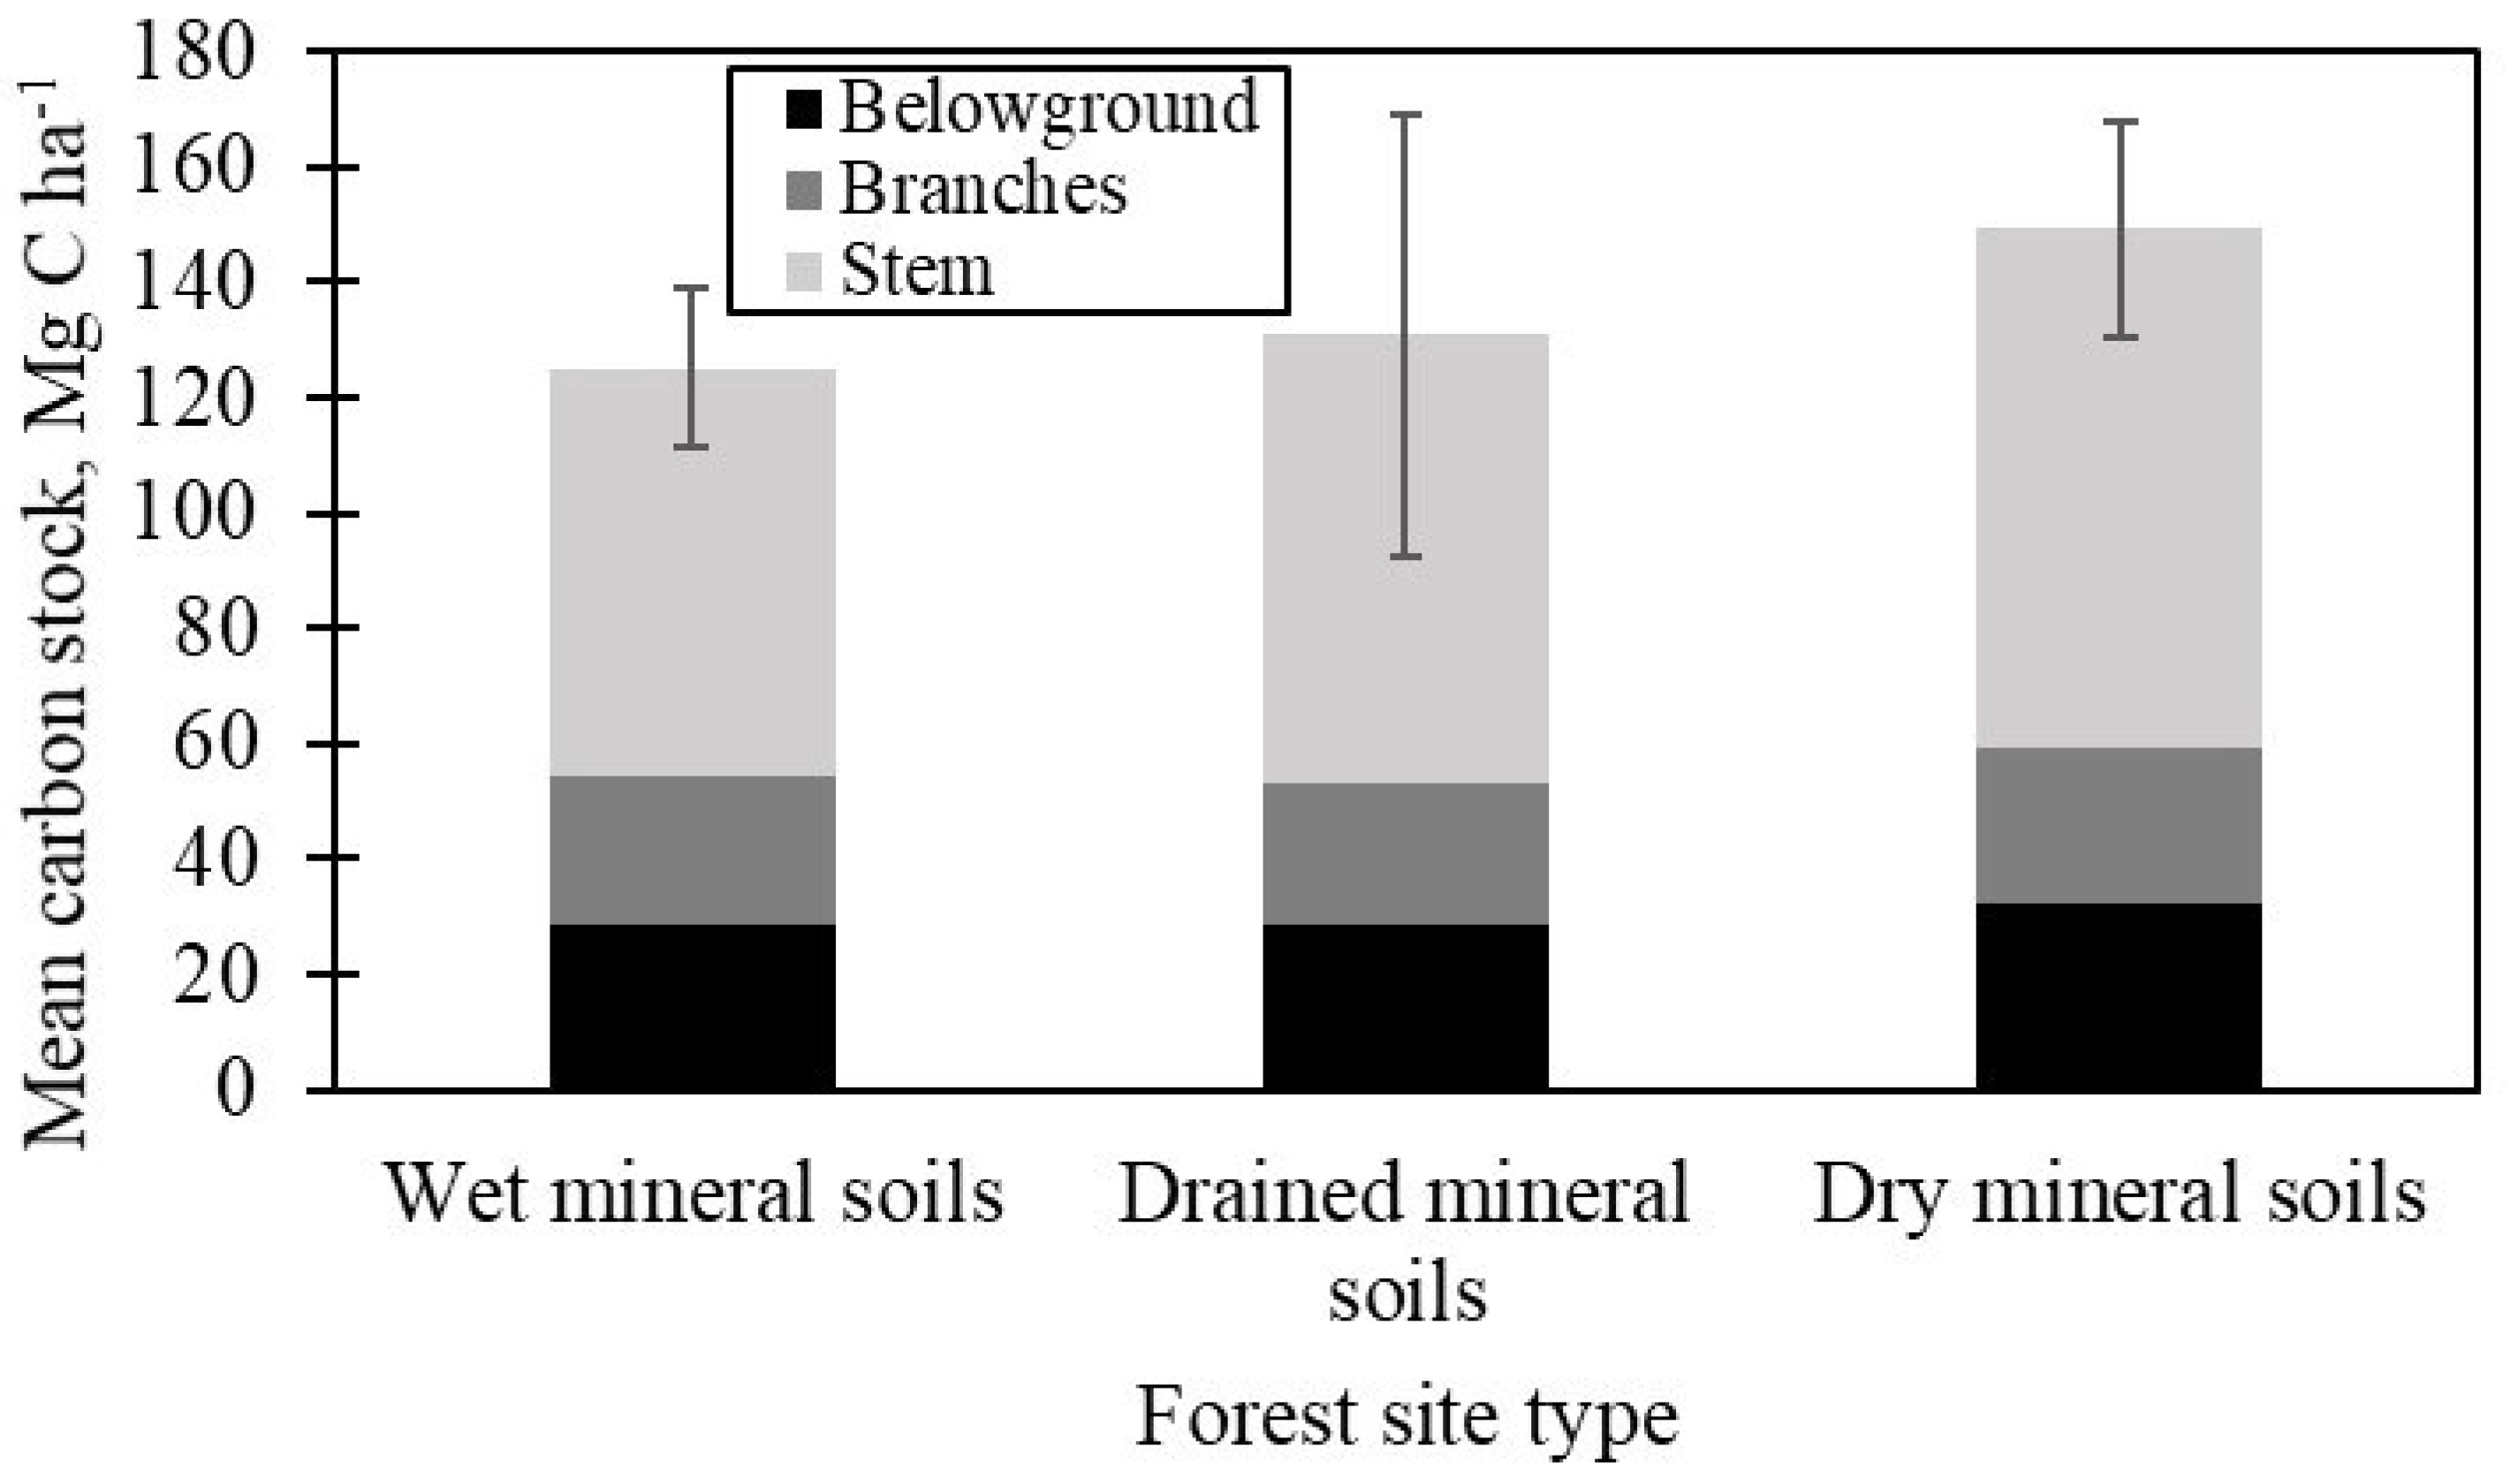
The carbon in the stems accounted for 59% of carbon stock in the tree biomass, followed by carbon stock in the roots (belowground biomass) and branches. The mean carbon stock in the tree biomass was not significantly (F2,162.59 = 1.87, p > 0.05) different between the forest site types: 149.2 ± 18.9 Mg C ha−1 in forests on dry mineral soils, 125.2 ± 14.0 Mg C ha−1 in forests on wet soils, and 130.9 ± 38.1 Mg C ha−1 in forests on drained mineral soil (Figure 1).
Despite the similar carbon stock of the tree biomass, there were differences in tree species composition and stand parameters between the forest site types. The mean proportion of spruce in stand composition (69%) was similar between the forest site types (F2,164.16 = 0.09, p > 0.05). Scots pine had the second-largest mean proportion in stand composition after spruce, both in forests on dry (36%) and drained (25%) mineral soils. The second most represented species on wet mineral soils was birch (25%). Birch and Scots pine were common tree species, occurring in 43% of the studied stands. Along with the tree species composition, differences in stand parameters of the upper tree layer affected the carbon distribution of the tree biomass between forest site types. There were no significant differences (p > 0.05) of spruce parameters in the upper layer between the forests on wet (mean tree dbh of 30.4 cm, tree height of 25.0 m, density of 231 trees ha−1, and volume of 208.5 m3 ha−1) and drained (mean tree dbh of 29.2 cm, tree height of 25.2 m, density of 270 trees ha−1, and volume of 238.3 m3 ha−1) mineral soils. The upper layer spruces in forests on dry mineral soils had significantly higher mean tree dbh (F2,165.32 = 26.13, p < 0.0001; 36.7 cm), tree height (F2,159.83 = 30.95, p < 0.0001; 28.3 m), and volume (F2,149.86 = 8.71, p < 0.0001; 264.7 m3 ha−1), but significantly lower density (F2,156.17 = 35.72, p < 0.0001; 175 trees ha−1).
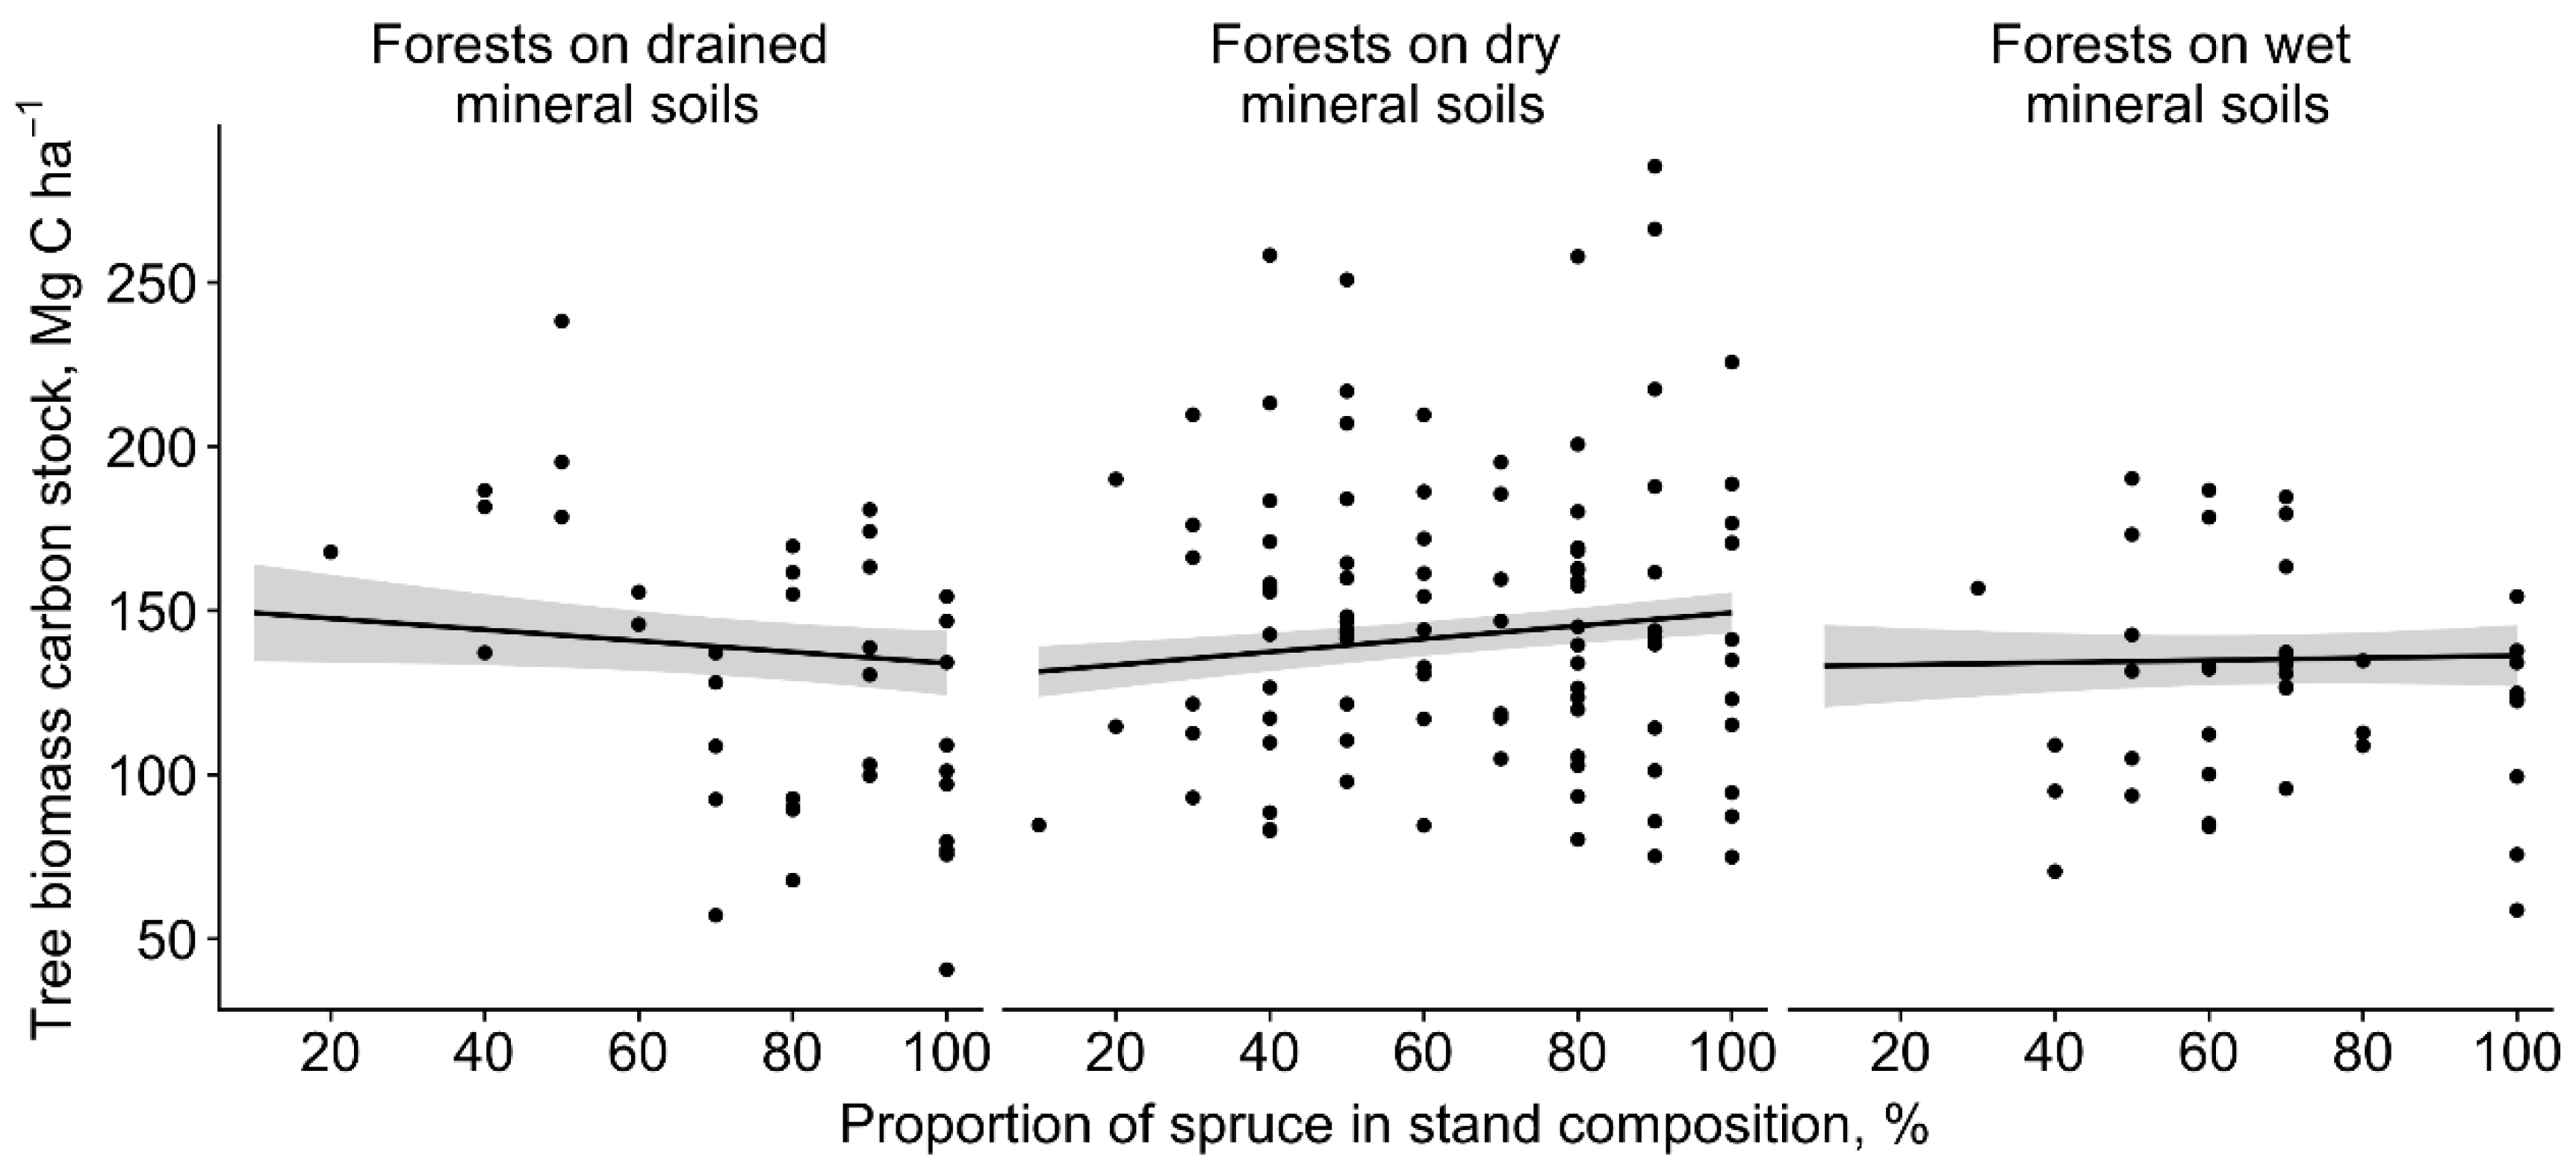
The carbon stock in the tree biomass was significantly affected by the basal area (positively, F1,156.15 = 1253.16, p < 0.0001) and by the interaction between forest site type and proportion of spruce in the stand composition (F2,153.68 = 6.37, p = 0.002) (Figure 2). In forests on drained mineral soils, the carbon stock of the tree biomass significantly decreased with the increasing proportion of spruce in the stand composition; the opposite trend was observed in forests on dry and wet mineral soils. Thus, the basal area (m2 ha−1) of spruces in the upper tree layer were similar (F2,149.30 = 0.04, p > 0.05) between the forest site types because, in forests on dry mineral soils, a few large spruces (40–60 cm in dbh) comprised a great share of the total basal area. The basal area in the upper tree layer ranged from 3.8 to 55.5 m2 ha−1; the spruces made up the largest share (68%).
3.2. Deadwood Carbon Stock
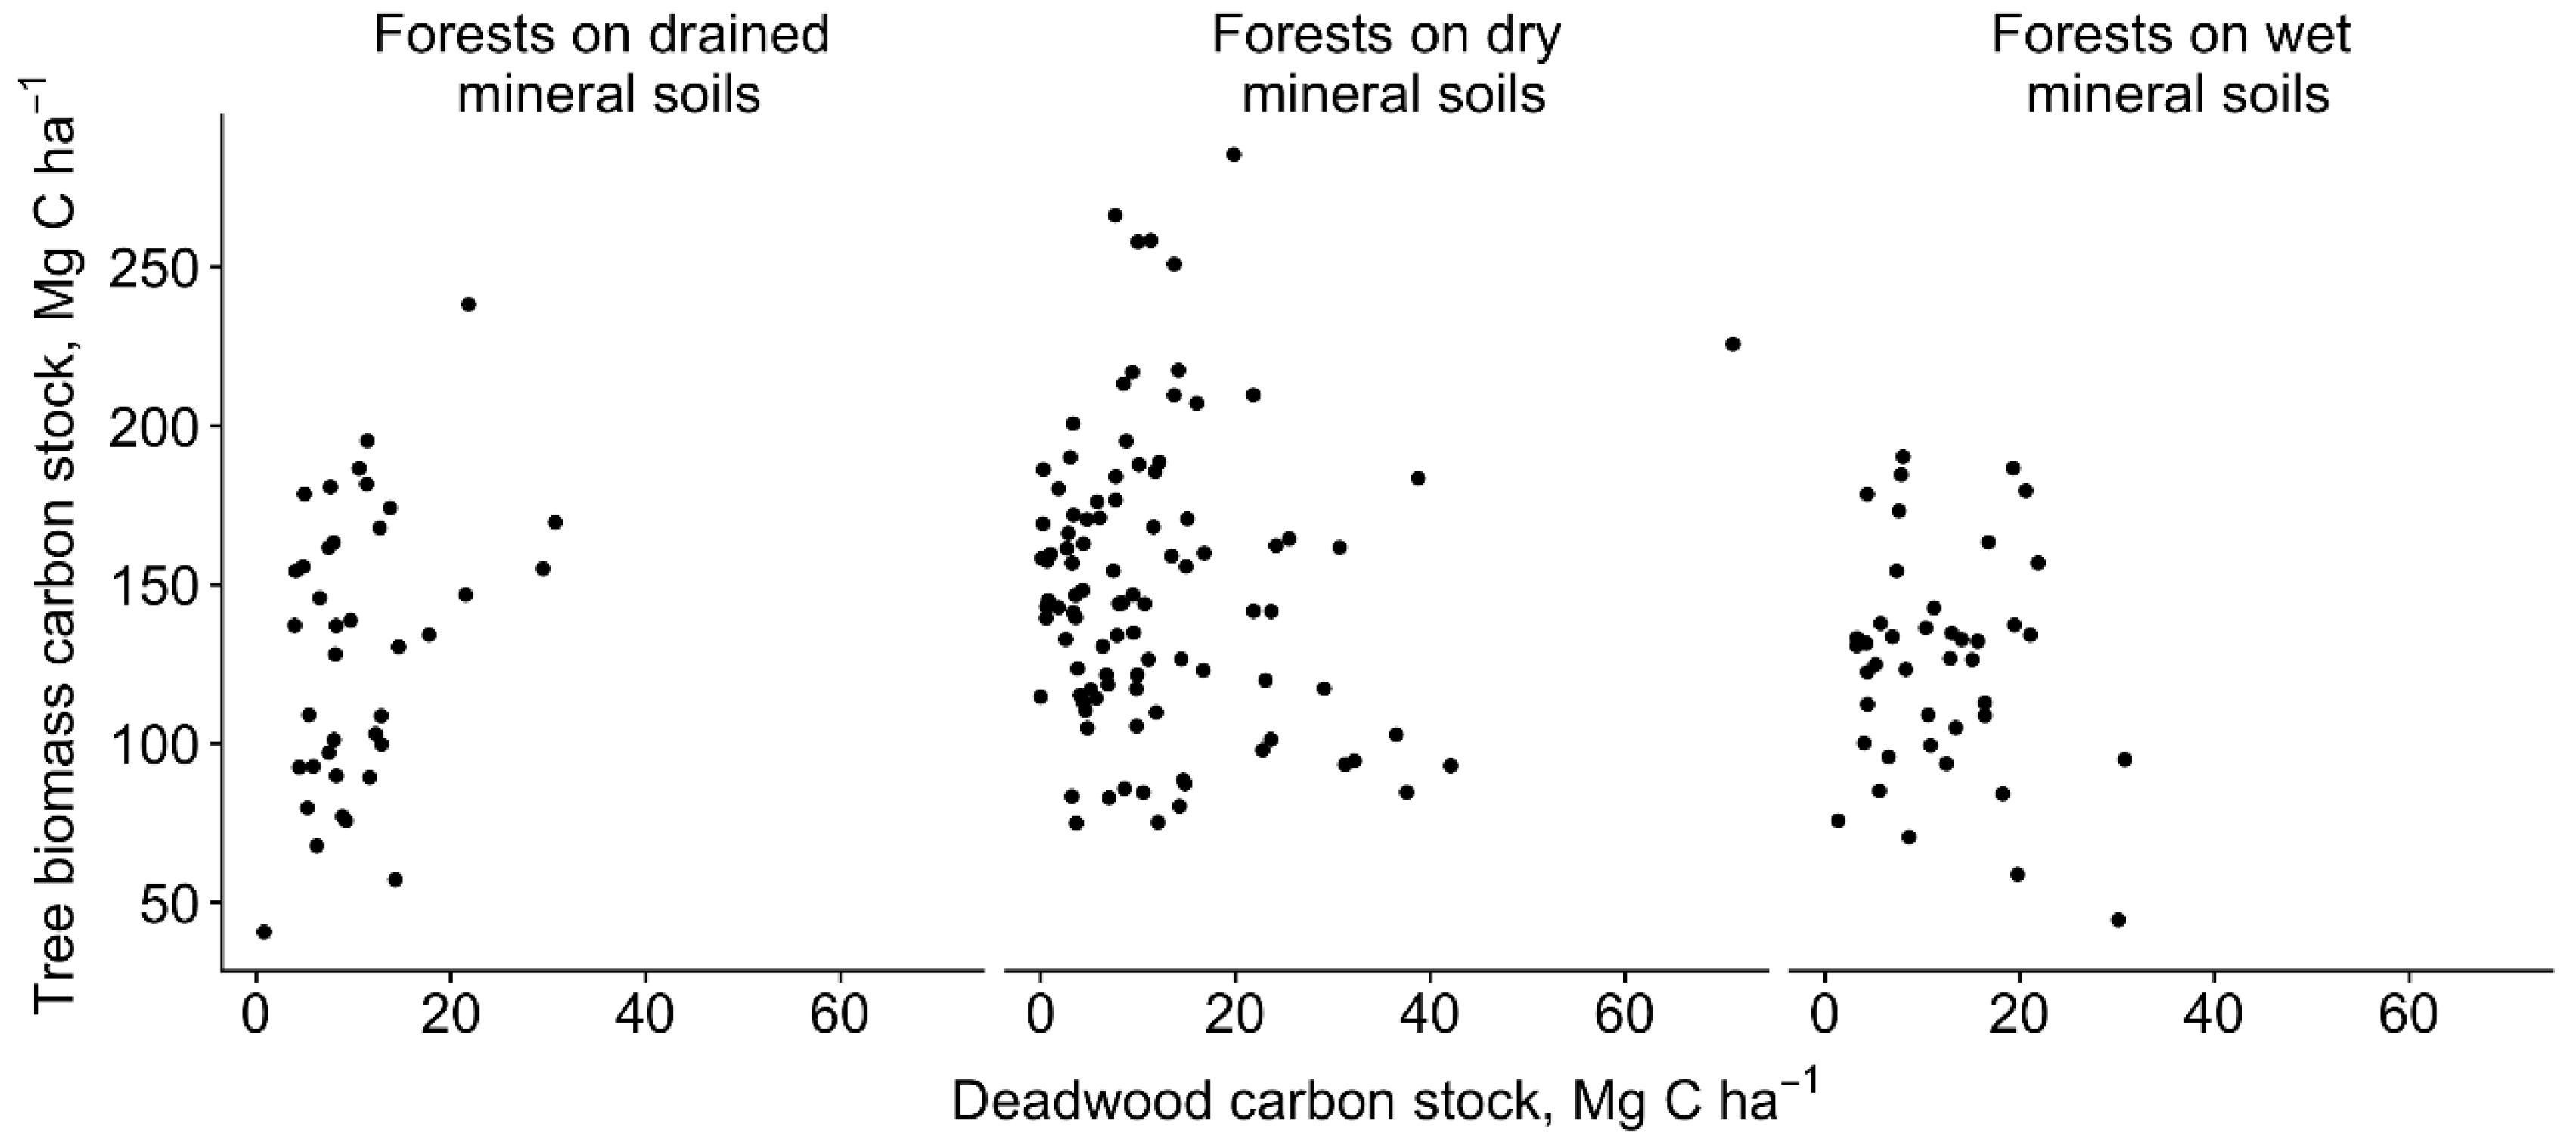
The mean carbon stock of deadwood was 11.8 ± 2.3 Mg C ha−1 (ranging between 0.1 Mg C ha−1 and 71 Mg C ha−1) in forests on dry mineral soils. Spruce trees (mean dbh 24.2 cm) formed the largest proportion of deadwood carbon stock (8.2 Mg C ha−1), followed by pines (mean dbh 29.6 cm; 1.0 Mg C ha−1) and different broadleaved tree species (mean dbh 16.4 cm; 2.4 Mg C ha−1) in forests on dry mineral soils. In the forests on wet mineral soils, the mean deadwood carbon stock ranged between 1.4 Mg C ha−1 and 30.8 Mg C ha−1 with a mean of 11.8 ± 2.2 Mg C ha−1. The largest deadwood carbon stock in forests on wet mineral soils consisted of spruces (mean dbh 21.3 cm; 8.2 Mg C ha−1), followed by birches (mean dbh 26.7 cm; 1.4 Mg C ha−1). In forests on wet mineral soils, birch (1.4 Mg C ha−1) and black alder deadwood carbon stocks were significantly higher (F2,173.00 = 5.03, p < 0.008) compared to both other forest site types. The smallest mean carbon stock of deadwood was in forests on drained mineral soils (10.6 ± 2.2 Mg C ha−1, ranging from 0.8 Mg C ha−1 to 30.7 Mg C ha−1). No significant differences (F2,20.78 = 0.78, p > 0.05) in the total deadwood carbon stock were found between the forest site types due to the high variation of the studied stands (Figure 3).
The downed logs contained, on average, 63% of the total carbon stored in the deadwood. The largest share of deadwood carbon stock accounted for 12.2% of the aboveground biomass carbon in forests on wet mineral soils, followed by forests on drained (10.3%) and dry (10.0%) mineral soils. The carbon stock in the deadwood was not significantly linked to any of the stand variables included in the analysis.
3.3. Soil Carbon
The carbon stored in the mineral soil (0–80 cm) of the studied stands ranged from 29.5 Mg C ha−1 to 214.3 Mg C ha−1 with an average carbon stock of 85.6 ± 26.1 Mg C ha−1 and did not differ (F1,15 = 0.004, p > 0.05) between forests on dry and wet mineral soils. The soil organic carbon content decreased with depths from 57 g kg−1 (0–10 cm) to 30 g kg−1 (40–80 cm). The mean carbon stock in the upper 0–10 cm layer ranged from 1.5 Mg C ha−1 to 60.1 Mg C ha−1. However, in the 40–80 cm layer, it ranged from 1.5 Mg C ha−1 to 32.7 Mg C ha−1 in sampled stands. The mean soil organic carbon stock decreased with increasing depth and greatly varied between the observed depth intervals.
3.4. Total Carbon Stock in Over-Mature Spruce Forests
The total carbon stock (including the carbon stored both in live and dead trees and soil) in over-mature forests on dry mineral soils varied from 164.8 Mg C ha−1 to 386.6 Mg C ha−1 (Table 2). Less variation of the total carbon stock was found in forests on wet (205.9–245.6 Mg C ha−1) and drained (188.3–259.8 Mg C ha−1) mineral soils. The mean total carbon stock was 249.3 ± 31.8 Mg C ha−1 in forests on dry mineral soils, 225.1 ± 11.4 Mg C ha−1 in forests on wet mineral soils, and 227.0 ± 39.8 Mg C ha−1 in forests on drained mineral soils. No significant differences of the total carbon stock in over-mature spruce stands in the assessed forest site types were observed (F2,25 = 0.92, p > 0.05).
4. Discussion
Latitudinal gradient is linked to nutrient cycling and soil richness, therefore, causing differences in carbon stock between the pools in forest ecosystem [39]. At present, the proportion of old-growth forest is very low [40]; therefore, many carbon stock studies have been conducted in young-to-mature managed temporal and boreal forests (e.g., [41,42,43]. However, few studies are available regarding the hemiboreal zone [4,22,23], which is the transition zone with diverse species and stand structures. Moreover, to our knowledge, there are no studies dealing with carbon stock estimations in over-mature spruce hemiboreal forests. Our study quantified the carbon stock of over-mature Norway spruce stands tree biomass, deadwood and soil, covering different forest site types in Latvia.
The tree biomass (above- and belowground) was the dominant carbon pool in over-mature spruce forests, ranging greatly between the stands from 41% to 74% of total carbon stock. This corresponds with the results found in other old-growth forest studies [2,17]. The mean carbon stock of the tree biomass in hemiboreal over-mature spruce stands, 139.2 Mg C ha−1, was somewhat more than reported from mixed old-growth (140–170 years) spruce stands (Vaccinium-Myrtillus type) in eastern Finland (106.3 Mg C ha−1) [2]. However, studies of old-growth spruce forests in central Europe found even more carbon stored in the tree biomass. In northeast Bavaria, Germany, 142-year-old spruce forests contained 162.5 Mg C ha−1 [44] and spruce stands (116–145 years) in the Bohemian Forest, Czech Republic, contained 150 Mg C ha−1 to 227 Mg C ha−1, respectively [17].
The tree biomass carbon stock was not significantly different between the forest site types, although forests on dry mineral soils had, on average, 16% more carbon stored in the tree biomass compared to both other forest site types (Figure 1). Nevertheless, the decline in productivity during the stand ageing process aligned the differences of the tree biomass carbon stock between older trees in different growing conditions [43], revealing that the studied over-mature spruce stands had reached their biomass storage capacity [17].
The spruce upper layer tree parameters affected the carbon stock of the tree biomass between the forest site types. Although the tree species composition in stands may be a result of random natural processes, the variation of the present species structure and stand parameters between the studied forest site types could be associated with the fertility of the site type [15,45,46] and the successional stage (tree mortality) of each stand [40,47]. Gap dynamics were assumed to be the main natural disturbance regime in studied over-mature spruce stands [48]. However, Norway spruce is highly susceptible to insects, pathogens and wind, as well as interaction among those factors, reducing the life span of the trees and dominance of particular generation of spruces in a specific stand [49]. Data of the Latvian State forest service revealed that more than 25% of established Norway spruce stands do not reach mature age (80 years). Other studies have suggested increasing (high) susceptibility of ageing spruce stands to stand-replacing disturbances [48]. Most likely, this is the main reason we were not able to find older Norway spruce stands than the ones included in the study, deliberately selected for Norway spruce dominance. Therefore, we assume that the studied over-mature spruce stands represent the maximum carbon storage capacity and can be used as a reference for comparison with managed stands. However, further studies shall be conducted to evaluate the carbon storage dynamics in theses stands as the dominant age class and/or tree species are changing due to natural disturbances, as part of the decaying old trees is captured and kept in the soil [50].
Deadwood is a functionally and ecologically important component of old forest ecosystems, affecting the total carbon storage [40,51]. The deadwood carbon stock was not significantly different between forest site types, which varied greatly between 0.1 Mg C ha−1 and 71.1 Mg C ha−1. Large differences in the amount of deadwood carbon stock occurred in the over-mature spruce stands even within the forest site type, revealing that the distribution of living trees and tree mortality within stands were the main factors explaining the variation in carbon stock [6,47]. The mean deadwood carbon stock in our sites was not very high, 11.5 Mg C ha−1, but it coincides with those of other studies [2,17]. A very high mean deadwood carbon stock (49.0 Mg C ha−1) was reported from northern Germany in old-growth (>200-year-old) spruce forests [42]. However, when comparing the mean proportion of the deadwood carbon stock of aboveground biomass in our study (10–12%) with results from northern Germany [42], Czech Republic [17], and Finland [2], comparable (12–15%) values were obtained. Although, we did not quantify dead roots (up to 3 Mg C ha−1; [17]), the largest share (63%) of deadwood carbon comprised lying deadwood.
The soil carbon plays an important role in carbon cycling as it has a potential to be stored for a long time [50]; however, the quantitative estimates of soil stock in forest ecosystems for many regions are scare [15]. Contrary to the results of studies by Klein et al. [43], and Pukkala [20], in the current study, the soil organic carbon stock was smaller than the tree biomass carbon, at about 85 Mg C ha−1. Thus, our results supported the evidence that the mean soil organic carbon stock decreased with increasing depth [52]. Nearly 30% of the soil organic carbon was concentrated in the soil surface (0–10 cm), which is more affected by different natural processes [52], although, due to the limited sample size, further analyses of the high variability of the soil organic carbon stock between the soil layers and forest site types were not possible.
The total carbon stock size of over-mature hemiboreal spruce stands was synthesised from forests where all three major carbon pools (tree biomass, deadwood, and soil) were directly measured (Table 2). By studying all major carbon pools in over-mature spruce forests, we determined that the total carbon stock was not different between the stand age of 167–213 years, which was in line with a previous study [17].
5. Conclusions
Some significant differences were observed in tree and deadwood carbon pools due to variations in stand structure (species composition and stand parameters) between the stands. Our results indicated that the total carbon stock in over-mature spruce stands between the forest site types was statistically insignificant. Overall, the carbon pools (above- and belowground biomass, deadwood, and soil) of over-mature unmanaged Norway spruce stands presented in our study may serve as a reference for further forest carbon studies in hemiboreal regions.
Author Contributions
Ā.J. conceived of the original research idea. Ā.J. and E.B. contributed to the experimental design. E.B. and L.Ķ. were responsible for data collection. L.Ķ. and D.E. analysed the data. L.Ķ. had the main responsibility for writing of the manuscript with contributions from other co-authors.
Funding
This study was supported by the Joint Stock Company Latvia’s State Forests project Assessment of greenhouse gas emission and CO2 sequestration in old forest stands.as well as in the project Measures to increase resilience of Norway spruce forests against impact of climatic changes (No. 1.1.1.2/VIAA/1/16/120) funded by the European Regional Development Fund.
Conflicts of Interest
The authors declare no conflict of interest.
References
- Krug, J.H.A. Accounting of GHG emissions and removals from forest management: A long road from Kyoto to Paris. Carbon Balance Manag. 2018, 13, 1. [Google Scholar] [CrossRef] [PubMed]
- Finér, L.; Mannerkoski, H.; Piirainen, S.; Starr, M. Carbon and nitrogen pools in an old-growth, Norway spruce mixed forest in eastern Finland and changes associated with clear-cutting. For. Ecol. Manag. 2003, 174, 51–63. [Google Scholar] [CrossRef]
- Bradshaw, C.J.A.; Warkentin, I.G. Global estimates of boreal forest carbon stocks and flux. Glob. Planet. Chang. 2015, 128, 24–30. [Google Scholar] [CrossRef]
- Uri, V.; Kukumägi, M.; Aosaar, J.; Varik, M.; Becker, H.; Morozov, G.; Karoles, K. Ecosystems carbon budgets of differently aged downy birch stands growing on well-drained peatlands. For. Ecol. Manag. 2017, 399, 82–93. [Google Scholar] [CrossRef]
- Neumann, M.; Moreno, A.; Mues, V.; Härkönen, S.; Mura, M.; Bouriaud, O.; Lang, M.; Achten, W.M.J.; Thivolle-Cazat, A.; Bronisz, K.; et al. Comparison of carbon estimation methods for European forests. For. Ecol. Manag. 2016, 361, 397–420. [Google Scholar] [CrossRef]
- Keith, H.; Lindenmayer, D.; MacKey, B.; Blair, D.; Carter, L.; McBurney, L.; Okada, S.; Konishi-Nagano, T. Managing temperate forests for carbon storage: Impacts of logging versus forest protection on carbon stocks. Ecosphere 2014, 5. [Google Scholar] [CrossRef]
- Lundmark, T.; Bergh, J.; Nordin, A.; Fahlvik, N.; Poudel, B.C. Comparison of carbon balances between continuous-cover and clear-cut forestry in Sweden. Ambio 2016, 45, 203–213. [Google Scholar] [CrossRef] [PubMed] [Green Version]
- Pohjanmies, T.; Triviño, M.; Le Tortorec, E.; Mazziotta, A.; Snäll, T.; Mönkkönen, M. Impacts of forestry on boreal forests: An ecosystem services perspective. Ambio 2017, 46, 743–755. [Google Scholar] [CrossRef] [PubMed]
- Triviño, M.; Pohjanmies, T.; Mazziotta, A.; Juutinen, A.; Podkopaev, D.; Le Tortorec, E.; Mönkkönen, M. Optimizing management to enhance multifunctionality in a boreal forest landscape. J. Appl. Ecol. 2017, 54, 61–70. [Google Scholar] [CrossRef]
- Grassi, G.; House, J.; Dentener, F.; Federici, S.; Den Elzen, M.; Penman, J. The key role of forests in meeting climate targets requires science for credible mitigation. Nat. Clim. Chang. 2017, 7, 220–226. [Google Scholar] [CrossRef]
- Sabatini, S.; Burrascano, W.S.; Keeton, C.; Levers, M.; Lindner, F.; Pötzschner, P.J.; Verkerk, J.; Bauhus, E.; Buchwald, O.; Chaskovsky, N.; et al. Where are Europe’s last primary forests? Divers. Distrib. 2018, 1–14. [Google Scholar] [CrossRef]
- Babst, F.; Bouriaud, O.; Papale, D.; Gielen, B.; Janssens, I.A.; Nikinmaa, E.; Ibrom, A.; Wu, J.; Bernhofer, C.; Köstner, B.; et al. Above-ground woody carbon sequestration measured from tree rings is coherent with net ecosystem productivity at five eddy-covariance sites. New Phytol. 2014, 201, 1289–1303. [Google Scholar] [CrossRef] [PubMed]
- Schelhaas, M.J.; Nabuurs, G.J.; Hengeveld, G.; Reyer, C.; Hanewinkel, M.; Zimmermann, N.E.; Cullmann, D. Alternative forest management strategies to account for climate change-induced productivity and species suitability changes in Europe. Reg. Environ. Chang. 2015, 15, 1581–1594. [Google Scholar] [CrossRef] [Green Version]
- Thom, D.; Seidl, R. Natural disturbance impacts on ecosystem services and biodiversity in temperate and boreal forests. Biol. Rev. Camb. Philos. Soc. 2016, 91, 760–781. [Google Scholar] [CrossRef] [PubMed]
- Vesterdal, L.; Clarke, N.; Sigurdsson, B.D.; Gundersen, P. Do tree species influence soil carbon stocks in temperate and boreal forests? For. Ecol. Manag. 2013, 309, 4–18. [Google Scholar] [CrossRef]
- Odum, E. The strategy of ecosystem development. Science 1969, 164, 262–270. [Google Scholar] [CrossRef] [PubMed]
- Seedre, M.; Kopáček, J.; Janda, P.; Bače, R.; Svoboda, M. Carbon pools in a montane old-growth Norway spruce ecosystem in Bohemian Forest: Effects of stand age and elevation. For. Ecol. Manag. 2015, 346, 106–113. [Google Scholar] [CrossRef]
- Carey, E.V.; Sala, A.; Keane, R.; Callaway, R.M. Are old forest underestimated as global carbon sinks? Glob. Chang. Biol. 2001, 7, 339–344. [Google Scholar] [CrossRef]
- Luyssaert, S.; Schulze, E.D.; Börner, A.; Knohl, A.; Hessenmöller, D.; Law, B.E.; Ciais, P.; Grace, J. Old-growth forests as global carbon sinks. Nature 2008, 455, 213–215. [Google Scholar] [CrossRef] [PubMed]
- Pukkala, T. Does management improve the carbon balance of forestry? Forestry 2017, 90, 125–135. [Google Scholar] [CrossRef]
- Pregitzer, K.S.; Euskirchen, E.S. Carbon cycling and storage in world forests: Biome patterns related to forest age. Glob. Chang. Biol. 2004, 10, 2052–2077. [Google Scholar] [CrossRef]
- Varik, M.; Aosaar, J.; Ostonen, I.; Lõhmus, K.; Uri, V. Carbon and nitrogen accumulation in belowground tree biomass in a chronosequence of silver birch stands. For. Ecol. Manag. 2013, 302, 62–70. [Google Scholar] [CrossRef]
- Lõhmus, A.; Kraut, A. Stand structure of hemiboreal old-growth forests: Characteristic features, variation among site types, and a comparison with FSC-certified mature stands in Estonia. For. Ecol. Manag. 2010, 260, 155–165. [Google Scholar] [CrossRef]
- Ahti, T.; Hämet-Ahti, L.; Jalas, J. Vegetation zones and their sections in north-western Europe. Ann. Bot. Fenn. 1968, 5, 169–211. [Google Scholar]
- Baders, E.; Senhofa, S.; Purina, L.; Jansons, A. Natural succession of Norway spruce stands in hemiboreal forests: Case study in Slitere national park, Latvia. Balt. For. 2017, 23, 522–528. [Google Scholar]
- Kasparinskis, R.; Nikodemus, O. Influence of environmental factors on the spatial distribution and diversity of forest soil in Latvia. Est. J. Earth Sci. 2012, 61, 48–64. [Google Scholar] [CrossRef]
- Bušs, K. Basis of Forest Classification in SSR of Latvia; LRZTIPI: Rīga, Latvia, 1976; p. 24. (In Latvian) [Google Scholar]
- Sharma, R.P.; Vacek, Z.; Vacek, S. Nonlinear mixed effect height-diameter model for mixed species forests in the central part of the Czech Republic. J. For. Sci. 2016, 62, 470–484. [Google Scholar] [CrossRef] [Green Version]
- Matuzānis, J. Stand Growth and Yield Models; LatZTIZPLI: Rīga, Latvia, 1983; p. 32. (In Latvian) [Google Scholar]
- Liepiņš, J.; Lazdiņš, A.; Liepiņš, K. Equations for estimating above- and belowground biomass of Norway spruce, Scots pine, birch spp. and European aspen in Latvia. Scand. J. For. Res. 2018, 33, 58–70. [Google Scholar] [CrossRef]
- Thomas, S.C.; Martin, A.R. Carbon content of tree tissues: A synthesis. Forests 2012, 3, 332–352. [Google Scholar] [CrossRef]
- Sandström, F.; Petersson, H.; Kruys, N.; Ståhl, G. Biomass conversion factors (density and carbon concentration) by decay classes for dead wood of Pinus sylvestris, Picea abies and Betula spp. in boreal forests of Sweden. For. Ecol. Manag. 2007, 243, 19–27. [Google Scholar] [CrossRef]
- Köster, K.; Metslaid, M.; Engelhart, J.; Köster, E. Dead wood basic density, and the concentration of carbon and nitrogen for main tree species in managed hemiboreal forests. For. Ecol. Manag. 2015, 354, 35–42. [Google Scholar] [CrossRef]
- Russell, M.B.; Fraver, S.; Aakala, T.; Gove, J.H.; Woodall, C.W.; D’Amato, A.W.; Ducey, M.J. Quantifying carbon stores and decomposition in dead wood: A review. For. Ecol. Manag. 2015, 350, 107–128. [Google Scholar] [CrossRef]
- Fleck, S.; Cools, N.; De Vos, B.; Meesenburg, H.; Fischer, R. The Level II aggregated forest soil condition database links soil physicochemical and hydraulic properties with long-term observations of forest condition in Europe. Ann. For. Sci. 2016, 73, 945–957. [Google Scholar] [CrossRef] [Green Version]
- R Core Team. R: A Language and Environment for Statistical Computing. Available online: https://www.R-project.org (accessed on 9 March 2018).
- Bates, D.; Mächler, M.; Bolker, B.; Walker, S. Fitting linear mixed-effects models using lme4. J. Stat. Softw. 2015, 67. [Google Scholar] [CrossRef]
- Lenth, R. Emmeans: Estimated Marginal Means, Aka Least-Square Means. R Package Version 1.2.1. Available online: https://CRAN.R-project.org/package=emmeans (accessed on 9 March 2018).
- Vucetich, J.A.; Reed, D.A.; Breymeyer, A.; Degórski, M.; Mroz, G.D.; Solon, J.; Roo-Zielinska, E.; Noble, R. Carbon pools and ecosystem properties along a latitudinal gradient in northern Scots pine (Pinus sylvestris) forests. For. Ecol. Manag. 2000, 128, 135–145. [Google Scholar] [CrossRef]
- Siitonen, J.; Martikainen, P.; Punttila, P.; Rauh, J. Coarse woody debris and stand characteristics in mature managed and old-growth boreal mesic forests in southern Finland. For. Ecol. Manag. 2000, 128, 211–225. [Google Scholar] [CrossRef]
- Fredeen, A.L.; Bois, C.H.; Janzen, D.T.; Sanborn, P.T. Comparison of coniferous forest carbon stocks between old-growth and young second-growth forests on two soil types in central British Columbia, Canada. Can. J. For. Res. 2005, 35, 1411–1421. [Google Scholar] [CrossRef]
- Jacob, M.; Bade, C.; Calvete, H.; Dittrich, S.; Leuschner, C.; Hauck, M. Significance of over-mature and decaying trees for carbon stocks in a Central European natural spruce forest. Ecosystems 2013, 16, 336–346. [Google Scholar] [CrossRef]
- Klein, D.; Höllerl, S.; Blaschke, M.; Schulz, C. The contribution of managed and unmanaged forests to climate change mitigation-A model approach at stand level for the main tree species in Bavaria. Forests 2013, 4, 43–69. [Google Scholar] [CrossRef]
- Mund, M.; Kummetz, E.; Hein, M.; Bauer, G.A.; Schulze, E.D. Growth and carbon stocks of a spruce forest chronosequence in central Europe. For. Ecol. Manag. 2002, 171, 275–296. [Google Scholar] [CrossRef]
- Gao, T.; Hedblom, M.; Emilsson, T.; Nielsen, A.B. The role of forest stand structure as biodiversity indicator. For. Ecol. Manag. 2014, 330, 82–93. [Google Scholar] [CrossRef]
- Shanin, V.; Komarov, A.; Mäkipä, R. Tree species composition affects productivity and carbon dynamics of different site types in boreal forests. Eur. J. For. Res. 2014, 133, 273–286. [Google Scholar] [CrossRef]
- Aakala, T.; Kuuluvainen, T.; Wallenius, T.; Kauhanen, H. Contrasting patterns of tree mortality in late-successional Picea-Abies stands in northern Fennoscandia. J. Veg. Sci. 2009, 20, 1016–1026. [Google Scholar] [CrossRef]
- Angelstam, P.; Kuuluvainen, T. Boreal forest disturbance regimes, successional dynamics and landscape structures: A European perspective. Ecol. Bull. 2004, 51, 117–136. [Google Scholar]
- Seidl, R.; Rammer, W. Climate change amplifies the interactions between wind and bark beetle disturbances in forest landscapes. Landsc. Ecol. 2017, 32, 1485–1498. [Google Scholar] [CrossRef] [PubMed]
- Clarke, N.; Gundersen, P.; Jönsson-belyazid, U.; Kjønaas, O.J.; Persson, T.; Sigurdsson, B.D.; Stupak, I.; Vesterdal, L. Influence of different tree-harvesting intensities on forest soil carbon stocks in boreal and northern temperate forest ecosystems. For. Ecol. Manag. 2015, 351, 9–19. [Google Scholar] [CrossRef]
- Jain, T.B.; Graham, R.T.; Adams, D. Carbon concentrations and carbon pool distributions in dry, moist, and cold mid-aged forests of the rocky mountains. In Integrated Management of Carbon Sequestration and Biomass Utilization Opportunities in a Changing Climate, Proceedings of the 2009 National Silviculture Workshop, Boise, ID, USA, 15–18 June 2009; Jain, T.B., Graham, R.T., Sandquist, J., Eds.; U.S. Department of Agriculture, Forest Service, Rocky Mountain Research Station: Fort Collins, CO, USA, 2010; pp. 39–59. [Google Scholar]
- Hansson, K.; Olsson, B.A.; Olsson, M.; Johansson, U.; Berggren, D. Differences in soil properties in adjacent stands of Scots pine, Norway spruce and silver birch in SW Sweden. For. Ecol. Manag. 2011, 262, 522–530. [Google Scholar] [CrossRef]
Figure 1.
Mean carbon stock of tree biomass components (±95% confidence interval of mean total tree biomass carbon stock) between the forest site types.
Figure 1.
Mean carbon stock of tree biomass components (±95% confidence interval of mean total tree biomass carbon stock) between the forest site types.

Figure 2.
Influence of proportion of spruce in the stand composition on tree biomass (above- and belowground biomass) carbon stock (±95% confidence interval (grey area)) in different forest site types.
Figure 2.
Influence of proportion of spruce in the stand composition on tree biomass (above- and belowground biomass) carbon stock (±95% confidence interval (grey area)) in different forest site types.

Figure 3.
The tree biomass and deadwood carbon stocks of sample plots in different forest site types.
Figure 3.
The tree biomass and deadwood carbon stocks of sample plots in different forest site types.


Table 1.
Characteristics of over-mature spruce stands of each forest site type. The forest site types included dry (Hylocomniosa, Oxalidosa), wet (Myrtilloso-sphagnosa, Myrtilloso-polytrichosa), and drained (Myrtillosa mel.) mineral soils.
Table 1.
Characteristics of over-mature spruce stands of each forest site type. The forest site types included dry (Hylocomniosa, Oxalidosa), wet (Myrtilloso-sphagnosa, Myrtilloso-polytrichosa), and drained (Myrtillosa mel.) mineral soils.
| Parameters ± CI 1 | Dry Mineral Soil | Wet Mineral Soil | Drained Mineral Soil |
|---|---|---|---|
| Mean tree dbh 2, cm | 41.2 ± 4.2 | 32.9 ± 4.8 | 31.1 ± 5.5 |
| Mean tree height, m | 29.7 ± 1.8 | 25.9 ± 2.3 | 26.7 ± 3.3 |
| Mean stand basal area, m2 ha−1 | 37.9 ± 3.4 | 32.7 ± 3.8 | 33.4 ± 8.9 |
| Mean basal area in upper tree layer, m2 ha−1 | 29.9 ± 3.6 | 25.6 ± 3.2 | 26.4 ± 7.2 |
| Mean stand volume, m3 ha−1 | 462.0 ± 66.5 | 357.4 ± 51.4 | 389.4 ± 121.4 |
| Site index, m | 27 | 23 | 25 |
| Mean stand age, years | 181.1 ± 6.2 | 179 ± 11.5 | 185 ± 23.4 |
| Number of sample plots | 98 | 42 | 38 |
1 CI: 95% confidence interval; 2 dbh: diameter at breast height.
Table 2.
Mean carbon stock (Mg C ha−1) of live, dead trees and soil in over-mature spruce forests between the different forest site types.
Table 2.
Mean carbon stock (Mg C ha−1) of live, dead trees and soil in over-mature spruce forests between the different forest site types.
| Carbon Pools ± CI 1 | Dry Mineral Soil | Wet Mineral Soil | Drained Mineral Soil |
|---|---|---|---|
| Aboveground tree biomass | 116.8 ± 15.4 | 96.8 ± 11.5 | 102.4 ± 30.3 |
| Belowground tree biomass | 32.3 ± 3.6 | 28.4 ± 2.6 | 28.5 ± 7.9 |
| Total tree biomass carbon stock | 149.2 ± 18.9 | 125.2 ± 14.0 | 130.9 ± 38.1 |
| Lying deadwood | 37.9 ± 3.4 | 32.7 ± 3.8 | 33.4 ± 8.9 |
| Standing snags | 29.9 ± 3.6 | 25.6 ± 3.2 | 26.4 ± 7.2 |
| Total deadwood carbon stock | 11.8 ± 2.3 | 11.8 ± 2.2 | 10.6 ± 2.2 |
| Soil carbon stock | 88.4 ± 23.8 | 88.0 ± 12.4 | 85.6 ± 26.1 * |
| Total carbon stock | 249.3 ± 31.8 | 225.1 ± 11.4 | 227.0 ± 39.8 |
1 CI: 95% confidence interval; * mean soil carbon stock was used.
© 2018 by the authors. Licensee MDPI, Basel, Switzerland. This article is an open access article distributed under the terms and conditions of the Creative Commons Attribution (CC BY) license (http://creativecommons.org/licenses/by/4.0/).
Share and Cite
MDPI and ACS Style
Ķēniņa, L.; Elferts, D.; Bāders, E.; Jansons, Ā. Carbon Pools in a Hemiboreal Over-Mature Norway Spruce Stands. Forests 2018, 9, 435. https://doi.org/10.3390/f9070435
AMA Style
Ķēniņa L, Elferts D, Bāders E, Jansons Ā. Carbon Pools in a Hemiboreal Over-Mature Norway Spruce Stands. Forests. 2018; 9(7):435. https://doi.org/10.3390/f9070435
Chicago/Turabian StyleĶēniņa, Laura, Didzis Elferts, Endijs Bāders, and Āris Jansons. 2018. "Carbon Pools in a Hemiboreal Over-Mature Norway Spruce Stands" Forests 9, no. 7: 435. https://doi.org/10.3390/f9070435
Note that from the first issue of 2016, this journal uses article numbers instead of page numbers. See further details here.