Article

Evaluation of Composite Burn Index and Land Surface Temperature for Assessing Soil Burn Severity in Mediterranean Fire-Prone Pine Ecosystems

by
Elena Marcos
1,*,
Víctor Fernández-García
1,
Alfonso Fernández-Manso
2,
Carmen Quintano
3,
Luz Valbuena
1,
Reyes Tárrega
1,
Estanislao Luis-Calabuig
1 and
Leonor Calvo
1
1
Area of Ecology, Department of Biodiversity and Environmental Management, Faculty of Biological and Environmental Sciences, Universidad de León, 24071 León, Spain
2
Agrarian Science and Engineering Department, Universidad de León, Av. Astorga s/n, 24400 Ponferrada, Spain
3
Electronic Technology Department, Sustainable Forest Management Research Institute, Universidad de Valladolid, Spanish National Institute for Agriculture and Food Research and Technology (INIA), C/Francisco Mendizábal s/n, 47014 Valladolid, Spain
*
Author to whom correspondence should be addressed.
Forests 2018, 9(8), 494; https://doi.org/10.3390/f9080494
Submission received: 15 June 2018 / Revised: 6 August 2018 / Accepted: 9 August 2018 / Published: 13 August 2018
(This article belongs to the Special Issue Forest Post-Fire Regeneration)

Abstract

:
We analysed the relationship between burn severity indicators, from remote sensing and field observations, and soil properties after a wildfire in a fire-prone Mediterranean ecosystem. Our study area was a large wildfire in a Pinus pinaster forest. Burn severity from remote sensing was identified by studying immediate post-fire Land Surface Temperature (LST). We also evaluated burn severity in the field applying the Composite Burn Index (CBI) in a total of 84 plots (30 m diameter). In each plot we evaluated litter consumption, ash colour and char depth as visual indicators. We collected soil samples and pH, soil organic carbon, dry aggregate size distribution (MWD), aggregate stability and water repellency were analysed. A controlled heating of soil was also carried out in the laboratory, with soil from the control plots, to compare with the changes produced in soils affected by different severity levels in the field. Our results shown that changes in soil properties affected by wildfire were only observed in soil aggregation in the high severity situation. The laboratory-controlled heating showed that temperatures of about 300 °C result in a significant reduction in soil organic carbon and MWD. Furthermore, soil organic carbon showed a significant decrease when LST values increased. Char depth was the best visual indicator to show changes in soil properties (mainly physical properties) in large fires that occur in Mediterranean pine forests. We conclude that CBI and post-fire LST can be considered good indicators of soil burn severity since both indicate the impact of fire on soil properties.

1. Introduction

Forest fires represent one of the main disturbances in the Mediterranean forest ecosystem [1], and mainly affect Pinus halepensis Mill and Pinus pinaster Ait forests in Spain [2]. In the last few decades, the fire regime changes have been driven by climate and land use and, more recently, have also been influenced by fire suppression policies [3]. These factors generate a more favourable environment for the occurrence of large forest fires that produce high degradation of the Mediterranean ecosystems [4].
It is known that fire can alter a variety of physical, chemical, mineralogical and biological soil properties [5,6,7,8,9,10]. In turn, soil responses affect vegetation composition, structure, and successional dynamics over time and across multiple spatial scales [11]. The damage produced by fire is often expressed in terms of fire/burn severity, terms which are often used indiscriminately [12]. Nevertheless, there is no general agreement in the literature on the precise meaning of this concept since both terms are understood as organic matter loss [12]. We will use the term “soil burn severity” to refer to the loss of organic matter in soil or on its surface, as in report NWCG [13], to evaluate the short-term impact of fire on soil [14,15,16,17].
Soil burn severity is often used as an indicator of disturbances in soil properties caused by fire [18]. The interest of assessing soil burn severity consists of predicting the impact on physical, chemical and biological soil properties [19,20] and their implications on the recovery of the ecosystem. It is also used to identify areas with a high risk of erosion processes and to prioritise emergency measurements [18,21,22] with the aim of protecting populations from damage caused by destructive floods [23]. In Mediterranean burnt forests, soils often appear as mosaics with areas barely or seriously affected by the wildfire [24], parts of which need rehabilitation. Despite the difficulty of this heterogeneous situation to evaluate burn severity, describing post-fire soil conditions will improve interpretations of fire-effect research, and will help forestry managers in the decision-making process after a fire [19].
Nowadays, there is no complete agreement on a standard methodology or a quantitative index that determines soil burn severity [18,25] and its assessment in the field must be done by means of visual indicators, which generally reflect changes in the forest floor and mineral soil [26]. Some of the visual soil indicators most widely used are the level of consumption of organic layers, the deposition of ash (depth, colour, etc.) [21,27] or fire-induced changes in soil colour patterns [28,29]. Furthermore, there are some soil burn severity indices that link visual indicators, such as the index proposed by Vega et al. [30], the soil post-fire index (PFI) proposed by Jain et al. [19] or the Composite Burn Index (CBI) developed by Key and Benson [14], which quantify the degree of change directly caused by fire. The majority of these indices are based on the consumption of organic layers, the amount of ash deposition and changes in soil colour. One of the most used is the CBI index [4], which was developed as an operational methodology for burn severity assessment, in the framework of the FIREMON (Fire Effects Monitoring and Inventory Protocol) project [31]. This method has been used in short- and long-term effects evaluation, and it is well adapted to estimating burn severity variations in forests. Furthermore, it was designed to be operationally retrieved from medium-resolution remotely sensed data, namely Landsat TM [14,32]. CBI assesses the vegetation and soil changes resulting from fire by calculating an overall continuous severity index ranging from 0–3. The CBI field form independently evaluates five vertical strata: Substrate (litter, soil), vegetation 1 m high, vegetation 1–5 m high, subcanopy trees and upper canopy trees. However, the average CBI value probably gives more importance to vegetation than soil layers [10,33], because four strata aboveground vegetation are used. Therefore, it must be considered that these indices reflect the impact on vegetation very well, but they could not reflect changes in soil suitably (as they are not always affected to the same degree). This could be a problem when soil post-fire management decisions are taken based on burn severity maps the thresholds of which are determined using CBI [33].
In the case of large forest fires, the elaboration of burn severity maps using exclusively field measurements is very difficult. These maps will serve as a baseline for field management teams to coordinate post-fire rehabilitation efforts [
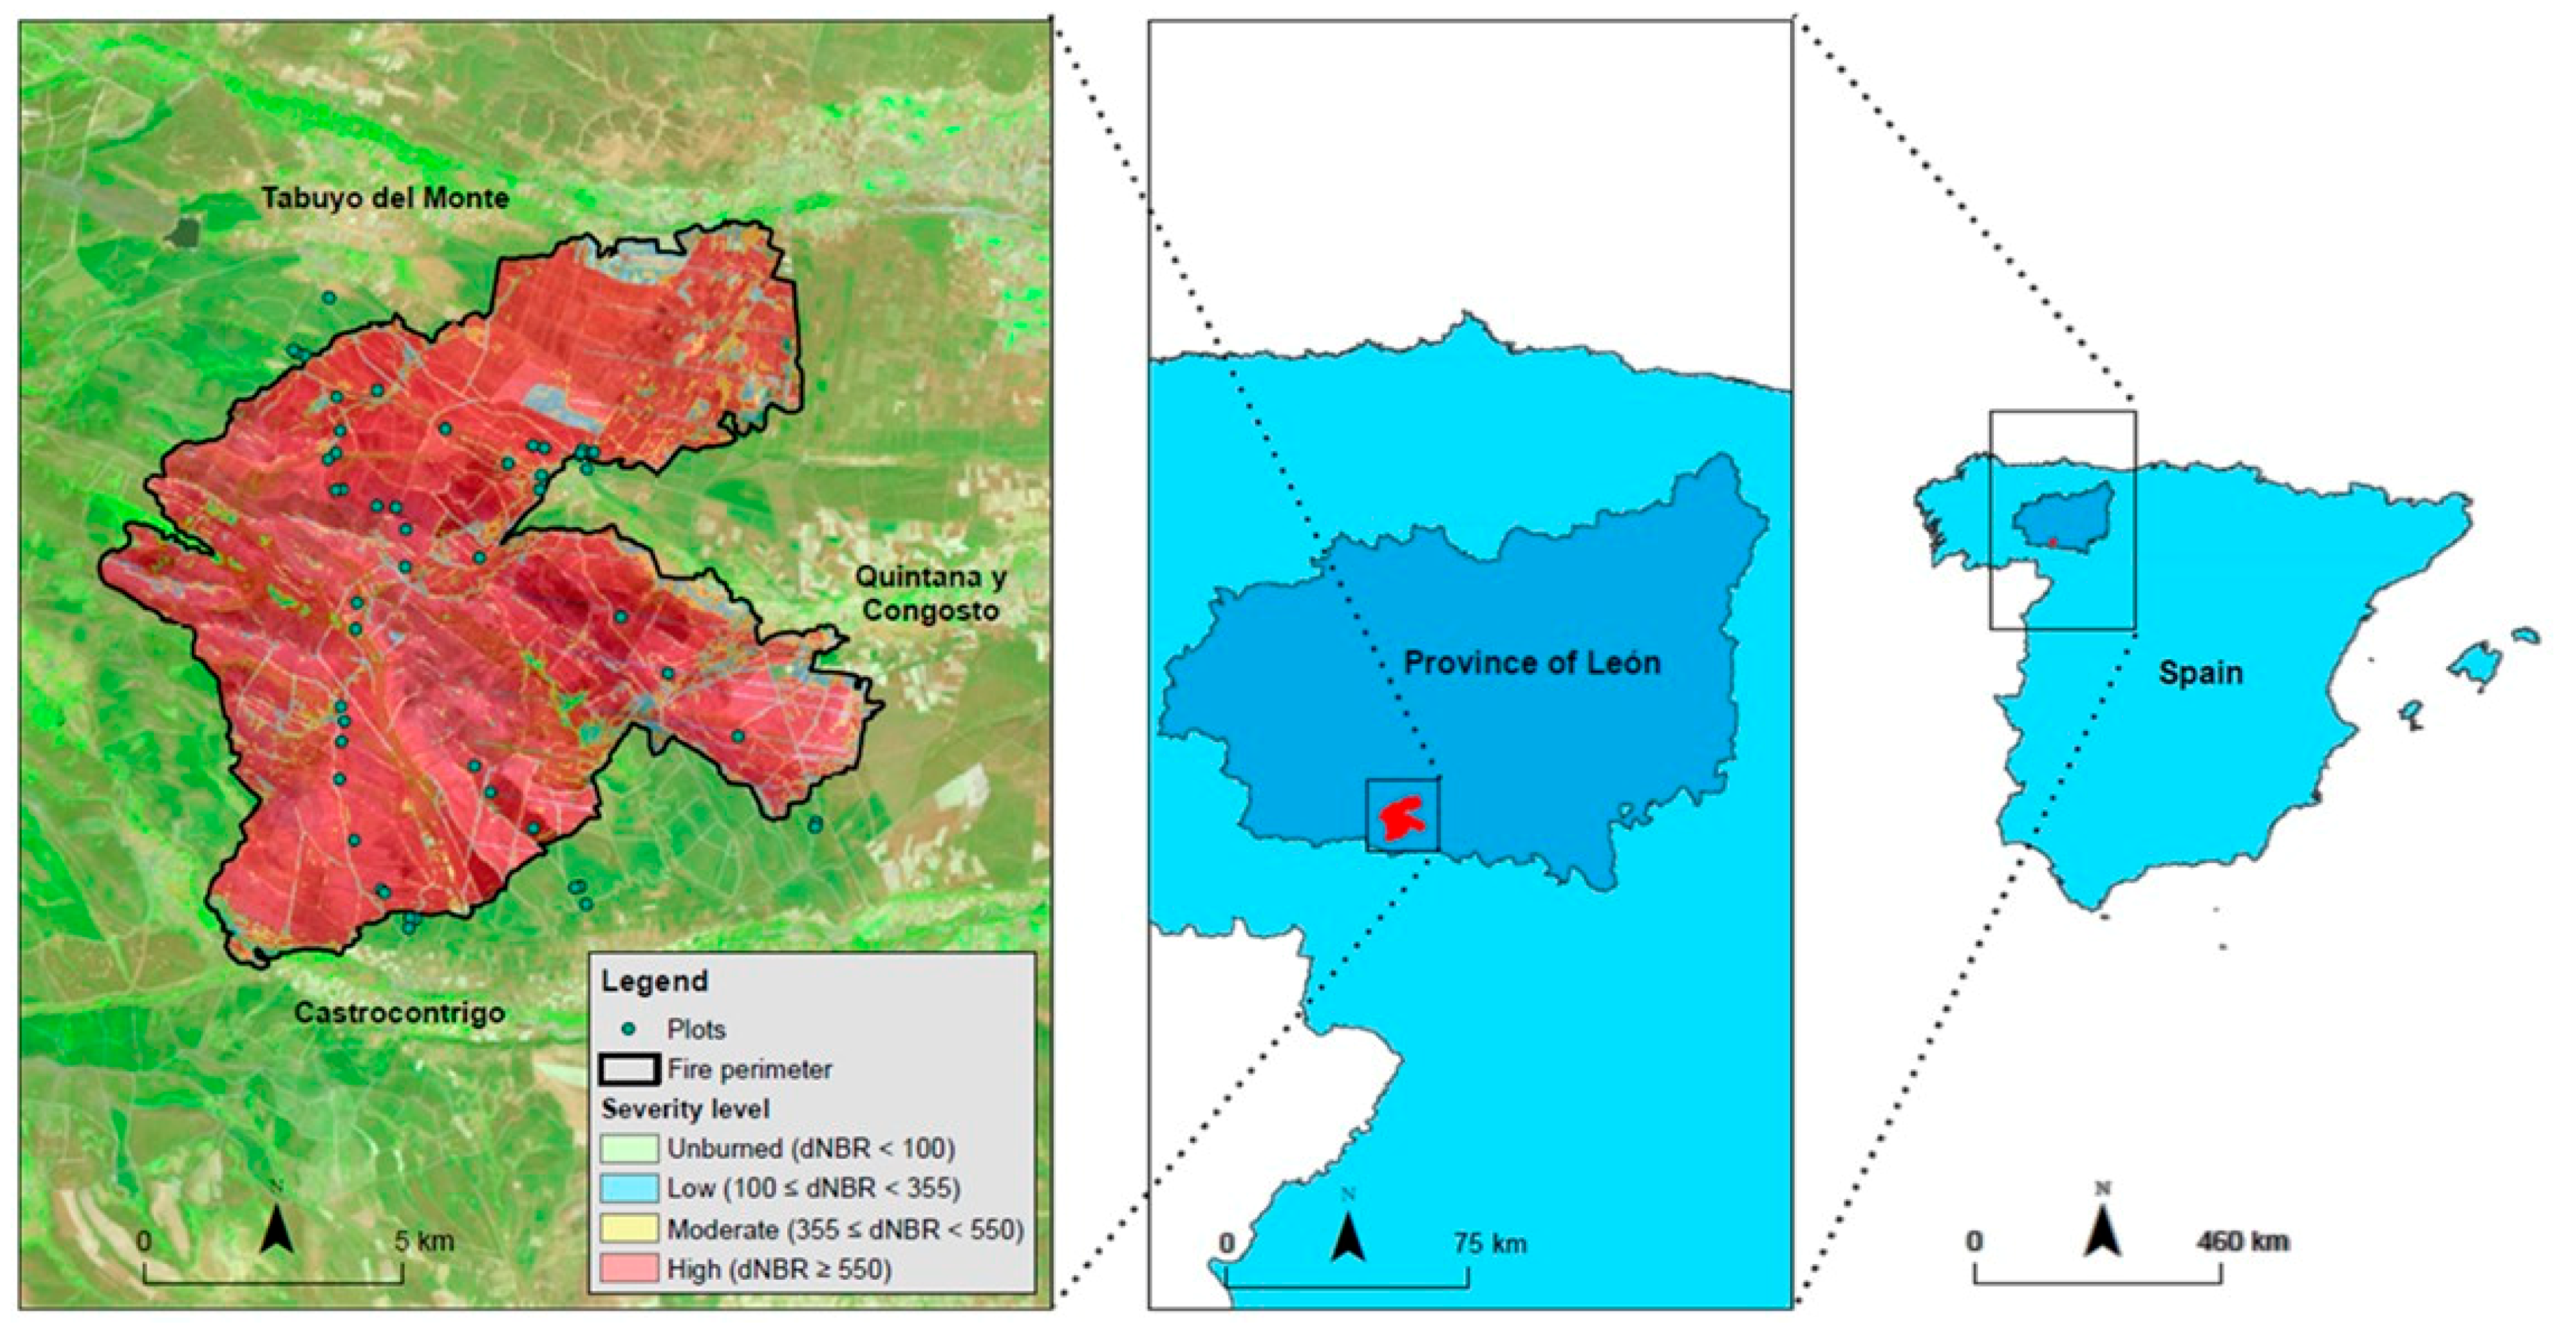
34]. For this reason, recent studies on fire severity have focused on the use of remote sensing, alone or combined with field observations to obtain appropriated tools to identify the fire effects on ecosystems. The differenced Normalized Burn Ratio (dNBR) is one of the severity indicators most often used [14]. Other spectral indices have been developed specifically to detect post-fire effects: The Burned Area Index (BAI) [35], the Char Soil Index (CSI) [36] and the Mid Infrared Burn Index (MIRBI) [37]. In this sense, other authors [4,38] have proposed the use of Land Surface Temperature (LST) as an indicator of burn severity, showing a good relationship in the most severely burned areas. However, these Landsat spectral indices were not efficient enough to estimate soil burn severity [10] and there are no studies that related these spectral indices with changes in soil characteristics.
Numerous studies have demonstrated a clear relationship between temperature achieved in the soil and changes in soil properties [39,40,41], so these could be used as potential soil burn severity indicators. In this regard, Notario del Pino et al. [42] suggest measuring a series of chemical parameters determined in the 1:5 soil: water extract to evaluate fire severity. Likewise, measurements of ash pH and chemical composition [25,43] or soil microbial activity [44] can properly represent the degree of fire impact. Nevertheless, this option is not feasible due to the cost and time required to analyse soil samples.
To determine whether visual indicators and the remote sensing index reflect soil burn severity in a proper way, it is necessary to relate both of them to changes in soil characteristics. In this sense, there are some studies that assessed visual signs of soil burn severity with changes in soil chemical and microbial properties after fire [30], post-fire soil erosion [45], or soil fertility [46]. Some soil properties such as pH, soil organic matter, aggregates stability, mean weight diameter or soil water repellence might be considered to explore the relationship with soil burn severity [47,48,49]. All of them are often significantly affected by increase of burn severity [41,50,51,52], easy to measure and may be of great interest due to their relationship with soil loss by erosion.
In this study, the main objective is the evaluation of the suitability of the CBI and LST as indices to estimate soil burn severity and reflect changes in soil properties in pine fire-prone ecosystems. More specifically, we checked if substrate component of CBI and the individual visual indicators (litter consumption, ash colour and char depth) of soil burn severity reflect the same pattern of changes in the same way. Finally, we also related field soil samples with laboratory heating soils to estimate the temperature reached in each severity level in order to identify the threshold of the severity levels.

2. Materials and Methods

2.1. Study Area

The study area is located in the Sierra del Teleno mountain range (NW Spain; 42°15′34″ N/06°12′13″ W; Figure 1). It is a small mountain chain with an average slope of 10% and elevation above sea level ranges from 850–2100 m. The climate is Mediterranean with 2–3 months’ dryness in summer, annual precipitation between 650–900 mm [4] and average temperature around 11 °C. The frequency of dry storms together with very low precipitation occurring mainly in spring and summer, often producing crown fires affecting small areas [53]. In this area, a total of 28 fires were identified between 1978 and 2017 [16]; however, the most surface was affected by low fire recurrence (1 fire in 39 years). The lithology is dominated by stones, silts, clays and conglomerates in the lowest areas, and slate, sandstone, and quartzite in the high ones [54], and soils are classified as Distric cambisol and Leptosol [55]. The soils in the unburned sites are acidic (pH around 5), with a high content of sand and low soil organic carbon content, available phosphorous and total nitrogen (Table 1). The vegetation present before fire was covered by Pinus pinaster Ait. (73%), by Quercus ilex L. (7%) and Quercus pyrenaica Willd (5%). In the understorey layer we found species such as: Erica australis L. (60%), Calluna vulgaris (L.) Hull (10%), Pterospartum tridentatum (L.) Willk. (10%), and Halimium lasianthum spp. alyssoides (Lam.) Greuter (5%) [56].
A large fire occurred on 19 August 2012, which burned 11,775 ha over three days, with the burnt surface mainly occupied by Pinus pinaster forest (10,265 ha), with a tree age of 35–95 years old [57]. This fire started on 19 August and finished 21 August. The weather conditions during the first day were 32 °C and relative humidity 27%. There was a very significant accumulated drought, with Haines index values of 6. For more information about this fire, see Quintano et al. [4].

2.2. Field Estimation of Soil Burn Severity and Soil Sampling

Soil burn severity was evaluated using an adapted version of the original Composite Burn Index (CBI) proposed by Key and Benson [14]. We measured CBI values two months after wildfire in 68 plots from the burned area plus 16 from the unburned one close to the fire perimeter (a total of 84 plots). Field plots (30 m diameter) were randomly distributed in fairly homogeneous patches of at least 100 m diameter and positions were GPS recorded. In this study, only CBI values from the substrate stratum (Table 2) were considered. Litter consumption, ash colour and char depth were used as factors or visual indicators. The thresholds between severity classes forming the CBI data were: Unburned (0), low severity (0.1–1.24), moderate severity (1.25–2.24) and high severity (2.25–3).
Soil samples were collected along two perpendicular transects (15 m long each one), in each plot (30 m diameter) to evaluate the effect of fire on soils. Four surface soil samples (0–5 cm in depth) were taken in each transect (after removing coarse charred materials, as well as litter and plant debris from the surface in burned and unburned plots, respectively), mixed, air dried and stored for further analysis. No significant precipitation was recorded from the fire until the sampling period.

2.3. Remotely Sensed Data

Remotely sensed information to estimate burn severity was obtained from a Landsat-7 ETM+ scene (path/row 203/31), specifically from 21 August 2012 because it was the closest scene to fire. The scene was downloaded from the US Geological Survey (L1T processing level). The methodology of pre-processing of remotely sensed data, LST calculation, and the building of the work database, is described in Quintano et al. [4]. The weather conditions at Landsat scan time were: (1) air temperature: 21 °C; (2) precipitation accumulated in 30 days: 0; (3) relative humidity: 70% and (4) wind speed: 10 km h−1.

2.4. Soil Heating

Twenty soil samples from an unburned area (control area), with similar characteristics to a burned forest in terms of soil and vegetation, were sampled at a depth of 0–5 cm to provide laboratory samples. They were air dried, homogenized and 2 mm sieved before heating. The selected temperatures were 100 °C, 300 °C, and 500 °C, which can simulate temperatures reached in Mediterranean soils affected by wildfires [5]. Aliquots of 100 g were placed in ceramic containers 10 cm in diameter and 2 cm thick. The samples were placed in a muffle furnace equipped with a timer control for 30 min. Each treatment consisted of four replicates.

2.5. Analytical Procedures

Analytical procedures were carried out on the control and burnt soil samples. The pH was measured in 1:2.5 soil/distilled water suspensions. Soil organic carbon (SOC) was determined by oxidation with acid—dichromate potassium and titration of dichromate excess with ferrous sulphate [58]. Aggregate size distribution was determined by dry sieving the soil samples through sieves of 2, 1, 0.25, 0.1 and 0.05 mm sieves for 120 s in an electromechanical agitator [59]. The results were expressed as a percentage of aggregates in each fraction (ratio between the aggregate amounts retained in the sieve to the total sample amount) and as mean weight diameter (MWD) using the equation below:
MWD = i = 1 n X i   W i
where MWD: Xi = mean diameter of the size classes (mm) and Wi = proportion of each size class considering to the total sample.
Aggregate stability (AS) was determined using the water drop impact test [59]. Twenty aggregates (>5 mm) per sample were measured. The results were expressed as a percentage of water stable aggregates (surviving 100 water drops impacts) [60].
The water drop penetration test (WDPT) was used to determine soil water repellency (WR) [61]. This test involves dropping distilled water over the soil sample and measuring the time it takes to penetrate it. A repellency class for each sample was established from the median of 10 measurements, namely: Class 1 (non-repellent, WDPT < 5 s), Class 2 (slightly repellent, WDPT = 5–60 s), Class 3 (strongly repellent, WDPT = 60–600 s), Class 4 (severely repellent, WDPT = 600–3600 s), Class 5 (extremely repellent, WDPT > 3600 s) [62]. The test was applied to the fraction smaller than 2 mm obtained by sieving.

2.6. Statistical Analysis

A one-way ANOVA was used to determine whether there were significant differences in soil properties among different burn severity classes in the field and among different soil heating temperatures in the laboratory. A Tukey test was applied for post-hoc comparisons when the ANOVA was significant at the p < 0.05 level. Sample normality was checked before using the Shapiro-Wilk test and homogeneity of variances with the Levene test. A Kruskal–Wallis test was employed when the data were not normal or homoscedastic. A principal component analysis (PCA) was performed for the joint comparison of soil samples from lab heating and from different field severity levels.
Regression models (GLM) were used to evaluate the potential relationship between CBI and visual indicators with soil properties. In the same way, the relationship between post-fire LST (predictor variables) and soil properties, CBI was analysed. The response was assumed to follow a Poisson distribution (CBI and soil water repellence) with a logarithmic function and a Gamma distribution (soil organic carbon) with an inverse function. Aggregate stability, aggregate size and pH followed a Gaussian distribution. All statistical analyses were implemented in IBM SPSS Statistics (24).

3. Results

3.1. Soil Burn Severity Effects on Soil Properties

There was a slight increase, although not significant (F = 0.25; p = 0.86), in soil pH values (from 5.2 to 5.5) (Figure 2a). Soil organic carbon (SOC) decreased with the severity, though not significantly (χ2 = 0.80; p = 0.84). Fire caused an 8% reduction in SOC at low severity, while at moderate and high severity the loss was about 26% (Figure 2b).
Mean MWD values decreased significantly (F = 5.53; p = 0.002) at the highest severity level (0.58 mm) in relation to the control (0.95 mm) (Figure 2c). A reduction of 31% in the most stable aggregates (>2 mm), and a reduction of 26% in those between 1–2 mm was observed at the highest level of severity. However, the opposite trend was shown in the <0.25 mm aggregates (Table 3).
The water aggregate stability decreased significantly (χ2 = 7.31; p = 0.04) with soil burn severity (Figure 2d). There was a significant reduction from 88% of water stable aggregates in the control situation to 33%–32% at low and moderate severity, respectively. At high severity, the proportion of stable aggregates dropped to 20%.
No significant differences (χ2 = 5.69; p = 0.10) were recorded in soil WR in relation to soil burn severity classes. In the control soils, 53% of the collected samples presented slight WR and 20% severe WR. As severity increased, so did the degrees of repellency, with 50% of the samples extremely WR and 30% strongly repellent in soils in the highest severity level. Hydrophilic samples only appeared in control and low severity levels, which disappeared with the increase in severity (Figure 2e).
In general, a negative significant relationship was observed between continuous field burn severity obtained with CBI values and soil organic carbon and MWD, while no significant relationship was found with pH, aggregate stability and water repellency (Table 4). When we analysed the relationship between the CBI individual scores (litter consumption, ash colour and char depth) and soil properties, a negative significant relationship between char depth and soil organic carbon, MWD and aggregate stability was observed. However, a positive relationship was found with water repellency (Table 4). Finally, no relationship was found between these visual indicators (litter consumption, ash colour and char depth) and pH. Although the three indicators are closely related, the char depth provided the best relationship with the changes produced in the soil.

3.2. LST Values as an Indicator of Changes in the Soil

For the highest severity class, the LST values were 327.93 K and 2.71 for CBI (Table 5). There was a significant increase in LST (χ2 = 29.14; p < 0.001) in the burned areas (low, moderate and high severity levels) in relation to the control ones. However, no significant differences were found in LST values among the different severity classes. By contrast, CBI showed significant differences among all severity levels (χ2 = 43.56; p < 0.001).
A significant positive relationship between LST and CBI substrate values was observed (p < 0.001). The general linear model between post-fire LST and CBI values explained 43% of the variation in observed CBI (Figure 3, Table 6). The relationship between changes in the soil properties (pH, MWD, SOC, AE and WR) and LST values showed that only soil organic carbon decreased significantly with the increase in LST values (Figure 4, Table 6). We did not detect any significant interactions between LST values and the other soil properties.

3.3. Effects of Controlled Heating on Soil Properties and Comparison with Soil Burn Severity

The lab soil heating at different temperatures showed a significant increase in soil pH (χ2 = 38.89; p < 0.001) with temperatures above 300 °C, which result in a shift from acid soils (pH around 5) to basic ones (pH approximately 8). Soil heated to temperatures of 500 °C produces a loss of organic carbon of 87.5% in relation to unburned soil. Significant differences (χ2 = 51.82; p < 0.001) were detected between the control and 100 °C samples and those heated above 300 °C. The weighted mean diameter decreases significantly at 300 °C and 500 °C (χ2 = 34.01; p < 0.001) in comparison with the control (Table 7). The maximum degree of repellency is observed in the samples heated to 300 °C, while a significant elimination of hydrophobicity (χ2 = 52.11; p < 0.001) occurs in those heated to 500 °C.
Results obtained in the PCA (Figure 5) joint comparison of laboratory burned soils with those collected at the different levels of severity in the field indicated a clear separation of temperatures along Axis I (with 77% variance absorption) and severity levels on Axis II (16% variance absorption). This analysis identified three main groups: (1) the first related temperatures of 100 °C to the soils collected in the control area and the lowest level of severity associated with a higher organic carbon content and larger aggregate size; (2) the second included the soils heated to 300 °C and the moderate and high levels of severity corresponding to the highest levels of water repellency; (3) the third consisted of the soils heated to 500 °C where the greatest changes in pH (between 7 and 8) occurred.

4. Discussion

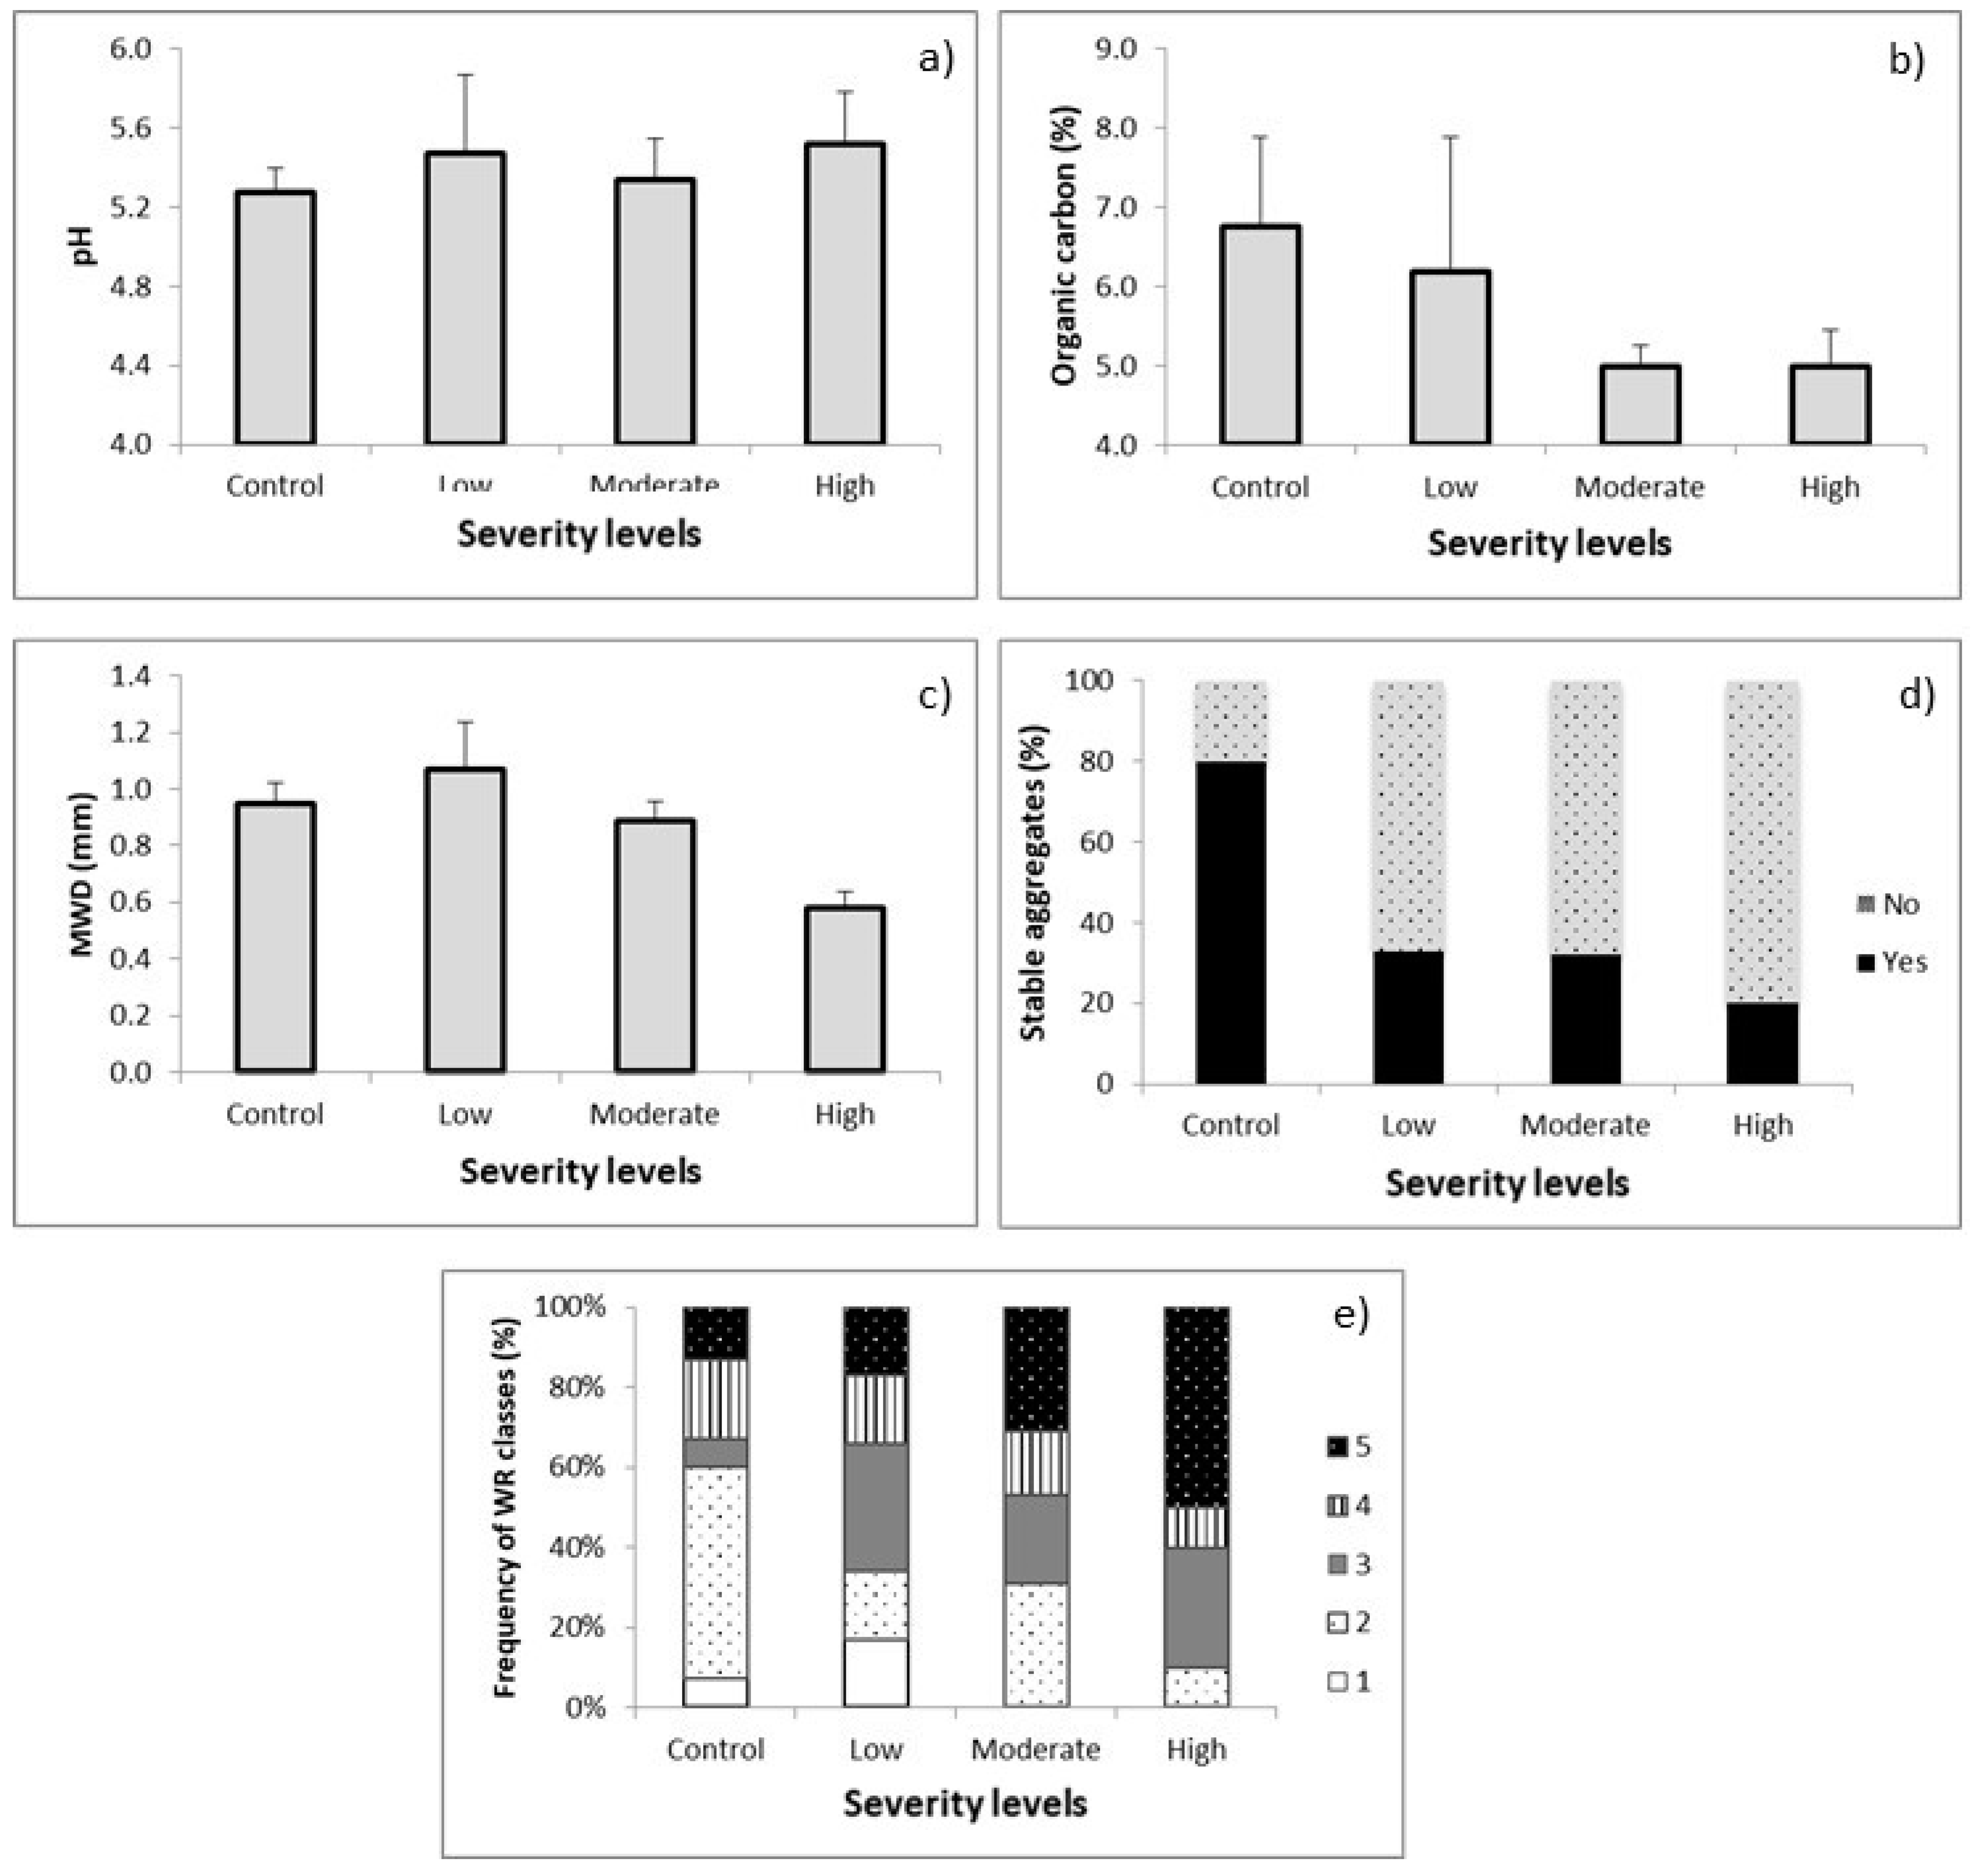
We evaluated the suitability of field and remote sensing burn severity indices to reflect changes in soil characteristics in fire-prone pine ecosystems. In general, pH, soil organic carbon, dry aggregate size distribution, aggregate stability and water repellency displayed a response pattern in relation to the severity, similar to that observed in other studies [30,41,63]. Although different studies have shown a significant increase in pH with increased temperature [39,40] and severity [30], only a small increase in pH with regard to severity was recorded in this study. These field results coincide with those obtained in the lab heating programme, in which a small increase in pH was detected at temperatures of 300 °C. Terefe et al. [40] also state that the increase in pH is produced in the 200–500 °C range due to complete oxidation of the organic material and the release of substantial quantities of cations. Other field studies [51] did not find any significant increases in pH with regard to fire severity in the short term either, and even detected lower pH values in severely burned zones [64] during the first year. Although the sampling in our study was carried out two months’ post-fire, some ash could likely have been dragged outside the system and not added to the soil, in which case the expected increase in pH would not occur and there would be no clear relationship to any of the visual severity indicators.
Soil organic carbon decreases with soil burn severity according to other findings [51]. Depending on fire severity, organic matter undergoes slight distillation, volatilisation of minor constituents, charring, or complete oxidation [6]. According to Giovannini et al. [65], combustion of soil organic matter begins at 200–250 °C and becomes complete around 450 °C or even around 700 °C, as stated by Santín and Doerr [66]. Our results are in agreement with Fernández et al. [67], who recorded a 37% decrease in organic matter when forest soil was heated to 220 °C. Furthermore, this reduction in SOC is consistent with the results obtained in our soil heating program where a decrease of around 40% was detected at 300 °C.
There is a decrease in mean aggregate size and aggregate stability with the increase in burn severity. This pattern could be explained by the observed decrease in organic carbon content, because organic matter is the principal binding agent in these soils [41,68]. Part of the aggregates > 2 mm and 1–2 mm disappear with high severity because the temperature reached is sufficient to increase their fragility. García-Corona et al. [68] and Varela et al. [41] found that aggregates of these sizes in soils in NW Spain (similar to those in this study), when heated to different temperatures, start to disappear from 380 °C up, which is consistent with the MWD decrease at 300 °C observed in this study.
According to Rodríguez-Alleres et al. [69], soils developed under the Pinus pinaster plantations in NW Spain usually present high repellence values due to the presence of large quantities of organic material and the production of hydrophobic substances deposited in the soils, such as resin, wax and aromatic oils [70]. The soils in this study showed naturally lower repellence values than those found in NW Spain [50,69] due to the existence of a more Mediterranean climate limiting production. Soil water repellence is generally more intense near the soil surface [24] where the presence of hydrophobic organic substances is more likely [71] and can be heavily modified by fire, depending on the temperature reached and its duration [72]. The results of this study demonstrate that fire severity is directly related to an increase in water repellence, since under high severity levels, approximately 70% of the samples can be detected as severely or extremely repellent. This indicates that the temperatures reached during the fire have not passed the threshold necessary for eliminating superficial repellence. Our laboratory studies indicate that the highest repellence persistence would be achieved at temperatures of 300 °C, similarly to what was recorded by Arcenegui et al. [72], whose maximum repellence values for two calcareous soils appeared between 300 and 350 °C. The fact that our soils develop higher repellence when heated could be related to their higher organic matter content and the associated increased supply of hydrophobic substances to the soil as a result [69], in addition to their coarser texture.
Analysis of all the results of this study leads to the conclusion that the mean temperature reached in the soils samples classified as moderate-high severity would be approximately 300 °C, which would correspond to the typical temperature range reached on the surface in forest fires [71]. We did not observe significant differences in soil properties between the soil samples collected at the moderate and high severity levels. This could be explained by a series of factors which may have affected this result: (a) the homogeneity of the fire which was mainly classed as of high severity by the Forestry Services; (b) the wide surface sampled, which implies variability in the soil characteristics throughout the fire [42], (c) the time passing between the fire and sample collection (2 months), which could have affected those properties [30]. These results agree with the two levels of severity (low-medium and high) found by Quintano et al. [4], using LST post-fire data as an indicator of burn severity.
The use of soil burn severity indicators is of great importance to forestry managers as it allows the degree of severity of a large wildfire to be estimated relatively quickly. These indicators must reflect the changes produced in the soil properly. Our study shows that the field index of burn severity and individual visual indicators present a good performance. We have found that char depth is the visual indicator more directly correlated with soil organic carbon and all physical properties analysed, reflecting the changes caused by fire. This individual visual indicator performs better than soil CBI (integration of three indicators). However, soil CBI can be considered a good predictor of the impact of fire since it presents a good fit with soil organic matter and soil aggregation. The visual indicators chosen in this study have been widely used with very good results in terms of severity classification in the field [19,21,26,30]. In addition, our study shows the capacity of visual indicators and CBI values to reflect changes in physical properties related with soil degradation (erosion, hydrological behavior, etc.). This information can help managers to enable prioritisation of the areas where restoration measures need to be established to avoid the occurrence of erosive processes.
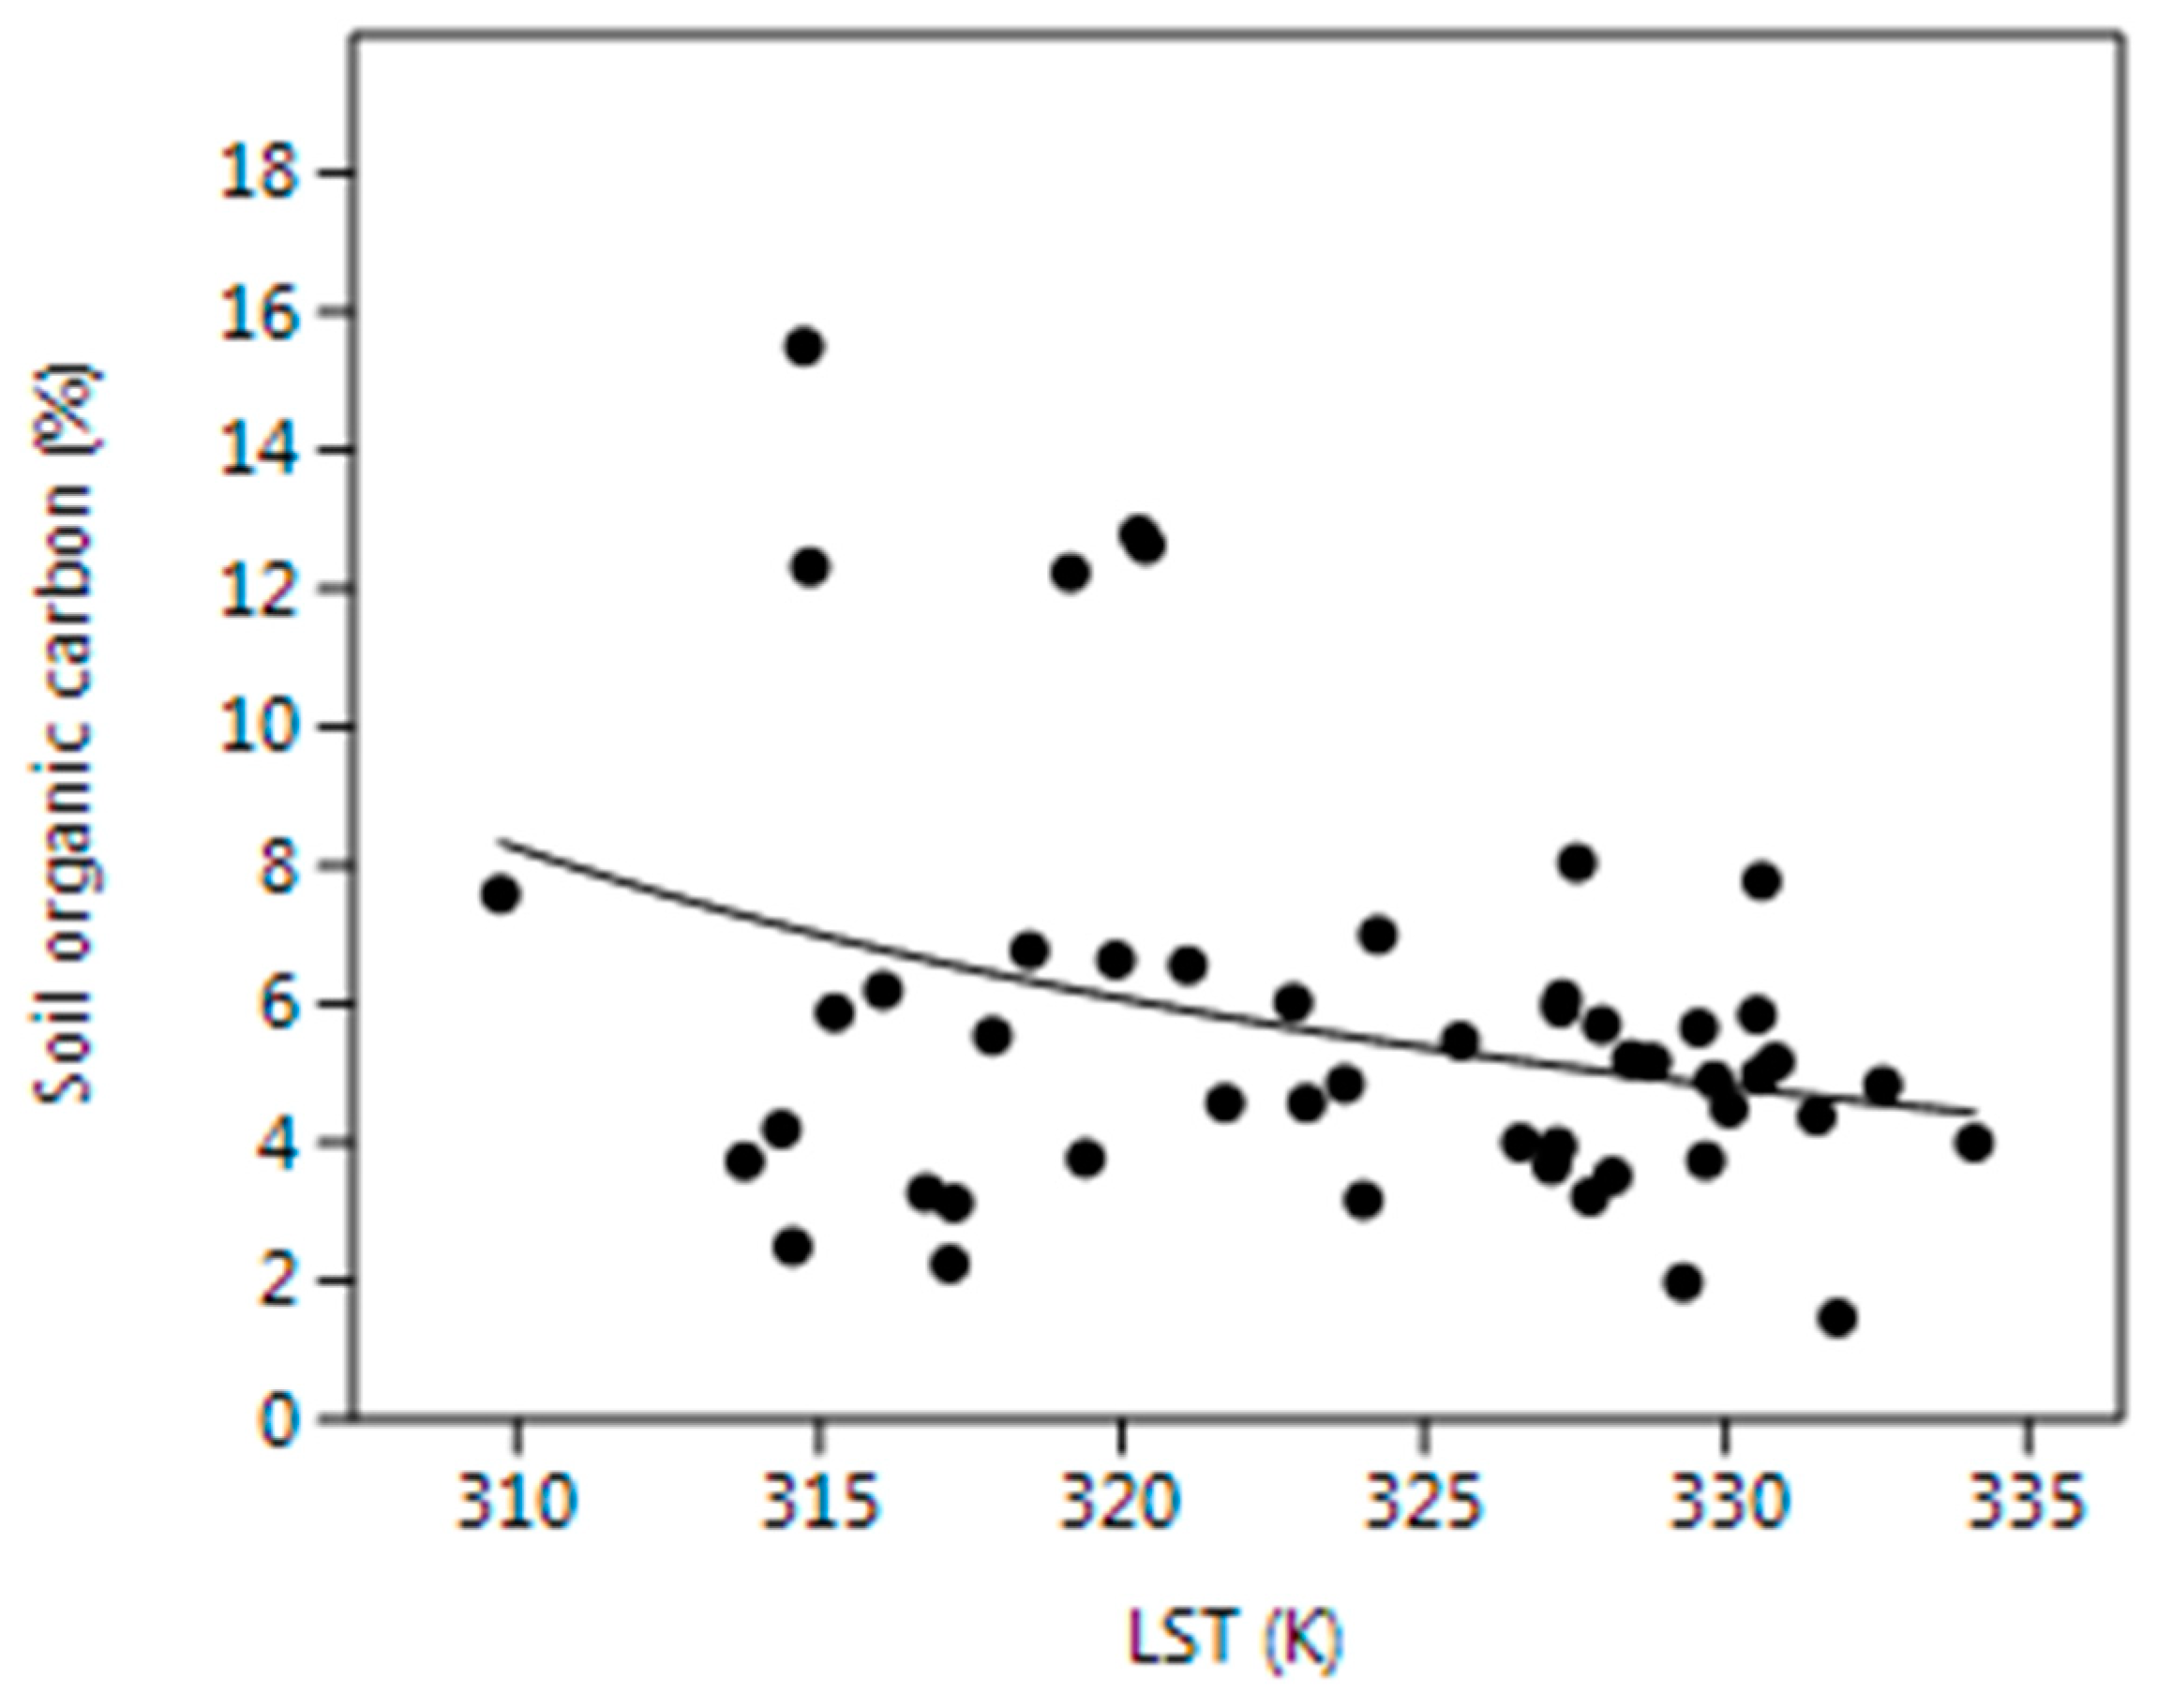
Similarly, post-fire LST from Landsat has been considered as a valuable indicator of burn severity mainly for severe forest fires [4,73]. However, remote sensing index (e.g., dNBR, LST, NVDI, etc.) show a lower ability to estimate soil burn severity than vegetation severity [10]. These findings are in accordance with our results where only a significant relationship between LST values and changes in soil carbon content was found. This could be related to (1) the decrease in SOC, when fire severity increases, [5,30,50,74], and (2) the changes in organic material associated with the transformation of biogenic structures or the input and removing of materials with differential resistance to thermal degradation [75,76]. In soils affected by high severity, these authors have found lignin markers followed by proteins, alkylaromatic and polycyclic aromatic hydrocarbons more resistant to thermal degradation. Therefore, these modifications in organic material because of fire may be related to high LST values observed in our study. According to Vlassova et al. [38] these high LST values are due (1) to the presence of combustion products with lower emissivity (ash, char and mineral soils), and (2) the level of intensity at which the organic material is affected. LST has the potential to be used as an indicator of soil burn severity since it reflects changes in soil properties, mainly in organic carbon content, which is, to a great extent, responsible for the physical changes. It should be tested in other fires and ecosystems to generalise this potentiality and its practical application in the identification of zones severely affected by fire, where immediate restoration measures are required.

5. Conclusions

The results of this study show that CBI is a good index to reflect the physical changes in soil characteristics that are closely related to the hydrological behavior of soils after fire. This index should always include the char depth as it is the visual indicator most closely related to the impact suffered by soils, even if it is not measured immediately after fire. Post-fire LST could be considered as a potential indicator of burn severity, due to its relationship with changes in soil organic carbon. Future studies should focus on developing field measurements of severity which fit properly with changes in soil properties. In the same way, satellite images with different spatial resolution to improve the match with field assessing should be explored. By comparing the changes in the properties of soil subjected to wildfire with those that have been laboratory heated, it can be deduced that the temperature reached in the soil during the wildfire was approximately 300 °C at the high severity level.

Author Contributions

E.M., L.C., C.Q. and A.F.-M. conceived and designed the experiment; E.M., L.C., C.Q., A.F.-M., L.V., E.L.-C. and R.T. obtained the data, E.M., V.F.-G., and R.T. analysed the data; E.M. and L.C. wrote the paper with contributions of C.Q. and A.F.-M.; E.M., L.C., and A.F.-M. coordinated the study.

Funding

This study was financially supported by the Spanish Ministry of Economy and Competitiveness, and the European Regional Development Fund (ERDF), in the framework of the GESFIRE project (AGL2013-48189-C2-1-R); and by the Regional Government of Castile and León within the framework of the SEFIRECYL project (LE001P17).

Acknowledgments

We would like to thank Omar Flores and Alicia Fuertes for helping us with the soil analysis. We thank the anonymous reviewers for their valuable comments to improve this paper.

Conflicts of Interest

The authors declare no conflicts of interest.

References

  1. Taboada, A.; Tárrega, R.; Marcos, E.; Valbuena, L.; Suárez-Seoane, S.; Calvo, L. Fire recurrence and emergency post-fire management influence seedling recruitment and growth by altering plant interactions in fire-prone ecosystems. For. Ecol. Manag. 2017, 402, 63–75. [Google Scholar] [CrossRef]
  2. Cubo, J.E.; Enríquez, E.; Gallar, J.J.; Jemes, V.; López, M.; Mateo, M.; Muñoz, A.; Parra, P.J. Los Incendios Forestales en España, Decenio 2001–2010; Ministerio de Agricultura, Alimentación y Medio Ambiente, Secretaría General Técnica: Madrid, Spain, 2012.
  3. Moreno, M.V.; Conedera, M.; Chuvieco, E.; Boris, G. Fire regime changes and major driving forces in Spain from 1968 to 2010. Environ. Sci. Policy 2014, 37, 11–22. [Google Scholar] [CrossRef]
  4. Quintano, C.; Fernández-Manso, A.; Calvo, L.; Marcos, E.; Valbuena, L. Land surface temperature as potential indicator of burn severity in forest Mediterranean ecosystems. Int. J. Appl. Earth Obs. 2015, 36, 1–12. [Google Scholar] [CrossRef]
  5. Gimeno-García, E.; Andreu, V.; Rubio, J.L. Spatial patterns of soil temperatures during experimental fires. Geoderma 2004, 118, 17–38. [Google Scholar] [CrossRef] [Green Version]
  6. Certini, G. Effects of fire on properties of forest soils: A review. Oecologia 2005, 143, 1–10. [Google Scholar] [CrossRef] [PubMed]
  7. Mataix-Solera, J.; Guerrero, C. Efectos de los incendios forestales en las propiedades edáficas. In Incendios Forestales, Suelos y Erosión Hídrica; Mataix-Solera, J., Ed.; Caja Mediterráneo CEMACAM Font Roja-Alcoy: Alicante, Spain, 2007; pp. 5–40. ISBN 978-84-7599-194-8. [Google Scholar]
  8. Marcos, E.; Villalón, C.; Calvo, L.; Luis-Calabuig, E. Short-term effects of experimental burning on the soil nutrient in the Cantabrian heathlands. Ecol. Eng. 2009, 35, 820–828. [Google Scholar] [CrossRef]
  9. López-Poma, R.; Bautista, S. Plant regeneration functional groups modulate the response to fire of soil enzyme activities in a Mediterranean shrubland. Soil Biol. Biochem. 2014, 79, 5–13. [Google Scholar] [CrossRef]
  10. Fernández-García, V.; Santamarta, M.; Fernández-Manso, A.; Quintano, C.; Marcos, E.; Calvo, L. Burn severity metrics in fire-prone pine ecosystems along a climatic gradient using Landsat imagery. Remote Sens. Environ. 2018, 206, 205–217. [Google Scholar] [CrossRef]
  11. DeBano, L.F.; Neary, D.G.; Folliott, P.F. Fire: Its Effect on Soil and Other Ecosystem Resources; John Wiley & Sons, Inc.: New York, NY, USA, 1998; pp. 71–159. ISBN 978-0-471-16356-5. [Google Scholar]
  12. Keeley, J.E. Fire intensity, fire severity and burn severity: A brief review and suggested usage. Int. J. Wildland Fire 2009, 18, 116–126. [Google Scholar] [CrossRef]
  13. NWCG. Glossary of Wildland Fire Terminology; National Wildfire Coordinating Group, Incident Operations Standards Working Team: Quincy, MA, USA, 2006. Available online: http://www.nwcg.gov/pms/pubs/glossary/index.htm (accessed on 1 March 2018).
  14. Key, C.H.; Benson, N.C. Landscape assessment: Ground measure of severity, the composite burn index; and remote sensing of severity, the normalized burn ratio. In General Technical Report RMRS-GTR-164-CD, Proceedings of the FIREMON: Fire Effects Monitoring and Inventory System; Lutes, D.C., Keane, R.E., Caratti, J.F., Key, C.H., Benson, N.C., Sutherland, S., Gangi, L.J., Eds.; USDA Forest Service, Rocky Mountain Research Station: Fort Collins, CO, USA, 2006; pp. 1–51. [Google Scholar]
  15. Chu, T.; Guo, X.; Takeda, K. Effects of burn severity and environmental conditions on post-fire regeneration in Siberian Larch Forest. Forests 2017, 8, 76. [Google Scholar] [CrossRef]
  16. Fernández-García, V.; Quintano, C.; Taboada, A.; Marcos, E.; Calvo, L.; Fernández-Manso, A. Remote sensing applied to the study of fire regime attributes and their influence on post-fire greenness recovery in pine ecosystems. Remote Sens. 2018, 10, 733. [Google Scholar] [CrossRef]
  17. González-De Vega, S.; de las Heras, J.; Moya, D. Post-Fire Regeneration and Diversity Response to Burn Severity in Pinus halepensis Mill. Forests 2018, 9, 299. [Google Scholar] [CrossRef]
  18. Vieira, D.C.S.; Fernández, C.; Vega, J.A.; Keizer, J.J. Does soil burn severity affect the post-fire runoff and interrill erosion response? A review based on meta-analysis of field rainfall simulation data. J. Hydrol. 2015, 523, 452–464. [Google Scholar] [CrossRef]
  19. Jain, T.B.; Pilliod, D.S.; Graham, R.T.; Lentile, L.B.; Sandquist, J.E. Index for characterizing post-fire soil environments in temperate coniferous forests. Forests 2012, 3, 445–466. [Google Scholar] [CrossRef]
  20. Pereira, P.; Cerdá, A.; Martin, D.; Úbeda, X.; Depellegrin, D.; Novara, A.; Martínez-Murillo, J.F.; Brevik, E.C.; Menshov, O.; Comino, J.R.; Miesel, J. Short-term low-severity spring grassland fire impacts on soil extractable elements and soil ratios in Lithuania. Sci. Total Environ. 2017, 578, 469–475. [Google Scholar] [CrossRef] [PubMed] [Green Version]
  21. Parsons, A.; Robichaud, P.; Lewis, S.; Napper, C.; Clark, J. Field Guide for Mapping Post-Fire Soil Burn Severity; General Technical Report RMRS-GTR-243; USDA Forest Service, Rocky Mountain Research Station: Fort Collins, CO, USA, 2010; pp. 1–11.
  22. Cerdá, A.; Doerr, S.H. The effect of ash and needle cover on surface runoff and erosion in the immediate post-fire period. Catena 2008, 74, 256–263. [Google Scholar] [CrossRef]
  23. Moody, J.A.; Shakesby, R.A.; Robichaud, P.R.; Cannon, S.H.; Martín, D.A. Current research issues related to post-wildfire runoff and erosion processes. Earth-Sci. Rev. 2013, 122, 10–37. [Google Scholar] [CrossRef]
  24. Mataix-Solera, J.; Cerdà, A.; Arcenegui, V.; Jordán, A.; Zavala, L.M. Fire effects on soil aggregation: A review. Earth-Sci. Rev. 2011, 109, 44–60. [Google Scholar] [CrossRef]
  25. Morgan, P.; Keane, R.E.; Dillon, G.K.; Jain, T.B.; Hudak, A.T.; Karau, E.C.; Sikkink, P.G.; Holdem, Z.A.; Strand, E.K. Challenges of assessing fire and burn severity using field measures, remote sensing and modelling. Int. J. Wildland Fire 2014, 23, 1045–1060. [Google Scholar] [CrossRef]
  26. Ryan, K.C.; Noste, N.V. Evaluating prescribed fires. In General Technical Report INT-182, Proceedings of the Symposium and Workshop on Wildderness Fire, Missoula, MT, USA, 15 November 1985; USDA Forest Service: Washington, DC, USA, 1985; pp. 230–238. [Google Scholar]
  27. Henig-Sever, N.; Poliakov, D.; Broza, M. A novel method for estimation of wild fire intensity based on ash pH and soil microarthropod community. Pedobiologia 2001, 45, 98–106. [Google Scholar] [CrossRef]
  28. Ulery, A.L.; Graham, R.C. Forest fire effects on soil colour and texture. Soil Sci. Soc. Am. J. 1993, 57, 135–140. [Google Scholar] [CrossRef]
  29. Cancelo-González, J.; Cachaldora, C.; Díaz-Fierros, F.; Prieto, B. Colourimetric variations in burnt granitic forest soils in relation to fire severity. Ecol. Indic. 2014, 46, 92–100. [Google Scholar] [CrossRef]
  30. Vega, J.A.; Fontúrbel, T.; Merino, A.; Fernández, C.; Ferreiro, A.; Jiménez, E. Testing the ability of visual indicators of soil burn severity to reflect changes in soil chemical and microbial properties in pine forests and shrubland. Plant. Soil 2013, 369, 73–91. [Google Scholar] [CrossRef]
  31. De Santis, A.; Chuvieco, E. GeoCBI: A modified version of the Composite Burn Index for the initial assessment of the short-term burn severity from remotely sensed data. Remote Sens. Environ. 2009, 113, 554–562. [Google Scholar] [CrossRef]
  32. Fang, L.; Yang, J.; White, M.; Liu, Z. Predicting potential fire severity using vegetation, topography and surface moisture availability in a Eurasian Boreal Forest Landscape. Forests 2018, 9, 130. [Google Scholar] [CrossRef]
  33. Kasischke, E.S.; Turetsky, M.R.; Ottmar, R.D.; French, N.H.F.; Hoy, E.E.; Kane, E.S. Evaluation of the composite burn index for assessing fire severity in Alaskan black spruce forests. Int. J. Wildland Fire 2008, 17, 515–526. [Google Scholar] [CrossRef]
  34. Eidenshink, J.; Schwind, B.; Brewer, K.; Zhu, Z.; Quayle, B.; Howard, S. A project for monitoring trends in burn severity. Fire Ecol. 2007, 3, 3–21. [Google Scholar] [CrossRef]
  35. Chuvieco, E.; Martín, M.P.; Palacios, A. Assessment of different spectral indices in the red-near-infrared spectral domain for burned land discrimination. Int. J. Remote Sens. 2002, 23, 5103–5110. [Google Scholar] [CrossRef]
  36. Smith, A.M.S.; Drake, N.A.; Wooster, M.J.; Hudak, A.T.; Holden, Z.A.; Gibbons, C.J. Production of Landsat ETM+ reference imagery of burned areas within Southern African savannahs: Comparisons of methods an application to MODIS. Int. J. Remote Sens. 2007, 28, 2753–2775. [Google Scholar] [CrossRef]
  37. Trigg, S.; Flasse, S. An evaluation of different bi-spectral spaces for discriminating burned shrub-savannah. Int. J. Remote Sens. 2001, 22, 2641–2647. [Google Scholar] [CrossRef]
  38. Vlassova, L.; Pérez-Cabello, F.; Rodrigues Mimbrero, M.; Montorio Llovería, R.; García-Martín, A. Analysis of the Relationship between Land Surface Temperature and Wildfire Severity in a Series of Landsat Images. Remote Sens. 2014, 6, 6136–6162. [Google Scholar] [CrossRef] [Green Version]
  39. Marcos, E.; Tárrega, R.; Luis, E. Changes in a Humic Cambisol heated (100–500 °C) under laboratory conditions: The significance of heating time. Geoderma 2007, 138, 237–243. [Google Scholar] [CrossRef] [Green Version]
  40. Terefe, T.; Mariscal-Sancho, I.; Peregrina, F.; Espejo, R. Influence of heating on various properties of six Mediterranean soils. A laboratory study. Geoderma 2008, 143, 273–280. [Google Scholar] [CrossRef]
  41. Varela, M.E.; Benito, E.; Keizer, J.J. Influence of wildfire severity on soil physical degradation in two pine forest stands of NW Spain. Catena 2015, 133, 342–348. [Google Scholar] [CrossRef]
  42. Notario del Pino, J.; Dorta Almenara, I.; Rodríguez Rodríguez, A.; Arbelo Rodríguez, C.; Navarro Rivero, F.J.; Mora Hernández, J.L.; Armas Herrera, C.M.; Guerra García, J.M. Analysis of the 1:5 soil: Water extract in burnt soils to evaluate fire severity. Catena 2008, 74, 246–255. [Google Scholar] [CrossRef]
  43. Pereira, P.; Úbeda, X.; Martín, D.A. Fire severity effects on ash chemical composition and water-extractable elements. Geoderma 2012, 191, 105–114. [Google Scholar] [CrossRef]
  44. Pourreza, M.; Hosseini, S.M.; Sinegani, A.A.S.; Matinizadeh, M.; Dick, W.A. Soil microbial activity in response to fire severity in Zagros oak (Quercus brantii Lindl.) forests, Iran, after one year. Geoderma 2014, 213, 95–102. [Google Scholar] [CrossRef]
  45. Fernández, C.; Vega, J.A. Modelling the effect of soil burn severity on soil erosion at hillslope scale in the first year following wildfire in NW Spain. Earth Surf. Process. Landf. 2016, 41, 928–935. [Google Scholar] [CrossRef]
  46. Ketterings, Q.M.; Bigham, J.M. Soil color as an indicator of slash-and-burn fire severity and soil fertility in Sumatra, Indonesia. Soil Sci. Soc. Am. J. 2000, 64, 1826–1833. [Google Scholar] [CrossRef]
  47. Girona-García, A.; Ortiz-Perpiñá, O.; Badía-Villas, D.; Martí-Dalmau, C. Effects of prescribed burning on soil organic C, aggregate stability and water repellency in a subalpine shrubland: Variations among sieve fractions and depths. Catena 2018, 166, 68–77. [Google Scholar] [CrossRef]
  48. Zavala, L.M.; González, F.A.; Jordán, A. Fire-induced soil water repellency under different vegetation types along the Atlantic dune coast-line in SW Spain. Catena 2009, 79, 153–162. [Google Scholar] [CrossRef]
  49. Plaza-Álvarez, P.A.; Lucas-Borja, M.E.; Sagra, J.; Moya, D.; Alfaro-Sánchez, R.; González-Romero, J.; de las Heras, J. Changes in soil water repellency after prescribed burnings in three different Mediterranean forest ecosystems. Sci. Total Environ. 2018, 644, 247–255. [Google Scholar] [CrossRef] [PubMed]
  50. Rodríguez-Alleres, M.; Varela, M.E.; Benito, E. Natural severity of water repellency in pine forest soils from NW Spain and influence of wildfire severity on its persistence. Geoderma 2012, 191, 125–131. [Google Scholar] [CrossRef]
  51. Dzwonko, Z.; Loster, S.; Gawronski, S. Impact of fire severity on soil properties and the development of tree and shrub species in a Scots pine moist forest site in southern Poland. Forest Ecol. Manag. 2015, 342, 56–63. [Google Scholar] [CrossRef]
  52. Thomaz, E.L. Fire changes the larger aggregate size classes in slash-and-burn agricultural systems. Soil Tillage Res. 2017, 165, 210–217. [Google Scholar] [CrossRef]
  53. Tapias, R.; Gil, L.; Pardos, J.A. Los pinares (Pinus pinaster Ait.) de las estribaciones de la Sierra del Teleno (León). La influencia del incendio en su ordenación. Montes 1998, 52, 115–120. [Google Scholar]
  54. IGME (Instituto Geológico y Minero de España). Mapa Geológico de España, Scale 1:50000. Sheets 230 and 231; Ministerio de Industria y Energía: Madrid, Spain, 1982.
  55. Forteza, J.; Lorenzo, L.; Najac, N.; Cuadrado, S.; Ingelmo, F.; Hernández, J.; García, P.; Prat, L.; Mulez, C.; Macarro, C.; Rivas, D. Mapa de Suelos de Castilla y León, Scale 1:500000; Dirección General de Medio Ambiente y Urbanismo, Junta de Castilla y León: Valladolid, Spain, 1987. [Google Scholar]
  56. Santalla, S.; Salgado, J.M.; Calvo, L.; Fernández, M. Changes in the Carabidae community after a large fire in a Pinus pinaster stand. In Fire and Biological Processes; Trabaud, L., Prodon, R., Eds.; Backhuys Publishers: Leiden, The Netherlands, 2002; pp. 215–231. ISBN 90-5782-116-8. [Google Scholar]
  57. Taboada, A.; Fernández-García, V.; Marcos, E.; Calvo, L. Interactions between large high-severity fires and salvage logging on a short return interval reduce the regrowth of fire-prone serotinous forests. For. Ecol. Manag. 2018, 414, 54–63. [Google Scholar] [CrossRef]
  58. MAPA (Ministerio de Agricultura, Pesca y Alimentación). Métodos Oficiales de Análisis. Tomo III; Ministerios de Agricultura, Pesca y Alimentación: Madrid, Spain, 1993; pp. 221–283.
  59. Kemper, W.D.; Rosenau, R.C. Aggregate stability and size distribution. In Methods of Soil Analysis, Part 1; American Society of Agronomy: Madison, WI, USA, 1986; pp. 425–442. [Google Scholar]
  60. Low, A.J. Study of soil structure in field and laboratory. J. Soil Sci. 1954, 5, 19–54. [Google Scholar] [CrossRef]
  61. Imeson, A.C.; Vis, M. Assessing soil aggregate stability by water-drop impact and ultrasonic dispersion. Geoderma 1984, 34, 185–200. [Google Scholar] [CrossRef]
  62. Doerr, S.H. On standardizing the ‘water drop penetration time’ and the ‘molarity of an ethanol droplet’ techniques to classify soil hydrophobicity: A case study using medium textured soils. Earth Surf. Process. Landf. 1998, 23, 663–668. [Google Scholar] [CrossRef]
  63. Merino, A.; Fonturbel, M.T.; Fernández, C.; Chávez-Vergara, B.; García-Oliva, F.; Vega, J.A. Inferring changes in soil organic matter in post-wildfire soil burn severity levels in a temperate climate. Sci. Total Environ. 2018, 627, 622–632. [Google Scholar] [CrossRef] [PubMed]
  64. Hamman, S.T.; Burke, I.C.; Stromberger, M.E. Relationships between microbial community structure and soil environmental conditions in a recently burned system. Soil Biol. Biochem. 2007, 39, 1703–1711. [Google Scholar] [CrossRef]
  65. Giovannini, G.; Lucchesi, S.; Giachetti, M. Effect of heating on some physical and chemical parameters related to soil aggregation and erodibility. Soil Sci. 1988, 146, 255–261. [Google Scholar] [CrossRef]
  66. Santín, C.; Doerr, S.H. Fire effects on soils: The human dimension. Philos. Trans. R. Soc. B 2016, 371. [Google Scholar] [CrossRef] [PubMed]
  67. Fernández, I.; Cabaneiro, A.; Carballas, T. Organic matter changes immediately after a wildfire in an Atlantic forest soil and comparison with laboratory soil heating. Soil Biol. Biochem. 1997, 29, 1–11. [Google Scholar] [CrossRef]
  68. García-Corona, R.; Benito, E.; de Blas, E.; Varela, M.E. Effects of heating on some soil physical properties related to its hydrological behaviour in two north-western Spanish soils. Int. J. Wildland Fire 2004, 13, 195–199. [Google Scholar] [CrossRef]
  69. Rodríguez-Alleres, M.; Benito, E.; de Blas, E. Extent and persistence of water repellency in north-western Spanish soils. Hydrol. Process. 2007, 21, 2291–2299. [Google Scholar] [CrossRef]
  70. Doerr, S.H.; Shakesby, R.A.; Walsh, R.P.D. Soil water repellency: Its causes, characteristics and hydro-geomorphological consequences. Earth-Sci. Rev. 2000, 51, 33–65. [Google Scholar] [CrossRef]
  71. Badía-Villas, D.; González-Pérez, J.A.; Aznar, J.M.; Arjona-Gracia, B.; Martí-Dalmau, C. Changes in water repellency, aggregation and organic matter of a mollic horizon burned in laboratory: Soil depth affected by fire. Geoderma 2014, 213, 400–407. [Google Scholar] [CrossRef] [Green Version]
  72. Arcenegui, V.; Mataix-Solera, J.; Guerrero, C.; Zornoza, R.; Mayoral, A.M.; Morales, J. Factors controlling the water repellency induced by fire in calcareous Mediterranean forest soils. Eur. J. Soil Sci. 2007, 58, 1254–1259. [Google Scholar] [CrossRef]
  73. Zheng, Z.; Zeng, Y.; Li, S.; Huang, W. A new burn severity index based on land surface temperature and enhanced vegetation index. Int. J. Appl. Earth Obs. 2016, 45, 84–94. [Google Scholar] [CrossRef]
  74. Neary, D.G.; Ryan, K.C.; DeBano, L.F. (Eds.) Revised 2008; Wildland fire in ecosystems: Effects of fire on soils and water. In Proceedings of the General Technical Report, RMRS-GTR-42-vol.4, Ogden, UT, USA, September 2005; United States Department of Agriculture, Forest Service, Rocky Mountain Research Station: Fort Collins, CO, USA, 2005; pp. 53–71. [Google Scholar]
  75. González-Pérez, J.A.; González-Vila, F.J.; Almendros, G.; Knicker, H. The effect of fire on soil organic matter—A review. Environ. Int. 2004, 30, 855–870. [Google Scholar] [CrossRef] [PubMed]
  76. Jiménez-Morillo, N.T.; de la Rosa, J.M.; Waggoner, D.; Almendros, G.; González-Vila, F.J.; González-Pérez, J.A. Fire effects in the molecular structure of soil organic matter fractions under Quercus suber cover. Catena 2016, 145, 266–273. [Google Scholar] [CrossRef]
Figure 1. Location of the study area in Sierra de Teleno (León, NW Spain).
Forests 09 00494 g001
Figure 2. Mean values and standard error for (a) pH, (b) soil organic carbon, (c) mean weight diameter, (d) aggregate stability, and (e) frequency of water repellency classes (Class 1: Hydrophilic; Class 2: Slight; Class 3: Strong; Class 4: Severe and Class 5: Extreme repellency) of soil samples between 0 and 5 cm deep in different severity levels.
Forests 09 00494 g002
Figure 3. Relationship between LST values (K) and soil burn severity measured in CBI (Composite Burn Index) units.
Forests 09 00494 g003
Figure 4. Relationship between LST values (K) and soil organic carbon content (%).
Forests 09 00494 g004
Figure 5. Samples and variables in the plane defined by the first two axes of the PCA (Level 0: Unburned; Level 1: Low severity; Level 2: Medium severity; Level 3: High severity).
Forests 09 00494 g005
Table 1. Soil characteristics of the unburned situation from 2012 wildfire.
Soil PropertyUnburned Area
Sand (%)70
Silt (%)24
Clay (%)6
Texture 1Sandy loam
pH5.23
Soil organic carbon (%)2.1
Total nitrogen (%)0.1
C/N ratio19.8
Available phosphorous (g kg−1)<5.4
Electrical conductivity (dS m−1)0.02
1 Following USDA textural classification based on grain size distribution and adopted in 1938.
Table 2. Modified Composite Burn Index used in this study to obtain the field values of soil burn severity (based on Key and Benson [14].
Strata Rating FactorsBurn Severity Scale
UnburnedLowModerateHigh
00.511.522.53
Litter/light fuel consumedNone<10%10%–20%20%–40%40%–80%80%–98%>98%
Ash colourNoneBlackened litter, no changes in soilCharred remains, recognizable litterGrey and white ash, grey soilWhite ash, reddened soil
Char depthNone<1 cm1–3 cm>3 cm
Table 3. Average soil aggregate size distribution (%) in relation to soil burn severity levels (control, low, moderate, high).
Severity LevelSoil Aggregate Size (mm)
>2.01.0–2.00.25–1.00.1–0.250.05–0.1<0.05
Control74.913.64.21.50.50.1
Low78.011.03.81.80.60.1
Moderate75.712.44.21.60.60.1
High51.710.03.82.41.00.2
Table 4. Generalised linear model (GLM) results for the relationship between soil properties and soil burn severity (CBI) and individual visual indicators (litter consumption, ash colour and char depth). Degrees of freedom (Df). Grubbs signification (G). Significant p-values are in bold face.
Response VariablePredictor VariableDfSlopeG-Valuep-Value
pHCBI10.0640.4150.519
Litter C 210.0250.0840.771
Ash colour10.0570.3980.527
Char depth10.0580.3810.536
Soil organic carbonCBI1−0.6394.0370.044
Litter C 21−0.5753.4540.063
Ash colour1−0.4081.6790.195
Char depth1−0.7044.4910.034
MWD 1CBI1−0.1088.1540.004
Litter C 21−0.0633.2780.070
Ash colour1−0.0663.3850.065
Char depth1−0.11611.2210.000
Aggregate stabilityCBI1−9.3243.7520.052
Litter C 21−9.0574.5490.032
Ash colour1−6.3462.0260.154
Char depth1−9.2944.2890.038
Water repellencyCBI10.4122.9940.083
Litter C 210.3202.2430.134
Ash colour10.3472.5000.113
Char depth10.4614.4080.035
1 MWD: Mean weight diameter. 2 Litter C: Litter consumption.
Table 5. Mean values and (± standard deviation) for CBI field and LST image values. The Kruskal–Wallis post hoc results are shown. Within a column means followed by the same letter are not significantly different.
Soil Burn Severity LevelsCBI Field ValuesLST (K)
Control0 (0.0) a316.24 (2.74) a
Low1.13 (0.26) b326.89 (4.20) b
Moderate1.96 (0.35) c326.66 (4.56) b
High2.71 (0.19) d327.93 (3.13) b
Table 6. Generalised linear model (GLM) results for changes in soil characteristics (response variable) in relation to LST values (predictor variable). Degrees of freedom (Df). Significant p-values are in bold face. Grubbs signification (G).
Soil PropertyDfSlopeG-Valuep-Value
CBI10.10924.8150.001
pH10.0080.2570.612
Soil organic carbon1−0.0045.8270.015
Aggregate size distribution1−0.0050.5650.451
Aggregate stability1−1.3502.6100.106
Soil water repellence10.0110.8000.370
Table 7. Mean values (±standard deviation) for pH, SOC, MWD and WDPT test in relation to heating temperature. The Kruskal–Wallis post hoc results are shown. Different letters in each column indicate significant differences among different heating temperatures for this variable.
TemperaturepHSOC (%)MWD (mm)WDPT (s)
Control4.67 a (0.24)5.03 a (0.57)0.22 a (0.01)286.6 a (103.5)
100 °C4.77 a (0.23)5.12 a (0.50)0.22 a (0.01)446.5 a (160.8)
300 °C5.19 ab (0.26)2.99 b (0.16)0.19 b (0.01)2096.1 b (135.1)
500 °C7.70 c (0.46)0.64 c (0.03)0.16 c (0.01)1.0 c (0.0)

