Article

Persistence versus Reversion of 3TC Resistance in HIV-1 Determine the Rate of Emergence of NVP Resistance

1
Center for AIDS Research, Division of Infectious Diseases and Geographic Medicine, Stanford University School of Medicine, Stanford, CA 94305, USA
2
Department of Pediatrics, Division of Pneumonology-Immunology, Charité University Medical Center, Berlin 13353, Germany
3
Division of Biostatistics, Stanford University School of Medicine, Stanford, CA 94305, USA
*
Author to whom correspondence should be addressed.
Viruses 2012, 4(8), 1212-1234; https://doi.org/10.3390/v4081212
Submission received: 11 July 2012 / Revised: 3 August 2012 / Accepted: 6 August 2012 / Published: 7 August 2012
(This article belongs to the Special Issue HIV Dynamics and Evolution)

Abstract

:
When HIV-1 is exposed to lamivudine (3TC) at inhibitory concentrations, resistant variants carrying the reverse transcriptase (RT) substitution M184V emerge rapidly. This substitution confers high-level 3TC resistance and increased RT fidelity. We established a novel in vitro system to study the effect of starting nevirapine (NVP) in 3TC-resistant/NNRTI-naïve clinical isolates, and the impact of maintaining versus dropping 3TC pressure in this setting. Because M184V mutant HIV-1 seems hypersusceptible to adefovir (ADV), we also tested the effect of ADV pressure on the same isolates. We draw four conclusions from our experiments simulating combination therapy in vitro. (1) The presence of low-dose (1 μM) 3TC prevented reversal to wild-type from an M184V mutant background. (2) Adding low-dose 3TC in the presence of NVP delayed the selection of NVP-associated mutations. (3) The presence of ADV, in addition to NVP, led to more rapid reversal to wild-type at position 184 than NVP alone. (4) ADV plus NVP selected for greater numbers of mutations than NVP alone. Inference about the “selection of mutation” is based on two statistical models, one at the viral level, more telling, and the other at the level of predominance of mutation within a population. Multidrug pressure experiments lend understanding to mechanisms of HIV resistance as they bear upon new treatment strategies.

Graphical Abstract

1. Introduction

1.1. In vitro ‘Combination Therapy’

Several antiretroviral agents have been licensed to treat infections with the human immunodeficiency virus Type 1 (HIV-1). Antiviral drugs that inhibit RT activity in wild-type HIV-1 select rapidly for drug-resistant variants. Current guidelines therefore recommend the use of several antiretroviral agents concomitantly rather than sequentially [1,2,3].
Two classes of drugs are active specifically against the reverse transcriptase enzyme of HIV-1. The nucleotide analogue RT inhibitors (NRTI) compete with the natural substrate and act as chain terminators in the RT catalytic site. The nonnucleoside analogue reverse transcriptase inhibitors (NNRTIs) are noncompetitive inhibitors that bind exclusively to a hydrophobic pocket in HIV type 1 RT [4]. Interactions between NRTI and NNRTI can be complex and difficult to assess experimentally.
We established a novel in vitro system to test the impact of NRTI pressure on the development of resistance to the NNRTI nevirapine (NVP) in highly NRTI-resistant but NNRTI-naïve isolates.

1.2. Lamivudine (3TC) Resistance—The M184V Substitution

When HIV-1 is exposed to the NRTI lamivudine (3TC) at inhibitory concentrations, resistant HIV variants carrying the RT substitution M184V (ATGàGTG) emerge rapidly [5,6,7]. The M184V substitution confers the highest level of resistance (up to 1000-fold) for any NRTI that has been described to date [8]. In cell-free RT assays the M184V mutant virus exhibits altered enzymatic properties. RT with the 184-Val substitution is less able to initiate reverse transcription, to incorporate dNTP, to perform chain elongation, and to undergo compensatory mutagenesis [9,10,11,12,13]. Decreased fitness and increased fidelity of 3TC-resistant virus limit the production of randomly mutant forms, many of which are not viable [14,15,16]. In M184V mutant enzyme, the process of polymerization becomes more accurate; fewer viral variants are produced; and adaptation to environmental stimuli is impaired [17,18,19].

1.3. Maintaining 3TC Pressure When NNRTI Are Introduced

To simulate an environment that promotes strong evolutionary pressure, we performed serial passages in escalating doses of the NNRTI nevirapine ([NVP]). Resistance against NVP develops rapidly in vitro and in vivo [20].
We hypothesize that if 3TC pressure is withdrawn and at the same time an NNRTI is introduced, then the M184V mutant strains will be at a competitive disadvantage to the more “fit” and “flexible” wild-type variants, which can adapt to the new drug more easily [19,21]. The concentration of 3TC used in our experiments is within the normal range of wild-type IC50. Since 3TC is known to exert selective pressure on M184V, we would expect inhibition of reversal to wild-type at position 184. In this study we address these questions. Can the anticipated 3TC effect be simulated in multidrug pressure experiments? Does 3TC have the expected impact on reversal and mutation rates, even in the context of high-level 3TC resistance?

1.4. Adding Adefovir (ADV)

We studied the 3TC-induced “antimutator phenotype” [22] further in the presence of adefovir (ADV). M184V mutant HIV has been shown to be hypersusceptible to ADV (as well as its successor, tenofovir) in vitro [23]. When ADV is added in the absence of 3TC, does ADV select for wild-type virus at position 184? Does the reversal to wild-type virus at position 184 (M184V-reversal) facilitate the development of NVP resistance?
The studies reported here come against a backdrop of tension between diminishing viral load through the administration of drugs on the one hand, and constraining viral escape of resistant strains on the other.
Figure 1. Sequencing Data—Review of Mutations and Reversals in Different Drug Combinations:A complete review of RT sequence changes under the following drug conditions: NVP_only, NVP+3TC, NVP+ADV, NVP+3TC+ADV, 3TC+ADV, No_drug. Individual isolates are displayed in different colors: #1 (green), #2 (dark blue), # 3 (light blue), #4 (pink), and #5 (orange). Sequence changes are listed with the passage number (PASS) and [NVP] where they were first observed. Any mutation away from wild-type is listed under ‘MUT’, reversal to wild-type under ‘REV’. Shaded areas within ‘REV’ indicate M184V-reversal.
Viruses 04 01212 g001

2. Results and Discussion

Figure 1, Figure 2 and Figure 3 summarize explicit baseline mutations and experimental mutations by isolate and drug combination. They also summarize counts of mutations together with incidence of V184M-reversal by isolate and passage number.

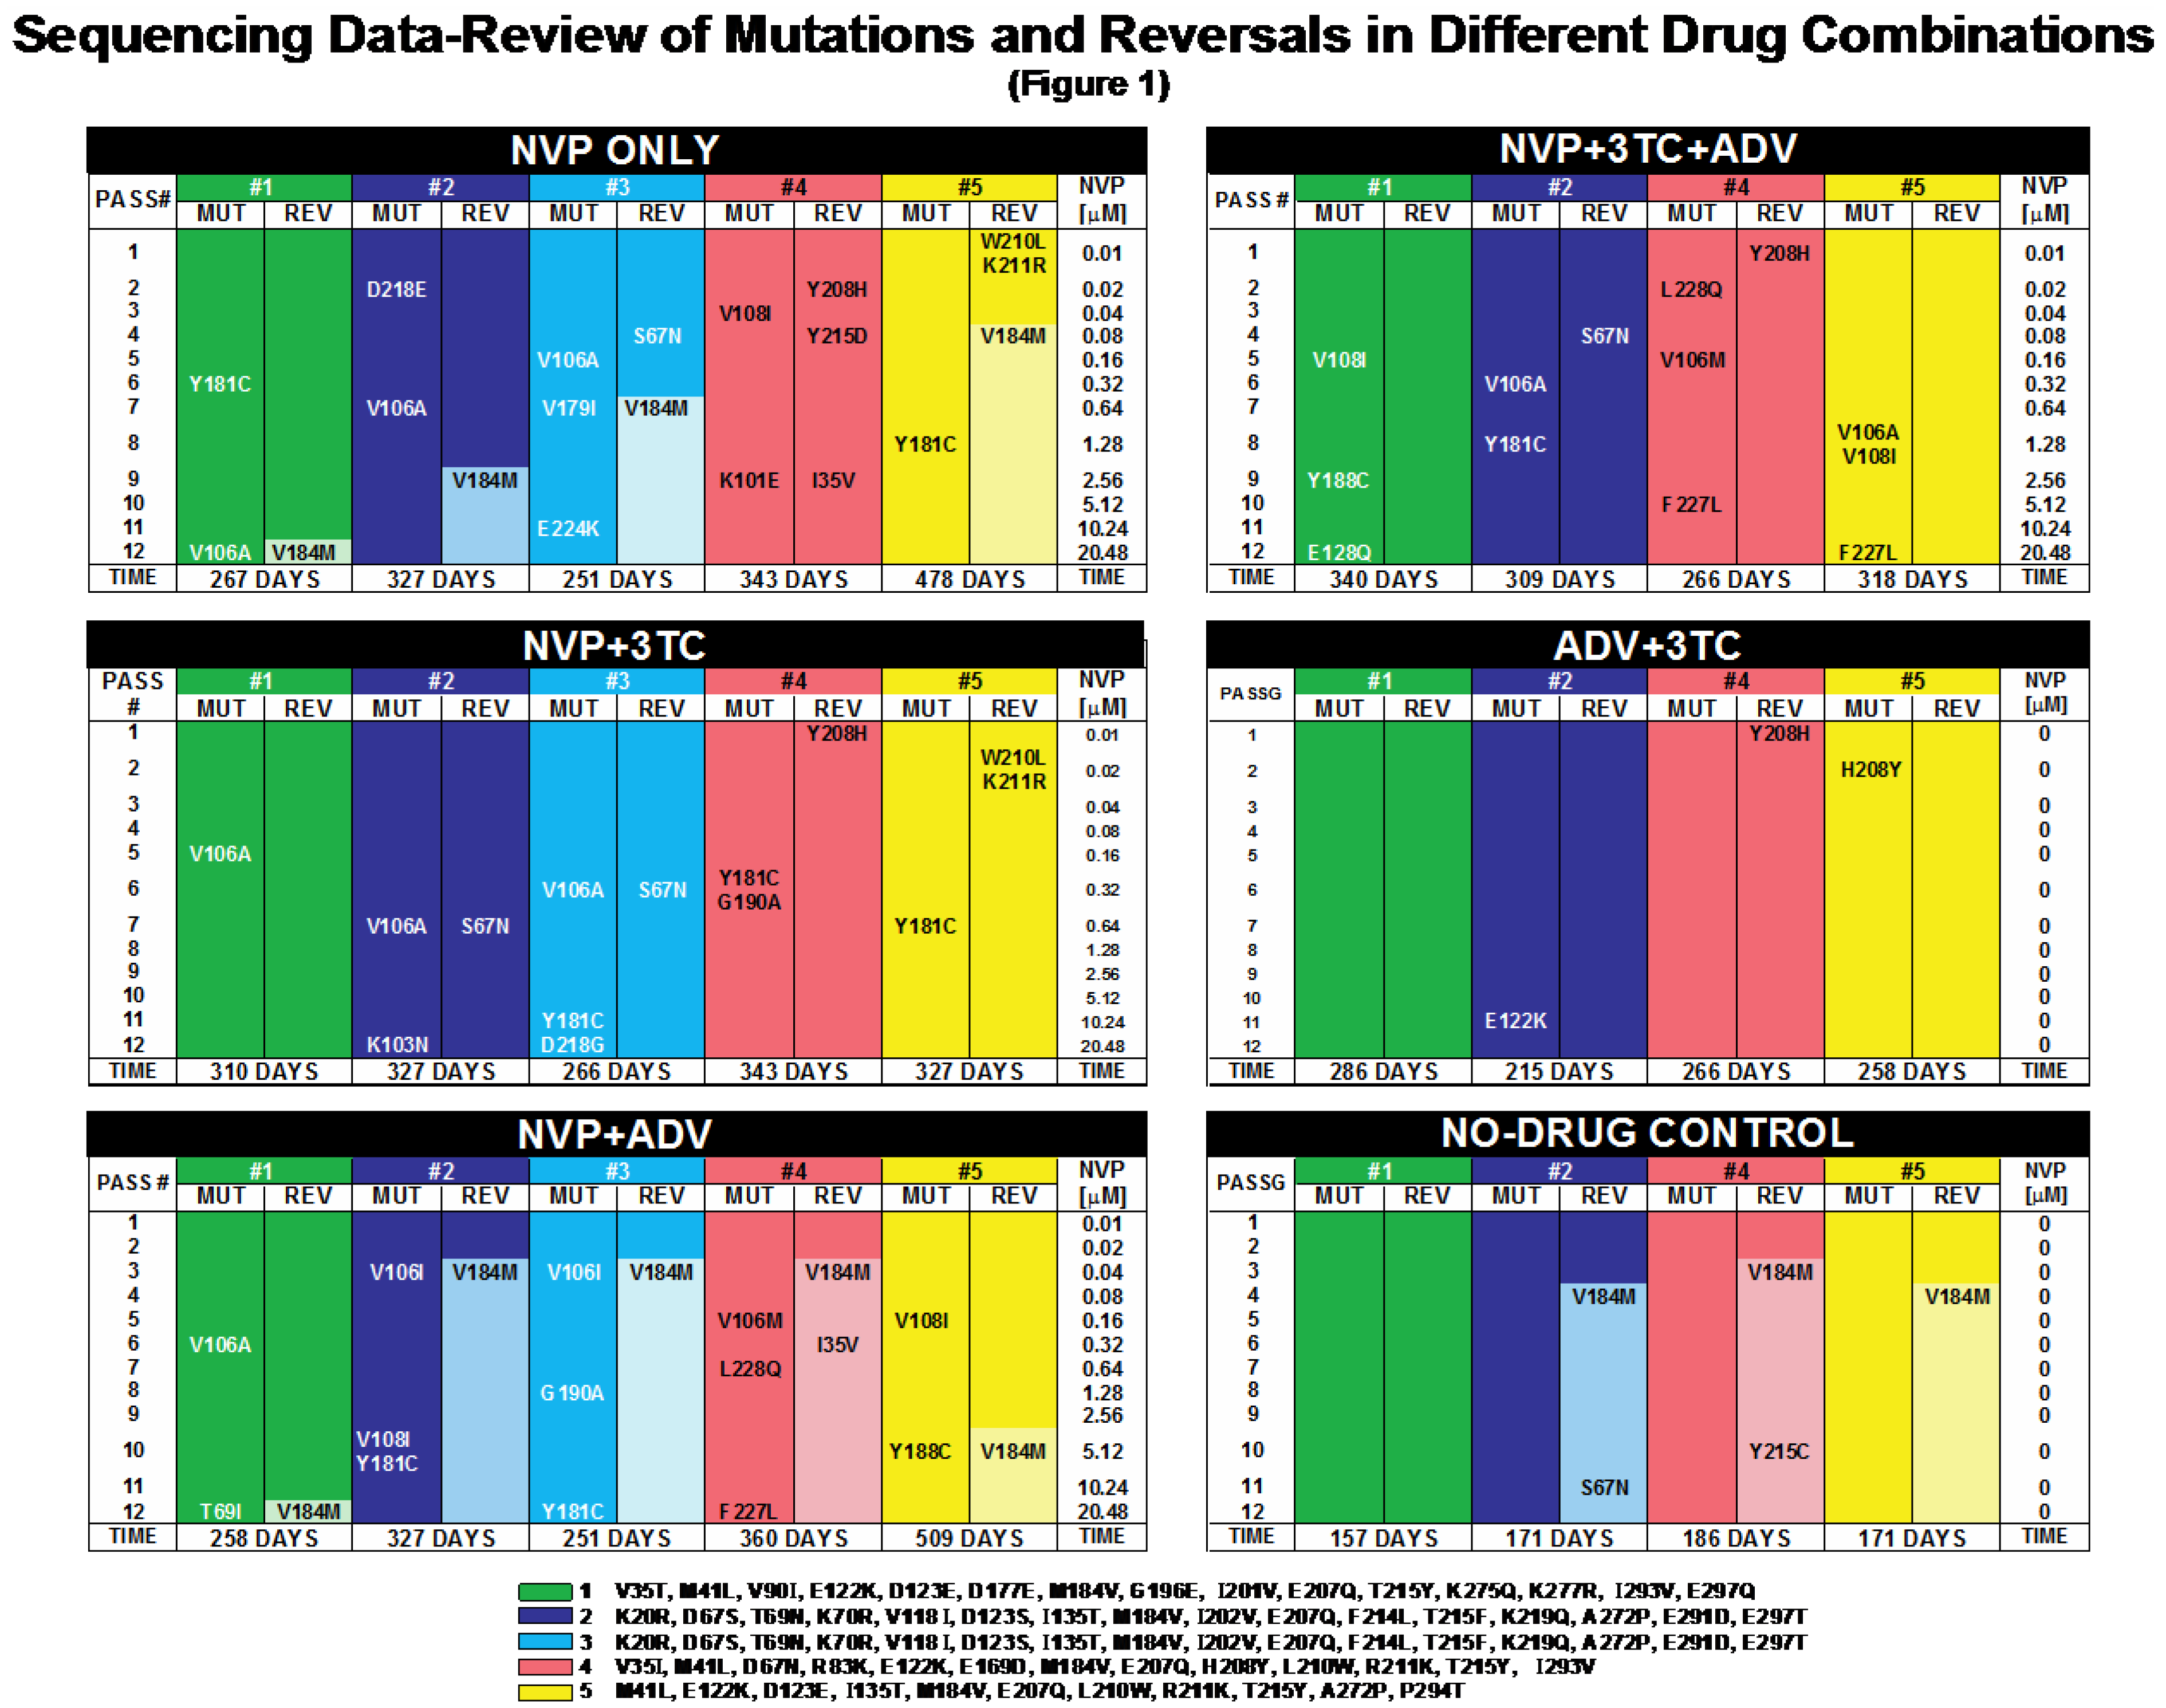
2.1. Mutations and Reversals in Different Drug Combinations

Reverse transcriptase (RT) mutational patterns and selected mutations/reversals of the individual isolates #1-5 at baseline and throughout twelve serial passages (P1-P12) are shown in Figure 1, below. All newly selected mutations and reversals persisted throughout P12. No mutations were observed in the No_drug control setup.

2.1.1. Introducing First-time NNRTI in NRTI-Resistant/NNRTI-naïve Clinical Isolates

Baseline isolates #1-5 (see legends) exhibit RT resistance patterns that commonly are observed in salvage therapy, all having changes at positions 184 and 215. It is noteworthy that of 55 baseline mutations, none is known to be in the NNRTI binding pocket, which includes positions 101, 103, 106, 108, 179, 181, 188, 190, 224, 227, and 228.
All isolates exposed to escalating doses of NVP showed a gradual appearance of one to three mutations, a total of 42 mutations. Of them, 38 were known to be in the NNRTI binding pocket, the remainder are considered noncanonical mutations or polymorphism. All RT mutations were tracked, including those not known to be associated with drug resistance. Please note the remarkably small p-values for the null hypothesis that these 38 mutations were “equidistributed” (that is to say, exchangeable) among possible codons.

2.1.2. Significance of NNRTI Binding Pocket Mutations

For the 19 isolates for which treatment included escalating doses of NVP, there were 38 NNRTI binding pocket mutations. Of these, 13 were at codon 106, seven at 181, and five at 108. The p-values for the findings that the “most popular” codon of 11 had at least 13 mutations, alternatively that the “second most popular” had at least 11, under the common null hypothesis that codons are “equidistributed” (exchangeable) were computed thus.
Isolates are taken to be independent, codons within isolates chosen at random without replacement from among the 11. Reading from isolate #1 through #5, successively from NVP only through NVP+3TC+ADV, the respective numbers of NNRTI binding pocket mutations were seen to be 2,1,3,2,1,1,2,1,2,1,1,3,2,3,1,2,2,3,3. Therefore, the number of ways NNRTI binding pocket codons could be chosen is
Viruses 04 01212 i002
We made this choice at random 50,000 times, each time noting the codon chosen the largest, respectively next largest, number of times, thereby obtaining the joint sampling distribution of these two random quantities. Of the 50,000 trials, the “most popular” codon seen was seen only 12 times, and that occurred for only four trials. The “next most popular” was seen seven times (2056 trials), eight times (129 trials), and nine times (seven trials). It follows that the respective estimated p-values are 1/50,001 (which is about 0.00002) and (2057+129+7)/50,001 (which is about 0.044) when the null hypotheses are as given. The first hypothesis seems untenable, and possibly not the second, either.

2.1.3. Maintaining versus Withdrawing 3TC Pressure

Maintaining 3TC Pressure prevented M184V reversal in all instances. Whenever 3TC was withdrawn, we selected for M184V-reversal, except for #4 in NVP_only (reversal at 215, 208, and 35 instead) and #1 in No_drug.

2.1.4. The Impact of Chance Effects

Isolates #2 and #3 were derived from the same baseline isolate. During lower passage numbers, these two isolates generated similar patterns. The impact of chance effects (‘stochasticity’) on the evolution of these two separate populations became more obvious at later passages. As expected, the two isolates #2 and #3 did not develop identically throughout combination passage experiments, but more similarly than isolates derived from different baseline patient isolates. In all isolates tested, preexisting sequence differences at baseline and viral variants below levels of detection may have contributed to the observed differences in mutational patterns. Since all baseline isolates underwent the same treatments, comparisons can be drawn across treatment groups.
It is evident that in this experimental setting, selective forces due to increasing evolutionary pressure override the impact of genetic differences at baseline. We note that when a mutation was selected at a particular codon for a particular triple, the mutation persisted in subsequent isolates. To be conservative, for “significance” we require a difference in numbers of detected mutations when isolates are compared for a given passage. In the particle model, we also test for whichever treatment has the smaller number of mutations, since the number of particles remains stable with subsequent passage.

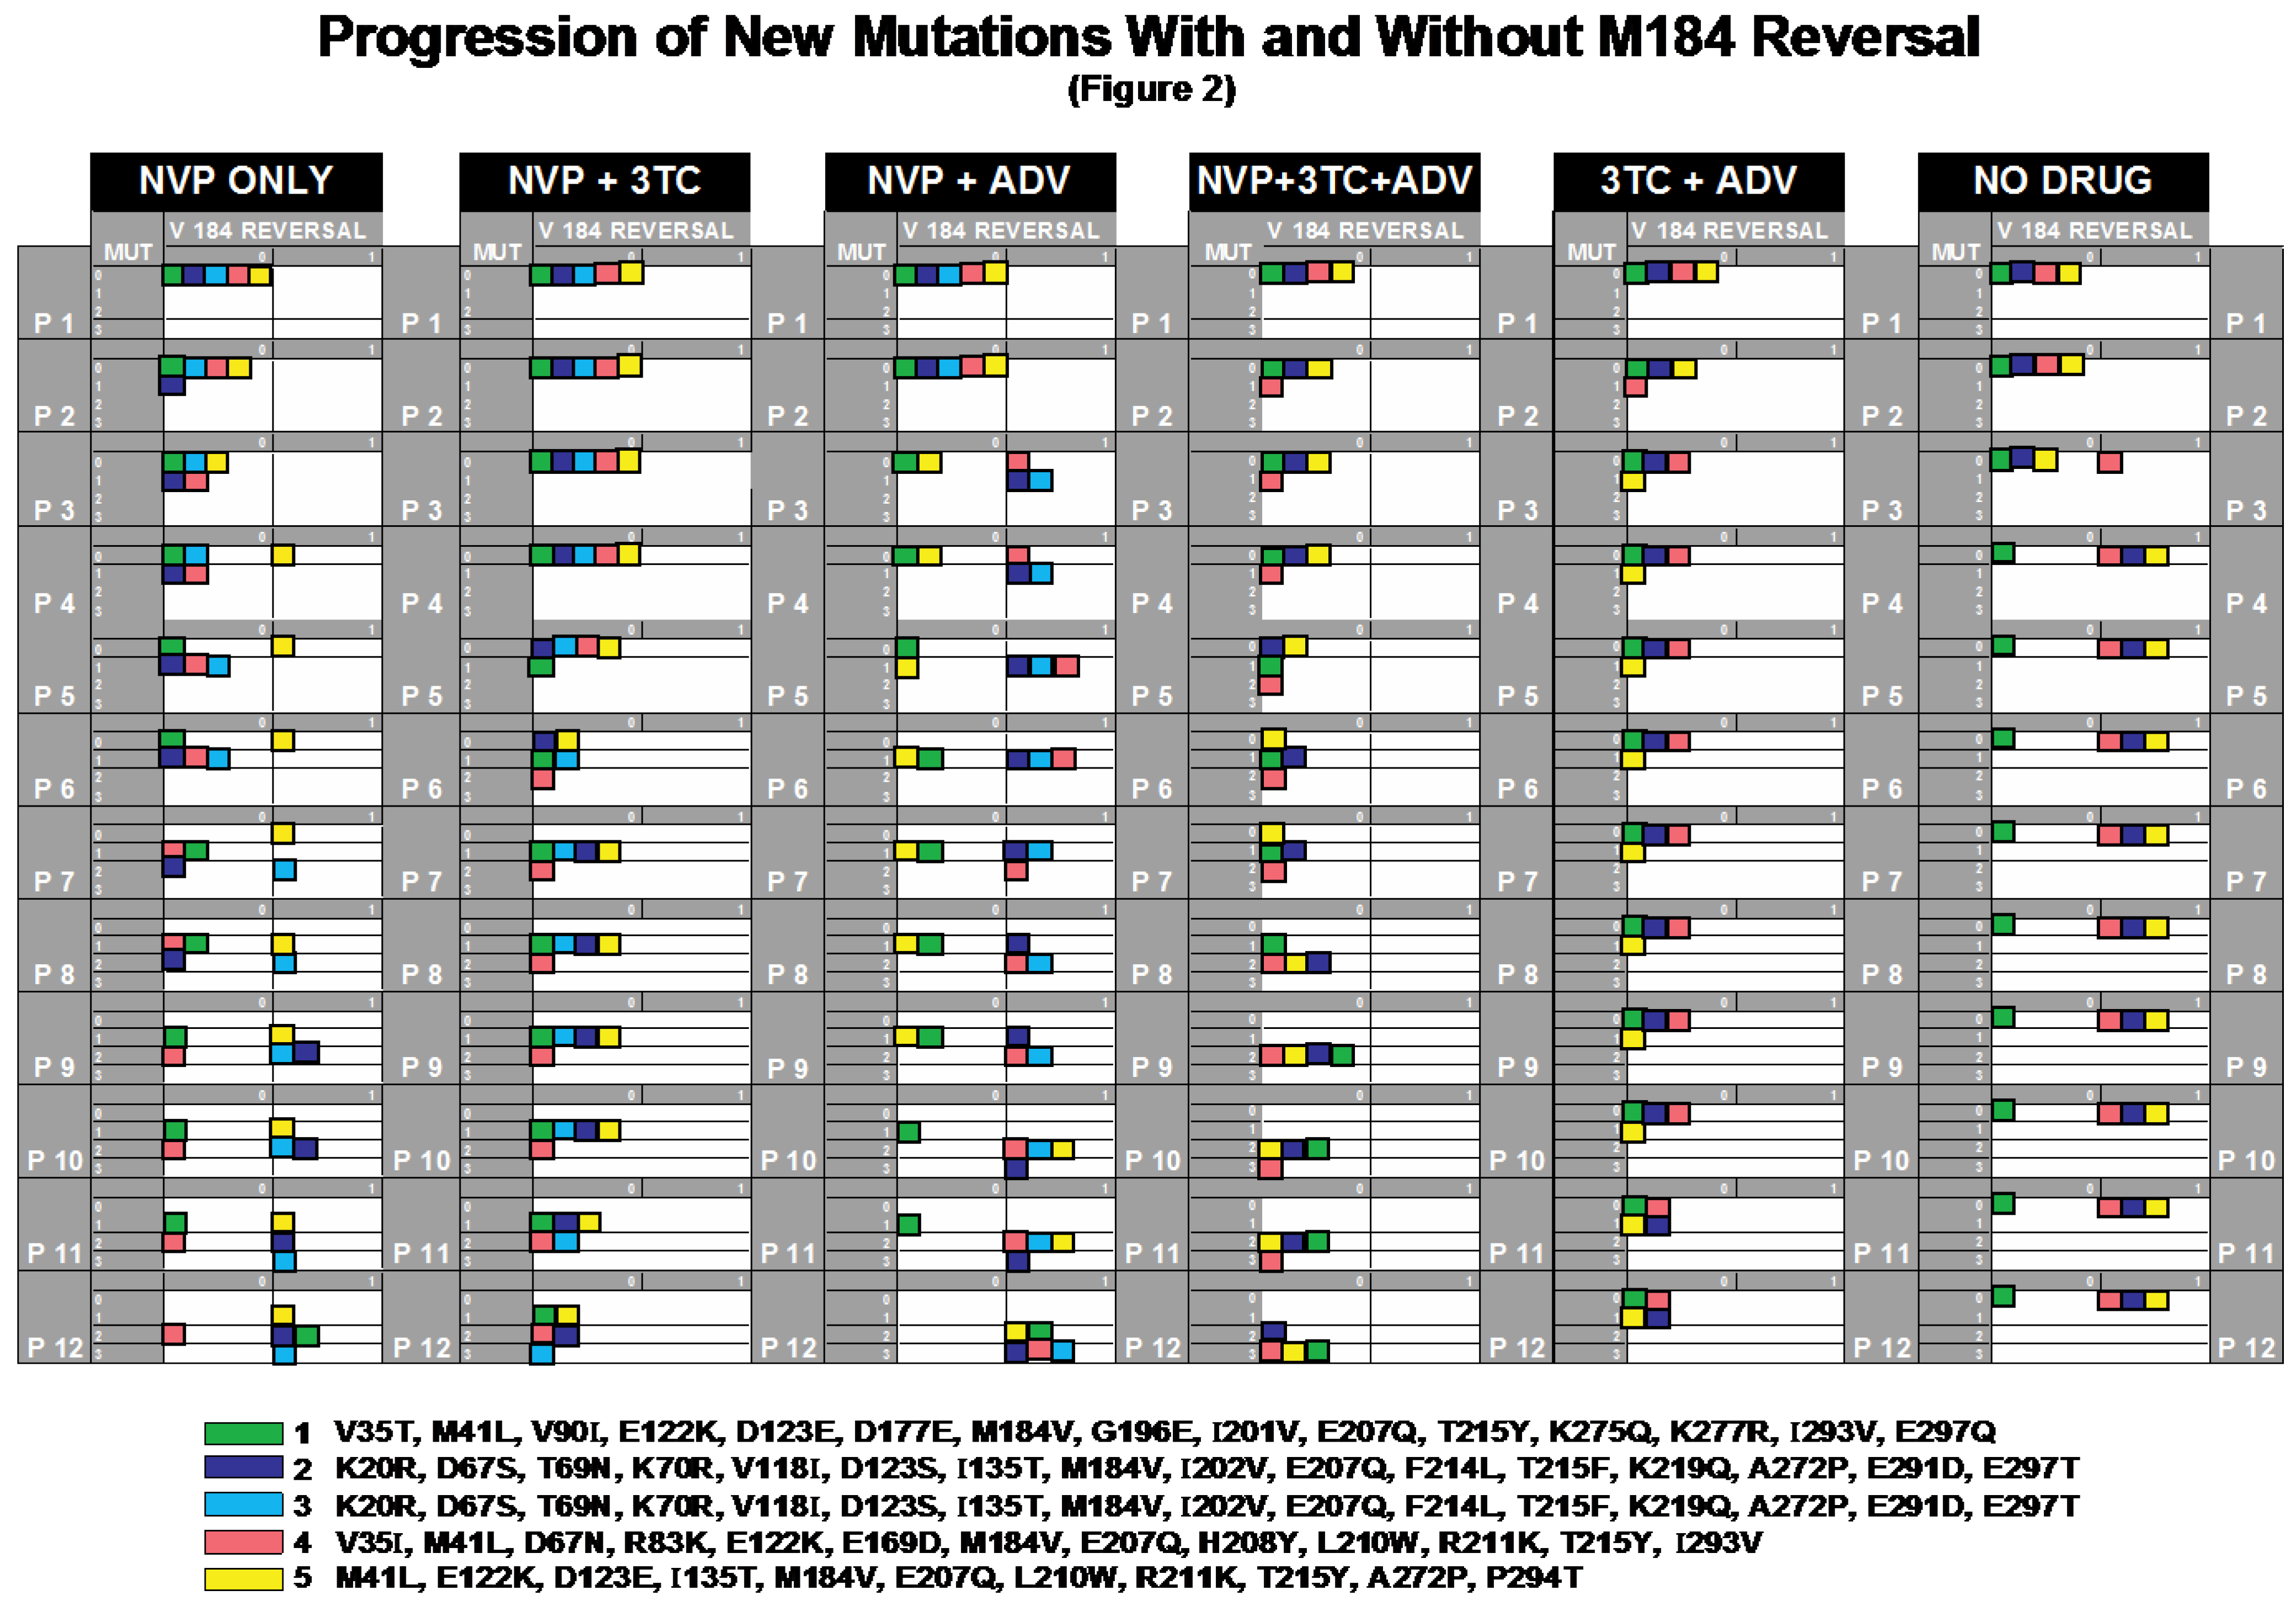
2.2. Progression of Mutations with and without M184V Reversal

For improved visualization of HIV evolution and dynamics during serial passage experiments, we summarized in vitro responses to different drug combinations in an innovative fashion using a Serial Passage Integrated Display (“Cube Model”) with 2-by-4 tables based on reversal/no reversal and the number of newly selected mutations per clinical isolate (“cube”).
Figure 2 illustrates how different drug combinations direct the movement of cubes into preferred directions: downward (new mutations), to the right (reversal), or diagonal (both).
Figure 2. Progression of Mutations With and Without M184V-reversal. All mutations and M184V-reversals for every passage and isolate are summarized. Isolates #1-5 (represented by colored cubes) started with a priori no mutations ‘MUT’ and no M184V-reversal (0MUT/0REV). At P1-P12, each cube could either remain in its position or move vertically to 1, 2, or 3 mutations and/or horizontally from 0 to 1 M184V-reversal. ‘Movements’ of cubes under defined drug pressures can be followed along P1-P12 or compared across equivalent passages.
Viruses 04 01212 g002

2.2.1. NVP_only

NVP_only simulates the effect of NVP monotherapy and serves as the basic experiment for the comparison with the other NVP escalation experiments. When all isolates in NVP_only are viewed together, we see the selection of wild-type at position 184 (M184V-reversal) in most (4/5) cases, though only one through the first six passages. There are 1, 2, or 3 newly selected mutations at least by P12, mostly known NVP resistance mutations (see Figure 1).

2.2.2. NVP+3TC

With the addition of 3TC (NVP+3TC) we observe several changes in comparison to NVP_only. M184V-reversal was prevented by the addition of low-level 3TC in all cases despite an exponential increase in NVP doses of up to >2000-fold. In the presence of 3TC, no RT changes could be found when NVP was escalated from P1 through P4 (1 to 8-fold [NVP] and from P7 to P10 (64 to 510-fold NVP). Under extreme pressure (P12, 2048-fold NVP) we observe total numbers of 2x1, 2x2 and 1x3 mutations, but no M184V-reversal. Testing the correlation in the viral particle model, there is a significant difference in the two regimes at the 5% level according to in the suspected direction for isolate #2 at P2 through P5 and for isolate #4 at P4. There are significant differences in the opposite direction for isolate #1 at P5 and isolate #4 at P6.

2.2.3. NVP+ADV

The addition of ADV to NVP_only (NVP+ADV) selects rapidly for M184V-reversal (P3). At P12 all isolates have reverted. Moreover, we see a higher total number of NNRTI mutations in comparison to both NVP_only and NVP+3TC. When NVP alone is compared to NVP+ADV by the viral particle model, there are significant differences in the anticipated direction for isolate #3 at P3 and for isolate #5 at P5 and P6. There is a significant difference in the opposite direction for isolate #4 at P3.

2.2.4. NVP+3TC+ADV

NVP+3TC+ADV can be viewed as the 3TC with ADV+NVP, as NVP_only plus 3TC+ADV, or as ADV with NVP+3TC; 3TC again prevented M184V-reversal in all cases. However, the addition of ADV to NVP+3TC increased the number of NVP mutations selected at lower passage numbers. The high degree of heterogeneity in the presence of ADV was independent of M184V-reversal, which was prevented by 3TC. Comparing NVP+3TC with NVP+3TC+ADV in the viral particle model, the only significant differences in mutation (other than reversals) are for isolate #4, P2 through P4. They are all in the suspected direction: more mutations appeared when ADV was part of the treatment regime.

2.2.5. 3TC+ADV

3TC+ADV serves as a control experiment; [3TC] and [ADV] were maintained at the same level from P1 through P12. The low number of total mutations suggests that the degree of evolutionary pressure was not comparable with the NVP-escalation experiments; ([ADV] at 2 μM) as an active drug exerted evolutionary pressure and generated mutations. Interestingly, E122K (#2/P11) and H208Y (#5/P3) would not be considered resistance mutations to ADV [24].

2.2.6. No_Drug

No_drug simulates a treatment interruption and demonstrates that upon 3TC withdrawal, M184V tends to revert, even if the environment is stable. By P4, 3/4 isolates had reverted.

2.2.7. Testing the 3TC-Effect

The null hypothesis that 3TC does not lead to altered 184 reversal has p- value 5.982×10⁻⁶ , at least if 3TC is specified in advance of the computation. Figure 2 will convince a reader that the attained significance level for any reasonable model should be very small since there was no reversal with 3TC.
Further inference in this section is devoted to testing the null hypotheses that numbers of mutations result in identical sampling distributions no matter which of two combinations of drugs was administered. In order that tests are conservative, we computed p-values for two-sided alternatives; that is, in principle either combination of drugs could have resulted in a sampling distribution of mutations stochastically smaller or larger than that of the other.
We employed exact distributions of a Mann-Whitney (equivalently Wilcoxon rank-sum) statistics in computing attained significance [25], respecting that resulting 2×4 tables [with rows representing treatment and columns numbers of mutations (0, 1, 2, or 3)] have many tied observations. Our statistics are, in fact, permutation statistics. When we say “significant” in the table that follows, we mean that the (two-sided) p-value was <0.05. Alert readers will see that we have made no attempt to correct for multiple testing and have not employed false discovery rates [26]. Evidence for our claims is transparent from cursory examination of Figure 1 and Figure 2; we feel that the conservative p-values we supply are sufficient to make our points. (Table 1).
  • (A) NVP_only has significantly more mutations than 3TC+ADV at passages 8 through 10 and 12.
  • (B) NVP+3TC has significantly fewer mutations than NVP+3TC+ADV at passages 9 and 10.
  • (C) NVP+3TC has significantly more mutations than 3TC+ADV at passages 7 through 10.
  • (D) NVP+ADV has significantly more mutations than 3TC+ADV at passages 6 through 12.
These are the most extreme comparisons with respective p-values 0 .048, 0.040, 0.032, 0.032, 0.024, 0.032, and 0.008.
  • (E) NVP+3TC+ADV has significantly more mutations than 3TC+ADV at passages 9 through 12.
Table 1. Comparison across passage numbers and drug combinations; testing the null hypotheses that numbers of mutations result in identical sampling distributions no matter which of two combinations of drugs was administered. P-values (<0.05 in bold) for comparisons (A) to (E); passage numbers 6–12.
ComparisonPassage Number
6789101112
A) NVP_only versus 3TC+ADV0.52380.14290.03170.04760.04760.07940.0317
B) NVP+3TC versus NVP+3TC+ADV0.97621.0000.20630.04760.03970.11900.1429
C) NVP+3TC versus 3TC+ADV0.44440.03970.03970.03970.03970.15870.0794
D) NVP+ADV versus 3TC+ADV0.04760.03970.03170.03170.02380.03170.0079
E) NVP+3TC+ADV versus 3TC+ADV0.37140.37140.05710.02860.02860.02860.0286

2.3. Appearance of New Mutations before and after 184 Reversal

Figure 3 summarizes the selection of mutations prior to and after M184V-reversal, respectively. Though numerical averages may be of limited descriptive value for random quantities that change by doubling, for completeness these numerical averages are displayed as horizontal white bars.
NVP_only shows a mixed picture. Mutations were selected at P2, P3, P5, and P6 without prior or simultaneous reversal at position 184 (M184V; left column). The first new mutation with reversal (After M184V Reversal; right column) became prevalent at P7. More mutations after reversal appeared at P8, P11, and P12, though additional mutations were selected at P7 and P9 without reversal.
Figure 3. Appearance of new mutations before and after 184 Reversal: All mutations generated (diamonds) per drug setting, before (M184V, left column) and after M184V-reversal (After 184 Reversal, right column) are summarized. We display the appearance of each selected mutation in relation to the respective passage number and NVP concentration on the y-axis. FOLD [NVP] represents the concentration at which a mutation first became prevalent. FOLD [NVP] =2p (with P = passage number). As reported in Figure 1, all observed mutations persisted up to P12. During drug escalation, the event of M184V-reversal is required for a mutation to appear in the right column. Diamonds in either column can therefore only be compared between different drug settings. Horizontal bars in the logarithmic FOLD [NVP] scale indicate the average [NVP] for mutations to appear.
Viruses 04 01212 g003
With NVP+3TC there was no M184V-reversal. With 3TC+NVP we selected for a total number of 9 mutations, which was the lowest among all NVP escalation experiments. Importantly, the first mutation that appeared with NVP+3TC was selected under substantially higher NVP concentrations (P5; 16-fold), by contrast with what was seen with NVP_only (P2; 2-fold) or in any other setting.
With NVP+ADV, mutations appeared after M184V-reversal, the first one at very low NVP concentration (P3; 4-fold). The average [NVP] was lower than in NVP_only for both M184V (left column, 24-fold versus 62-fold) and After M184V Reversal (right column: 682-fold versus 816-fold).
In the NVP+3TC+ADV experiments, 3TC precluded M184V-reversal. The total number of selected mutations (11) was lower than in NVP+ADV (13) and higher than in NVP+3TC (9). It must be noted, however, that NVP+3TC+ADV was done with only four isolates (versus five in the other NVP-settings). The first mutation appeared at P2 (2-fold [NVP]). However, the average concentration needed to generate mutations was high (483-fold in NVP+3TC+ADV), but lower than without ADV (595-fold in NVP+3TC).

2.4. Summary of Results

We draw four conclusions from our experiments simulating combination therapy in vitro.
  • 1. The presence of low-dose (1μM) 3TC prevented reversal to wild-type from an M184V mutant background.
  • 2. Adding low-dose 3TC in the presence of NVP delayed the selection of NVP-associated mutations.
  • 3. The presence of ADV, in addition to NVP, led to more rapid reversal to wild-type at position 184 than NVP alone.
  • 4. ADV plus NVP selected for greater numbers of mutations than NVP alone.
Inference about the “selection of mutation” is based on two statistical models, one at the viral level, more telling, and the other at the level of predominance of mutation within a population.

2.5. Discussion

It is evident from Figure 1, Figure 2 through Figure 3 that during each passage, there is tension between diminishing viral load through the administration of drugs and constraining viral escape through the selection of mutant forms. Our contributions begin with the establishment of an in vitro system to study the impact of continued 3TC pressure on the selection of both M184V-reversal and resistance to NVP.
Several clinical trials demonstrated that the use of genotypic resistance data is associated with improved virologic and clinical outcome in salvage therapy and can be cost-effective [27,28,29]. When sequence data are available to direct the choice of a new regimen and a known resistance mutation is found, it seems plausible that the respective drug has lost antiviral activity and should be discontinued. Specific combinations of antiretroviral agents can exert conflicting genetic pressures [30]. A novel strategy that remains to be established is the continued use of certain individual compounds with the goal to preserve “suppressor mutations” impairing the evolution of resistance to other compounds [4,15,22,31].
Some authors have suggested continuing 3TC therapy even in the context of high-level 3TC resistance [18,19,32,33]. The strategy is to preserve the resistance mutation M184V, which has been linked to an HIV-1 reverse transcriptase with altered biochemical properties. Previous in vitro studies have shown that M184V may not delay the emergence of some protease inhibitors (PI) mutations [34], but of some PI and NNRTI [12]. In our study we test for NRTI-NNRTI interactions allowing for structural or functional constraints within the RT enzyme to interfere with the acquisition of new mutations.
Jonckheere et al. compared HIV wild-type to M184V mutant virus with three different stable doses of NVP in the absence of 3TC pressure [35]. Breakthrough of NVP-resistant virus was generally observed one passage later with M184V mutant than with wild-type virus. This study is in agreement with our results, but did not address the effect of concomitant 3TC pressure on diverse clinical isolates. Diallo and Balzarini et al. tested the combination 3TC with NNRTI (NVP and efavirenz, respectively) [12,36]. Again, viral breakthrough was delayed significantly when wild-type and 184V recombinant HIV were exposed to 3TC plus NNRTI. The above experiments by Jonckheere, Balzarini and Diallo et al. used clonal HIV-1 IIIB laboratory isolates passaged in tumor cell lines, which would be considered the standard method when examining the effect of individual mutations on the emergence of drug resistance mutations. In our experiments we confirmed that this additive 3TC-NNRTI effect is preserved even in the context of “real-life” patient isolates carrying the M184V “naturally”, i.e., after in vivo exposure to 3TC. This is even more remarkable as our method used diverse clinical isolates, which may have contained minority variants below the 20% detection level with population-based sequencing [37]. Future developments of this method should employ second generation sequencing methodologies to examine the role of minority variants in the mix, or to compare artificial mixtures of minority variants outcompeting each other under drug pressure.
It remains to be noted that in our assay, we used pooled donor PBMC rather than immortalized laboratory cell lines, aiming to simulate the real-life scenario as closely as possible. While pooled PBMC may pose a potential caveat due to the variability in the composition of PBMC over time, the pooled PBMC culture technique has been developed and established at the Stanford Center for AIDS Research (CFAR) in the early 1990s [38,39,40,41,42] and has since then become part of standard quantitative PBMC culture protocols in the NIAID Virology Manual for HIV Laboratories [43]. Quan et al. observed an additive effect of 3TC+NVP in enzymatic assays when measuring the amount of full-length RT product in M184V mutant virus. The authors suggested that 2.5–20 μM 3TC might exhibit a modest antiviral effect in M184V mutant virus despite high-level resistance [32]. Our data are in agreement with this hypothesis, but for 3TC-concentrations as low as 1 μM.
Our results underline the importance of drug combination testing in patient isolates that are resistant at baseline. In 38 of 42 isolates exposed to NVP we selected for mutations that are located in the NNRTI binding pocket. We note that of them, 13 were at site 106, seven at 181, and five at 108. It seems plausible that structural constraints favor NNRTI mutations in positions 103-108 over changes in positions 181 or 188 as long as M184V predominates. The structure of M184I-HIV-1 has been solved and published [8], NNRTI have been co-crystallized with wild-type as well as Y181C and Y188L mutant RT [44]. For a better understanding of NRTI-NNRTI interactions complex three-dimensional models of dual/triple resistant virus will be required.
In our study we investigate the overall effect of maintaining versus withdrawing 3TC pressure in clinical isolates at the first-time use of NNRTI. It is well known that NNRTI mutations are generated quickly de novo, even in wild-type laboratory strains. Clinical studies have shown that NNRTI- naïve patients may harbor HIV-1 viral variants with reduced NVP-susceptibility [45,46]. In our study, all isolates were fully susceptible to NVP and ADV at baseline (data not shown). All isolates were exposed to identical experimental conditions, allowing comparisons across the different drugs present in the growth media. In this context it is not surprising that the two isolates (#2 and #3) of common genetic lineage behaved similarly. As we expected, patterns of resistance evolved differently, but always in concordance with one basic hypothesis. That is, no matter the genetic background, 3TC precluded M184V-reversal and impaired the selection of mutations in the NNRTI binding pocket. Thus, continuing 3TC and adding at least two more active agents to the regimen should delay the initial selection of NNRTI resistance.
The observation that ADV+NVP select for greater numbers of RT mutations than NVP_only can be explained by the selective pressure of both drugs, ADV+NVP, being greater than that of NVP alone, but sufficiently low to allow viral replication and selection. The pressures imposed by ADV would be expected to select changes conferring advantages to replication in the presence of ADV, such as 184 reversion. M184V reversion was promoted by ADV pressure only in the absence of 3TC pressure, contrary to reports of TDV+3TC serial passage experiments in SIV [47]. Interestingly, the mutations observed with ADV in our experiments were, with one exception (T69I), all positioned within the NNRTI binding pocket as opposed to the NRTI binding pocket. Thus, the majority of mutations selected with NVP+ADV and NVP+ADV+3TC were mutations known to confer NVP, not ADV, resistance. ADV+3TC alone selected for random changes at positions 208 and 122. Another NRTI, zidovudine (ZDV) has previously been reported to increase mutation rates [48,49].
The rapid outgrowth of 184Met virus in the absence of 3TC in our experiments indicates that fitness disadvantages are compensated for, as soon as drug pressure is released. We screened for replicative fitness in P10-12 supernatants and found that TCID50 values, when measured several times in the absence of drug, were extremely low. Surprisingly, the same isolates showed dramatically improved growth in the presence ADV, NVP and 3TC, independent of the dose range applied (data not shown). Dose-dependent enhancement of viral growth by NNRTI has been reported [44]. The observed phenomenon of dose-independent, but drug-dependent growth enhancement in some of our isolates will be a subject for further investigation [50].
It has been suggested that the observed benefits of 3TC in combination therapy, even after 3TC-resistance arises, may be attributed to the net-effect of decreased adaptability and a deficit in viral fitness [5,12,51]. The simulation of combination therapy in vitro is a new method that provides an important link between in vitro assays and in vivo studies in animal models and human subjects. Our data support a chain of evidence derived from biochemical assays and single-drug experiments in laboratory isolates, as we report. We approximate the actual clinical scenario further by using multiple drugs simultaneously in clinical isolates with diverse genetic backgrounds.
The genetic background has been determined by consensus genotyping as the current method of choice when switching drug regimens. As indicated in the mathematical models used, this includes only the view of majority variants composing >80% of the virus population [37]. In this assay, each virus population was allotted the time required to outgrow drug pressures with each passage before the next passage was started. Future studies using different mathematical models will be addressing growth kinetics during single passages. Allele-specific assays may help determine the role of minority variants in the evolution of drug resistance against combinations of antiviral drugs.
The next level of complexity would be reached in a clinical trial that ought to account for additional parameters, such as patient compliance, virus-host interactions, and the distribution of viral populations within body compartments [31]. Several studies tested the decay of M184V during salvage therapy as well as treatment interruptions [51,52,53,54]. Resistant variants with impaired fitness disappeared within weeks after discontinuation of highly active antiretroviral therapy (HAART), accompanied by rapid viral load rebound. Only well-designed prospective clinical trials can assess the in vivo risk/benefit ratio and justify a prolonged, possibly once-daily use of 3TC in 3TC-resistant patients, not only in the context of strategic treatment interruptions, but also when a new regimen is started [31,55,56,57].

3. Experimental Section

3.1. Test Compounds

Lamivudine (3TC) was kindly provided by GlaxoSmithKline (Research Triangle Park, NC), ADV by Gilead (Foster City, CA). NVP was obtained from Boehringer Ingelheim (Ridgefield, CT).

3.2. HIV Strains

Six clinical isolates #1 through #5, were cell-free supernatants expanded by cocultivation with donor PBMC (NIAID Virology Manual for HIV Laboratories). They were stored at −70 °C. These frozen stocks were derived anonymously from individuals who had received long-term antiretroviral therapy but who had never been exposed to NNRTIs. The primary samples were sequenced up to RT amino acid position 300. A complete list of initial RT mutations (as compared to the Los Alamos consensus HIV-1B) can be found in the legends of Figure 1 and Figure 2.

3.3. Cells and Cell Culture

Pooled HIV-negative donor PBMC (Stanford Blood Bank) were isolated by centrifugation on Ficoll-Paque and were cultured in RPMI medium containing 15% heat-inactivated fetal calf serum, IL-2, PenStrep and L-Glu. Before use, these cells were stimulated for 2–3 days with phytohemagglutinin (Sigma, St. Luis, MO) and washed [40,41,42].

3.4. Passage Experiments

Isolates # 1–5 were set up in five different drug combinations: NVP_only, NVP+3TC, NVP+ADV, NVP+3TC+ADV, 3TC+ADV and No_drug, #3 and #2 were aliquots from the same baseline sample, but were run as independent experiments in NVP_only, NVP+3TC, and NVP+ADV. With each passage, the concentration of NVP was doubled. The NVP starting dose was 0.01 mM, around the IC 50 of the NNRTI-naïve baseline isolates. 3TC [1 mM] and ADV [2 mM] were added and maintained at levels around the IC50 of the respective baseline isolates.
Newly passaged cultures were set up as follows: 100 μl supernatant, incubated with 5 Mio PBMCs in 1ml media without drug. After 2 hours of incubation at 37 °C/5% CO2, the culture was dissolved in 10ml media with the respective drug combinations. The cultures were transferred to 25-mL flasks and again incubated at 37 °C/5% CO2.
Viral growth was monitored once weekly using a p24 antigen assay on supernatants (Abbott Laboratories, Chicago, IL). At p24 ELISA values <3 × 10⁴ pg/mL, cultures were split: 2.5 Mio PBMCs were replaced by new donor PBMC in media containing the respective drugs in the same molar concentration. At ≥ 3 × 10⁴ pg/mL, the cultures were passaged after a 2-hour incubation time. With every passage [NVP] was doubled. The amount of supernatant to infect new cells was adapted according to p24 values obtained before passage. All experiments were carried to the 12th passage (P12), i.e., 2048-fold [NVP], well below cytotoxic levels. Average time to P12 was 293 days (range 157–509 days). With every passage, supernatant was harvested and stored in aliquots at −70 °C.

3.5. ABI Sequencing

Population-based sequencing [37] was done at baseline as well as from the supernatant obtained with every passage. As was described previously [58], purified proviral RNA (Quiagen Viral RNA Extraction Kits, Chatsworth, CA) from cultured cell pellets was amplified by nested PCR. A Superscript-One-Step RT-PCR reagent (Life Technologies, Gaithersburg, MD) was used to obtain DNA segments for sequencing. First-round nested PCR primers were RT-21 [59] and MAW-26 [58] and second-round primers were PRO-1 [60] and RT-20 [59], respectively. Second-round products were sequenced using a dRhodamine labeled terminator kit (PE Applied Biosystems, Warrensburg, UK) and the previously described [61] primers RT-a, RT-b (forward), RT-y and HXBR2-89 (reverse). Sequencing was performed using ABI Model 377 equipment and software.
Sequences were aligned, proofread, and edited in a blinded fashion. Sequencing data were compared to the corresponding baseline isolates and to the consensus B sequence from the Los Alamos HIV Sequence Database, as well as to data obtained from earlier passages in the same experiment. Any mutation away from consensus B-sequence was defined as mutation. Any mutation back towards consensus HIV-1B was defined as a reversal, even if it was not “all the way back” to consensus.

3.6. Statistical Methods

For a given triple (drug combination, isolate, passage), the individual viral particle is the sampling unit for our first model. Its assumptions are that for each of (approximately) 3x10⁴ viral particles and at each of the 300 RT key codons, the amino acid at that codon is either as it was at baseline or has a mutated value. Based on published estimates, the sensitivity of population based sequencing is at least 80% [37]. We assume that for a fixed codon the probability of mutation is constant across particles [62,63]. For a fixed codon c, what might vary for two particles i and i’ is the correlation between the indicator functions of the amino acid values at the codon for the two particles. Recall that the indicator function of an event is 1 if the event occurs and 0 if not. Therefore, the indicator for the cth codon of the ith particle is 1 if that codon has baseline value. Otherwise it is 0. Symbolically, this is ρ(i,i’) = Corr(Ii(c),Ii’(c)).
We ask this question: “What would be the maximum value of this correlation, averaged over pairs of particles, so that two isolates differ at the 5% level of significance when one isolate has baseline values at all codons and the other a single mutation away from baseline?”
The mathematical details and discussion of this novel statistical model are summarized in 3.6.1. Viral Particle Model and 3.6.2. Population Models, below:

3.6.1. Viral Particle Model

One approach to testing differences at two fixed passages between two isolates, neither descended from the other, was by what we have termed the viral particle model. The basis for comparison at a fixed codon is a two-sample t-like statistic that is the difference of two fractions divided by an estimate of the standard deviation of that difference. We denote the two isolates by a and b.
For a, say, the indicator of particle i having its baseline value at codon c is Ii(c), which has value 1 if c is wild type, and otherwise is 0. There is an analogous indicator for b. We take the numbers of viral particles to be 30,000. We speak of the correlation ρ between two indicators. For two codons i and i′ we write this correlation ρ(i,i′). What matters is actually the value of ρ(i,i′) averaged over pairs (i,i′) of codons. From the constraint that the variance of a sum cannot be negative, it follows easily that the average ρ(i,i′) cannot be less than −3.33 × 10⁻⁵. In fact we expect that ρ, which we cannot know exactly, is positive and small. Because two particles within the same isolate and passage may have replicated inside the same cell, and also because of the physical proximity of any two particles within a flask can vary, we do not assume a priori that ρ = 0.
For a comparison of differences, the numerator of the t-like statistic is
Viruses 04 01212 i003
and Viruses 04 01212 i004 is defined by analogy.
From a well-known computation with sums of random variables that assume only values 0 and 1 it follows that the variance of Viruses 04 01212 i005,
Viruses 04 01212 i006
where Viruses 04 01212 i007
Note that this probability is assumed here not to depend on i. (Of course, computations that follow in this appendix, and that are required elsewhere in the paper, show this assumption to be false, decisively. However, the net effect of our assumptions is to make the p-values of our test extremely conservative.) We estimate Viruses 04 01212 i008 by replacing pa on the right hand side of (A.1) by Viruses 04 01212 i009.
Viruses 04 01212 i010 is estimated analogously. Because Viruses 04 01212 i009 and Viruses 04 01212 i011 are clearly independent, our t-like statistic is now seen to be
Viruses 04 01212 i012
The missing ingredient in tc is ρ, which we admittedly have no way of knowing exactly. But for that, we could approximate p-value for testing the null hypothesis “no difference between given isolates and passages at codon c” by Prob (|Z| > t), where Z is a standard Gaussian random variable; and t the observed value of tc. We could then test the null hypothesis “no difference at any codon” by 300Prob (|Z| > t). The latter computation uses the simple Bonferroni bound. In fact what we wish to do with tc is to find and use the largest value of ρ for which the cited 80%–20% difference at some codon for fixed isolates and passages is significant at the 5% level for the null hypothesis as given. First, we solve Prob (|Z| > t) = 0.05/300 for t, arriving at t = 3.7482.
Then, set Viruses 04 01212 i013 = 0.8, Viruses 04 01212 i014 = 0.2, and tc = 3.7482; and solve for ρ. The resulting ρ is 0.08.

3.6.2. Population Models

Two further models are based on the notion that for each (drug, passage) combination, isolates are sampling units. Thus, the sample size is five for NVP_only, NVP+3TC, and NVP+ADV, and for NVP+3TC+ADV, 3TC+ADV, and No_drug, for a total sample size of 27 for each cited pair.
Numbers of mutations across isolates within a particular passage for a “counting process” such as ours might be taken to be what is conventional in such applications, a Poisson process. The Poisson model arises when there are many chances for “success” but few “successes”, and in addition trials are independent. These assumptions might apply when we take mutations themselves as sampling units. The presence of mutation or mutations within an isolate and drug combination can be assumed independent across passages; they are certainly independent across isolates. A sum of independent Poisson random variables has a Poisson distribution no matter the respective parameters of the summands. Conversely, if a sum of independent random variables has a Poisson distribution, then according to D. Raikov [64], each summand has a Poisson distribution. Therefore, we can test the null hypothesis that the Poisson model applies to numbers of mutations within a drug combination by looking at Passage 12 to see if the distribution of numbers of mutations across isolates is Poisson. We begin with the usual approach to assessing the Poisson model: via the “Poisson dispersion test” [63]. (In a Poisson model the mean and variance are equal as numbers.) The test statistic is proportional to the ratio of sample variance to sample mean. If the Poisson model for mutations were correct for a fixed treatment (or drug combination), but there was a change by isolate in the Poisson parameter with 184 reversal, then there would be evidence for over-dispersed data and thus evidence against a strict Poisson model. Other aspects of the experiment could lead to over-dispersed or under-dispersed numbers of mutations. (Over[under]-dispersion in a model means that the variance is greater [less] than what the model would constrain it to be.) There are some 0s in the sample variances when isolates are pooled within treatments. The ratio of sample variance to sample mean disregards information in the sample mean when the sample variance is 0. This observation and a Taylor series argument not given here led us to use as a test statistic the difference of sample mean and sample variance rather than the usual ratio. On the null hypothesis that the data are Poisson, the difference should be 0 to within noise. Because there are at most five isolates per drug combination, we could not rely on asymptotic distributions computed under the null hypothesis. Instead, we used the parametric bootstrap distribution [62] of the test statistic under the null hypothesis. This amounts to sampling independently from a Poisson distribution with parameter (mean and variance) the average number of mutations observed at the twelfth passage. The resulting distribution is the reference distribution for the cited difference when the null hypothesis is true. We took 1,000 bootstrap samples per drug combination. This approach enabled us to compute p-values for the null hypothesis separately for alternatives of over-dispersion and under-dispersion relative to the Poisson.
When the number of mutations across isolates within a particular passage is hypothesized to have a Poisson distribution and tested as specified, then the p-value for “over-dispersion” is never less than 0.85. However, for the model with “under-dispersion”, the respective p-values are 0.137 for NVP only, 0.147 for NVP+3TC, 0.058 for NVP+ADV, 0.061 for NVP+3TC+ADV, and 0.370 for 3TC+ADV. There were no mutations but V184M reversal (and two other reversals) for the No drug regimen. Clearly, none of the five p- values is less than 0.05. However, when we combine them by Fisher’s technique [65] of summing minus twice the natural logarithms of the p-values and comparing the sum with a chi-square distribution with 10 degrees of freedom, the overall p-value for the null hypothesis of “under-dispersion” comes to 0.03. For this reason we did not use the Poisson model for numbers of mutations. Instead, our test statistic was nonparametric. Given two candidate drug regimes, it was simply the difference between cumulative numbers of mutations, pooled across isolates. The significance of this difference at each passage was assessed by a permutation test [62].
In summary, the first of the two involves a Poisson assumption that is standard for data like ours but that was discarded after careful study.
The second of the two models involves a nonparametric statistic. That is, given two candidate drug regimens, it is simply the difference between cumulative numbers of mutations, pooled across isolates. The significance of this difference at each passage was assessed by a permutation test [62]. That the passages of the isolates are independent conditional on their origin is all that matters for the validity of this second test. Sampling distributions of reversal by isolate ought to be closer for the second and third isolates than for any other pair when they are exposed to the same challenges. With the second of the cited two approaches here, we can assign separate p-values for the null hypothesis of “no difference in mutation rate” versus each of the two alternatives where one treatment produces a greater mutation rate than the other.
The issue of whether 3TC precludes V184M reversal can be approached by means of a 2-by-2 table and Fisher’s exact test [63]. One of rows or columns corresponds to “treatment with 3TC or not” and the other to “reversal” or not. There are 27 isolates (Figure 2).

4. Conclusions

Using a novel in vitro assay and statistical model, we explored useful strategies of combining antiretroviral drugs with potentially divergent effects on the RT substitution M184V, exerting high-level resistance to 3TC.
We noted a pronounced “antimutator effect” when continuing low-dose 3TC while introducing a first-time NNRTI (NVP) in NRTI resistant/NNRTI naïve clinical isolates. Even in the context of high-level resistance, maintaining 3TC pressure prevented reversal M184V in all instances while delaying the emergence of NNRTI resistance. The opposite effect was exerted by ADV; M184V mutant HIV-1 has previously been shown to be hypersusceptible to ADV (as well as its successor, tenofovir) [23].
For improved visualization of HIV evolution and dynamics during serial passage experiments, we summarized in vitro responses to different drug combinations in an innovative fashion using a Serial Passage Integrated Display (“Cube Model”, Figure 2) with 2-by-4 tables based on reversal/no reversal and the number of newly selected mutations per clinical isolate (“cube”).

Acknowledgments

The authors thank three companies for their generosity in supplying compounds for this study: GlaxoSmithKline Inc., USA (3TC, Epivir™), Gilead Sciences Inc. (ADV, Preveon™), and Boehringer Ingelheim Inc. (NVP, Nevirapine™). We especially thank David A. Katzenstein and Robert W. Shafer for their scientific advice and Mark Winters, Kristi Cooley, Aimee Geissler, and Yvette Girard for their excellent technical assistance. We also thank Karen Johnson and Murtaza Alimohamed for helping us with the data assembly and the graphical display of our results. The support of Grant CA59039 from the National Cancer Institute and 8R01 EB002784-28 from the National Institutes of Health are acknowledged with gratitude.

Conflict of Interest

The authors declare no conflict of interest.

References

  1. Camacho, R.; Teofilo, E. Antiretroviral therapy in treatment-naive patients with HIV infection. Current opinion in HIV and AIDS 2011, 6 Suppl 1, S3–S11. [Google Scholar] [CrossRef]
  2. Akanbi, M.O.; Scarci, K.; Taiwo, B.; Murphy, R.L. Combination nucleoside/nucleotide reverse transcriptase inhibitors for treatment of HIV infection. Expert Opin. Pharmacother. 2012, 13, 65–79. [Google Scholar] [CrossRef]
  3. Rouleau, D.; Fortin, C.; Trottier, B.; Lalonde, R.; Lapointe, N.; Cote, P.; Routy, J.P.; Matte, M.F.; Tsarevsky, I.; Baril, J.G. Antiretroviral therapy for adults infected with HIV: Guidelines for health care professionals from the Quebec HIV care committee. Can. J. Infect. Dis. Med. Microbiol. 2011, 22, 52–60. [Google Scholar]
  4. Sierra-Aragon, S.; Walter, H. Targets for inhibition of HIV replication: Entry, enzyme action, release and maturation. Intervirology 2012, 55, 84–97. [Google Scholar] [CrossRef]
  5. Van Rompay, K.K.; Matthews, T.B.; Higgins, J.; Canfield, D.R.; Tarara, R.P.; Wainberg, M.A.; Schinazi, R.F.; Pedersen, N.C.; North, T.W. Virulence and reduced fitness of simian immunodeficiency virus with the M184V mutation in reverse transcriptase. J. Virol. 2002, 76, 6083–6092. [Google Scholar]
  6. McColl, D.J.; Margot, N.; Chen, S.S.; Harris, J.; Borroto-Esoda, K.; Miller, M.D. Reduced emergence of the M184V/I resistance mutation when antiretroviral-naive subjects use emtricitabine versus lamivudine in regimens composed of two NRTIs plus the NNRTI efavirenz. HIV Clin. Trials 2011, 12, 61–70. [Google Scholar] [CrossRef]
  7. Svedhem, V.; Bergroth, T.; Lidman, K.; Sonnerborg, A. Presence of M184I/V in minor HIV-1 populations of patients with lamivudine and/or didanosine treatment failure. HIV Med. 2007, 8, 504–510. [Google Scholar] [CrossRef]
  8. Sarafianos, S.G.; Das, K.; Clark, A.D., Jr.; Ding, J.; Boyer, P.L.; Hughes, S.H.; Arnold, E. Lamivudine (3TC) resistance in HIV-1 reverse transcriptase involves steric hindrance with beta-branched amino acids. Proc. Natl. Acad. Sci. USA 1999, 96, 10027–10032. [Google Scholar]
  9. Wei, X.; Liang, C.; Gotte, M.; Wainberg, M.A. Negative effect of the M184V mutation in HIV-1 reverse transcriptase on initiation of viral DNA synthesis. Virology 2003, 311, 202–212. [Google Scholar] [CrossRef]
  10. Wei, X.; Liang, C.; Gotte, M.; Wainberg, M.A. The M184V mutation in HIV-1 reverse transcriptase reduces the restoration of wild-type replication by attenuated viruses. AIDS (London, England) 2002, 16, 2391–2398. [Google Scholar] [CrossRef]
  11. Diallo, K.; Gotte, M.; Wainberg, M.A. Molecular impact of the M184V mutation in human immunodeficiency virus type 1 reverse transcriptase. Antimicrob. Agents Chemother. 2003, 47, 3377–3383. [Google Scholar] [CrossRef]
  12. Diallo, K.; Brenner, B.; Oliveira, M.; Moisi, D.; Detorio, M.; Gotte, M.; Wainberg, M.A. The M184V substitution in human immunodeficiency virus type 1 reverse transcriptase delays the development of resistance to amprenavir and efavirenz in subtype B and C clinical isolates. Antimicrob. Agents Chemother. 2003, 47, 2376–2379. [Google Scholar]
  13. Gotte, M.; Arion, D.; Parniak, M.A.; Wainberg, M.A. The M184V mutation in the reverse transcriptase of human immunodeficiency virus type 1 impairs rescue of chain-terminated DNA synthesis. J. Virol. 2000, 74, 3579–3585. [Google Scholar] [CrossRef]
  14. Sanjuan, R.; Nebot, M.R.; Chirico, N.; Mansky, L.M.; Belshaw, R. Viral mutation rates. J. Virol. 2010, 84, 9733–9748. [Google Scholar] [CrossRef]
  15. Dapp, M.J.; Holtz, C.M.; Mansky, L.M. Concomitant lethal mutagenesis of human immunodeficiency virus type 1. J. Mol. Biol. 2012, 419, 158–170. [Google Scholar] [CrossRef]
  16. Chen, R.; Quinones-Mateu, M.E.; Mansky, L.M. Drug resistance, virus fitness and HIV-1 mutagenesis. Curr. Pharm. Des. 2004, 10, 4065–4070. [Google Scholar] [CrossRef]
  17. Stumpp, S.N.; Heyn, B.; Brakmann, S. Activity-based selection of HIV-1 reverse transcriptase variants with decreased polymerization fidelity. Biol. Chem. 2010, 391, 665–674. [Google Scholar] [CrossRef]
  18. Wainberg, M.A. The impact of the M184V substitution on drug resistance and viral fitness. Expert Rev. Anti Infect. Ther. 2004, 2, 147–151. [Google Scholar] [CrossRef]
  19. Turner, D.; Brenner, B.G.; Routy, J.P.; Petrella, M.; Wainberg, M.A. Rationale for maintenance of the M184v resistance mutation in human immunodeficiency virus type 1 reverse transcriptase in treatment experienced patients. New Microbiol. 2004, 27, 31–39. [Google Scholar]
  20. Hauser, A.; Mugenyi, K.; Kabasinguzi, R.; Kuecherer, C.; Harms, G.; Kunz, A. Emergence and persistence of minor drug-resistant HIV-1 variants in Ugandan women after nevirapine single-dose prophylaxis. PLoS One 2011, 6. [Google Scholar] [CrossRef]
  21. Petrella, M.; Wainberg, M.A. Might the M184V substitution in HIV-1 RT confer clinical benefit? AIDS Rev. 2002, 4, 224–232. [Google Scholar]
  22. Mansky, L.M.; Cunningham, K.S. Virus mutators and antimutators: Roles in evolution, pathogenesis and emergence. Trends Genet. 2000, 16, 512–517. [Google Scholar] [CrossRef]
  23. Palmer, S.; Margot, N.; Gilbert, H.; Shaw, N.; Buckheit, R., Jr.; Miller, M. Tenofovir, adefovir, and zidovudine susceptibilities of primary human immunodeficiency virus type 1 isolates with non-B subtypes or nucleoside resistance. AIDS Res. Hum. Retrovir. 2001, 17, 1167–1173. [Google Scholar] [CrossRef]
  24. Miller, M.D.; Anton, K.E.; Mulato, A.S.; Lamy, P.D.; Cherrington, J.M. Human immunodeficiency virus type 1 expressing the lamivudine-associated M184V mutation in reverse transcriptase shows increased susceptibility to adefovir and decreased replication capability in vitro. J. Infect. Dis. 1999, 179, 92–100. [Google Scholar] [CrossRef]
  25. Lehmann, E.; D’Abrera, H. Nonparametrics: Statistical Methods based on Ranks; Mcgraw-Hill: New York, NY, USA, 1975; pp. 240–247. [Google Scholar]
  26. Efron, B. Large-Scale Inference: Empirical Bayes Methods for Estimation, Testing, and Prediction; Cambridge University Press: Cambridge, United Kingdom, 2010; Volume 1. [Google Scholar]
  27. Kekitiinwa, A.; Asiimwe, A.R.; Kasirye, P.; Korutaro, V.; Kitaka, S.; Maganda, A.; Madalon, M.; Graziano, F.M. Prospective long-term outcomes of a cohort of ugandan children with laboratory monitoring during antiretroviral therapy. Pediatr. Infect. Dis. J. 2012, 31, e117–e125. [Google Scholar] [CrossRef]
  28. Prosperi, M.C.; De Luca, A. Computational models for prediction of response to antiretroviral therapies. AIDS Rev. 2012, 14, 145–153. [Google Scholar]
  29. Baxter, J.D.; Mayers, D.L.; Wentworth, D.N.; Neaton, J.D.; Hoover, M.L.; Winters, M.A.; Mannheimer, S.B.; Thompson, M.A.; Abrams, D.I.; Brizz, B.J.; et al. A randomized study of antiretroviral management based on plasma genotypic antiretroviral resistance testing in patients failing therapy. CPCRA 046 Study Team for the Terry Beirn Community Programs for Clinical Research on AIDS. AIDS (London, England) 2000, 14, F83–F93. [Google Scholar] [CrossRef]
  30. Hill, A.L.; Rosenbloom, D.I.; Nowak, M.A. Evolutionary dynamics of HIV at multiple spatial and temporal scales. J. Mol. Med. (Berl. Ger.) 2012, 90, 543–561. [Google Scholar] [CrossRef]
  31. Fox, Z.; Dragsted, U.B.; Gerstoft, J.; Phillips, A.N.; Kjaer, J.; Mathiesen, L.; Youle, M.; Katlama, C.; Hill, A.; Bruun, J.N.; et al. A randomized trial to evaluate continuation versus discontinuation of lamivudine in individuals failing a lamivudine-containing regimen: The COLATE trial. Antivir. Ther. 2006, 11, 761–770. [Google Scholar]
  32. Quan, Y.; Brenner, B.G.; Oliveira, M.; Wainberg, M.A. Lamivudine can exert a modest antiviral effect against human immunodeficiency virus type 1 containing the M184V mutation. Antimicrob. Agents Chemother. 2003, 47, 747–754. [Google Scholar]
  33. Rezende, L.F.; Prasad, V.R. Nucleoside-analog resistance mutations in HIV-1 reverse transcriptase and their influence on polymerase fidelity and viral mutation rates. Int. J. Biochem. Cell Biol. 2004, 36, 1716–1734. [Google Scholar]
  34. Keulen, W.; van Wijk, A.; Schuurman, R.; Berkhout, B.; Boucher, C.A. Increased polymerase fidelity of lamivudine-resistant HIV-1 variants does not limit their evolutionary potential. AIDS (London, England) 1999, 13, 1343–1349. [Google Scholar] [CrossRef]
  35. Jonckheere, H.; Witvrouw, M.; de Clercq, E.; Anne, J. Lamivudine resistance of HIV type 1 does not delay development of resistance to nonnucleoside HIV type 1-specific reverse transcriptase inhibitors as compared with wild-type HIV type 1. AIDS Res. Hum. Retrovir. 1998, 14, 249–253. [Google Scholar] [CrossRef]
  36. Balzarini, J.; Pelemans, H.; Karlsson, A.; de Clerc, Q.E.; Kleim, J.P. Concomitant combination therapy for HIV infection preferable over sequential therapy with 3TC and non-nucleoside reverse transcriptase inhibitors. Proc. Natl. Acad. Sci. USA 1996, 93, 13152–13157. [Google Scholar] [CrossRef]
  37. Shafer, R.W.; Hertogs, K.; Zolopa, A.R.; Warford, A.; Bloor, S.; Betts, B.J.; Merigan, T.C.; Harrigan, R.; Larder, B.A. High degree of interlaboratory reproducibility of human immunodeficiency virus type 1 protease and reverse transcriptase sequencing of plasma samples from heavily treated patients. J. Clin. Microbiol. 2001, 39, 1522–1529. [Google Scholar] [CrossRef]
  38. Winters, M.A.; Holodniy, M.; Katzenstein, D.A.; Merigan, T.C. Quantitative RNA and DNA gene amplification can rapidly monitor HIV infection and antiviral activity in cell cultures. PCR Methods Appl. 1992, 1, 257–262. [Google Scholar]
  39. Holodniy, M.; Katzenstein, D.A.; Sengupta, S.; Wang, A.M.; Casipit, C.; Schwartz, D.H.; Konrad, M.; Groves, E.; Merigan, T.C. Detection and quantification of human immunodeficiency virus RNA in patient serum by use of the polymerase chain reaction. J. Infect. Dis. 1991, 163, 862–866. [Google Scholar]
  40. Tang, M.W.; Shafer, R.W. HIV-1 Antiretroviral resistance: Scientific principles and clinical applications. Drugs 2012, 72, e1–e25. [Google Scholar]
  41. Melikian, G.L.; Rhee, S.Y.; Taylor, J.; Fessel, W.J.; Kaufman, D.; Towner, W.; Troia-Cancio, P.V.; Zolopa, A.; Robbins, G.K.; Kagan, R.; Israelski, D.; Shafer, R.W. Standardized comparison of the relative impacts of HIV-1 reverse transcriptase (RT) mutations on nucleoside RT inhibitor susceptibility. Antimicrob. Agents Chemother. 2012, 56, 2305–2313. [Google Scholar] [CrossRef]
  42. Palmer, S.; Shafer, R.W.; Merigan, T.C. Highly drug-resistant HIV-1 clinical isolates are cross-resistant to many antiretroviral compounds in current clinical development. AIDS 1999, 13, 661–667. [Google Scholar]
  43. Paxton, W.B.; Coombs, R.W.; McElrath, M.J.; Keefer, M.C.; Hughes, J.; Sinangil, F.; Chernoff, D.; Demeter, L.; Williams, B.; Corey, L. Longitudinal analysis of quantitative virologic measures in human immunodeficiency virus-infected subjects with > or = 400 CD4 lymphocytes: Implications for applying measurements to individual patients. National Institute of Allergy and Infectious Diseases AIDS Vaccine Evaluation Group. J. Infect. Dis. 1997, 175, 247–254. [Google Scholar] [CrossRef]
  44. Rizzo, R.C.; Tirado-Rives, J.; Jorgensen, W.L. Estimation of binding affinities for HEPT and nevirapine analogues with HIV-1 reverse transcriptase via Monte Carlo simulations. J. Med. Chem. 2001, 44, 145–154. [Google Scholar] [CrossRef]
  45. Delaugerre, C.; Gallien, S.; Flandre, P.; Mathez, D.; Amarsy, R.; Ferret, S.; Timsit, J.; Molina, J.M.; de Truchis, P. Impact of low-level-viremia on HIV-1 drug-resistance evolution among antiretroviral treated-patients. PLoS One 2012, 7. [Google Scholar] [CrossRef]
  46. Messiaen, P.; Verhofstede, C.; Vandenbroucke, I.; Dinakis, S.; Van Eygen, V.; Thys, K.; Winters, B.; Aerssens, J.; Vogelaers, D.; Stuyver, L.J.; Vandekerckhove, L. Ultra-deep sequencing of HIV-1 reverse transcriptase before start of an NNRTI-based regimen in treatment-naive patients. Virology 2012, 426, 7–11. [Google Scholar] [CrossRef]
  47. Murry, J.P.; Higgins, J.; Matthews, T.B.; Huang, V.Y.; van Rompay, K.K.; Pedersen, N.C.; North, T.W. Reversion of the M184V mutation in simian immunodeficiency virus reverse transcriptase is selected by tenofovir, even in the presence of lamivudine. J. Virol. 2003, 77, 1120–1130. [Google Scholar]
  48. Diallo, K.; Oliveira, M.; Moisi, D.; Brenner, B.; Wainberg, M.A.; Gotte, M. Pressure of zidovudine accelerates the reversion of lamivudine resistance-conferring M184V mutation in the reverse transcriptase of human immunodeficiency virus type 1. Antimicrob. Agents Chemother. 2002, 46, 2254–2256. [Google Scholar] [CrossRef]
  49. Mansky, L.M.; Bernard, L.C. 3'-Azido-3'-deoxythymidine (AZT) and AZT-resistant reverse transcriptase can increase the in vivo mutation rate of human immunodeficiency virus type 1. J. Virol. 2000, 74, 9532–9539. [Google Scholar] [CrossRef]
  50. Chen, R.; Yokoyama, M.; Sato, H.; Reilly, C.; Mansky, L.M. Human immunodeficiency virus mutagenesis during antiviral therapy: Impact of drug-resistant reverse transcriptase and nucleoside and nonnucleoside reverse transcriptase inhibitors on human immunodeficiency virus type 1 mutation frequencies. J. Virol. 2005, 79, 12045–12057. [Google Scholar] [CrossRef]
  51. Opravil, M.; Klimkait, T.; Louvel, S.; Wolf, E.; Battegay, M.; Fux, C.A.; Bernasconi, E.; Vogel, M.; Speck, R.; Weber, R. Prior therapy influences the efficacy of lamivudine monotherapy in patients with lamivudine-resistant HIV-1 infection. J. Acquir. Immune Defic. Syndr. (1999) 2010, 54, 51–58. [Google Scholar]
  52. Deeks, S.G.; Wrin, T.; Liegler, T.; Hoh, R.; Hayden, M.; Barbour, J.D.; Hellmann, N.S.; Petropoulos, C.J.; McCune, J.M.; Hellerstein, M.K.; Grant, R.M. Virologic and immunologic consequences of discontinuing combination antiretroviral-drug therapy in HIV-infected patients with detectable viremia. N. Engl. J. Med. 2001, 344, 472–480. [Google Scholar]
  53. Metzner, K.J.; Leemann, C.; di Giallonardo, F.; Grube, C.; Scherrer, A.U.; Braun, D.; Kuster, H.; Weber, R.; Guenthard, H.F. Reappearance of minority K103N HIV-1 variants after interruption of ART initiated during primary HIV-1 infection. PLoS One 2011, 6. [Google Scholar] [CrossRef] [Green Version]
  54. Paquet, A.C.; Baxter, J.; Weidler, J.; Lie, Y.; Lawrence, J.; Kim, R.; Bates, M.; Coakley, E.; Chappey, C. Differences in reversion of resistance mutations to wild-type under structured treatment interruption and related increase in replication capacity. PLoS One 2011, 6. [Google Scholar] [CrossRef]
  55. Campbell, T.B.; Shulman, N.S.; Johnson, S.C.; Zolopa, A.R.; Young, R.K.; Bushman, L.; Fletcher, C.V.; Lanier, E.R.; Merigan, T.C.; Kuritzkes, D.R. Antiviral activity of lamivudine in salvage therapy for multidrug-resistant HIV-1 infection. Clin. Infect. Dis. 2005, 41, 236–242. [Google Scholar]
  56. Lecossier, D.; Shulman, N.S.; Morand-Joubert, L.; Shafer, R.W.; Joly, V.; Zolopa, A.R.; Clavel, F.; Hance, A.J. Detection of minority populations of HIV-1 expressing the K103N resistance mutation in patients failing nevirapine. J. Acquir. Immune Defic. Syndr. (1999) 2005, 38, 37–42. [Google Scholar] [CrossRef]
  57. Shulman, N.S.; Zolopa, A.R.; Passaro, D.J.; Murlidharan, U.; Israelski, D.M.; Brosgart, C.L.; Miller, M.D.; Van Doren, S.; Shafer, R.W.; Katzenstein, D.A. Efavirenz- and adefovir dipivoxil-based salvage therapy in highly treatment-experienced patients: Clinical and genotypic predictors of virologic response. J. Acquir. Immune Defic. Syndr. (1999) 2000, 23, 221–226. [Google Scholar]
  58. Winters, M.A.; Schapiro, J.M.; Lawrence, J.; Merigan, T.C. Human immunodeficiency virus type 1 protease genotypes and in vitro protease inhibitor susceptibilities of isolates from individuals who were switched to other protease inhibitors after long-term saquinavir treatment. J. Virol. 1998, 72, 5303–5306. [Google Scholar]
  59. Nijhuis, M.; Boucher, C.A.; Schuurman, R. Sensitive procedure for the amplification of HIV-1 RNA using a combined reverse-transcription and amplification reaction. Biotechniques 1995, 19, 178–180, 182. [Google Scholar]
  60. Schapiro, J.M.; Winters, M.A.; Stewart, F.; Efron, B.; Norris, J.; Kozal, M.J.; Merigan, T.C. The effect of high-dose saquinavir on viral load and CD4+ T-cell counts in HIV-infected patients. Ann. Internal Med. 1996, 124, 1039–1050. [Google Scholar]
  61. Winters, M.A.; Coolley, K.L.; Girard, Y.A.; Levee, D.J.; Hamdan, H.; Shafer, R.W.; Katzenstein, D.A.; Merigan, T.C. A 6-basepair insert in the reverse transcriptase gene of human immunodeficiency virus type 1 confers resistance to multiple nucleoside inhibitors. J. Clin. Invest. 1998, 102, 1769–1775. [Google Scholar] [CrossRef]
  62. Efron, B.; Tibshirani, R.J. An Introduction to the Bootstrap; Chapman & Hall/CRC: New York, NY, USA, 1993; Volume 57. [Google Scholar]
  63. Rice, J.A. Mathematical Statistics and Data Analysis, 3rd ed; Thompson Higher Education: Belmont, CA, USA, 2006. [Google Scholar]
  64. Raikov, D. On the decomposition of Gauss and Poisson laws (in Russian). Izv. Ross. Akad. Nauk. Ser. Mat. 1938, 2, 91–124. [Google Scholar]
  65. Fisher, R. Statistical Methods for Research Workers, 19th ed; Oliver and Boyd: Edinburgh, Scotland, UK, 1963. [Google Scholar]

