
Perturbation of Human T-Cell Leukemia Virus Type 1 Particle Morphology by Differential Gag Co-Packaging

Abstract
:
1. Introduction
2. Materials and Methods
2.1. Production and Purification of HTLV-1-Like Particles
2.2. Cryogenic Transmission Electron Microscopy Analysis of HTLV-1-Like Particles
2.3. Measurement of Virus-Like Particle Size
2.4. Fluorescence Fluctuation Spectroscopy, Experimental Setup, and Data Analysis
2.5. Scanning Transmission Electron Microscopy Mass Measurements of Virus-Like Particles
2.6. Protein and RNA Content of HTLV-1 Virus-Like Particles
3. Results
3.1. Morphology of HTLV-1-Like Particles
3.2. Gag Stoichiometry of HTLV-1-Like Particles Determined by Fluorescence Fluctuation Spectroscopy
3.3. Virus-Like Particles Diameter as Determined by FFS
3.4. Scanning Transmission Electro Microscopy Analysis of HTLV-1-Like Particle Mass
3.5. Scanning Transmission Electron Microscopy Determination of Gag Stoichiometry in HTLV-1-Like Particles
4. Discussion
5. Conclusions
Acknowledgments
Author Contributions
Conflicts of Interest
References
- Gessain, A.; Barin, F.; Vernant, J.C.; Gout, O.; Maurs, L.; Calender, A.; de The, G. Antibodies to human T-lymphotropic virus type-1 in patients with tropical spastic paraparesis. Lancet 1985, 2, 407–410. [Google Scholar] [CrossRef]
- Osame, M.; Usuku, K.; Izumo, S.; Ijichi, N.; Amitani, H.; Igata, A.; Matsumoto, M.; Tara, M. HTLV-1 associated myelopathy, a new clinical entity. Lancet 1986, 1, 1031–1032. [Google Scholar] [CrossRef]
- De The, G.; Bomford, R. An HTLV-1 vaccine: Why, how, for whom? AIDS Res. Hum. Retrovir. 1993, 9, 381–386. [Google Scholar] [CrossRef] [PubMed]
- Gessain, A.; Cassar, O. Epidemiological aspects and world distribution of HTLV-1 infection. Front. Microbiol. 2012, 3, 388. [Google Scholar] [CrossRef] [PubMed]
- Yoshida, M.; Seiki, M.; Yamaguchi, K.; Takatsuki, K. Monoclonal integration of human T-cell leukemia provirus in all primary tumors of adult T-cell leukemia suggests causative role of human T-cell leukemia virus in the disease. Proc. Natl. Acad. Sci. USA 1984, 81, 2534–2537. [Google Scholar] [CrossRef] [PubMed]
- Kaplan, J.E.; Osame, M.; Kubota, H.; Igata, A.; Nishitani, H.; Maeda, Y.; Khabbaz, R.F.; Janssen, R.S. The risk of development of HTLV-1-associated myelopathy/tropical spastic paraparesis among persons infected with HTLV-1. J. Acquir. Immune Defic. Syndr. 1990, 3, 1096–1101. [Google Scholar] [PubMed]
- Wills, J.W.; Craven, R.C. Form, function, and use of retroviral Gag proteins. AIDS 1991, 5, 639–654. [Google Scholar] [CrossRef] [PubMed]
- Jouvenet, N.; Simon, S.M.; Bieniasz, P.D. Imaging the interaction of HIV-1 genomes and Gag during assembly of individual viral particles. Proc. Natl. Acad. Sci. USA 2009, 106, 19114–19119. [Google Scholar] [CrossRef] [PubMed]
- Hirokawa, N.; Noda, Y. Intracellular transport and kinesin superfamily proteins, KIFS: Structure, function, and dynamics. Physiol. Rev. 2008, 88, 1089–1118. [Google Scholar] [CrossRef] [PubMed]
- Maldonado, J.; Martin, J.; Mueller, J.; Zhang, W.; Mansky, L. New insights into retroviral Gag-Gag and Gag-membrane interactions. Front. Microbiol. 2014, 5, 302. [Google Scholar] [CrossRef] [PubMed]
- Sonnino, S.; Prinetti, A. Membrane domains and the lipid raft concept. Curr. Med. Chem. 2013, 20, 4–21. [Google Scholar] [PubMed]
- Le Blanc, I.; Grange, M.P.; Delamarre, L.; Rosenberg, A.R.; Blot, V.; Pique, C.; Dokhelar, M.C. HTLV-1 structural proteins. Virus Res. 2001, 78, 5–16. [Google Scholar] [CrossRef]
- Ootsuyama, Y.; Shimotohno, K.; Miwa, M.; Oroszlan, S.; Sugimura, T. Myristylation of Gag protein in human T-cell leukemia virus type-1 and type-2. Jpn. J. Cancer Res. 1985, 76, 1132–1135. [Google Scholar] [PubMed]
- Resh, M.D. Fatty acylation of proteins: New insights into membrane targeting of myristoylated and palmitoylated proteins. Biochim. Biophys. Acta 1999, 1451, 1–16. [Google Scholar] [CrossRef]
- Li, H.; Dou, J.; Ding, L.; Spearman, P. Myristoylation is required for human immunodeficiency virus type 1 Gag-Gag multimerization in mammalian cells. J. Virol. 2007, 81, 12899–12910. [Google Scholar] [CrossRef] [PubMed]
- Gamble, T.R.; Yoo, S.; Vajdos, F.F.; von Schwedler, U.K.; Worthylake, D.K.; Wang, H.; McCutcheon, J.P.; Sundquist, W.I.; Hill, C.P. Structure of the carboxyl-terminal dimerization domain of the HIV-1 capsid protein. Science 1997, 278, 849–853. [Google Scholar] [CrossRef] [PubMed]
- Rayne, F.; Bouamr, F.; Lalanne, J.; Mamoun, R.Z. The NH2-terminal domain of the human T-cell leukemia virus type 1 capsid protein is involved in particle formation. J. Virol. 2001, 75, 5277–5287. [Google Scholar] [CrossRef] [PubMed]
- Burniston, M.T.; Cimarelli, A.; Colgan, J.; Curtis, S.P.; Luban, J. Human immunodeficiency virus type 1 Gag polyprotein multimerization requires the nucleocapsid domain and RNA and is promoted by the capsid-dimer interface and the basic region of matrix protein. J. Virol. 1999, 73, 8527–8540. [Google Scholar] [PubMed]
- Khorchid, A.; Halwani, R.; Wainberg, M.A.; Kleiman, L. Role of RNA in facilitating Gag/Gag-Pol interaction. J. Virol. 2002, 76, 4131–4137. [Google Scholar] [CrossRef] [PubMed]
- Fogarty, K.H.; Chen, Y.; Grigsby, I.F.; Macdonald, P.J.; Smith, E.M.; Johnson, J.L.; Rawson, J.M.; Mansky, L.M.; Mueller, J.D. Characterization of cytoplasmic Gag-Gag interactions by dual-color z-scan fluorescence fluctuation spectroscopy. Biophys. J. 2011, 100, 1587–1595. [Google Scholar] [CrossRef] [PubMed]
- O’Carroll, I.P.; Crist, R.M.; Mirro, J.; Harvin, D.; Soheilian, F.; Kamata, A.; Nagashima, K.; Rein, A. Functional redundancy in HIV-1 viral particle assembly. J. Virol. 2012, 86, 12991–12996. [Google Scholar] [CrossRef] [PubMed]
- O’Carroll, I.P.; Soheilian, F.; Kamata, A.; Nagashima, K.; Rein, A. Elements in HIV-1 Gag contributing to virus particle assembly. Virus Res. 2013, 171, 341–345. [Google Scholar] [CrossRef] [PubMed]
- Demirov, D.G.; Freed, E.O. Retrovirus budding. Virus Res. 2004, 106, 87–102. [Google Scholar] [CrossRef] [PubMed]
- Morita, E.; Sundquist, W.I. Retrovirus budding. Annu. Rev. Cell Dev. Biol. 2004, 20, 395–425. [Google Scholar] [CrossRef] [PubMed]
- Coffin, J.M.; Hughes, S.H.; Varmus, H.E. The interactions of retroviruses and their hosts. In Retroviruses; Coffin, J.M., Hughes, S.H., Varmus, H.E., Eds.; Cold Spring Harbor Laboratory Press: Cold Spring Harbor, NY, USA, 1997. [Google Scholar]
- Grigsby, I.F.; Zhang, W.; Johnson, J.L.; Fogarty, K.H.; Chen, Y.; Rawson, J.M.; Crosby, A.J.; Mueller, J.D.; Mansky, L.M. Biophysical analysis of HTLV-1 particles reveals novel insights into particle morphology and Gag stochiometry. Retrovirology 2010, 7, 75. [Google Scholar] [CrossRef] [PubMed]
- Maldonado, J.O.; Cao, S.; Zhang, W.; Mansky, L.M. Distinct morphology of human T-cell leukemia virus type 1-like particles. Viruses 2016, 8. [Google Scholar] [CrossRef] [PubMed]
- Vogt, V.M.; Simon, M.N. Mass determination of Rous sarcoma virus virions by scanning transmission electron microscopy. J. Virol. 1999, 73, 7050–7055. [Google Scholar] [PubMed]
- Yu, F.; Joshi, S.M.; Ma, Y.M.; Kingston, R.L.; Simon, M.N.; Vogt, V.M. Characterization of Rous sarcoma virus Gag particles assembled in vitro. J. Virol. 2001, 75, 2753–2764. [Google Scholar] [CrossRef] [PubMed]
- Briggs, J.A.; Johnson, M.C.; Simon, M.N.; Fuller, S.D.; Vogt, V.M. Cryo-electron microscopy reveals conserved and divergent features of Gag packing in immature particles of Rous sarcoma virus and human immunodeficiency virus. J. Mol. Biol. 2006, 355, 157–168. [Google Scholar] [CrossRef] [PubMed]
- Briggs, J.A.; Simon, M.N.; Gross, I.; Krausslich, H.G.; Fuller, S.D.; Vogt, V.M.; Johnson, M.C. The stoichiometry of Gag protein in HIV-1. Nat. Struct. Mol. Biol. 2004, 11, 672–675. [Google Scholar] [CrossRef] [PubMed]
- Briggs, J.A.; Watson, B.E.; Gowen, B.E.; Fuller, S.D. Cryoelectron microscopy of mouse mammary tumor virus. J. Virol. 2004, 78, 2606–2608. [Google Scholar] [CrossRef] [PubMed]
- Carlson, L.A.; Briggs, J.A.; Glass, B.; Riches, J.D.; Simon, M.N.; Johnson, M.C.; Muller, B.; Grunewald, K.; Krausslich, H.G. Three-dimensional analysis of budding sites and released virus suggests a revised model for HIV-1 morphogenesis. Cell Host Microbe 2008, 4, 592–599. [Google Scholar] [CrossRef] [PubMed]
- Parker, S.D.; Wall, J.S.; Hunter, E. Analysis of Mason-Pfizer monkey virus Gag particles by scanning transmission electron microscopy. J. Virol. 2001, 75, 9543–9548. [Google Scholar] [CrossRef] [PubMed]
- Fuller, S.D.; Wilk, T.; Gowen, B.E.; Krausslich, H.G.; Vogt, V.M. Cryo-electron microscopy reveals ordered domains in the immature HIV-1 particle. Curr. Biol. 1997, 7, 729–738. [Google Scholar] [CrossRef]
- Yeager, M.; Wilson-Kubalek, E.M.; Weiner, S.G.; Brown, P.O.; Rein, A. Supramolecular organization of immature and mature murine leukemia virus revealed by electron cryo-microscopy: Implications for retroviral assembly mechanisms. Proc. Natl. Acad. Sci. USA 1998, 95, 7299–7304. [Google Scholar] [CrossRef] [PubMed]
- Chen, Y.; Wu, B.; Musier-Forsyth, K.; Mansky, L.M.; Mueller, J.D. Fluorescence fluctuation spectroscopy on viral-like particles reveals variable Gag stoichiometry. Biophys. J. 2009, 96, 1961–1969. [Google Scholar] [CrossRef] [PubMed]
- Baker, T.S.; Olson, N.H.; Fuller, S.D. Adding the third dimension to virus life cycles: Three-dimensional reconstruction of icosahedral viruses from cryo-electron micrographs. Microbiol. Mol. Biol. Rev. 1999, 63, 862–922. [Google Scholar] [CrossRef] [PubMed]
- Johnson, J.; Chen, Y.; Mueller, J.D. Characterization of brightness and stoichiometry of bright particles by flow-fluorescence fluctuation spectroscopy. Biophys. J. 2010, 99, 3084–3092. [Google Scholar] [CrossRef] [PubMed]
- Zacharias, D.A.; Violin, J.D.; Newton, A.C.; Tsien, R.Y. Partitioning of lipid-modified monomeric GFPs into membrane microdomains of live cells. Science 2002, 296, 913–916. [Google Scholar] [CrossRef] [PubMed]
- Chen, Y.; Wei, L.N.; Muller, J.D. Probing protein oligomerization in living cells with fluorescence fluctuation spectroscopy. Proc. Natl. Acad. Sci. USA 2003, 100, 15492–15497. [Google Scholar] [CrossRef] [PubMed]
- Chen, Y.; Johnson, J.; Macdonald, P.; Wu, B.; Mueller, J.D. Observing protein interactions and their stoichiometry in living cells by brightness analysis of fluorescence fluctuation experiments. Methods Enzymol. 2010, 472, 345–363. [Google Scholar] [PubMed]
- Chirico, G.; Bettati, S.; Mozzarelli, A.; Chen, Y.; Muller, J.D.; Gratton, E. Molecular heterogeneity of o-acetylserine sulfhydrylase by two-photon excited fluorescence fluctuation spectroscopy. Biophys. J. 2001, 80, 1973–1985. [Google Scholar] [CrossRef]
- Wall, J.S.; Hainfeld, J.F.; Simon, M.N. Scanning transmission electron microscopy of nuclear structures. Methods Cell Biol. 1998, 53, 139–164. [Google Scholar] [PubMed]
- Namba, K.; Stubbs, G. Structure of tobacco mosaic virus at 3.6 Å resolution: Implications for assembly. Science 1986, 231, 1401–1406. [Google Scholar] [CrossRef] [PubMed]
- Freeman, R.; Leonard, K.R. Comparative mass measurement of biological macromolecules by scanning transmission electron microscopy. J. Microsc. 1981, 122, 275–286. [Google Scholar] [CrossRef] [PubMed]
- Müller, S.A.; Goldie, K.N.; Bürki, R.; Häring, R.; Engel, A. Factors influencing the precision of quantitative scanning transmission electron microscopy. Ultramicroscopy 1992, 46, 317–334. [Google Scholar] [CrossRef]
- Thomas, D.; Schultz, P.; Steven, A.C.; Wall, J.S. Mass analysis of biological macromolecular complexes by stem. Biol. Cell 1994, 80, 181–192. [Google Scholar] [CrossRef] [PubMed]
- Cockburn, J.J.; Abrescia, N.G.; Grimes, J.M.; Sutton, G.C.; Diprose, J.M.; Benevides, J.M.; Thomas, G.J., Jr.; Bamford, J.K.; Bamford, D.H.; Stuart, D.I. Membrane structure and interactions with protein and DNA in bacteriophage PRD1. Nature 2004, 432, 122–125. [Google Scholar] [CrossRef] [PubMed]
- Fleissner, E. Chromatographic separation and antigenic analysis of proteins of the oncornaviruses. I. Avian leukemia-sarcoma viruses. J. Virol. 1971, 8, 778–785. [Google Scholar] [PubMed]
- Poiesz, B.J.; Ruscetti, F.W.; Gazdar, A.F.; Bunn, P.A.; Minna, J.D.; Gallo, R.C. Detection and isolation of type C retrovirus particles from fresh and cultured lymphocytes of a patient with cutaneous T-cell lymphoma. Proc. Natl. Acad. Sci. USA 1980, 77, 7415–7419. [Google Scholar] [CrossRef] [PubMed]
- Poiesz, B.J.; Ruscetti, F.W.; Reitz, M.S.; Kalyanaraman, V.S.; Gallo, R.C. Isolation of a new type C retrovirus (HTLV) in primary uncultured cells of a patient with Sezary T-cell leukaemia. Nature 1981, 294, 268–271. [Google Scholar] [CrossRef] [PubMed]
- Martin, J.L.; Maldonado, J.O.; Mueller, J.D.; Zhang, W.; Mansky, L.M. Molecular studies of HTLV-1 replication: An update. Viruses 2016, 8. [Google Scholar] [CrossRef] [PubMed]
- Cao, S.; Maldonado, J.O.; Grigsby, I.F.; Mansky, L.M.; Zhang, W. Analysis of human T-cell leukemia virus type 1 particles by using cryo-electron tomography. J. Virol. 2015, 89, 2430–2435. [Google Scholar] [CrossRef] [PubMed]
- Shehu-Xhilaga, M.; Crowe, S.M.; Mak, J. Maintenance of the Gag/Gag-Pol ratio is important for human immunodeficiency virus type 1 RNA dimerization and viral infectivity. J. Virol. 2001, 75, 1834–1841. [Google Scholar] [CrossRef] [PubMed]
- Johnson, S.F.; Collins, J.T.; D’Souza, V.M.; Telesnitsky, A. Determinants of moloney murine leukemia virus Gag-Pol and genomic RNA proportions. J. Virol. 2014, 88, 7267–7275. [Google Scholar] [CrossRef] [PubMed]


| Measurement | HTLV-1 Like Particle | ||
|---|---|---|---|
| Gag-YFP | Gag:Gag-YFP (3:1) | ||
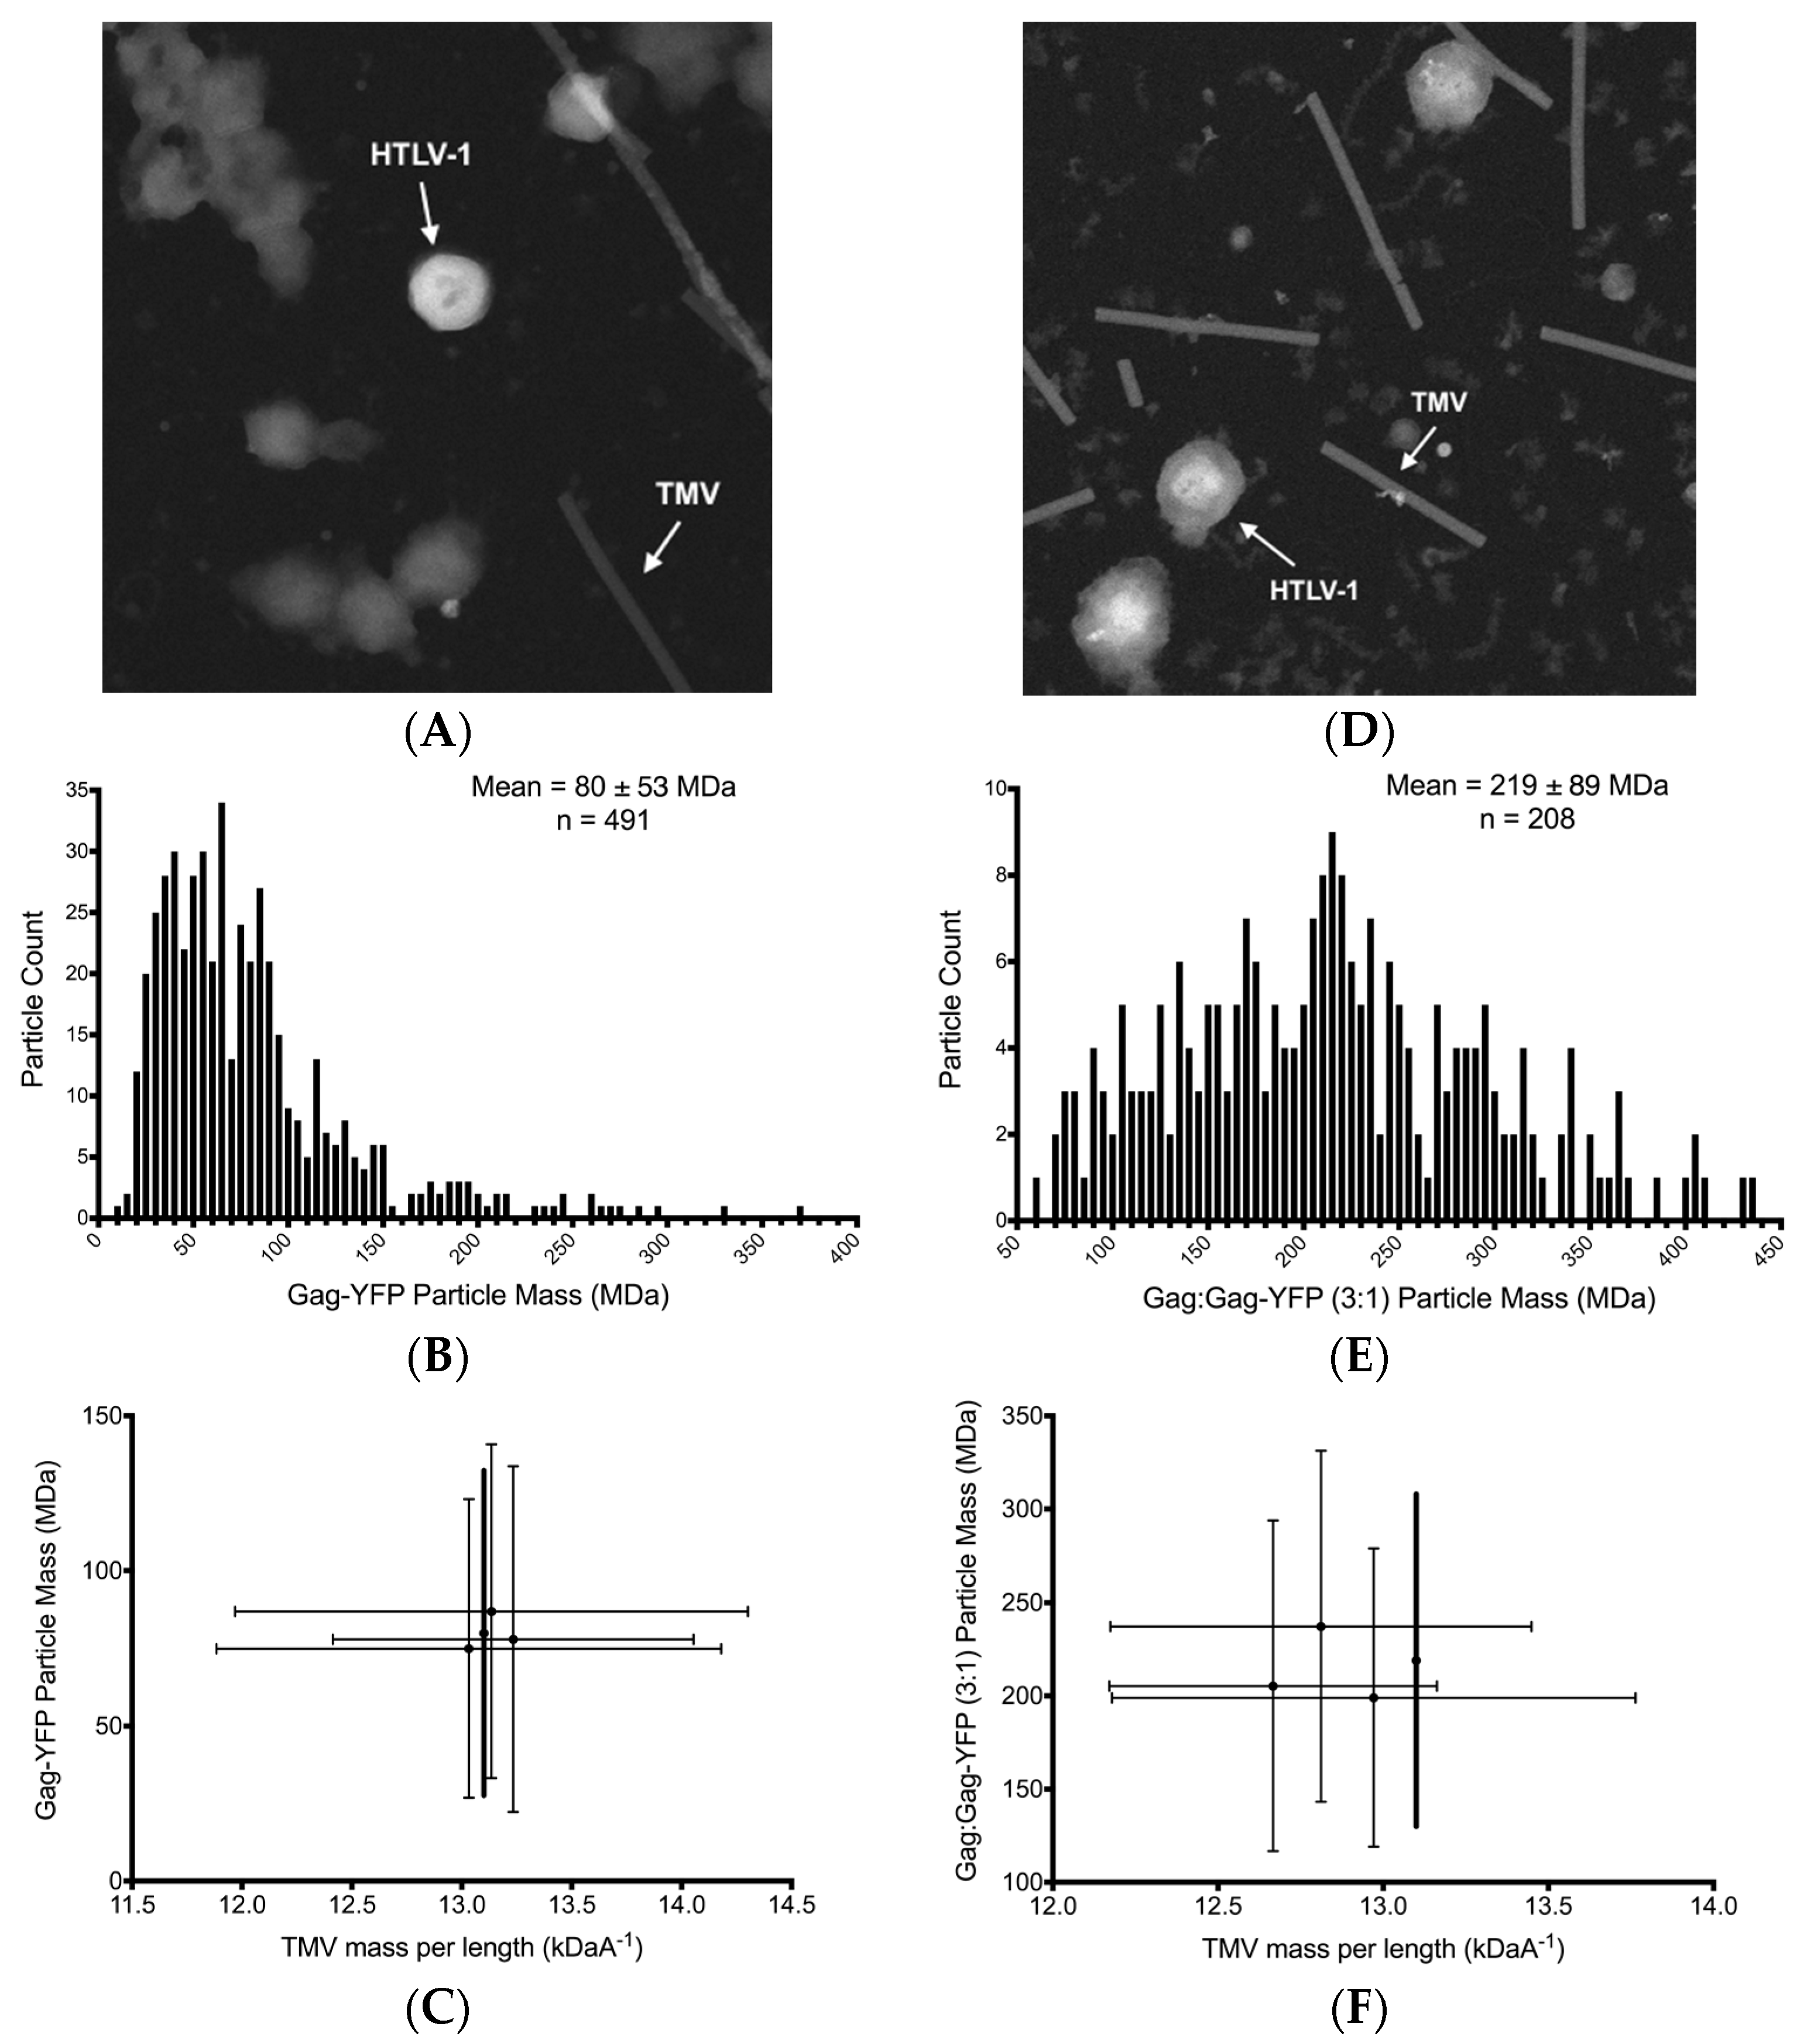
| Average Diameter (nm) a | 83 | 113 | |
| Average Particle Mass (MDa) b | 80 | 219 | |
| Mass of RNA, Lipid and Protein (MDa) | RNA c | 2.4 | 6.6 |
| Lipid d | 36 | 80 | |
| Total protein e | 42 | 133 | |
| Mass of Gag Molecules (MDa) | Total Gag polyprotein f | 29–38 | 93–120 |
| Gag | - | 70–90 | |
| Gag-YFP | 29–38 | 23–30 | |
| Gag polyprotein copy number g | 360–480 | 1600–2100 | |
© 2017 by the authors. Licensee MDPI, Basel, Switzerland. This article is an open access article distributed under the terms and conditions of the Creative Commons Attribution (CC BY) license (http://creativecommons.org/licenses/by/4.0/).
Share and Cite
Maldonado, J.O.; Angert, I.; Cao, S.; Berk, S.; Zhang, W.; Mueller, J.D.; Mansky, L.M. Perturbation of Human T-Cell Leukemia Virus Type 1 Particle Morphology by Differential Gag Co-Packaging. Viruses 2017, 9, 191. https://doi.org/10.3390/v9070191
Maldonado JO, Angert I, Cao S, Berk S, Zhang W, Mueller JD, Mansky LM. Perturbation of Human T-Cell Leukemia Virus Type 1 Particle Morphology by Differential Gag Co-Packaging. Viruses. 2017; 9(7):191. https://doi.org/10.3390/v9070191
Chicago/Turabian StyleMaldonado, José O., Isaac Angert, Sheng Cao, Serkan Berk, Wei Zhang, Joachim D. Mueller, and Louis M. Mansky. 2017. "Perturbation of Human T-Cell Leukemia Virus Type 1 Particle Morphology by Differential Gag Co-Packaging" Viruses 9, no. 7: 191. https://doi.org/10.3390/v9070191