Article

Prediction of Drug-Drug Interactions with Bupropion and Its Metabolites as CYP2D6 Inhibitors Using a Physiologically-Based Pharmacokinetic Model

Department of Clinical Pharmacy and Pharmaceutical Management, School of Pharmacy, Fudan University, 826 Zhangheng Road, Shanghai 201203, China
*
Author to whom correspondence should be addressed.
These authors contributed equally to this work.
Pharmaceutics 2018, 10(1), 1; https://doi.org/10.3390/pharmaceutics10010001
Submission received: 31 October 2017 / Revised: 5 December 2017 / Accepted: 19 December 2017 / Published: 21 December 2017
(This article belongs to the Special Issue Preclinical Pharmacokinetics and Bioanalysis)

Abstract

:
The potential of inhibitory metabolites of perpetrator drugs to contribute to drug-drug interactions (DDIs) is uncommon and underestimated. However, the occurrence of unexpected DDI suggests the potential contribution of metabolites to the observed DDI. The aim of this study was to develop a physiologically-based pharmacokinetic (PBPK) model for bupropion and its three primary metabolites—hydroxybupropion, threohydrobupropion and erythrohydrobupropion—based on a mixed “bottom-up” and “top-down” approach and to contribute to the understanding of the involvement and impact of inhibitory metabolites for DDIs observed in the clinic. PK profiles from clinical researches of different dosages were used to verify the bupropion model. Reasonable PK profiles of bupropion and its metabolites were captured in the PBPK model. Confidence in the DDI prediction involving bupropion and co-administered CYP2D6 substrates could be maximized. The predicted maximum concentration (Cmax) area under the concentration-time curve (AUC) values and Cmax and AUC ratios were consistent with clinically observed data. The addition of the inhibitory metabolites into the PBPK model resulted in a more accurate prediction of DDIs (AUC and Cmax ratio) than that which only considered parent drug (bupropion) P450 inhibition. The simulation suggests that bupropion and its metabolites contribute to the DDI between bupropion and CYP2D6 substrates. The inhibitory potency from strong to weak is hydroxybupropion, threohydrobupropion, erythrohydrobupropion, and bupropion, respectively. The present bupropion PBPK model can be useful for predicting inhibition from bupropion in other clinical studies. This study highlights the need for caution and dosage adjustment when combining bupropion with medications metabolized by CYP2D6. It also demonstrates the feasibility of applying the PBPK approach to predict the DDI potential of drugs undergoing complex metabolism, especially in the DDI involving inhibitory metabolites.

Graphical Abstract

1. Introduction

Metabolized drug-drug interactions (mDDIs) have been one of the main reasons for the failure of new drug research and development; a variety of drugs have been forced to withdraw from the market due to serious DDIs [1,2,3,4]. With the increasing and development of new drugs and usage, clinical combination therapy has become very common and inevitably increases the probability of occurrence of DDI. Consequently, evaluation of a potential risk of mDDIs is essential to improve safety and minimize the clinical risks associated with drug interactions [5].
In general, metabolites are formed primarily via metabolic enzymes, which play an important role in pharmacological activity and toxicity. Compared to the parent drug, it is generally considered less likely to cause metabolized drug interactions due to more polarity. In vitro studies of parent drugs are sufficient to avoid DDI risks [6].
However, it has recently been found that some important metabolites of inhibitors also have inhibitory effects [6,7,8]. In the latest Food and Drug Administration (FDA) draft guidance [9], it is explicitly stated that metabolites should be studied in DDI if the metabolite’s area under the plasma concentration-time curve (AUC) is greater than or equal to 25% of the parent AUC (AUCm/AUCp ≥ 0.25). The European Medicines Agency (EMA) further emphasizes that, for metabolites with AUCm/AUCp > 0.25 and represent >10% of total drug-related material [10], it is recommended to evaluate their DDI. In addition, regulators are also strongly proposing to predict and understand potential clinical DDI from the perspective of physiologically-based pharmacokinetic (PBPK), especially those complex DDIs [9,10,11]. The PBPK model provides a dynamic method for evaluation of DDI based on the physiological mechanism [12,13,14,15]. Compared with the static approach, it is reasonable to anticipate that the dynamic model is more accurate in the predication of DDIs, such as simultaneous inhibition and induction [16,17], the DDI of both substrate and inhibitory metabolites [15,18,19] and multiple DDIs. Recently, PBPK models have been widely applied in research and development, and even some good models are accepted by regulatory agencies and can be used to exempt some clinical trials [11,20,21,22,23].
Bupropion is widely used in the treatment of major depressive disorder and smoking cessation. As a classical probe substrate for CYP2B6, it is metabolized to hydroxybupropion. In human, carbonyl reductase also plays an important role in the metabolism of bupropion. Threohydrobupropion and erythrohydrobupropion are two major metabolites produced by the reduction of the carbonyl group [24,25,26,27] (Figure 1). Although bupropion is not a substrate for CYP2D6, it also inhibits CYP2D6 activity [27,28]. Clinical studies have shown that there is a significant increase in substrate exposure when bupropion was administered in combination with substrates for CYP2D6. For desipramine, a five-fold increase in exposure was caused [29]. However, in vitro studies have shown that bupropion and hydroxybupropion are weak CYP2D6 inhibitors (IC50 = 58 and 74 μM, respectively) [27]. Thus, bupropion was chosen as the model drug. To better understand the complex DDI, a PBPK model was taken in the present study.
The objectives of the present work are (1) to build a PBPK model that can describe the PK profile of bupropion, hydroxybupropion, threohydrobupropion and erythrohydrobupropion; (2) to verify the bupropion PBPK model on the basis of the results of different-dose bupropion PK studies; and ultimately (3) to apply the PBPK model to predict the clinically observed DDIs with bupropion and its metabolites as the CYP2D6 inhibitors, and to better understand the involvement and impact of inhibitory metabolites for DDIs.

2. Materials and Methods

2.1. Physiologically-Based Pharmacokinetic (PBPK) Model Development

The Simcyp software package version 15 (Simcyp Limited, a Certara company, Sheffield, UK) was used to develop the PBPK model of bupropion and its metabolites. The absorption and distribution of bupropion was described by the first-order absoption and full PBPK model. For other metabolites, a minimal PBPK model were used to describe their distribution. To better predict the DDIs involving bupropion and its metabolites as CYP2D6 inhibitors, the model was first developed to simulate the PK of bupropion, hydroxybupropion, threohydrobupropion and erythrohydrobupropion when bupropion was given in different doses. Then, the verified model was used for the prediction of the involvement and impact of inhibitory metabolites in DDIs. Bufuralol, tolterodine, metoprolol, desipramine, and dextromethorphan as the CYP2D6 substrates from the Simcyp simulator library were used to simulate the DDIs. In addition, the PBPK model of venlafaxine was also built to simulate the DDI with bupropion. The observed clinical data were digitized from the graphs provided in literature using DigIt version 1.04 (Simulations Plus, Inc., Lancaster, CA, USA), a plot digitizer tool.

2.2. PBPK Model for Bupropion

The physicochemical properties of bupropion, including molecular weight, logP, pKa, blood-to-plasma ratio and fraction unbound in plasma were obtained from literature and in silico prediction as listed in Table 1. Bupropion binding to human plasma protein is 82% to 88%. Its absorption was described with a first-order absorption model. It has been reported that the absorption of bupropion is close to 100% [26]. A full PBPK model was used to describe the distribution of bupropion. The distribution of bupropion was predicted with Rogers method [30] based on the fitted Kp scalar to comparable to the observed value of 19 L/kg [31]. Bupropion is mainly metabolized by the liver and less than 1% of the parent drug is found in the urine [26,29]. According to the in vitro studies [27,32,33] with human liver microsomes, the enzyme kinetic parameters (Vmax and Km) of bupropion to form hydroxybupropion, threohydrobupropion and erythrohydrobupropion were integrated into the model. Considering the other metabolic pathways of bupropion, the formation of threohydrobupropion and erythrohydrobupropion were by carbonyl reductase. Therefore, in this model, we assumed that threohydrobupropion and erythrohydrobupropion were cleared likewise by CYP2B6. The fu,mic is used to correct the expression of carbonyl reductase to obtain the best simulation results closest to observed data.

2.3. PBPK Model for Hydroxybupropion, Threohydrobupropion and Erythrohydrobupropion

The physicochemical properties of the three metabolites were obtained from in silico prediction. The distribution of metabolite hydroxybupropion, threohydrobupropion and erythrohydrobupropion were described by a minimal-PBPK distribution model with tissue partition coefficients predicted by the Rodgers method [30]. A single adjusting compartment in Simcyp optimized the Vss of hydroxybupropion and threohydrobupropion. The elimination of all metabolites are fitted based on the corresponding observed clinical data. The corresponding parameters are listed in Table 2.

2.4. PBPK Model for Venlafaxine

In addition, venlafaxine was also used as a CYP2D6 substrate to run the simulation with bupropion. To simulate the DDI between bupropion with venlafaxine, a PBPK model for venlafaxine was developed. The model of venlafaxine was built by a minimal PBPK model with tissue partition coefficients predicted by the Poulin and Theil method [35] combined with a first order absorption. The model parameters of venlafaxine are placed in Table 3. An oral absorption up to 92% was found. The Kp scalar of 2.3 was used to predict the Vss comparable to the observed value of 7 L/kg [36,37,38]. The plasma protein binding of venlafaxine is low at 27% [37]. There is a consensus that the metabolic pathway of venlafaxine is mediated predominantly by CYP2D6. The CYP2C19, 2C9, and 3A4 isoforms also play a role in the metabolism of the drug, but to a lesser extent. The elimination of venlafaxine is fitted based on the corresponding observed clinical data. The intrinsic clearance (Clint) was calculated using retrograde model, assuming 80% Hep CL via CYP2D6 [39].

2.5. Simcyp Simulation

The Simcyp software package version 15 (Simcyp Limited, a Certara company, Sheffield, UK) was used to build and develop the PBPK model of bupropion and its metabolites. The model parameters mentioned above were integrated into the PBPK model to simulate PK and DDI. The healthy volunteer population database in the Simcyp simulator is a powerful capability that allows us to assess the combined effects of variations in physiology and pharmacokinetics within populations, as well as formulate variables that are not precise values, but for which distributions of values can be estimated. Each subject is randomly (“Monte Carlo”) generated to have a unique set of generic, anatomic, demographic, and tissue specific parameters, plasma protein binding, hepatic blood flow rate, and pharmacokinetic parameters. The default trial designed by Simcyp is selected to build the model of bupropion and its metabolites. A virtual population of 100 healthy volunteers (10 trials with 10 subjects each) aged 20–50 years with a female/male ratio of 0.5 was used in the simulation of PK following different single oral doses of bupropion (150, 75 and 100 mg).

2.6. Simulation of Drug-Drug Interaction (DDI)

In these DDI model, bufuralol, tolterodine, metoprolol, desipramine, and dextromethorphan from the Simcyp simulator library were selected as the CYP2D6 substrates to simulate the DDIs with bupropion and its metabolites. Venlafaxine, whose model was built by us, was also used in the simulation of DDIs. The detailed DDI parameters of bupropion and its metabolites are shown in Table 4.
Trials used in the DDI simulations were designed consistent with the reported clinical studies. The details of the trials were as follows:
(1)
The subjects (10 trials × 15 subject, aged 20–50, female/male ratio 0) received 150 mg bupropion or matching placebo orally twice daily for 10 days, and on day 11 the subjects received a single oral dose of 50 mg desipramine. Plasma concentrations of bupropion and desipramine were simulated during the drug treatment period.
(2)
The subjects (10 trials × 18 subject, aged 20–50, female/male ratio 0.5) received bupropion (at a daily dose of 150 mg/day) with venlafaxine (at a daily dose of 75 mg/day) for 8 weeks. Plasma concentrations of bupropion and venlafaxine were simulated during the drug treatment period.
(3)
The subjects (10 trials × 13 subject, aged 21–64, female/male ratio 0.5) received 150 mg bupropion or matching placebo orally twice daily for 17 days, and on day 18 the subjects received a single oral dose of 30 mg dextromethorphan. Plasma concentrations of bupropion and dextromethorphan were simulated during the drug treatment period.
(4)
The subjects (10 trials × 10 subject, aged 20–56, female/male ratio 0.5) received bupropion (at a twice daily dose of 150 mg) with metoprolol (at a twice daily dose of 75 mg) for 12 days. Plasma concentrations of bupropion and metoprolol were simulated during the drug treatment period.
(5)
The subjects (10 trials × 10 subject, aged 20–50, female/male ratio 0.5) received 150 mg bupropion or matching placebo orally twice daily for 2 weeks, and on day 15 the subjects received a single oral dose of 20 mg bufuralol or 2 mg tolterodine. Plasma concentrations of bupropion, bufuralol and tolterodine were simulated during the drug treatment period.
The fold-error was used to assess the success of model building and the accuracy of the predicted pharmacokinetic profile and data. Basically, two-fold-error was publicly recognized in the simulation [35,41,42,43,44]. The model was considered to have a goodness-of-fit when the fold-error was less than two. The fold-error was defined as observed/predicted or predicted/observed, where the numerator is greater than the denominator. The DDI effect, expressed as a ratio of AUC and Cmax in the presence and absence of bupropion, was compared with observed data. The results are listed in Table 5 and Table 6.

2.7. PBPK Model for Stereo-Selective Bupropion and Its Metabolites

The PBPK model for stereo-selective bupropion and its metabolites were further developed based on the above model. The corresponding parameters are listed in Table 7. Other parameters not mentioned in Table 7 are similar to those of non-stereo selective bupropion and its metabolites. The absorption and distribution of R-bupropion and S-bupropion were described by the first-order absoption and full PBPK model. For other metabolites, a minimal PBPK model were used to describe this distribution. The in vitro studies showed that R-bupropion was metabolized to form RR-hydroxybupropion via CYP2B6 2C19 and 3A4, respectively, RR-threohydrobupropion and SR-erythrohydrobupropion via carbonyl reductase, and R-4’-hydroxybupropion via CYP2C19; while the S-bupropion was metabolized to form SS-hydroxybupropion via CYP2B6 2C19 and 3A4, respectively, SS-threohydrobupropion and RS-erythrohydrobupropion via carbonyl reductase, and S-4′-hydroxybupropion via CYP2C19 [45]. We have integrated these metabolic pathways into our model. The CYP2J2 was used to define the carbonyl reductase. These corresponding intrinsic clearance rates are calculated by retrograde calculation in Simcyp to account for their proportion in the total clearance rate base on the in vitro study [46]. The total elimination of R-bupropion is divided into 34% hydroxybupropion, 50% threohydrobupropion, 8% erythrohydrobupropion and 8% 4′-hydroxybupropion. For S-bupropion, the proportion of these metabolites are 12% hydroxybupropion, 82% threohydrobupropion, 4% erythrohydrobupropion and 2% 4′-hydroxybupropion, respectively. The Vss of SS-hydroxybupropion and RS-erythrohydrobupropion were predicted with Rogers method and Poulin and Theil method based on the optimized Kp value, respectively. The elimination of all metabolites are fitted based on the corresponding observed clinical data.

3. Results

3.1. Prediction of Bupropion and Its Metabolites Pharmacokinetics

The PBPK model of bupropion was successfully built based on the parameters in Table 1. The simulated PK profiles after oral doses of 150 mg bupropion are shown in Figure 2. There is a good match between predicted concentration profile and clinically observed data. The predicted Cmax, AUC and Tmax of bupropion were 136 ng/mL, 1402 ng∙h/mL, and 1.8 h, respectively. All of them were within a two-fold error of the observed results (Cmax = 143 ng/mL, AUC = 1161 ng∙h/mL and Tmax = 2.9 h) [47] (Figure 2A).
The simulated concentration-time profiles for hydroxybupropion, threohydrobupropion and erythrohydrobupropion are reasonably well consistent with the observed data based on the model parameters mentioned above (Figure 2B–D). The predicted PK parameters for hydroxybupropion were as follows: Cmax, AUC and Tmax were 457 ng/mL, 13,564 ng∙h/mL, and 5.8 h, respectively. The observed Cmax, AUC and Tmax were 433 ng/mL, 16,651 ng∙h/mL, and 7.7 h, respectively [47]. A fold error of less than two was simulated. The predicted Cmax and AUC for threohydrobupropion were 96 ng/mL and 1358 ng∙h/mL, respectively. The simulated Cmax and AUC were also in good agreement with (<two-fold error) the observed results (Cmax = 109 ng/mL, AUC = 1219 ng∙h/mL) [34]. The predicted erythrohydrobupropion Cmax and AUC were 12 ng/mL and 144 ng∙h/mL, respectively. The simulated Cmax and AUC were less than 2 fold error compared with the observed results (Cmax = 15 ng/mL, AUC = 133 ng∙h/mL) [34].
To verify the PBPK model, the PK profile of bupropion and its metabolites after oral different dose was also simulated and compared with reported data. Following a single oral doses of 75 mg bupropion to healthy subjects, the PK profiles of bupropion and its metabolites are shown in Figure 3. The predicted Cmax (66 ng/mL), AUC (435 ng∙h/mL) and Tmax (1.9 h) less than 2 fold error compared with the observed data (Cmax = 117 ng/mL, AUC = 456 ng∙h/mL and Tmax = 1.6 h, respectively) (Figure 3A) [48]. For the metabolites, the predicted PK parameters were as follows: Cmax, AUC and Tmax of hydroxybupropion were 222 ng/mL, 3827 ng∙h/mL, and 5.8 h, respectively; Cmax, AUC and Tmax of threohydrobupropion were 51 ng/mL, 719 ng∙h/mL, and 4.6 h, respectively; Cmax, AUC and Tmax of erythrohydrobupropion were 7 ng/mL, 87 ng∙h/mL, and 4.5 h, respectively. The simulated results compared reasonably well with the observed PK data (hydroxybupropion: Cmax = 134 ng/mL, AUC = 2248 ng∙h/mL, and Tmax = 4.6 h; threohydrobupropion: Cmax = 57 ng/mL, AUC = 647 ng∙h/mL, and Tmax = 1.9 h; erythrohydrobupropion: Cmax = 7 ng/mL, AUC = 113 ng∙h/mL, and Tmax = 2.6 h, respectively) (Figure 3B–D) [48]. The simulated results compared reasonably well with the observed data: the predicted PK parameters were within a two-fold error of the observed data, whereas the Tmax of threohydrobupropion was slightly overpredicted by two-fold error.
The PK profiles of bupropion and its metabolites after a single oral dose of 100 mg bupropion are shown in Figure 4. The predicted results were as follows: bupropion: Cmax = 89 ng/mL, AUC = 586 ng∙h/mL, and Tmax = 1.9 h; hydroxybupropion: Cmax = 299 ng/mL, AUC = 7764 ng∙h/mL, and Tmax = 5.8 h; threohydrobupropion: Cmax = 68 ng/mL, AUC = 1329 ng∙h/mL, and Tmax = 4.6 h; erythrohydrobupropion: Cmax = 9 ng/mL, AUC = 133 ng∙h/mL, and Tmax = 4.6 h, respectively. They were in agreement with (<two-fold error) the observed PK data (bupropion: Cmax = 74 ng/mL, AUC = 360 ng∙h/mL, and Tmax = 1.7 h; hydroxybupropion: Cmax = 281 ng/mL, AUC = 7468 ng∙h/mL, and Tmax = 4.2 h; threohydrobupropion: Cmax = 73 ng/mL, AUC = 1354 ng∙h/mL, and Tmax = 3.0 h) [49]. However, no concentration-time profile data for erythrohydrobupropio from this study was available for direct comparison.

3.2. Prediction of the Bupropion-Desipramine DDI

Desipramine is a substrate of CYP2D6. Although published in vitro data showed that bupropion and a major active metabolite, hydroxybupropion, were relatively weak CYP2D6 inhibitors (IC50 = 58 and 74 μM, respectively) [27], drug interactions resulting in increased exposure of CYP2D6-metabolized drugs following coadministration with bupropion were observed in clinic.
In this simulation, subjects were given a dose of 150 mg bupropion twice a day for 10 days before the administration of a single dose of 50 mg desipramine. The predicted and observed mean plasma concentration–time profiles of desipramine in the absence and presence of bupropion are shown in Figure 5. The predicted and observed pharmacokinetic parameter values are summarized in Table 5. The clinical interaction results showed a 5.2, 1.9 and 2.0-fold increase in the AUC, Cmax and Tmax of desipramine, respectively, when desipramine was codosed with bupropion [28]. The simulated results is reasonably well compared to the observed data when all of the inhibition from bupropion and its metabolites were integrated. The predicted AUC, Cmax and Tmax ratio were 5.05, 1.79 and 1.84-fold, respectively.
Simultaneously, the contribution of DDI for bupropion and its metabolites were simulated using the PBPK model. The model predicted a 2.27, 1.15 and 1.10-fold increase in desipramine AUC, Cmax and Tmax, respectively, when bupropion was considered alone as an inhibitor. If each of the metabolites were considered as the only inhibitor, the AUC, Cmax and Tmax ratio of metabolites were as follows: hydroxybupropion (4.58, 1.76 and 1.84-fold), threohydrobupropion (3.47, 1.61 and 1.47-fold), and erythrohydrobupropion (2.83, 1.45 and 1.47-fold), respectively. The results indicate that bupropion and its metabolites all are involved in the DDI between bupropion and desipramine. While the inhibition of bupropion is weaker than its metabolites, hydroxybupropion is a relatively strong CYP2D6 inhibitor.

3.3. Prediction of the Bupropion-Venlafaxine DDI

Venlafaxine is another substrate of CYP2D6. The clinical results showed inhibition of venlafaxine metabolism, resulting in a significant, 2.5-fold higher plasma venlafaxine concentration at steady state following co-adminstration of bupropion with venlafaxine [50]. To simulate the DDI, a PBPK model of venlafaxine was developed in the first place. The PBPK model of venlafaxine was successfully built based on the parameters in Table 3. Following a single dose of 75 mg venlafaxine to healthy subjects, the predicted Cmax (50 ng/mL) and AUC (608 ng∙h/mL) matched the observed data well (Cmax = 34 ng/mL, AUC = 463 ng∙h/mL) [51].
Then, a simulation of DDI was performed by the PBPK model. In the study, subjects received bupropion (at a daily dose of 150 mg/day) with venlafaxine (at a daily dose of 75 mg/day) for 8 weeks. The simulated results showed a 2.24-fold of Cmax ratio when the inhibition from bupropion as well as its metabolites were considered. This model can reasonably predict the clinical DDI. The contribution of DDI for bupropion and its metabolites were also analyzed by this model. The predicted Cmax ratio of bupropion, hydroxybupropion, threohydrobupropion and erythrohydrobupropion were 1.27, 1.94 1.80 and 1.60-fold. The result was similar to the DDI of bupropion on venlafaxine. There was a minimal effect on bupropion, whereas when the inhibition from hydroxybupropion, threohydrobupropion and erythrohydrobupropion were incorporated, significant DDI was captured (Table 5). In general, the inhibition from hydroxybupropion is the strongest, while bupropion has a relatively weak inhibitory effect.

3.4. Prediction of DDI between Bupropion with Other Potential CYP2D6 Substrates

The PBPK model was also used to predict more DDI of bupropion on other CYP2D6 substrates. The predicted interaction effect on different drugs was listed in Table 6. A simulation of bupropion inhibits dextromethorphan following a single oral dose of 30 mg dextromethorphan after 17 days of co-administration of bupropion (150 mg twice a day) was performed. According to the model, a 4.06 and 3.05-fold of AUC and Cmax ratio was predicted, respectively. There are reports showed that interaction occurs when dextromethorphan is co-administered with bupropion in healthy volunteers, the mean dextromethorphan/dextrophan ratio was significantly increased in urine [52]. Even though no concentration-time profile data for the DDI study is available for direct comparison, a significant increase in exposure of dextromethorphan after co-administration of bupropion was predicted by our model.
In a case report, a severe bradycardia occurred between buproprion and metoprolol. It suggested that the serious adverse event might be attributed to the CYP2D6 inhibition of bupropion [53]. Following 12 days multiple oral administration of metoprolol 75 mg twice daily with and without coadministration of bupropion (150 mg twice a day), the predicted AUC and Cmax ratio of metoprolol were 3.53 and 2.57-fold, respectively. This further confirms the need for caution when combining bupropion with metoprolol.
More drug interactions were studied based on the PBPK model. Following a single oral dose of 20 mg bufuralol or 2 mg tolterodine after 2 weeks of coadministration of bupropion (150 mg twice a day), the predicted AUC and Cmax ratio of bufuralol were 2.04 and 1.55-fold respectively, and the predicted AUC and Cmax ratio of tolterodine were 2.91 and 2.17-fold, respectively.

3.5. Prediction of Stereo-Selective Bupropion and Its Metabolites Pharmacokinetics and DDI

The above-established PBPK model of stereo-selective bupropion and its metabolites were used to simulate the PK profiles for the subject of 100 mg bupropion administered orally. The results showed that good PK profiles were captured by the PBPK model. All of the predicted Cmax and AUC were within a two-fold error of the observed results and are shown in Table 8.
On this basis, a DDI between bupropion with desipramine is further simulated following a dose of 150 mg bupropion twice a day for 10 days before the administration of a single dose of 50 mg desipramine. The simulated and observed DDI effect are listed in Table 9. The value of Ki was predicted base on IC50 from in vitro reports [55] in the Simcyp model. A 2.53, 1.21, and 1.47-fold of AUC, Cmax and Tmax ratio were predicted, respectively, when the inhibition from R-bupropion, RR-hydroxybupropion, threohydrobupropion and erythrohydrobupropion were integrated. Although the predicted DDI was lower than the observed clinical data. The results indicated that the RR-hydroxybupropion was a major coutribution to the inhibition of CYP2D6 from bupropion.

4. Discussion

It is common to think that the possibility of causing drug interactions for metabolites compared with the parent drug is low. However, recently, more and more studies have shown that the perpetrator drug’s metabolites may also have a significant impact on CYP-mediated DDI. With the development of the PBPK model, it has been widely used in various stages of drug development, especially in evaluation of DDIs. The PBPK model can simulate a dynamic process which is closer to the in vivo behavior based on in vitro biotransformation and physicochemical parameters. Many studies have successfully evaluated drug interactions using PBPK model [12,56,57,58]. However, only a few studies have built a PBPK model to evaluate DDI caused by inhibitory metabolite [18,59,60,61]. Many compounds, such as bupropion, have an unexpected DDI in clinic, although in vitro study showed that bupropion was a weak CYP2D6 inhibitor. It is possible that the inhibition from metabolites contributes to the observed DDI. To better address this apparent discrepancy between in vitro and in vivo studies, bupropion was chosen as an example, and the PBPK model was employed to describe the complex drug interactions involving inhibitory metabolite.
First, an accurate simulation of PK profiles of both parent and metabolite is required to maximize the confidence in the DDI prediction. Therefore, in our study, many observed PK profiles of different doses were used to verify the bupropion model. A full PBPK distribution model and first order absorption model was used for a good description of bupropion PK profile. Bupropion is mainly metabolized by the liver, and less than 1% of the parent drug is found in the urine [26,29]. In addition to hydroxybupropion that are mediated by CYP enzymes, bupropion is also metabolized by 11β-HSD to form threohydrobupropion and erythrohydrobupropion [62,63]. To better describe and build the PBPK model, CYP2B6 instead of carbonyl reductase was set in Simcyp as the metabolic enzymes of formation of threohydrobupropion and erythrohydrobupropion, and a fu,mic was used to correct the expression of carbonyl reductase to obtain the best simulation results compared to observed data.
For those uncertain or unknown parameters, a sensitivity analysis is performed to assess the importance and effect of these parameters in human PK and DDI prediction. In the PBPK model of bupropion, the logP, pKa, and three fu,mic were considered for sensitivity analysis. According to the analysis, the logP, pKa and the fu,mic for formation of erythrohydrobupropion were not sensitive to the prediction of PK. However, fu,mic for formation of hydroxybupropion and threohydrobupropion has a certain impact on the prediction of PK and the fu,mic for formation of erythrohydrobupropion. Thus, the logP and pKa from the drug bank were inputted into the model. The fu,mic for formation of hydroxybupropion and threohydrobupropion were optimized at the 0.16 and 0.003, respectively. The erythrohydrobupropion and threohydrobupropion are formed via reduction of the carbonyl group. Thus, the same fu,mic is integrated into the model. The detailed sensitivity analysis results are shown in Supplementary Figure S1.
Based on the in vitro data and the mechanisms mentioned above, 1% of the fe (fraction of total body clearance via renal excretion) and geometric mean 174 (L/h) of CL were reasonably predicted by the PBPK model. Studies have shown that the CL for bupropion is in the range of 113 to 215 L/h [31,47,49,64,65,66,67,
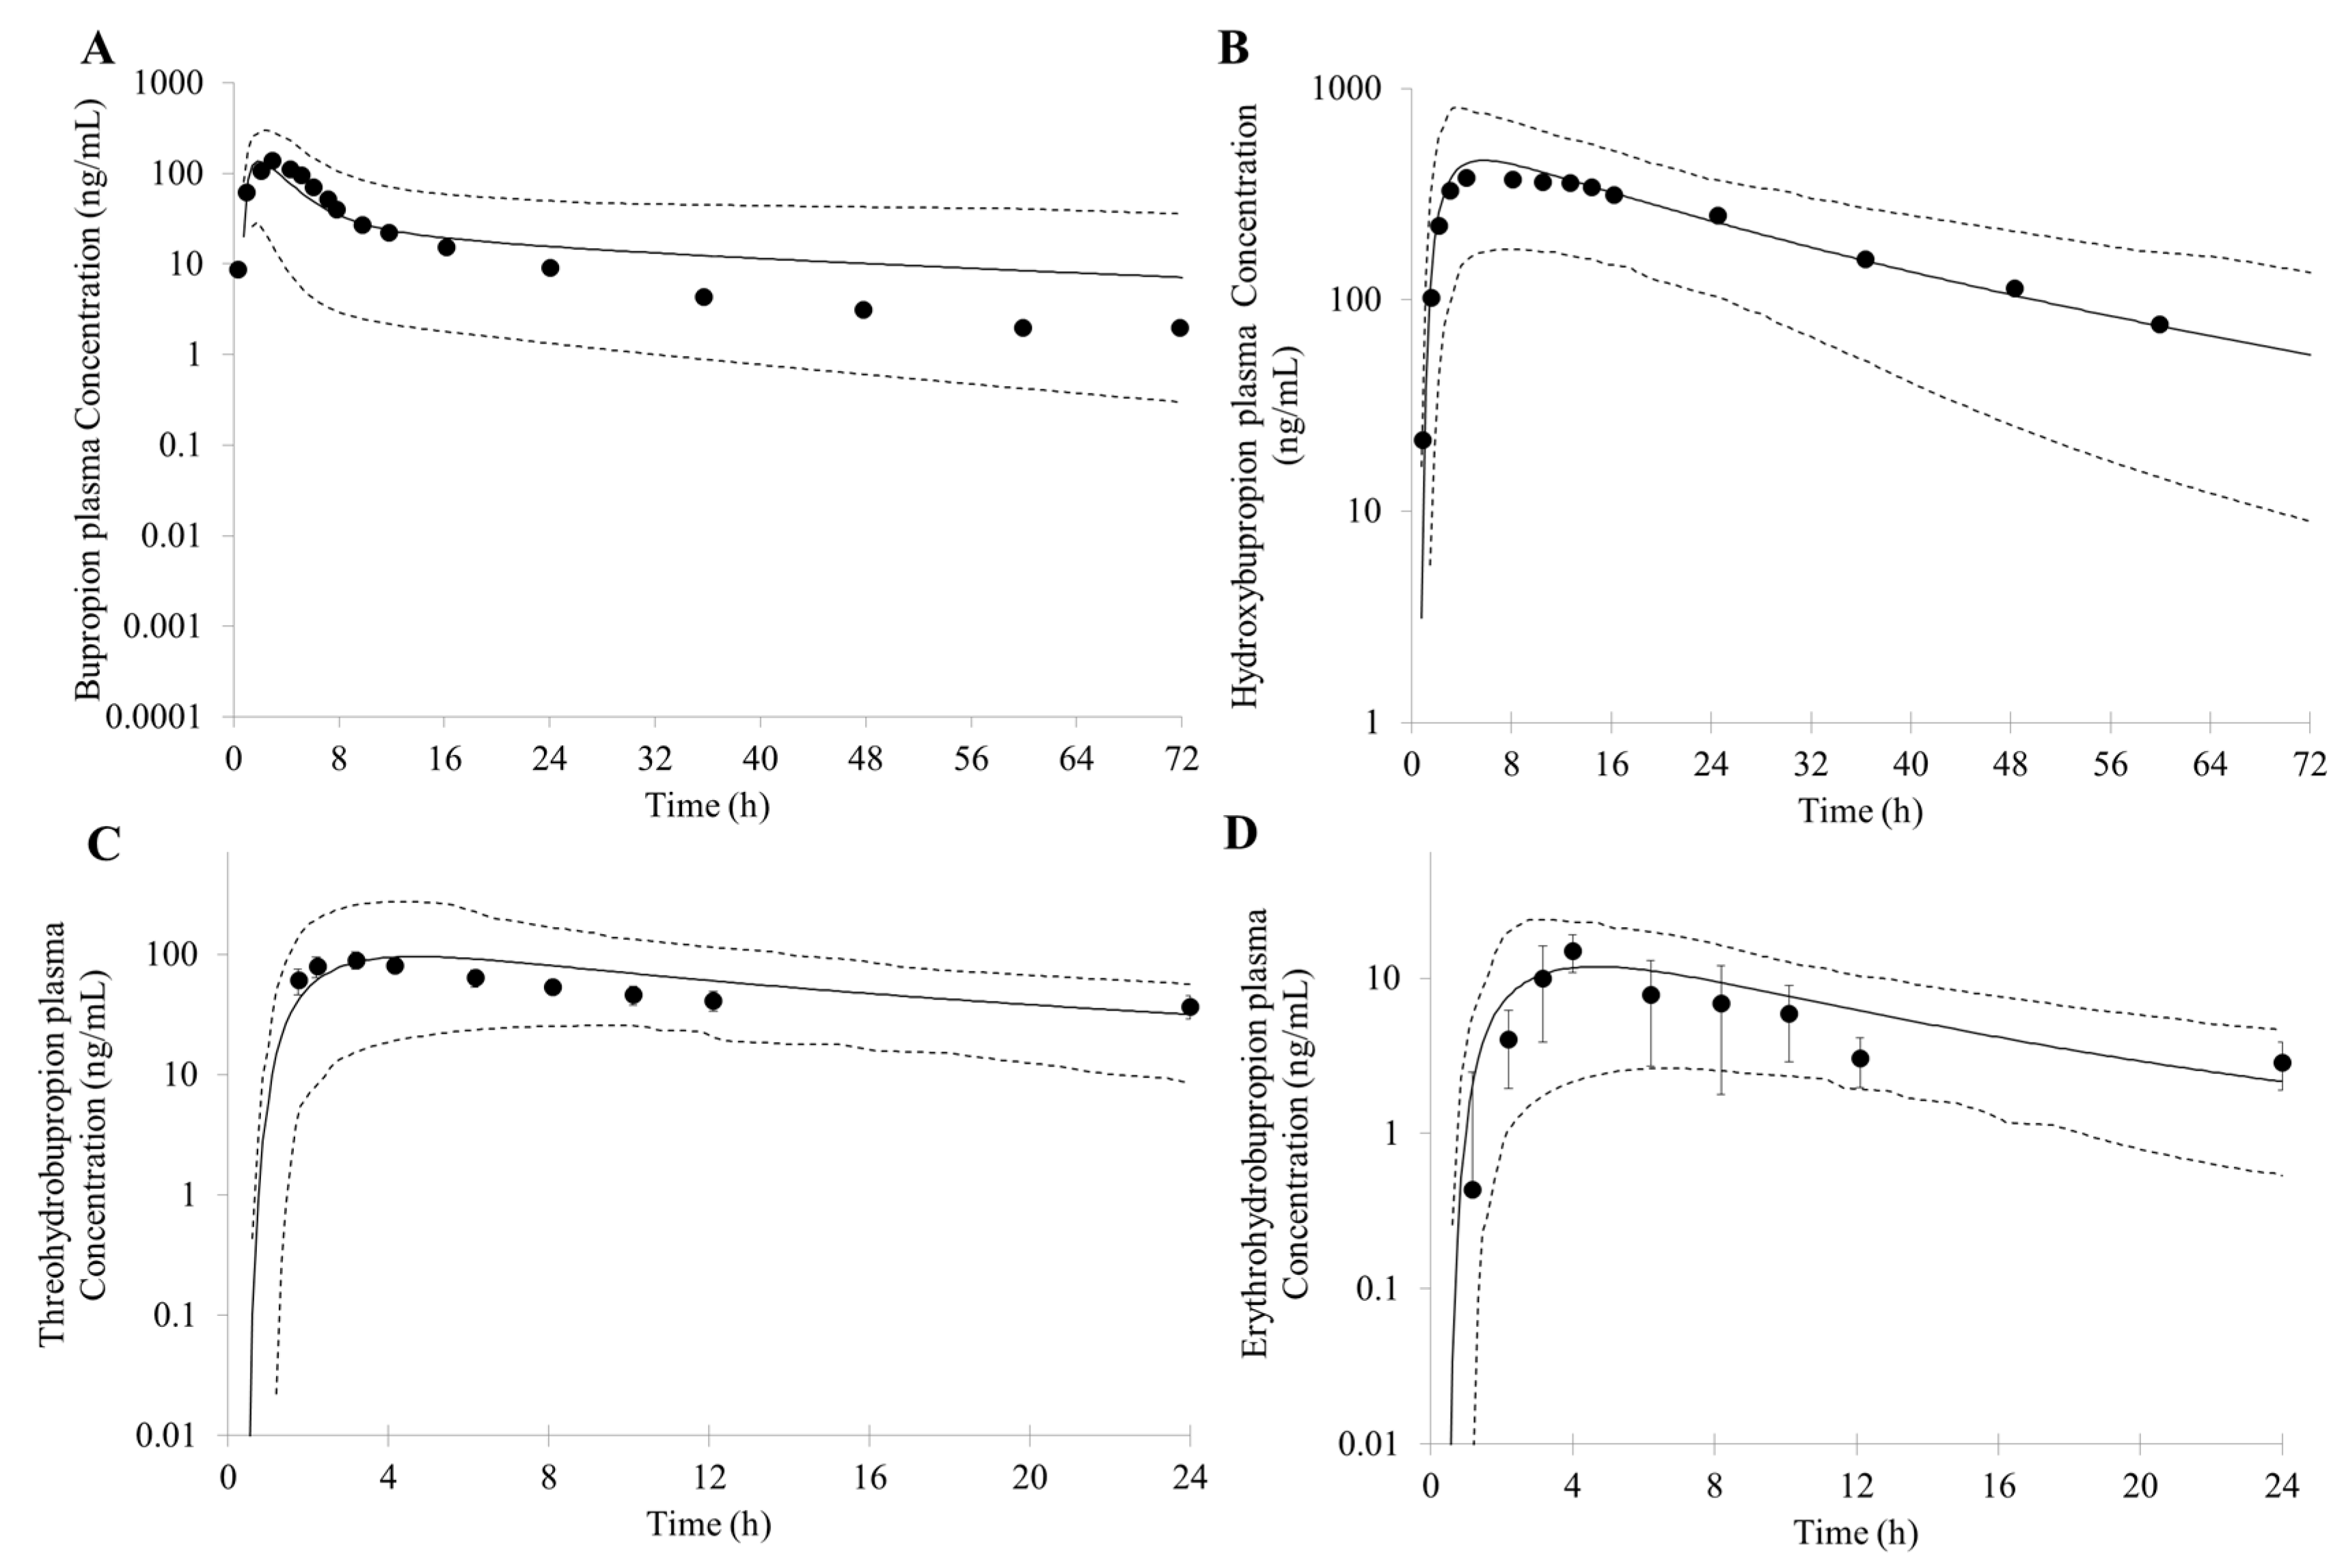
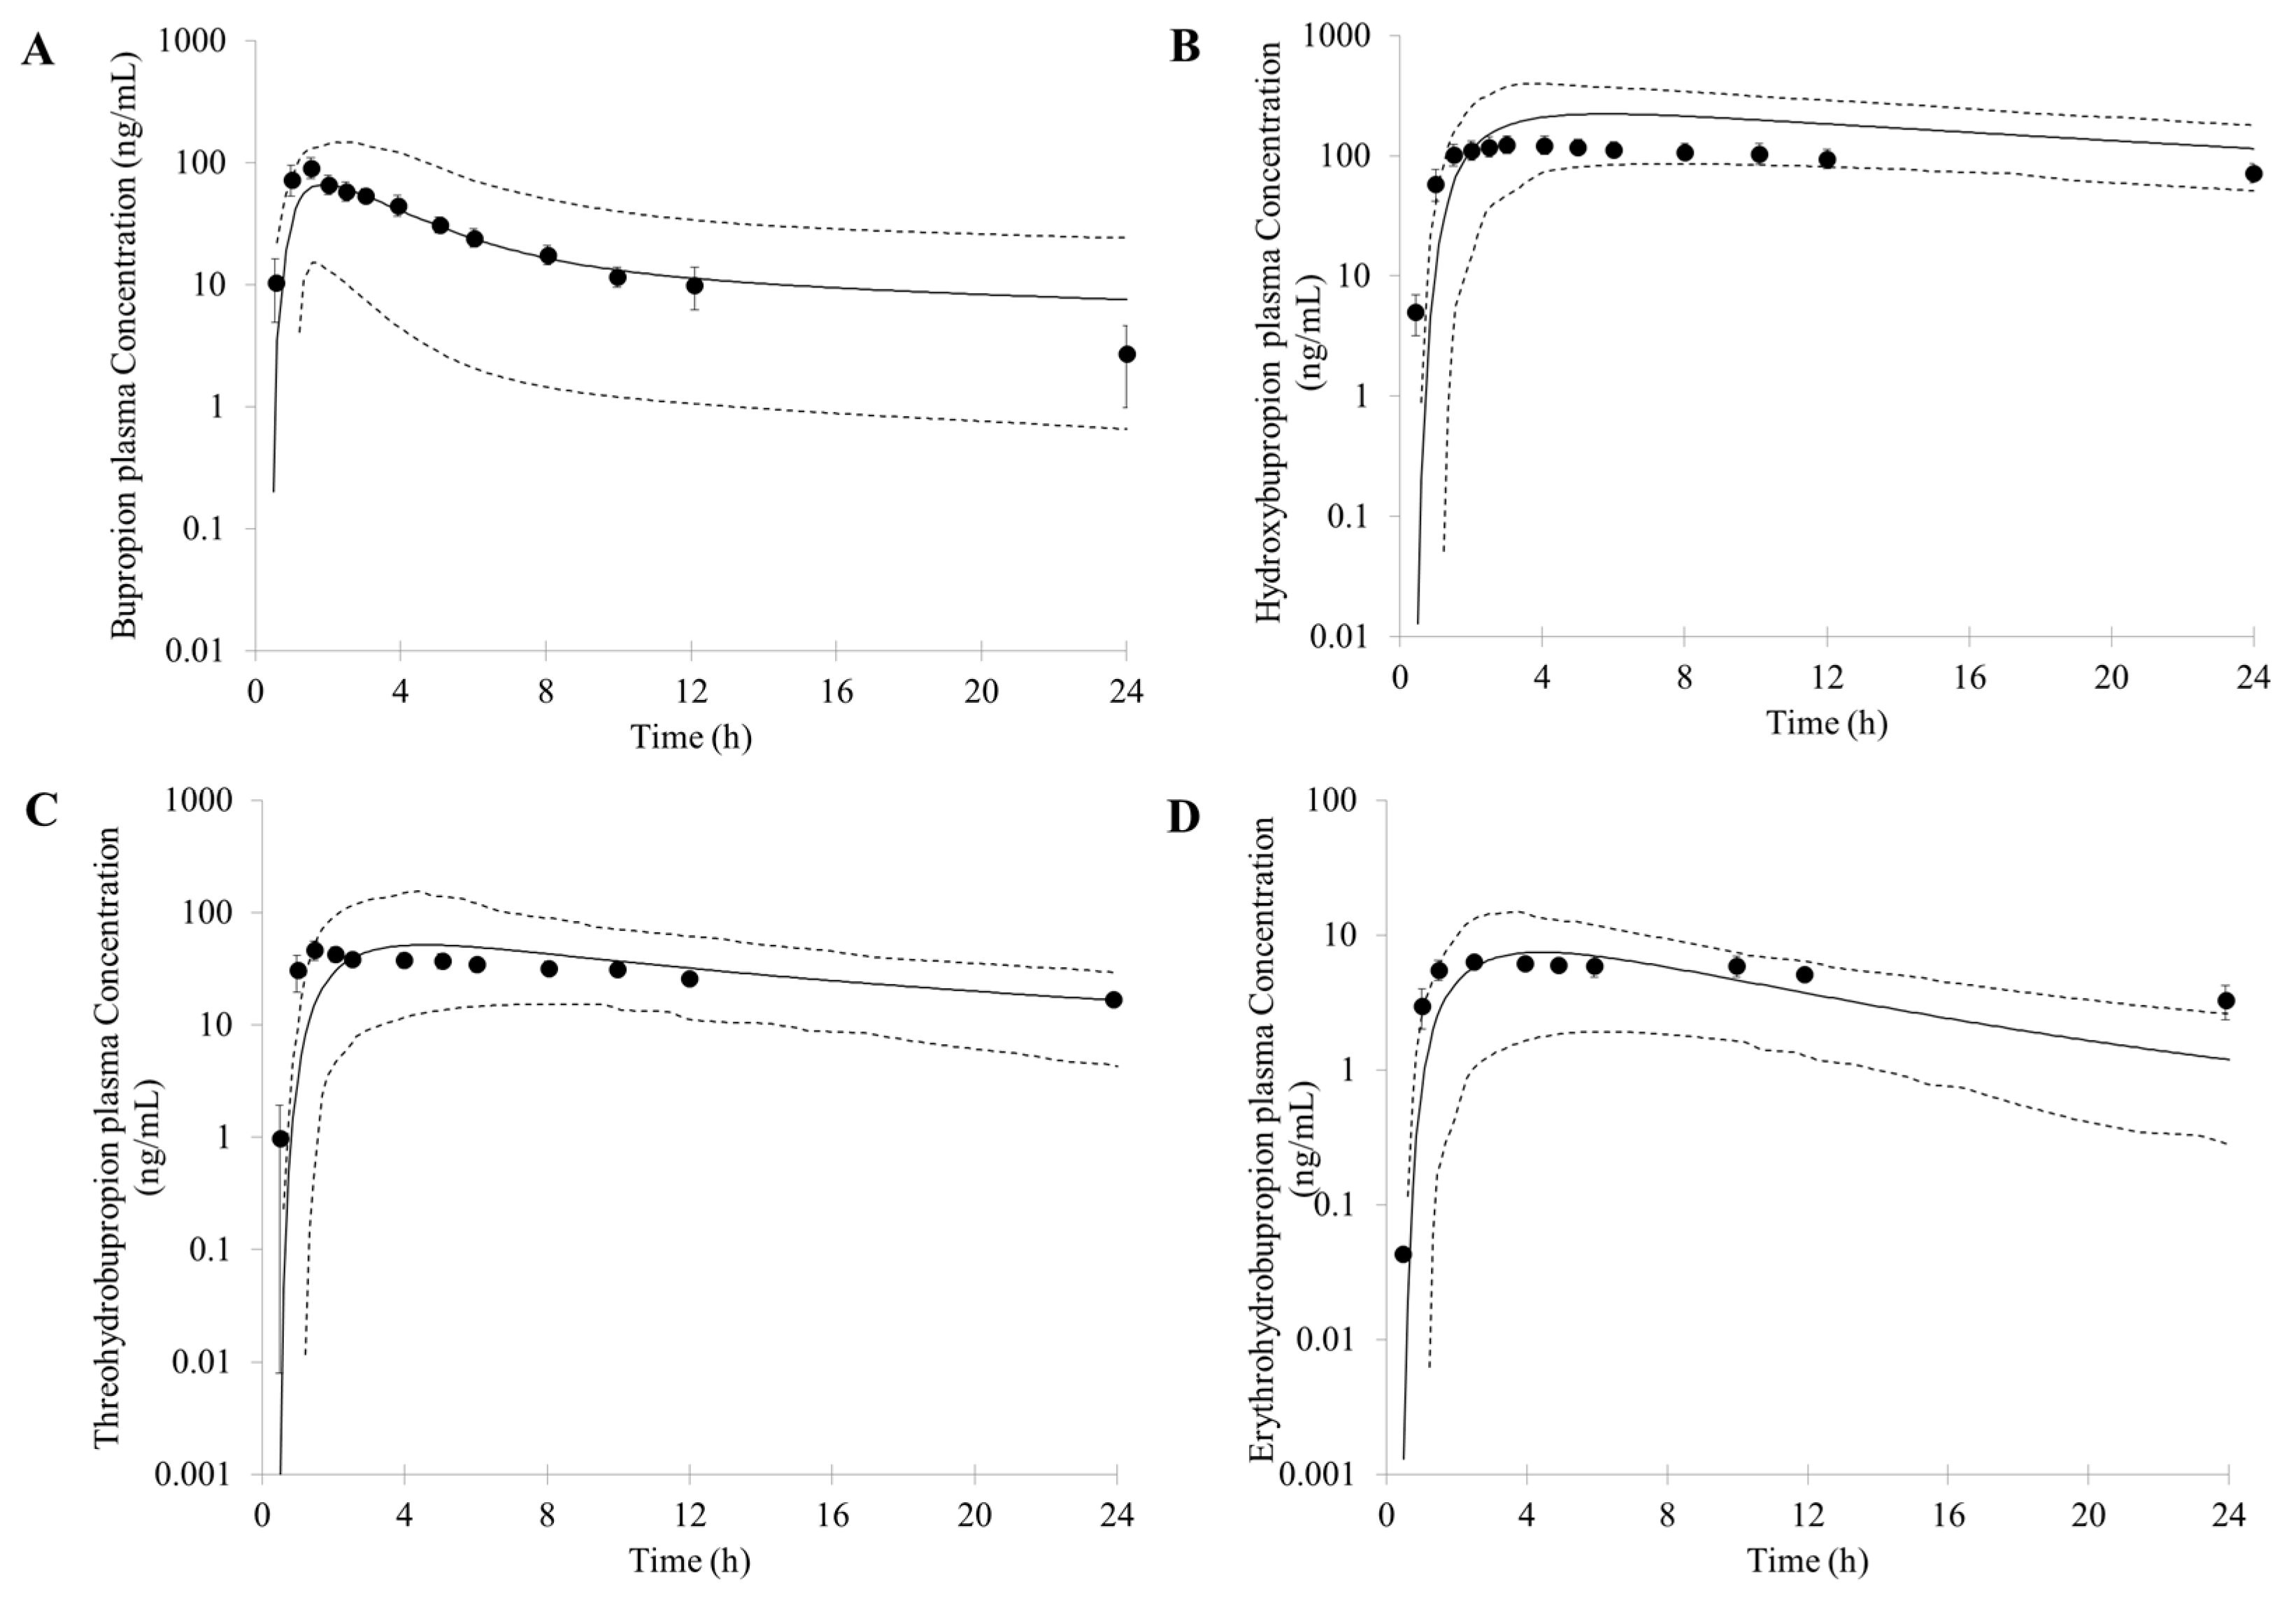
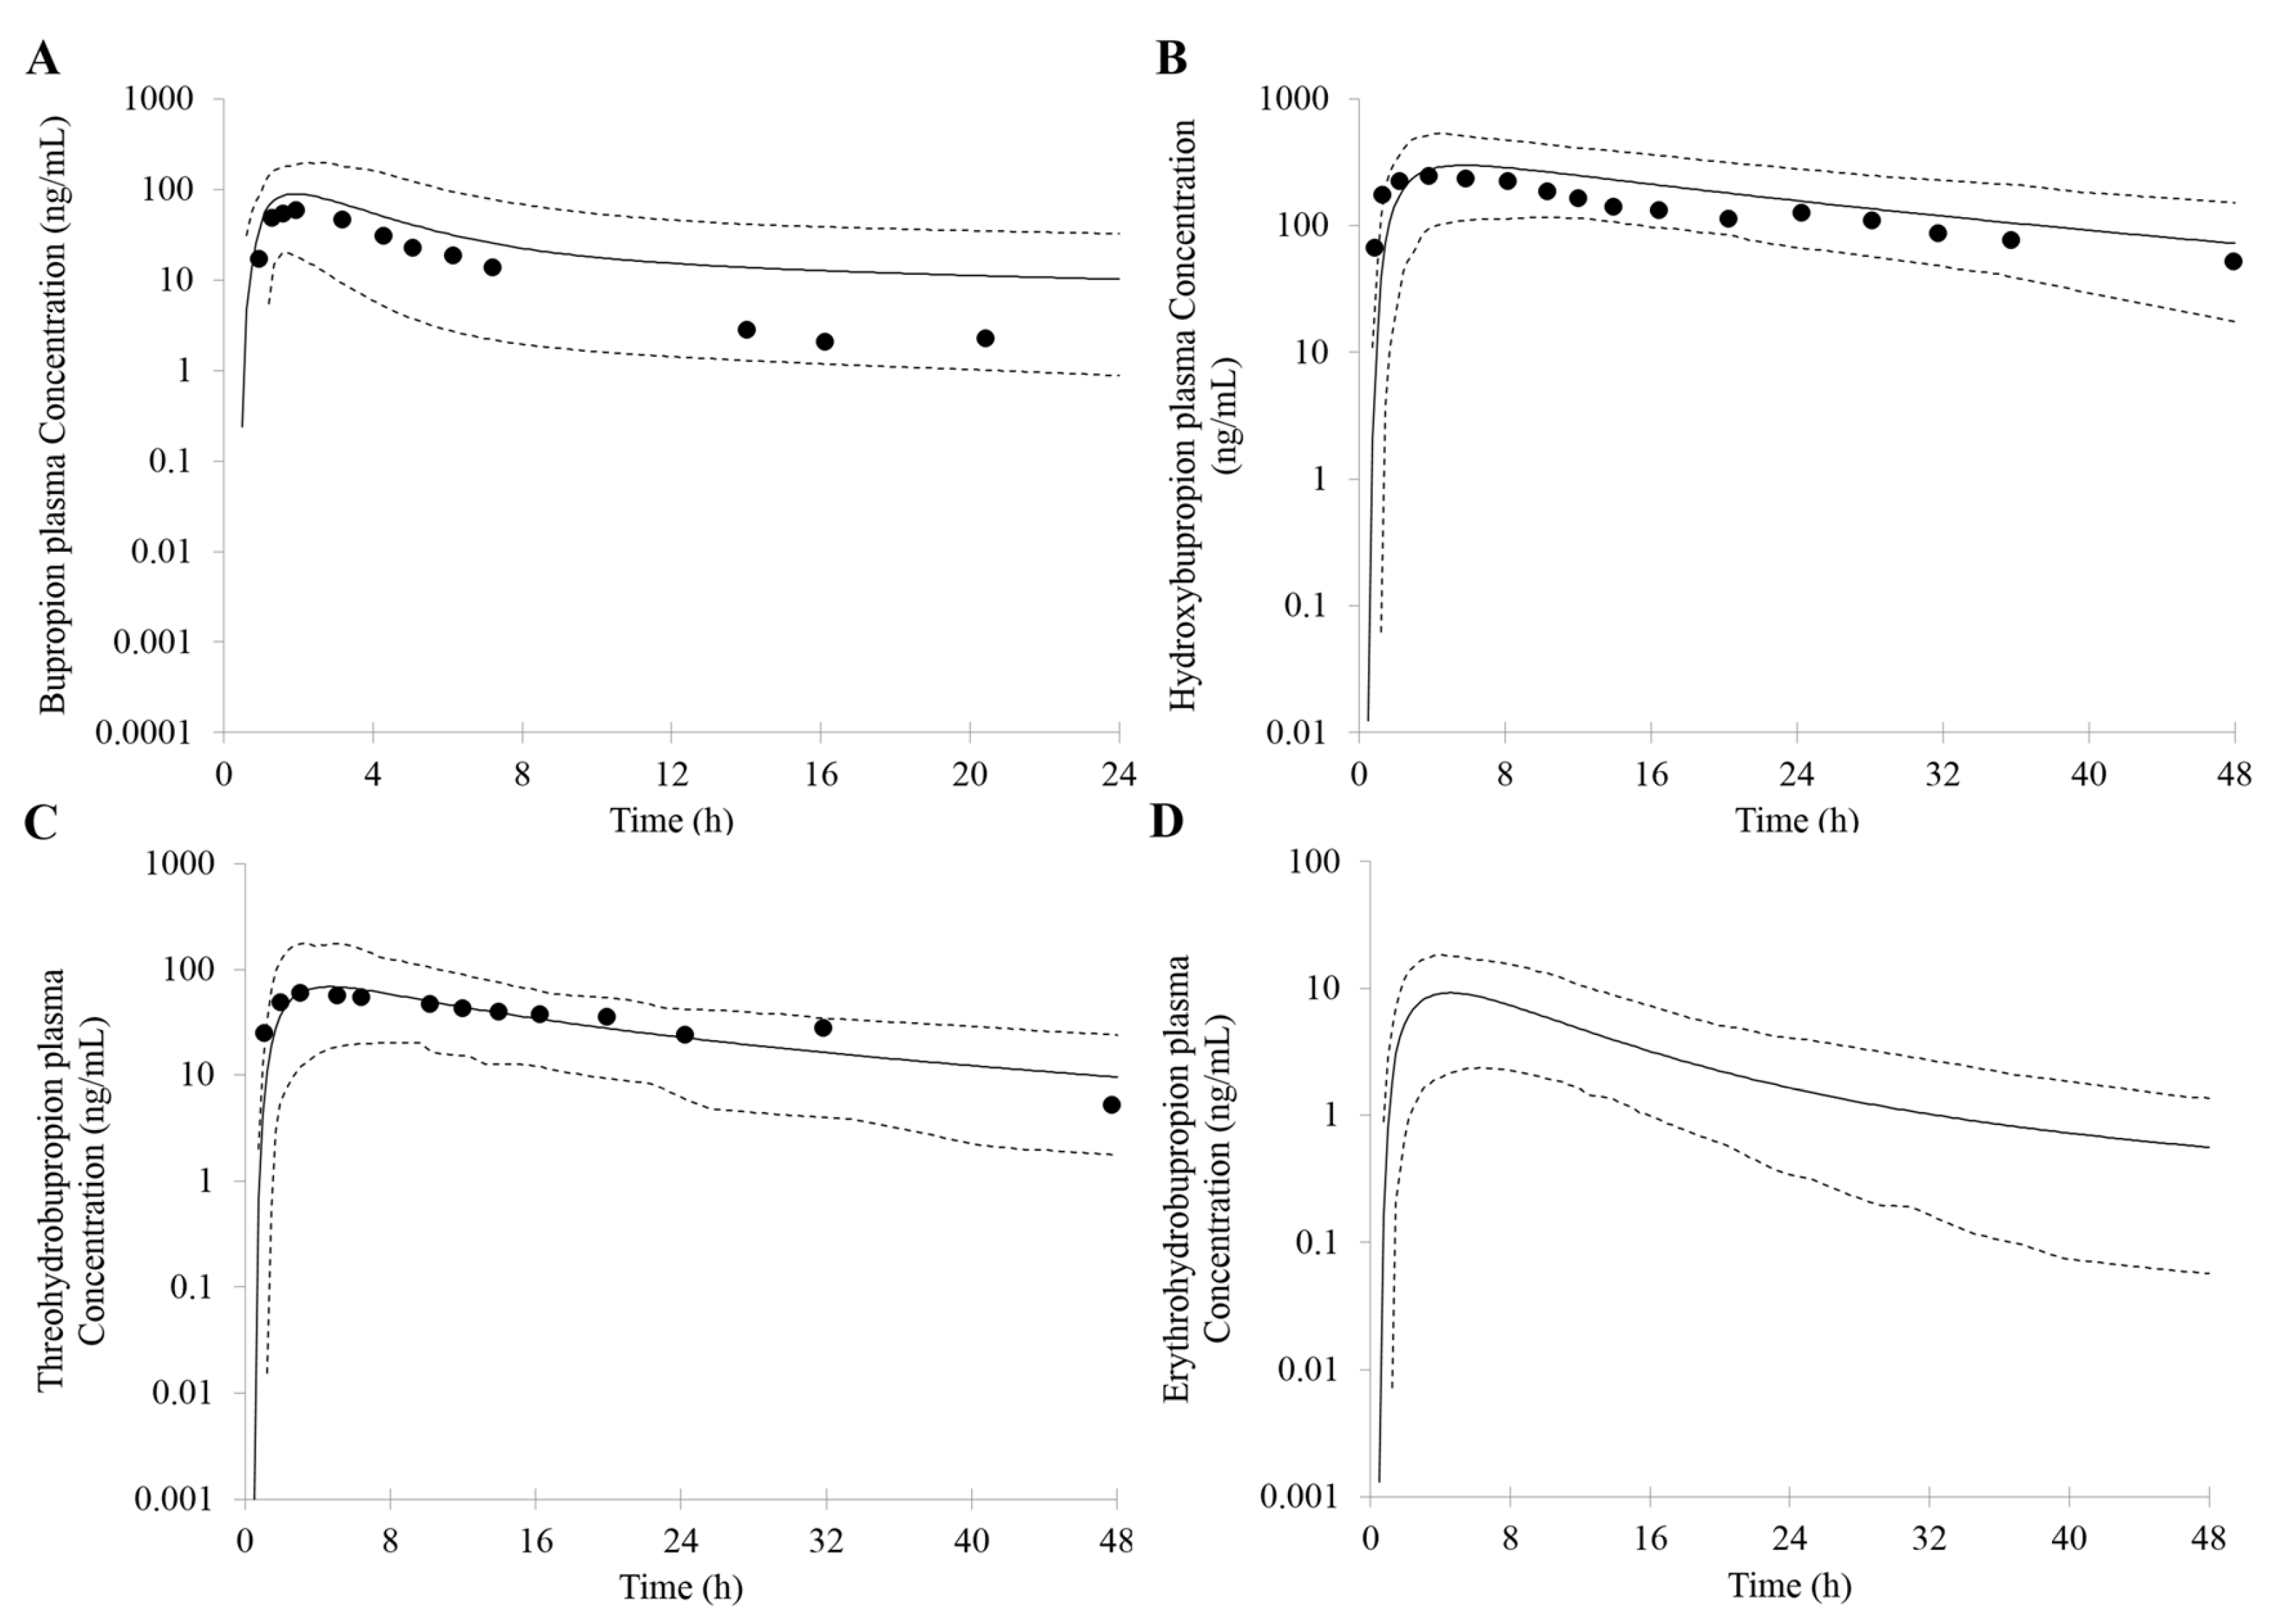
68]. For the PK profile of metabolites, the minimal PBPK distribution model or minimal PBPK distribution model + adjusting compartment distribution model have a good description based on in vitro data, in silico data and clinical PK data. More importantly, the developed PBPK model was well captured the PK profile after oral dose of 75 mg and 100 mg bupropion.
In the Simcyp, the user can only simultaneously select one specified inhibitor metabolite to simulate the interaction effects. To better describe the actual clinical DDI, metabolites were regarded as different inhibitors and combined with bupropion to simulate the complex DDI with other CYP2D6 substrates. A sensitivity analysis on the dosage of metabolites was conducted; the results predicted by the model were in good agreement with the observed PK profiles when doses of hydroxybupropion, threohydrobupropion and erythrohydrobupropion were assumed to be 90 mg, 30 mg and 4 mg, respectively. This indicates that the plasma concentration of metabolites formed by single oral 150 mg bupropion is equivalent to plasma levels in vivo after a single oral of 90 mg hydroxybupropion, 30 mg threohydrobupropion and 4 mg erythrohydrobupropion, respectively. (Figure 6). The predicted Cmax (hydroxybupropion 443 ng/mL threohydrobupropion 107 ng/mL and erythrohydrobupropion 16 ng/mL) and AUC (hydroxybupropion 15,215 ng∙h/mL, threohydrobupropion 1178 ng∙h/mL and erythrohydrobupropion 185 ng∙h/mL) were within 2-fold error of the observed values [34,47].
To sum up, dynamic PK process of bupropion and its metabolites were well characterized in PBPK models. The successful simulations of clinically observed PK profiles build confidence in the prediction and mechanistic understanding of the DDI caused by bupropion, and particularly the unexpected DDI potential contributed by its metabolites. On the basis of the above model, we then applied the PBPK model to predict the clinically observed DDIs involving bupropion and its metabolites as the CYP2D6 inhibitors. The result contribute to the understanding of the involvement and impact of inhibitory metabolites on DDIs observed in the clinic.
In the simulation of bupropion-desipramine interaction, the addition of the inhibitory metabolites into the PBPK model resulted in more accurate prediction of DDIs (AUC and Cmax ratio) compared with that when only the inhibition of P450 from the parent drug (bupropion) was taken into account. The simulation suggests that bupropion and its metabolites contribute to the DDI between bupropion and desipramin. Although in vitro study showed that the inhibitory potency from strong to weak were erythrohydrobupropion, threohydrobupropion, hydroxybupropion and bupropion, respectively, the simulation of in vivo DDI suggests that hydroxybupropion is the most potent competitive CYP2D6 inhibitor. It can be possible due to the greater exposure of hydroxybupropion. The plasma level of hydroxybupropion is five- to ten-fold higher than the parent drug [29,69,70,71,72]. The exposure of threohydrobupropion is similar to the parent drug; however, it has a stronger in vitro inhibition constant than parent drug and hydroxybupropion. For the erythrobupropion, it is predicted to have similar importance in in vivo DDIs as hydroxybupropion, despite the fact that its plasma concentration is much lower than hydroxybupropion. This may be related to its strongest inhibition constant. Conversely, even though the exposure of bupropion is similar to threohydrobupropion. The PBPK simulation shows bupropion is the weakest competitive CYP2D6 inhibitor. The result may attribute to the relatively weakest inhibition constant.
Consistently, a minimal effect of bupropion on venlafaxine was predicted if only the competitive inhibition from the parent drug was considered. With the addition of the inhibitory metabolites into the PBPK model, there was a more accurate prediction of DDIs. The inhibitory potency from strong to weak was hydroxybupropion, threohydrobupropion, erythrohydrobupropion, and bupropion, respectively.
In the DDI study of bupropion with other CYP2D6 substrates, the significant increase in exposure of dextromethorphan, metoprolol, bufuralol and tolterodine after coadministration of bupropion was predicted. These DDI predictions may explain the occurrence of severe sinus bradycardia after coadministration of bupropion and metoprolol and highlight the need for caution and dosage adjustment when combining bupropion with medications metabolized by CYP2D6.
To better understand the effect of stereo-selective bupropion and its metabolites on the DDI, a stereo-selective PBPK model for bupropion and its metabolites was further developed. The PBPK model considered multiple metabolic pathways including CYP2B6, 2C19, 3A4 and carbonyl reductase, and it is reasonable to describe the proportion of each metabolite in total clearance of bupropion. The simulated PK profile was a good match with the observed clinical data, although, in the simulation of DDI between bupropion with desipramine, the predicted DDI was lower than the observed. The results indicated that RR-hydroxybupropion was a major contributor to the inhibition of CYP2D6 from bupropion. The inhibitory effect of bupropion on CYP2D6 may be the result of synergistic production of all stereo-selective parent drugs and its metabolites. Currently, all inhibitors cannot be simultaneously integrated into the model for simulation. Only four inhibitors can be allowed to integrate into the model in Simcyp. In addition, the stereo-chemical threohydrobupropion and erythrohydrobupropion may have different inhibitory contributions compared to non-stereo-chemical, and the in vitro inhibition rate constants of the stereo-chemical threohydrobupropion and erythrohydrobupropion have not been reported. The PBPK model of stereo-selective bupropion and its metabolites still need to be further improved and optimized after obtaining more data in the future.
Overall, we successfully developed a PBPK model to describe the dynamic PK process of bupropion and its metabolites and understand the involvement and impact of inhibitory metabolites for DDIs observed in the clinic. The present bupropion PBPK model can be useful for predicting inhibition from bupropion in other clinical studies. However, the use of the PBPK model for a true prospective prediction of DDI caused by inhibitory metabolite is still very challenging, as the in vitro inhibition and human PK data for the metabolite are not routinely generated. To maximize confidence in the DDI prediction, more information is needed for the inhibitory potency of the metabolites towards the P450 enzymes.

Supplementary Materials

The following are available online at www.mdpi.com/1999-4923/10/1/1/s1, Figure S1: Sensitivity analysis results expressed as plasma concentration-time profiles from Simcyp PBPK model simulations: (A) logP; (B) pKa; (C) fu,mic for formation of hydroxybupropion, (D) fu,mic for formation of threohydrobupropion, (E) fu,mic for formation of erythrohydrobupropion. The parameter ranges assessed were logP, 0.33−32.8, pKa, 0.82−14.00, fu,mic, 0.0005−1.
Supplementary File 1

Acknowledgments

This study was supported by a grant from the National Natural Science Foundation of China [Grant No. 81673501].

Author Contributions

Caifu Xue and Weimin Cai designed the research; Caifu Xue and Xuejie Zhang performed the research, analyzed the data and wrote the paper; Weimin Cai reviewed and revised the paper.

Conflicts of Interest

The authors declare that there is no conflicts of interests.

References

  1. Huang, S.M.; Lesko, L.J. Drug-drug, drug-dietary supplement, and drug-citrus fruit and other food interactions: What have we learned? J. Clin. Pharmacol. 2004, 44, 559–569. [Google Scholar] [CrossRef] [PubMed]
  2. Krayenbühl, J.C.; Vozeh, S.; Kondo-Oestreicher, M.; Dayer, P. Drug-drug inleracüons or new active substances; mibefradil example. Eur. J. Clin. Pharmacol. 1999, 55, 559–565. [Google Scholar] [PubMed]
  3. Lee, S.Y.; Jang, H.; Lee, J.Y.; Kwon, K.I.; Oh, S.J.; Kim, S.K. Inhibition of cytochrome P450 by ethambutol in human liver microsomes. Toxicol. Lett. 2014, 229, 33–40. [Google Scholar] [CrossRef] [PubMed]
  4. Wienkers, L.C.; Heath, T.G. Predicting in vivo drug interactions from in vitro drug discovery data. Nat. Rev. Drug Discov. 2005, 4, 825–833. [Google Scholar] [CrossRef] [PubMed]
  5. Prueksaritanont, T.; Chu, X.; Gibson, C.; Cui, D.; Yee, K.L.; Ballard, J.; Cabalu, T.; Hochman, J. Drug-drug interaction studies: Regulatory guidance and an industry perspective. AAPS J. 2013, 15, 629–645. [Google Scholar] [CrossRef] [PubMed]
  6. Callegari, E.; Kalgutkar, A.S.; Leung, L.; Obach, R.S.; Plowchalk, D.R.; Tse, S. Drug metabolites as cytochrome p450 inhibitors: A retrospective analysis and proposed algorithm for evaluation of the pharmacokinetic interaction potential of metabolites in drug discovery and development. Drug Metab. Dispos. 2013, 41, 2047–2055. [Google Scholar] [CrossRef] [PubMed]
  7. Isoherranen, N.; Hachad, H.; Yeung, C.K.; Levy, R.H. Qualitative analysis of the role of metabolites in inhibitory drug-drug interactions: Literature evaluation based on the metabolism and transport drug interaction database. Chem. Res. Toxicol. 2009, 22, 294–298. [Google Scholar] [CrossRef] [PubMed]
  8. Yeung, C.K.; Fujioka, Y.; Hachad, H.; Levy, R.H.; Isoherranen, N. Are circulating metabolites important in drug-drug interactions? Quantitative analysis of risk prediction and inhibitory potency. Clin. Pharmacol. Ther. 2011, 89, 105–113. [Google Scholar] [CrossRef] [PubMed]
  9. US Department of Health and Human Services, Food and Drug Administration, Center for Drug Evaluation and Research (CDER). Drug Interaction Studies—Study Design, Data Analysis, Implications for Dosing, and Labeling Recommendations Draft Guidance. Available online: http://www.fda.gov/downloads/Drugs/GuidanceComplianceRegulatoryInformation/Guidances/ucm292362.pdf (accessed on 31 October 2017).
  10. European Medicines Agency, Committee for Human Medicinal Products (CHMP). Guideline on the Investigation of Drug Interactions. Available online: http://www.ema.europa.eu/docs/en_GB/document_library/Scientific_guideline/2012/07/WC500129606.pdf (accessed on 31 October 2017).
  11. Huang, S.M.; Rowland, M. The role of physiologically based pharmacokinetic modeling in regulatory review. Clin. Pharmacol. Ther. 2012, 91, 542–549. [Google Scholar] [CrossRef] [PubMed]
  12. Fenneteau, F.; Poulin, P.; Nekka, F. Physiologically based predictions of the impact of inhibition of intestinal and hepatic metabolism on human pharmacokinetics of CYP3A substrates. J. Pharm. Sci. 2010, 99, 486–514. [Google Scholar] [CrossRef] [PubMed]
  13. Jamei, M.; Marciniak, S.; Feng, K.; Barnett, A.; Tucker, G.T.; Rostami-Hodjegan, A. The Simcyp population-based ADME simulator. Expert Opin. Drug Metab. Toxicol. 2009, 5, 211–223. [Google Scholar] [CrossRef] [PubMed]
  14. Kato, M.; Shitara, Y.; Sato, H.; Yoshisue, K.; Hirano, M.; Ikeda, T.; Sugiyama, Y. The quantitative prediction of CYP mediated drug interaction by physiologically based pharmacokineticmodeling. Pharm. Res. 2008, 25, 1891–1901. [Google Scholar] [CrossRef] [PubMed]
  15. Vossen, M.; Sevestre, M.; Niederalt, C.; Jang, I.J.; Willmann, S.; Edginton, A.N. Dynamically simulating the interaction of midazolam and the CYP3A4 inhibitor itraconazole using individual coupled wholebody physiologically-based pharmacokinetic (WB-PBPK) models. Theor. Biol. Med. Model. 2007, 4, 13. [Google Scholar] [CrossRef] [PubMed]
  16. Fahmi, O.A.; Maurer, T.S.; Kish, M.; Cardenas, E.; Boldt, S.; Nettleton, D. A combined model for predicting CYP3A4 clinical net drug-drug interaction based on CYP3A4 inhibition, inactivation, and induction determined in vitro. Drug Metab. Dispos. 2008, 36, 1698–1708. [Google Scholar] [CrossRef] [PubMed]
  17. Rostami-Hodjegan, A.; Tucker, G.T. ‘In silico’ simulations to assess the ‘in vivo’ consequences of ‘in vitro’ metabolic drug-drug interactions. Drug Discov. Today Technol. 2004, 1, 441–448. [Google Scholar] [CrossRef] [PubMed]
  18. Rowland Yeo, K.; Jamei, M.; Yang, J.; Tucker, G.T.; Rostami-Hodjegan, A. Physiologically basedmechanistic modeling to predict complex drug-drug interactions involving simultaneous competitive and time-dependent enzyme inhibition by parent compound and its metabolite in both liver and gut-the effect of diltiazem on the time-course of exposure to triazolam. Eur. J. Pharm. Sci. 2010, 39, 298–309. [Google Scholar] [PubMed]
  19. Zhang, X.; Quinney, S.K.; Gorski, J.C.; Jones, D.R.; Hall, S.D. Semiphysiologically based pharmacokinetic models for the inhibition of midazolam clearance by diltiazem and its major metabolite. Drug Metab. Dispos. 2009, 37, 1587–1597. [Google Scholar] [CrossRef] [PubMed]
  20. Huang, S.M. PBPK as a tool in regulatory review. Biopharm. Drug Dispos. 2012, 33, 51–52. [Google Scholar] [CrossRef] [PubMed]
  21. Leong, R.; Vieira, M.L.; Zhao, P.; Mulugeta, Y.; Lee, C.S.; Huang, S.M.; Burckart, G.J. Regulatory experience with physiologically based pharmacokinetic modeling for pediatric drug trials. Clin. Pharmacol. Ther. 2012, 91, 926–931. [Google Scholar] [CrossRef] [PubMed]
  22. Sinha, V.; Zhao, P.; Huang, S.M.; Zineh, I. Physiologically based pharmacokinetic modeling: From regulatory science to regulatory policy. Clin. Pharmacol. Ther. 2014, 95, 478–480. [Google Scholar] [CrossRef] [PubMed]
  23. Zhao, P.; Rowland, M.; Huang, S.M. Best practice in the use of physiologically based pharmacokinetic modeling and simulation to address clinical pharmacology regulatory questions. Clin. Pharmacol. Ther. 2012, 92, 17–20. [Google Scholar] [CrossRef] [PubMed]
  24. Faucette, S.R.; Hawke, R.L.; Lecluyse, E.L.; Shord, S.S.; Yan, B.; Laethem, R.M.; Lindley, C.M. Validation of bupropion hydroxylation as a selective marker of human cytochrome P450 2B6 catalytic activity. Drug Metab. Dispos. 2000, 28, 1222–1230. [Google Scholar] [PubMed]
  25. Golden, R.N.; De Vane, C.L.; Laizure, S.C.; Rudorfer, M.V.; Sherer, M.A.; Potter, W.Z. Bupropion in depression. II. The role of metabolites in clinical outcome. Arch. Gen. Psychiatry 1988, 45, 145–149. [Google Scholar] [CrossRef] [PubMed]
  26. Schroeder, D.H. Metabolism and kinetics of bupropion. J. Clin. Psychiatry 1983, 44, 79–81. [Google Scholar] [PubMed]
  27. Hesse, L.M.; Nevkatakrishnan, K.; Court, M.H.; von Moltke, L.L.; Duan, S.X.; Shader, R.I.; Greenblatt, D.J. 2B6 mediates the in vitro hydroxylation of bupropion: Potential drug interactions with other antidipressants. Drug Metab. Dispos. 2000, 28, 1176–1183. [Google Scholar] [PubMed]
  28. Reese, M.J.; Wurm, R.M.; Muir, K.T.; Generaux, G.T.; St John-Williams, L.; McConn, D.J. An in vitro mechanistic study to elucidate the desipramine/bupropion clinical drug-drug interaction. Drug Metab. Dispos. 2008, 36, 1198–1201. [Google Scholar] [CrossRef] [PubMed]
  29. Jefferson, J.W.; Pradko, J.F.; Muir, K.T. Bupropion for major depressive disorder: Pharmacokinetic and formulation considerations. Clin. Ther. 2005, 27, 1685–1695. [Google Scholar] [CrossRef] [PubMed]
  30. Rodgers, T.; Rowland, M. Physiologically based pharmacokinetic modelling 2: Predicting the tissue distribution of acids, very weak bases, neutrals and zwitterions. J. Pharm. Sci. 2006, 95, 1238–1257. [Google Scholar] [CrossRef] [PubMed]
  31. Findlay, J.W.; Van Wyck Fleet, J.; Smith, P.G.; Butz, R.F.; Hinton, M.L.; Blum, M.R.; Schroeder, D.H. Pharmacokinetics of bupropion, a novel antidepressant agent, following oral administration to healthy subjects. Eur. J. Clin. Pharmacol. 1981, 21, 127–135. [Google Scholar] [CrossRef] [PubMed]
  32. Kirchheiner, J.; Klein, C.; Meineke, I.; Sasse, J.; Zanger, U.M.; Mürdter, T.E.; Roots, I.; Brockmöller, J. Bupropion and 4-OH-bupropion pharmacokinetics in relation to genetic polymorphisms in CYP2B6. Pharmacogenetics 2003, 13, 619–626. [Google Scholar] [CrossRef] [PubMed]
  33. Connarn, J.N.; Zhang, X.; Babiskin, A.; Sun, D. Metabolism of bupropion by carbonyl reductases in liver and intestine. Drug Metab. Dispos. 2015, 43, 1019–1027. [Google Scholar] [CrossRef] [PubMed]
  34. Ketter, T.A.; Jenkins, J.B.; Schroeder, D.H.; Pazzaglia, P.J.; Marangell, L.B.; George, M.S.; Callahan, A.M.; Hinton, M.L.; Chao, J.; Post, R.M. Carbamazepine but not valproate induces bupropion metabolism. J. Clin. Psychopharmacol. 1995, 15, 327–333. [Google Scholar] [CrossRef] [PubMed]
  35. Poulin, P.; Theil, F.P. Prediction of pharmacokinetics prior to in vivo studies. 1. Mechanism-based prediction of volume of distribution. J. Pharm. Sci. 2002, 91, 129–156. [Google Scholar] [CrossRef] [PubMed]
  36. Ereshefsky, L.; Dugan, D. Review of the pharmacokinetics, pharmacogenetics, and drug interaction potential of antidepressants: Focus on venlafaxine. Depress. Anxiety 2000, 12 (Suppl. 1), 30–44. [Google Scholar] [CrossRef]
  37. Magalhães, P.; Alves, G.; LLerena, A.; Falcão, A. Clinical drug-drug interaction: Focus on venlafaxine. Drug Metab. Pers. Ther. 2015, 30, 3–17. [Google Scholar] [CrossRef] [PubMed]
  38. Taft, D.R.; Iyer, G.R.; Behar, L.; DiGregorio, R.V. Application of a first-pass effect model to characterize the pharmacokinetic disposition of venlafaxine after oraladministration to human subjects. Drug Metab. Dispos. 1997, 25, 1215–1218. [Google Scholar] [PubMed]
  39. Fogelman, S.M.; Schmider, J.; Venkatakrishnan, K.; von Moltke, L.L.; Harmatz, J.S.; Shader, R.I.; Greenblatt, D.J. O-and N-demethylation of venlafaxine in vitro by human liver microsomes and by microsomes from cDNA-transfected cells: Effect of metabolic inhibitors and SSRI antidepressants. Neuropsychopharmacology 1999, 20, 480–490. [Google Scholar] [CrossRef]
  40. Siccardi, M.; Marzolini, C.; Seden, K.; Almond, L.; Kirov, A.; Khoo, S.; Owen, A.; Back, D. Prediction of drug-drug interactions between various antidepressants and efavirenz or boosted protease inhibitors using a physiologically based pharmacokinetic modelling approach. Clin. Pharmacokinet. 2013, 52, 583–592. [Google Scholar] [CrossRef] [PubMed]
  41. De Buck, S.S.; Sinha, V.K.; Fenu, L.A.; Gilissen, R.A.; Mackie, C.E.; Nijsen, M.J. The prediction of drug metabolism, tissue distribution, and bioavailability of 50 structurally diverse compounds in rat using mechanism-based absorption, distribution, and metabolism prediction tools. Drug Metab. Dispos. 2007, 35, 649–659. [Google Scholar] [CrossRef] [PubMed]
  42. Jones, H.M.; Parrott, N.; Jorga, K.; Lavé, T. A novel strategy for physiologically based predictions of human pharmacokinetics. Clin. Pharmacokinet. 2006, 45, 511–542. [Google Scholar] [CrossRef] [PubMed]
  43. Parrott, N.; Paquereau, N.; Coassolo, P.; Lave, T. An evaluation of the utility of physiologically based models of pharmacokinetics in early drug discovery. J. Pharm. Sci. 2005, 94, 2327–2343. [Google Scholar] [CrossRef] [PubMed]
  44. Yamazaki, S.; Skaptason, J.; Romero, D.; Vekich, S.; Jones, H.M.; Tan, W.; Wilner, K.D.; Koudriakova, T. Prediction of oral pharmacokinetics of cMet kinase inhibitors in humans: Physiologically based pharmacokinetic model versus traditional one compartment model. Drug Metab. Dispos. 2011, 39, 383–393. [Google Scholar] [CrossRef] [PubMed]
  45. Sager, J.E.; Price, L.S.; Isoherranen, N. Stereoselective metabolism of bupropion to OHbupropion, threohydrobupropion, erythrohydrobupropion, and 4’-OH-bupropion in vitro. Drug Metab. Dispos. 2016, 44, 1709–1719. [Google Scholar] [CrossRef] [PubMed]
  46. Dash, R.P.; Rais, R.; Srinivas, N.R. Chirality and neuropsychiatric drugs: An update on stereoselective disposition and clinical pharmacokinetics of bupropion. Xenobiotica 2017, 13, 1–13. [Google Scholar] [CrossRef] [PubMed]
  47. Hsyu, P.H.; Singh, A.; Giargiari, T.D.; Dunn, J.A.; Ascher, J.A.; Johnston, J.A. Pharmacokinetics of bupropion and its metabolites in cigarette smokers versus nonsmokers. J. Clin. Pharmacol. 1997, 37, 737–743. [Google Scholar] [CrossRef] [PubMed]
  48. Hesse, L.M.; Greenblatt, D.J.; von Moltke, L.L.; Court, M.H. Ritonavir has minimal impact on the pharmacokinetic disposition of a single dose of bupropion administered to human volunteers. J. Clin. Pharmacol. 2006, 46, 567–576. [Google Scholar] [CrossRef] [PubMed]
  49. Posner, J.; Bye, A.; Dean, K.; Peck, A.W.; Whiteman, P.D. The disposition of bupropion and its metabolites in healthy male volunteers after single and multiple doses. Eur. J. Clin. Pharmacol. 1985, 29, 97–103. [Google Scholar] [CrossRef] [PubMed]
  50. Kennedy, S.H.; McCann, S.M.; Masellis, M.; McIntyre, R.S.; Raskin, J.; McKay, G.; Baker, G.B. Combining bupropion SR with venlafaxine, paroxetine, or fluoxetine: A preliminary report on pharmacokinetic, therapeutic, and sexual dysfunction effects. J. Clin. Psychiatry 2002, 63, 181–186. [Google Scholar] [CrossRef] [PubMed]
  51. Jiang, F.; Kim, H.D.; Na, H.S.; Lee, S.Y.; Seo, D.W.; Choi, J.Y.; Ha, J.H.; Shin, H.J.; Kim, Y.H.; Chung, M.W. The influences of CYP2D6 genotypes and drug interactions on the pharmacokinetics of venlafaxine: Exploring predictive biomarkers for treatment outcomes. Psychopharmacology 2015, 232, 1899–1909. [Google Scholar] [CrossRef] [PubMed]
  52. Kotlyar, M.; Brauer, L.H.; Tracy, T.S.; Hatsukami, D.K.; Harris, J.; Bronars, C.A.; Adson, D.E. Inhibition of CYP2D6 activity by bupropion. J. Clin. Psychopharmacol. 2005, 25, 226–229. [Google Scholar] [CrossRef] [PubMed]
  53. McCollum, D.L.; Greene, J.L.; McGuire, D.K. Severe sinus bradycardia after initiation of bupropion therapy: A probable drug-drug interaction with metoprolol. Cardiovasc. Drugs Ther. 2004, 18, 329–330. [Google Scholar] [CrossRef] [PubMed]
  54. Masters, A.R.; Gufford, B.T.; Lu, J.B.; Metzger, I.F.; Jones, D.R.; Desta, Z. Chiral plasma pharmacokinetics and urinary excretion of bupropion and metabolites in healthy volunteers. J. Pharmacol. Exp. Ther. 2016, 358, 230–238. [Google Scholar] [CrossRef] [PubMed]
  55. Sager, J.E.; Tripathy, S.; Price, L.S.; Nath, A.; Chang, J.; Stephenson-Famy, A.; Isoherranen, N. In vitro to in vivo extrapolation of the complex drug-drug interaction of bupropion and its metabolites with CYP2D6; simultaneous reversible inhibition and CYP2D6 downregulation. Biochem. Pharmacol. 2017, 123, 85–96. [Google Scholar] [CrossRef] [PubMed]
  56. Chenel, M.; Bouzom, F.; Cazade, F.; Ogungbenro, K.; Aarons, L.; Mentré, F. Drug-drug interaction predictions with PBPK models and optimal multiresponse sampling time designs: Application to midazolam and a phase I compound. Part 2: Clinical trial results. J. Pharmacokinet. Pharmacodyn. 2008, 35, 661–681. [Google Scholar] [CrossRef] [PubMed]
  57. Jones, H.M.; Dickins, M.; Youdim, K.; Gosset, J.R.; Attkins, N.J.; Hay, T.L.; Gurrell, I.K.; Logan, Y.R.; Bungay, P.J.; Jones, B.C.; et al. Application of PBPK modelling in drug discovery and development at Pfizer. Xenobiotica 2012, 42, 94–106. [Google Scholar] [CrossRef] [PubMed]
  58. Perdaems, N.; Blasco, H.; Vinson, C.; Chenel, M.; Whalley, S.; Cazade, F.; Bouzom, F. Predictions of metabolic drug-drug interactions using physiologically based modelling: Two cytochrome P450 3A4 substrates coadministered with ketoconazole or verapamil. Clin. Pharmacokinet. 2010, 49, 239–258. [Google Scholar] [CrossRef] [PubMed]
  59. Chen, Y.; Mao, J.; Hop, C.E. Physiologically based pharmacokinetic modeling to predict drug-drug interactions involving inhibitory metabolite: A case study of amiodarone. Drug Metab. Dispos. 2015, 43, 182–189. [Google Scholar] [CrossRef] [PubMed]
  60. Kudo, T.; Hisaka, A.; Sugiyama, Y.; Ito, K. Analysis of the repaglinide concentration increase produced by gemfibrozil and itraconazole based on the inhibition of the hepatic uptake transporter and metabolic enzymes. Drug Metab. Dispos. 2013, 41, 362–371. [Google Scholar] [CrossRef] [PubMed]
  61. Varma, M.V.S.; Lai, Y.; Kimoto, E.; Goosen, T.C.; El-Kattan, A.F.; Kumar, V. Mechanistic modeling to predict the transporter- and enzyme-mediated drug-drug interactions of repaglinide. Pharm. Res. 2013, 30, 1188–1199. [Google Scholar] [CrossRef] [PubMed]
  62. Loboz, K.K.; Gross, A.S.; Ray, J.; McLachlan, A.J. HPLC assay for bupropion and its major metabolites in human plasma. J. Chromatogr. B Anal. Technol. Biomed. Life Sci. 2005, 823, 115–121. [Google Scholar] [CrossRef] [PubMed]
  63. Matsunaga, T.; Shintani, S.; Hara, A. Multiplicity of mammalian reductases for xenobiotic carbonyl compounds. Drug Metab. Pharmacokinet. 2006, 21, 1–18. [Google Scholar] [CrossRef] [PubMed]
  64. Daviss, W.B.; Perel, J.M.; Rudolph, G.R.; Axelson, D.A.; Gilchrist, R.; Nuss, S.; Birmaher, B.; Brent, D.A. Steady-state pharmacokinetics of bupropion SR in juvenile patients. J. Am. Acad. Child. Adolesc. Psychiatry 2005, 44, 349–357. [Google Scholar] [CrossRef] [PubMed]
  65. Loboz, K.K.; Gross, A.S.; Williams, K.M.; Liauw, W.S.; Day, R.O.; Blievernicht, J.K.; Zanger, U.M.; McLachlan, A.J. Cytochrome P450 2B6 activity as measured by bupropion hydroxylation: Effect of induction by rifampin and ethnicity. Clin. Pharmacol. Ther. 2006, 80, 75–84. [Google Scholar] [CrossRef] [PubMed]
  66. Palovaara, S.; Pelkonen, O.; Uusitalo, J.; Lundgren, S.; Laine, K. Inhibition of cytochrome P450 2B6 activity by hormone replacement therapy and oral contraceptive as measured by bupropion hydroxylation. Clin. Pharmacol. Ther. 2003, 74, 326–333. [Google Scholar] [CrossRef]
  67. Stewart, J.J.; Berkel, H.J.; Parish, R.C.; Simar, M.R.; Syed, A.; Bocchini, J.A., Jr.; Wilson, J.T.; Manno, J.E. Single-dose pharmacokinetics of bupropion in adolescents: Effects of smoking status and gender. J. Clin. Pharmacol. 2001, 41, 770–778. [Google Scholar] [CrossRef] [PubMed]
  68. Worrall, S.P.; Almond, M.K.; Dhillon, S. Pharmacokinetics of bupropion and its metabolites in haemodialysis patients who smoke. A single dose study. Nephron. Clin. Pract. 2004, 97, c83–c89. [Google Scholar] [CrossRef] [PubMed]
  69. Bondarev, M.L.; Bondareva, T.S.; Young, R.; Glennon, R.A. Behavioral and biochemical investigations of bupropion metabolites. Eur. J. Pharmacol. 2003, 474, 85–93. [Google Scholar] [CrossRef]
  70. Damaj, M.I.; Carroll, F.I.; Eaton, J.B.; Navarro, H.A.; Blough, B.E.; Mirza, S.; Lukas, R.J.; Martin, B.R. Enantioselective effects of hydroxy metabolites of bupropion on behavior and on function of monoamine transporters and nicotinic receptors. Mol. Pharmacol. 2004, 66, 675–682. [Google Scholar] [CrossRef] [PubMed]
  71. Damaj, M.I.; Grabus, S.D.; Navarro, H.A.; Vann, R.E.; Warner, J.A.; King, L.S.; Wiley, J.L.; Blough, B.E.; Lukas, R.J.; Carroll, F.I. Effects of hydroxymetabolites of bupropion on nicotine dependence behavior in mice. J. Pharmacol. Exp. Ther. 2010, 334, 1087–1095. [Google Scholar] [CrossRef] [PubMed]
  72. Zhu, A.Z.; Cox, L.S.; Nollen, N.; Faseru, B.; Okuyemi, K.S.; Ahluwalia, J.S.; Benowitz, N.L.; Tyndale, R.F. CYP2B6 and bupropion’s smoking-cessation pharmacology: The role of hydroxybupropion. Clin. Pharmacol. Ther. 2012, 92, 771–777. [Google Scholar] [CrossRef] [PubMed]
Figure 1. Bupropion and metabolism. Bupropion is metabolized by CYP2B6 to form hydroxybupropion and by carbonyl reductase to form the diastereoisomers threohydrobupropion and erythrohydrobupropion. CR: carbonyl reductase.
Pharmaceutics 10 00001 g001
Figure 2. Predicted and observed mean plasma concentration-time profiles of bupropion (A); hydroxybupropion (B); threohydrobupropion (C) and erythrohydrobupropion (D) after a single oral dose of 150 mg bupropion. The solid lines represent the predicted mean. The dotted lines represent the 5th and 95th percentile of the predicted values for virtual population. Symbols represent mean observed data (n = 17) [34,47].
Pharmaceutics 10 00001 g002
Figure 3. Predicted and observed mean plasma concentration–time profiles of bupropion (A); hydroxybupropion (B); threohydrobupropion (C) and erythrohydrobupropion (D) after a single oral dose of 75 mg bupropion. The solid lines represent the predicted mean. The dotted lines represent 5th and 95th percentile of the predicted values for virtual population. Symbols represent mean observed data (n = 7) [48].
Pharmaceutics 10 00001 g003
Figure 4. Predicted and observed mean plasma concentration–time profiles of bupropion (A); hydroxybupropion (B); threohydrobupropion (C) and erythrohydrobupropion (D) after a single oral dose of 100 mg bupropion. The solid lines represent the predicted mean. The dotted lines represent 5th and 95th percentile of the predicted values for virtual population. Symbols represent mean observed data (n = 8) [49].
Pharmaceutics 10 00001 g004
Figure 5. Predicted and observed mean plasma concentration-time profiles of desipramine after a single oral dose of 50 mg desipramine in the absence or presence of a twice-daily dose of 150 mg bupropion. The black solid lines represent the predicted mean concentrations when administered alone; the gray solid lines represent the predicted mean concentrations when co-administered with bupropion. The black and gray dotted lines represent 5th and 95th percentile of the predicted values for virtual population before and after co-administered with bupropion, respectively. Closed circles, observed plasma concentrations when administered alone (n = 15) [28]; Stars, observed plasma concentrations when co-administered with bupropion (n = 15) [28].
Pharmaceutics 10 00001 g005
Figure 6. Predicted and observed mean plasma concentration–time profiles of hydroxybupropion with 90 mg (A); threohydrobupropion with 30 mg (B) and erythrohydrobupropion with 4 mg (C). The solid lines represents the predicted mean. The dotted lines represents 5th and 95th percentile of the predicted values for virtual population. Symbols represent mean observed data which is metabolized from a single oral dose of 150 mg bupropion (n = 17) [34,47].
Pharmaceutics 10 00001 g006
Table 1. Parameters for bupropion used in physiologically-based pharmacokinetic (PBPK) modeling.
ParameterBupropion
ValueReferences/Comments
Mol weight (g/mol)239.74Drug bank
Log Po:w3.28Drug bank
pKa8.22Drug bank
B/P0.82[29]
fu,p0.16[28]
fa1[26]
ka (h−1)0.8[34]
Tlag (h)0.8[31]
Kp scalar5.4Simcyp best fit
Vss (L/kg)19[31]
EnzymeCYP2B6Metabolite: hydroxybupropion
Vmax (pmol/min per milligram)3623[27]
Km (μM)89[27]
fu,mic0.16Assumed = fu,p
EnzymeCYP2B6Metabolite: threohydrobupropion
Vmax (pmol/min per milligram)98.4[33]
Km (μM)186.3[33]
fu,mic0.003Simcyp best fit, correct expression of carbonyl reductase
EnzymeCYP2B6Metabolite: erythrohydrobupropion
Vmax (pmol/min per milligram)2.6[33]
Km (μM)41.4[33]
fu,mic0.003Simcyp best fit, correct expression of carbonyl reductase
B/P, blood-to-plasma ratio; fu,p, free fraction in plasma; fa, fraction of dose absorbed; ka, first-order absorption rate constant; Tlag, lag time; Vss, steady-state volume of distribution; Km, Michaelis constant; Vmax, Maximum metabolic rate; fu,mic, free fraction in liver microsome.
Table 2. Parameters for hydroxybupropion, threohydrobupropion and erythrohydrobupropion used in PBPK modeling.
ParameterHydroxybupropionThreohydrobupropionErythrohydrobupropion
ValueReferences/CommentsValueReferences/CommentsValueReferences/Comments
Mol weight (g/mol)255.74ACD-ilab241.757ACD-ilab241.757ACD-ilab
Log Po:w2.03ACD-ilab2.88ACD-ilab2.88ACD-ilab
pKa7.4ACD-ilab7.4ACD-ilab9.6ACD-ilab
B/P0.82Assigned using bupropion value0.82Assigned using bupropion value0.82Assigned using bupropion value
fu,p0.23[28]0.58[28]0.58[28]
Vsac (L/kg)0.5Simcyp best fit5.83Simcyp best fitN/A
Vss (L/kg)2.15Predicted with Rogers method9.11Predicted with Rogers method1.47Predicted with Rogers method
Kp scalar1Simcyp default value1Simcyp default value2Simcyp best fit
CLpo (L/h)5.76Simcyp best fit21.15Simcyp best fit21.69Simcyp best fit
B/P, blood-to-plasma ratio; fu,p, free fraction in plasma; Vsac, volume of distribution of compartment; Vss, steady-state volume of distribution; CLpo, oral clearance; N/A, not available. ACD-ilab, the online prediction engine from Advanced Chemistry Development, Inc.
Table 3. Parameters for venlafaxine used in PBPK modeling.
ParameterVenlafaxine
ValueReferences/Comments
Mol weight (g/mol)277.402[40]
Log Po:w2.8[40]
pKa9.4[40]
B/P1.17[40]
fu,p0.73[40]
fa0.92[37]
ka (h−1)1.31[38]
Tlag (h)1.44Simcyp best fit
Kp scalar2.3Predicted with Poulin and Theil method
Vss (L/kg)7[38]
EnzymeCYP2D6
CLint (µL/min/pmol of isoform)5.825Retrograde calculation in Simcyp to account for 80% Hep CL from CYP2D6
CLint-additional (µL/min/mg protein)11.65Simcyp predicted
B/P, blood-to-plasma ratio; fu,p, free fraction in plasma; fa, fraction of dose absorbed; ka, first-order absorption rate constant; Tlag, lag time; Vss, steady-state volume of distribution.
Table 4. In vitro P450 inhibition parameters for bupropion and its metabolism.
ParameterBupropionHydroxybupropionThreohydrobupropionErythrohydrobupropion
Ki (μM)21135.41.7
All data from [28]. Ki here are apparent values, and are corrected for free fraction in microsome (fu,mic = 0.01) estimated in the Simcyp model.
Table 5. PBPK model-predicted drug-drug interactions (DDIs) between bupropion and desipramine/venlafaxine.
InhibitorsAUC RatioCmax RatioTmax Ratio
Bupropion + Desipramine (observed)5.21.92
Bupropion (predicted)2.271.151.10
Hydroxybupropion (predicted)4.581.761.84
Threohydrobupropion (predicted)3.471.611.47
Erythrohydrobupropion (predicted)2.831.451.47
Bup + H-Bup + T-Bup + E-Bup (predicted)5.051.791.84
Bupropion + Venlafaxine (observed)N/A2.5N/A
Bupropion (predicted)1.301.271
Hydroxybupropion (predicted)2.491.941
Threohydrobupropion (predicted)2.141.801
Erythrohydrobupropion (predicted)1.761.601
Bup + H-Bup + T-Bup + E-Bup (predicted)3.032.241
Bup, Bupropion; H-Bup, Hydroxybupropion; T-Bup, Threohydrobupropion; E-Bup, Erythrohydrobupropion; AUC (concentration–time curve) ratio, AUC in the presence of inhibitor/AUC in the absence of inhibitor; Cmax ratio, Cmax in the presence of inhibitor/Cmax in the absence of inhibitor; Tmax ratio, Tmax in the presence of inhibitor/Tmax in the absence of inhibitor; N/A, not available.
Table 6. PBPK model-predicted DDIs between bupropion with other potential CYP2D6 substrates.
SubstrateAUC RatioCmax Ratio
Bufuralol2.041.55
Tolterodine2.912.17
Metoprolol3.532.57
Dextromethorphan4.063.05
AUC ratio, AUC in the presence of inhibitor/AUC in the absence of inhibitor; Cmax ratio, Cmax in the presence of inhibitor/Cmax in the absence of inhibitor.
Table 7. Parameters for R-bupropion, S bupropion, RR-hydroxybupropion, SS-hydroxybupropion, RR-threohydrobupropion, SS-threohydrobupropion, SR-erythrohydrobupropion and RS-erythrohydrobupropion used in PBPK modeling.
ParameterValueReferences/Comments
R-BUP
Clint (μL/min per pmol)
CYP2B612Metabolite: RR-OHBUPRetrograde calculation in Simcyp to account for 34% of total CL [46]
CYP2C195.36
CYP3A40.58
CYP2J227Metabolite: RR-TBRetrograde calculation in Simcyp to account for 50% of total CL [46]
CYP2J24.24Metabolite: SR-EBRetrograde calculation in Simcyp to account for 8% of total CL [46]
CYP2C194.24Metabolite: R-4′-OHBUPRetrograde calculation in Simcyp to account for 8% of total CL [46]
S-BUP
Clint (μL/min per pmol)
CYP2B620.56Metabolite: SS-OHBUPRetrograde calculation in Simcyp to account for 12% of total CL [46]
CYP2C1912.61
CYP3A41.37
CYP2J2236.16Metabolite: SS-TBRetrograde calculation in Simcyp to account for 82% of total CL [46]
CYP2J211.52Metabolite: RS-EBRetrograde calculation in Simcyp to account for 4% of total CL [46]
CYP2C195.76Metabolite: S- 4’-OHBUPRetrograde calculation in Simcyp to account for 2% of total CL [46]
RR-OHBUP
CLpo (L/h)6.76Simcyp best fit
SS-OHBUP
Vss (L/kg)10.5Predicted with Rogers method
Kp scalar5Simcyp best fit
CLpo (L/h)305.8Simcyp best fit
RR-TB
Vss (L/kg)4.7Predicted with Poulin and Theil method
Kp scalar1Simcyp default value
CLpo (L/h)20Simcyp best fit
SS-TB
Vss (L/kg)4.7Predicted with Poulin and Theil method
Kp scalar1Simcyp default value
CLpo (L/h)120Simcyp best fit
SR-EB
Vss (L/kg)3.07Predicted with Poulin and Theil method
Kp scalar1Simcyp default value
CLpo (L/h)11.69Simcyp best fit
RS-EB
Vss (L/kg)9.08Predicted with Poulin and Theil method
Kp scalar3Simcyp best fit
CLpo (L/h)52Simcyp best fit
R-BUP, R-Bupropion; S-BUP, S-Bupropion; RR-OHBUP, RR-Hydroxybupropion; SS-OHBUP, SS-Hydroxybupropion; RR-TB, RR-Threohydrobupropion; SS-TB, SS-Threohydrobupropion; SR-EB, SR-Erythrohydrobupropion; RS-EB, RS-Erythrohydrobupropion; R-4′-OHBUP, R-4′-Hydroxybupropion; S-4′-OHBUP, S-4′-Hydroxybupropion.
Table 8. Observed versus predicted PK data (AUC, Cmax and Tmax) of stereo-selective bupropion and its metabolites in the PBPK model of stereo-selective bupropion and its metabolites study.
PK ParameterAUC (nM·h)Cmax (nM)
PredictedObserved [54]PredictedObserved [54]
R-BUP1343.681162196.37288
S-BUP291.2719353.2047
RR-OHBUP37,777.6337,4211564.591240
SS-OHBUP524.7558033.8535.9
RR-TB3228.593326117.1979.9
SS-TB1813.41433159.34168
SR-EB872.6594233.3130.5
RS-EB195.481858.1210.6
R-BUP, R-Bupropion; S-BUP, S-Bupropion; RR-OHBUP, RR-Hydroxybupropion; SS-OHBUP, SS-Hydroxybupropion; RR-TB, RR-Threohydrobupropion; SS-TB, SS-Threohydrobupropion; SR-EB, SR-Erythrohydrobupropion; RS-EB, RS-Erythrohydrobupropion.
Table 9. PBPK model-predicted DDIs of between bupropion with desipramine.
InhibitorsKiAUC RatioCmax RatioTmax Ratio
Bupropion + Desipramine (observed) 5.21.92
R-BUP + RR-OHBUP + EB + TB (predicted) 2.531.211.47
S-BUP + SS-OHBUP + EB + TB (predicted) 1.931.031.10
R-BUP (predicted)12.51.830.961.10
S-BUP (predicted)0.911.840.971.10
RR-OHBUP (predicted)1.52.451.191.47
SS-OHBUP (predicted)4.31.840.971.10
Threohydrobupropion (predicted)3.971.880.991.10
Erythrohydrobupropion (predicted)0.911.870.981.10
Bup, Bupropion; H-Bup, Hydroxybupropion; T-Bup, Threohydrobupropion; E-Bup, Erythrohydrobupropion; AUC ratio, AUC in the presence of inhibitor/AUC in the absence of inhibitor; Cmax ratio, Cmax in the presence of inhibitor/Cmax in the absence of inhibitor; Tmax ratio, Tmax in the presence of inhibitor/Tmax in the absence of inhibitor.

