1. Introduction
The amorphous state of solid compounds is characterized by the absence of orientational and positional long range order, typical for the crystalline solid state [
1]. Amorphous forms may however contain some residual order from their crystalline counterparts as well as near order over the length scale of a few molecules [
2]. Amorphous forms of drugs are attractive in drug development, especially for poorly water soluble compounds (BCS Class 2 compounds), as they possess a faster dissolution rate and higher apparent solubility than their respective crystalline forms [
3]. This advantage, however, goes hand in hand with an increased physical instability, and amorphous systems have a tendency to convert back to the thermodynamically more stable crystalline state (either a metastable or the stable polymorphic form) [
4]. Although conventional X-ray powder diffraction (XRPD) is routinely used to analyze non-crystalline material it has to be taken into account that this technique is directly measuring a crystalline property (long range order, leading to diffraction peaks in the diffractograms), the absence of which is in turn interpreted as amorphousness [
1]. In contrast, the application of atomic pair-wise distribution functions (PDF) to the diffractograms takes both, diffracted and diffuse X-ray scattering into account, and thus also probes the non-crystalline signals of the diffractograms [
2,
5,
6].
The PDF technique utilizes a Fourier transformation of the XRPD diffractograms to produce a trace in a coordinate system. The y-axis in the PDF trace is corresponding to the probability of finding two atoms separated by a distance stipulated by the x-axis. The PDF hence assesses the inter-atomic distances of the material [
2,
7,
8,
9]. The accuracy of this assessment of inter-atomic distances is directly proportional to the energy of the utilized radiation source [
10,
11]. It is therefore inferred that using low energy X-rays, as is done in this study, does not provide an assessment of the atomic structure but may nevertheless be sufficient to display changes in the diffuse scattering of the amorphous samples. PDF analysis has been employed for many decades within the field of material science [
12,
13]. PDF analysis has more recently been applied within the pharmaceutical sciences on chemical compounds such as piroxicam [
8], saquinavir [
14], indomethacin [
2,
5] and polymer-drug mixtures [
15,
16].
The aim of this study was to investigate the influence of milling and quench cooling on two different forms of amlodipine besilate using XRPD, Raman spectroscopy (as a molecular level technique, commonly used complementary to XRPD) and PDF analysis of the XRPD patterns.
3. Results and Discussion
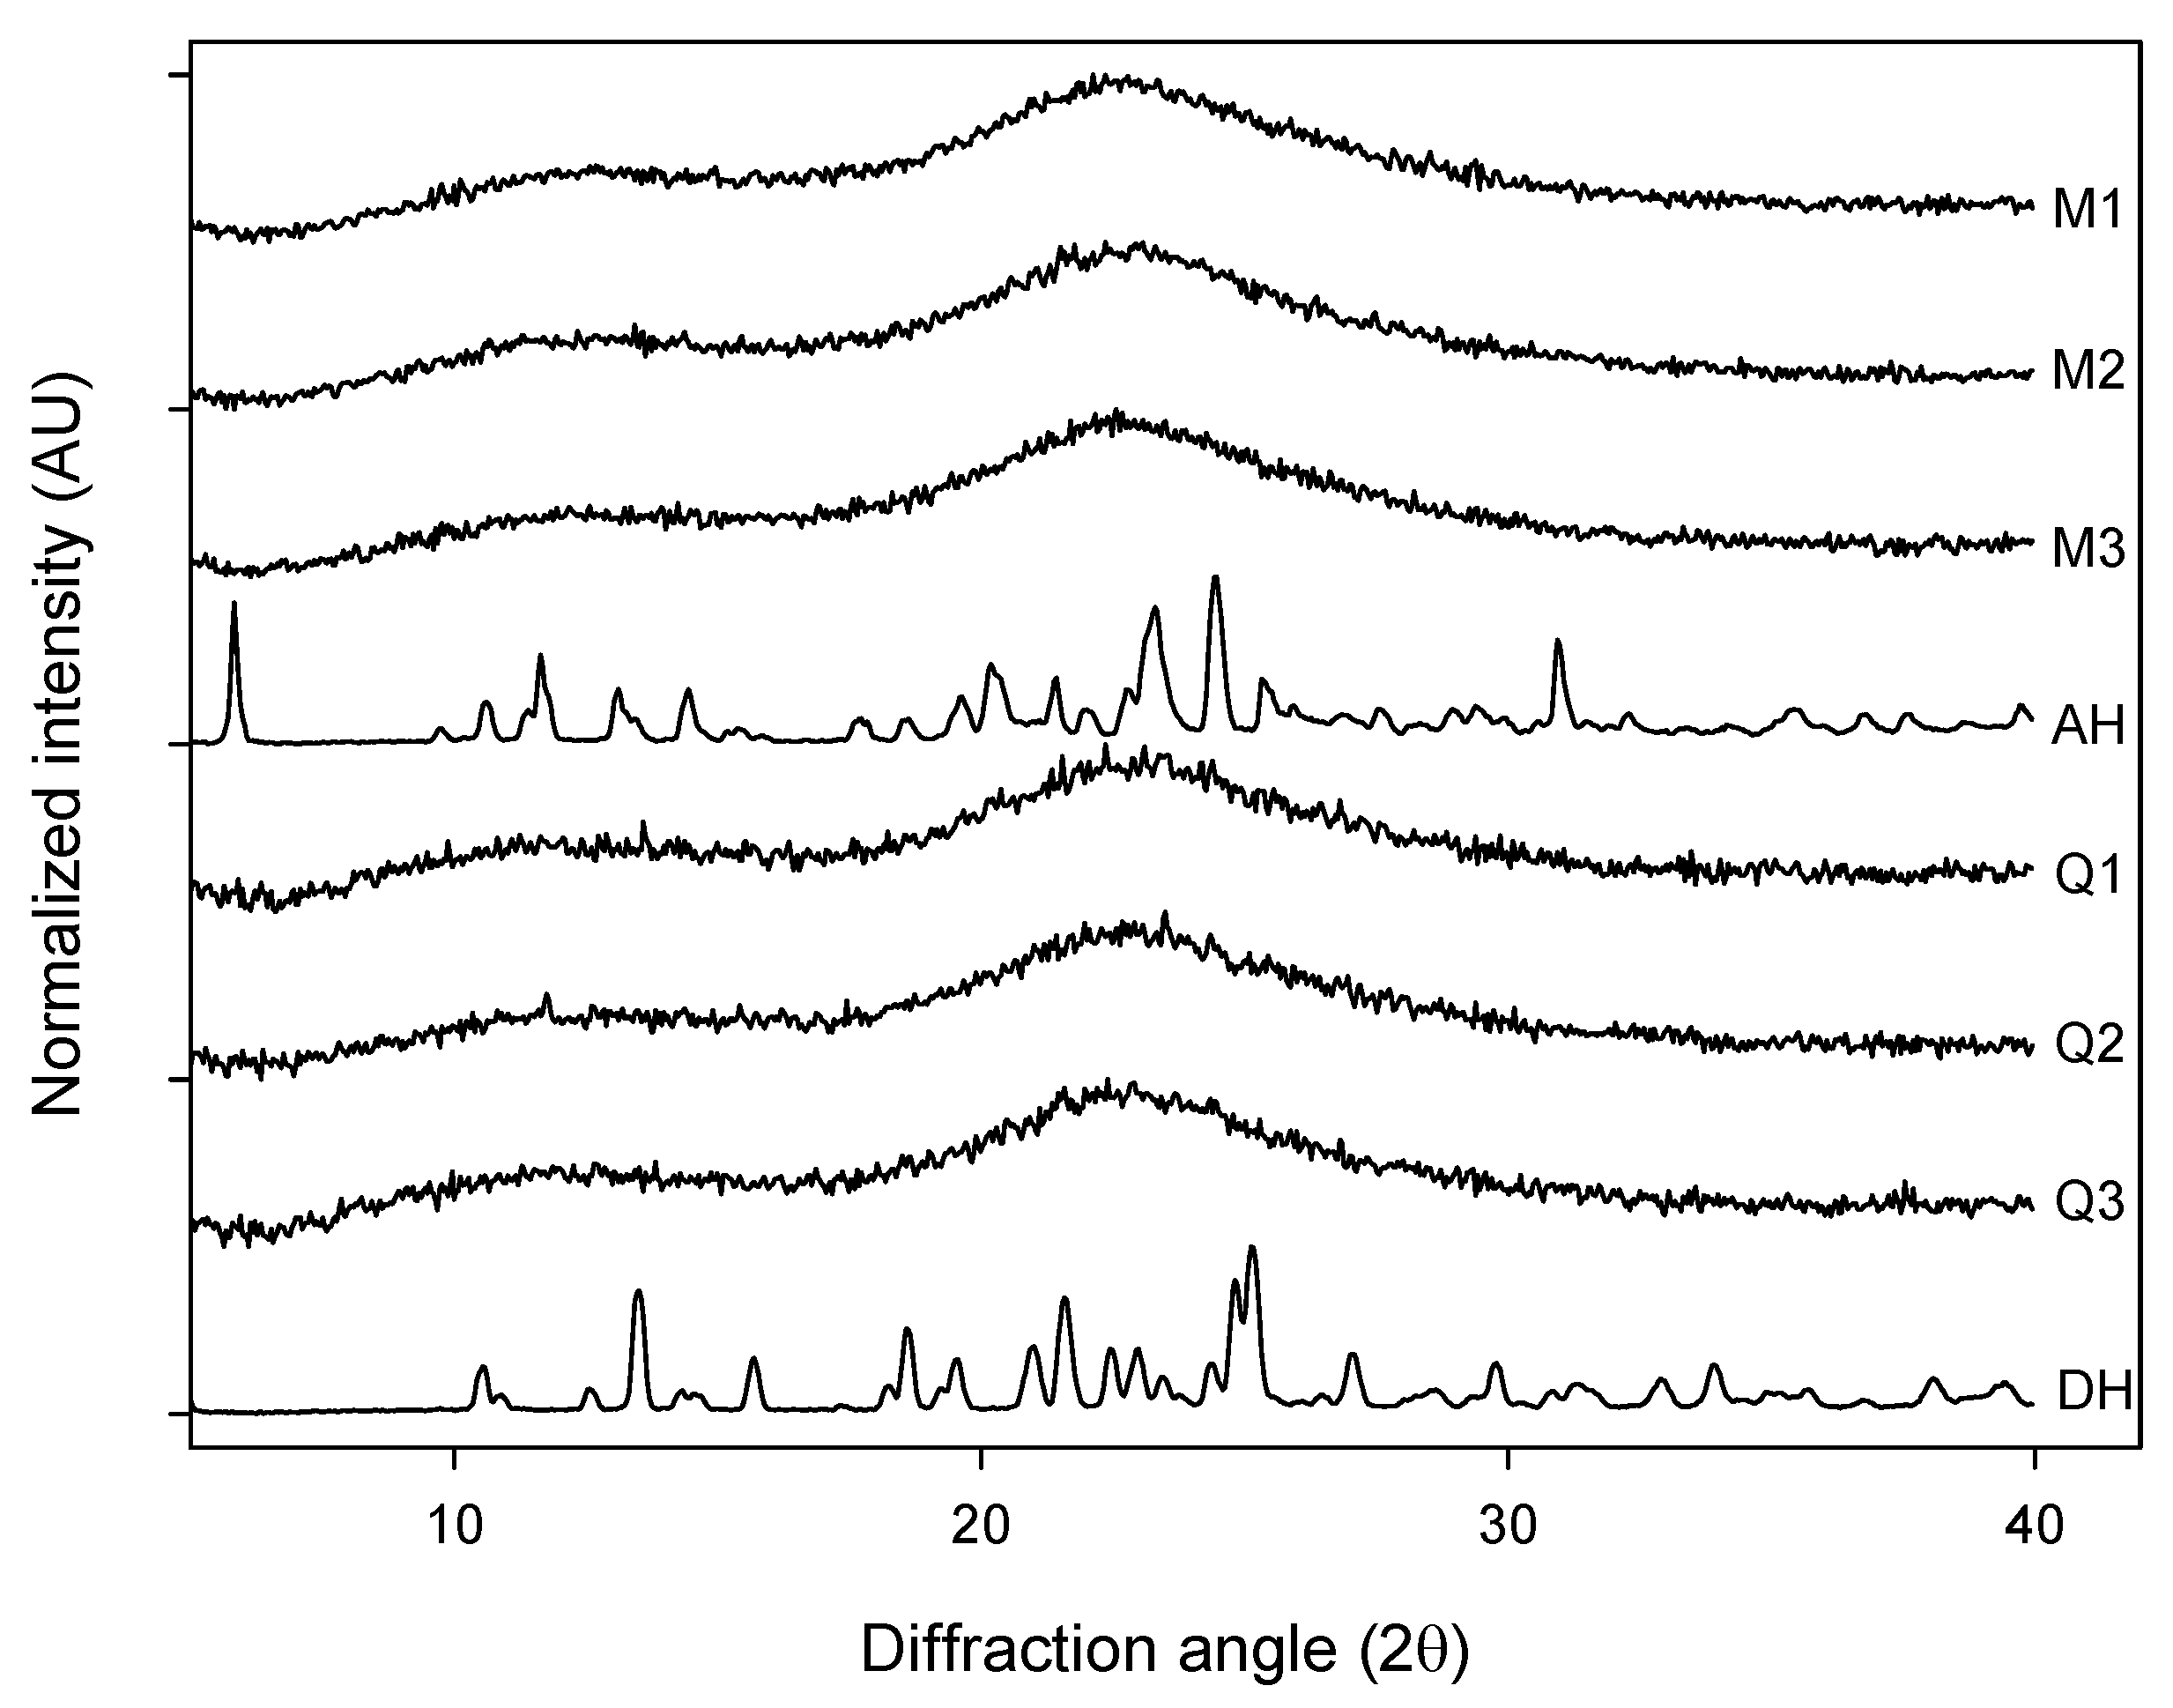
The different forms of AMB were subjected to X-ray powder diffraction measurement. The milled samples of AH (M1, M2 and M3) as well as the quench cooled samples of DH (Q1, Q2 and Q3) displayed XRPD diffractograms that can be characterized as broad and featureless whereas the crystalline anhydrate (AH) and dihydrate (DH) showed patterns similar to the published ones [
17,
20] (
Figure 1). The broad features seen for the processed samples did not provide any visual evidence for differences in the degree of disorder between the milled and quench cooled samples.
Figure 1.
XRPD diffractograms of: milled samples (M1, M2 and M3), quench cooled samples (Q1, Q2 and Q3), crystalline anhydrate (AH) and crystalline dihydrate (DH).
Figure 1.
XRPD diffractograms of: milled samples (M1, M2 and M3), quench cooled samples (Q1, Q2 and Q3), crystalline anhydrate (AH) and crystalline dihydrate (DH).
Figure 2.
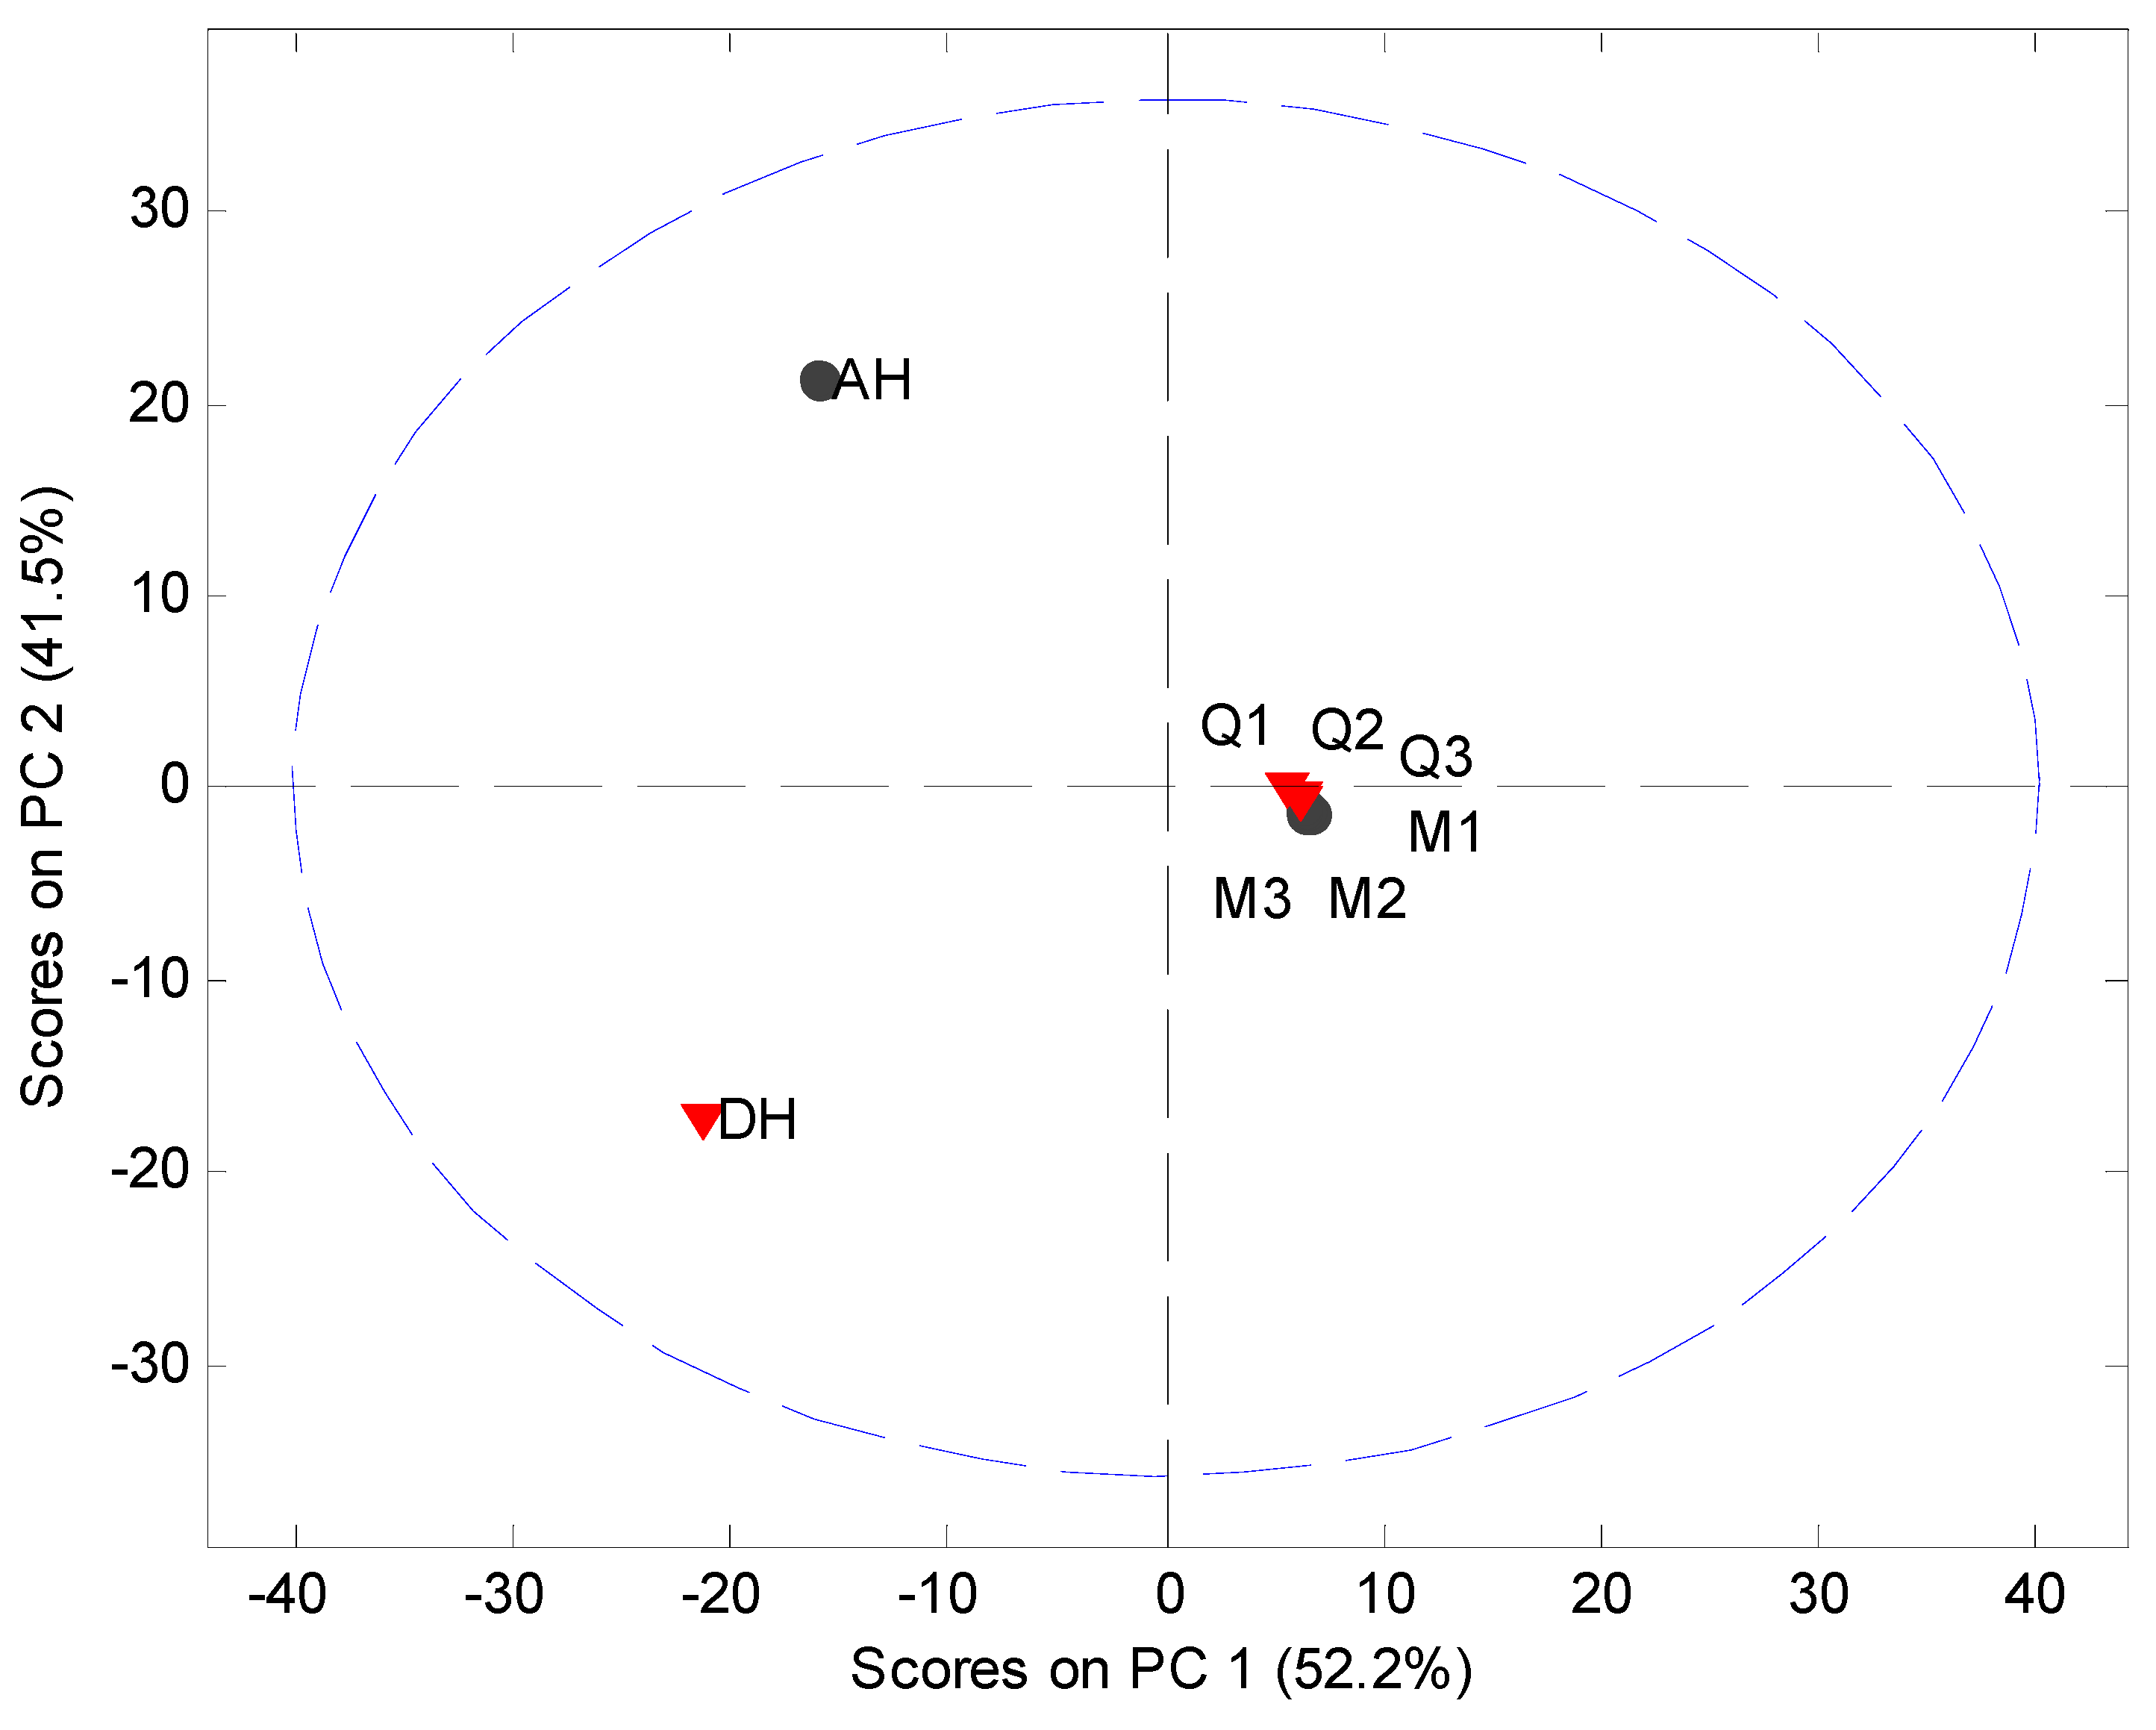
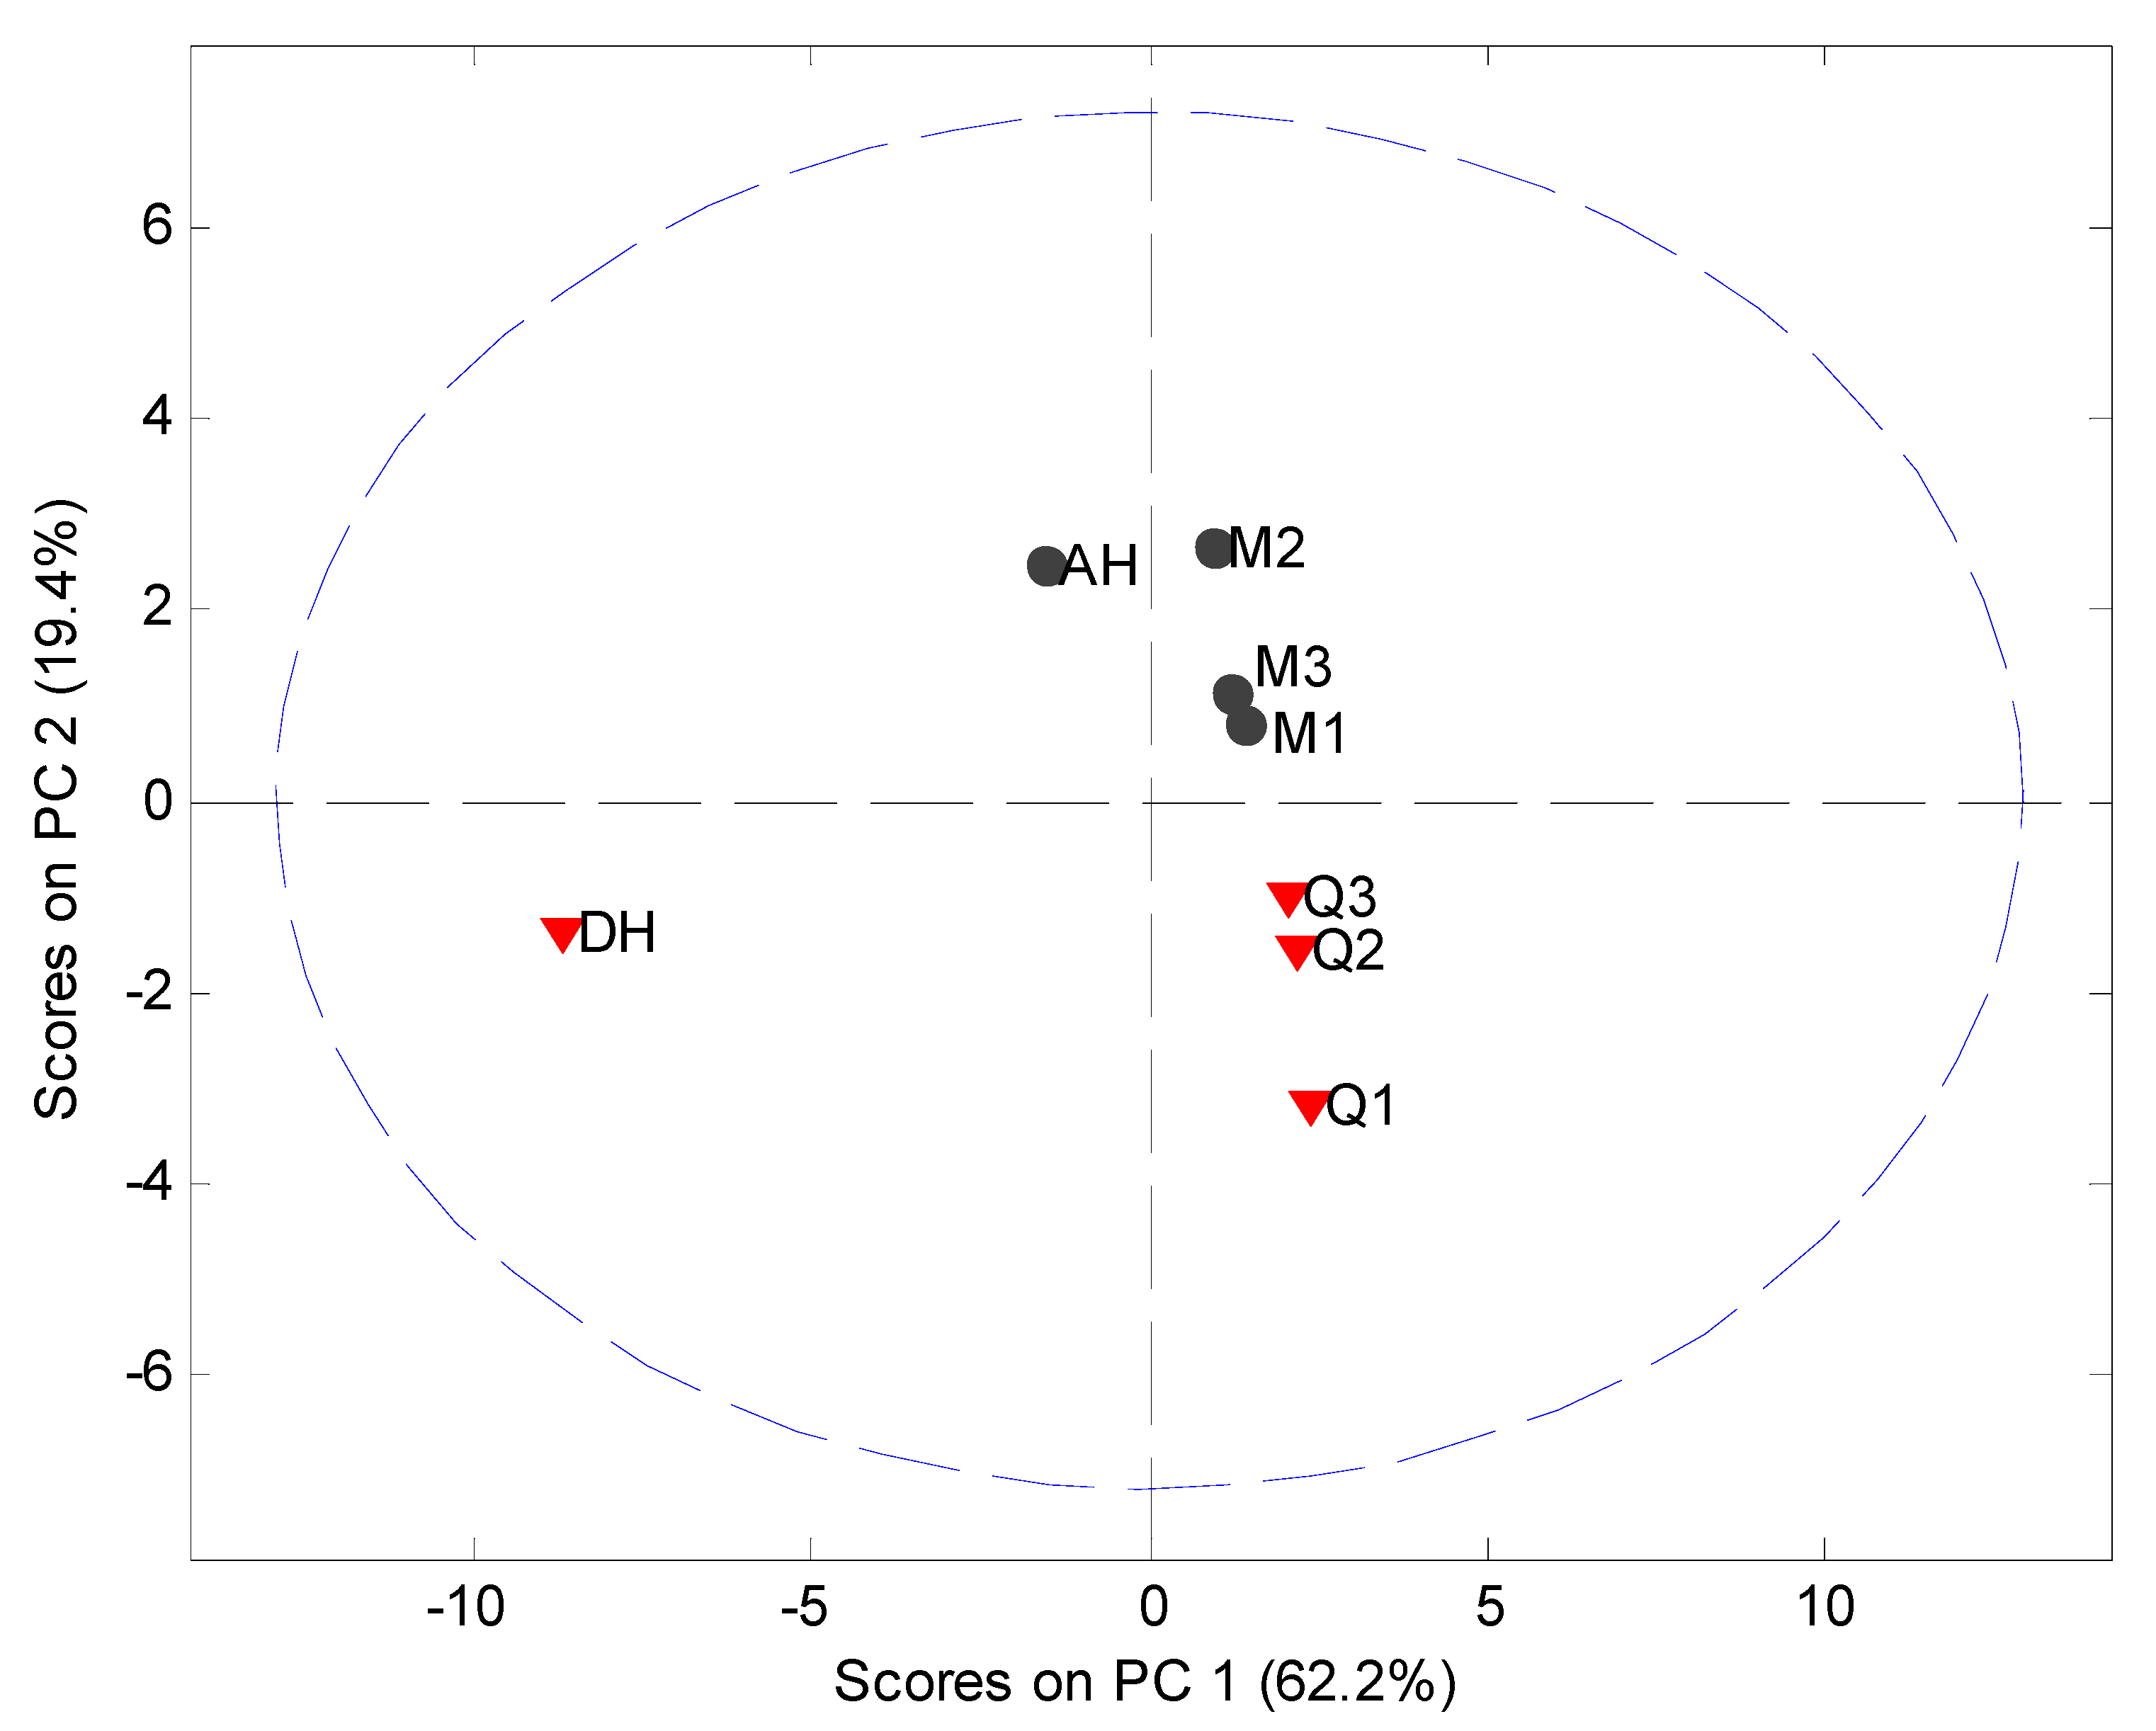
PCA score plot of the original XRPD data (5° 2θ to 40° 2θ) of milled samples (M1, M2 and M3), quench cooled samples (Q1, Q2 and Q3), crystalline anhydrate (AH) and crystalline dihydrate (DH).
Figure 2.
PCA score plot of the original XRPD data (5° 2θ to 40° 2θ) of milled samples (M1, M2 and M3), quench cooled samples (Q1, Q2 and Q3), crystalline anhydrate (AH) and crystalline dihydrate (DH).
MVDA has been widely used as a fast approach for evaluation of solid state phenomena [
21] and is subsequently employed in this study. MVDA was performed using standard normal variate (SNV) correction and mean centering of the 5° to 40° 2
θ part of the diffractogram (
Figure 2). The model explained 93.7% of the variation in the data set using two principal components (PCs). The scores plot indicated that only the crystalline counterparts can be readily distinguished from each other and the processed samples. However, such information is also easily obtained from the diffractograms themselves. Several other models using different preprocessing, multiple PCs and exclusion of the crystalline samples from the data set were tried. However, it was not possible to obtain a separation of the XRPD diffractograms into clusters of the milled and quench cooled samples.
Figure 3.
Raman spectra of milled samples (M1, M2 and M3), quench cooled samples (Q1, Q2 and Q3), crystalline anhydrate (AH) and crystalline dihydrate (DH).
Figure 3.
Raman spectra of milled samples (M1, M2 and M3), quench cooled samples (Q1, Q2 and Q3), crystalline anhydrate (AH) and crystalline dihydrate (DH).
Figure 4.
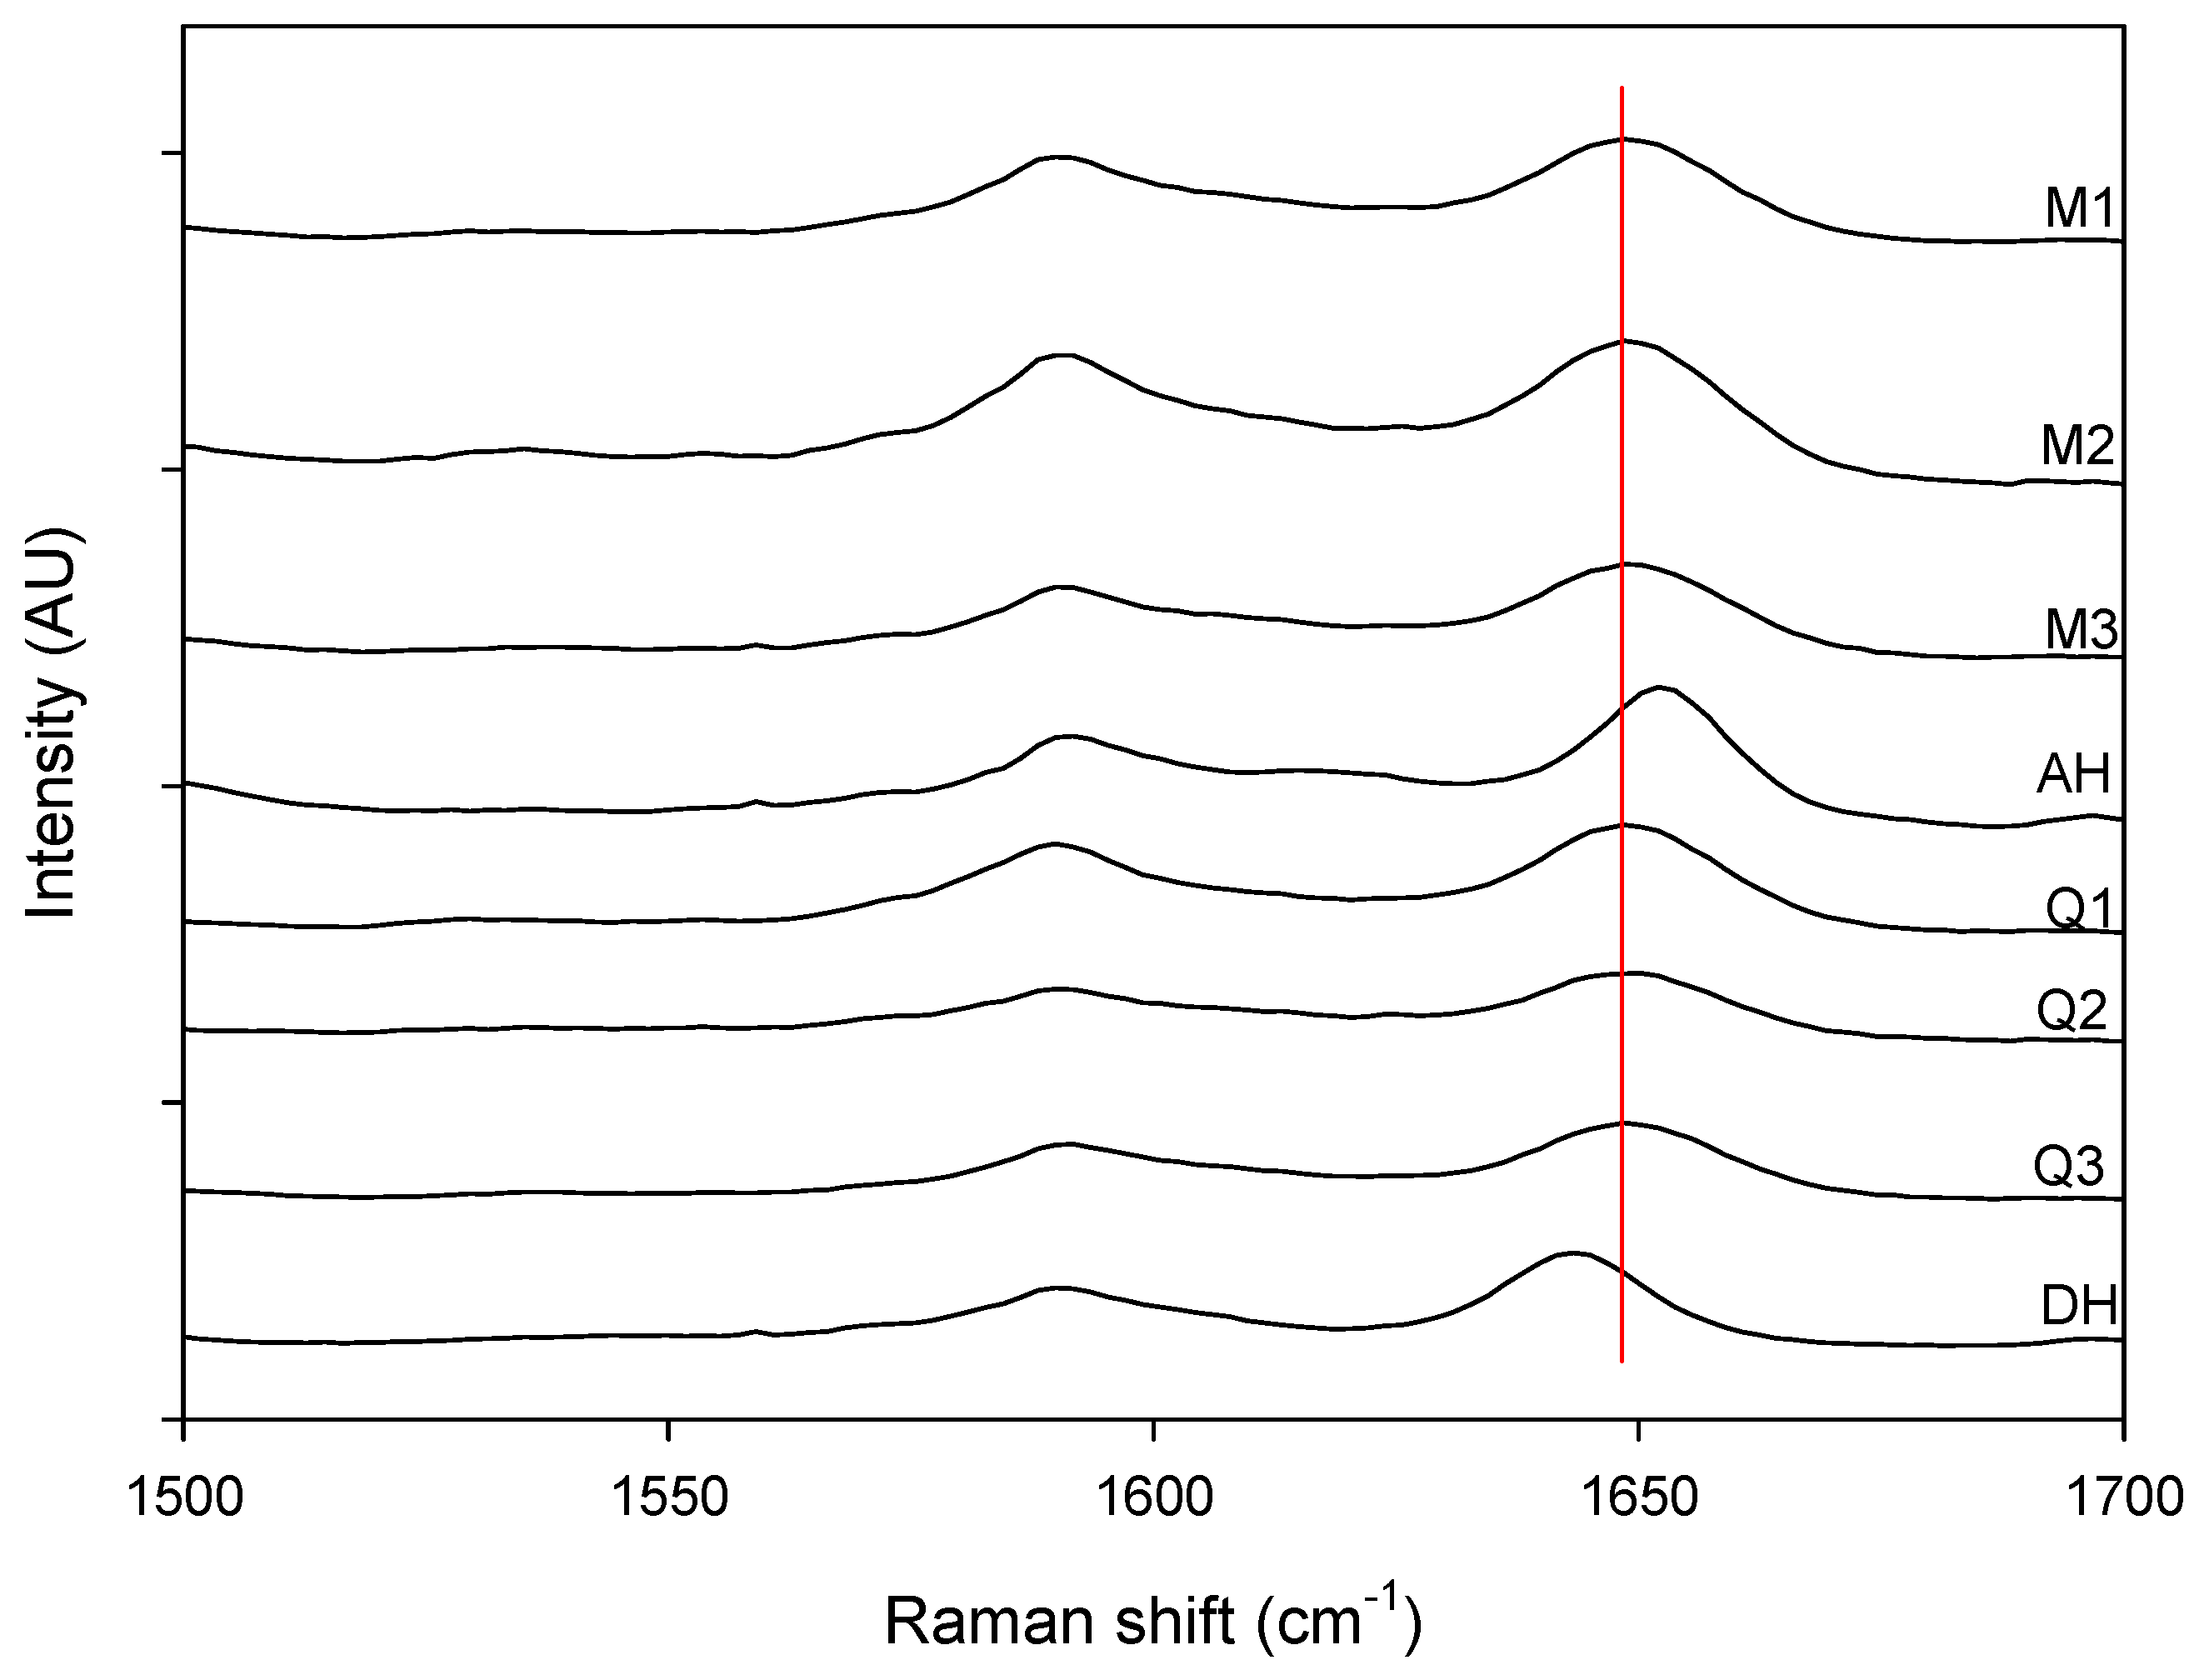
Magnification of the 1500 cm−1 to 1700 cm−1 spectral region. Milled samples (M1, M2 and M3), quench cooled samples (Q1, Q2 and Q3), crystalline anhydrate (AH) and crystalline dihydrate (DH).
Figure 4.
Magnification of the 1500 cm−1 to 1700 cm−1 spectral region. Milled samples (M1, M2 and M3), quench cooled samples (Q1, Q2 and Q3), crystalline anhydrate (AH) and crystalline dihydrate (DH).
Figure 3 shows that a change could be observed in the Raman spectra for the milled and quench cooled samples. For example a peak shift from 1643 cm
−1 to 1648 cm
−1 occurred during dehydration and a peak shift from 1652 cm
−1 to 1648 cm
−1 occurred during milling. This peak at 1648 cm
−1 (red line in
Figure 4) corresponds to the amorphous form and can be used to monitor the solid state transformation [
17].
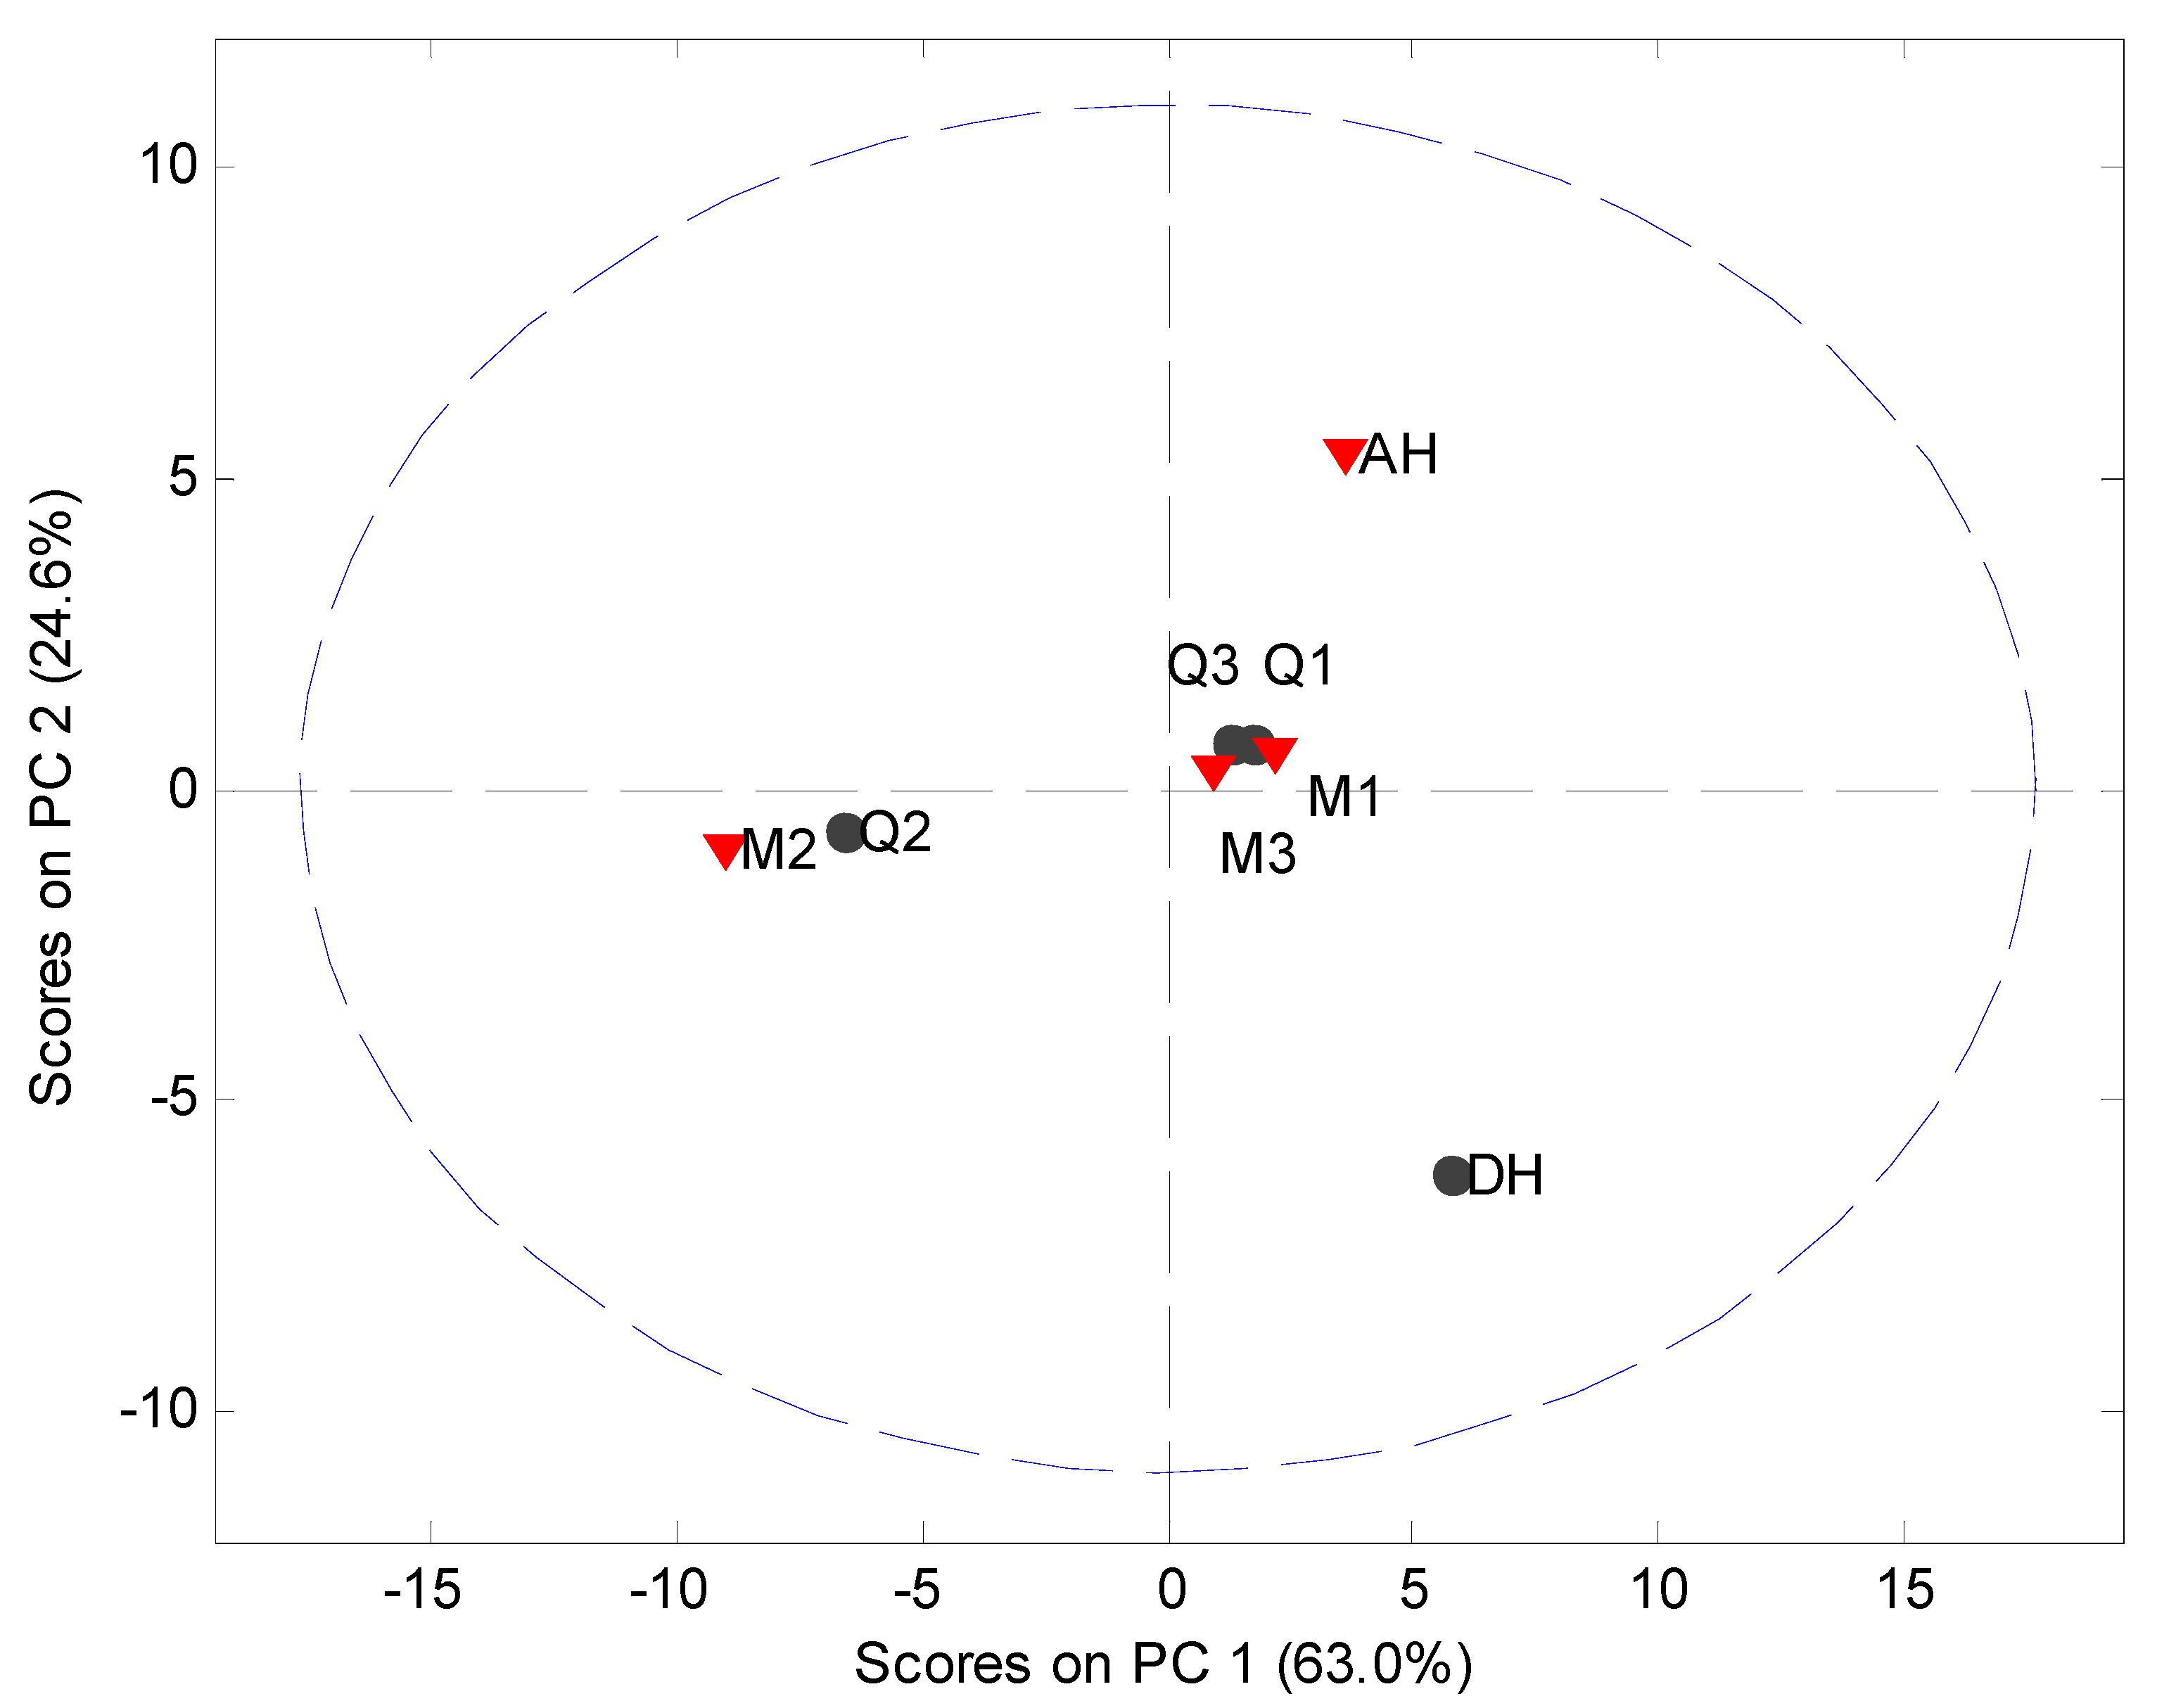
MVDA, using SNV correction and mean centering, was utilized on the 900 cm
−1 to 1800 cm
−1 spectral region. Four PCs, to explain 97.0% of the variation, were utilized to elucidate differences in the Raman spectra of the processed samples. It was observed that PC 2 is capable of separating the crystalline counterparts. However, no differences could be extracted from the processed samples using the two first principal components because even though two separate groups were formed, each group contained samples from both the milled and quench cooled samples (
Figure 5). After inspection of the loadings on PC 1 and the raw data it was apparent that this clustering for PC 1 was caused by intensity differences in the Raman spectra. These intensity differences are most likely related to different distances between the Raman probe and the various samples. The differences in the remaining PCs were also examined, however, these PCs were impaired by a large presence of background noise in the loadings and no useful information was subsequently obtained from them. Finally, MVDA was also performed on the Raman data range from 200 cm
−1 to 1800 cm
−1 but this model was also incapable of separating the milled and quenches cooled samples from one another.
Figure 5.
PCA score plot of Raman data (900 cm−1 to 1800 cm−1). Milled samples (M1, M2 and M3), quench cooled samples (Q1, Q2 and Q3), crystalline anhydrate (AH) and crystalline dihydrate (DH).
Figure 5.
PCA score plot of Raman data (900 cm−1 to 1800 cm−1). Milled samples (M1, M2 and M3), quench cooled samples (Q1, Q2 and Q3), crystalline anhydrate (AH) and crystalline dihydrate (DH).
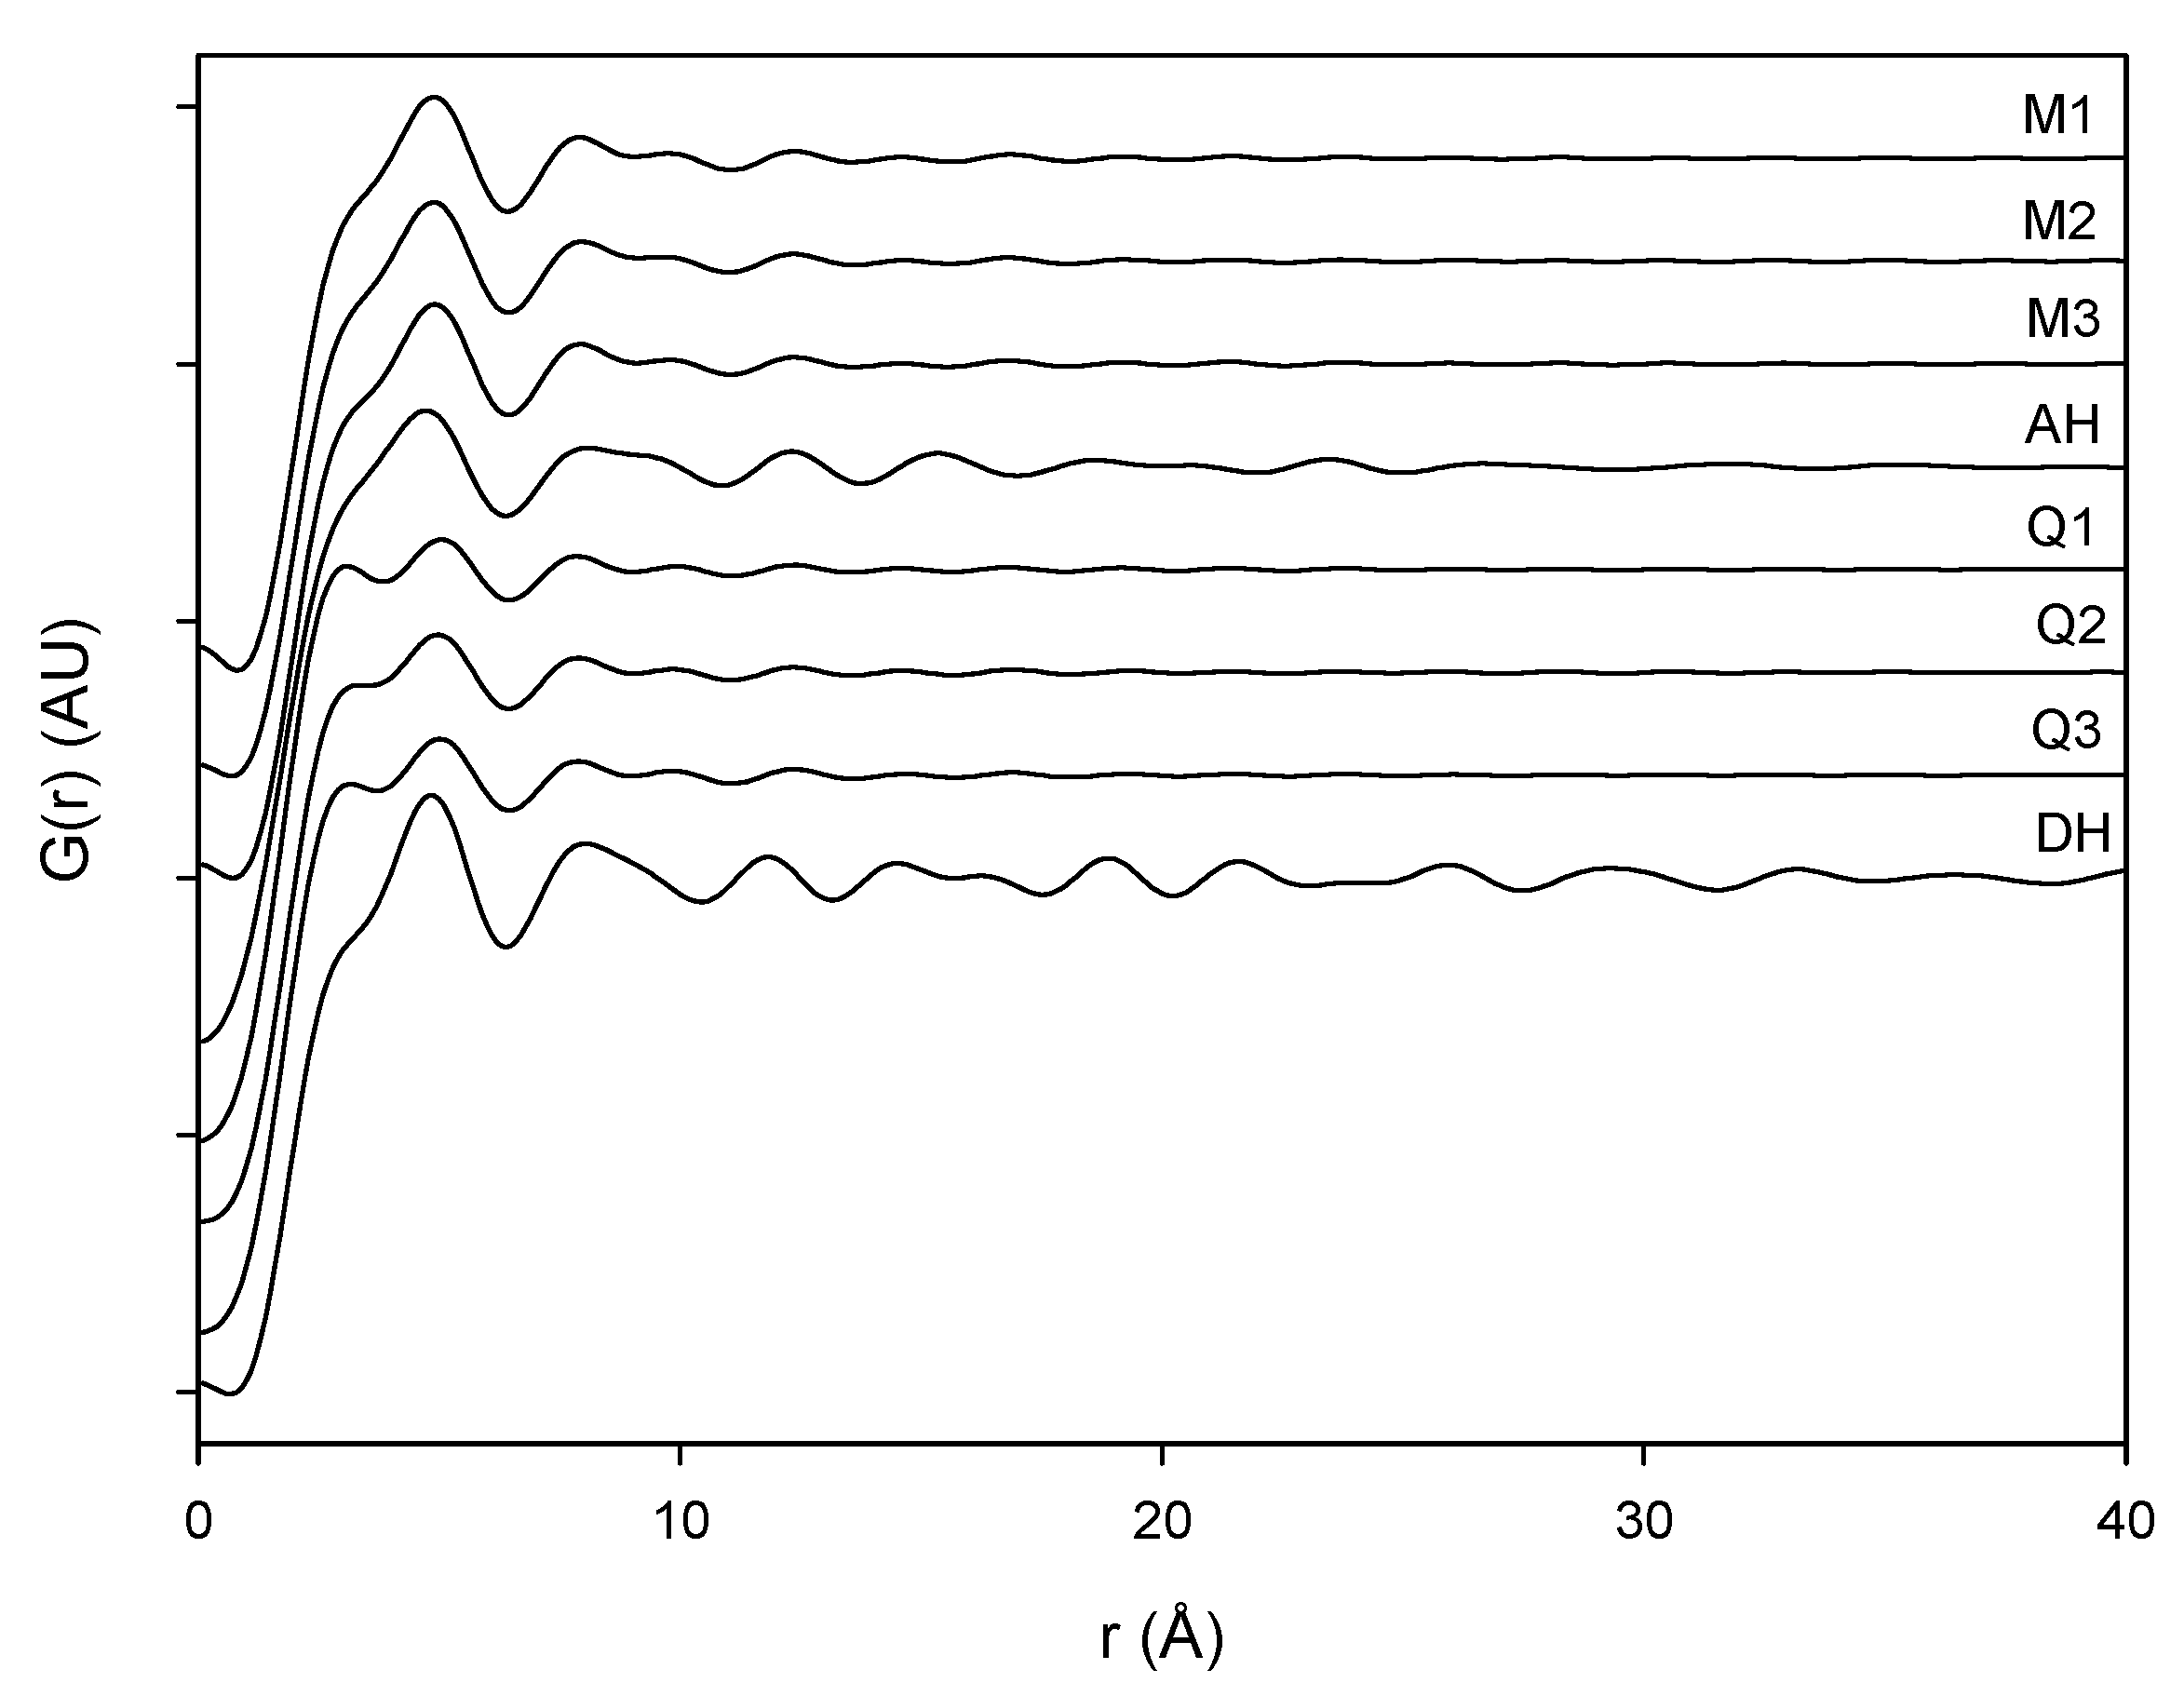
The PDF traces of XRPD data displayed in
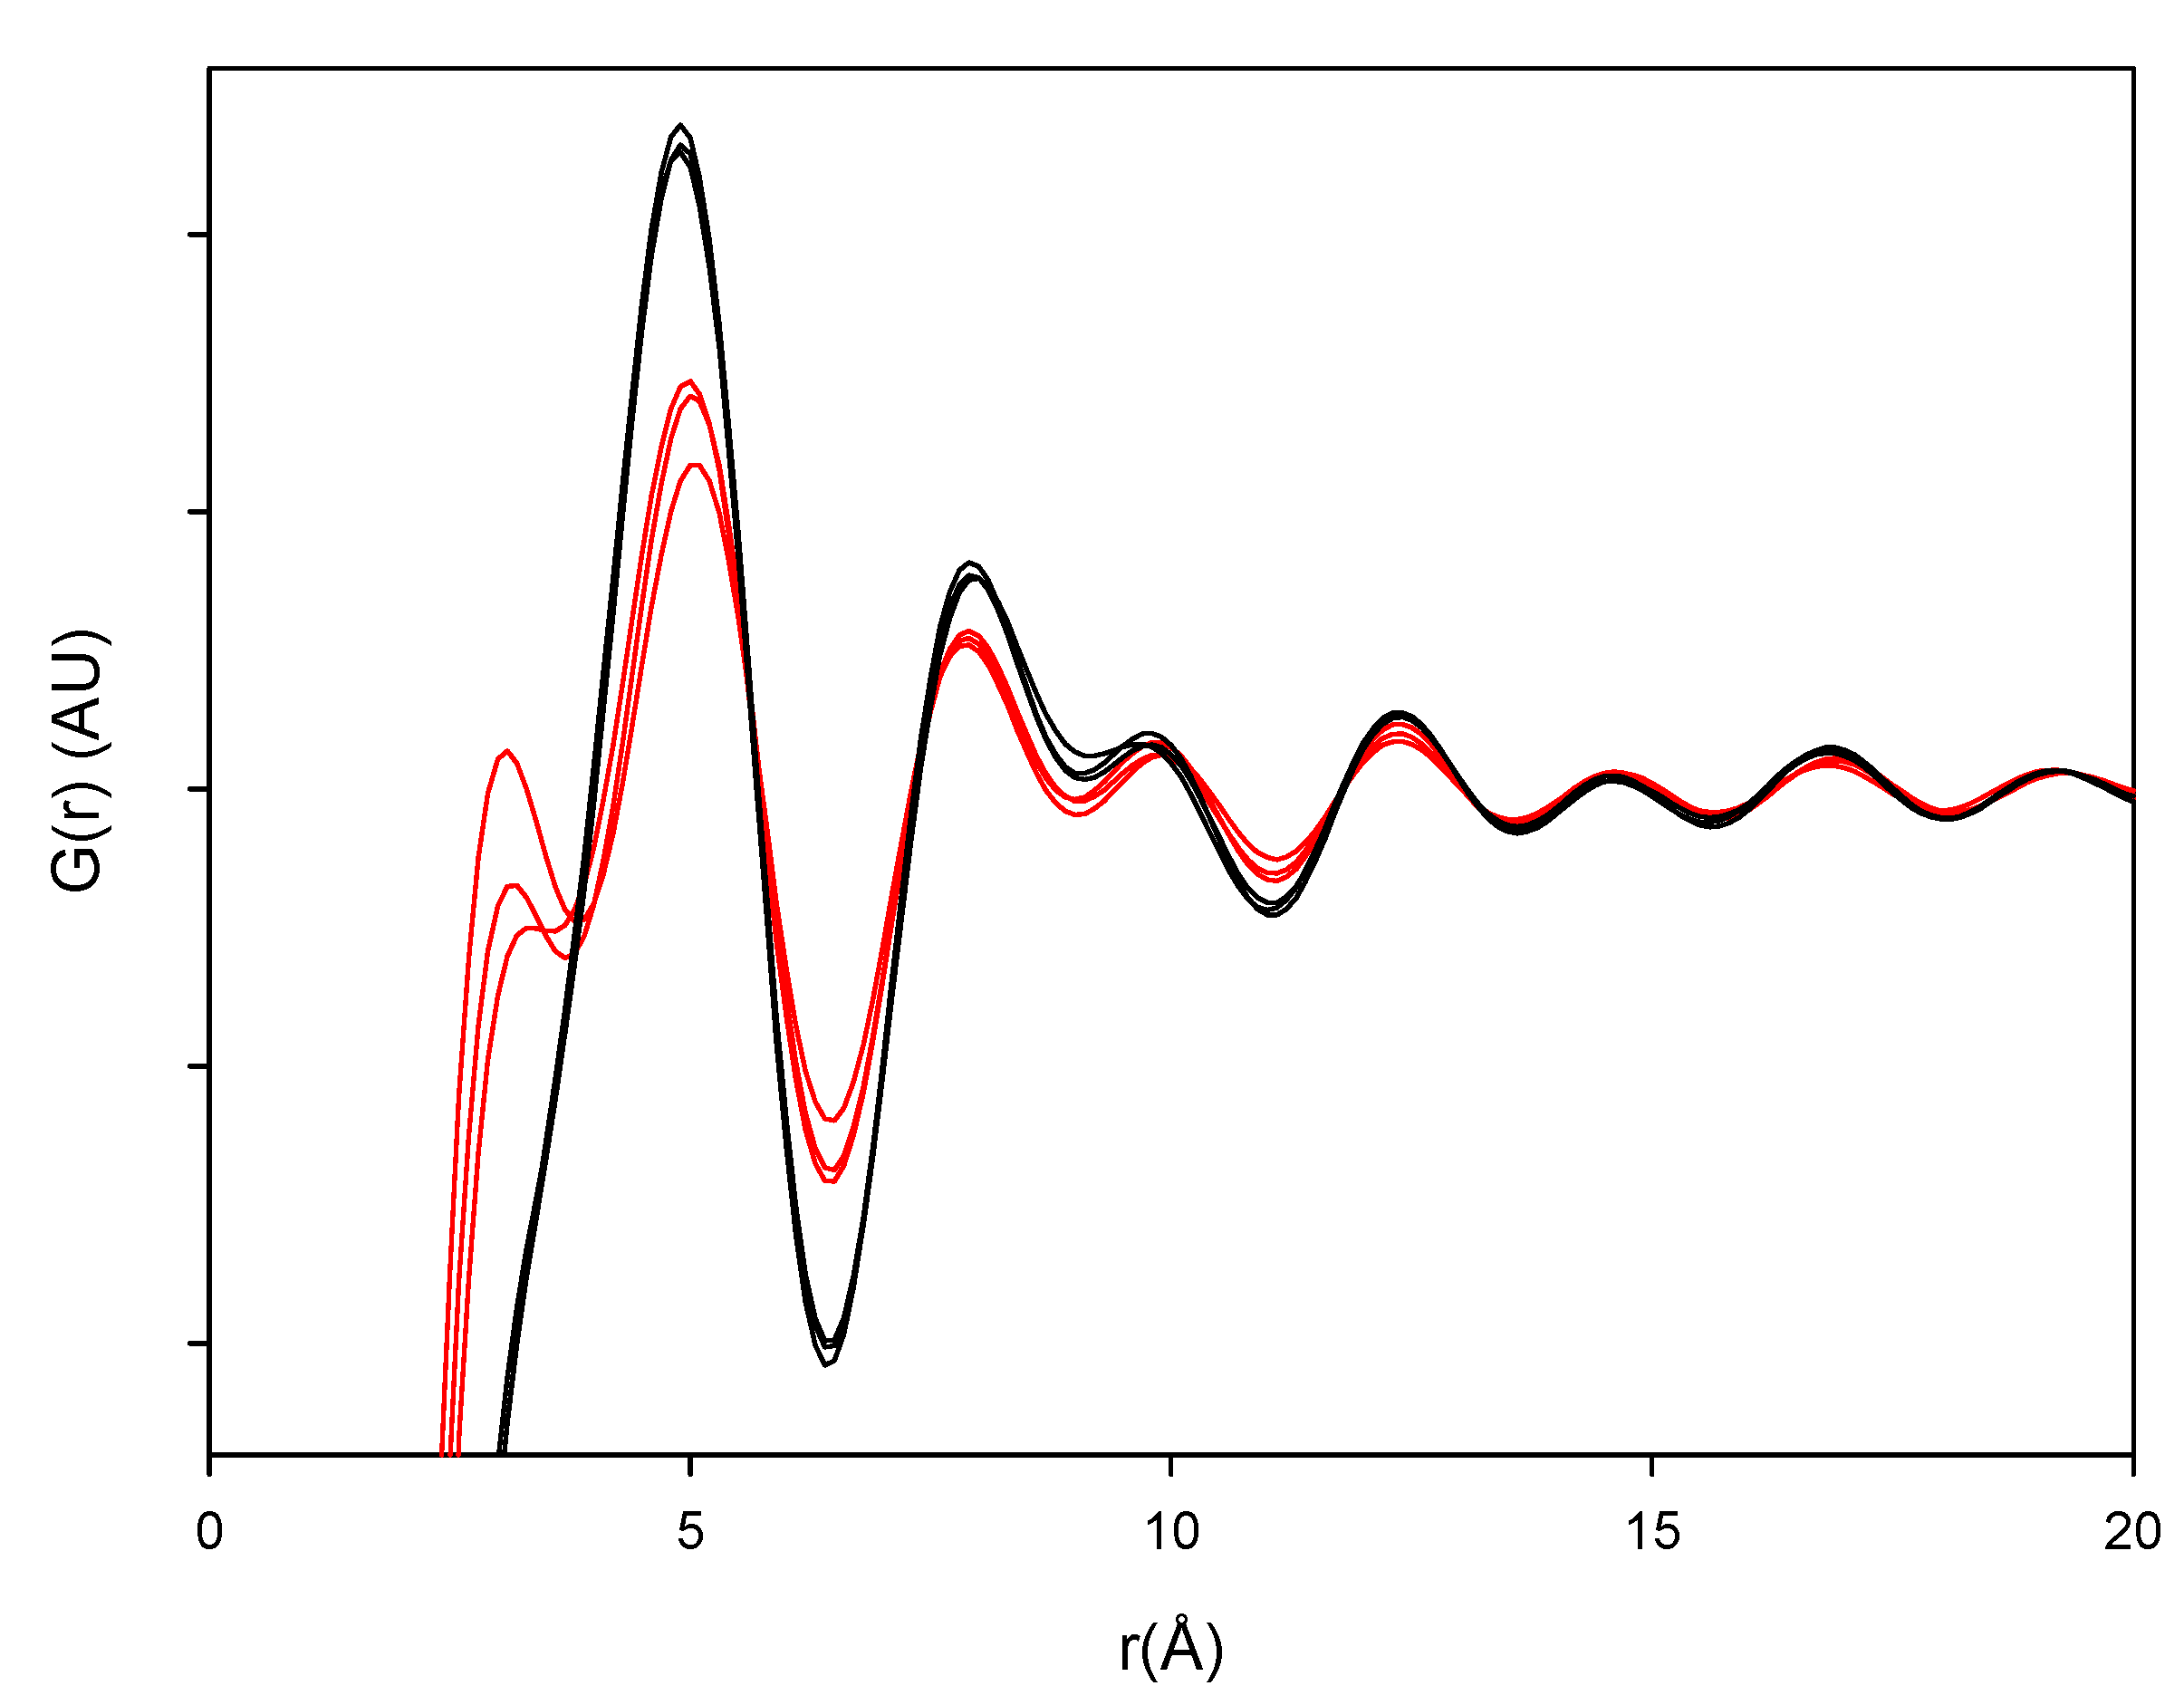
Figure 6 represent the various milled and dehydrated samples as well as the crystalline DH and AH starting material. It is observed that the PDF trace of all the samples attenuates with varying rates towards unity at distances far away from the origin. Furthermore, it is observed that the crystalline AH and DH starting materials have a peak attenuation that is much lower than the corresponding attenuation for the processed samples. This low PDF trace attenuation of the crystalline samples is a direct consequence of the more ordered structure of these samples compared to their amorphous counterparts. When overlaying the milled samples (black lines) and quench cooled samples (red lines) in
Figure 7 it was observed that there is a lower value of the peaks for the quench cooled samples than for the milled samples indicating a higher degree of disorder in the quench cooled samples. Such information was not obtainable from the Raman spectra and the XRPD diffractograms. PDF analysis of XRPD diffractograms is, thus, shown to provide additional information about the degree of disorder within the amorphous state.
Figure 6.
PDF pattern of the milled samples (M1, M2 and M3), quench cooled samples (Q1, Q2 and Q3), crystalline anhydrate (AH) and crystalline dihydrate (DH).
Figure 6.
PDF pattern of the milled samples (M1, M2 and M3), quench cooled samples (Q1, Q2 and Q3), crystalline anhydrate (AH) and crystalline dihydrate (DH).
Figure 7.
PDF patterns of the processed samples. Milled samples: black lines and quench cooled samples: red lines.
Figure 7.
PDF patterns of the processed samples. Milled samples: black lines and quench cooled samples: red lines.
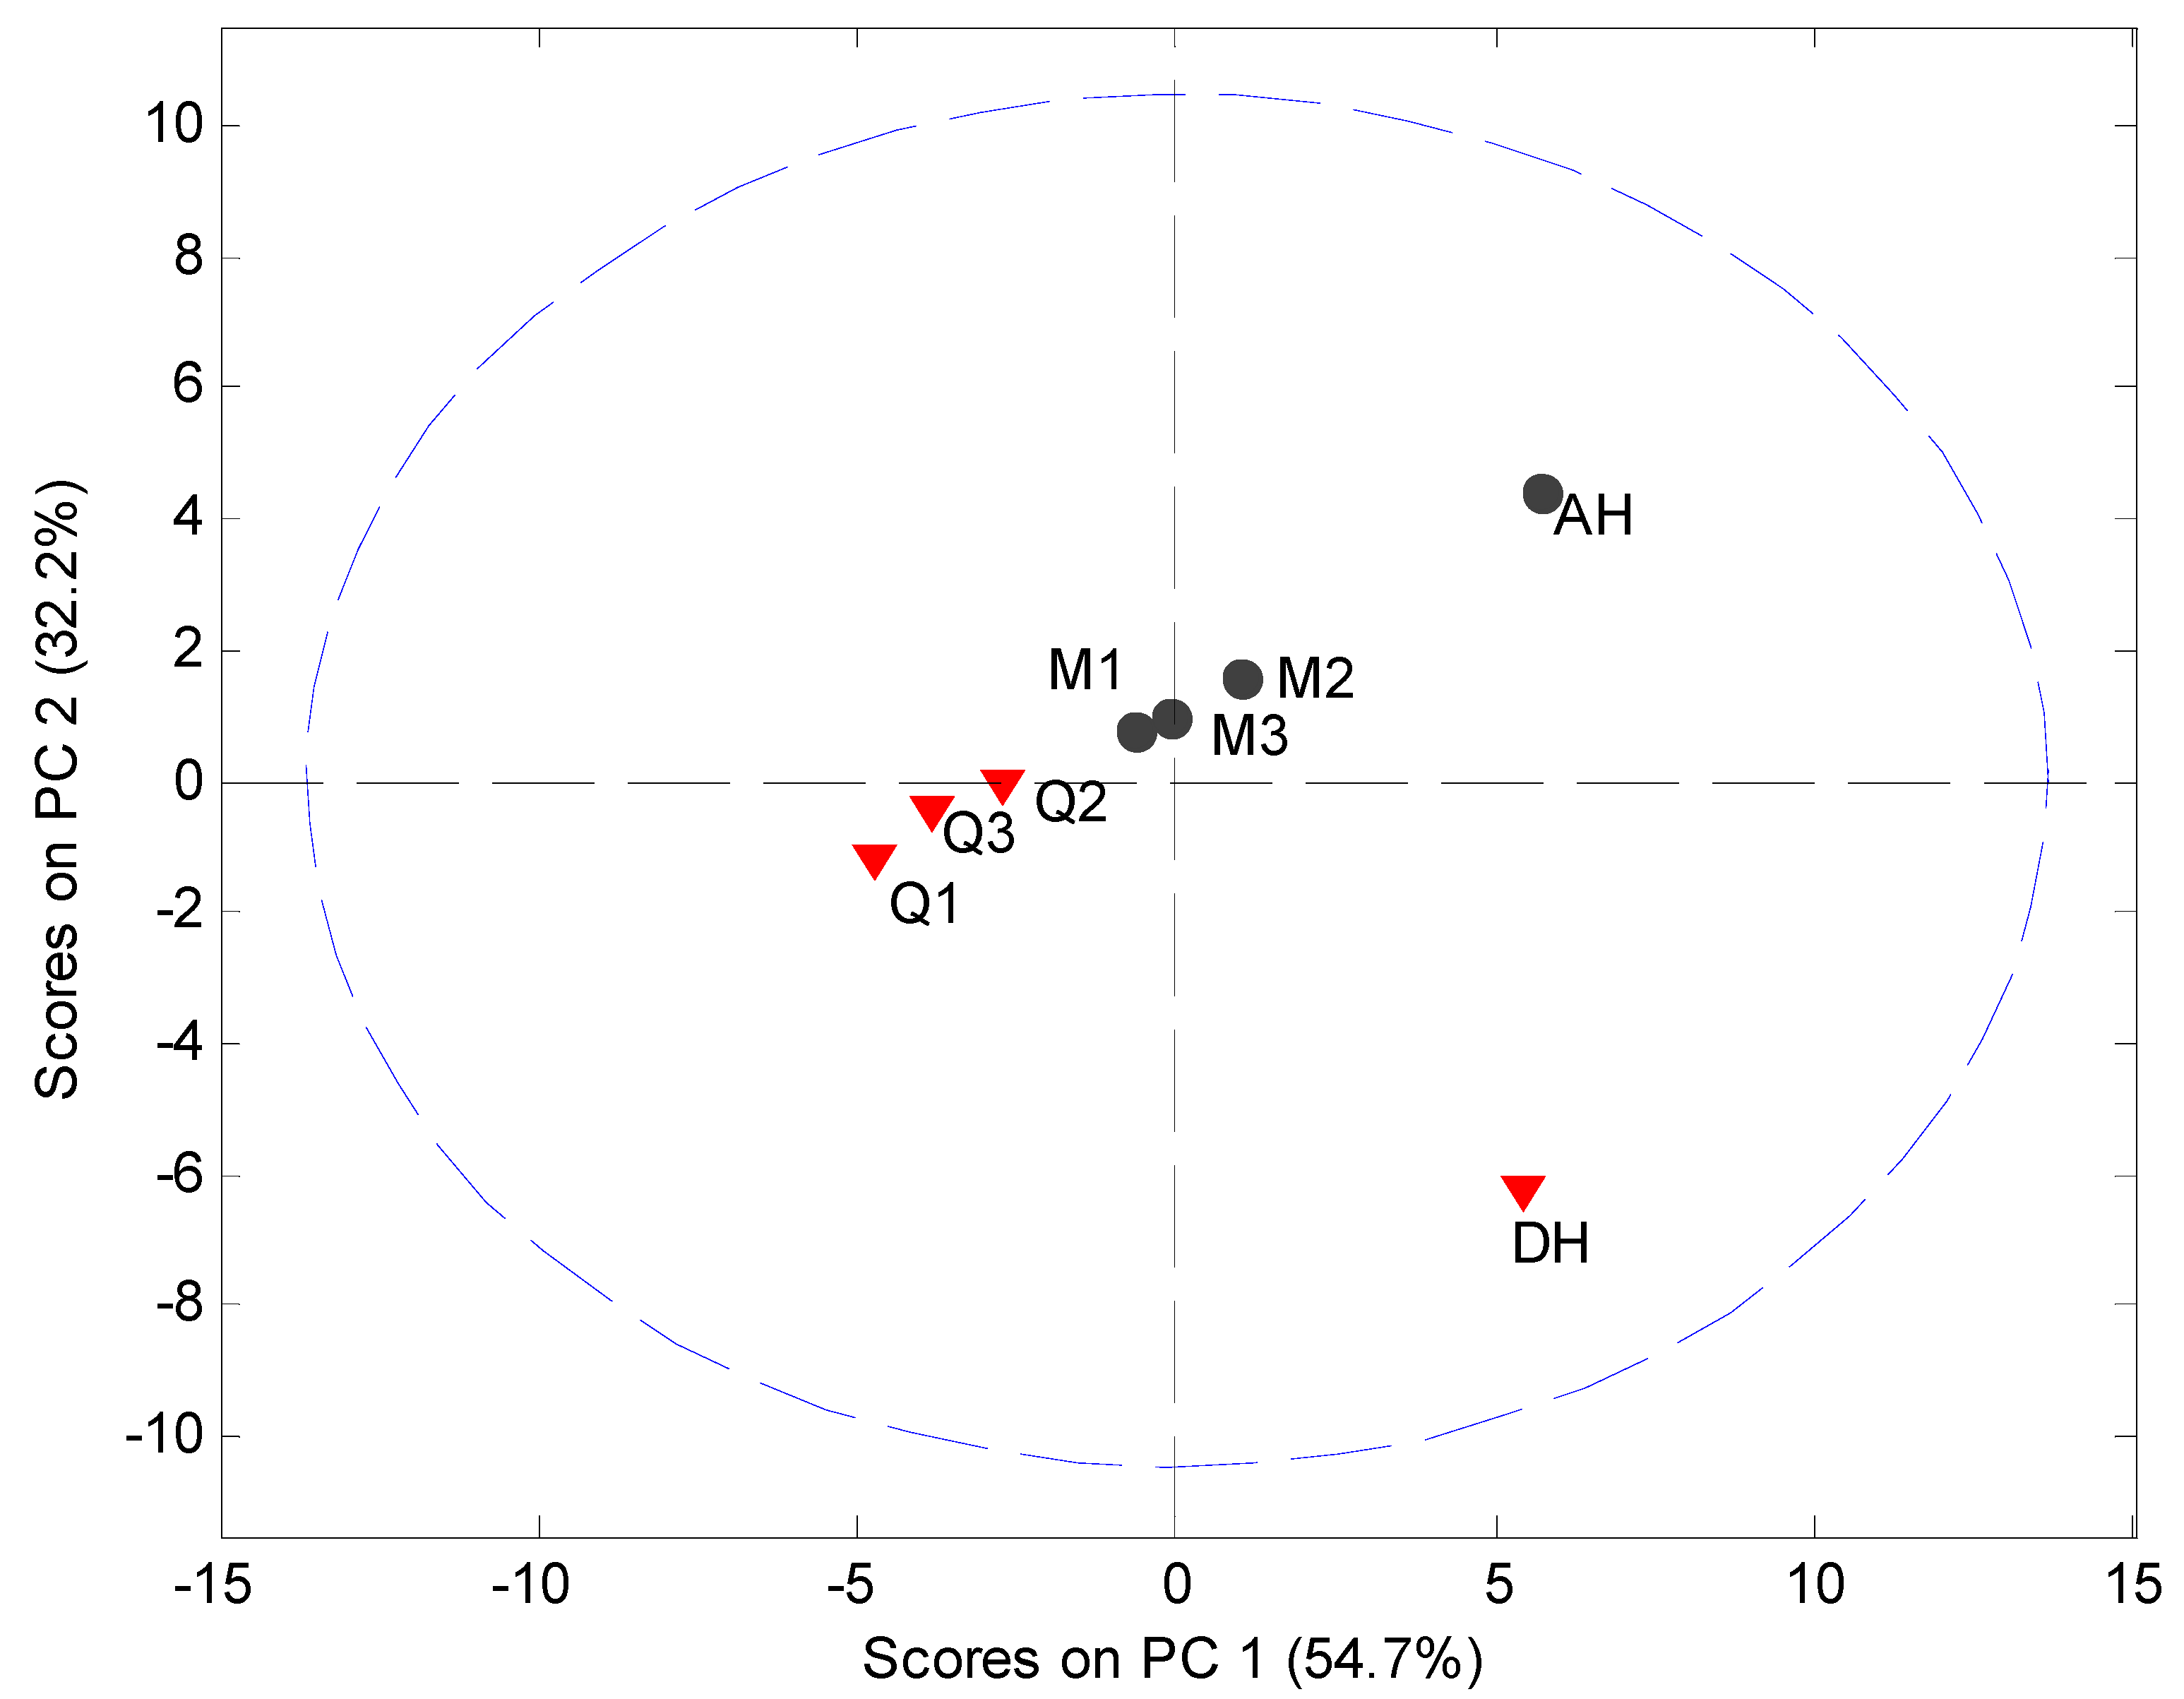
MVDA, using SNV correction and mean centering, was carried out on the PDF data in the interval 4 Å to 40 Å to assess the structural disorder induced by milling or quench cooling. The PCA model utilized 2 PCs to explain 87.0% of the variation (
Figure 8). It was observed that the crystalline samples were separated in the score plot from the processed samples and that the milled and quench cooled samples could be separated from each other.
Figure 8.
PCA score plot of PDF data (4 Å to 40 Å) using the 5° to 40° 2θ XRPD diffraction range. Milled samples (M1, M2 and M3), quench cooled samples (Q1, Q2 and Q3), crystalline anhydrate (AH) and crystalline dihydrate (DH).
Figure 8.
PCA score plot of PDF data (4 Å to 40 Å) using the 5° to 40° 2θ XRPD diffraction range. Milled samples (M1, M2 and M3), quench cooled samples (Q1, Q2 and Q3), crystalline anhydrate (AH) and crystalline dihydrate (DH).
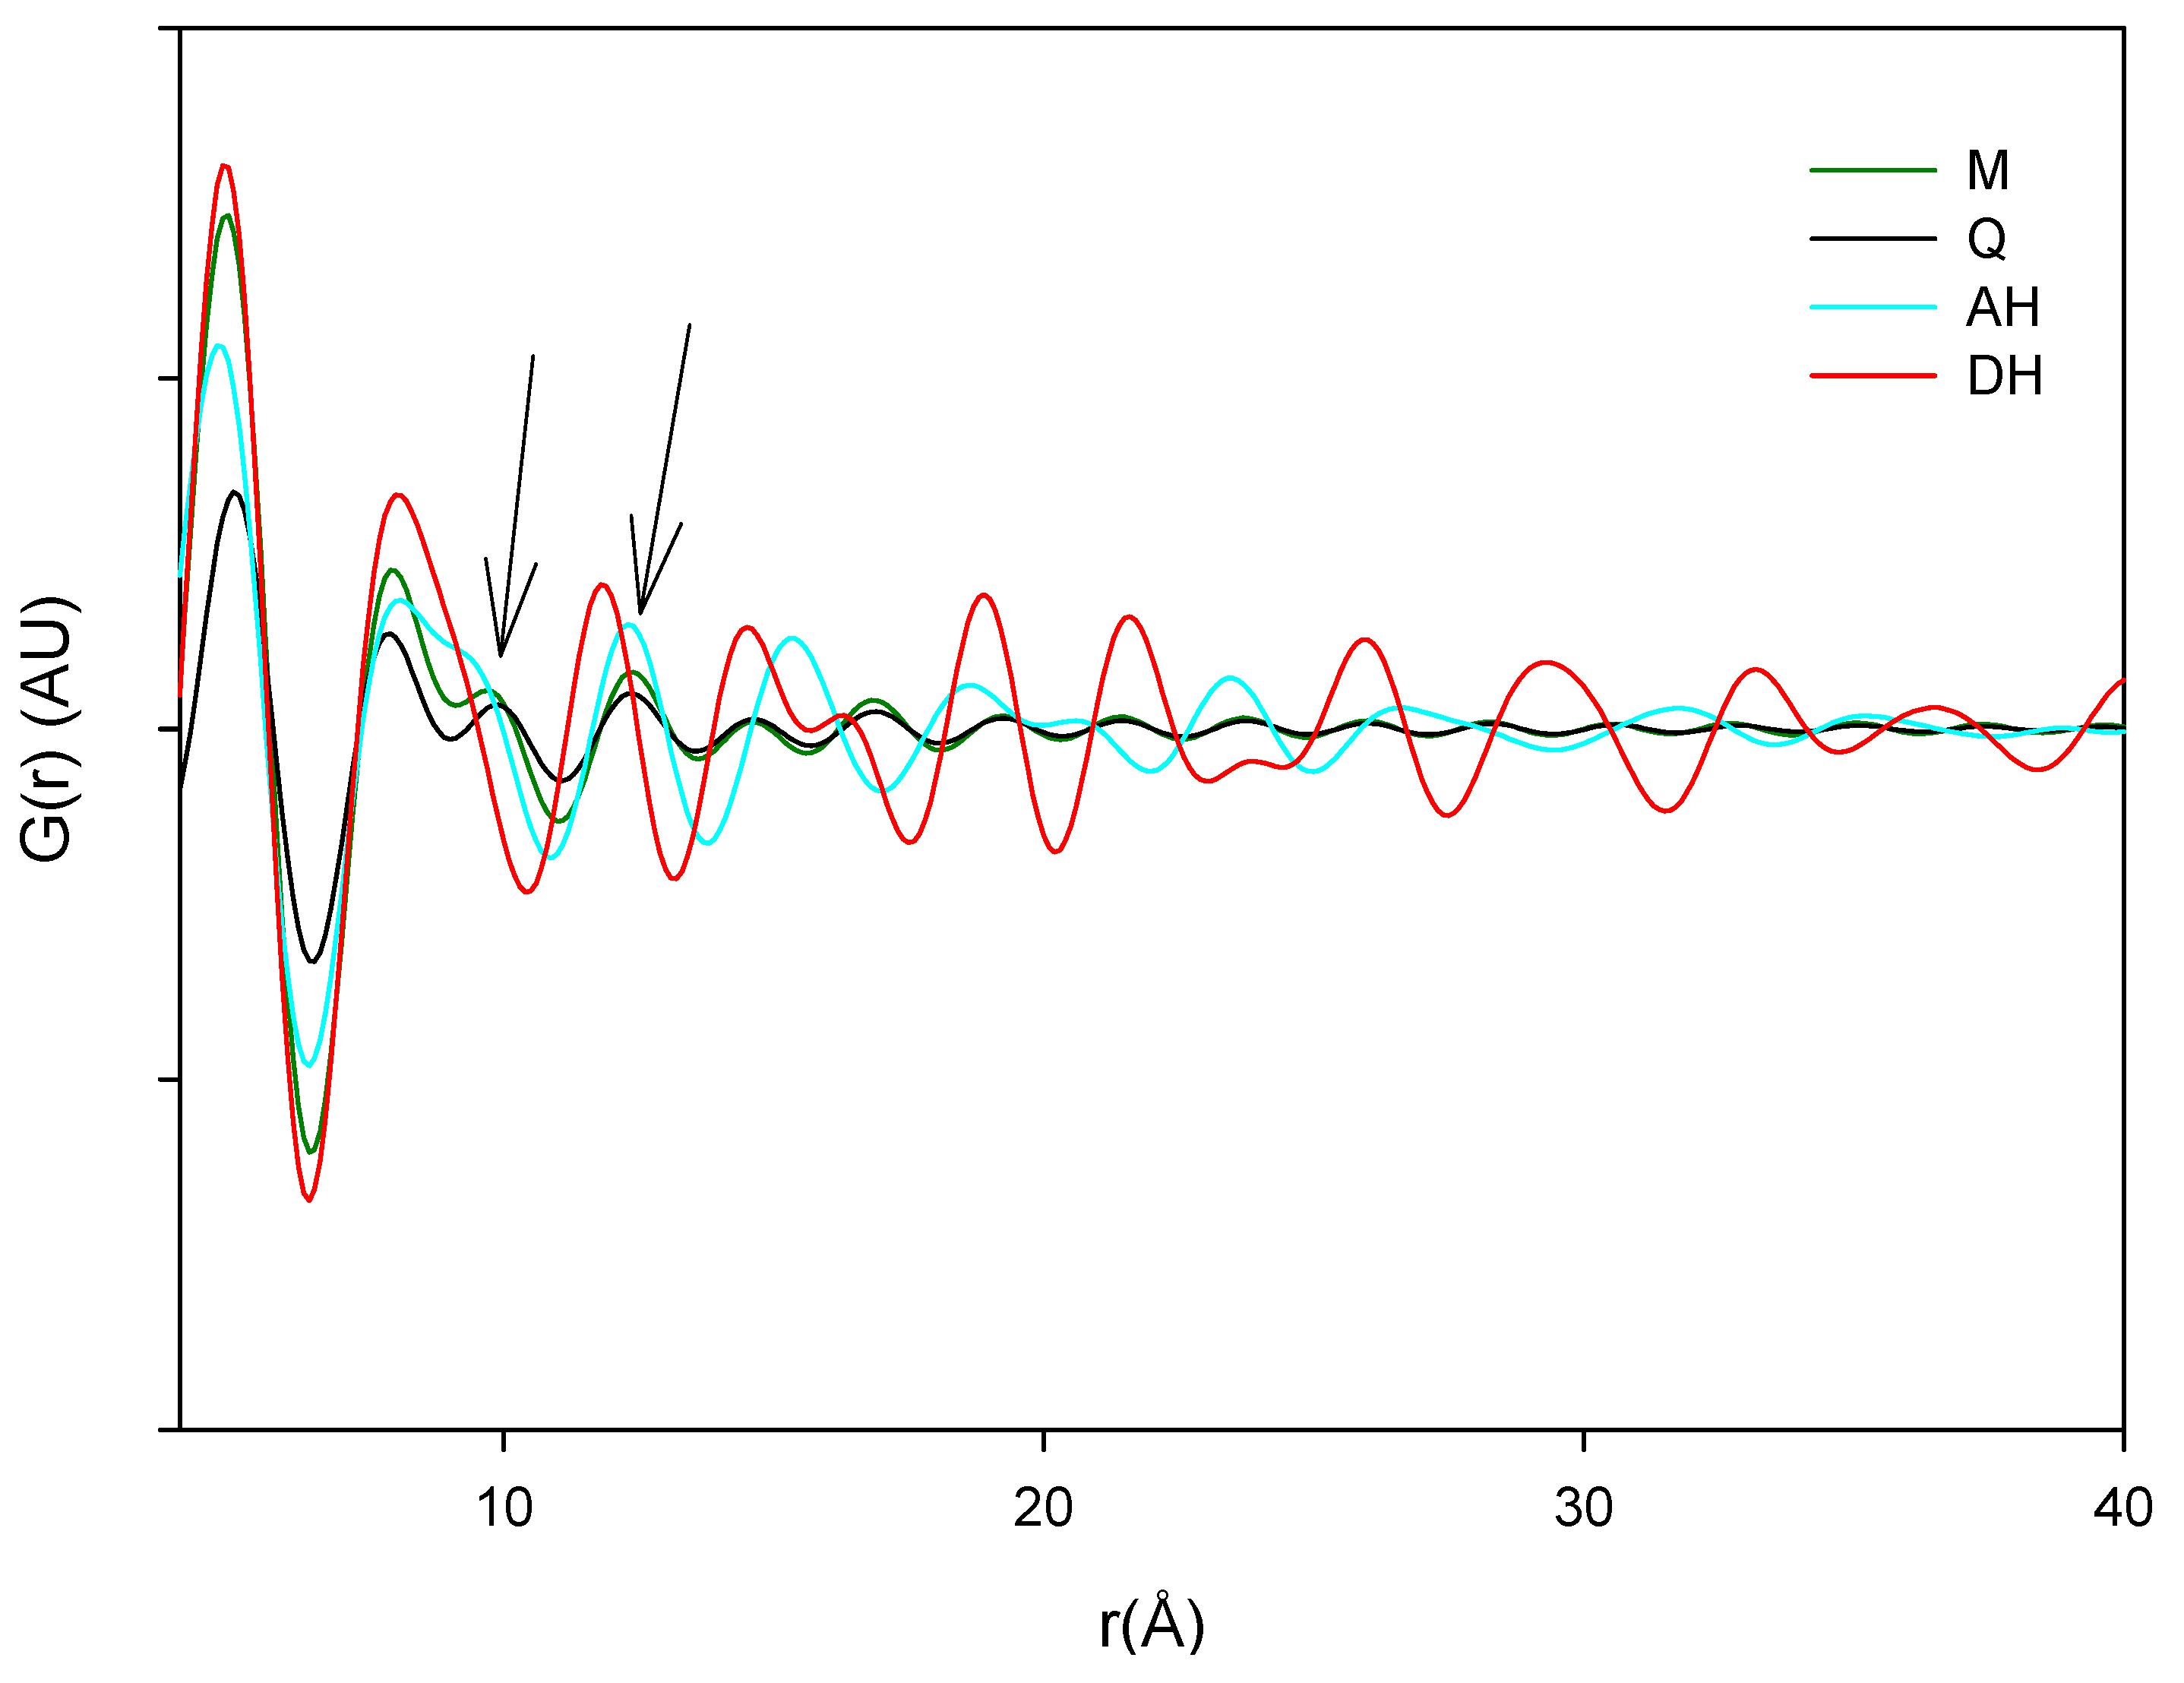
The main source of variation in this PDF data set (indicated by separation in the direction of PC1) originates from disorder and hence lowered peak values. PC 2 is separating the crystalline starting materials and it was observed that the milled and quench cooled samples form a line with the crystalline AH sample. Furthermore, when the raw PDF data is inspected it can be observed that the milled and quench cooled samples seem to have a more pronounced similarity to the AH form than to the DH form (
Figure 9). This is especially apparent from the first four peak positions of the processed samples that all coincide with peak positions in the PDF trace of the AH form and only with two of these four peak positions of the DH form (
Figure 9B, black arrows). However, such correlations in PFD data between amorphous and crystalline forms have been shown to be influenced by the utilized radiation source. The use of a Cu anode was deemed to have to low a resolution for resolving structural similarities between two amorphous APIs and their respective crystalline counterparts [
10]. It can therefore suggested that such findings would have to be reexamined utilizing a higher range in the 2θ diffraction angle or preferably with a higher energy radiation source.
Figure 9.
Averaged raw PDF traces of crystalline anhydrate (AH), crystalline dihydrate (DH), milled (M) and quench cooled (Q) samples.
Figure 9.
Averaged raw PDF traces of crystalline anhydrate (AH), crystalline dihydrate (DH), milled (M) and quench cooled (Q) samples.
Figure 10.
PCA score plot of PDF data (4 Å to 40 Å) using the 5° to 30° 2θ XRPD diffraction range. Milled samples (M1, M2 and M3), quench cooled samples (Q1, Q2 and Q3), crystalline anhydrate (AH) and crystalline dihydrate (DH).
Figure 10.
PCA score plot of PDF data (4 Å to 40 Å) using the 5° to 30° 2θ XRPD diffraction range. Milled samples (M1, M2 and M3), quench cooled samples (Q1, Q2 and Q3), crystalline anhydrate (AH) and crystalline dihydrate (DH).
The low energy Cu anodes capability to separate the PDF traces of the quench cooled and milled samples into two distinct groups was further investigated. PDF analysis was performed on a limited XRPD diffraction interval from 5° to 30° 2θ as opposed to the previous 5° to 40° 2θ interval. It is apparent that the PCA score plot of the PDF data is still capable of separating the differently prepared amorphous samples into two groups (
Figure 10). It may subsequently be inferred that there must be a systematic difference between quench cooled and milled samples.


