Route Availability as a Communication Quality Metric of a Mobile Ad Hoc Network

Information Systems Science Major, Graduate School of Engineering, Soka University, 1-236 Tangi-cho, Hachioji-shi 192-8577, Japan
*
Author to whom correspondence should be addressed.
Future Internet 2018, 10(5), 41; https://doi.org/10.3390/fi10050041
Submission received: 4 March 2018
/
Revised: 17 April 2018
/
Accepted: 1 May 2018
/
Published: 4 May 2018
Abstract
:Using ad hoc communication between mobile terminals, MANETs (mobile ad hoc networks) are independent of any communication infrastructure but their communication quality can degrade because, as terminals move about in the service area, routes are constantly disconnected and then re-established. There has been no proposal for a quality metric that models this unstable state, i.e., route nonuniformity. This paper proposes a new concept of route availability (RA) as a metric of route nonuniformity in a MANET and verifies how effectively it represents the quality of service (QoS) of a network or the quality of experience (QoE) of video streaming. We have built an environment that emulates a MANET capable of video streaming, and developed a method of measuring RA for two representative MANET routing methods: AODV (Ad hoc On-Demand Distance Vector) and OLSR (Optimized Link State Routing). We have examined the relationship between RA and conventional network QoS metrics: packet loss rate and throughput. We have also checked RA using a subjective quality assessment test.

1. Introduction
In recent years, there has been a sharp increase in demand for video communication [1] and a widespread use of drones. Consequently, the need to study video communication in MANETs (mobile ad hoc networks) is growing. Since MANETs use ad hoc communication between mobile terminals, they do not depend on any communication infrastructure. They can be employed for urgent delivery of medical or emergency videos in the event of a disaster, or for multi-hop transfer of videos between drones. Thus, expectations are rising that they can be used for M2M (machine-to-machine) communication. However, unlike conventional networks, such as the Internet, MANETs can experience a degradation in communication quality due to a number of factors that increase instability, such as the radio environment, multi-hop communication, node mobility, and variations among communication terminals in remaining battery levels and performance.
Metrics used to represent the data communication quality of MANETs are packet loss rate [2,3] and throughput [2,4,5,6], end-to-end delay [2,5,7,8], and packet delivery ratio (PDR) [2,4,6,7,9]; these have been used in IP (Internet Protocol) networks. These are designed for application to data communication after communication routes have been established, and thus are not necessarily a suitable metric to assess the communication quality for networks like MANETs in which routes are not uniform because they are constantly disconnected and re-established as a result of node mobility. Regarding communication route establishment, routing overhead [2,5,7], path length [2], and path lifetime [8,10,11] are used as metrics to assess the performance of routing protocols and routes. For applications such as video streaming, in which the user’s quality of experience is important, jitter [6] and MoS (Mean Opinion Score) [9,12,13] are also used in addition to the above metrics.
The authors previously proposed a concept of route availability (RA) as a metric of route nonuniformity in a MANET and a calculation method of RA [14]. However, the network environment used to verify this calculation method was a simple one that simulated network disconnections and connections using the Netem [15] shell script. Thus, it did not incorporate node mobility and the procedure for route establishment using a routing protocol, which are main features of MANETs. The paper presented no method of measuring route feature values, which are needed to calculate RA based on the routing protocol. To further refine the concept of RA, in the current paper we build an environment that emulates a MANET capable of video streaming. We develop a method of calculating RA for two representative MANET routing protocols: AODV (Ad hoc On-Demand Distance Vector) [16] and OLSR (Optimized Link State Routing) [17]. We study the relationship between RA and conventional network quality of service (QoS) metrics (packet loss rate and throughput). Using a subjective quality assessment test of videos delivered in video streaming, we obtain the degradation mean opinion score (DMOS) and examine how it relates to the quality of experience (QoE) metrics. Section 2 summarizes related studies and indicates where the present research fits in relation to these studies. Section 3 presents an RA model and methods of measuring RA for AODV and OLSR. Section 4 describes the evaluation environment we have built. Section 5 presents the evaluation experiments we have carried out and discusses the experiment results. Finally, Section 6 gives conclusions.
2. Related Studies
Studies related to metrics used to assess the performance of routing protocols in MANETs are presented here. The position of the present research in these studies is also discussed.
2.1. Metrics Used to Assess the Performance of Routing Protocols in MANETs
A variety of routing protocols have been proposed for MANETs [2,3,4,5,6,7,8,9,10,11,12,13], and various metrics have been used to assess their performance, such as packet delivery ratio (PDR), throughput, end-to-end delay, routing overhead, path length, packet loss rate, jitter, path lifetime, and mean opinion score (MOS). Table 1 lists metrics used in different references.
However, packet delivery ratio, throughput, end-to-end delay, path length, and packet loss rate can be observed only during the packet communication phase after a communication route has been established. In a MANET, in which routes are unstable, these are secondary information. If routing control is to be carried out based on these metrics, nodes need to exchange basic information from which these items of information can be calculated. Routing overhead [2,5,7] is used for protocols that are designed to improve the performance and stability of the routes to be established but it does not indicate the quality of the routes established. Path lifetime [10,11], which is based on the remaining battery levels of relay nodes, is an important assessment metric but is not fit for assessing the nonuniformity (represented by repeated connections and disconnections) that the current paper focuses on.
2.2. Position of This Research
A MANET is formed in the network layer. It consists of a network connection establishment phase and a packet communication phase. Applications communicate using this packet communication. The transport layer may be used as a middle layer. As mentioned in Section 2.1, existing studies mainly use packet loss rate, throughput, and packet delay to indicate network QoS, and coding rate, frame rate, and delay jitter to indicate video streaming QoE. They use the number of nodes, node moving speed, remaining battery level, and the number of hops as parameters that define the topology of a MANET. However, no indicator of route stability in MANETs has been proposed. The position of the present research relative to the existing studies is shown in Figure 1. The present research studies metrics that can represent the route nonuniformity, which forms a foundation for packet communication and application communication in a MANET.
3. Route Nonuniformity Path Modelling
The processes of modeling route nonuniformity in a MANET and of deriving route availability (RA) are described below. Methods of measuring connected time and disconnected time—which are needed for the calculation of RA—for AODV and OLSR are also presented.
3.1. Route Availability (RA) of a MANET
Routing protocols for MANETs can be classified into a reactive type and a proactive type. A representative reactive routing protocol is AODV, which establishes a route only when a node that wants to establish a route has sent a route request message, called an RREQ (Route REQuest), and has received a route reply message, called an RREP (Route REPly), from the destination node. An advantage of this protocol is that it requires fewer control messages than proactive protocols. A representative proactive routing protocol is OLSR, which constantly ensures that communication is possible by making nodes adjacent to each other exchange topology control (TC) messages periodically to keep their route information up to date. In a MANET, there is a procedure for nodes to discover adjacent nodes by exchanging HELLO messages periodically. However, this is only a supplementary procedure in AODV.
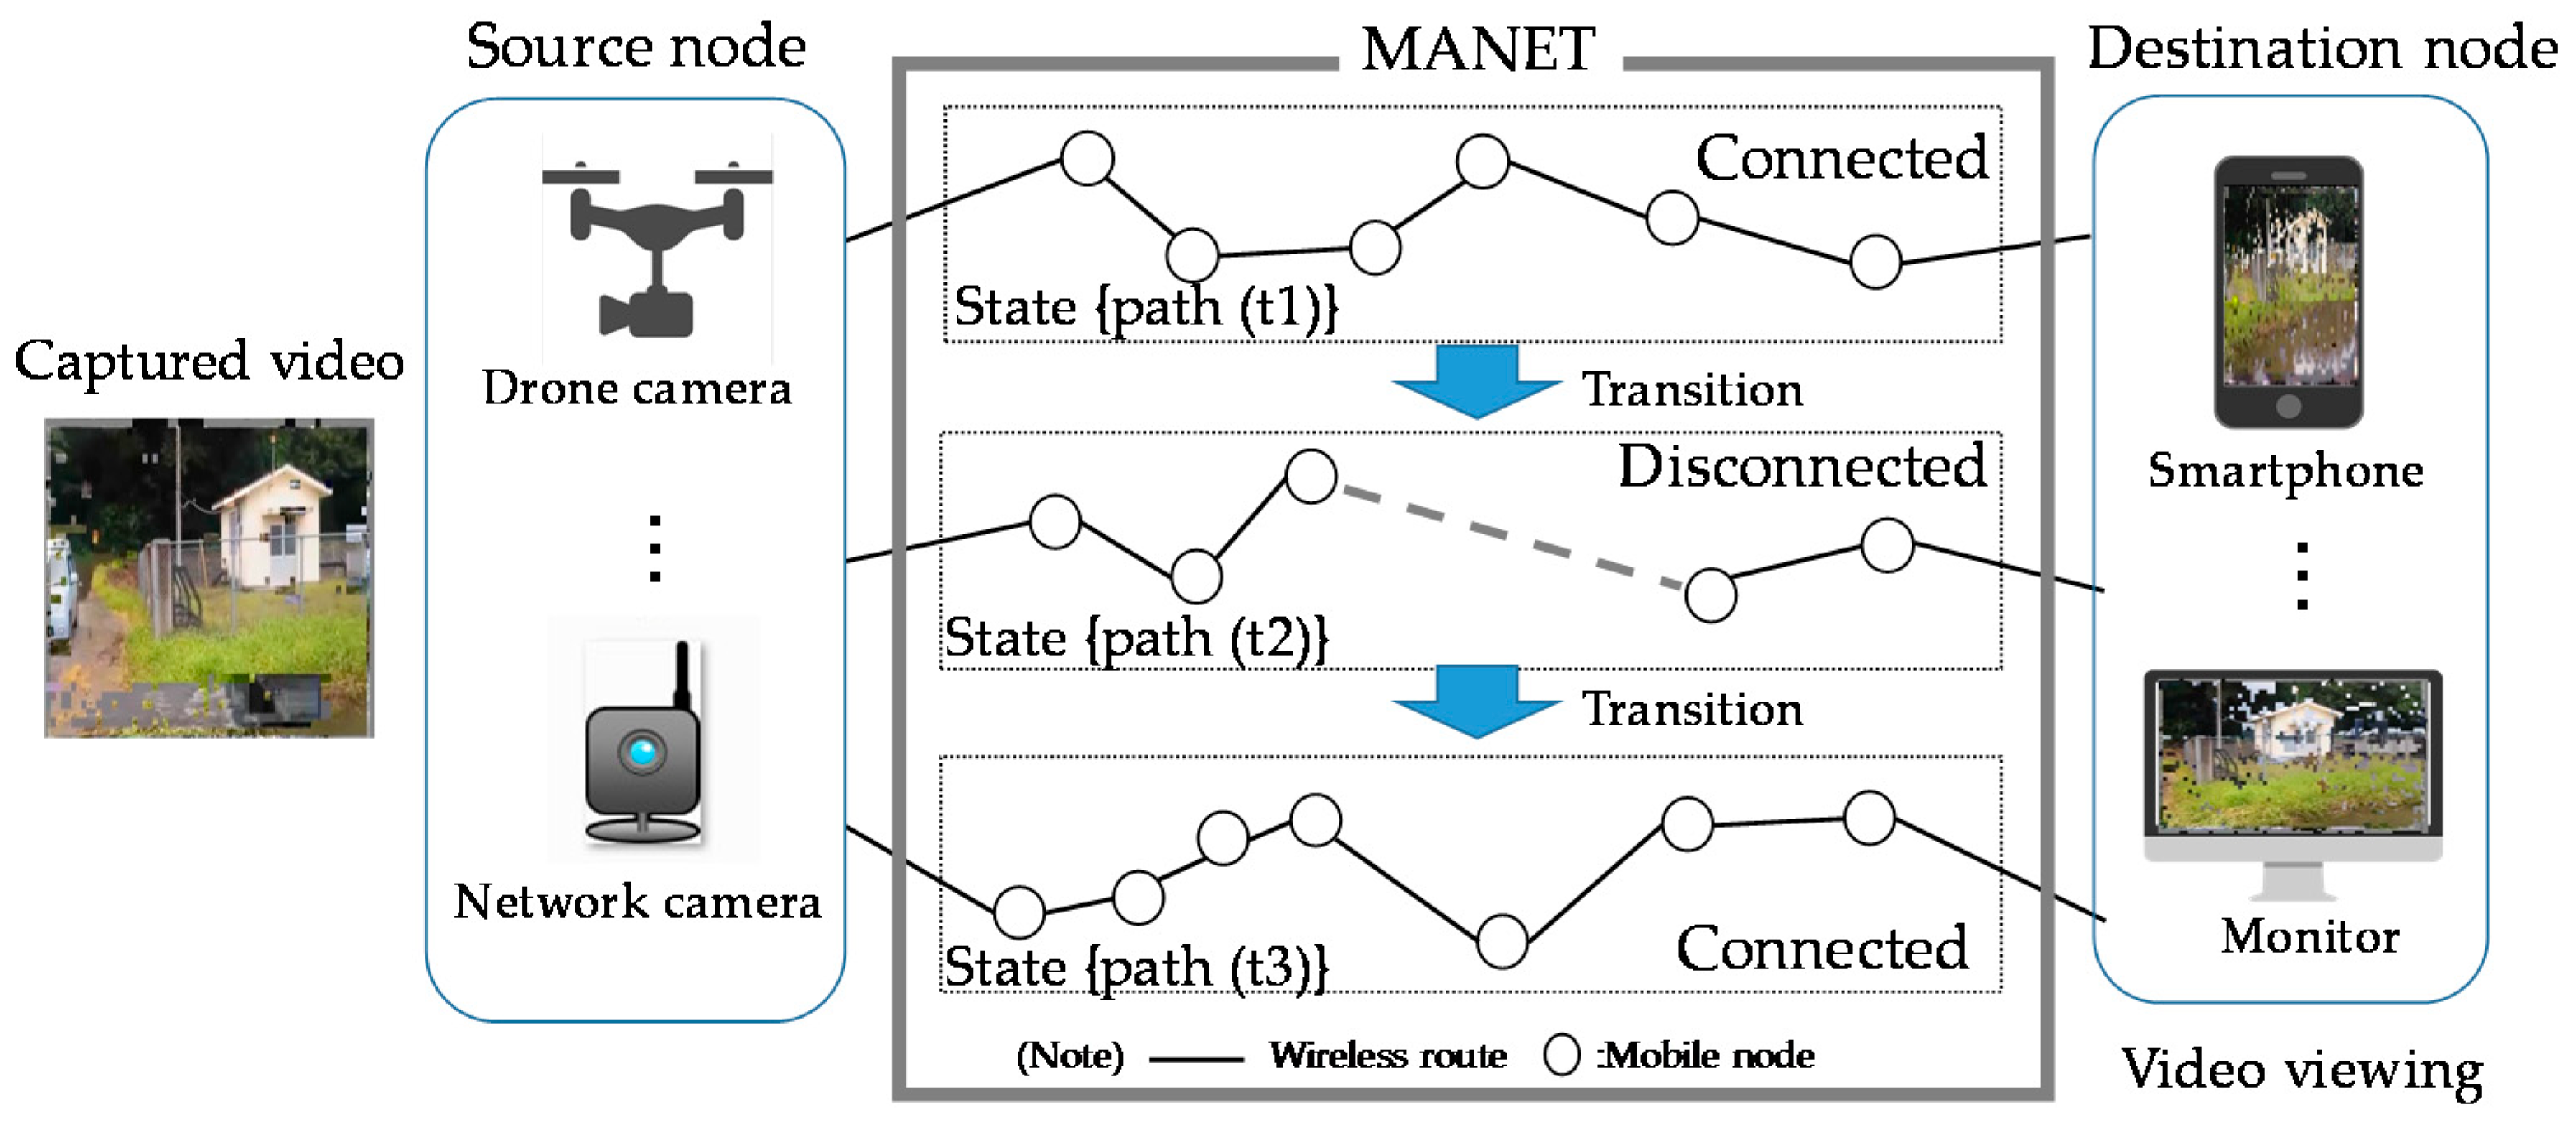
The route between a sending node and its destination node is not always the same because relay nodes move, changing the network topology, and because nodes have different performance and different remaining battery levels. During application communication time, the route is disconnected and re-established in accordance with the routing protocol used—AODV or OLSR. Figure 2 shows an example of route state transitions in a MANET in which the sending node sends a video captured by a drone or a network camera to a smartphone, which is the destination node. State {path (t1)} is a state in which a route has been established. When a relay node involved departs from the established route, the route is disconnected. This is state {path (t2)}. Next, a new adjacent node that can serve as a relay node is discovered, and the route is re-established. This is state {path (t3)}. Note that the relay nodes involved in state {path (t1)} are not necessarily the same as those involved in state {path (t3)}.
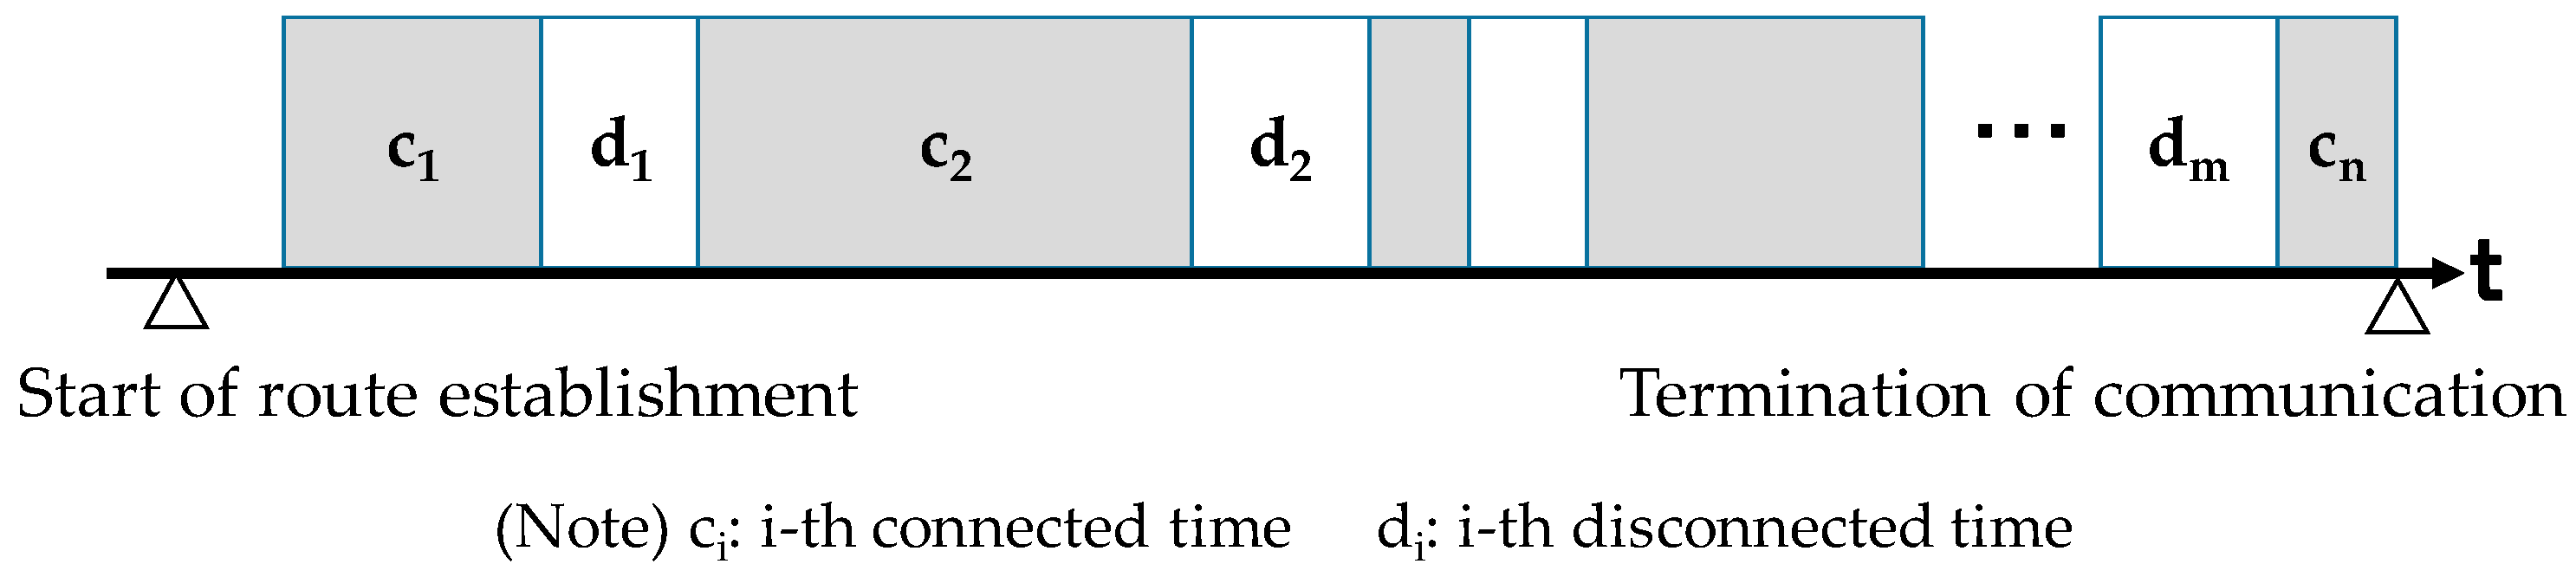
Since route nonuniformity frequently causes route disconnections, we focus on route connections and disconnections as state elements that characterize route nonuniformity. Changes in the route between the sending and destination nodes over time are shown in Figure 3. Figure 3 shows alterations of connected time and disconnected time of a route over communication time. A long connected time indicates that the route is stable, and a long disconnected time means that the route is unstable. The greater the ratio of connected time to the entire communication time, the more stable routes the network topology of the MANET provides. A large ratio of disconnected time is an indication that routes in that network topology are unstable. Thus, route availability can be calculated by measuring the percentages of total connected time and total disconnected time over communication time.
From Figure 3, the total connected time and the total disconnected time are calculated using Equations (1) and (2), respectively, where m is the number of disconnections and n is the number of connections. The time from completion of route establishment to termination of data communication is defined as Equation (3). Using these, RA is defined as Equation (4).
Communication time (ST) = CT + DT
3.2. How to Measure Route Feature Values for RA Calculation
Since connected time and disconnected time characterize nonuniformity of the route, they are called “route feature values” in this paper. Methods of measuring route feature values for AODV and OLSR are described below. The algorithm used to calculate RA is also presented.
3.2.1. How to Measure Route Feature Values for AODV
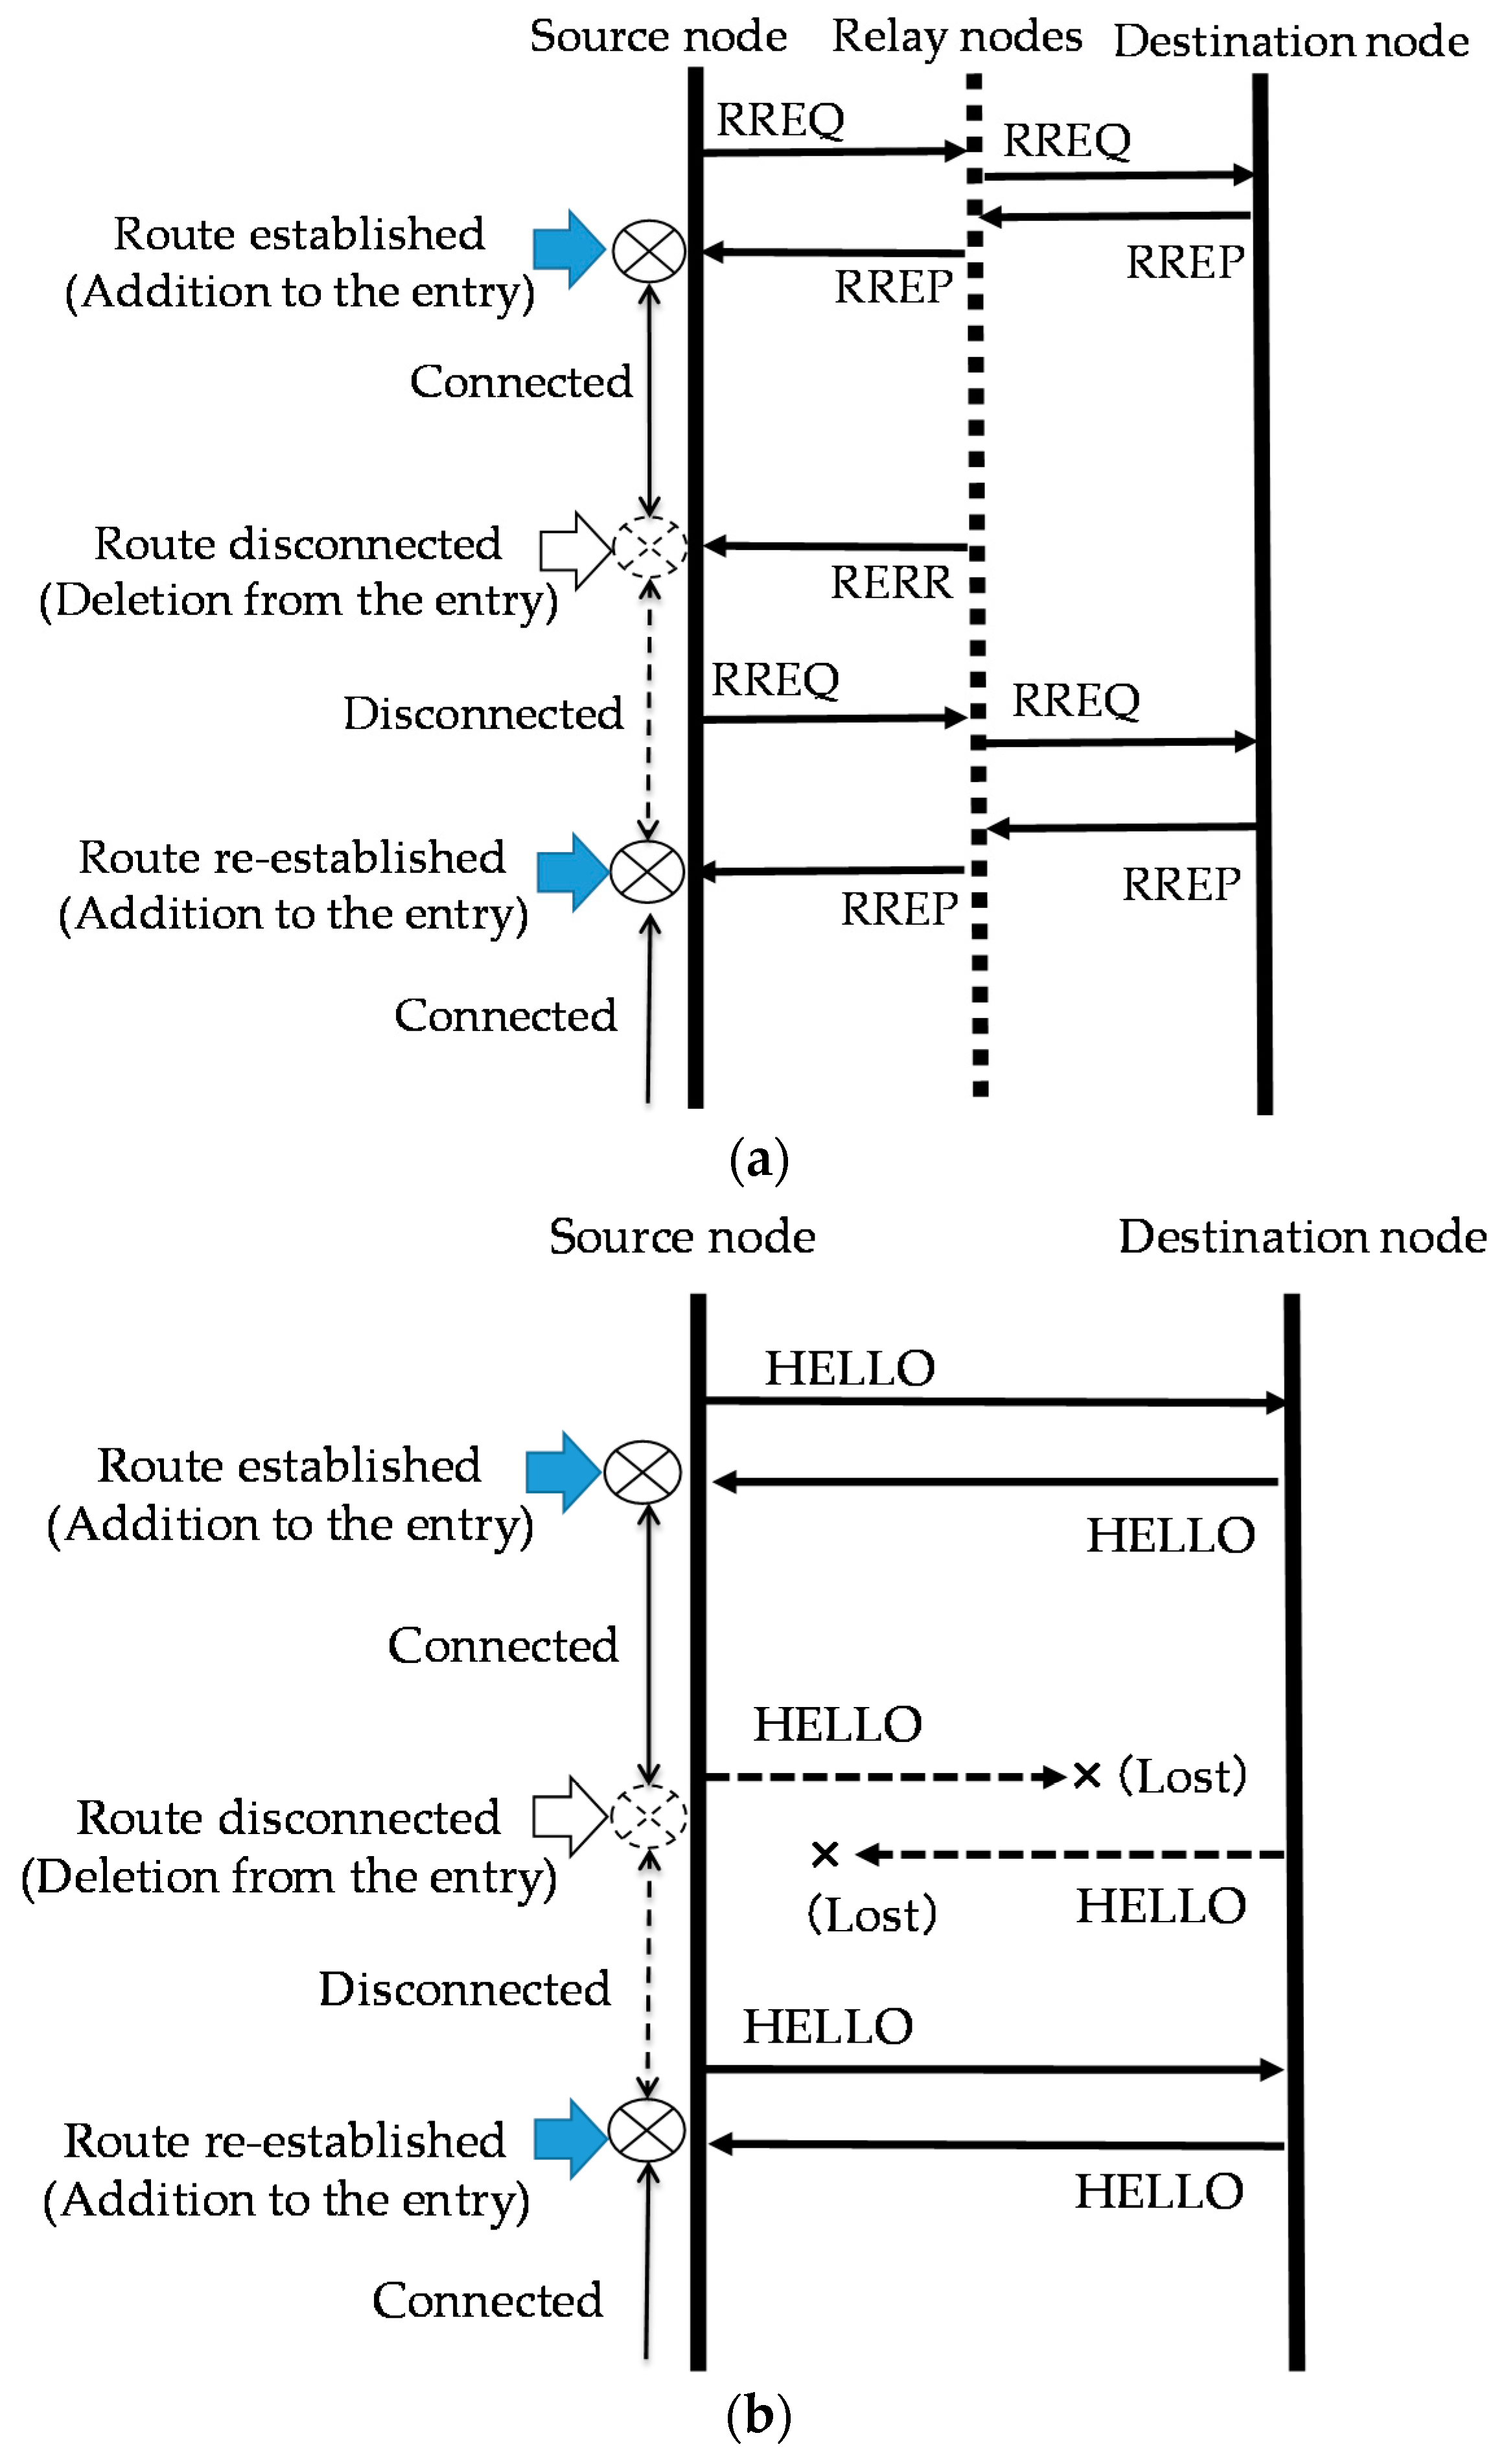
Route feature values are measured based on two types of trigger: the time when the destination node address is added to the route entry of the source node and the time when the destination node address is deleted from the route entry of the source node. In AODV, these events occur when the source node receives an RREP message or an RERR (Route ERRor) message, or when the source node receives or fails to receive a HELLO message. The sequences of measuring the connected time and disconnected time for AODV are shown in Figure 4.
As shown in Figure 4a, an addition to the route entry occurs when the source node receives an RREP, indicating that a route has been established. A deletion from the route entry occurs when the source node receives an RERR, indicating that the route has been disconnected. The period between an addition and the deletion for the same route is connected time. The period between a deletion and the next addition, i.e., reception of the next RREP, is disconnected time. When a source node tries to establish a route, it may receive multiple RREPs because multiple routes can be established. If the source node receives multiple RREPs, the route with the smallest number of hops, for example, is selected in accordance with AODV, and the destination node address is added to its entry. The source node may receive multiple RERRs when a route is disconnected. When the source node receives multiple RERRs, the first one is selected, and the destination node address is deleted from its entry.
Disconnections and re-establishments of routes through entry updates with HELLOs occur only when the source node communicates with the destination node directly, i.e., without using relay nodes. This occurs when the source node and the destination node are located close to each other. In such a case, no route requests arise and communication can start with exchanges of only HELLO messages, which are used to maintain and update routes. Connected time and disconnected time can be measured by detecting additions to and deletions from the route entry as shown in Figure 4b in the same manner as the case where routes are established and disconnected by receptions of RREPs and RERRs. However, use of HELLO messages is optional in AODV.
Route connections and disconnections are determined in accordance with the sequence of entry events that have occurred as shown in Table 2. Consecutive additions to the entry or consecutive deletions from the entry are treated as exceptions. An event once used is not used in the next attempt to determine connection or disconnection. The end of communication is defined as the time when the application of the sending side is closed.
3.2.2. How to Measure Route Feature Values for OLSR
OLSR constantly ensures that communication is possible by making nodes adjacent to each other exchange topology control (TC) messages periodically to keep their route information up to date. As shown in Figure 5, connected time and disconnected time can be measured based on the time when additions to or deletions from the route entry occurred at the source node, as is the case with AODV. Additions or deletions occur when TC messages are sent. If TC messages are sent at long intervals, failures to detect disconnections or to find a route that can be established may occur. In such cases, disconnections and connections as determined based on additions and deletions can be different from actual disconnections and connections. Impacts of failures to detect disconnections are considered in Section 5. Determination of disconnections and connections based on entry updates with HELLOs is similar to that for AODV shown in Figure 4b. However, with OLSR, entry updates with HELLOs can occur even if one relay node is involved. The sequence for a case involving one relay node is shown in Figure 5b.
As with AODV, route connections and disconnections are determined based on the combination of the previous event and the latest event as shown in Table 3. Consecutive additions or consecutive deletions are treated as exceptions. An event once used is not used in the next attempt to determine connection or disconnection. With OLSR, an addition occurs when the relay node moves and the route used changes as a result. Therefore, an addition that follows an addition is not treated as an exception. Rather, it is determined that the route used has been changed. The period between an addition and the next deletion is judged to be connected time. Conversely, the period between a deletion and the next addition is treated as disconnected time. An exception is a case where an unexpected combination of events occurs. When this happens, an alarm is issued and the processing is stopped. The end of communication is defined as the time when the application of the sending side is closed.
3.2.3. Algorithm for Calculating RA
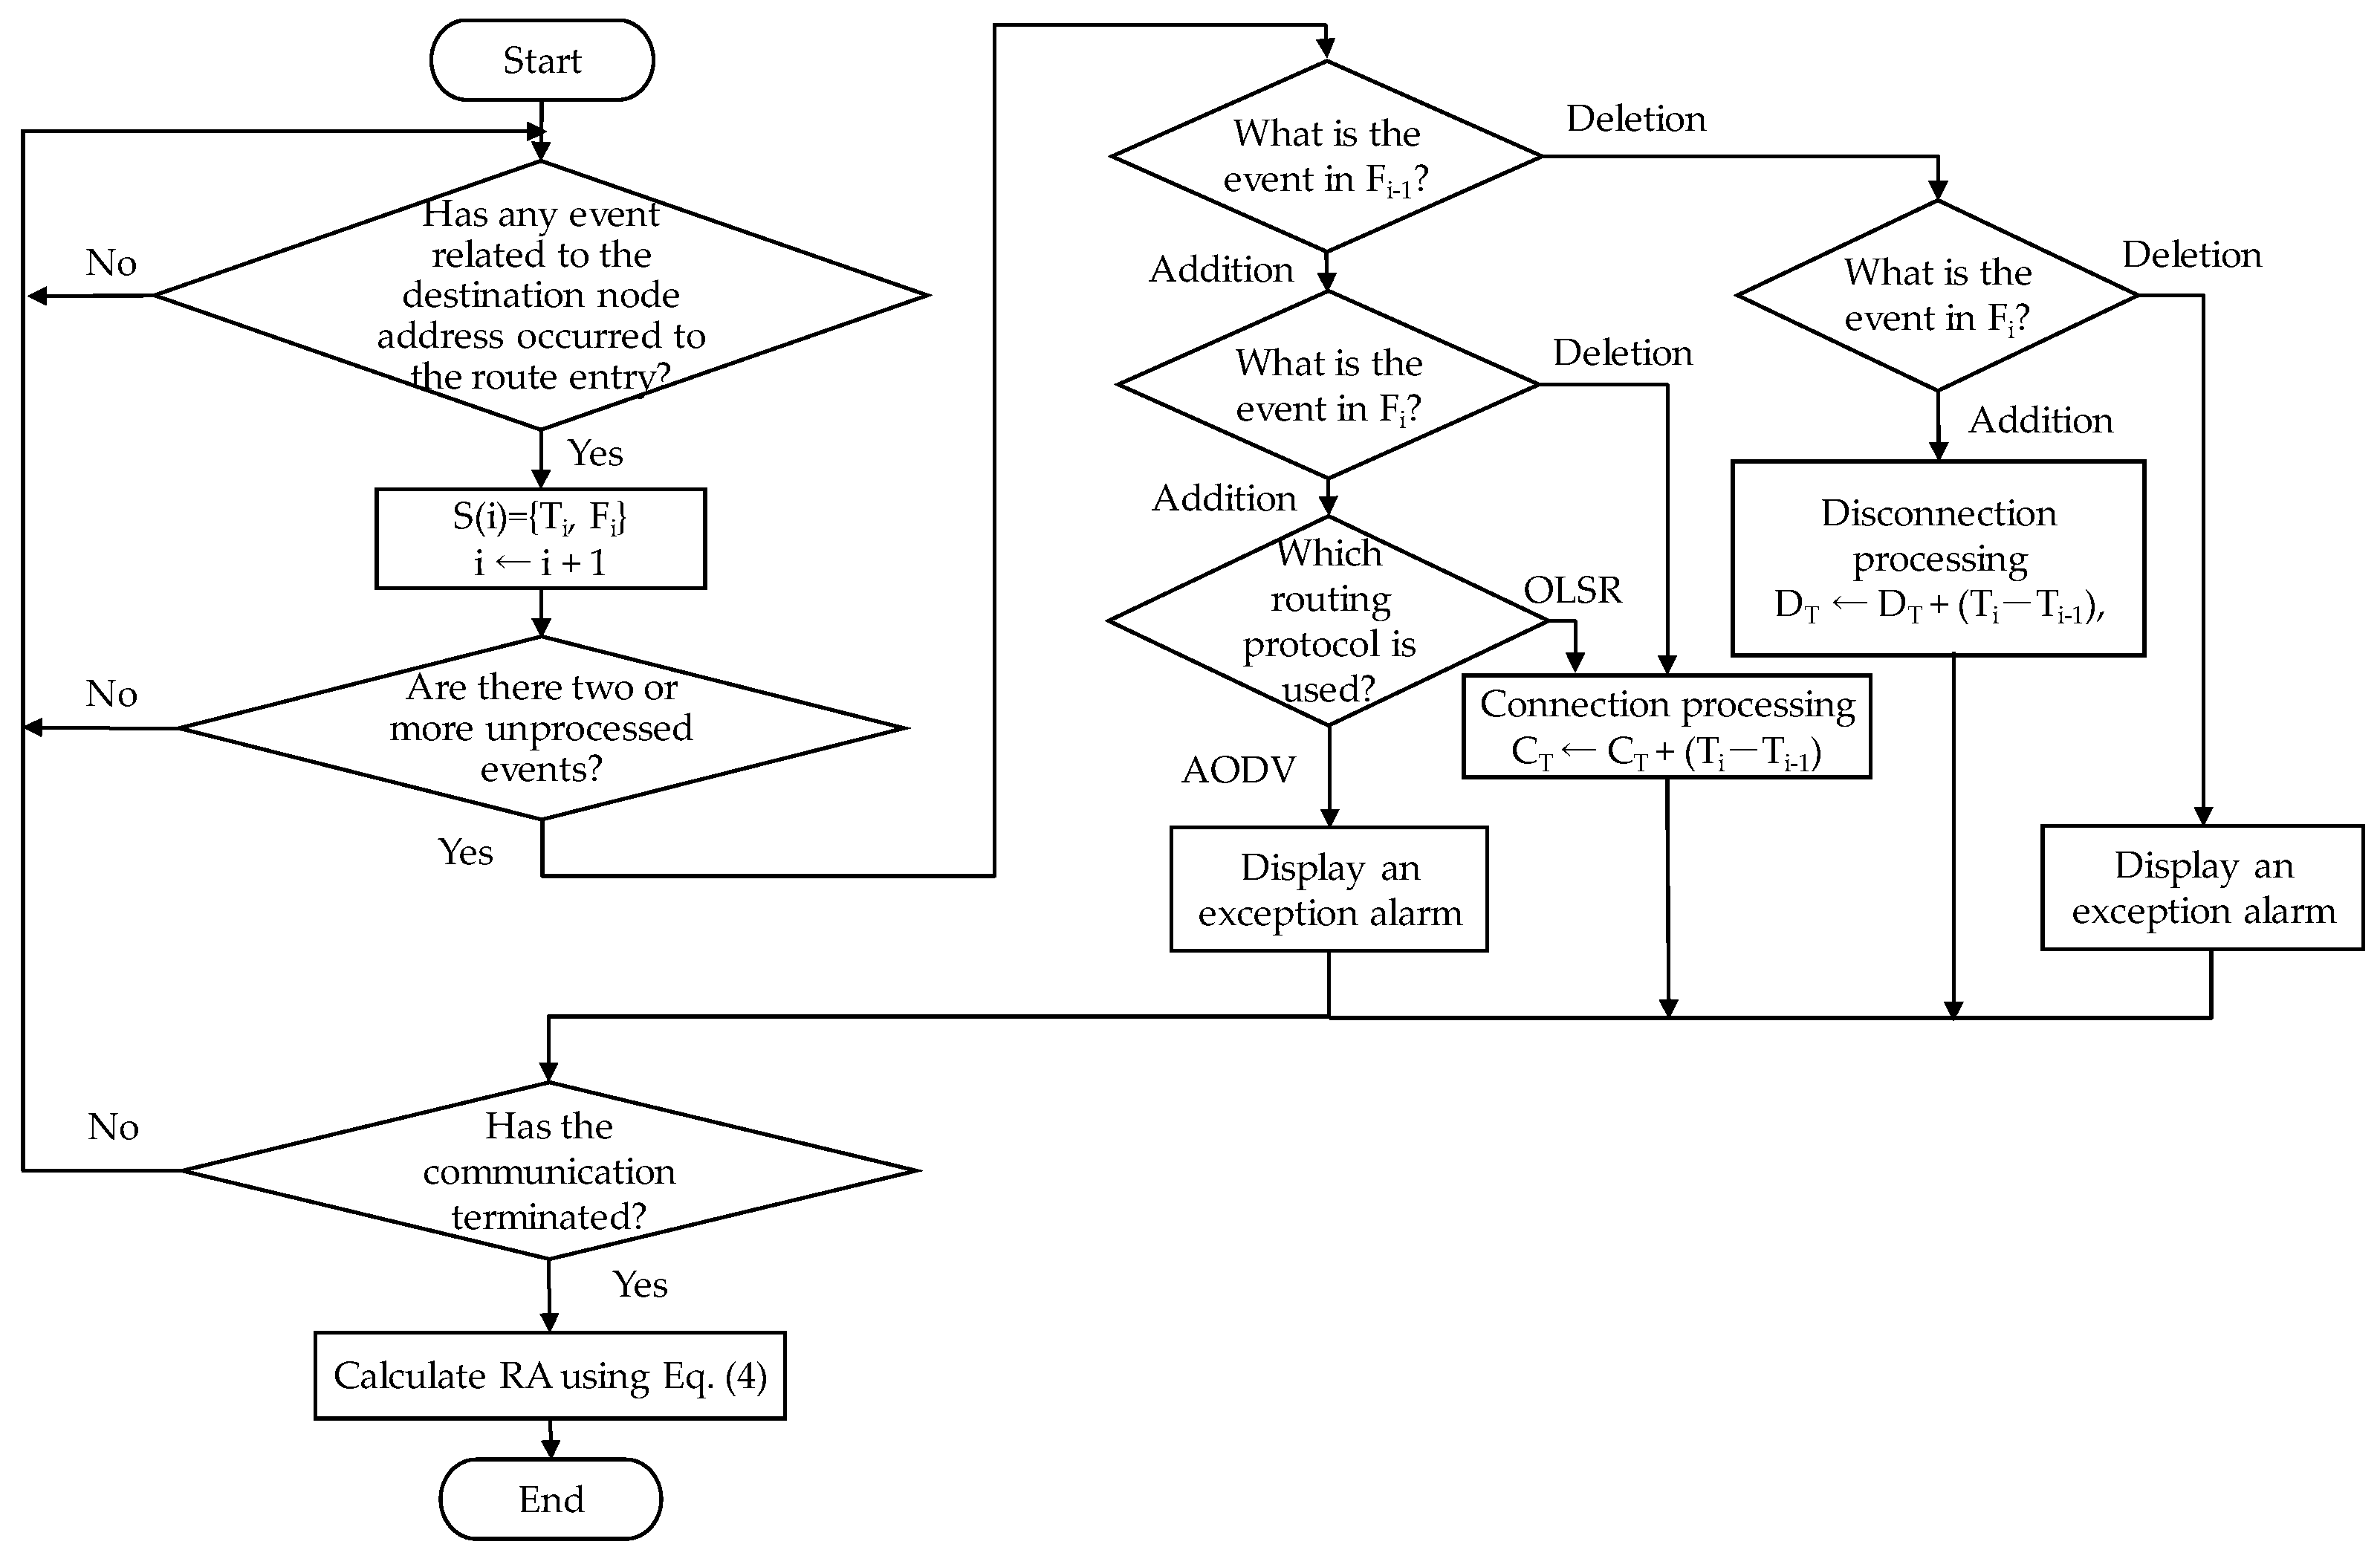
The algorithm used to calculate RA is described below, starting with a step of measuring route feature values at the source node. The flowchart of the algorithm is shown in Figure 6.
- STEP 1:
- Examine whether the destination node address is added to the route entry of the source node.If yes, go to STEP 2, else go to STEP 1.
- STEP 2:
- Detect Ti, time at which the route entry of the destination node is updated, and Fi, event information that indicates whether the entry event is an addition or a deletion, and store these items of information in S (i) = {Ti, Fi}. The initial value of i is 1. Each time an item of information is added, i is incremented by 1.
- STEP 3:
- Branch off based on whether the latest two unprocessed events have been stored, as follows:
- Case 3-1:
- If only one event has been stored (only S (i) has information), go to STEP 1.
- Case 3-2:
- If two events have been stored (both S (i-1) and S (i) have information), go to STEP 3.
- STEP 4:
- Branch off based on the content of F stored in S (i-1) and S (i), as follows:
- Case 4-1:
- If {Fi-1, Fi} = {addition, addition}, go to STEP 7.
- Case 4-2:
- If {Fi-1, Fi} = {addition, deletion}, go to STEP 5 (the connection processing).
- Case 4-3:
- If {Fi-1, Fi} = {addition, addition}, go to STEP 6 (the disconnection processing).
- Case 4-4:
- If {Fi-1, Fi} = {addition, addition}, go to STEP 8 (the exception processing).
- STEP 5:
- Add the difference between Ti and Ti-1 to total connected time, CT;namely, CT ← CT + (Ti − Ti-1). Go to STEP 9.
- STEP 6:
- Add the difference between Ti and Ti-1 to total disconnected time, DT;namely DT ← DT + (Ti − Ti-1). Go to STEP 9.
- STEP 7:
- Branch off based on the routing protocol used, as follows:
- Case 7-1:
- If the routing protocol is AODV, go to STEP 8 (exception processing).
- Case 7-2:
- If the routing protocol is OLSR, this is a route change.Go to STEP 5 (connection processing).
- STEP 8:
- This is an unexpected combination of events. Issue an alarm and stop the processing.Go to STEP 9.
- STEP 9:
- Branch off based on whether the communication has terminated, as follows:
- Case 9-1:
- If the communication has not terminated, go to STEP 1.
- Case 9-2:
- If the communication has terminated, calculate RA from CT, and DT using Equation (4).
As mentioned above, RA can be calculated from the connected time, disconnected time, and the number of route disconnections. These items of information are obtained by detecting information additions to or information deletions from the source node’s route entry. These events occur when the source node receives routing control messages. In other words, these events are confined to the source node. This means that RA can be calculated without any need to receive feedback information from the destination node. In contrast, calculations of conventional metrics, such as packet loss rate and throughput, require that the source node receive feedback information from the destination node.
4. Construction of an Evaluation Environment
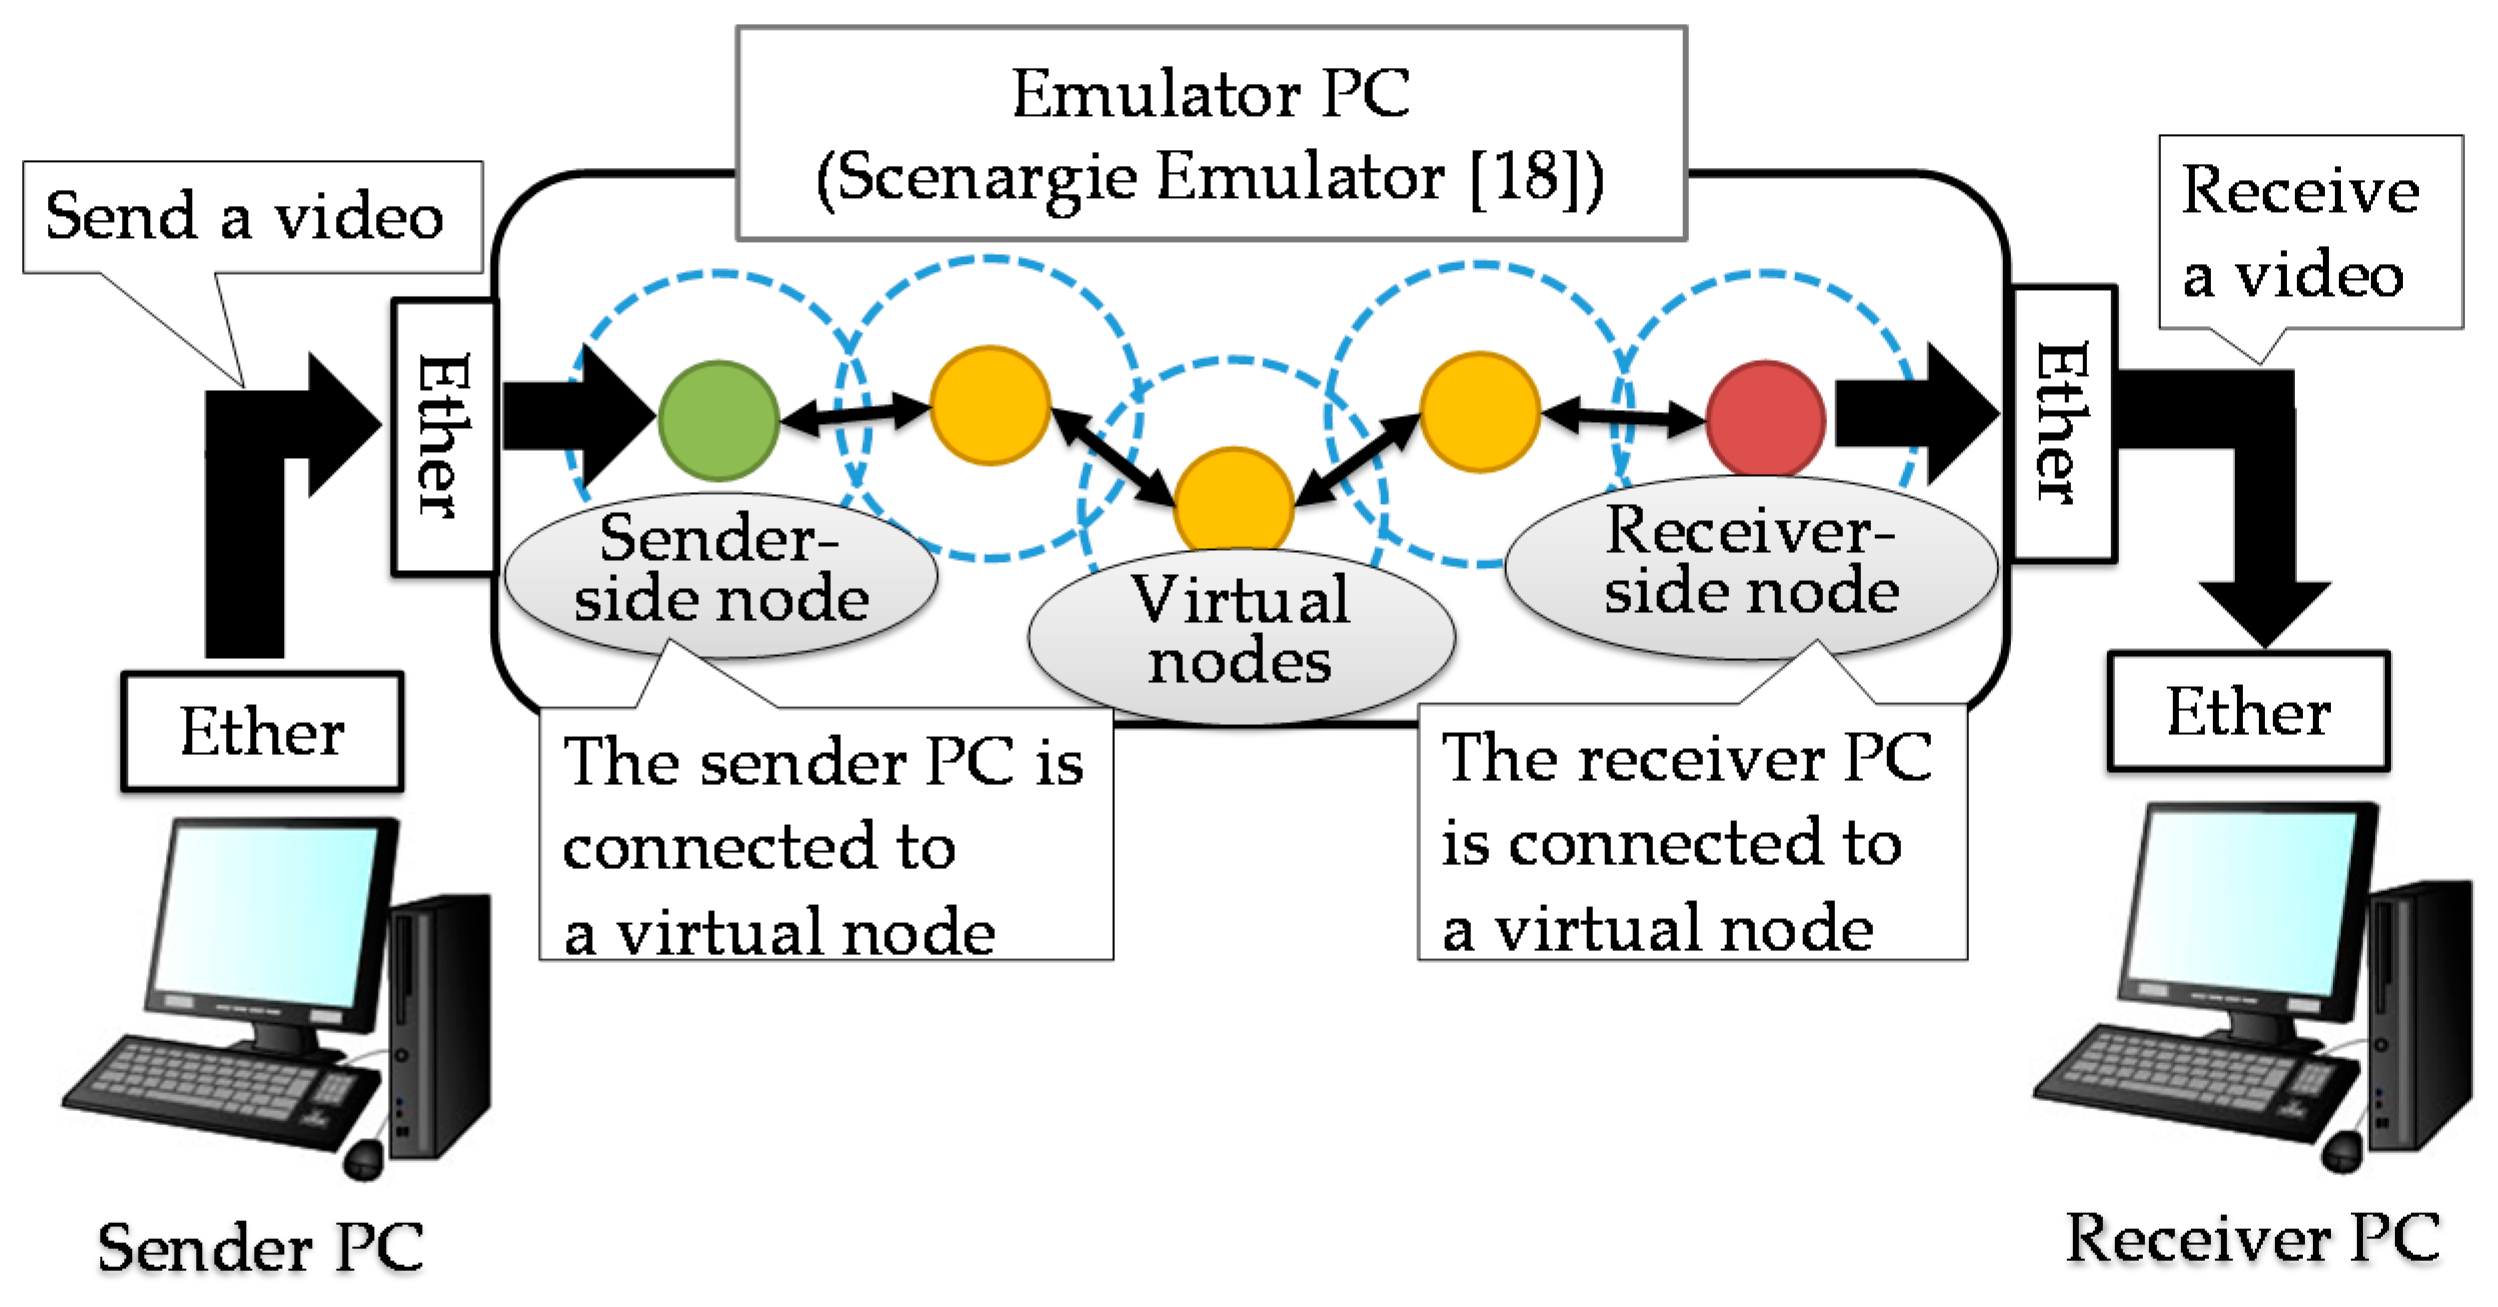
We have constructed an evaluation environment. The environment must be able to emulate transmission of video streams over a MANET and must provide means to measure network states. The configuration of the evaluation environment is shown in Figure 7. A network emulator, Scenargie Emulator [18], which runs on Linux and is from Space-Time Engineering, was used to emulate a MANET. Two USB–Ethernet converters were attached to the PC in which the emulator was implemented. A PC for sending videos and a receiver PC were connected to these converters using a wired LAN.
Figure 8 shows the configuration of the network that connects the emulator PC, in which Scenargie Emulator had been installed, and other PCs. The three Ethernet ports were connected to the sender PC, the receiver PC, and the WAN (Wide Area Network), respectively. The WAN was connected because, to use Scenargie Emulator, the emulator PC needs to be connected to an external server for authentication. Each tap device, which was a virtual network interface card (NIC) created using a tap command, was bridge-connected to an Ethernet port, which was connected to either the sender PC or the receiver PC [19]. Bridge-connected NIC devices—Br1 and Br2—were connected to the emulator PC. This is how the emulator PC was connected to the sender PC and the receiver PC. The server node and the client node respectively played the roles of the sender-side node and the receiver-side node on Scenargie Emulator. We set the properties of Scenargie Emulator by referring to Reference [18].
The media server used was Video LAN Client (VLC) Media Player. It played video streams using UDP (User Datagram Protocol). The quality of videos recorded in the receiver PC was evaluated. In the experiment, immediately after the sender PC started sending a video, the emulator program was launched to start the MANET simulator. Videos recorded in the receiver PC over a specified emulation time were used as evaluation videos.
The quality metrics used were RA, average number of hops, throughput, and packet loss rate. RA and the average number of hops were obtained by having a calculation program developed in Perl read trace data produced by the emulation. The calculation program implemented the measurement and RA calculation method described in Section 3. Throughput is the number of bytes in the video packets received—which was counted by Wireshark [20]—divided by communication time. This is shown in Equation (5). Packet loss rate is “the number of packets sent by the sender side minus the number of packets received by the receiver side” divided by the number of packets sent by the sender. Both the number of packets received and the number of packets sent were counted by Wireshark. This is shown in Equation (6).
5. Evaluation of the RA Calculation Method and Verification of Usefulness of RA
Using the evaluation environment described above, we evaluated the proposed RA calculation method and examined how useful RA is as a metric of network QoS and video streaming QoE.
5.1. Observability of the Route Feature Values
We examined how observable RA is and how the route feature values capture changes in route nonuniformity. We conducted video streaming experiments in which total connected time and total disconnected time were measured for different numbers of nodes and different moving speeds. The number of nodes was altered from 3 to 7, and the length of emulation time was varied from 90 to 180 and 270 s. As expressed in Equation (7), the emulation time is the first route establishment time after the emulation program was started plus communication time (total connected time + total disconnected time). We defined the communication to end when the emulation ends. The moving speeds of nodes were varied between 0 m/s and 2 m/s considering that nodes may stand still. The routing protocol used was AODV. The emulation conditions are shown in Table 4. By referring to the holding time of conventional telephone calls, we set the emulation time at about 270 s at the longest. Since, unlike the Internet, a MANET is not an always-on environment, we made the video streaming delivery time shorter than that in the Internet in this experiment.
Emulation time = first route establishment time + communication time (total connected time + total disconnected time)
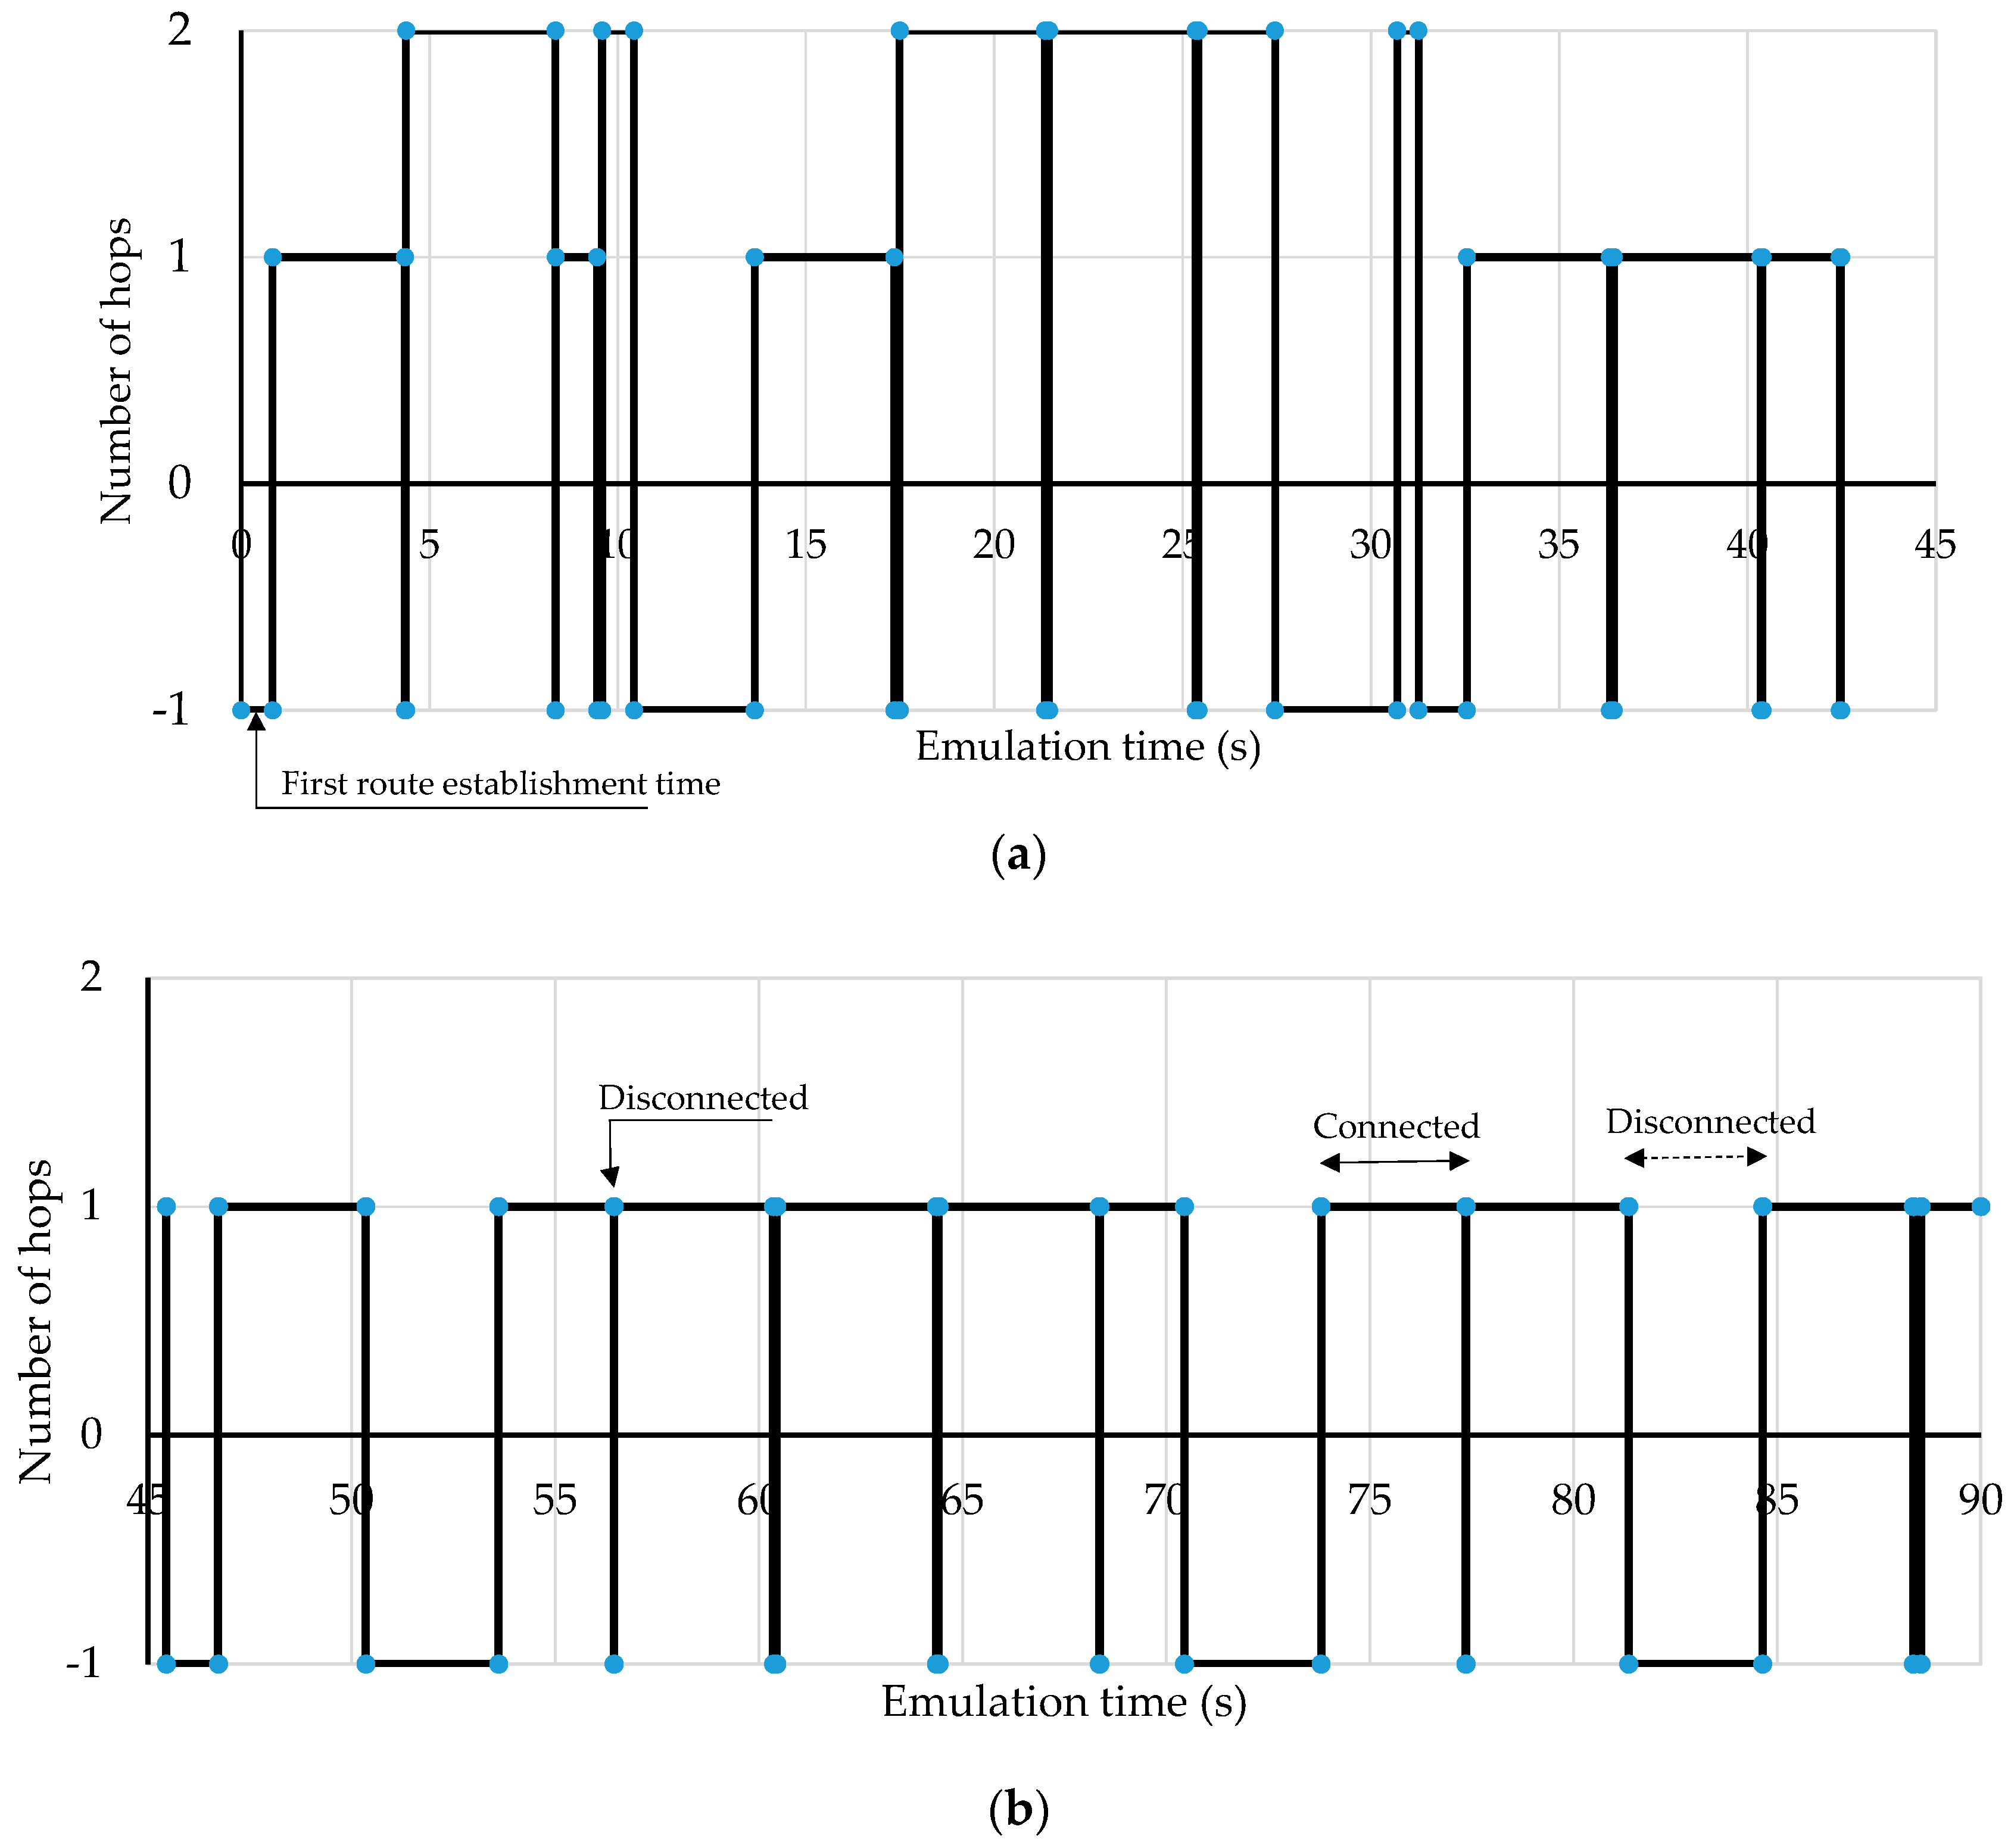
An example of a communication pattern in which connections and disconnections occur alternately after the start of emulation is shown in Figure 9. The vertical axis indicates the number of hops from the source node to the destination node during the time in which a connection is set up between them. The width of each bar indicates the time for which a connection is maintained. A section in which the number of hops is −1 indicates the time for which the route is disconnected. The time between the start of emulation and 0.83 s later was the first route establishment time. There were 22 disconnections. Blank sections indicate the time when there was no connection. The length of each bar indicates the number of hops from the source node to the destination node. The number of hops is equal to the number of relay nodes in this paper. If the number of hops is 0, the source node directly communicates with the destination node. We can confirm from Figure 9 that the measurement methods proposed in Section 3.2 are useful for observing connection and disconnection triggers and connected time. The presence of changes in the number of hops indicates that the route nonuniformity of a MANET is observable.
Table 5 shows how the route feature values and RA changed when the emulation time and the number of nodes were changed. There were cases where the sum of the total connected time and the total disconnected time was not the same as the emulation time. The difference was the first route establishment time after the emulation started. The table confirms that the total connected time, the total disconnected time, and the number of disconnections can be measured using the measurement method described in Section 3.2. We were able to calculate RA from these observed route feature values as shown in Table 5, and thus verified that RA was observable. It can be seen that RA varied between 71 and 83 under the conditions shown in Table 4.
5.2. Usefulness of RA as a QoS Metric
We conducted experiments to examine how useful RA is as a QoS metric. Specifically, we examined the relationship between RA and conventional QoS metrics: packet loss rate and throughput. We developed emulation scenarios in which the area within which nodes can move, the number of nodes, and the initial locations of nodes were adjusted so that calculated RAs would take values close to the 12 values assumed. Since video quality can be degraded severely by even minor packet loss, we selected an increment of 5 for RA after RA reached 80 so that we could examine QoS metrics in finer granularity. In addition, to check how variations in the number of hops, video quality, and routing protocol affect the relationship between RA and the QoS metrics, we produced, for each RA value, videos with different values for these variables. Thus, a total of 92 scenarios were developed. Furthermore, to be able to vary the quality of transmitted videos, we produced two types of video, each having a different total bit rate and resolution. The video material used was “Big Buck Bunny” [21]. Detailed emulation conditions are shown in Table 6 and the codec conditions in Table 7. Although the length of the low-quality video was 10 min, the playing of this video stopped automatically as soon as the emulation time ended in the experiments.
We examined the relationship between RA and the conventional QoS metrics. The results are shown in Figure 10, Figure 11 and Figure 12. Approximate straight lines are also shown in each graph.
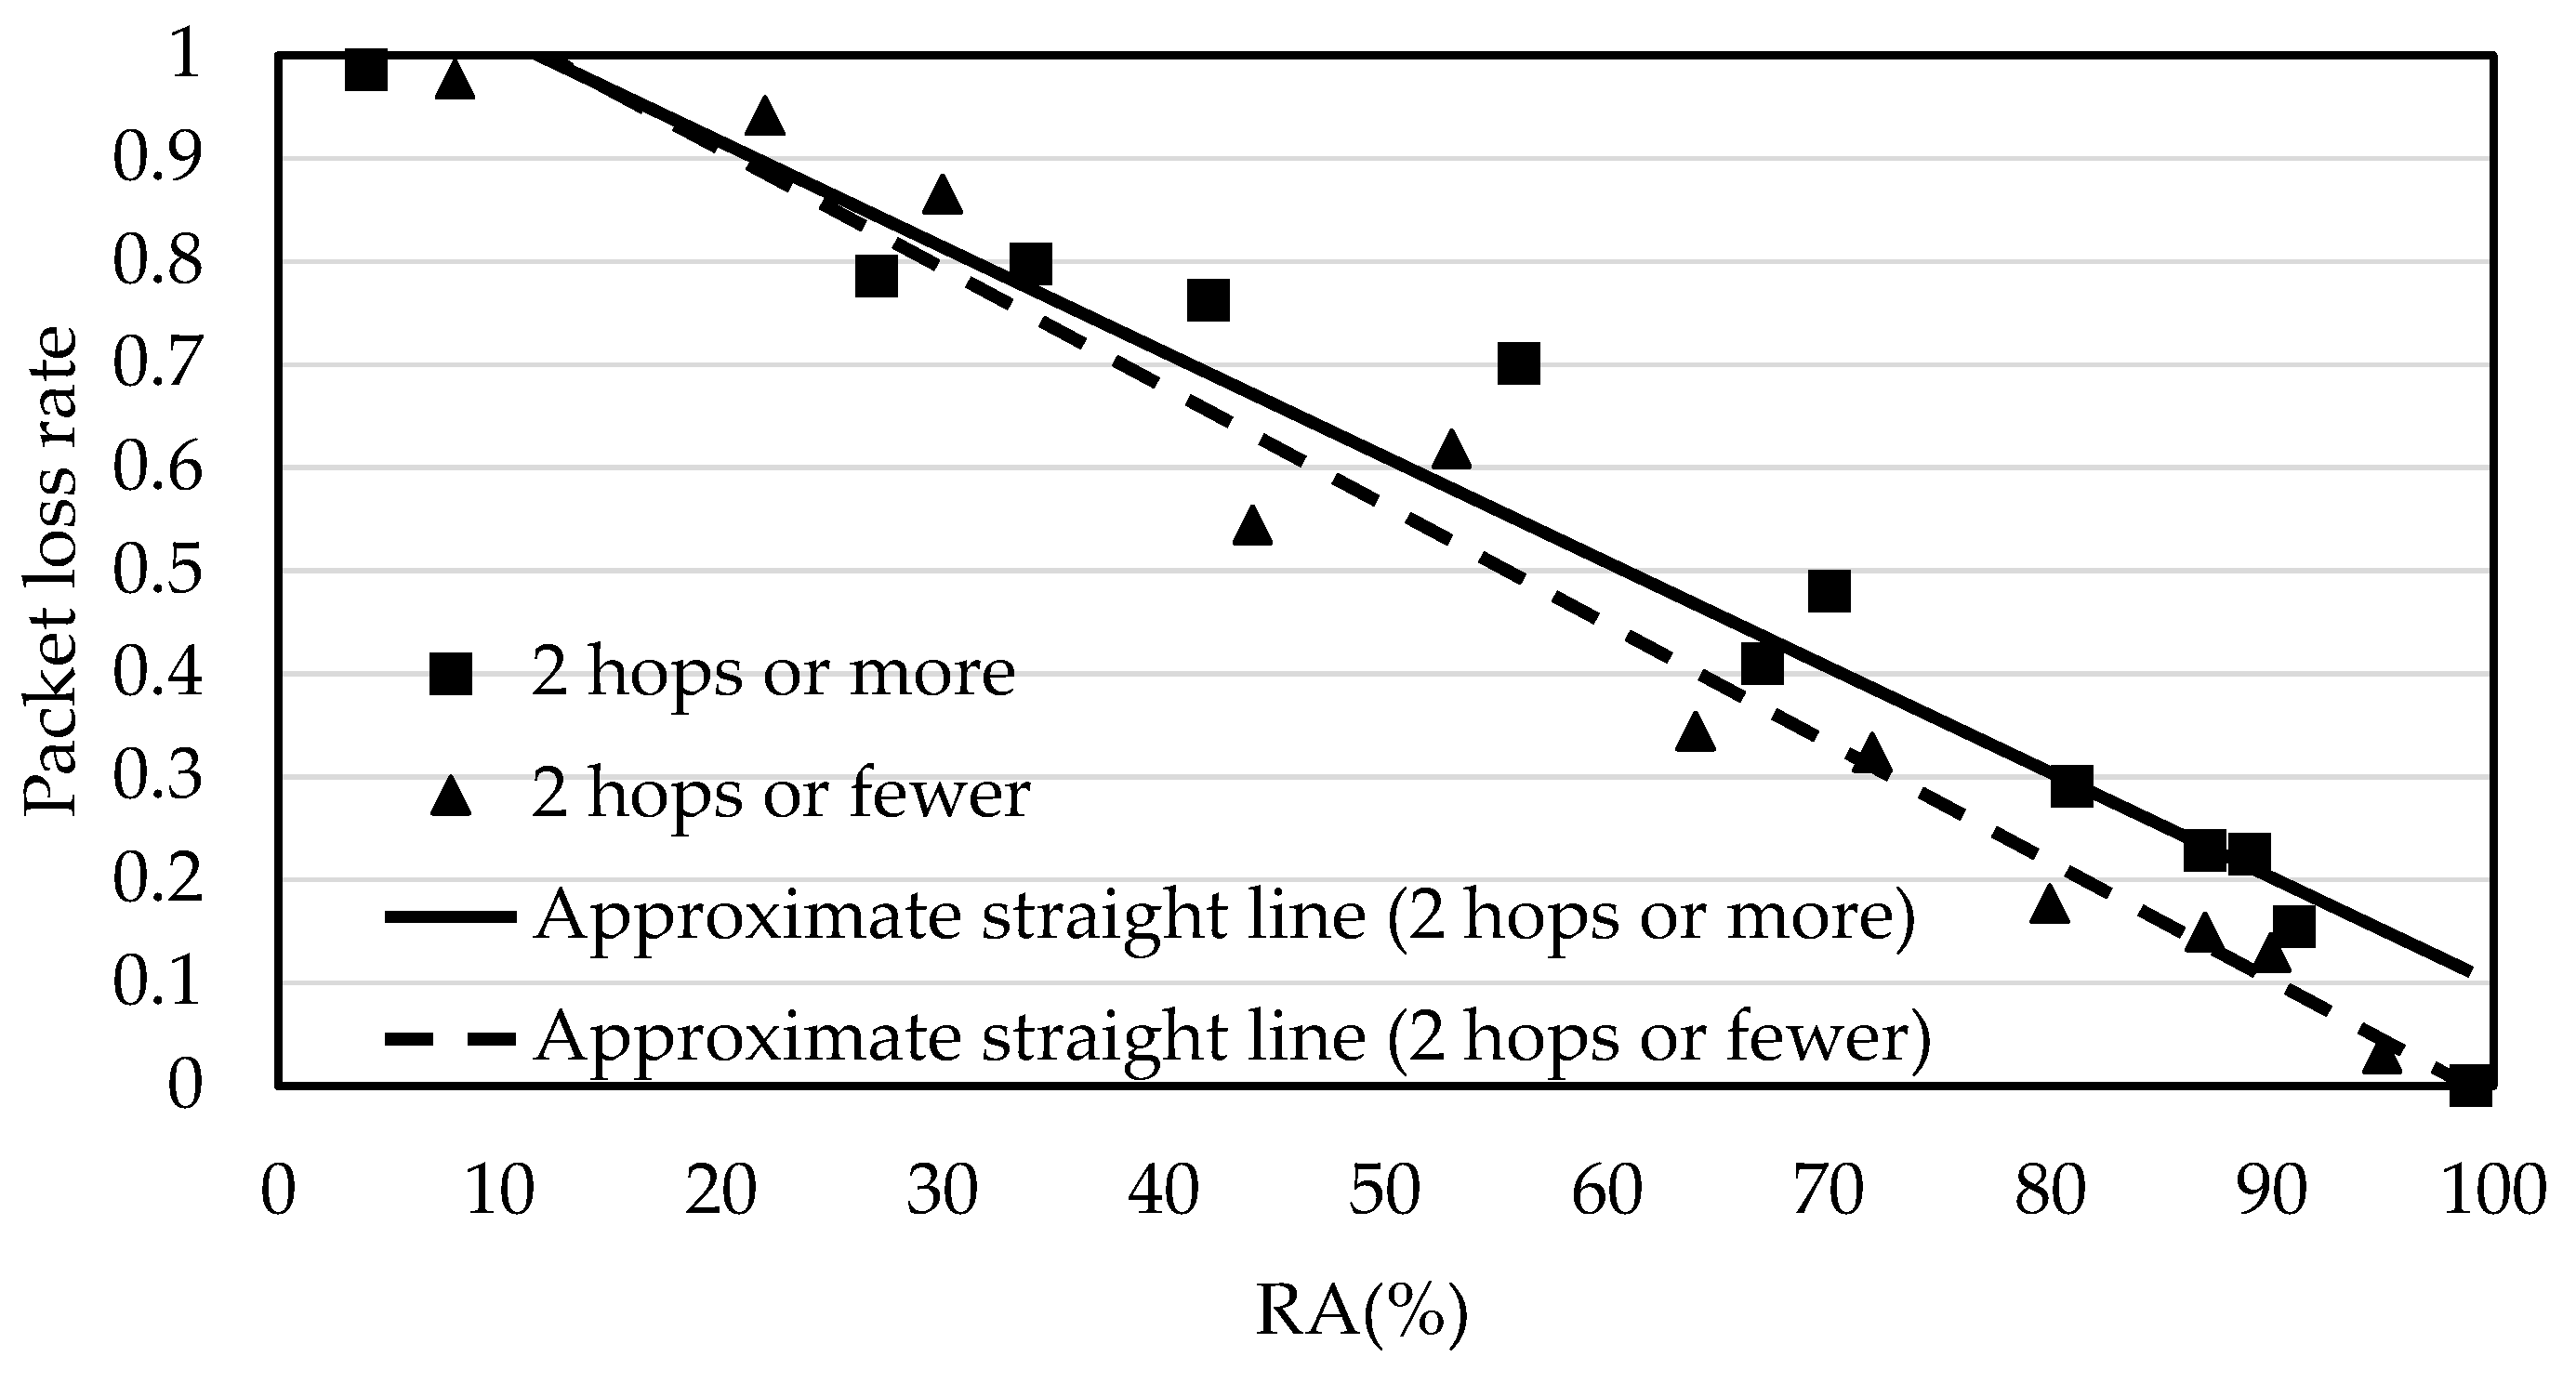
Figure 10 shows the relationship between RA and packet loss rate when the number of hops was varied. Since packet loss rate is affected by both the quality degradation attributable to an adverse radio environment and that attributable to MANET properties, it is not possible to pinpoint the factors that caused packet loss. On the other hand, being a metric of route nonuniformity, RA reflects changes in route quality mainly attributable to MANET properties, i.e., frequent occurrences of disconnections. The fact that there was a negative linear correlation between RA and packet loss rate, as shown in Figure 10, indicates that packet loss was caused mostly by disconnections. This also means that packet loss in the network can be monitored by observing RA. Figure 10 shows that the packet loss rate for the case where the average number of hops was 2 or more is higher than that for the case where the average number of hops was 2 or fewer. The reason for this can be that a rise in the number of hops increases transmission delay, which in turn increases packet loss. Although a change in transmission delay due to a change in the average number of hops affects the relationship between RA and packet loss rate, its effect on this relationship is smaller than the effect of disconnections.
Figure 11 looks at how the choice of routing protocol affects the relationship between RA and packet loss rate. It shows that the choice of routing protocol scarcely affects this relationship. This is most likely because nodes moved so slowly that differences between the two routing protocols did not manifest themselves. Although some routes’ disconnections remain undetected with our RA calculation method for OLSR, the effect of this is small because this property is not much different from that of AODV.
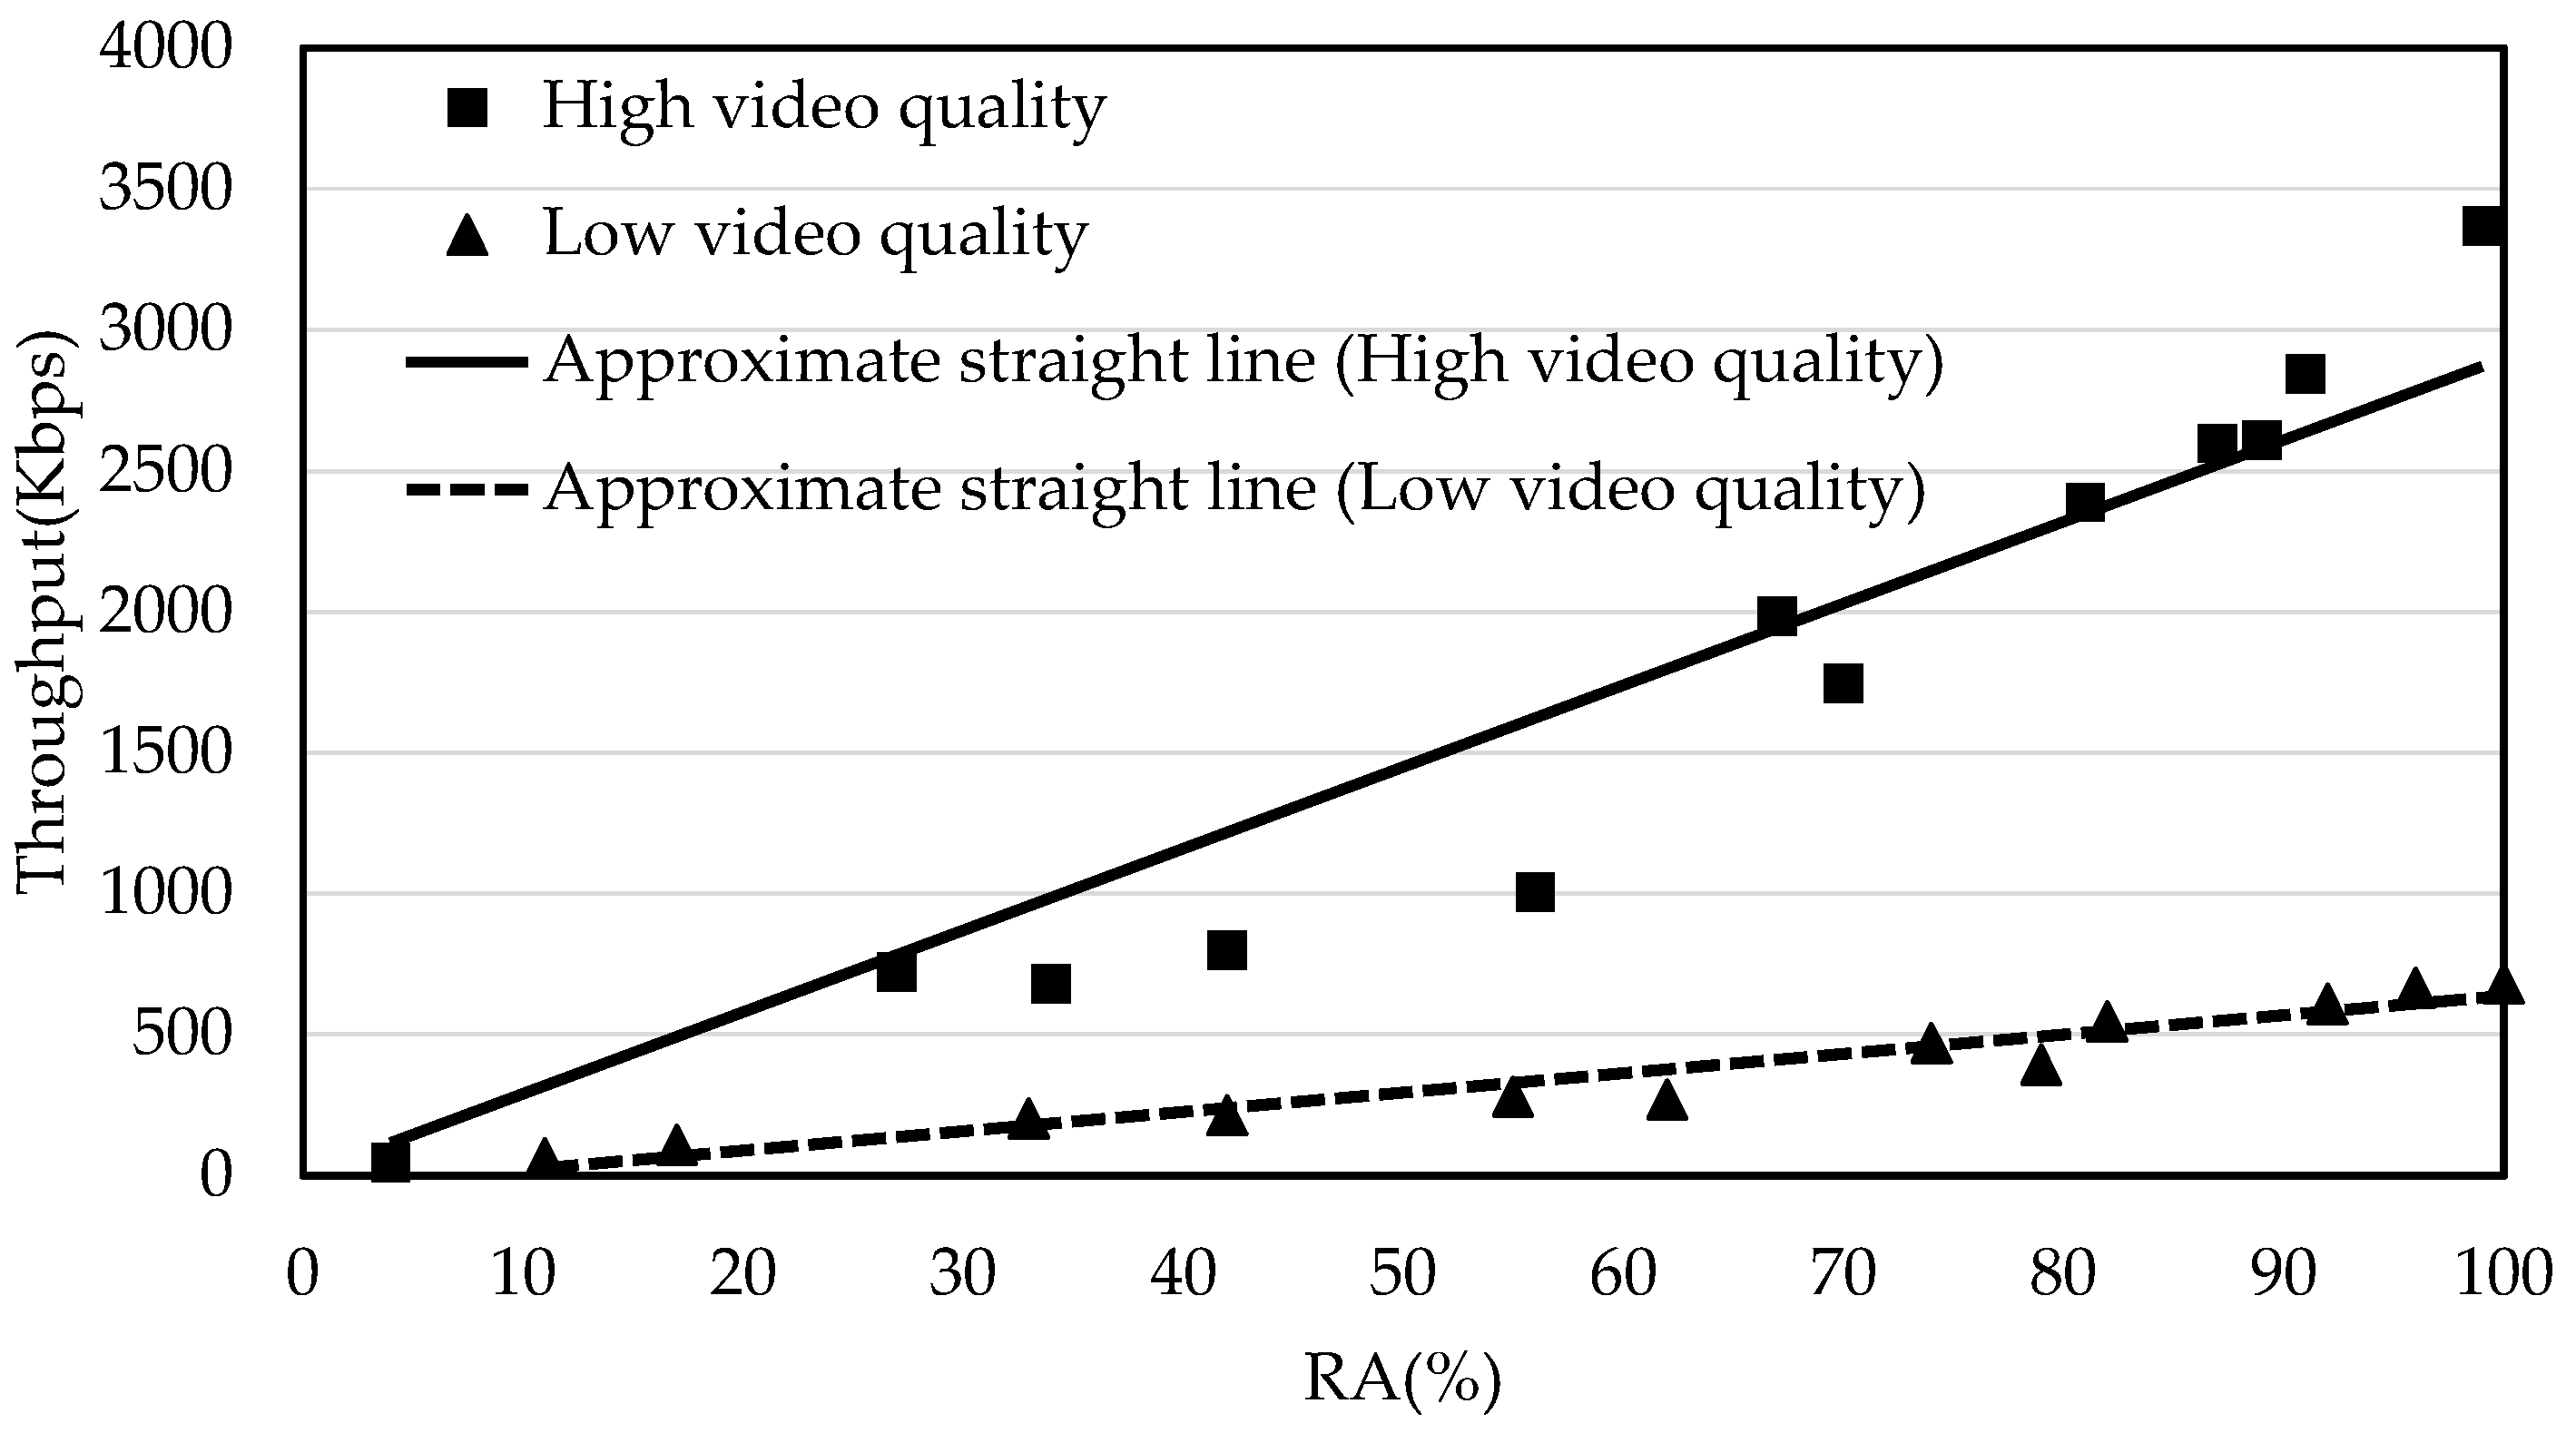
Figure 12 shows how video quality affects the relationship between RA and throughput. It shows that there is a positive linear correlation between RA and throughput and that the throughput increases in such a way that it reaches the total bit rate of the reference video when RA = 100. This means that if the total bit rate of the video can be obtained and the transmission bit rate is constant, the network throughput can be estimated from RA. However, if the total bit rate of the video to be transmitted cannot be obtained, the maximum throughput when RA = 100 cannot be determined; thus, the actual network throughput cannot be estimated from RA.
The above results indicate that RA is correlated to packet loss rate and to throughput, and thus is useful as a QoS metric. Packet loss rate and throughput cannot be determined unless feedback information from the destination node is available. In contrast, RA can be determined by the source node alone. Therefore, the network status can be monitored without adding any extra traffic load to the network.
5.3. Usefulness of RA as a QoE Metric
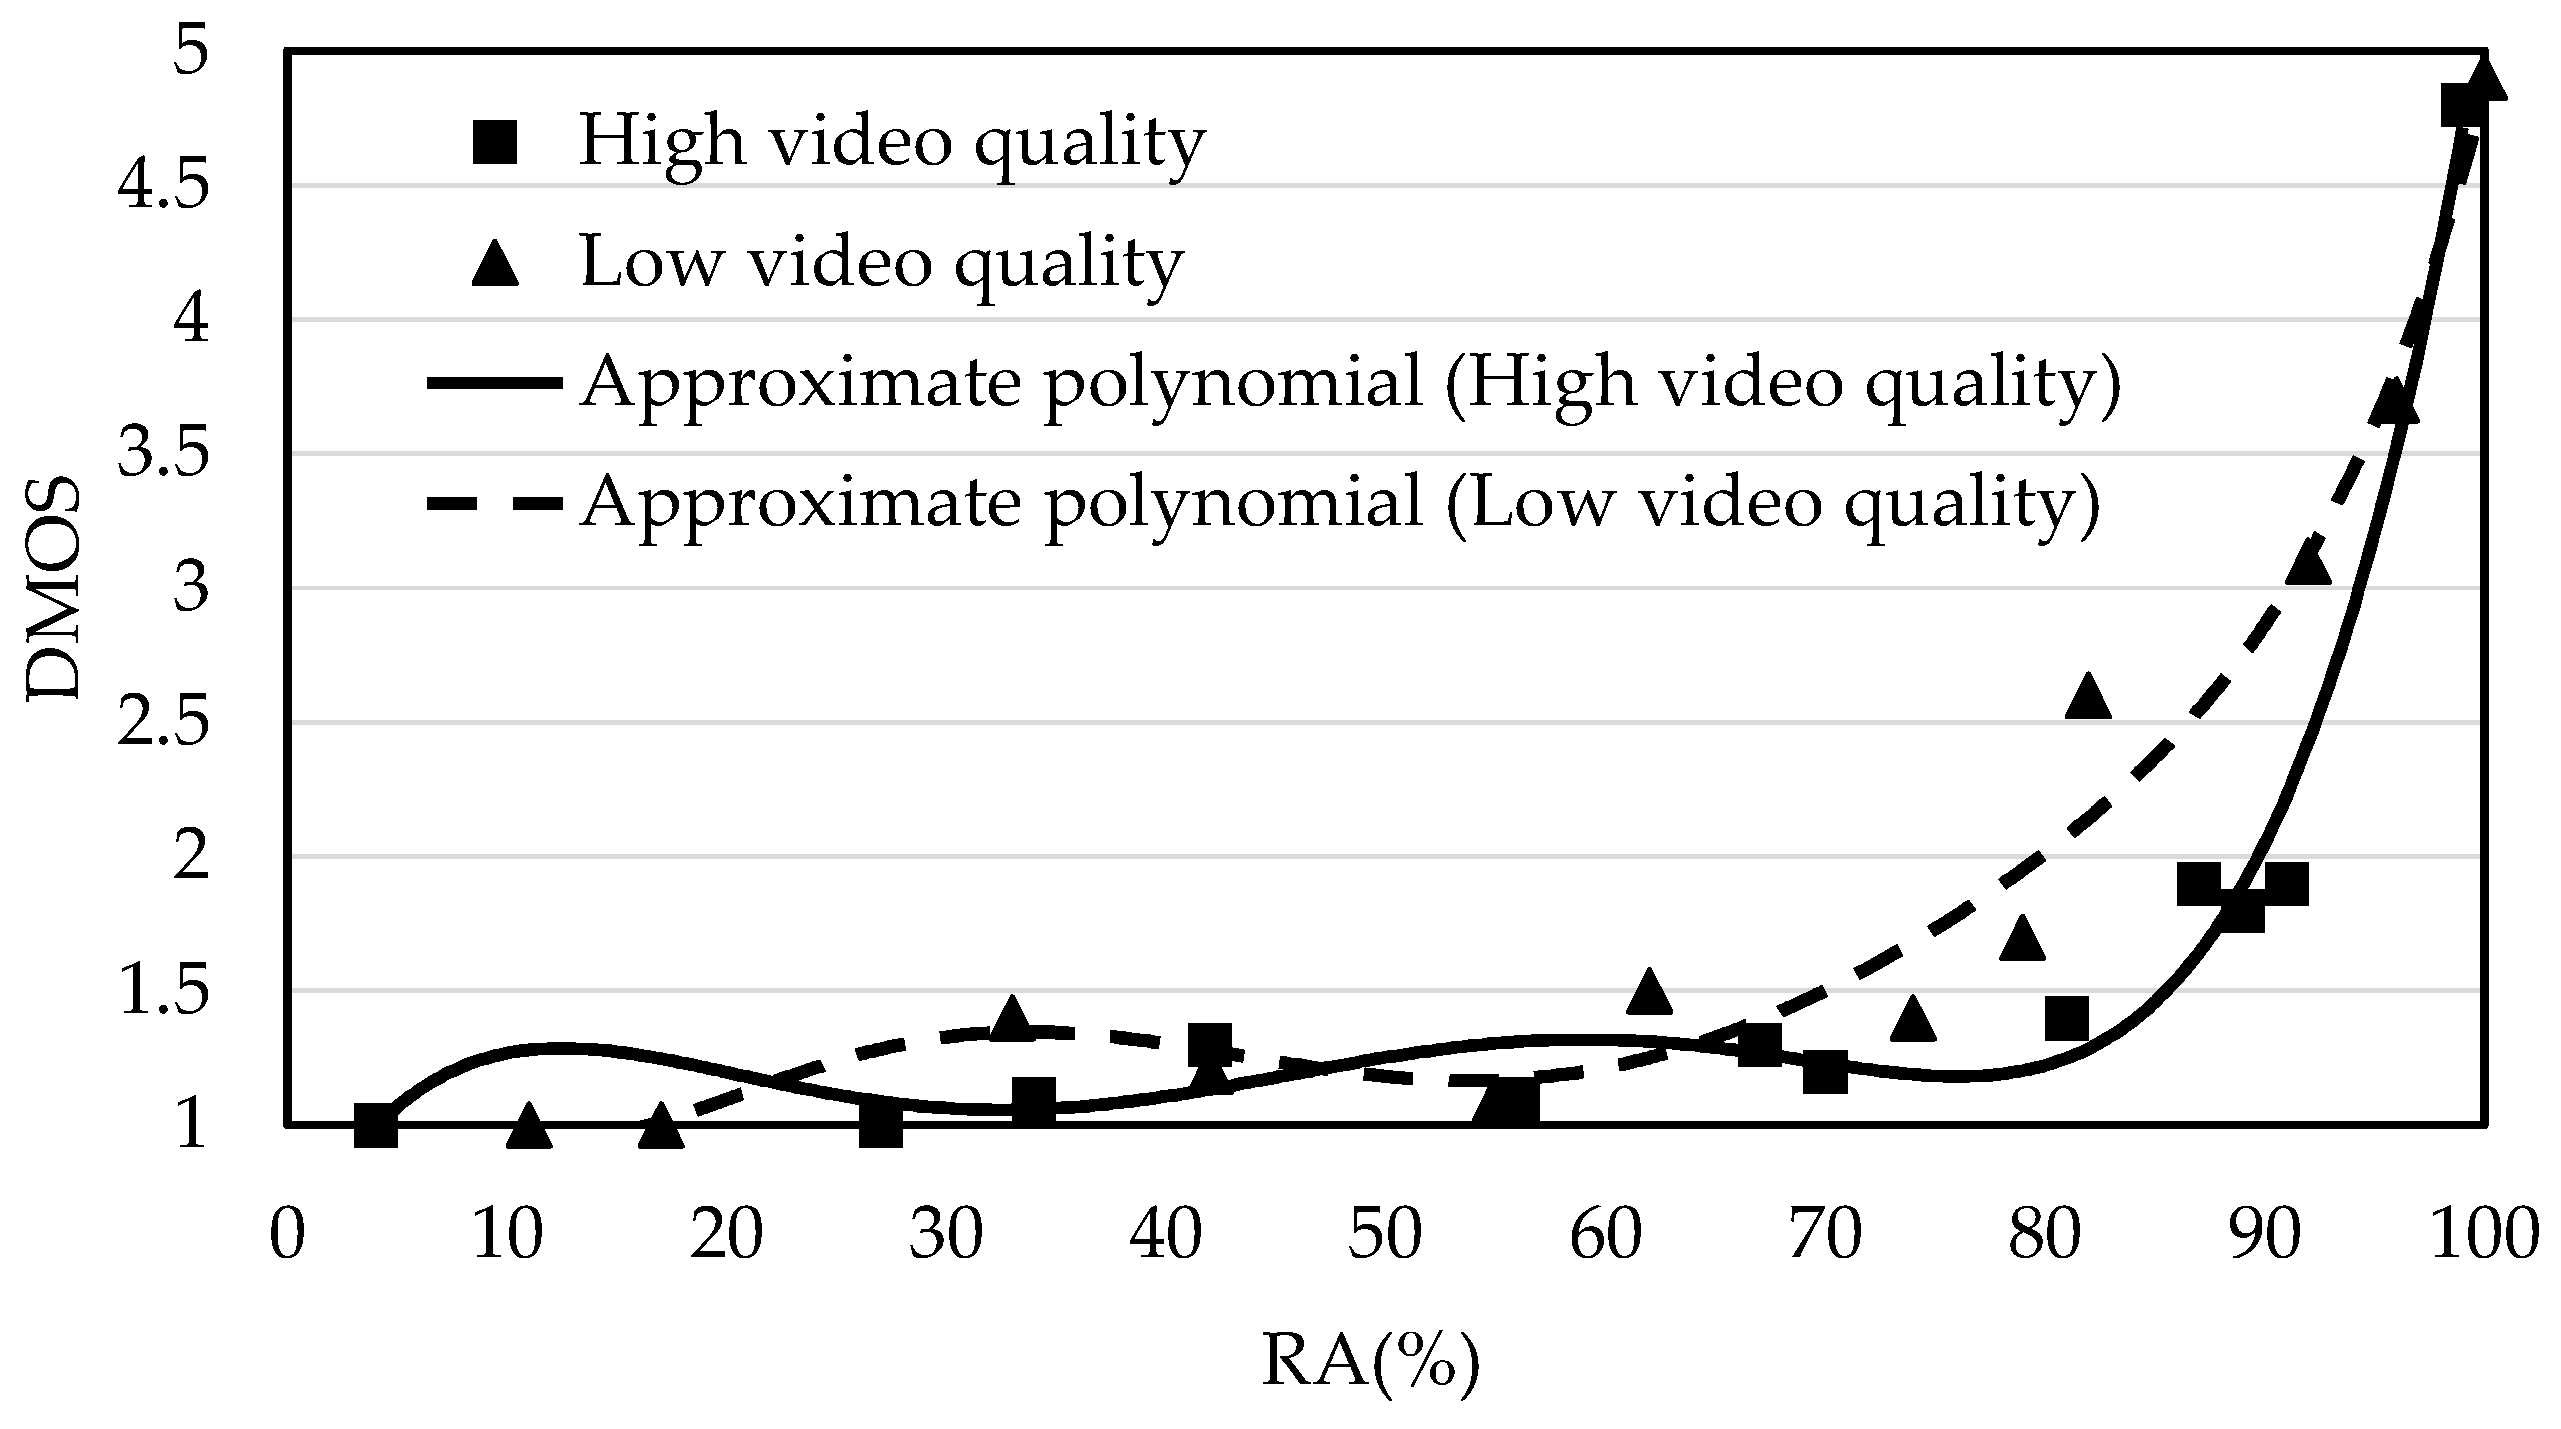
We made a subjective quality assessment test of streaming video to verify whether RA is useful as a QoE metric. In the evaluation environment described in Section 4, videos transmitted from the sender PC were captured by the receiver PC, and the quality of each captured video was assessed by subjects. The test was based on the degradation category rating method (DCR) [22] which has been standardized by ITU-T (International Telecommunication Union—Telecommunication Standardization Sector). Each subject first watched the reference video, then viewed a video to be assessed (test video), and rated the test video using a 5-point degradation scale. There were 40 subjects, men and women aged 10 to 30 years. Many of them were around 20 years old. It was anticipated that subjects aged about 20 tended to be more critical than people in other age groups because they often watch videos on the Internet. Therefore, before starting the test, the subjects were asked to assess test videos considering that the reference video was the highest quality video. The length of assessment time per subject was around 75 min. Since the ratings by the subjects can vary, the rating values by 10 subjects were collected for each scenario. The average of these values was used as the degradation mean opinion score (DMOS). The assessment results are shown in Figure 13, Figure 14 and Figure 15.
Figure 13 shows the relationship between RA and DMOS for videos having different video quality levels. When RA increased beyond a certain value, DMOS rose rapidly, indicating that there is a positive correlation between RA and QoE. While a subject was viewing a test video, the video stopped when the route used was disconnected. When a route was re-established, the test video the subject began to view did not start at the point it stopped. The video that was played during the disconnected time was skipped. When the test video was played again, block noise arose. If disconnections occurred in rapid succession, the video became seriously corrupted. The fact that DMOS for low-quality videos was higher than that for high-quality videos in Figure 13 can be attributable to the more serious block noise that arose when a high-quality video was replayed after a disconnection.
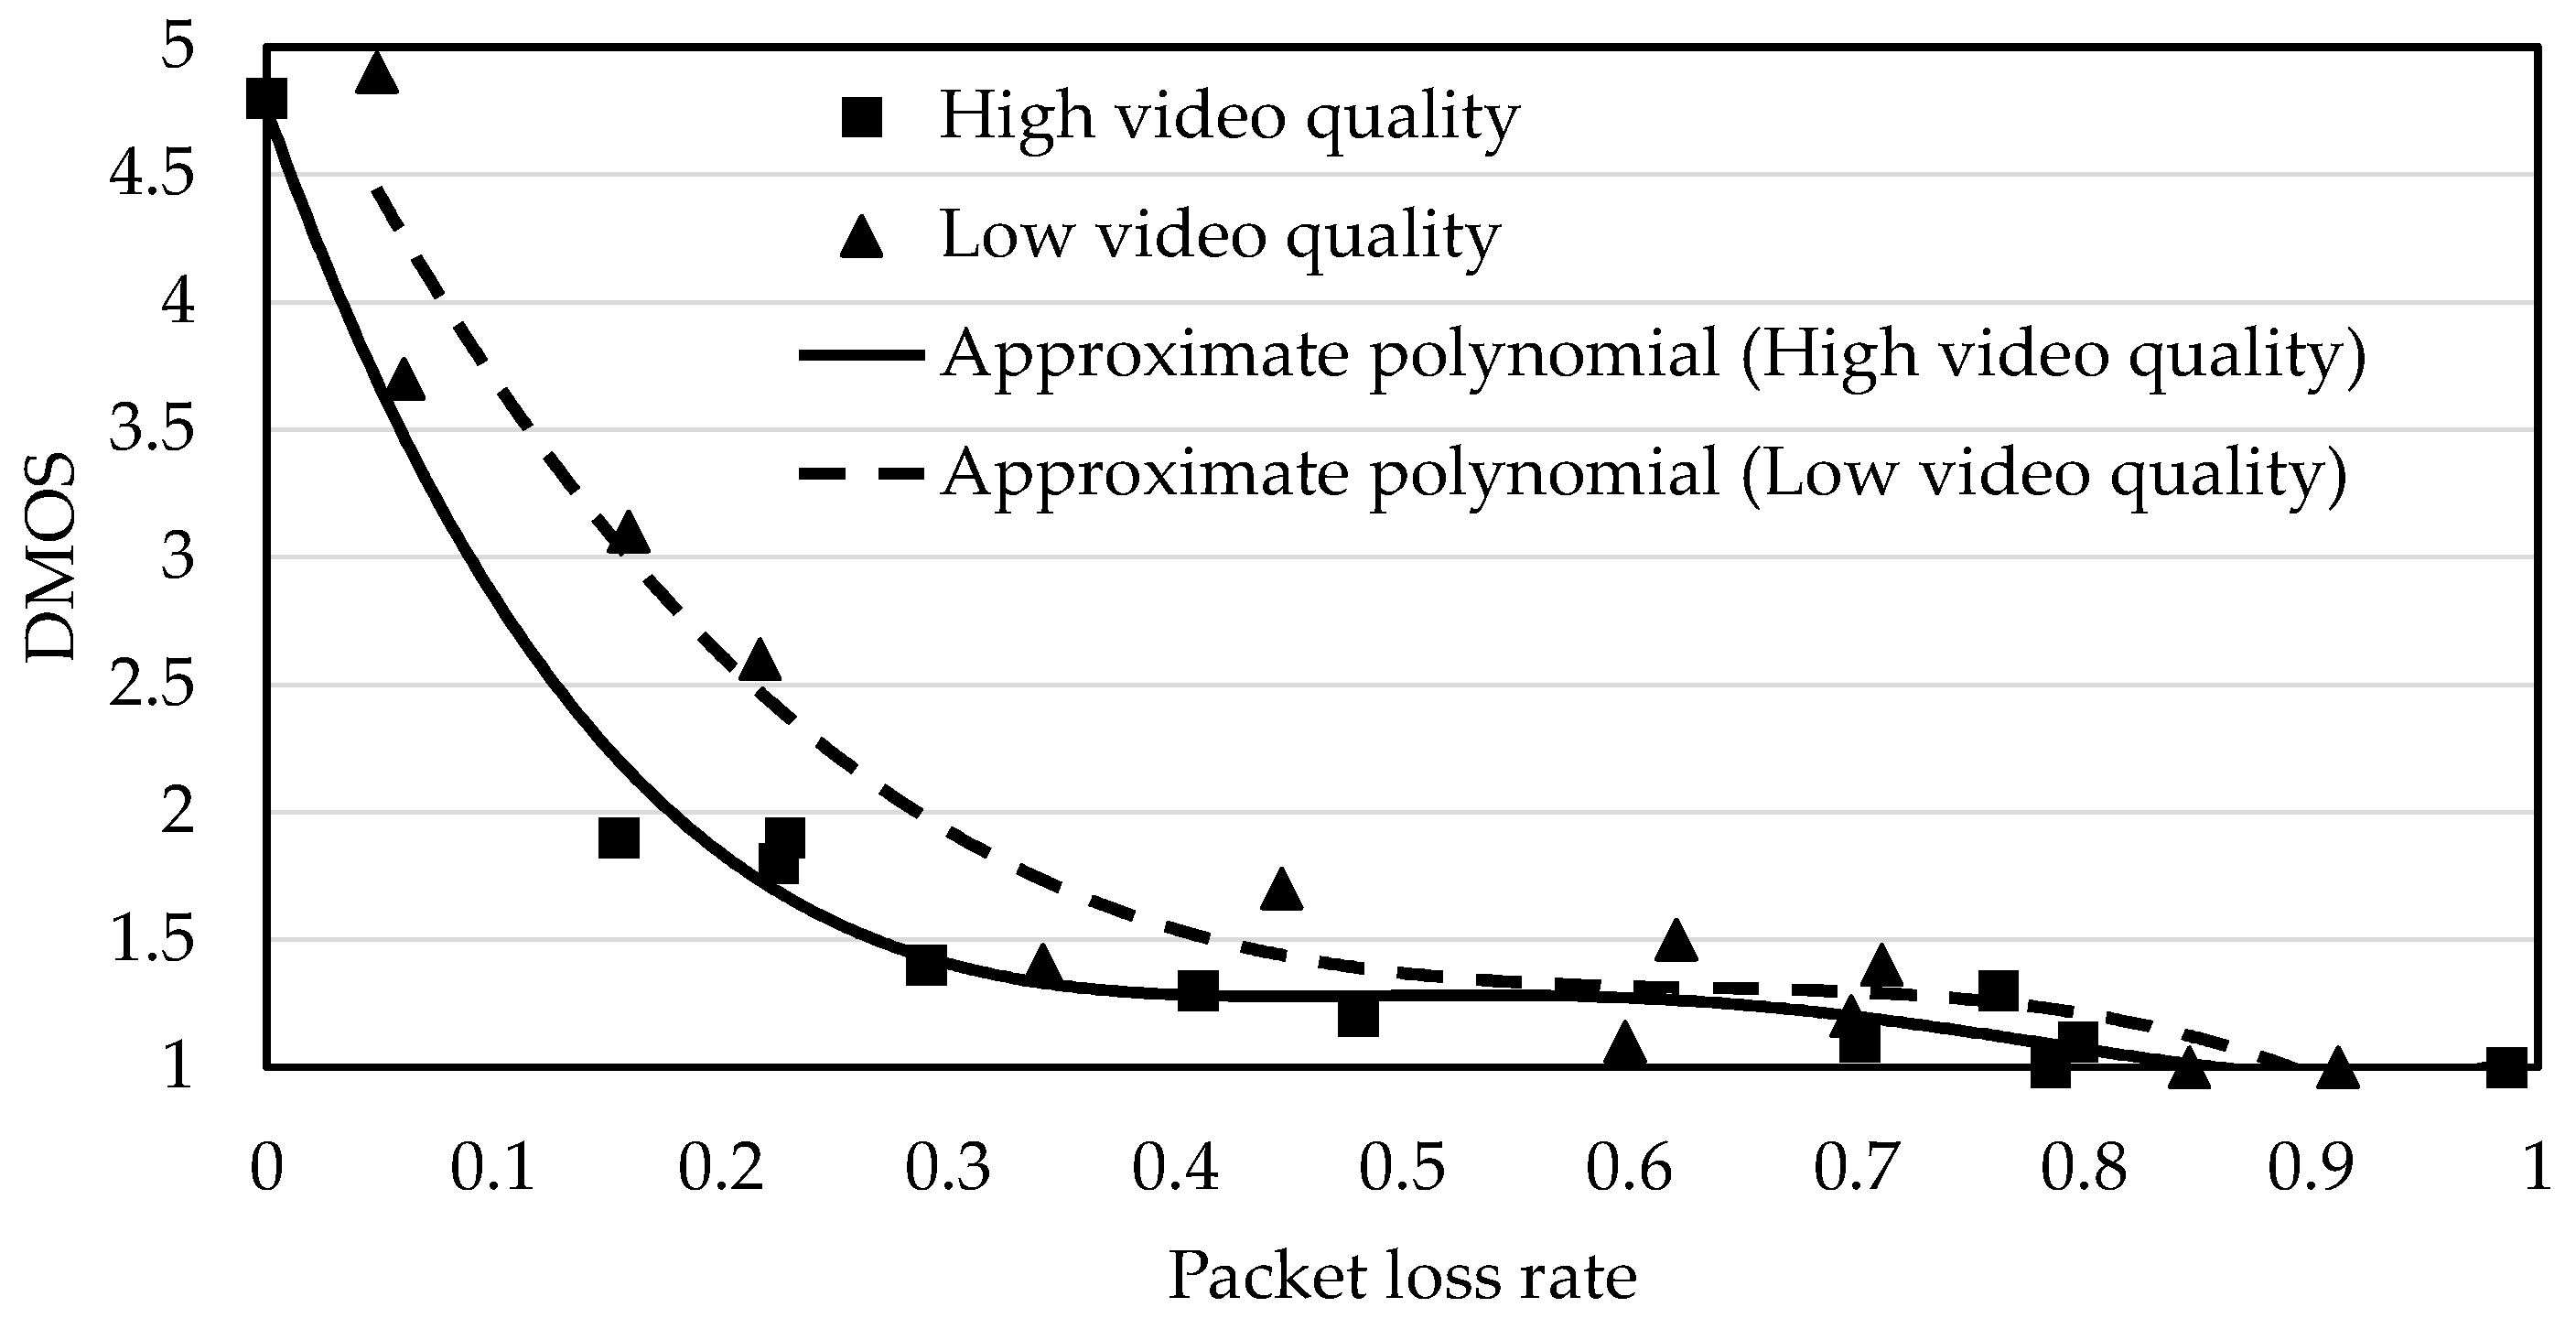
Figure 14 shows the relationship between packet loss rate and DMOS. As the packet loss rate increased, DMOS decreased rapidly up to the point where the packet loss rate was about 0.3. After that, DMOS stayed around 1 even when the packet loss rate increased. Thus, it can be stated that there is a negative correlation between packet loss rate and QoE when the packet loss rate is between 0 and 0.3. Packet loss rate is more loosely correlated with QoE than RA is, as shown in Figure 13, because RA did not reflect the packet loss caused by degradation in the transmission quality in wireless sections. Thus, RA is a metric more sensitive to QoE than is the packet loss rate.
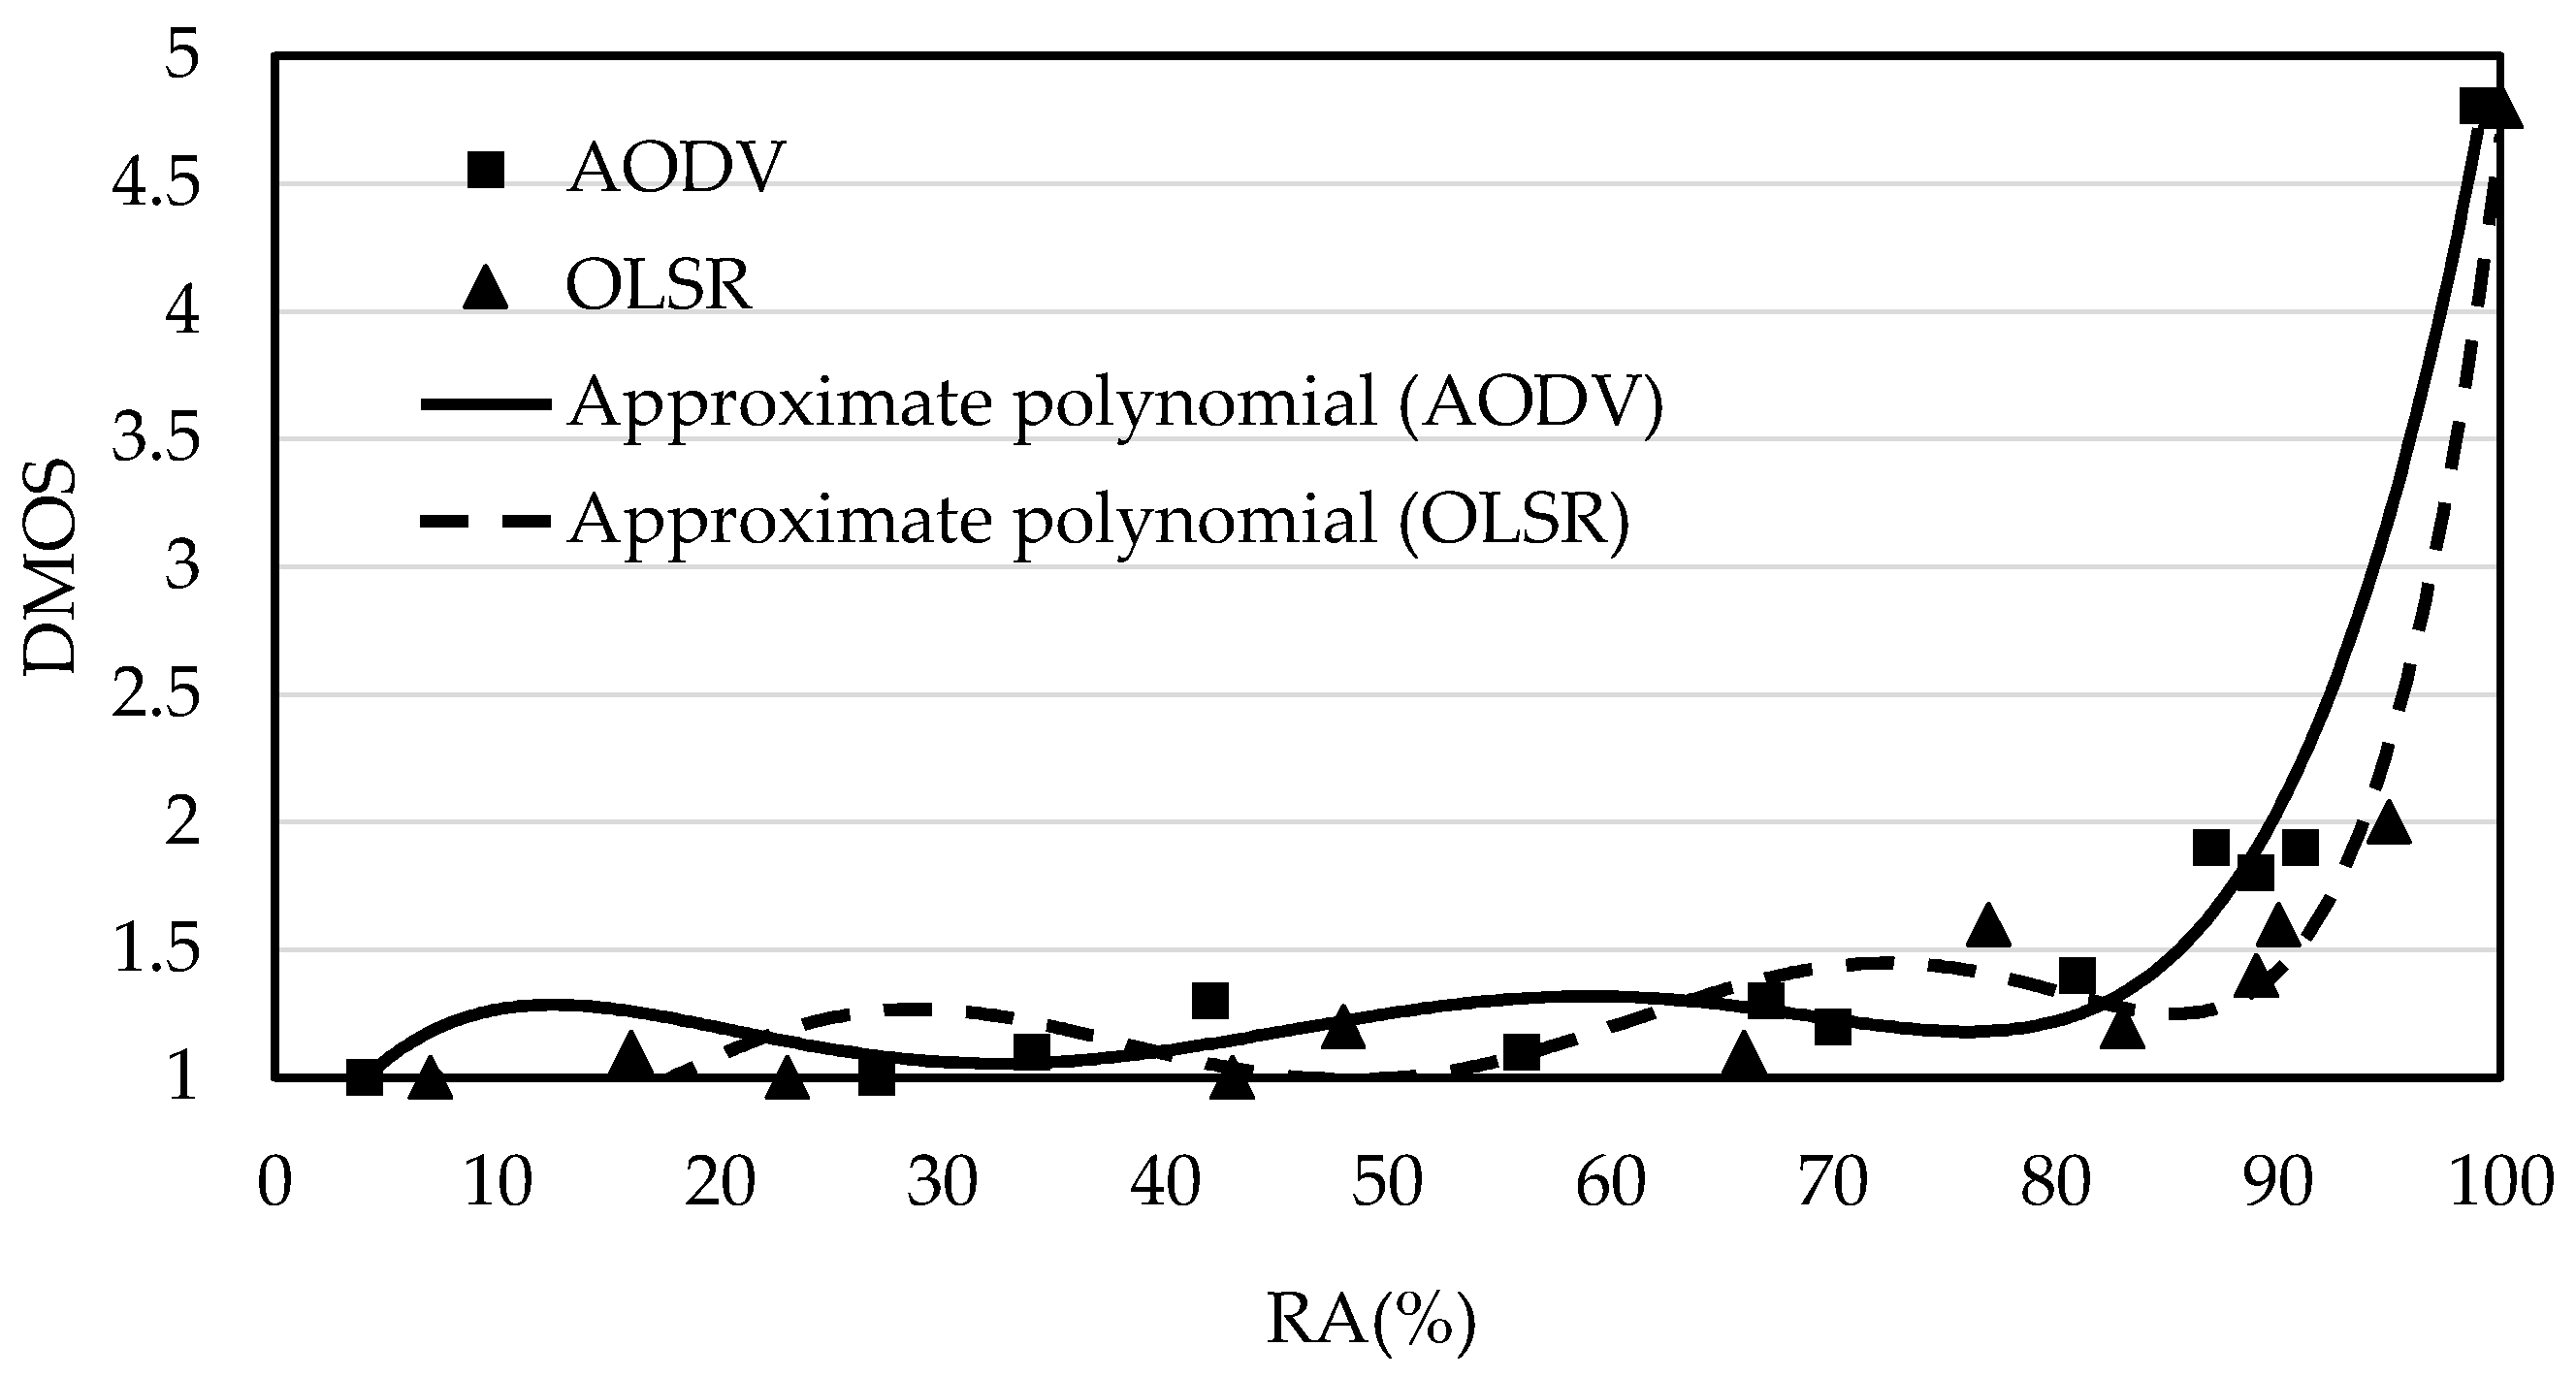
Figure 15 shows the relationship between RA and DMOS for the two different routing protocols. The relationship did not differ greatly between the two routing protocols. Although some disconnections may not be detected in the measurement method described in Section 3.2.2 for OLSR, its effect was negligible and did not produce results that were much different from those for AODV, which is sensitive to disconnections. However, the way streaming videos degraded differed between AODV and OLSR. Since AODV is more sensitive to disconnections caused by link disconnections than OLSR is, instantaneous disconnections can occur more frequently with AODV. As a result, block noise, which arose when a video was replayed or when key frames were lost, tended to occur more frequently. The upside is that a video is less likely to become severely corrupted because any unstable connection state is judged to be a disconnected state. In contrast, OLSR performs route updates using TC messages, which are sent only periodically. Thus, it may frequently fail to detect disconnections and consequently fail to stop the video being played. In such a case, it continues to play a video even though its video quality is degraded by block noise. In the experiment, some videos continued to be played even though their connections were unstable. These videos were degraded by an accumulation of block noise and thus were seriously corrupted sometimes. In summary, with OLSR, playing of a video stopped less frequently but videos were degraded by large block noise. With AODV, distortion from block noise was smaller but videos suffered from the effects of instantaneous interruptions more severely.
6. Conclusions
This paper presented a formal model for route availability (RA) as a metric of route nonuniformity; this is a property unique to MANETs, in which nodes move about in the service area, causing routes to be disconnected and re-established repeatedly. In addition, we proposed a method of measuring RA in a network that operates with either of the two representative routing protocols: AODV and OLSR. We examined how useful RA is as a metric of network QoS and video streaming QoE by building a MANET emulation environment capable of sending streaming videos. We have confirmed that RA has a linear correlation with the two conventional network QoS metrics: packet loss rate and throughput. In addition, by conducting a subjective quality assessment test, we have confirmed that DMOS changes with RA and that these have a positive correlation in a way that DMOS rises sharply when RA is around 80. From the way RA and packet loss rate relate to their respective DMOS values, we have found that RA is more sensitive to changes in video quality.
Looking forward, it is necessary to examine the usefulness of RA for routing protocols other than AODV and OLSR and for multipath routing protocols. It is also necessary to study how RA relates to metrics other than packet loss rate and throughput. It is necessary to extend the emulation time in cases where the steady state values of the mobility model are used as initial values for emulation. In addition, it will be necessary to examine how RA relates to QoS metrics and QoE metrics in cases where the video transmission bit rate changes dynamically or where the frame rate of the key frame is changed. It will be also necessary to study how to use observed RA to control the quality of video communication in a way such that the video coding rate can be changed as necessary.
Author Contributions
Tamotsu Yashima designed the proposed method, developed the software prototype of the evaluation system, collected the evaluation data, and wrote the initial draft of the paper. Kazumasa Takami provided the direction for his research activities and refined the proposed method, the analysis of the evaluation results, and the writing of the paper.
Acknowledgments
We would like to thank our laboratory’s members who worked on the evaluation experiment.
Conflicts of Interest
The authors declare no conflict of interest.
References
- Cisco Visual Networking Index: Global Mobile Data Traffic Forecast Update, 2016–2021 White Paper. Available online: https://www.cisco.com/c/en/us/solutions/collateral/service-provider/visual-networking-index-vni/mobile-white-paper-c11-520862.html (accessed on 2 December 2017).
- Purohit, K.C.; Dimri, S.C.; Jasola, S. Performance evaluation of various MANET routing protocols for adaptability in VANET environment. Int. J. Syst. Assur. Eng. Manag. 2017, 8 (Suppl. 2), 690–702. [Google Scholar] [CrossRef]
- Gupta, U.S.; Soni, A.; Pahare, T. Performance Evaluation of Routing Protocols on MANET. Int. J. Eng. Trends Technol. (IJETT) 2016, 31, 153–158. [Google Scholar] [CrossRef]
- Arora, S.K.; Monga, H. Performance evaluation of MANET on the basis of Knowledge Base Algorithm. Opt. Int. J. Light Electron Opt. 2016, 127, 7283–7291. [Google Scholar] [CrossRef]
- Singh, G.; Kaur, K. Performance Evaluation of MANET (Mobile Ad-hoc Network) Metrics: A Comparative Analysis; LAP LAMBERT Academic Publishing: Saarbrucken, Germany, 2012; ISBN 13: 978-3848449194. [Google Scholar]
- Kumar, A.; Singla, A.K. Performance Evaluation of MANET Routing Protocols on The Basis Of TCP Traffic Pattern. Int. J. Inform. Technol. Conv. Ser. (IJITCS) 2011, 1, 41–48. [Google Scholar] [CrossRef]
- Gupta, P.; Gupta, S. Performance Evaluation of Mobility Models on MANET Routing Protocols. In Proceedings of the Third International Conference on Advanced Computing and Communication Technologies (ACCT), Rohtak, India, 6–7 April 2013; pp. 248–253. [Google Scholar] [CrossRef]
- Asif, H.M.; Sheltami, T.R.; Shakshuki, E.E. Power consumption optimization and delay minimization in MANET. In Proceedings of the 6th International Conference on Advances in Mobile Computing and Multimedia, Linz, Austria, 24–26 November 2008. [Google Scholar]
- Lal, C.; Laxmi, V.; Gaur, M.S.; Conti, M. Enhancing QoE for video streaming in MANETs via multi-constraint routing. Wirel. Netw. 2018, 24, 235–256. [Google Scholar] [CrossRef]
- Er-rouidi, M.; Moudni, H.; Faouzi, H.; Mouncif, H.; Merbouha, A. A Fuzzy-Based Routing Strategy to Improve Route Stability in MANET Based on AODV. In Proceedings of the International Conference on Networked Systems, Marrakech, Morocco, 17–19 May 2017; pp. 40–48. [Google Scholar] [CrossRef]
- Todoroki, H.; Takami, K. MANETs Routing Scheme Considering Remaining Battery Power to Achieve the User Requested Call Duration Time in Multimedia Communication. In Proceedings of the 2nd International Conference on Mobile and Wireless Technology (ICMWT2015), Bangkok, Thailand, 22–24 June 2015. [Google Scholar] [CrossRef]
- Quang, P.T.A.; Piamrat, K.; Singh, K.D.; Viho, C. Video Streaming Over Ad Hoc Networks: A QoE-Based Optimal Routing Solution. IEEE Trans. Veh. Technol. 2017, 66, 1533–1546. [Google Scholar] [CrossRef]
- Goudarzi, P.; Hosseinpour, M. QoE enhancement for video transmission over MANETs using distortion minimization. Sci. Iran. 2012, 19, 696–706. [Google Scholar] [CrossRef]
- Yashima, T.; Takami, K. Method of determining the relationship between audio/video QoE and route availability in a MANET. In Proceedings of the IEEE Region 10 Conference (TENCON), Singapore, 22–25 November 2016; pp. 1344–1347. [Google Scholar] [CrossRef]
- Networking:netem. Available online: https://wiki.linuxfoundation.org/networking/netem (accessed on 10 April 2018).
- RFC 3651—Ad hoc On-Demand Distance Vector (AODV) Routing. Available online: https://www.ietf.org/rfc/rfc3561.txt (accessed on 26 February 2018).
- RFC 7181—The Optimized Link State Routing Protocol Version 2. Available online: https://tools.ietf.org/html/rfc7181 (accessed on 26 February 2018).
- Scenargie. Available online: https://www.spacetime-eng.com/ (accessed on 28 December 2017).
- Linux Bridge and Virtual Networking. Available online: http://www.innervoice.in/blogs/2013/12/02/linux-bridge-virtual-networking/ (accessed on 15 April 2018).
- Wireshark. Available online: https://www.wireshark.org/ (accessed on 20 February 2018).
- Big Buck Bunny. Available online: https://peach.blender.org/ (accessed on 10 January 2018).
- Okamoto, J.; Hayashi, T. Latest Trends in Image Media Quality Assessment Technologies. IEICE Fundam. Rev. 2012, 6, 276–284. [Google Scholar] [CrossRef]
Figure 1.
Position of the present research. MANET: mobile ad hoc network; QoE: quality of experience; QoS: quality of service.
Figure 1.
Position of the present research. MANET: mobile ad hoc network; QoE: quality of experience; QoS: quality of service.

Figure 2.
Example of route state transitions in a MANET for video streaming.

Figure 3.
Changes in connected and disconnected states over time.

Figure 4.
Sequence of measuring route feature values for Ad hoc On-Demand Distance Vector (AODV). (a) Measurement triggers with Route REPlies (RREPs) and Route ERRors (RERRs); (b) Measurement triggers with HELLOs.
Figure 4.
Sequence of measuring route feature values for Ad hoc On-Demand Distance Vector (AODV). (a) Measurement triggers with Route REPlies (RREPs) and Route ERRors (RERRs); (b) Measurement triggers with HELLOs.

Figure 5.
Sequence of measuring route feature values for Optimized Link State Routing (OLSR). (a) Measurement triggers with topology control (TC) messages; (b) Measurement triggers with HELLOs for a case involving one relay node.
Figure 5.
Sequence of measuring route feature values for Optimized Link State Routing (OLSR). (a) Measurement triggers with topology control (TC) messages; (b) Measurement triggers with HELLOs for a case involving one relay node.

Figure 6.
Flowchart for calculating route availability (RA).

Figure 7.
Configuration of the evaluation environment constructed to emulate transmission of video streams over a MANET.
Figure 7.
Configuration of the evaluation environment constructed to emulate transmission of video streams over a MANET.

Figure 8.
Network configuration of the emulator. TAP: tap device.

Figure 9.
Example of communication pattern consisting of connections and disconnections and the number of hops (emulation time: 90 s; number of relay nodes: 5; “number of hops = −1” means that the route is disconnected). (a) Pattern for a case where the emulation time is from 0 to 45 s; (b) Pattern for a case where the emulation time is from 45 s to 90 s.

Figure 10.
Relationship between RA and packet loss rate (when the number of hops was varied).

Figure 11.
Relationship between RA and packet loss rate (when the routing protocol was varied).

Figure 12.
Relationship between RA and throughput (when video quality was varied).

Figure 13.
Relationship between RA and degradation mean opinion score (DMOS) (when video quality was varied).
Figure 13.
Relationship between RA and degradation mean opinion score (DMOS) (when video quality was varied).

Figure 14.
Relationship between packet loss rate and DMOS (when video quality was varied).

Figure 15.
Relationship between RA and DMOS (for two different routing protocols).


Table 1.
Metrics used to assess routing protocols in mobile ad hoc networks (MANETs) in different references.
Table 1.
Metrics used to assess routing protocols in mobile ad hoc networks (MANETs) in different references.
| References | [2] | [3] | [4] | [5] | [6] | [7] | [8] | [9] | [10] | [11] | [12] | [13] | |
|---|---|---|---|---|---|---|---|---|---|---|---|---|---|
| Metrics | |||||||||||||
| Packet loss rate | ✔ | ✔ | |||||||||||
| Throughput | ✔ | ✔ | ✔ | ✔ | |||||||||
| End-to-end delay | ✔ | ✔ | ✔ | ✔ | ✔ | ||||||||
| Routing overhead | ✔ | ✔ | ✔ | ||||||||||
| Path length | ✔ | ||||||||||||
| Packet delivery ratio (PDR) | ✔ | ✔ | ✔ | ✔ | ✔ | ||||||||
| Jitter | ✔ | ||||||||||||
| Path lifetime | ✔ | ✔ | ✔ | ||||||||||
| Mean opinion score (MOS) | ✔ | ✔ | ✔ | ||||||||||
Table 2.
Determination of connection/disconnection for AODV (Ad hoc On-Demand Distance Vector).
| Previous Event | Latest Event | Processing |
|---|---|---|
| Addition to the entry | Addition to the entry | Treated as an exception |
| Addition to the entry | Deletion from the entry | Connection |
| Deletion from the entry | Addition to the entry | Disconnection |
| Deletion from the entry | Deletion from the entry | Treated as an exception |
Table 3.
Determination of connection/disconnection for OLSR (Optimized Link State Routing).
| Previous Event | Latest Event | Processing |
|---|---|---|
| Addition to the entry | Addition to the entry | Considered that the route has been changed |
| Addition to the entry | Deletion from the entry | Connection |
| Deletion from the entry | Addition to the entry | Disconnection |
| Deletion from the entry | Deletion from the entry | Treated as an exception |
Table 4.
Emulation conditions. AVC: Advanced Video Coding; AAC: Advanced Audio Coding.
| Item | Value |
|---|---|
| Emulation time | 90, 180, 270 s |
| Field size | 1 km × 1 km |
| Number of nodes | 3, 4, 5, 6, and 7 |
| Wireless communication standard | IEEE802.11g |
| Reception threshold (propagation range) | −82 dBm (about 500 m) |
| Mobility model | Random waypoint |
| Moving speed | 0 m/s~2 m/s |
| Routing protocol | AODV |
| Video format | H.264/AVC |
| Audio format | AAC |
Table 5.
How the route feature values and RA changed when the emulation time and the number of nodes were changed.
Table 5.
How the route feature values and RA changed when the emulation time and the number of nodes were changed.
| Emulation Time (s) | Number of Nodes | Total Connected Time | Total Disconnected Time | RA (%) |
|---|---|---|---|---|
| 90 | 3 | 69 | 21 | 77 |
| 4 | 67 | 22 | 76 | |
| 5 | 74 | 15 | 83 | |
| 6 | 74 | 16 | 82 | |
| 7 | 69 | 20 | 78 | |
| 180 | 3 | 128 | 51 | 71 |
| 4 | 130 | 49 | 73 | |
| 5 | 131 | 48 | 73 | |
| 6 | 142 | 37 | 79 | |
| 7 | 146 | 33 | 82 | |
| 270 | 3 | 191 | 78 | 71 |
| 4 | 185 | 84 | 69 | |
| 5 | 202 | 67 | 75 | |
| 6 | 199 | 70 | 74 | |
| 7 | 196 | 72 | 73 |
Table 6.
Emulation conditions.
| Item | Value |
|---|---|
| Emulation time | 180 s |
| Field size | Maximum 2 km × 2 km |
| Number of nodes | 4 to 22 |
| Assumed RA | 10, 20, 30, 40, 50, 60, 70, 80, 85, 90, 95, 100 |
| Average number of hops | 2 hops or more; 2 hops or fewer |
| Video quality | High quality, low quality |
| Transport layer | UDP (User Datagram Protocol) |
| Number of scenarios | 92 |
| Wireless communication standard | IEEE 802.11g |
| Reception threshold (propagation range) | −82 dBm (about 500 m) |
| Transmission rate | About 15 Mbps |
| Mobility model | Random waypoint |
| Moving speed | 0.1 to 2.0 m/s |
| Area within which nodes can move | 500 m × 500 m, 600 m × 600 m, 750 m × 750 m, 1 km × 1 km |
| Routing protocol | AODV, OLSRv2 |
Table 7.
Video codec conditions.
| Item | Value for High Quality | Value for Low Quality |
|---|---|---|
| Video format | H.264/AVC | |
| Audio format | AAC | |
| Playing time | 180 s | 596 s |
| Profile | [email protected] | |
| Frame reference distance (Ref Frame) | 1 frame | |
| Frame rate | 24 fps | |
| Total bit rate | 3120 kbps | 581 kbps |
| Resolution | 1280 × 720 | 416 × 240 |
© 2018 by the authors. Licensee MDPI, Basel, Switzerland. This article is an open access article distributed under the terms and conditions of the Creative Commons Attribution (CC BY) license (http://creativecommons.org/licenses/by/4.0/).
Share and Cite
MDPI and ACS Style
Yashima, T.; Takami, K. Route Availability as a Communication Quality Metric of a Mobile Ad Hoc Network. Future Internet 2018, 10, 41. https://doi.org/10.3390/fi10050041
AMA Style
Yashima T, Takami K. Route Availability as a Communication Quality Metric of a Mobile Ad Hoc Network. Future Internet. 2018; 10(5):41. https://doi.org/10.3390/fi10050041
Chicago/Turabian StyleYashima, Tamotsu, and Kazumasa Takami. 2018. "Route Availability as a Communication Quality Metric of a Mobile Ad Hoc Network" Future Internet 10, no. 5: 41. https://doi.org/10.3390/fi10050041
Note that from the first issue of 2016, this journal uses article numbers instead of page numbers. See further details here.