Towards Prediction of Immersive Virtual Reality Image Quality of Experience and Quality of Service


Department of Computer Science, Central Michigan University, Mount Pleasant, MI 48859, USA
*
Author to whom correspondence should be addressed.
Future Internet 2018, 10(7), 63; https://doi.org/10.3390/fi10070063
Submission received: 21 May 2018
/
Revised: 28 June 2018
/
Accepted: 4 July 2018
/
Published: 7 July 2018
Abstract
:In this article, we evaluate the Quality of Service (QoS) through media impairment levels and device operators’ subjective Quality of Experience (QoE). The human-centered QoE determination commonly requires human subject experimentation, which we combine with Electroencephalography (EEG) measurements to move towards automatized and generalized possibilities of determining the QoE. We evaluate the prediction performance for spherical/immersive images displayed with a mobile device VR viewer (Spherical Virtual Reality (SVR)) with the help of only four-position EEG data gathered at the forehead, which correlates well with practical applicability. We find that QoS levels can be predicted more reliably (directly with or based on profiles with ) than the QoE, which exhibits significant error levels. Additional comparison with previous approaches for the Spherical Augmented Reality (SAR) QoE indicates better predictability in AR scenarios over VR.
1. Introduction and Related Works
Virtual Reality (VR) is moving swiftly into main content consumption scenarios. With affordable device solutions, the optimized delivery of immersive multimedia content becomes an important aspect for network and service providers alike. Recent years have seen a vast emergence of wearable display devices, such as for Virtual Reality (VR) and Augmented Reality (AR) services. This development considering the hardware has been flanked by increased numbers of offerings for software and multimedia content that target these new device types. In turn, media consumption in governmental, industrial and consumer scenarios is highly likely to increasingly utilize these types of head-mounted devices. Initial interest is emerging for directly comparing the two approaches in immersive contexts [1], which we consider with our prior work from [2] in this article, as well. With the head-worn nature of VR equipment, an opportunity exists to integrate the determination of EEG data into a closed feedback loop for QoE determinations (and adjustments) in future device iterations. We consider this trajectory by employing only a small number of dry electrodes with commercially available off-the-shelf equipment (in contrast to most prior research utilizing specialized EEG equipment in clinical settings).
Commonly, a trade-off exists between the amount of compressed media data and the possible quality that can be attained for presentation. Readily, objectively measurable metrics can be utilized to derive network and service evaluations, commonly referred to as Quality of Service (QoS). As most of these wearable devices might rely on secondary Internet connectivity over wireless links, such as cellular connected mobile phones forwarding data [3], the delivery of networked content represents a major challenge. Recently, the focus has been changing towards low-latency first [4]. QoS metrics, such as bandwidth, latency or buffer starvation, however, typically do not accumulate directly with respect to the experience of the users of multimedia services. From a resource utilization point of view, network and service providers have an interest in optimizing the quality-data relationship for their offerings. Providers, however, also have a strong motivation to determine the actual experience of their users, as that experience normally correlates with the willingness to pay for a service offering. Subsequently, recent years have seen the emergence and shift to this user-centric Quality of Experience (QoE) [5].
The replacement of the objective QoS results in new challenges resulting from the subjective nature of the QoE, which typically requires human subject experimentations. The experiments commonly require subjects to rate their individual experience with a service on a Likert-type scale, e.g., employing a rating from worst (one) to best (five). The derivation of generalizable QoE values in the form of a ground truth is subsequently performed by repeating this experiment with a sufficiently large number of subjects. The individual ratings are subsequently aggregated and expressed in terms of Mean Opinion Scores (MOS); see, e.g., [6,7]. The allure of the experience-based service rating in the real world and close to real-time scenarios, on the other hand, proves challenging. Human subject experimentation, however, is not easily undertaken and commonly requires approved procedures and more experimental effort than computer-driven experiments or simulations [8]. Similarly, it is not always possible to directly determine subject-specific ratings though interventions, i.e., having an active human-in-the-loop approach.
The challenge of determining the QoE has subsequently led to research that results in indirectly determining the QoE from QoS parameters; see, e.g., [9,10]. For still images, objective image quality metrics that approximate the QoE through various features have been developed for some time [11]. A particular challenge in objectively determined quality metrics is the requirement to have the original unimpaired medium available for comparisons, which is not practical for real-time service evaluation and adjustments at the network edge. Image quality assessments that are non-referential have attracted recent research efforts, as well; see, e.g., [12]. In this article, we rely on the BRISQUEimage impairment metric [13] as the QoS indicator, which we successfully employed in past research efforts [2]. A similar dataset that presents immersive VR videos is described in [14]. As described in [15], significant challenges for active experimentation for the QoE determination in VR scenarios remain.
A potential path to eliminate the QoE active human-in-the-loop requirement without indirect approximation via QoS metrics is enabled through developments in the domain of human-computer interaction. The focus of this article is on enabling a passive human-in-the-loop for immersive multimedia presentation scenarios. Multimedia presentation, however, is only one particular example of these types of feedback loops. Current developments also include haptic feedback evaluations, which represent additional challenges due to the different types of human sensory system stimuli required [16,17].
The utilization of physiological signals has attracted research interests, and common examples include Electroencephalography (EEG), skin conductivity or heart rate [18]. The direct utilization of EEG measurements has attracted research interests in the QoE domain [19] and has successfully been evaluated in traditional content consumption settings; see, e.g., [20,21,22]. Two common approaches to the utilization of the EEG data are given by (i) a direct employment of EEG measurements at 300–500 ms after a stimulus (e.g., media display or quality changes) and (ii) in the context of steady-state evoked potentials [23]. We follow these two approaches by employing values directly, as well as homogenized via z-scores across the experimental sessions.
Contribution and Article Structure
This article describes an approach to the determination of the subject-specific Quality of Experience (QoE) for spherical (immersive) still images in Virtual Reality (VR) presentations. Our approach follows practical real-world scenario considerations within the confines of current commercially available off-the-shelf equipment in a practical, non-clinical setting. The main contribution we describe in this article is the prediction approach to the QoE of individual human subjects in virtual reality settings employing EEG measurements.
The remainder of this paper is structured as follows. In the succeeding section, we review our general approach and methodology before presenting the utilization of the data in Section 3 and describe the obtained results in Section 4 before we discuss the implications in Section 5 and conclude in Section 6.
2. Methodology
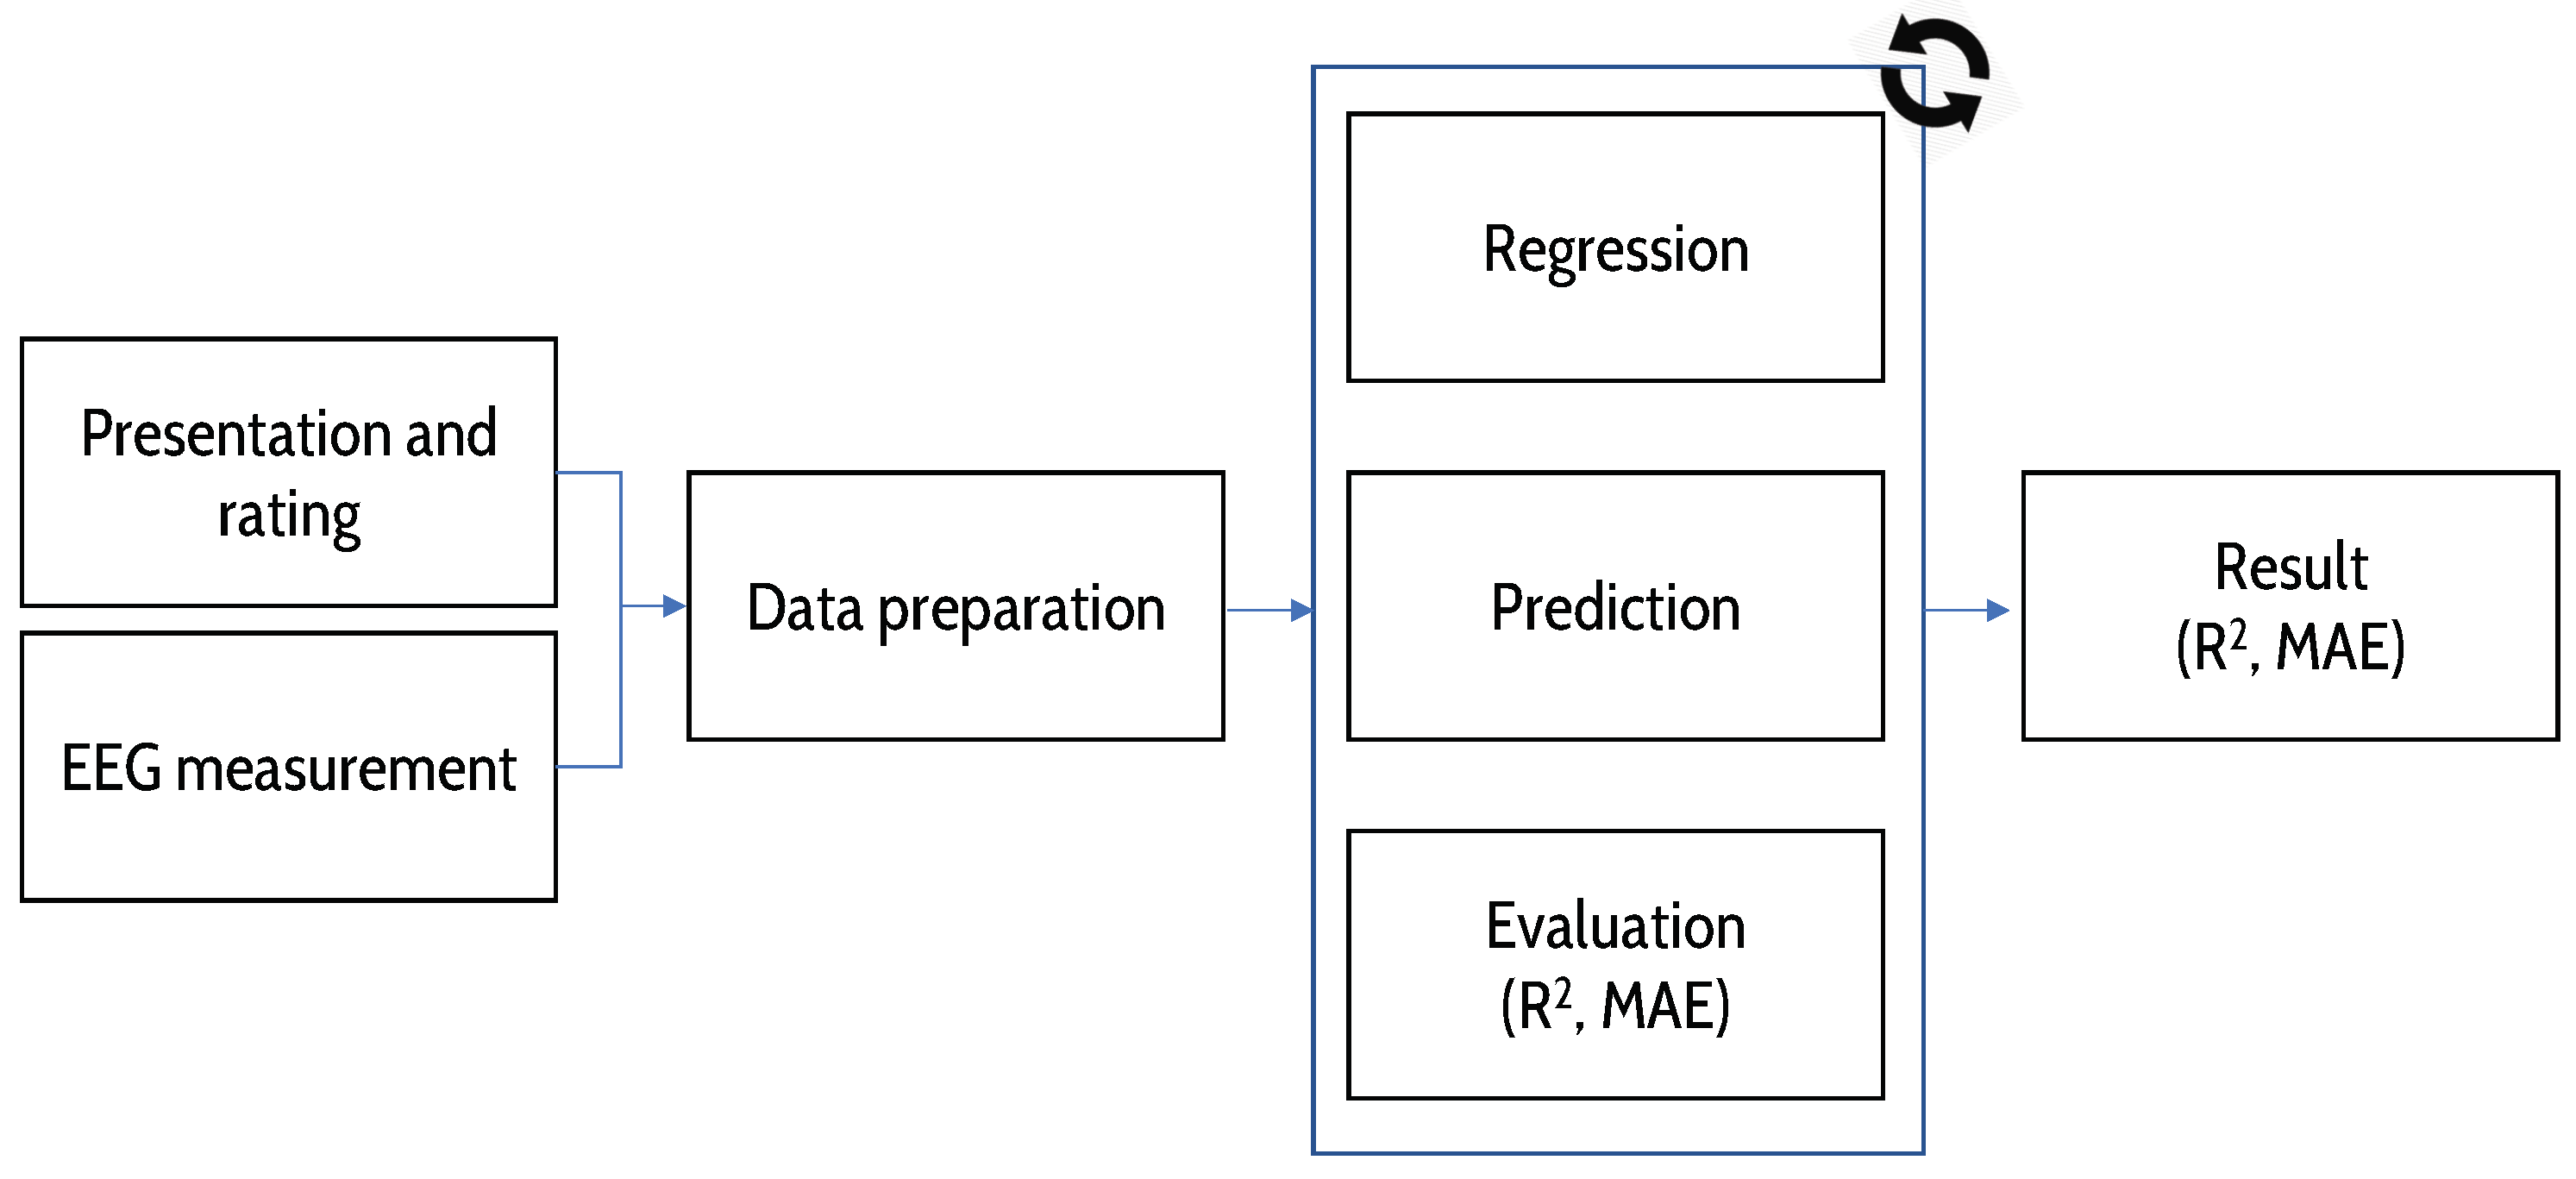
This section addresses the general approach to the data generation processes before describing the performance metrics employed in greater detail. Overall, our approach follows that described in prior works, specifically the Visual Interface Evaluation for Wearables (VIEW) datasets [2,24,25,26]. Our methodology, thus, follows the process illustrated in Figure 1 [2]. A major difference from the prior works is that here, we are not focusing on the generation of reusable datasets, but directly on the evaluation of the gathered data from the new human subject experiments.
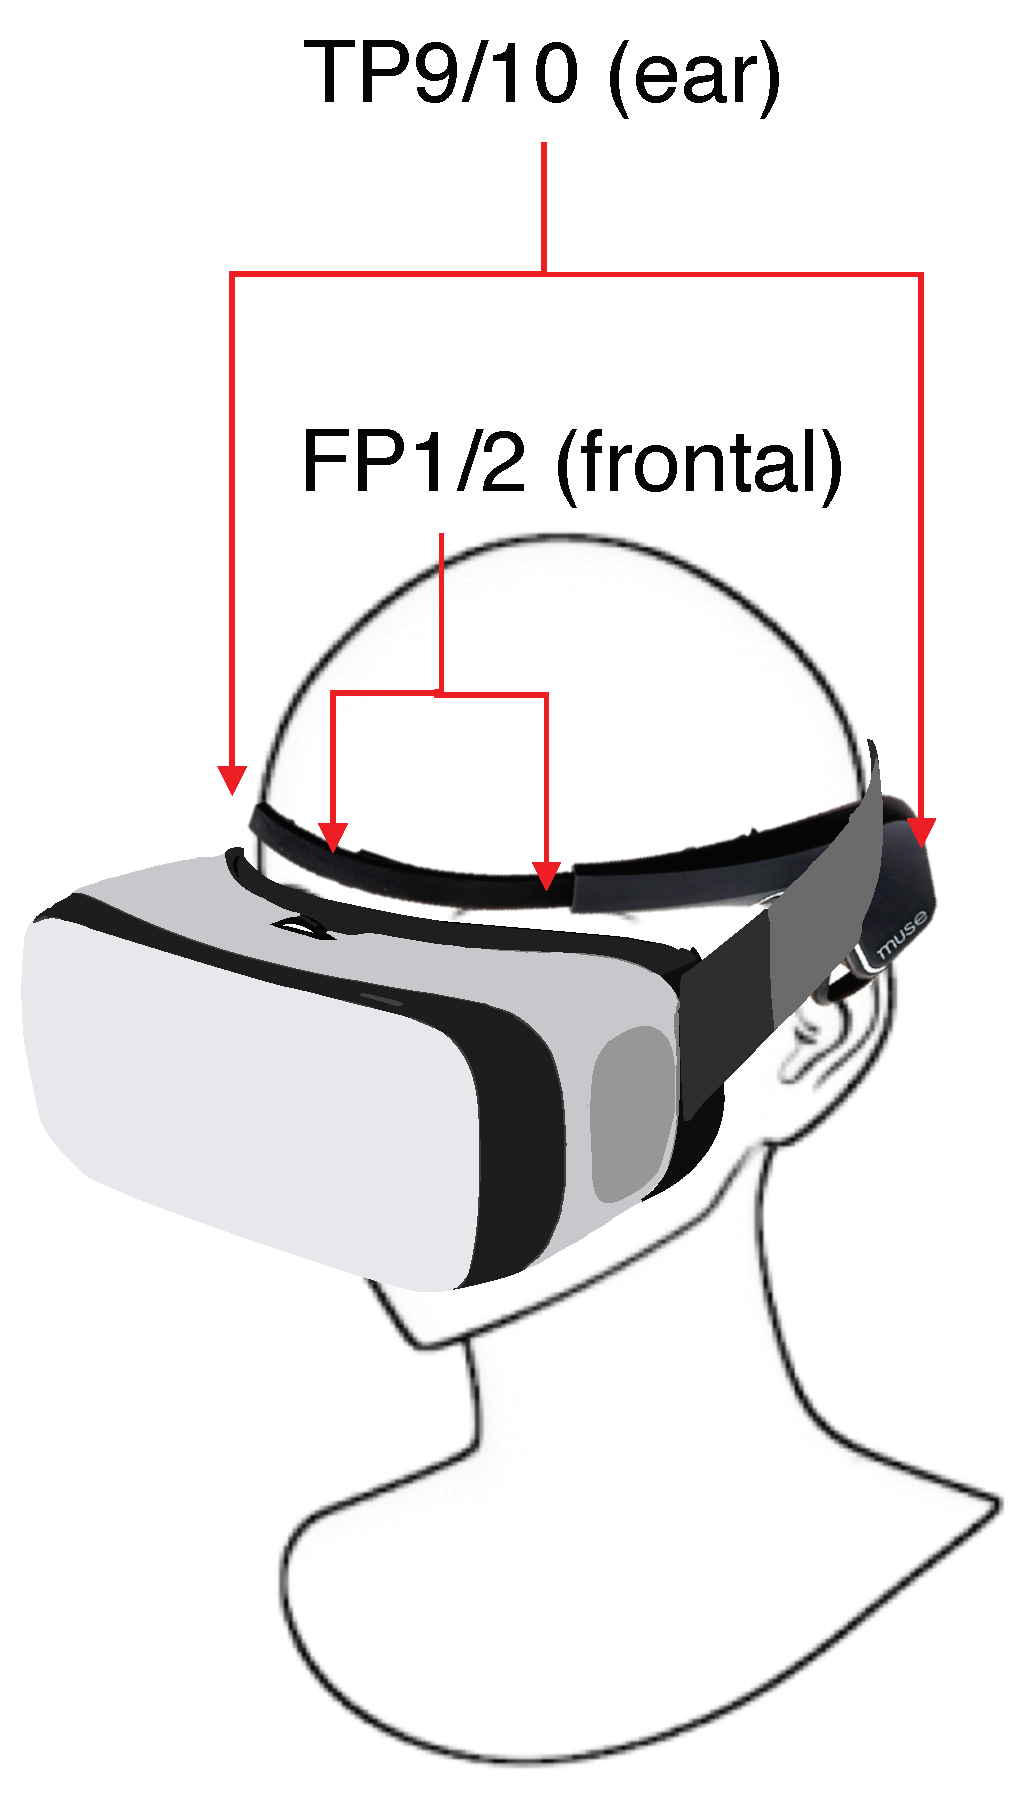
The participating human subjects were provided with an overview of the experimental flow and gave their informed consent for inclusion before they participated in the experiments. We note that the subjects employed in this study were recruited separately from prior works, but an overlap might exist (but is not discernible due to anonymity of the data gathering process). The study was conducted during the Spring semester of 2018 in accordance with the Declaration of Helsinki, and the protocol was approved by the Institutional Review Board of Central Michigan University (Central Michigan University Institutional Review Board #568993). The device employed for rendering the content was an ASUS Zenphone AR smartphone, which features a 5.7-inch (2560 by 1440 pixels) Super AMOLED (Active-Matrix Organic Light-Emitting Diode) display capable of over 100% of the NTSC (National Television Standards Committee) color gamut. Participants employed a virtual reality smartphone adapter together with the phone to display the immersive content similar to current content consumption scenarios. A custom web-technology-based viewer application was executed on the phone and controlled remotely from a dedicated laptop. The overall group of human subjects that participated consisted of 4 females and 11 males with an overall average age of 23.4 years (SD = 2.97 years). The subjects were commonly recruited from the general student population on Central Michigan University’s main campus and, subsequently, was comprised of non-experts. Eight of the subjects wore vision-correcting devices, whereby seven subjects chose to wear these devices during their respective experimental session. In addition, the participants wore the commercial-grade MUSE EEG headband (we note that detailed developer documentation for the headband is available for interested readers at http://www.choosemuse.com/developer/). We provide a schematic overview of the on-person setup in Figure 2.
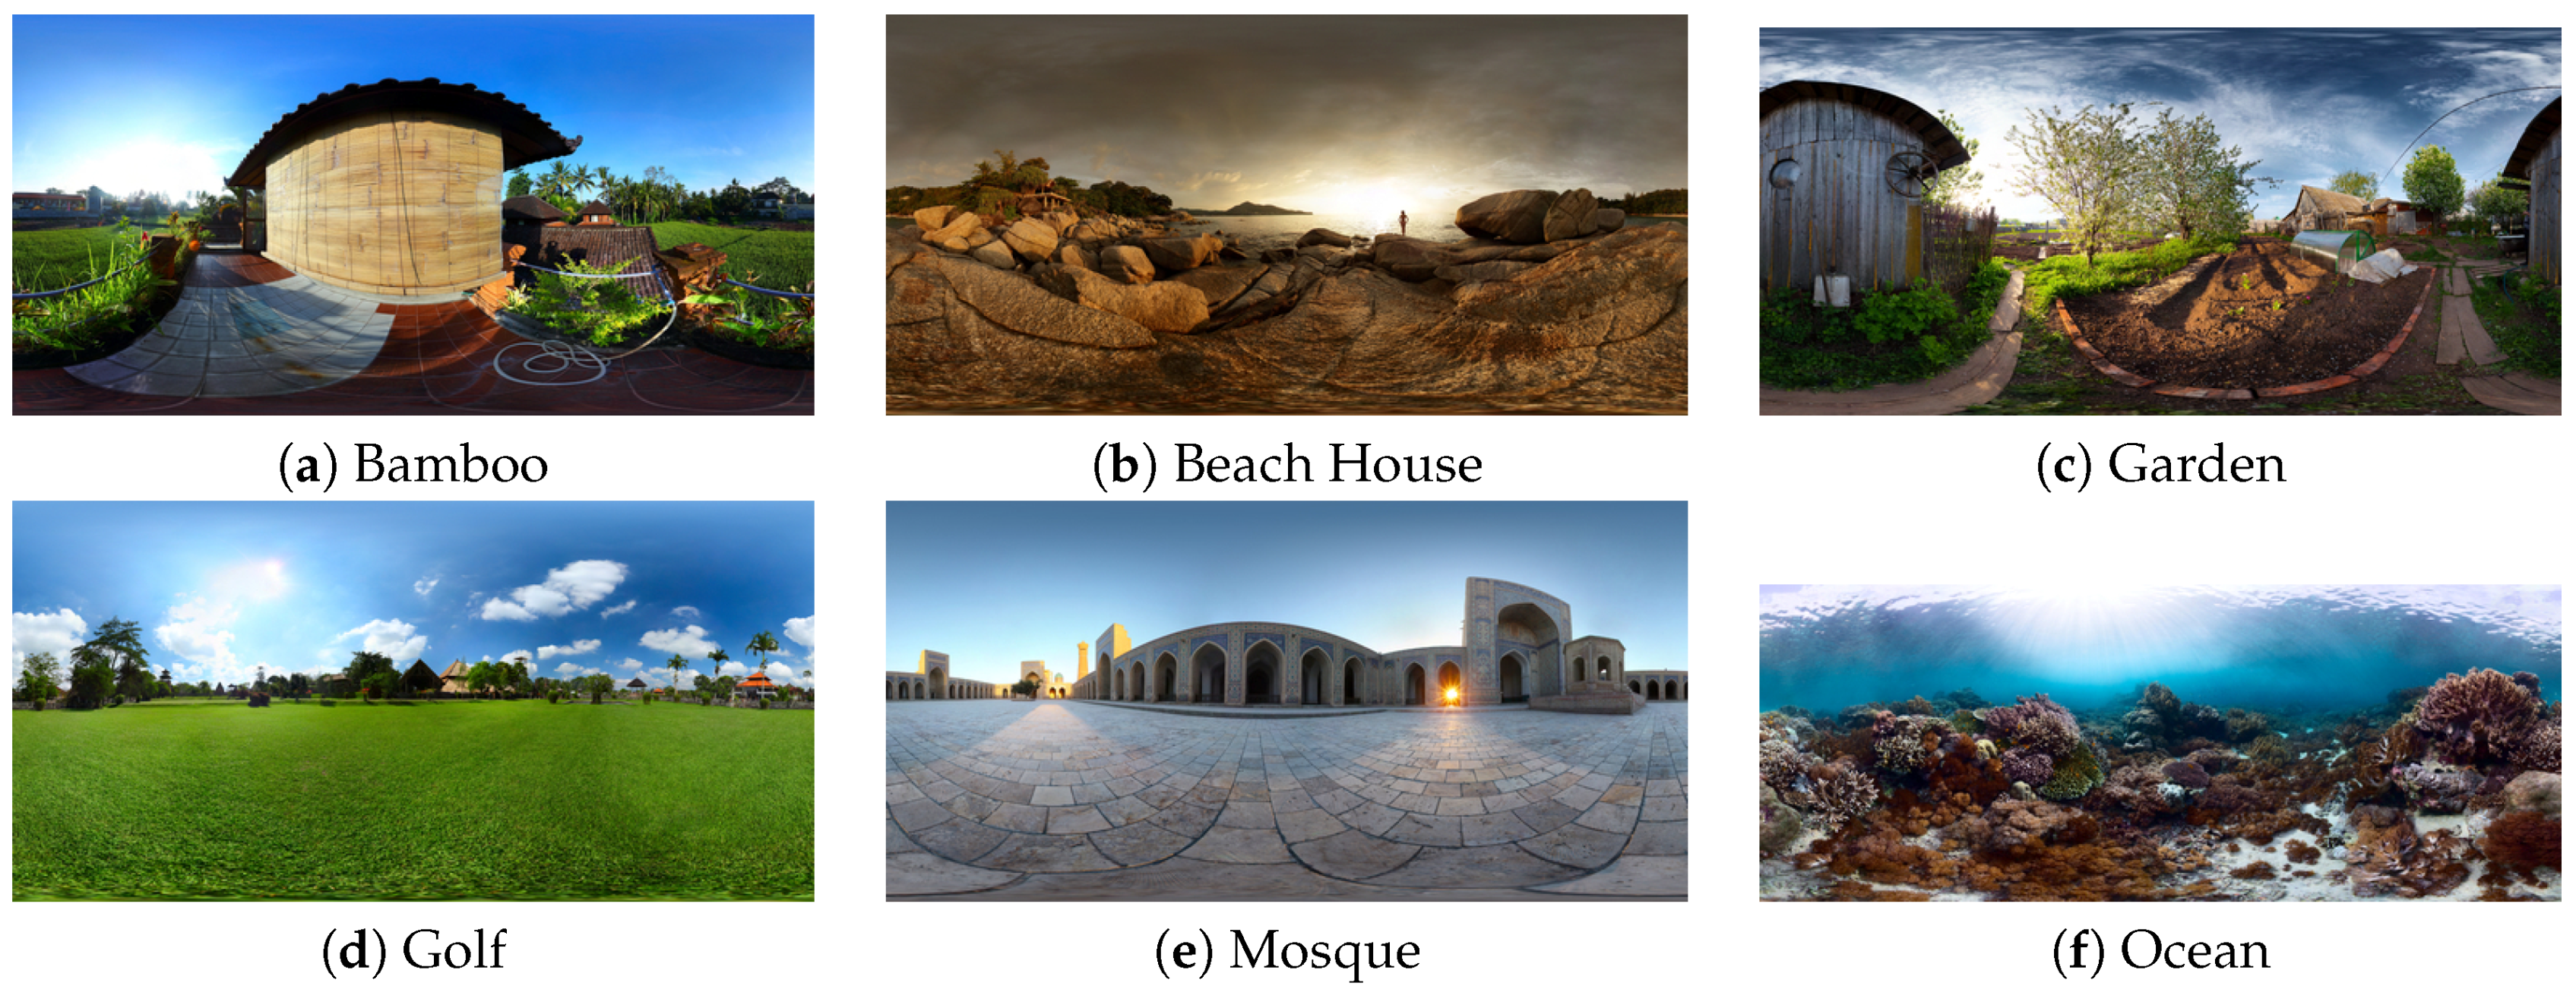
The participating users u viewed the immersive image content i at different impairment levels l for a time ranging from –. The presentation was followed by an unrestricted quality rating period, where subjects were asked to rate the previously-observed media quality on a 5-point Likert scale. After a short black screen period, the next randomly-chosen media and impairment combination was presented to the subjects. Overall, our approach follows the ACR-HR (Absolute Category Rating with Hidden Reference) approach according to ITU-T P.910 [27], i.e., we include the original image in the evaluation as an additional reference. The result is the subject’s quality of experience for the Spherical (immersive) Virtual Reality content display (SVR), which we denote as . The images selected for the spherical image display were derived by applying different levels of JPEG compression to the source images, mimicking the impairments of the regular images. We applied JPEG compression levels of 100% for the unimpaired image and JPEG compression at 75%, 50%, 25%, 15% and 5% for the impairment levels l from 1–5, respectively. The selected spherical source images were used in prior works [2], enabling a direct comparison between results described for an augmented reality setting (SAR) and the virtual reality setting (SVR) we consider in this contribution. We illustrate the employed spherical images for additional reference in Figure 3.
Similar to our prior works, we captured EEG data in addition to the user QoE feedback. The MUSE headband directly provides 10-Hz measurements for TP9, Fp1, Fp2 and TP10 positions (denoted as positions p, }, respectively) for these EEG bands:
- Low at 2.5–6.1 Hz,
- Delta at 1–4 Hz,
- Theta at 4–8 Hz,
- Alpha at 7.5–13 Hz,
- Beta at 13–30 Hz and
- Gamma at 30–44 Hz.
The generated data have been made publicly available as part of the Visual Interface Evaluation for Wearables (VIEW) datasets; see [2].
3. Data Preparation and Evaluation
We initially performed an evaluation of the completeness of the publicly available dataset with respect to the available EEG data. In turn, we eliminated several subjects that exhibited problems in gathering EEG data, for a resultant set of 11 fully-suitable subject datasets. The subset consisted of 3 female and 8 male subjects with an average age of 24 years (SD = 3.07). Five of the subjects commonly wear vision-correcting devices (with one subject not wearing the device during the experimental session). For comparability with prior results in [2], we evaluated the potential to predict the subject-specific QoE, as well as the set (pre-determined) impairment level (QoS). We employed two different approaches in this performance evaluation, namely (i) a direct EEG-data-based approach utilizing the timely gathered data and (ii) a normalized approach that utilizes z-scores derived over the entire EEG data available per subject. We briefly outline the major statistics employed and our evaluation methodology in the remainder of this section.
3.1. Statistical Methods
We note from the prior Section 2 that subjects u viewed image i at different impairment levels l for a time ranging from –. In addition to the media time, EEG data were determined for an individual user’s entire session time , which included time before and after the actual media presentation. This approach enables additional evaluation approaches as described in the following for an individual combination of EEG sensor position and a frequency band to maintain clarity in the overall presentation of our approach.
As the media display invokes EEG potentials trailing between 300 and 500 ms as the result of a stimulus, we initially consider:
In other words, we consider the initial 500-ms time from the individual content displays onward by aggregating the individual measurements into a generalized average. The motivation to combine the individual measurement points is provided by the overall setup we employed, which, in its non-clinical approach, is closely aligned with real-world implementation scenarios.
Let denote the generic z-score for a measurement value at time t. The z-score is a unit-neutral expression of values in standard deviations from the overall sample mean [28], here for an individual position’s single EEG band, as noted above. The z-score, referred to as EEGz, is subsequently determined as:
whereby denotes the overall average for the measurement value (i.e., over T) and denotes its standard deviation.
We employ logistic regression as the approach underlying the prediction performance evaluation for both QoE and QoS, as both are captured as categorical Likert-type scales in the experimental phase. In our evaluation, we consider the second degree () polynomial extension of the original values throughout our prediction efforts, based on our prior findings in [29]. We evaluate different combinations of EEG sensor positions p as input sources for our evaluations to determine practical device implementation options as follows:
- All:
- Left:
- Right:
- Outside:
- Inside: .
Based on the poor performance of individual measurement points, we found in [2], we here do not consider the individual sensors separately.
As we perform an evaluation of the possibility to predict the QoE ratings/QoS levels based on the EEG data, let denote an estimated QoE rating for an individual image at a specific impairment level presented to the subject under consideration (with the QoS estimation performed similarly). In order to derive a general estimation for the fit of a regression model, a common approach is to consider the coefficient of determination, defined generally here as:
However, the value itself should be put into additional context, such as an evaluation of the actual prediction error. Here, we consider the Mean Absolute Error (MAE). The MAE over a range of sample estimations s is defined as:
Next, we describe how we employ these metrics in our prediction and evaluation approach. We additionally note that this overall process is performed for QoE, QoS and EEG, EEGz combinations in a similar fashion.
3.2. Evaluation Approach
For an individual subject, we denote the available user ratings as and the according EEG values in second degree polynomial expansion as . We perform a random split into a training and an evaluation data subset (80/20 split), resulting in and . We perform logistic regression on . The regression-determined coefficients are subsequently applied to the remaining test subset, and the Mean Absolute Error (MAE) is determined.
We repeat this individual prediction process times, interrupting when a 95% confidence interval width [28] below 5 percent of the overall average MAE value is reached. This approach results in n random sub-sampling repetitions for cross-validation (Monte Carlo-type cross-validation). The determined coefficients for each of the individual validations are averaged themselves to and employed in the prediction of the complete dataset, i.e., without separation of training and testing data. This approach mimics the availability of a user-dependent profile that is employed to predict close to real time how users experience the media presentation (QoE). This last prediction is utilized to determine the coefficient of determination () score and the MAE that is described in the following Section 4 as the outcome of our evaluation process.
4. Results
In this section, we initially evaluate the results obtained from the prediction of the QoE and QoS directly based on the gathered EEG data. We subsequently shift the evaluation to additionally consider the availability of user-centric profiles, expressed in terms of the z-score of the EEG measurements, EEGz. Throughout this section, we employ the second degree polynomial extensions in our evaluations, to enable direct comparison with other results obtained for binocular augmented vision scenarios in [2]. We additionally note that the overall trends observed in prior works [29] apply here, as well, i.e., the second degree is a sensible trade-off between computational complexity and prediction performance.
4.1. Direct EEG Prediction
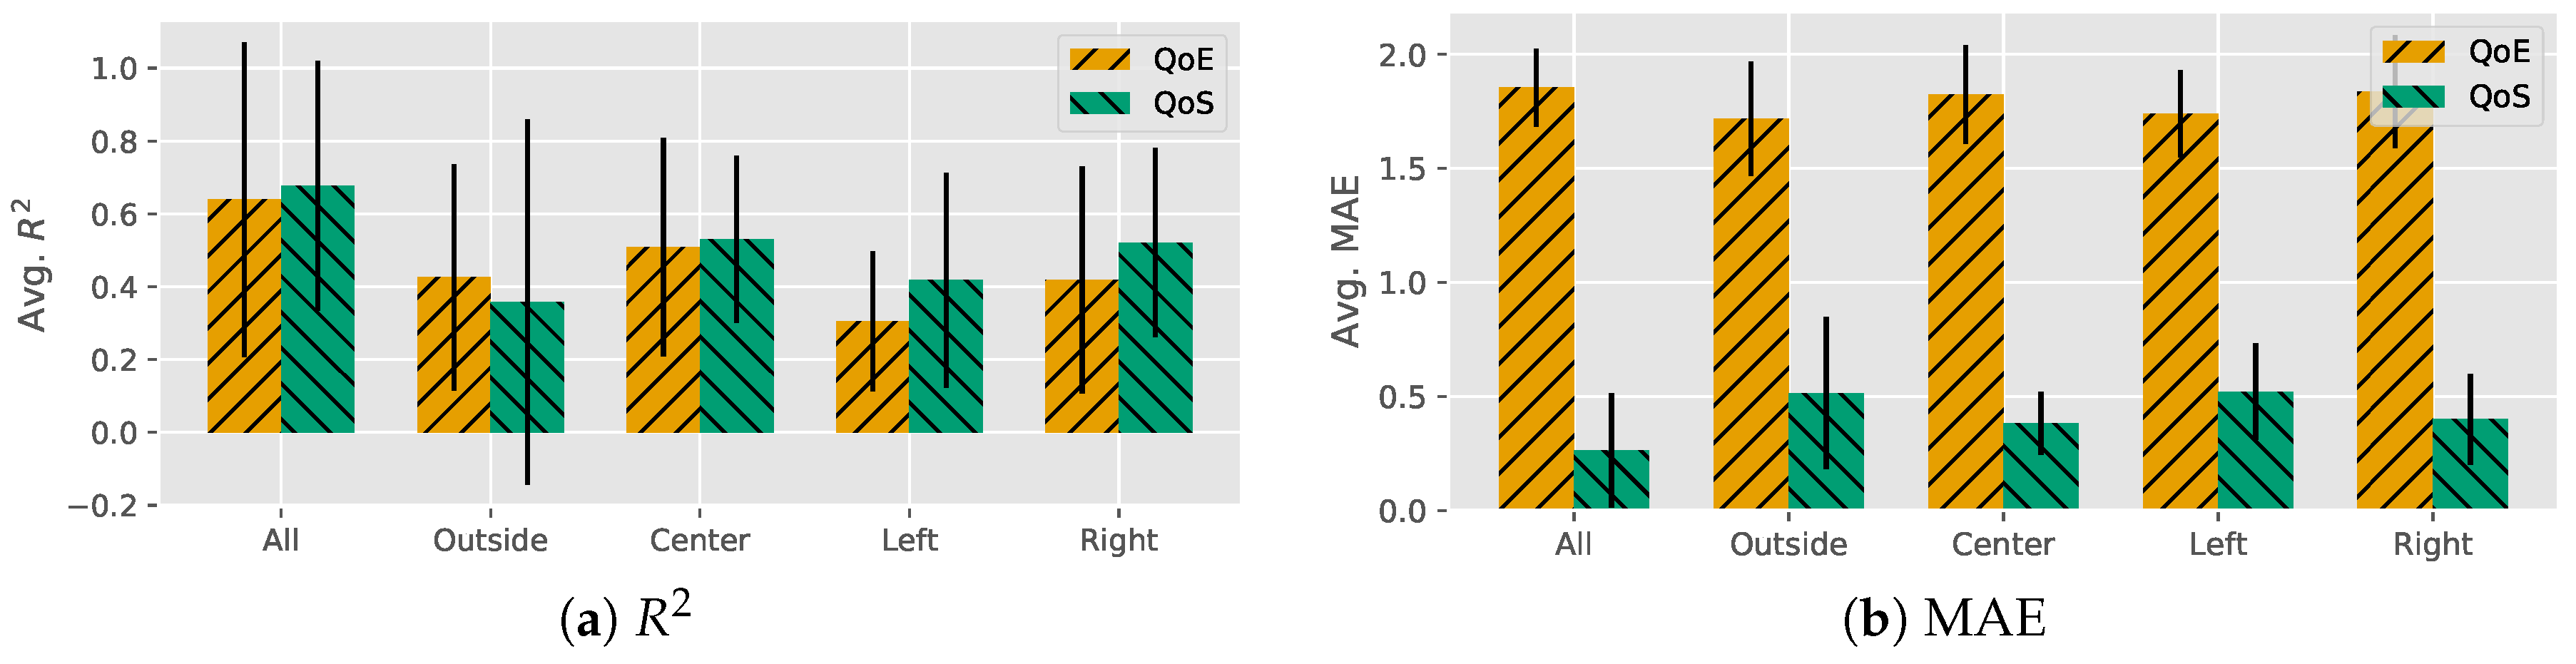
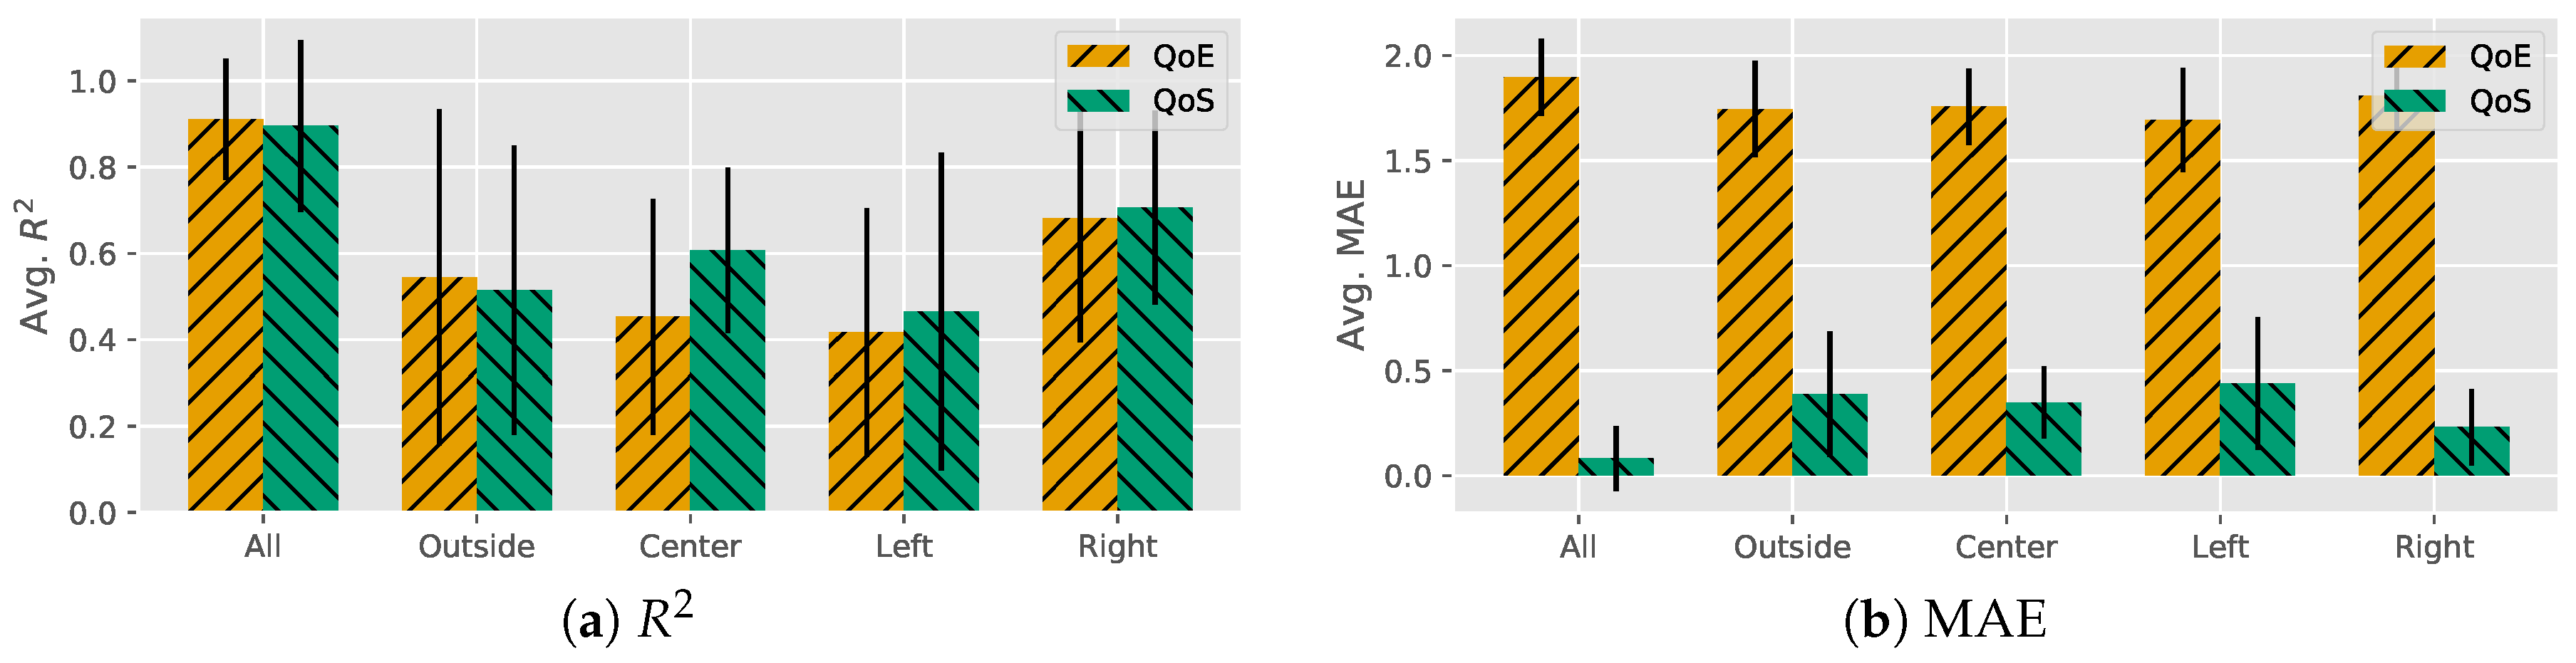
We begin the discussion of the results by an overall evaluation of all available electrodes’ data gathered and employed for predictions as described in Section 3. The subject-based results are illustrated in Figure 4.
We initially observed that the overall average obtained for the score of all sensors’ data was just below . This level indicates an overall approach of fair prediction performance. We furthermore observed that this average level was accompanied by a significant level of variability (). Indeed, a closer inspection of the individual subject prediction performance readily reveals considerable differences. The first subject in this set, as an extreme example case, exhibited even a negative score.
Next, we considered the prediction errors indicated as MAE, also illustrated in Figure 4. We first observed that the QoE prediction yields MAE values that indicate significant deviations from the original (). The small level of variability here results from only a small spread on the high end for individual subjects (ranging between 1.57 and 2.13). Additional evaluations of a potential reduction in the amount of sensors, either to the left two, right two, outside two or center, two indicated that the prediction performance would decrease even further.
Shifting the view to an approximation of the QoS (set image quality level), we continue to illustrate our results in Figure 4. A first view at the overall level of the score obtained is similar to the one we derived for the QoE predictions, resulting in an average . The performance increased for some users (including the outlier observed for QoE values) and only partially decreased for some of the others, which subsequently was reflected in the slightly reduced variability (). Comparing the different scenarios for reduced amounts of sensors, we furthermore observed this trend continuing, with an exception for the reliance on the outside sensor data only, where the QoS prediction performance was below that for the QoE.
We observed a significant reduction of the MAE () that came with the increase in the performance, which was also reflected in the MAE range (ranging from 0–0.83). Performing a similar evaluation of the possibility for complexity reductions as before, we noticed that the decrease of EEG measurement data had an overall damaging effect on the results. While better prediction outcomes were attained for individual subjects in some constellations, the generally observable trend for different electrode placement scenarios was one of an overall reduced prediction accuracy indicated by lower scores paired with higher MAE levels.
4.2. Prediction with EEG z-Scores
Considering that EEG profiles would be available for the individual VR users in future scenarios, we considered the overall EEG z-scores as input of the QoE and QoS predictions in the following. We illustrate the initial QoE results in Figure 5.
We initially observed that the z-scored approach yielded a significantly high level of scores for the subjects under consideration (). We furthermore noted that the overall variability decreased, as well, which indicated significantly less between-subject differences in prediction performance. Attempting a reduction in the number of z-scored EEG data points to be employed for the prediction approach yielded the by now anticipated reduction in the score attained.
Shifting the view to the prediction errors, we noted a high level of errors as indicated by the MAE (). The high level of errors shows that the increased score did not result in an accurate prediction outcome, while the small variability indicated that this was observed for this group of subjects in general. A reduction in the number of data points here had only a minor impact on the MAE results, which remained high throughout.
For the QoS results, illustrated in Figure 5, we also observed a fairly high level of scores on average () when considering all available data. As observed for the direct EEG value scenario, we also note that the high scores were accompanied by a low average MAE level () with perfect predictions for several subjects. In this scenario, we note that the MAE scores for the four alternative EEG source data scenarios resulted in an additional increase of the MAE scores, rendering these alternative approaches non-favorable.
5. Discussion
Throughout the prior sections, we focused on the description of the attainable results for Spherical Virtual Reality (SVR) image QoE and QoS approximations. The results illustrated in Figure 4 highlight that in almost all cases, the subject-dependent results are worse than those obtained when considering all available EEG data. While small improvements in the average MAE can be observed for these additional configurations, the combination of MAE and performance does not make any of these suitable for real-time QoE predictions. Overall, for the direct EEG value-based predictions of the QoE, we noted the best scenario resulting in an overall average of just above , which is promising, but it did not result in the desired low-level MAE that would make the prediction outcome directly applicable. The average MAE level approaching two indicates that a prediction effort would be off by this amount on average, e.g., predicting the rating of an average quality experience as low or high.
Even the EEGz-based approach with higher outcomes does not significantly improve on the QoE predictability, as indicated by comparably high levels of MAE. Given these outcomes, it is not surprising that a reduction in the number of sensors yields even worse results and is not feasible for reliable QoE predictions in the VR settings we considered.
If we considered the impairment levels themselves as QoS as the prediction target, we observe a completely different outcome. Here, we derive a feasible approach to the prediction of the QoS level based on the EEG and EEGz values of most participating subjects. The shift to the QoS in both cases results in a significant increase in the performance, rendering the current approach applicable for a QoS approximation.
Comparing the QoE and QoS MAE levels for the EEG and EEGz approaches, we note a significant difference of the QoS approach (i.e., utilizing the objective image quality metric). One of the reasons for this difference is the deviation of the QoE ratings by subjects and the previously set level. Fitting the QoE through EEG signal evaluation, thus, also incorporates these differences between set and perceived quality levels, resulting in increased errors. The commonly possible interpolation of the QoE through QoS means (e.g., following the IQXapproach in [9]) could, in turn, yield an approximation of the QoE, albeit with likely additional approximation accuracy penalties.
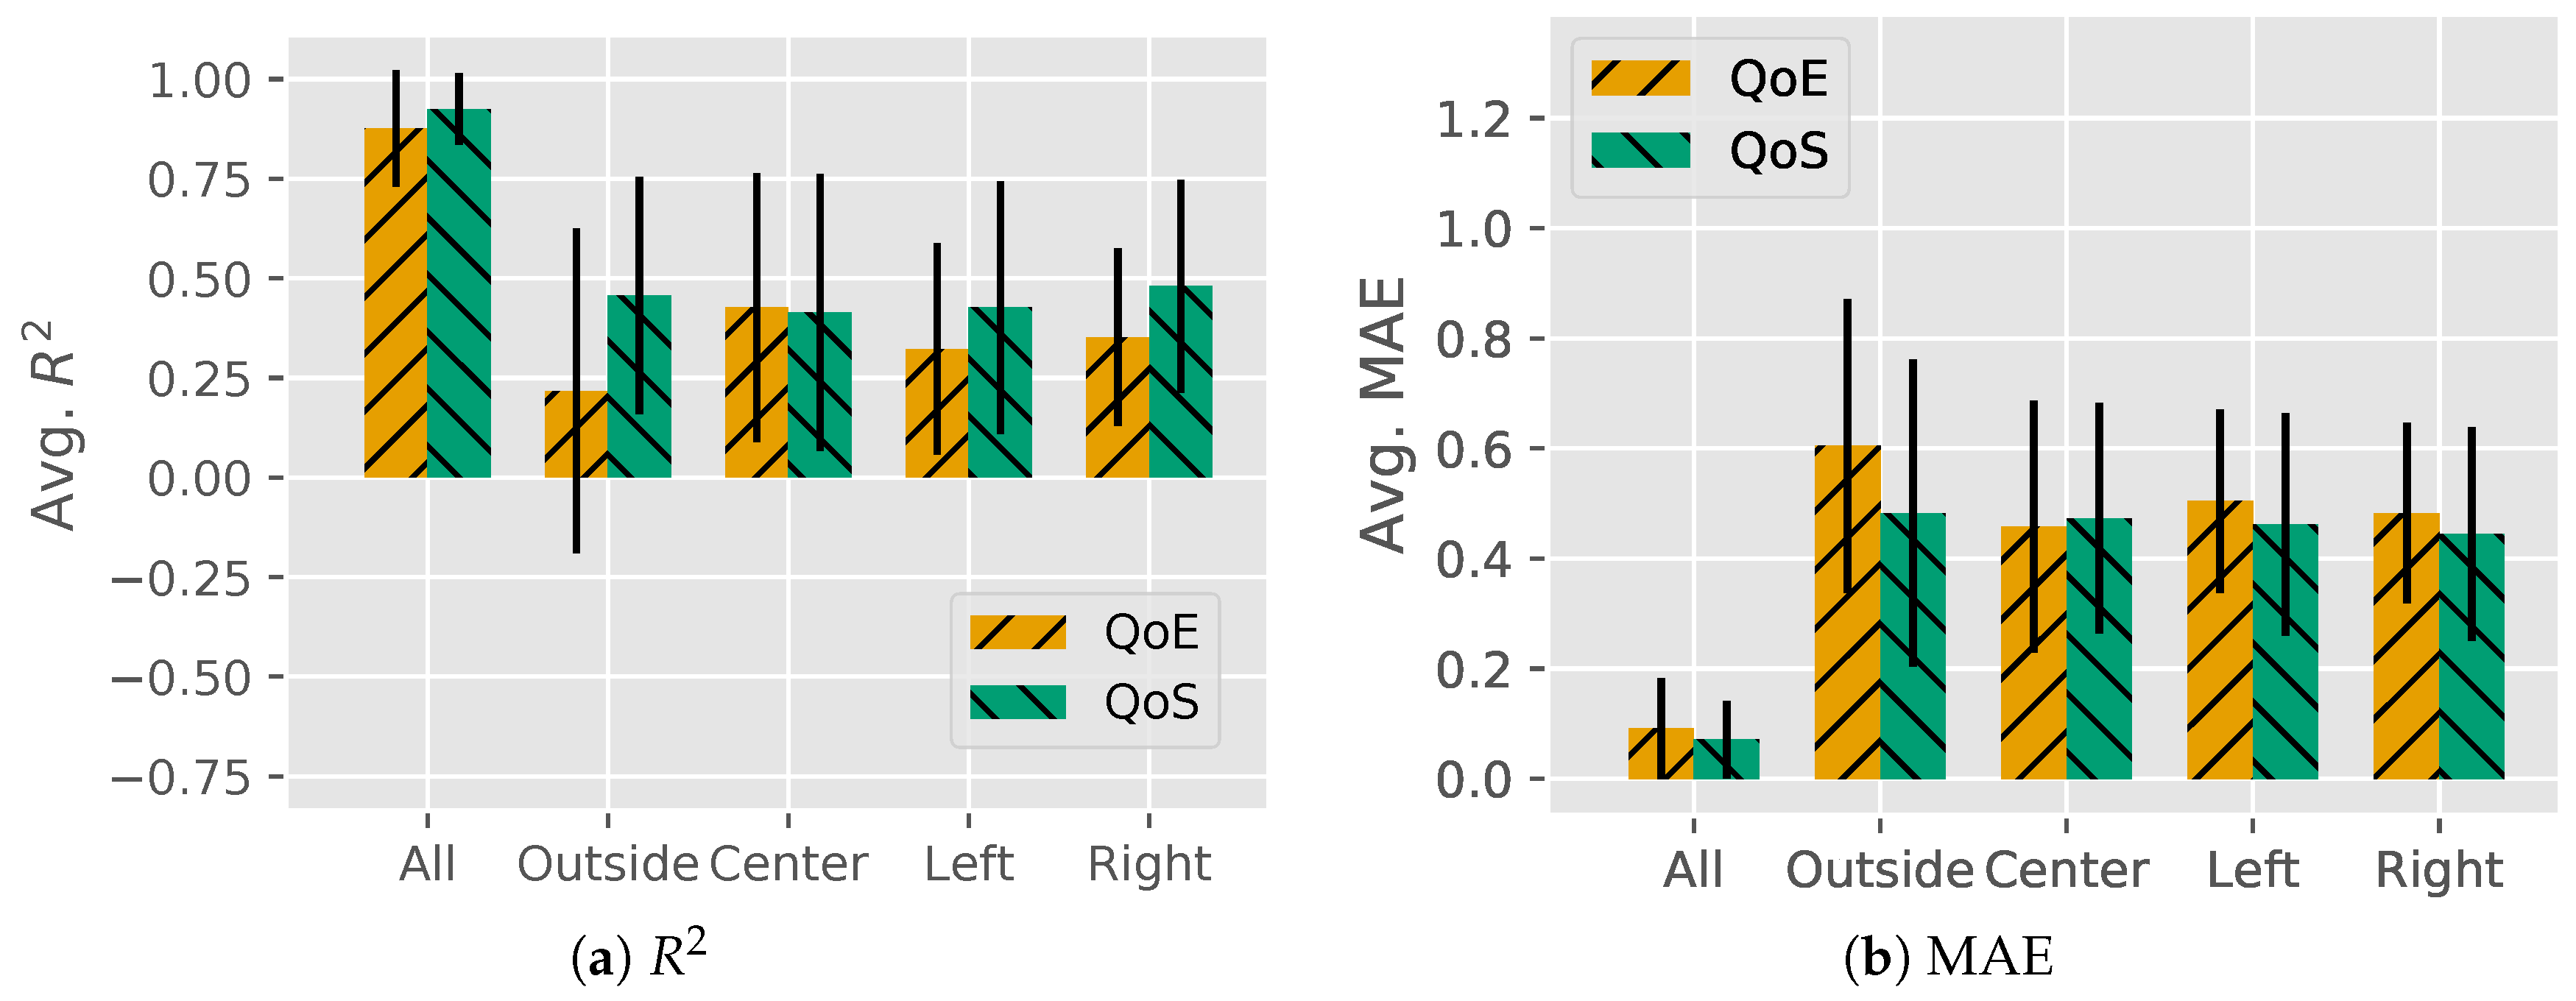
In comparison to the results we obtained as part of our own prior research results for augmented reality (SAR) settings in [2], we find several similarities. For comparison, we provide the results for the EEG-based SAR and MAE values in Figure 6.
While not presented in Section 4, the evaluation of individual EEG sensor positions results in a similar low level of scores (and, subsequently, high MAE levels). For the EEGz data (to enable a direct comparison), we note that for all position data, the SAR exhibited an average of for the QoE prediction, which is very comparable to the values we obtained here for the SVR. However, the major difference is a significantly lower in the SAR QoE prediction scenario, which made that approach directly applicable; see Figure 6b. Similar trends were again observed for shifting from the QoE to the QoS, which results in a slight performance increase for both scenarios. We additionally note that for both scenarios, shifting the available EEG electrode data to the sides, center or outside has similar impacts on the resulting scores and MAEs.
Jointly, our results indicate overall predictability of the SVR-QoS, but not the SVR-QoE. This could enable future implementations in passive human-in-the-loop settings through approximations of the SVR-QoE from the SVR-QoS, albeit at a potential penalty in accuracy. In comparison with the SAR scenario, which features more active variables that can impact the prediction outcome (e.g., light source, real-world backdrops, etc.), we find worse performance for the more immersive SVR approach. This counter-intuitive reversal is currently under further investigation as it resembles a significant finding.
6. Conclusions
This article expanded on prior works in the domain of EEG-based QoE/QoS predictions by presenting the results of human subject experimentation for Spherical images in Virtual Reality settings (SVR). While the data are disseminated as part of the existing Visual Interface Evaluation for Wearables (VIEW) datasets, an analysis revealed that the prediction performance is below applicable levels for the QoE (and lower than previously observed for similar augmented reality evaluations). However, the prediction of the QoS is feasible within acceptable margins of error. We additionally find that performance can be increased if considering an EEG user profile, i.e., in the context of our work employing EEG z-score values.
Interestingly, when compared to the augmented reality scenarios, we find that the SVR performance is counter-intuitively lower, which is the subject of our ongoing inquiries. The additional next steps in our research include a move to fully-automatized system implementations on the network edge to optimize the delivery of immersive content on-the-fly.
Author Contributions
Anil Kumar Karembai and Jeffrey Thompson performed the experimental data generation at the source of this article and helped in the article processing. Patrick Seeling generated the publicly available dataset and was the main contributor to the manuscript.
Funding
This material is based on work supported by the Faculty Research and Creative Endeavors (FRCE) program at Central Michigan University under Grant #48146.
Conflicts of Interest
The authors declare no conflict of interest.
References
- Keighrey, C.; Flynn, R.; Murray, S.; Murray, N. A QoE evaluation of immersive augmented and virtual reality speech language assessment applications. In Proceedings of the 2017 Ninth International Conference on Quality of Multimedia Experience (QoMEX), Erfurt, Germany, 31 May–2 June 2017; pp. 1–6. [Google Scholar]
- Bauman, B.; Seeling, P. Visual Interface Evaluation for Wearables Datasets: Predicting the Subjective Augmented Vision Image QoE and QoS. Future Internet 2017, 9, 40. [Google Scholar] [CrossRef]
- Seeling, P. Network Traffic Characteristics of Proxied Wearable Devices: A Day with Google Glass. In Proceedings of the IEEE Consumer Communications and Networking Conference (CCNC), Las Vegas, NV, USA, 9–12 January 2015. [Google Scholar]
- Shih, Y.Y.; Chung, W.H.; Pang, A.C.; Chiu, T.C.; Wei, H.Y. Enabling Low-Latency Applications in Fog-Radio Access Networks. IEEE Netw. 2017, 31, 52–58. [Google Scholar] [CrossRef]
- Brunnström, K.; Beker, S.A.; De Moor, K.; Dooms, A.; Egger, S.; Garcia, M.N.; Hossfeld, T.; Jumisko-Pyykkö, S.; Keimel, C.; Larabi, C.; et al. Qualinet White Paper on Definitions of Quality of Experience. In Proceedings of the Fifth Qualinet Meeting, Novi Sad, Serbia, 12 March 2013. [Google Scholar]
- Hektner, J.M.; Schmidt, J.A.; Csikszentmihalyi, M. Experience Sampling Method: Measuring the Quality of Everyday Life; Sage: Newcastle upon Tyne, UK, 2007. [Google Scholar]
- ITU-R, R. 1534-1, “Method for the Subjective Assessment of Intermediate Quality Levels of Coding Systems (MUSHRA)”; International Telecommunication Union: Geneva, Switzerland, 2003. [Google Scholar]
- Calvo, R.A.; D’Mello, S. Affect Detection: An Interdisciplinary Review of Models, Methods, and Their Applications. IEEE Trans. Affect. Comput. 2010, 1, 18–37. [Google Scholar] [CrossRef]
- Fiedler, M.; Hossfeld, T.; Tran-Gia, P. A generic quantitative relationship between quality of experience and quality of service. IEEE Netw. 2010, 24, 36–41. [Google Scholar] [CrossRef] [Green Version]
- Reichl, P.; Tuffin, B.; Schatz, R. Logarithmic laws in service quality perception: Where microeconomics meets psychophysics and quality of experience. Telecommun. Syst. 2013, 52, 587–600. [Google Scholar] [CrossRef]
- Gaubatz, M.D.; Hemami, S.S. On the nearly scale-independent rank behavior of image quality metrics. In Proceedings of the IEEE International Conference on Image Processing (ICIP), San Diego, CA, USA, 12–15 October 2008; pp. 701–704. [Google Scholar]
- Pan, C.; Xu, Y.; Yan, Y.; Gu, K.; Yang, X. Exploiting neural models for no-reference image quality assessment. In Proceedings of the 2016 IEEE Visual Communications and Image Processing Conference (VCIP), Chengdu, China, 27–30 November 2016; pp. 1–4. [Google Scholar]
- Mittal, A.; Moorthy, A.K.; Bovik, A.C. No-Reference Image Quality Assessment in the Spatial Domain. IEEE Trans. Image Process. 2012, 21, 4695–4708. [Google Scholar] [CrossRef] [PubMed] [Green Version]
- Li, B.J.; Bailenson, J.N.; Pines, A.; Greenleaf, W.J.; Williams, L.M. A Public Database of Immersive VR Videos with Corresponding Ratings of Arousal, Valence, and Correlations between Head Movements and Self Report Measures. Front. Psychol. 2017, 8, 2116. [Google Scholar] [CrossRef] [PubMed]
- Schatz, R.; Sackl, A.; Timmerer, C.; Gardlo, B. Towards Subjective Quality of Experience Assessment for Omnidirectional Video Streaming. In Proceedings of the 2017 Ninth International Conference on Quality of Multimedia Experience (QoMEX), Erfurt, Germany, 31 May–2 June 2017; pp. 1–6. [Google Scholar]
- Mastmeyer, A.; Hecht, T.; Fortmeier, D.; Handels, H. Ray-casting based evaluation framework for haptic force feedback during percutaneous transhepatic catheter drainage punctures. Int. J. Comput. Assist. Radiol. Surg. 2014, 9, 421–431. [Google Scholar] [CrossRef] [PubMed]
- Mastmeyer, A.; Fortmeier, D.; Handels, H. Evaluation of Direct Haptic 4D Volume Rendering of Partially Segmented Data for Liver Puncture Simulation. Sci. Rep. 2017, 7, 671. [Google Scholar] [CrossRef] [PubMed]
- Arnau-Gonzalez, P.; Althobaiti, T.; Katsigiannis, S.; Ramzan, N. Perceptual video quality evaluation by means of physiological signals. In Proceedings of the 2017 Ninth International Conference on Quality of Multimedia Experience (QoMEX), Erfurt, Germany, 31 May–2 June 2017; pp. 1–6. [Google Scholar]
- Bosse, S.; Müller, K.R.; Wiegand, T.; Samek, W. Brain-Computer Interfacing for multimedia quality assessment. In Proceedings of the 2016 IEEE International Conference on Systems, Man, and Cybernetics (SMC), Budapest, Hungary, 9–12 October 2016; pp. 002834–002839. [Google Scholar]
- Davis, P.; Creusere, C.D.; Kroger, J. The effect of perceptual video quality on EEG power distribution. In Proceedings of the 2016 IEEE International Conference on Image Processing (ICIP), Phoenix, AZ, USA, 25–28 September 2016; pp. 2420–2424. [Google Scholar]
- Scholler, S.; Bosse, S.; Treder, M.S.; Blankertz, B.; Curio, G.; Mueller, K.R.; Wiegand, T. Toward a Direct Measure of Video Quality Perception Using EEG. IEEE Trans. Image Process. 2012, 21, 2619–2629. [Google Scholar] [CrossRef] [PubMed]
- Lindemann, L.; Magnor, M.A. Assessing the quality of compressed images using EEG. ICIP 2011. [Google Scholar] [CrossRef]
- Acqualagna, L.; Bosse, S.; Porbadnigk, A.K.; Curio, G.; Müller, K.R.; Wiegand, T.; Blankertz, B. EEG-based classification of video quality perception using steady state visual evoked potentials (SSVEPs). J. Neural Eng. 2015, 12, 026012. [Google Scholar] [CrossRef] [PubMed] [Green Version]
- Bauman, B.; Seeling, P. Towards Still Image Experience Predictions in Augmented Vision Settings. In Proceedings of the IEEE Consumer Communications and Networking Conference (CCNC), Las Vegas, NV, USA, 8–11 January 2017; pp. 1–6. [Google Scholar]
- Seeling, P. Augmented Vision and Quality of Experience Assessment: Towards a Unified Evaluation Framework. In Proceedings of the IEEE ICC Workshop on Quality of Experience-Based Management for Future Internet Applications and Services (QoE-FI), London, UK, 8–12 June 2015. [Google Scholar]
- Seeling, P. Visual User Experience Difference: Image Compression Impacts on the Quality of Experience in Augmented Binocular Vision. In Proceedings of the IEEE Consumer Communications and Networking Conference (CCNC), Las Vegas, NV, USA, 9–12 January 2016; pp. 931–936. [Google Scholar]
- International Telecommunication Union (ITU-T). Recommendation ITU-T P.910: Subjective Video Quality Assessment Methods for Multimedia Applications; ITU-T: Geneva, Switzerland, 2008; pp. 1–42. [Google Scholar]
- Jain, R. The Art of Computer Systems Performance Analysis: Techniques for Experimental Design, Measurement, Simulation, and Modeling; Wiley: Hoboken, NJ, USA, 1991. [Google Scholar]
- Bauman, B.; Seeling, P. Towards Predictions of the Image Quality of Experience for Augmented Reality Scenarios. ArXiv, 2017; arXiv:cs.MM/1705.01123. [Google Scholar]
Figure 1.
Overview of the methodology for creating and evaluating the Spherical Virtual Reality (SVR) data, as employed in [2]. Initial data gathering through a new set of human subject experiments is followed by data preparations and subsequent prediction evaluations.
Figure 1.
Overview of the methodology for creating and evaluating the Spherical Virtual Reality (SVR) data, as employed in [2]. Initial data gathering through a new set of human subject experiments is followed by data preparations and subsequent prediction evaluations.

Figure 2.
Schematic view of the placement for the EEG headband (top) and the VR viewer (bottom). The headband’s electrodes connect at four positions on the forehead (TP9, Fp1, Fp2 and TP10 positions) of the subject and behind the ear for a reference.
Figure 2.
Schematic view of the placement for the EEG headband (top) and the VR viewer (bottom). The headband’s electrodes connect at four positions on the forehead (TP9, Fp1, Fp2 and TP10 positions) of the subject and behind the ear for a reference.

Figure 3.
Overview of the spherical images employed in the SVR scenario. Images were used prior in the evaluation of augmented binocular vision QoE in [2].
Figure 3.
Overview of the spherical images employed in the SVR scenario. Images were used prior in the evaluation of augmented binocular vision QoE in [2].

Figure 4.
Overview of the EEG data-based results for individual users and electrode positions for the QoE/QoS predictions based on SVR.
Figure 4.
Overview of the EEG data-based results for individual users and electrode positions for the QoE/QoS predictions based on SVR.

Figure 5.
Overview of the EEGz results for individual users and electrode positions for the QoE/QoS predictions based on SVR.
Figure 5.
Overview of the EEGz results for individual users and electrode positions for the QoE/QoS predictions based on SVR.

Figure 6.
and MAE results for the EEG-based prediction of the same images in the augmented binocular vision (SAR) setting; see [2].
Figure 6.
and MAE results for the EEG-based prediction of the same images in the augmented binocular vision (SAR) setting; see [2].

© 2018 by the authors. Licensee MDPI, Basel, Switzerland. This article is an open access article distributed under the terms and conditions of the Creative Commons Attribution (CC BY) license (http://creativecommons.org/licenses/by/4.0/).
Share and Cite
MDPI and ACS Style
Karembai, A.K.; Thompson, J.; Seeling, P. Towards Prediction of Immersive Virtual Reality Image Quality of Experience and Quality of Service. Future Internet 2018, 10, 63. https://doi.org/10.3390/fi10070063
AMA Style
Karembai AK, Thompson J, Seeling P. Towards Prediction of Immersive Virtual Reality Image Quality of Experience and Quality of Service. Future Internet. 2018; 10(7):63. https://doi.org/10.3390/fi10070063
Chicago/Turabian StyleKarembai, Anil Kumar, Jeffrey Thompson, and Patrick Seeling. 2018. "Towards Prediction of Immersive Virtual Reality Image Quality of Experience and Quality of Service" Future Internet 10, no. 7: 63. https://doi.org/10.3390/fi10070063
Note that from the first issue of 2016, this journal uses article numbers instead of page numbers. See further details here.