Performance Analysis of Hybrid Optical–Acoustic AUV Swarms for Marine Monitoring


Department of Electronic Engineering, University of Rome Tor Vergata, 00133 Rome, Italy
*
Authors to whom correspondence should be addressed.
Future Internet 2018, 10(7), 65; https://doi.org/10.3390/fi10070065
Submission received: 30 May 2018
/
Revised: 6 July 2018
/
Accepted: 7 July 2018
/
Published: 10 July 2018
Abstract
:Autonomous Underwater Vehicles (AUVs) are assuming an important role in the monitoring and mapping of marine ecosystems, especially for their ability to explore harsh environments. AUV swarm can collect data operating autonomously for long periods enabling new applications in this field. However, the mission duration is usually limited also by the high power consumption required for acoustic transmissions. A new generation of devices complements the acoustic modem with an optical modem that can provide a communication channel with higher capacity and lower power consumption with respect to the acoustic channel. However, the optical link that uses the visible light is very sensitive to the water turbidity that can strongly limit the link coverage. In this paper, we evaluate the networking performances of the Venus vessel, a real AUV prototype equipped with an acoustical modem and an optical modem. The presented analysis aims to evaluate key system parameters allowing to select the best way to set up network communications according to the surrounding conditions (e.g., quality of water) and to the application requirements. Simulation results account for the case of ports or basins, where the water quality is poor and the use of the optical modem is strongly limited by distance. We evaluate system performance in terms of transmission delay in the network and we also provide a power–capacity trade-off.
1. Introduction
Swarms of Autonomous Underwater Vehicles (AUVs) are expected to be used for various tasks, including monitoring and surveillance of underwater infrastructures, especially for communication and energy usage, and more in general for monitoring the ecology of basins, coasts and continental waters mainly for their ability to explore extreme and dangerous environments [1]. Usually, to properly fulfill the assigned mission, the vessels forming the swarm must communicate each other to exchange location information, collaborate for target discovering and/or share the collected data.
In many current applications, the communication among devices is usually demanded to acoustic communication channels. Acoustic modems support reliable long-range transmissions but offer a limited transmission capacity [2,3]. For this reason, many researchers have studied the integration of optical modems to complement acoustic communication link to provide an additional, relatively low power and high capacity communication channel. As a drawback, underwater optical modems use visible light signals transmitted and thus attenuated in water, resulting in a relatively short effective communication range (few meters). Indeed, the performance of optical link is strongly affected by the quality of the water and, in particular, by its turbidity that plays a central role in characterizing the optical signal attenuation.
Modern AUVs that integrate both acoustic and optical modems can support new classes of underwater missions. However, this high flexibility provides many challenges in the definition of the mission strategies since selecting the best communication solution clearly depends on the actual environmental parameters. AUVs controllers integrate smart algorithms and solutions to select the proper communication strategy, according to the application communication requirements and the actual environment status [4]. For instance, if a swarm monitors an area with limited optical visibility, the mission controller has two options: (i) redesign the swarm topology to match the reduced communication range; or (ii) reduce the exchanged information up to the capacity of the acoustical channel.
In this paper, we analyze possible configurations of acoustic–optical hybrid network with the aim to compare acoustic and optical communication channels for different conditions of water quality. From this analysis, we show the performance of the network configuration resulting from the swarm topology.
The main contributions of this work are:
- the evaluation of the network performance in terms of transmission delay, required energy of AUV swarm networks considering parameters taken from a real implementation and specifically from the Venus vessel (described in Section 4), the results of which can be useful to design mission strategies, such as defining the topology to use, and assess the related performance, such as the duration lifetime of the AUVs;
- the extension of the communication model available in the literature [5] to consider omni-directional optical coverage, which follows a technological advance that places three triplets of diode array on the three side faces of a prism, enabling a near omni-directional optical coverage on a plane; and
- the assessment of the effects of the turbidity of the water on the network topologies and system parameters, presenting how the communication models change with the different characteristics of the water.
The paper is organized as follows: Section 2 describes the state of the art; Section 3 presents the application scenario challenges and goals; Section 4 presents the Venus device, an AUV implementation prototype; Section 5 presents the performance evaluation of different network topologies using the Venus parameters; and, finally, conclusions are drawn in Section 6.
2. Related Work
In recent years, researchers have shown an increasing interest in the acoustical–optical hybrid solutions for underwater communication [6]. In some cases, nodes and modems have been studied in research projects and developed within experimental AUV prototypes.
2.1. Experimental Setups and Real Prototypes
The first prototype of a hybrid acoustic/optical underwater system was presented in [7]: the presented system included static sensors (Aquafleck), vessels for sensors deployment (Amour AUV) and mobile nodes for data collection (Starbug AUV). The acoustic communication was used mainly for signaling among the devices. Mobile AUVs operate as data mules and use the optical system for collecting then data from the sensors.
In [8], the authors evaluated the effectiveness of hybrid acoustic/optical solution for real time video streaming applications. In the presented system, real-time video collection is performed using a multi hop network of optical links and the acoustic channel is used for network coordination and signaling. However, if optical link fails, a backup channel can be activated with an ultra compressed video streamed by the acoustical channel. The paper presents a real experiment of compressed video transmission by the AquaSeNT acoustic modems.
2.2. Hybrid Networking Evaluation and Performance
Several works study the performance of hybrid optical acoustic devices and network of nodes. Specifically, adopting the same nomenclature of [9,10], we call “hybrid” nodes the nodes that are equipped both with an acoustic modem and with an optical modem; such communication systems can also be used simultaneously.
In [11], the authors presented a simple performance comparison between the pure optical and acoustical solutions and the hybrid solution, using the actual parameters of two real modems: the S2CR 18/34 acoustic modem from Evologics (www.evologics.de) and the AquaOptical II modem presented in [12]. The paper analyzes the network throughput varying the offered traffic until it saturates the channels. Moreover, they evaluated the required energy for the different transmission media. Similarly, in our study, we evaluated the required energy vs. the offered traffic considering variable water turbidity conditions.
In [13], the authors considered the problem of the integration at the networking level of an hybrid dual channel modem. They presented a protocol stack that introduces a convergence layer and implemented it in the DESERT simulator. The network entities that control the layer, called controllers, can support two transmission policies coping with different application needs: a fast transmission policy over the optical channel and a robust transmission policy over the acoustical channel. The paper tests the effectiveness of the proposed solution on a mixed scenario with AUV devices and divers, and the network is used to monitor and control the diver’s work.
The work in [14] presents the transmissions performance of the optical modem of the Alvin submarine in a real clear water scenario. Results were used to design an integrated optical/acoustical hybrid communication system. It also describes several application scenarios for the designed system: for instance, the use of the hybrid communication system for monitoring oil drilling at the bottom of the sea. In this case, the network of sensors is controlled by messages exchanged in the acoustic channel while the devices act as data mules collecting the data by optical communication.
3. Application Scenarios, Challenges and Goals
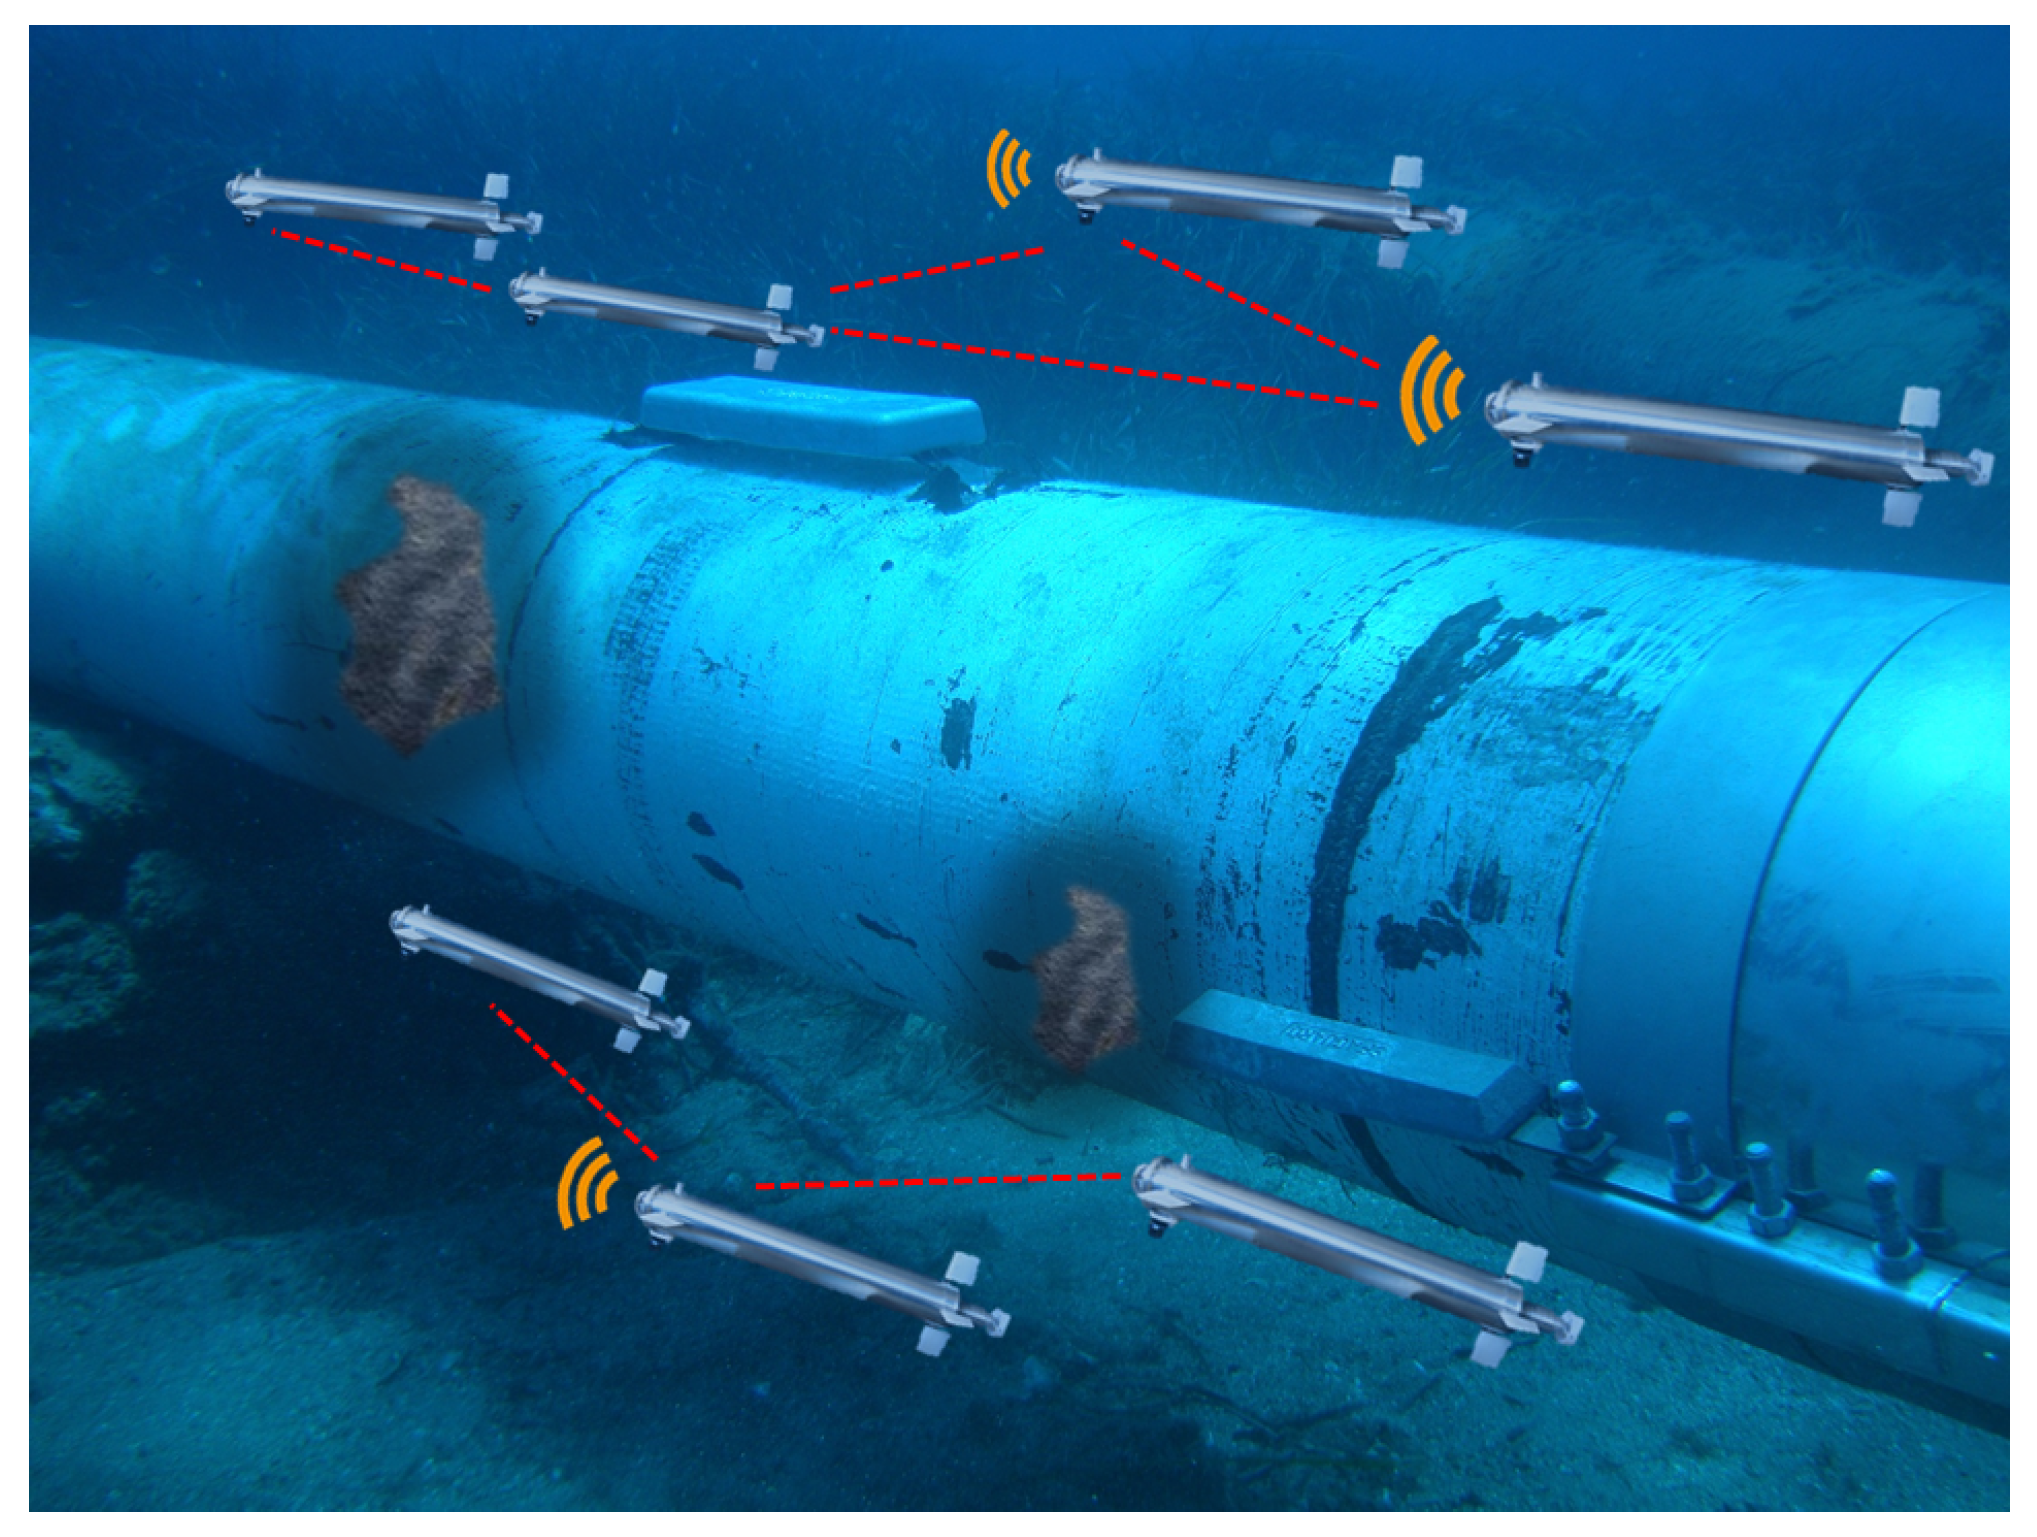
AUVs find their field of application in several missions such as the monitoring of the underwater pipelines (Figure 1), the reaction to ecological disasters, the maritime archeology and the monitoring of the underwater creatures and ecosystem. Advanced usage of swarms of AUV can benefit from the multiple availability of the relatively low cost vessels that can speed up for instance the scanning of a shipwreck sunken to the bottom of the sea.
To carry out all these missions, AUVs are usually equipped by a propulsion and guidance system, one or more communication modems and several specific sensors: all these components represent the resources on top of which a control software operates. The communication system plays a pivotal role, especially in missions requiring coordinated group work. Specifically, AUV devices need to communicate for:
- Knowing the mutual positions
- Discovering the objectives
- Identifying the relative positions of the targets being monitored
- Creating redundancy for the collected data
- Communicating the presence of obstacles.
Communication technologies and storage capability of the swarm deeply impacts on the ability of the AUVs to accomplish their missions. In particular, the selection the acoustic link or the optic link impacts several system parameters including the communication bit-rate, the delay and the communication range given by the propagation of the signal in the medium and also on the energy consumption of the transmitting and receiving chains. Table 1 reports some typical parameters of optical and acoustical communication channels. In our system model, we include specific values obtained from a real implementation described in Section 4.
Optical communication offers several benefits in terms of available bit-rate and energy consumption, while presents limitations on the communication distance with respect to the acoustic counterpart. These limitations pose some constraints on the possible topologies and arrangements of the AUVs swarm during the missions, as well as to their ability to create the AUV network. For instance, the AUV network can be designed to cover a certain volume. Usually, this configuration is adopted for swarm motion to monitor a certain area or to measure environmental data on a given surface. Obviously, the physical arrangement of the transducers and sensors impacts this configuration management and the protocol development. Typical swarm configurations can be classified according to the nodes topology in high or low density. Low density topologies tend to occupy the maximum volume while high density topologies ensure low AUV-to-AUV delay and offers a greater network resiliency.
The simplest arrangement is probably the “pipeline” configuration where all the nodes are ideally aligned and each node relaunches information to the next one. This topology configuration (sometimes called chain topology) can be used to collaborative mapping or scanning but also to set up a multi-hop communication channel toward a gateway typically placed on the surface of the sea. Thus the distance between robots plays a fundamental role when the communication is carried out by optical modems. The link range determines the number of AUVs that have to be used during the mission and can change also the mission strategy. Anyway, if the water turbidity is excessive or change during the mission, the communication penalty could lead up to a swarm partition, which could compromise the planned mission.
4. Venus Device
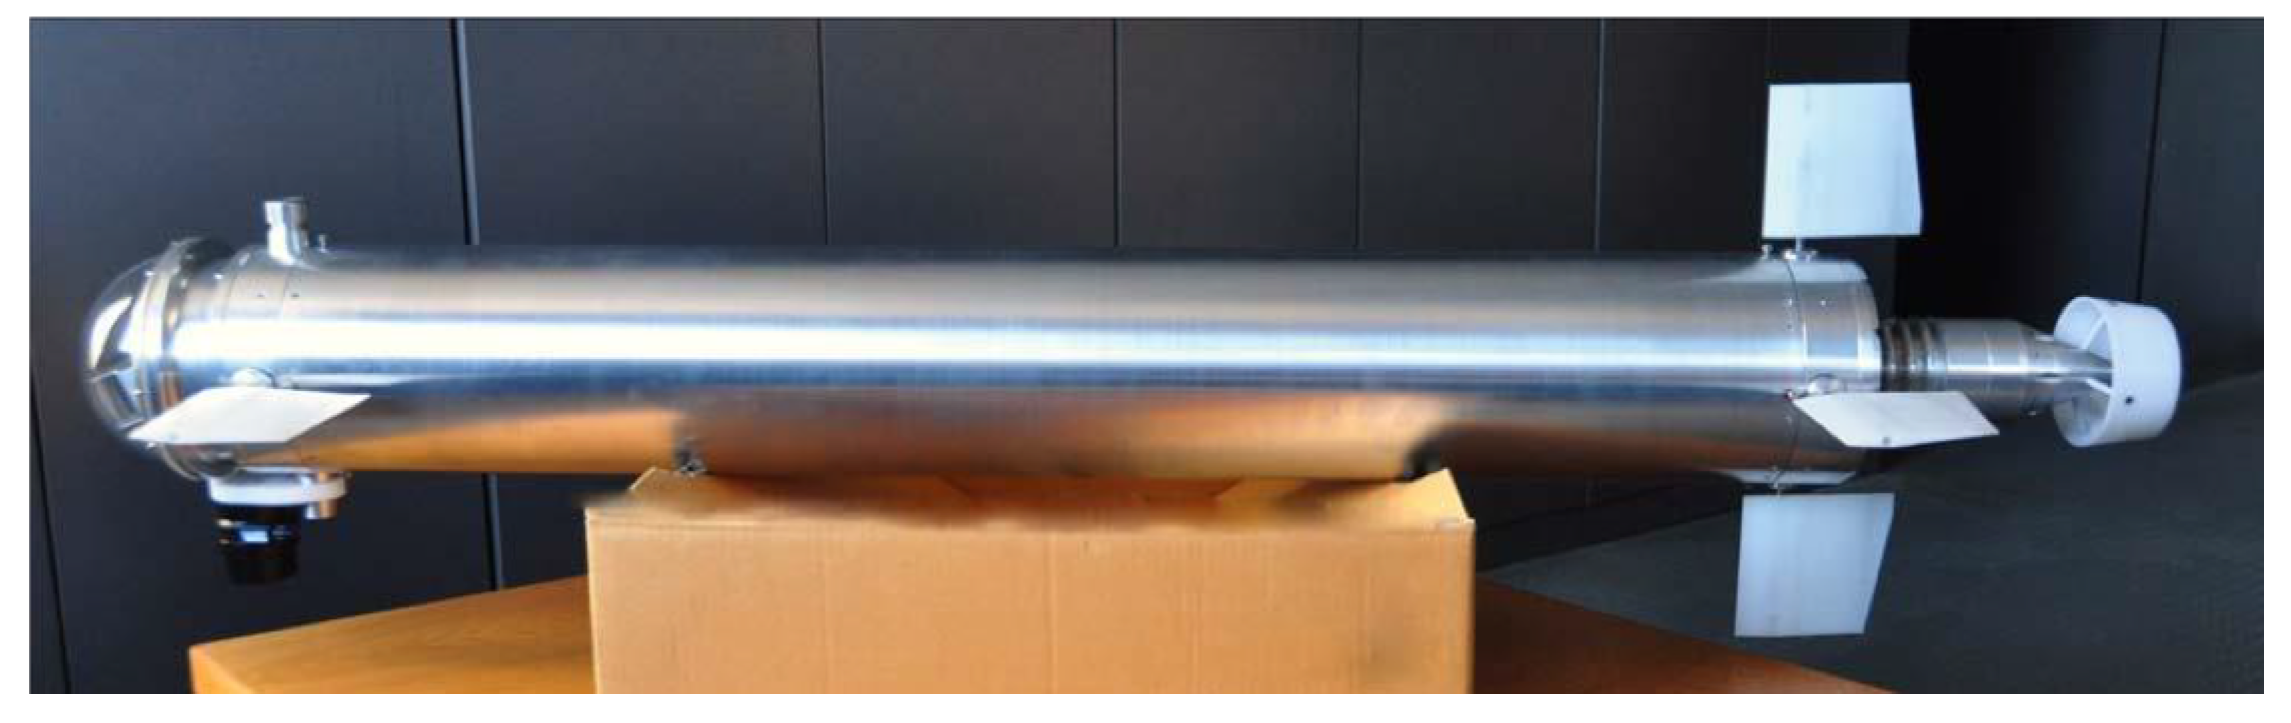
Figure 2 shows the Venus MAUV, a Mini Autonomous Underwater Vehicle designed and built by ENEA (Agenzia nazionale per le nuove tecnologie, l’energia e lo sviluppo ecosostenibile) [15].
The Venus vessel is descried in [15] and is composed of several components:
- A processing unit
- An electric subsystem
- Communication systems
- A sensing and implementation section.
The processing unit is the vessel controller, which implements the communication protocol and is responsible for the optimization of the consumed energy. The electric subsystem implements the energy saving procedures according to the processing units needs. The energy management strategy plays a fundamental role because the AUV is equipped with a limited power source and it is difficult to recharge the batteries.
This MAUV is equipped both with acoustic and optical modems. The integration of both the communication modems allows the Venus controller to select the best transmission link. In the following, we briefly describe the characteristics of the two modems in the current implementation status. Table 2 reports the main features of the MAUV Venus. In Section 5, we evaluate performances of the swarm network considering the real characteristics of the installed acoustic and optical modems. Both modems have been developed and implemented by ENEA with the collaboration of the University of Rome Tor Vergata. This has allowed us to obtain realistic operating scenario as well as the various system parameters. A trial with at least 10 Venus robots is planned for the next future.
4.1. Acoustical Modem
A general description of the acoustic modem in reported in [15]. In the current implementation of the Venus vessel, the acoustic transmitter adopts the 8-FSK modulation scheme and uses the following frequency vector: [220, 240, 260, 280, 300, 320, 340, 360] (kHz). It can transmit simultaneously any combination of the 8 available frequencies that assumes a binary weight meaning: a given frequency is associated with the bit k of an 8-bit codeword. A line coding is used with the capability of detecting single errors through a parity bit. In particular, 7 bits are dedicated to the transmission of the data (dataword) and 1 bit is for the parity check (odd-numbered parity). This involves usable configurations where 8 out of 128 are used for signaling and the remaining 120 for the payload.
The modulated signal waveforms are generated from samples that are stored in a ROM memory that the transmitter uses as a Look-Up-Table for the generation of the tones starting for a given codeword. All the logic for addressing and buffering data is implemented in a FPGA. The receiver performs the complementary decoding operations to recognize the transmitted codeword from the received tones.
The modulated signal is transmitted by a quasi omnidirectional electro-acoustic transducer Reson TC4034. The technical characteristics are: Receiving Voltage Sensitivity (RVS) of −218 dB re 1 V/1 uPa (at 250 Hz), Transmit Voltage Response (TVR) exceeding 122 dB re 1uPa/v@1m (at 100 kHz). This broadband spherical hydrophone model provides uniform omnidirectional characteristics over a wide frequency range of 1 Hz to 470 kHz.
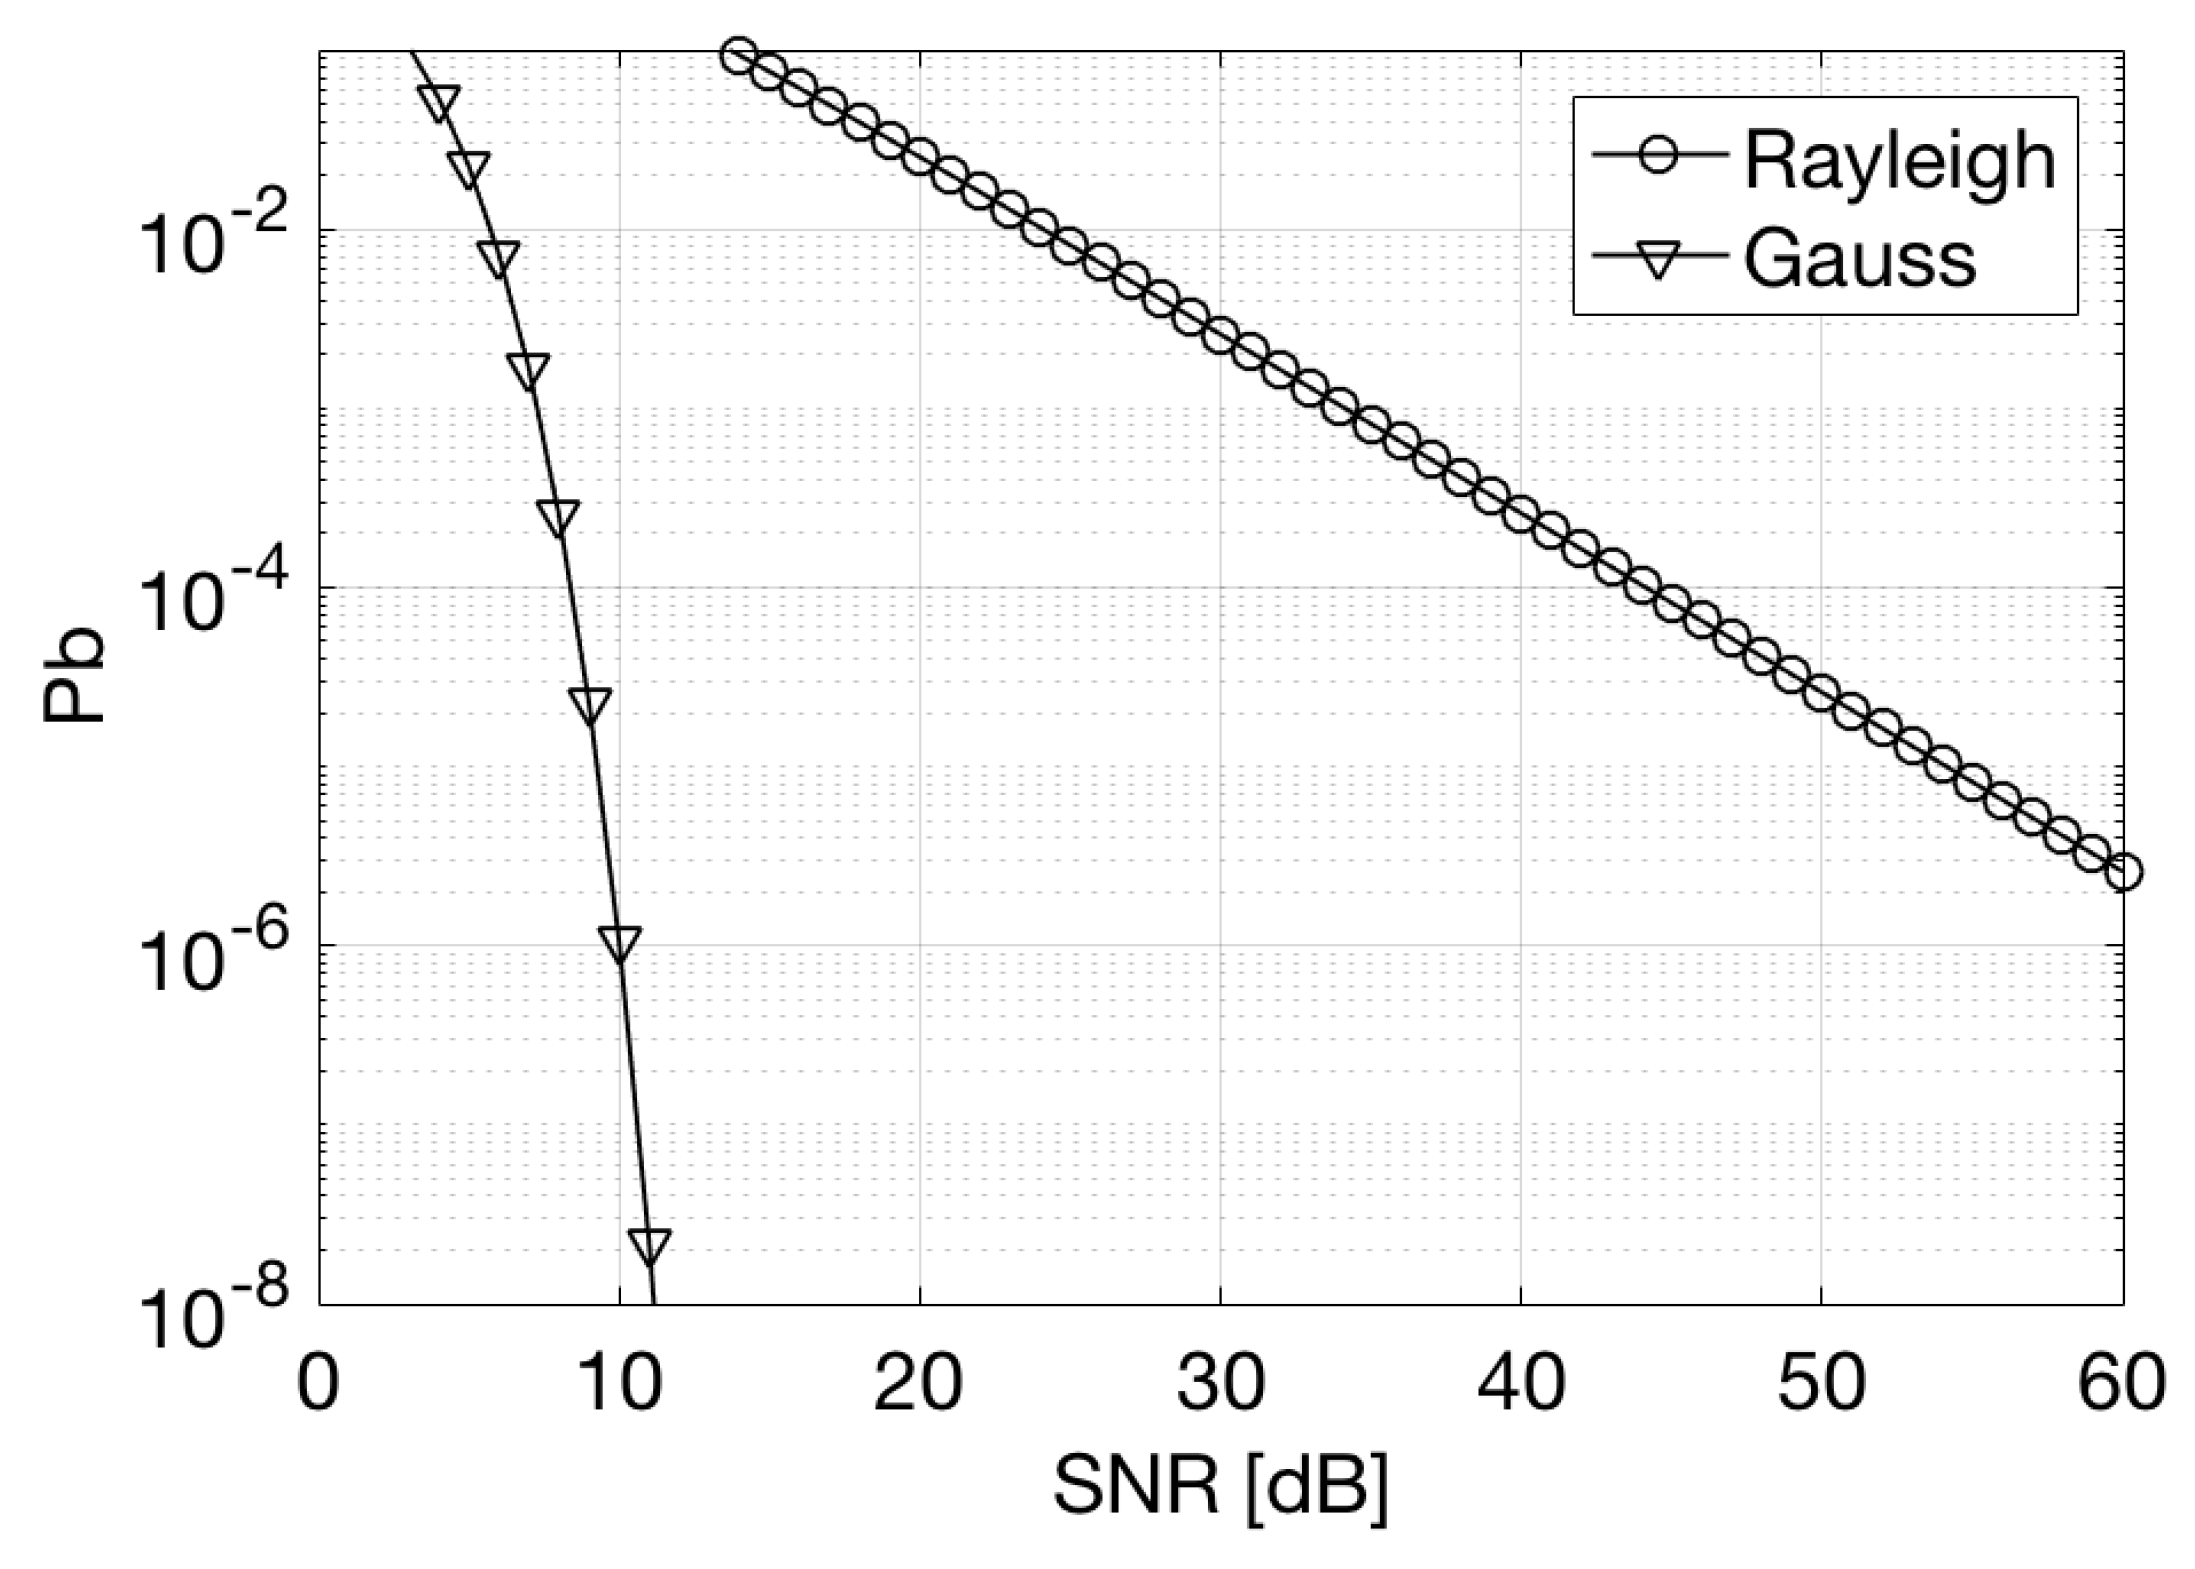
Figure 3 shows the error probability as a function of the SNR, for an 8-FSK modulation in the case of an Additive White Gaussian Noise channel and a Rayleigh fading channel.
According to Tabacchiera et al. [16], the error probability is given by:
In the case of Gaussian channel, is equal to:
while in case of Rayleigh channel, is:
where (for the 8-FSK), is the signal to noise ratio and .
4.2. Optical Modem
The performance of optical channel has been analyzed according to the model proposed in [15,17]. The optical communication system is based on the use of LED sources. The transmission section is composed of three triplets of diode arrays with different wavelengths (red, solar and blue spectrum); currently, only the blue LEDs are used for data transmission. The receiving section is comprised of three high sensitivity PIN diodes.
The modem, assembled in the ENEA laboratories, is inserted in a prismatic plexiglass structure completely filled with oil to avoid stressing the structure with the water pressure due to the immersion depth. Each side of the prism brings one set of array and one receiving sensor to cover all the directions both in transmission and in detection.
Using analytical expressions, we evaluated the maximum achievable distance by an optical channel and how the turbidity of the water affects the performance. We started from the general expression for the SNR [17]:
where is the transmitted power, is the half angle transmitter beam width, c is the beam attenuation coefficient, r is the distance between transmitter and receiver, is the angle between the optical axis and the line-of-sight between the transmitter and the receiver, NEP is the Noise Equivalent Power and D is the receiver aperture diameter.
Then, for analytical tractability, we assumed the following conditions:
- Considering that the emission cone of LED is about 60 and that the triplets of the LEDs are arranged on the three sides of a triangle with different pointing directions, we assumed an omnidirectional coverage for the optical communication, so to have .
- We assumed that both transmitter and the receiver are positioned on the same plane, so that, on average, .
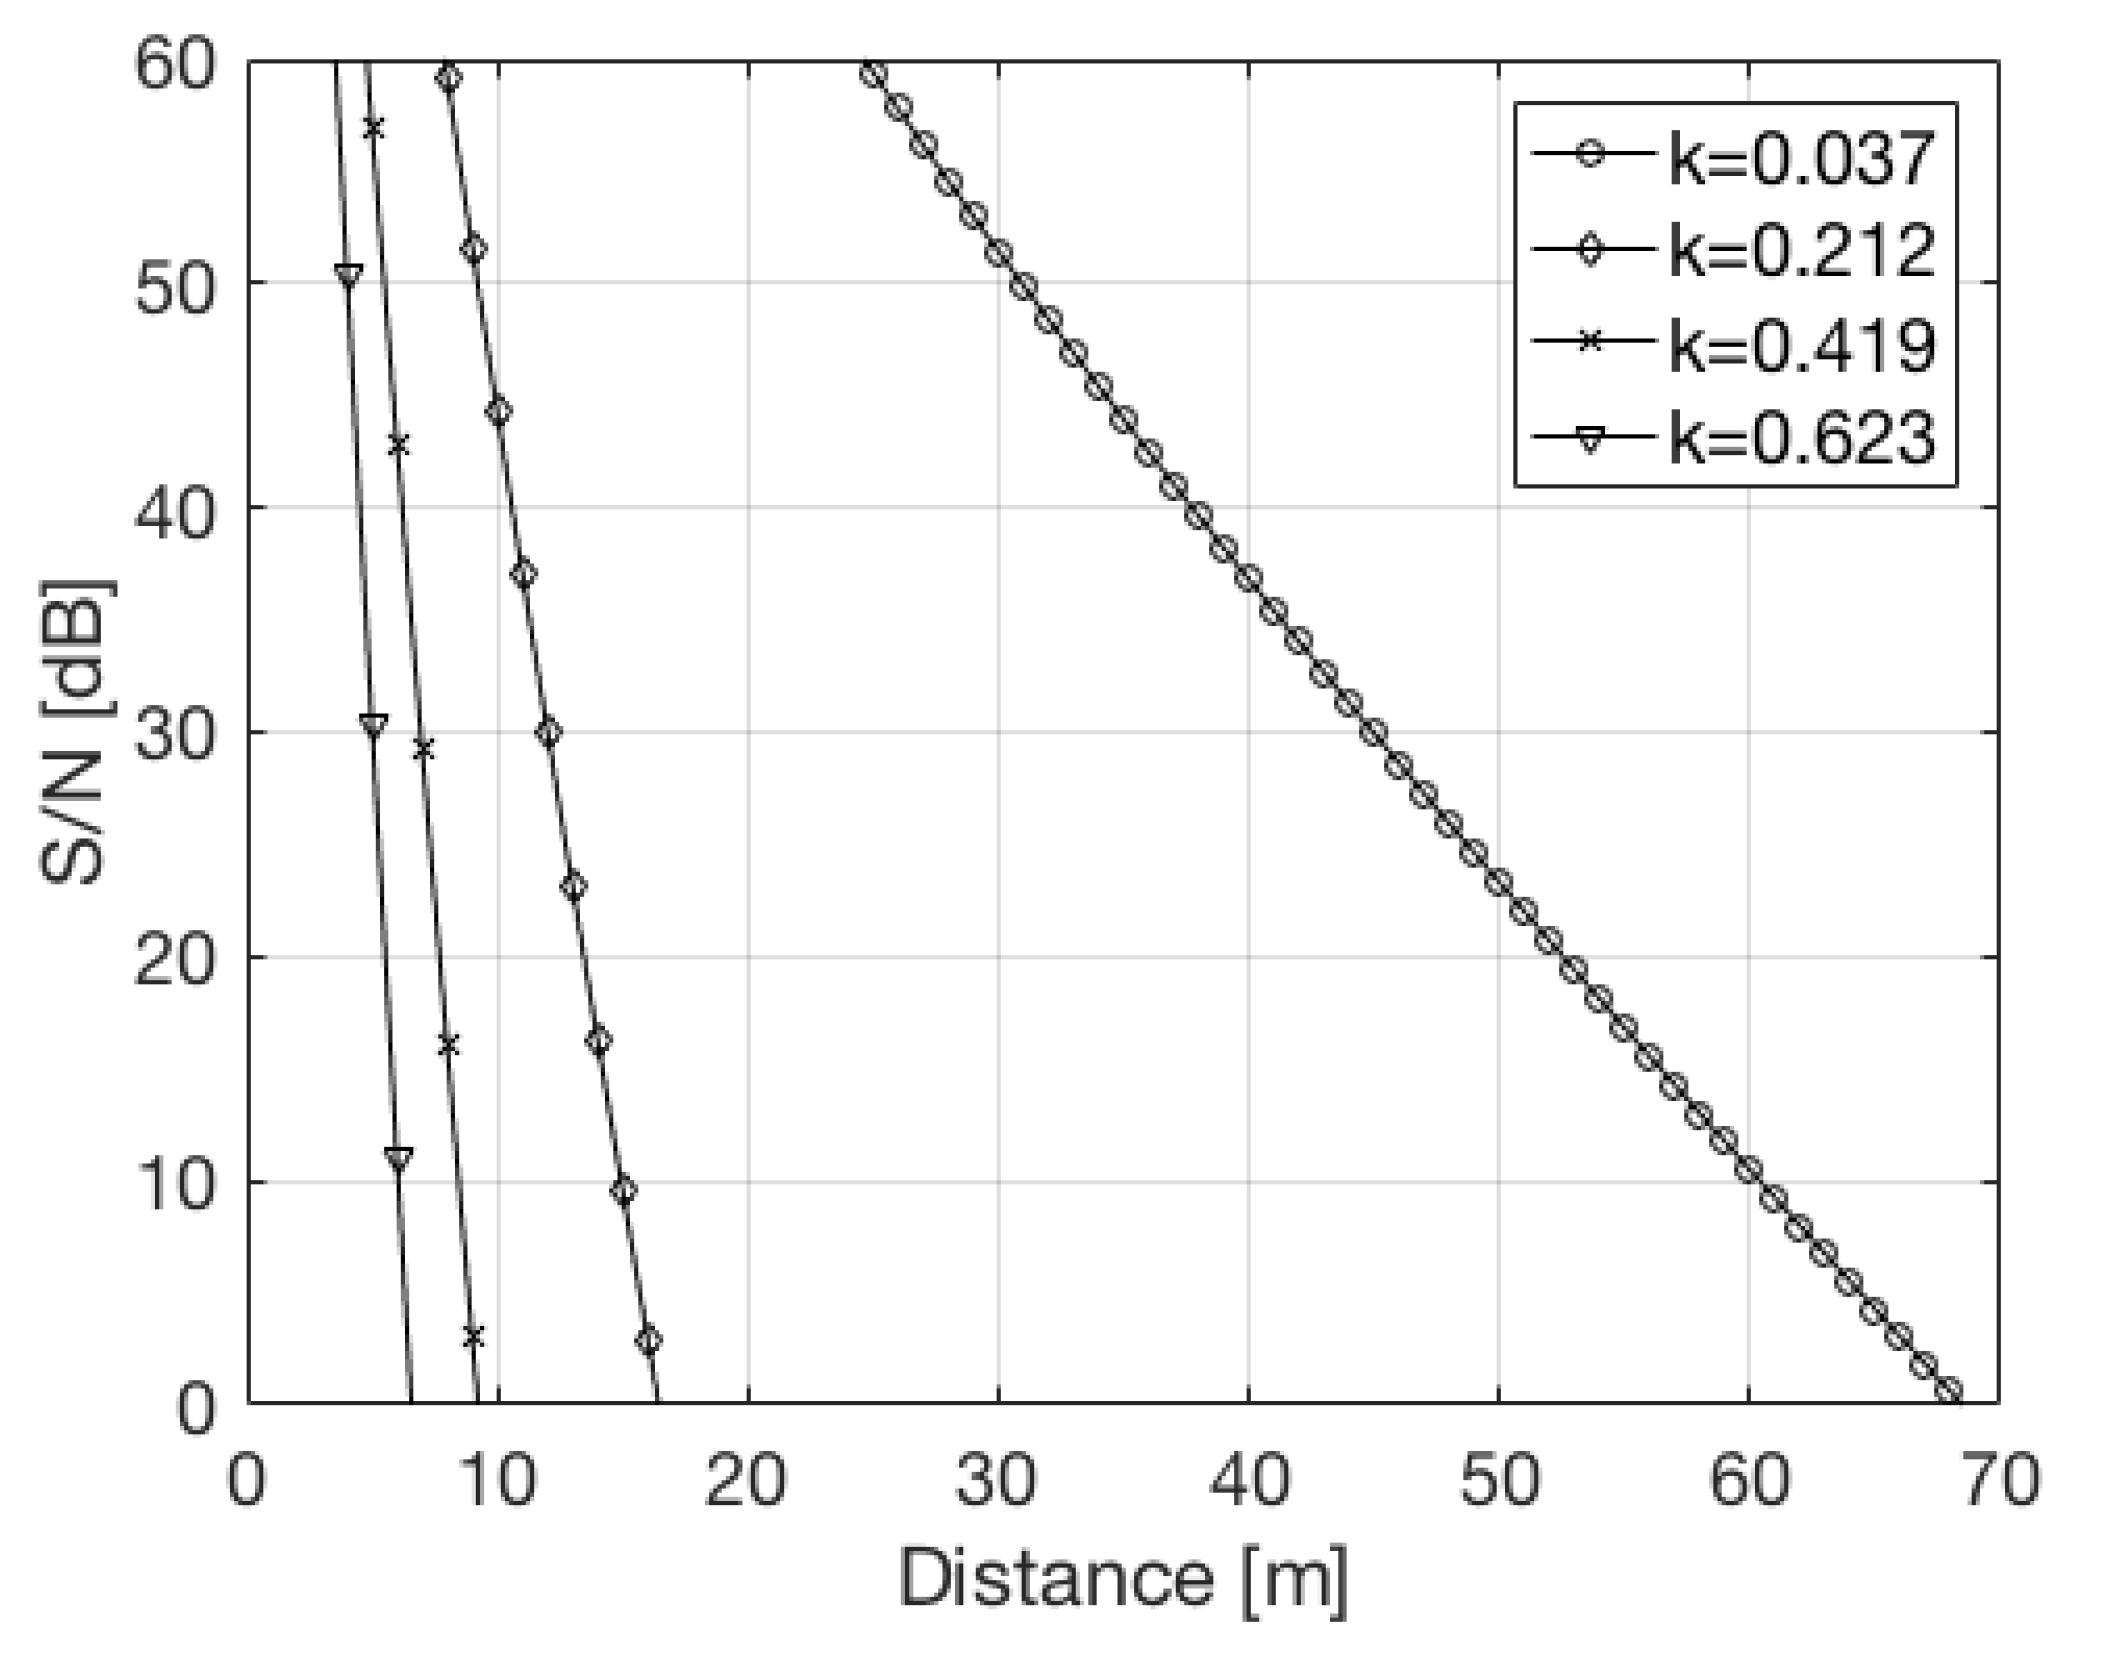
The term that contributes most to the NEP is the noise power accountable to the shot-noise of the received signal. Figure 5 shows the maximum achievable distance for a given SNR for different values of the diffuse attenuation coefficient K [17].
Considering an On–Off-Keying (OOK) modulation format and a equal to , we need at least 12 dB for an effective communication. As shown in Figure 5, this corresponds to a maximum achievable distance varying from m in the case of water with high turbidity m to m in the case of clear water m. The coefficient K depends on the wavelength used. In our case, we considered a wavelength in the range 470–525 nm.
5. Performance Evaluation of Underwater Network
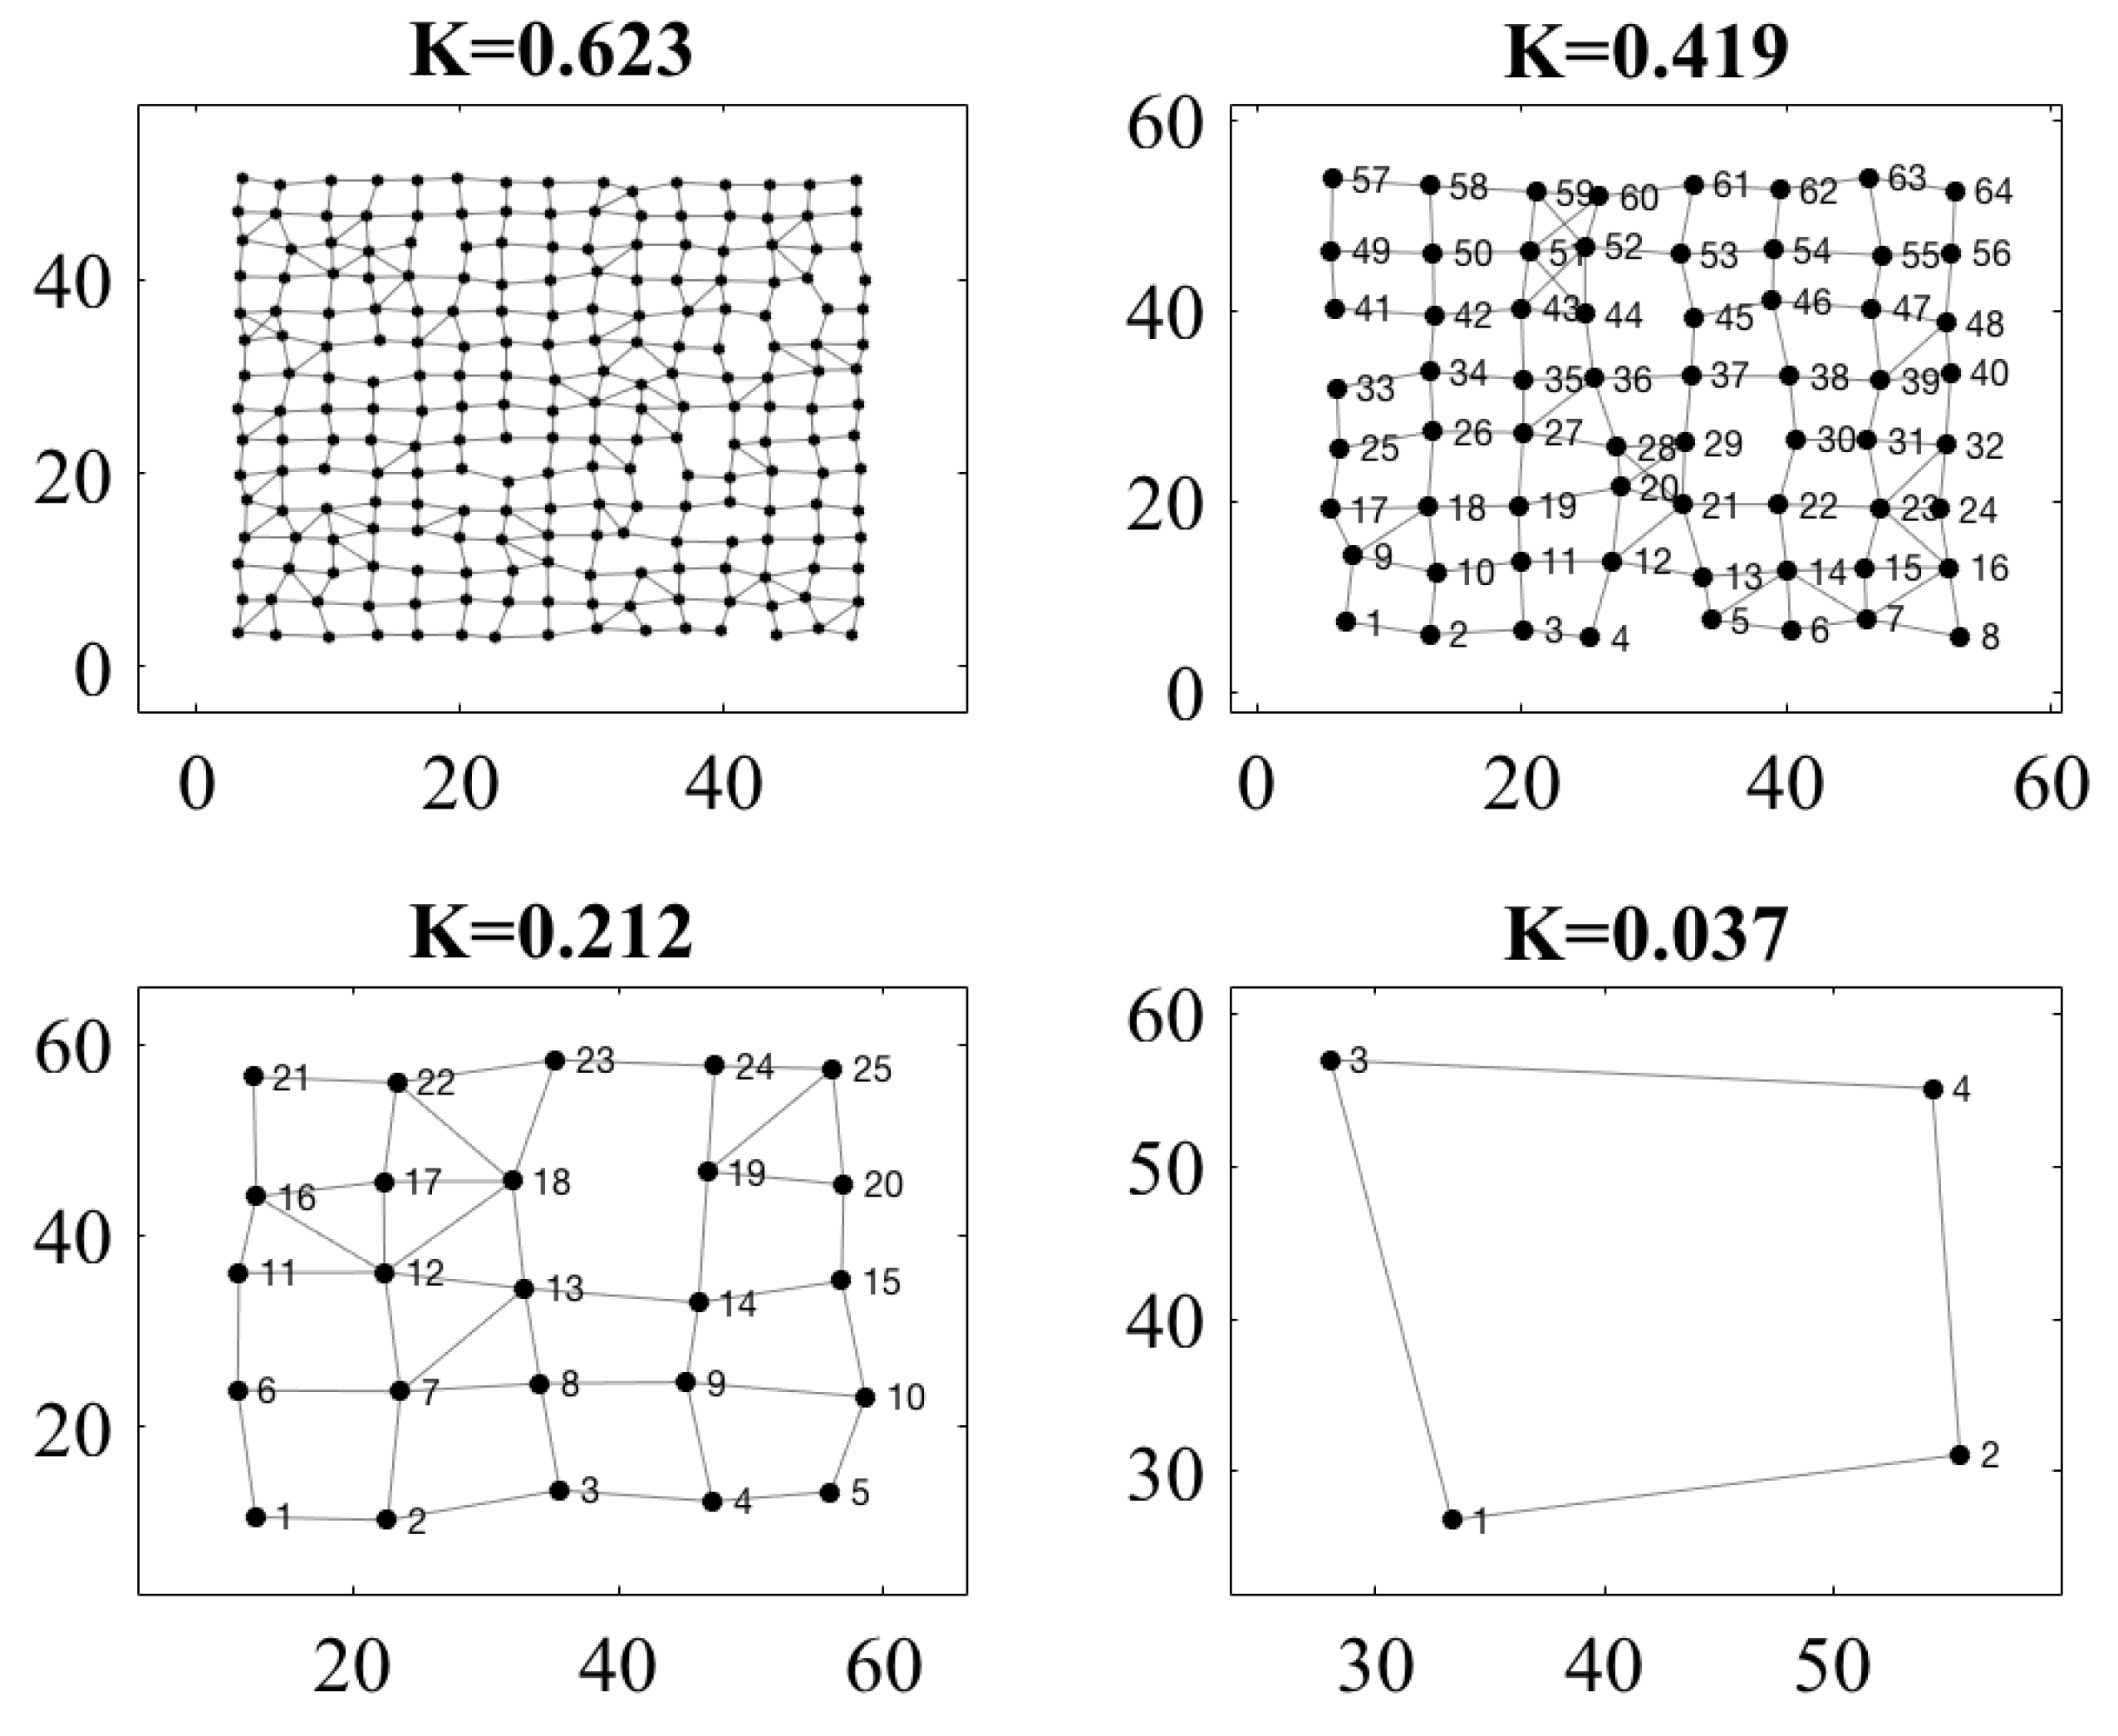
We carried out a set of simulations devised to assess the different performance of the optical and acoustical communication networks under different system and topology conditions. In particular, we assumed that the optical communication link can take place if nodes are within a given range, independently from the mutual position (angle) of the transmitter/receiver. Acoustical communication can be active as well but on a larger range and with a lower data rate. Simulations were performed using a custom numerical simulator, tuned with the parameters of the Venus device reported in Section 4. The considered network scenarios comprise a variable number of nodes that are spaced to cover a planar area. We evaluated performances of two network scenarios: a linear and a grid grid topology. In the linear topology, nodes were arranged on a line over 100 m while, in the grid topology, nodes were displaced in a regular grid to cover a 50 m × 50 m area. The average distance among nodes varied according to the turbidity of the water and was set to the maximum communication distance (DV) decreased by a margin of . Furthermore, a positioning error was considered to account for the possible estimation error of the AUV with respect to other nodes. The error was modeled as a bi-dimensional Gaussian random variable with , . Figure 6 shows an example of a generation of the grid topology for various values of the parameter K.
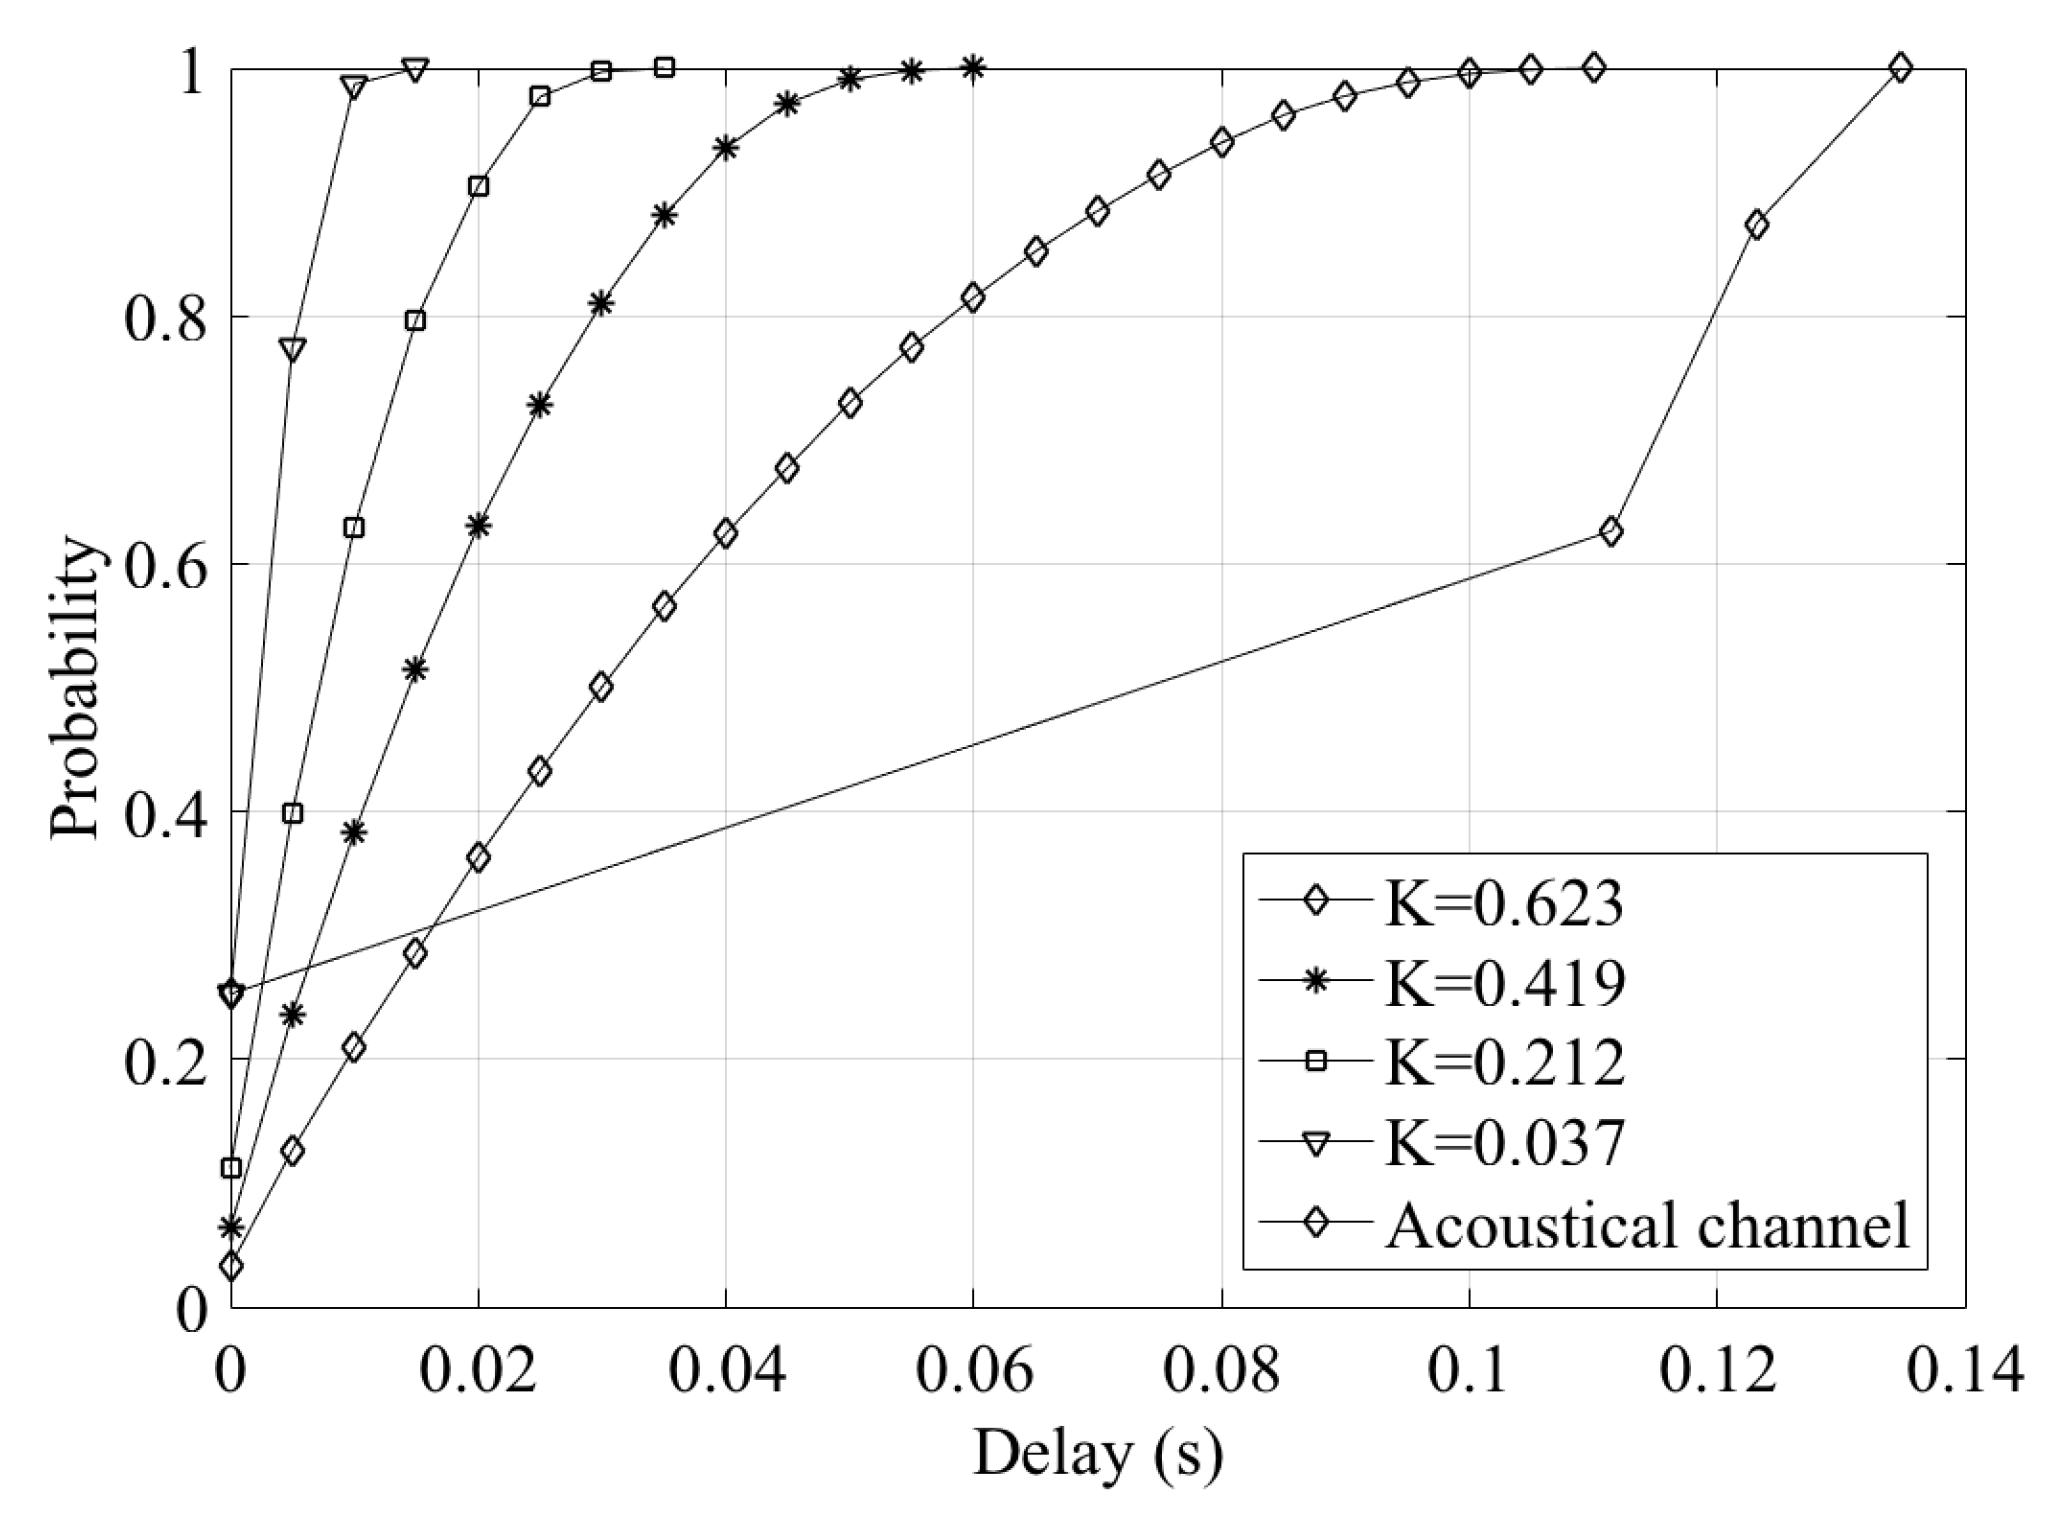
Networks delays: Figure 7 shows how the quality of water affects the delay performance of the network considering different topologies. Specifically, it reports the Cumulative Distribution Function (CDF) of the network delays under the following topological conditions. There is a variable number of nodes that must cover 100 m adopting a quasi-linear topology. The nodes are spaced on average by where D is the maximum range of optical transmission that depends on the turbidity of the water. Node position is affected by a Gaussian error with m. We selected a pair of nodes uniformly from the available ones and evaluated the delay of the multi-hop network communication. In Figure 7, variation of the turbidity of the water corresponds to a greater communication delay as a consequence of a greater number of nodes involved in relaying the communication from the source to the destination nodes. In the case of clear water (small K), we have a delay of about s while, in the case of high turbidity, the delay grows up to five times.
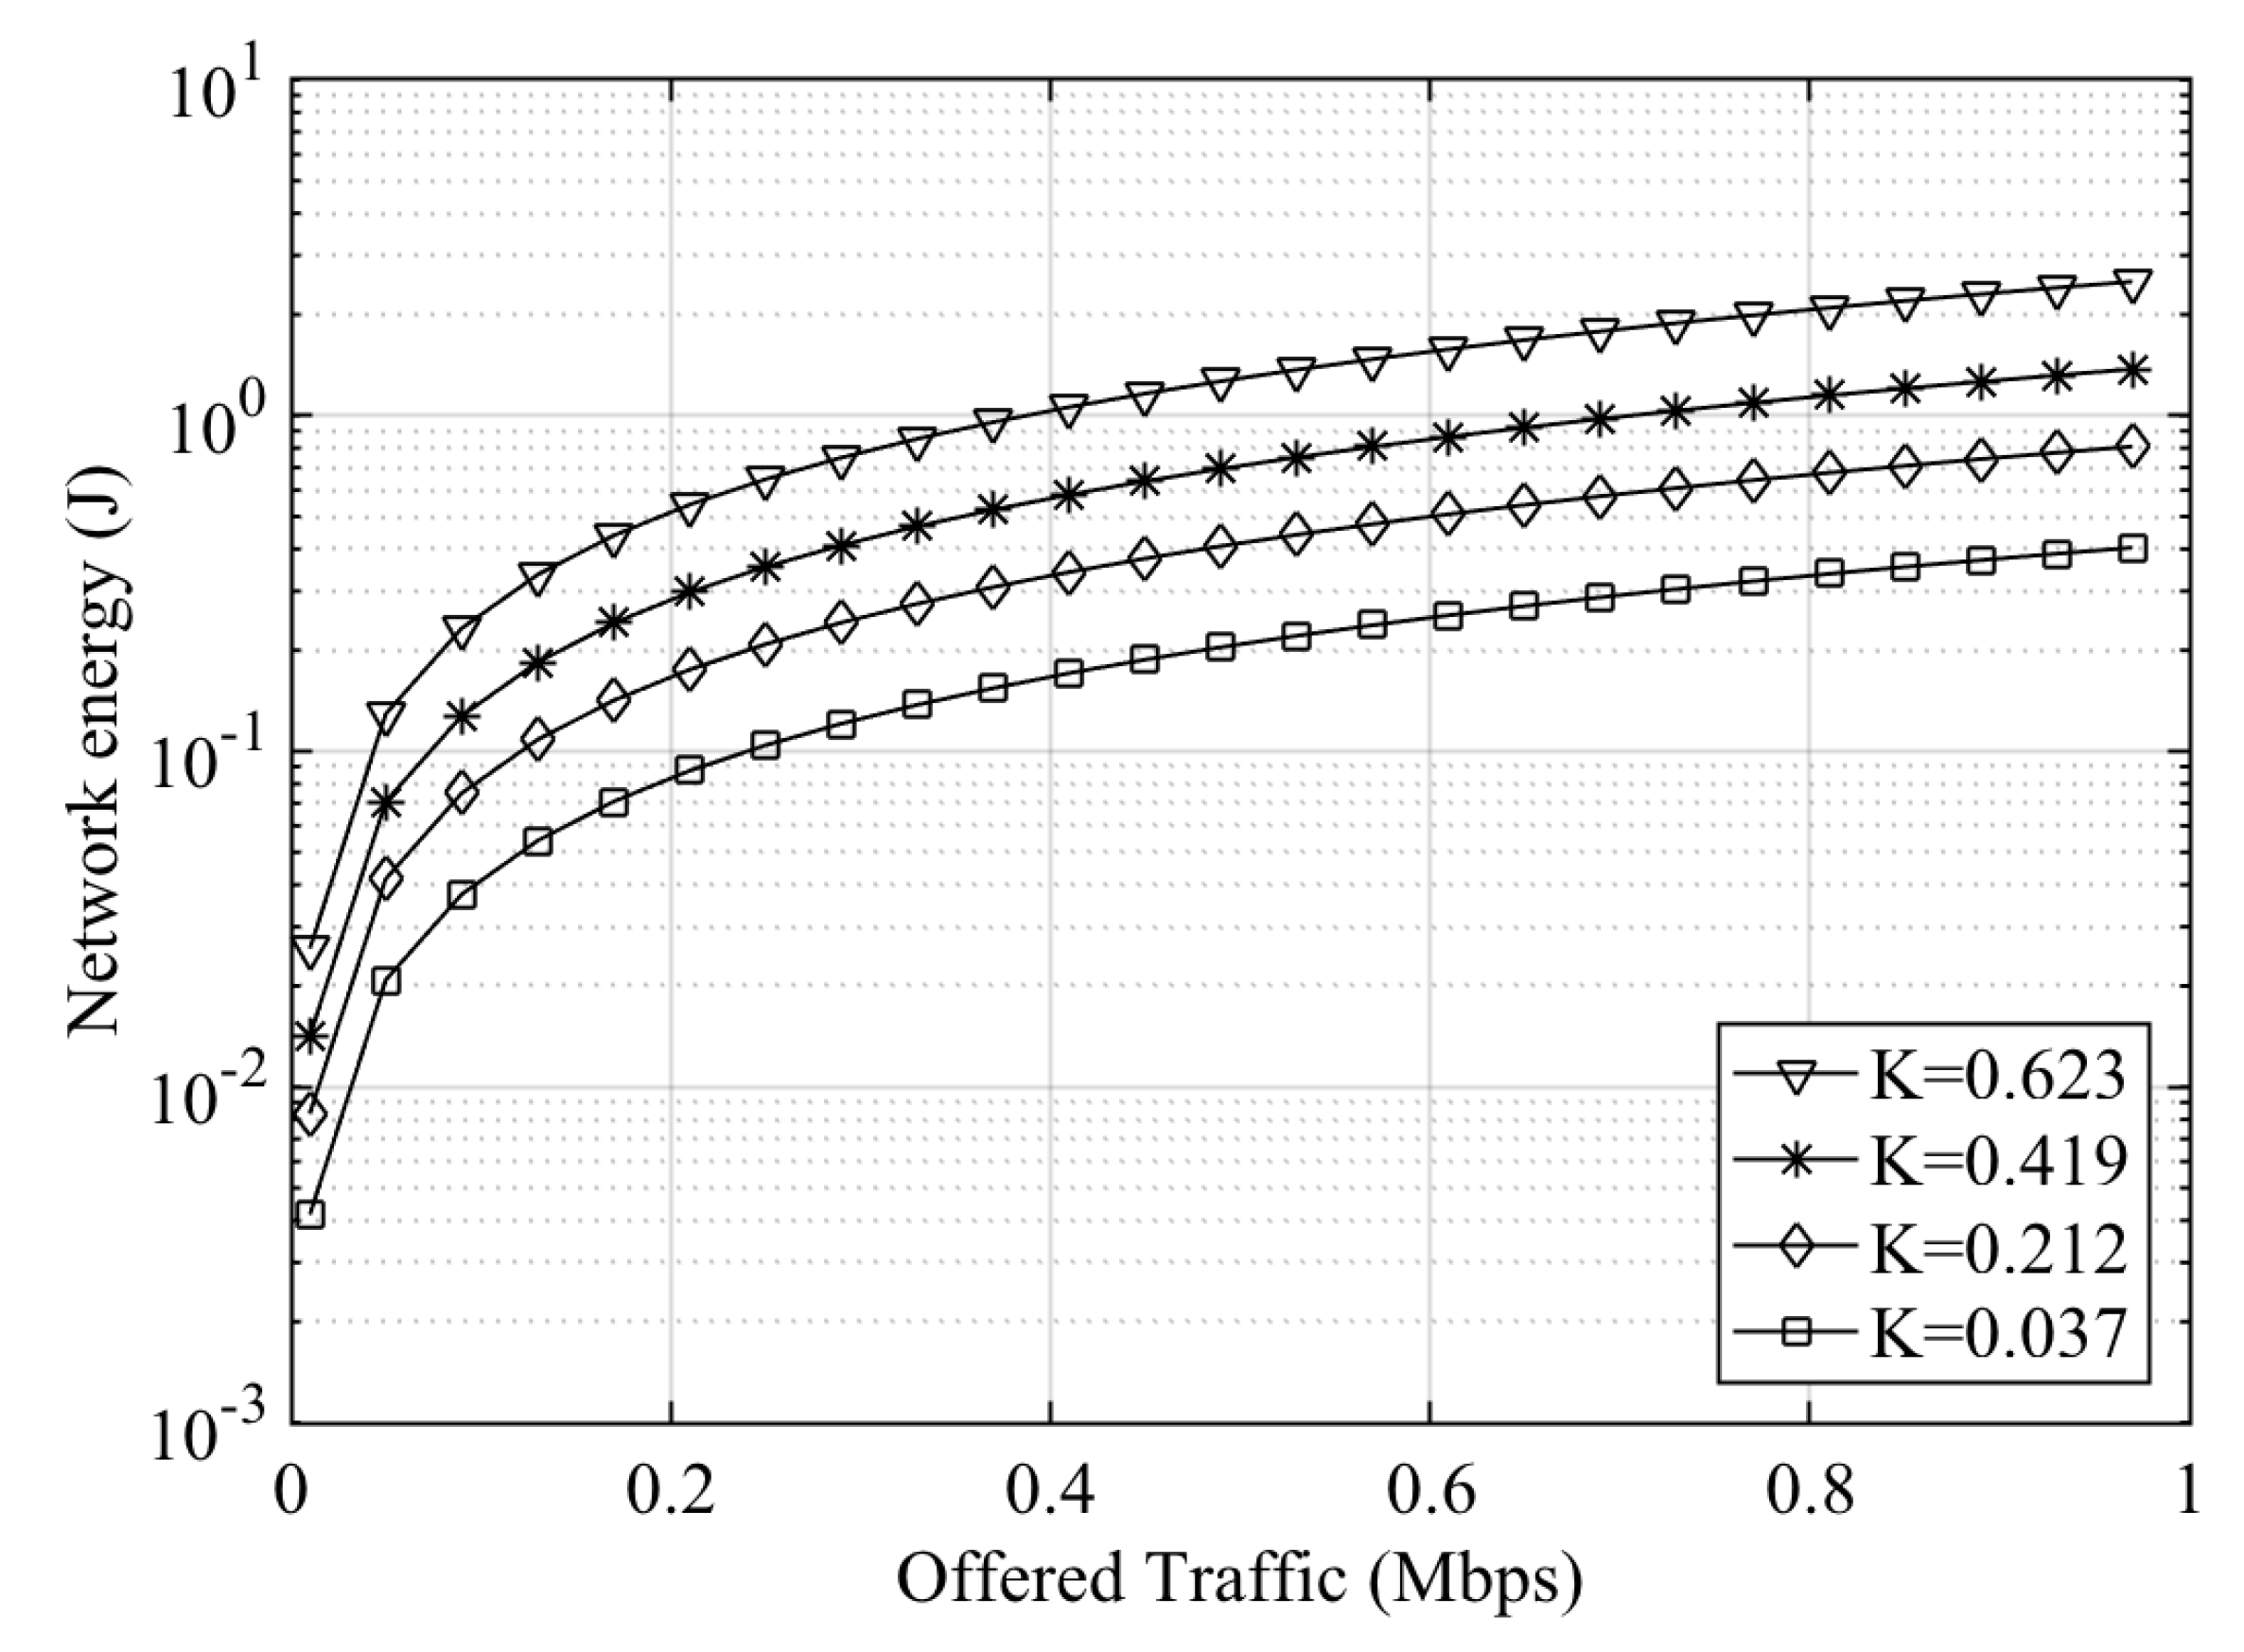
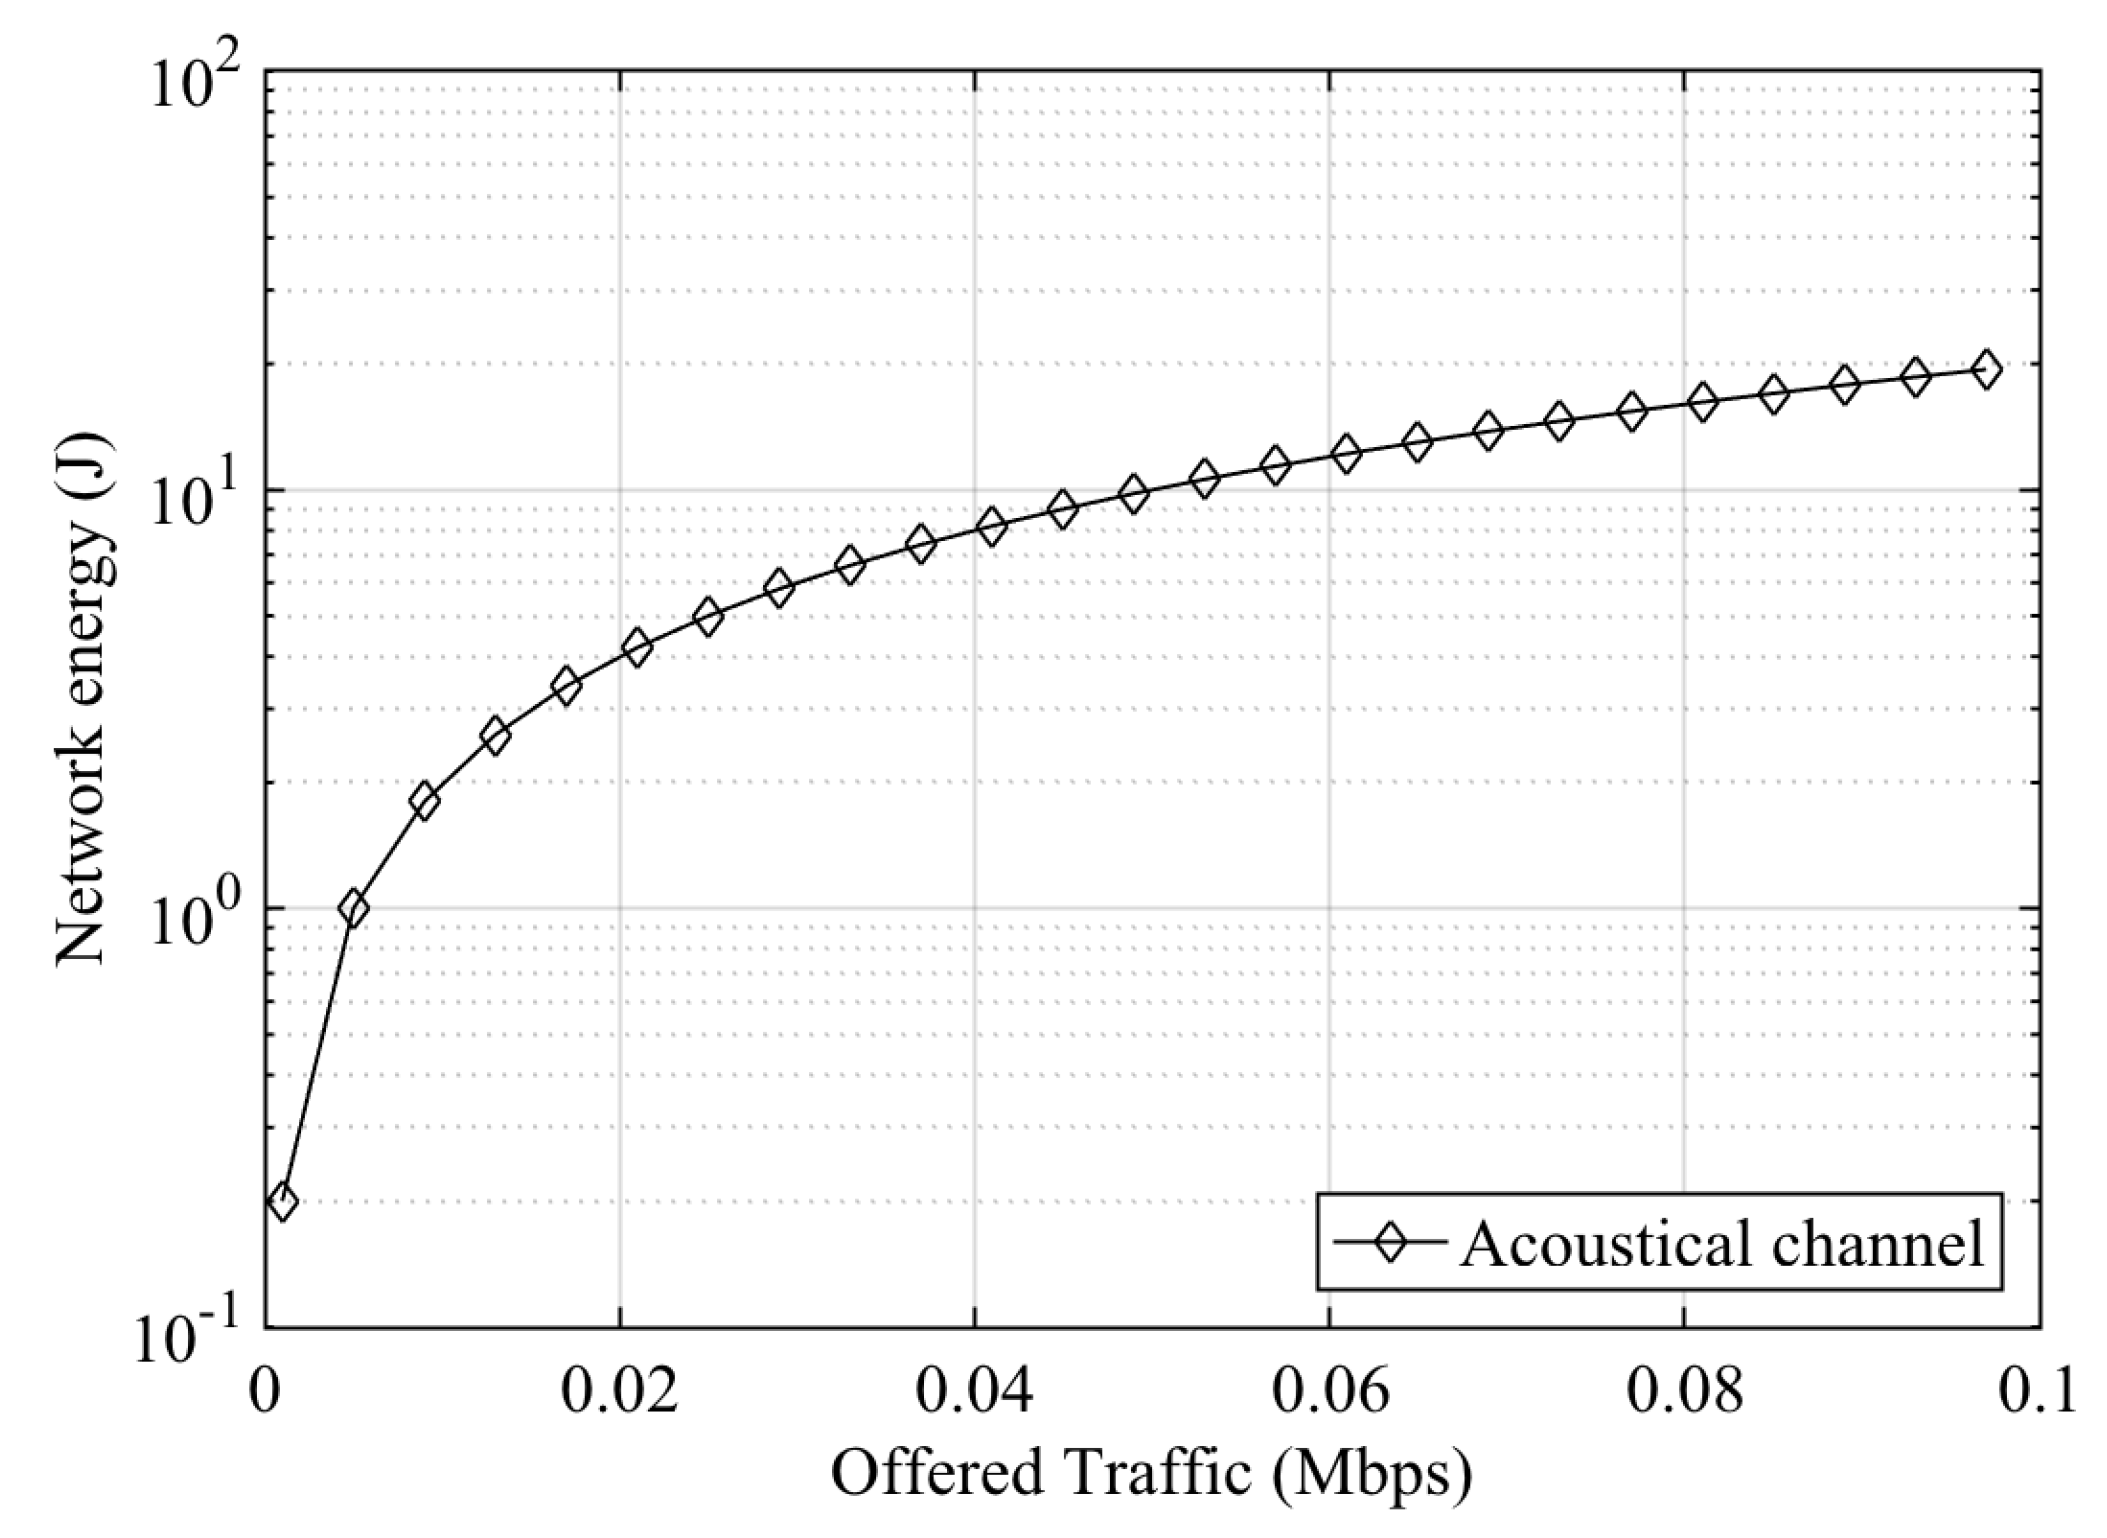
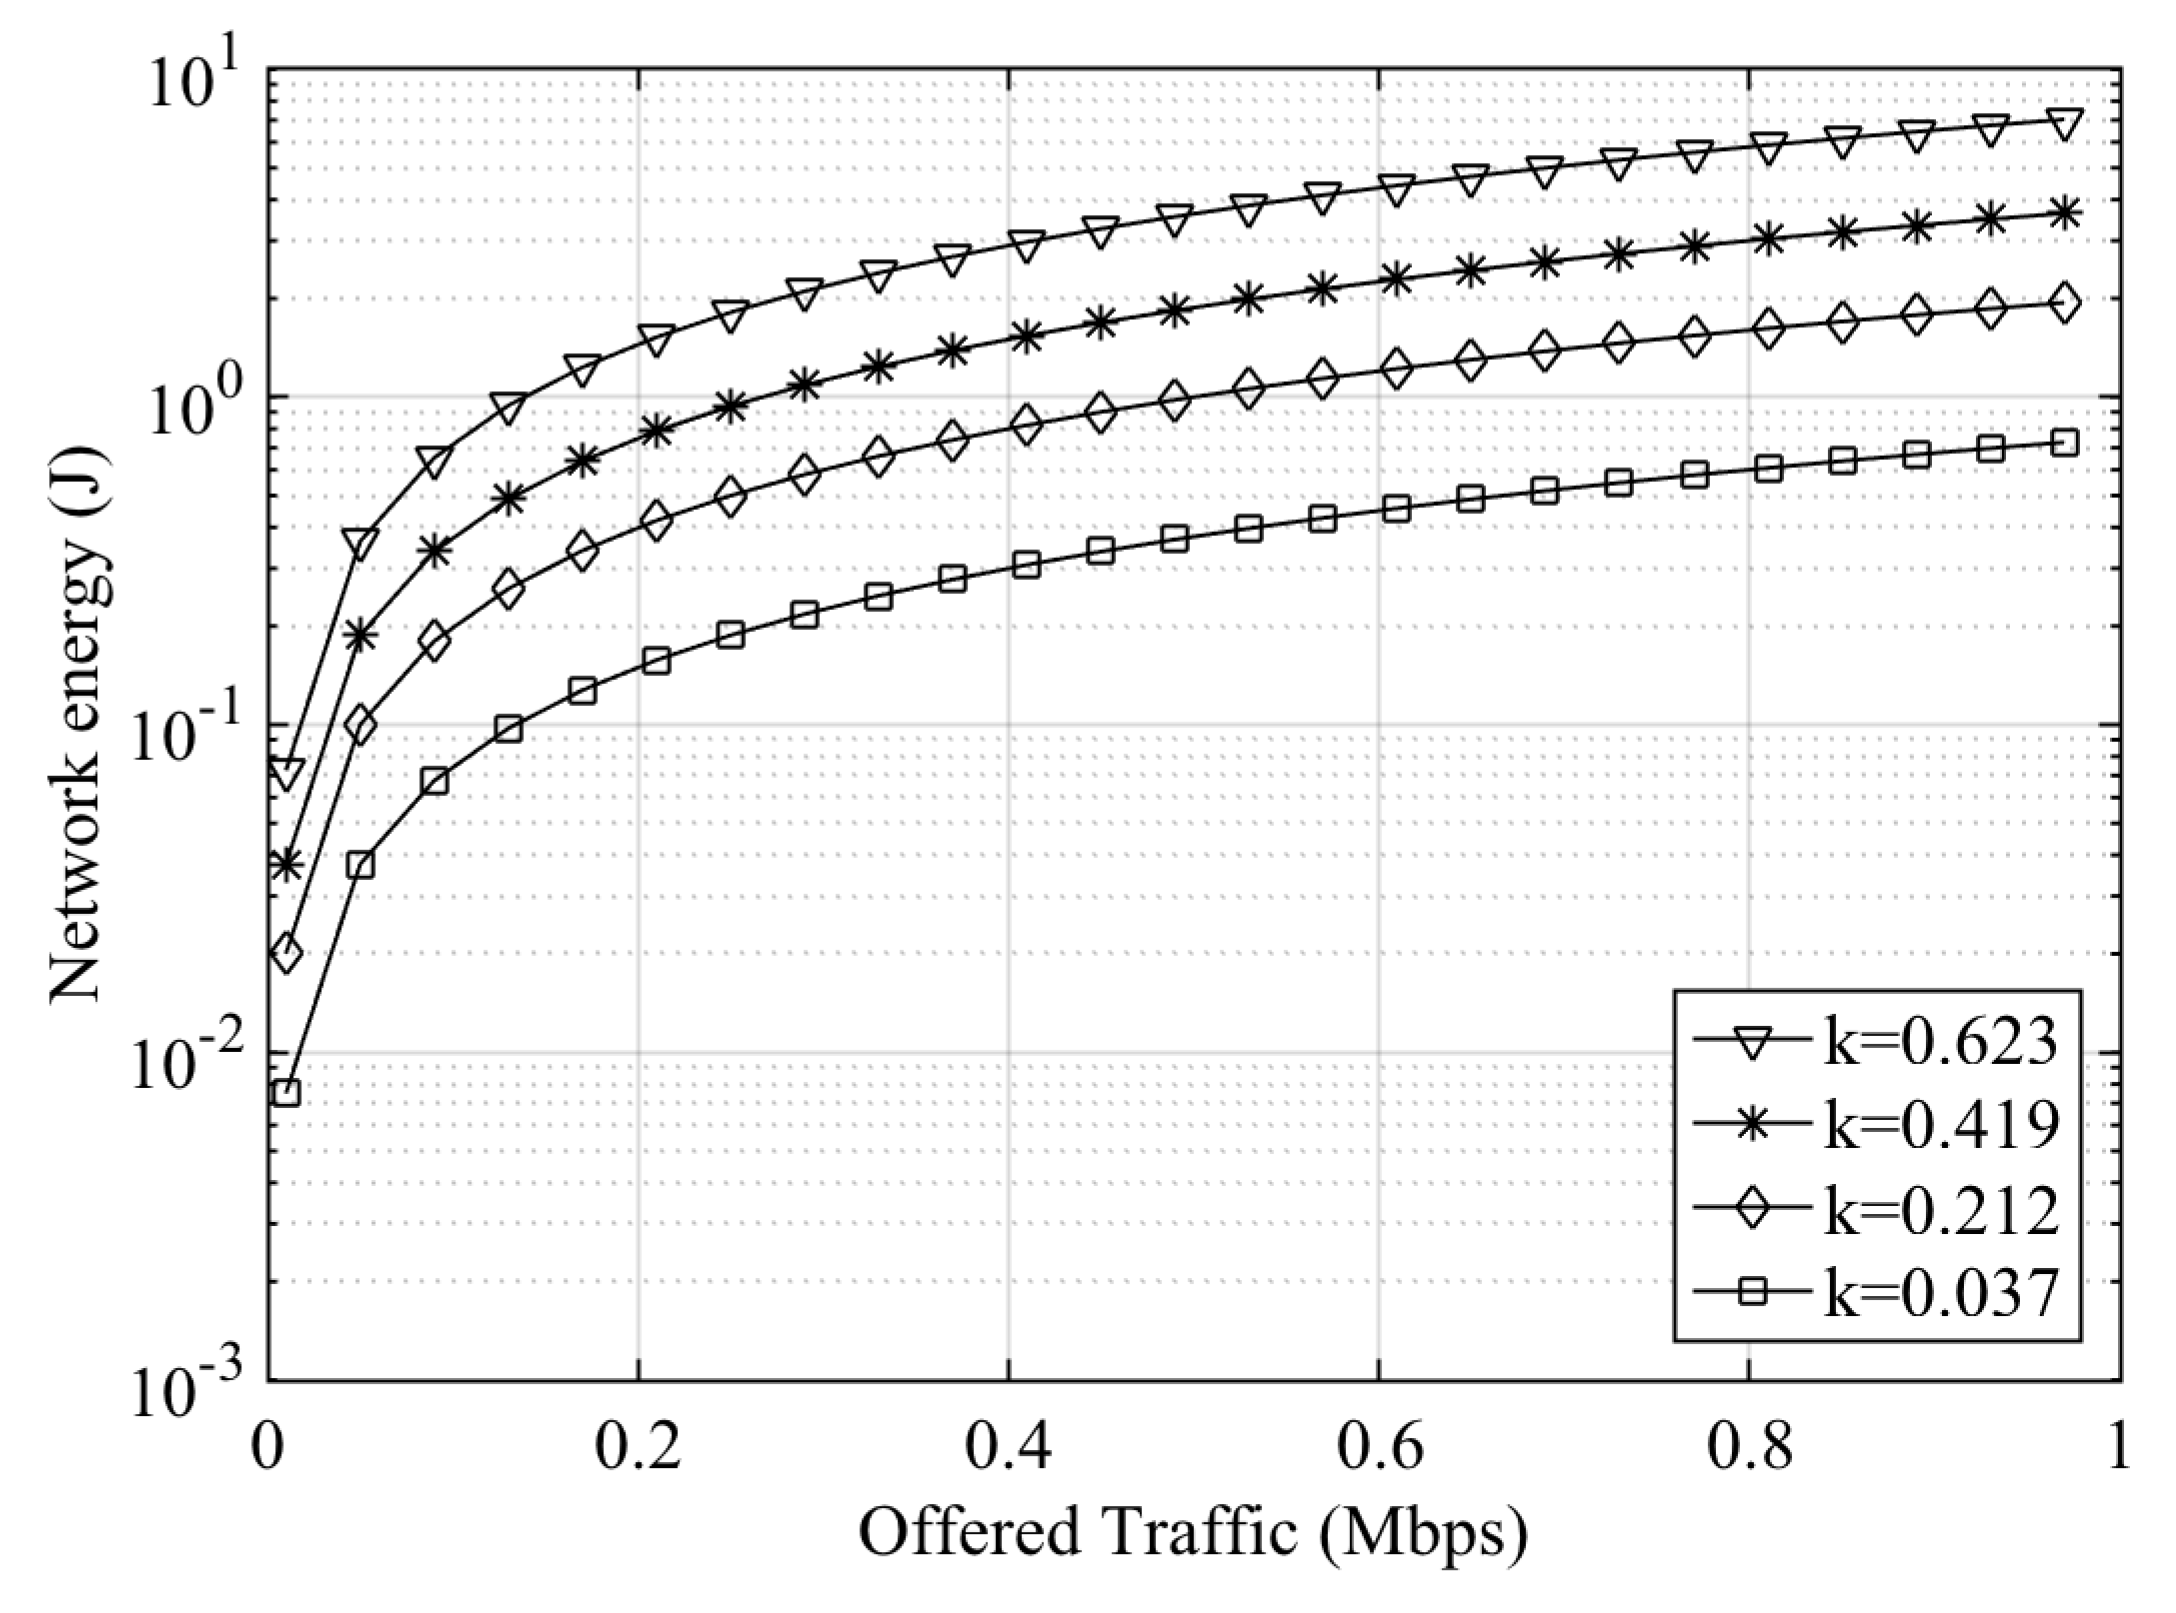
Energy for point to point transmissions: To evaluate the energy required to provide the multi-hop data transmission, we selected the same network scenario in which every node has to transmit a given amount of data (offered traffic). In Figure 8, there is almost one order of magnitude of difference in terms of required power for the different values of K. This is a fundamental parameter since the AUVs are battery powered and hence energy constrained. In Figure 9, we report the energy for a given data traffic for the single hop acoustic modem. Clearly, the required power is much larger with respect to the optical modem but does not depend on the water quality.
To compare the optical and acoustical modems, we report in Table 4 the average bit for Joule required for different optical communication links and for the acoustic communication. For each of the two technologies, we considered the typical value of the data rates and we calculated the total energy consumed normalized with respect to the data transmitted over a second. We considered different network topologies according to the values of K; for each topology, we evaluated the average number of hops required for a communication.
Acoustic communications emerge to be far more energy hungry than the optical one, even considering that for optical communication the shorter communication range implies the needs of multi-hop transmissions also in scenarios where a single acoustic data transmission suffices to cover the required communication range (up to ≈100 m).
Energy for broadcast transmissions: Figure 10 shows the performance in terms of total consumed energy for a network where all the nodes need to communicate periodically with all the remaining nodes using optical communication link. In particular, we considered a linear topology of 100 m with the same parameters as in the previous case. Broadcast was implemented with multiple optical point-to-point communication where the range of the optical communication varies according to the quality of the water expressed by the coefficient K. Broadcast communications are indeed used in many different underwater applications such as cooperative SLAM algorithm [18,19] and cooperative discovery algorithm [20], where the nodes must share data (e.g., covariance matrix) to improve their own estimation and thus the achieved performance.
6. Conclusions
In this study, we compared the performance of the acoustical and optical modems of the Venus AUV robot in different network simulated scenarios, using parameters coming from the real implementation of the vessel. We analyzed the power consumption and the delay in the case of linear topologies and evaluated how the optical communication performance varies according to the quality (turbidity) of the water expressed by the diffuse attenuation coefficient K. The use of an optical communication link presents a sensible, lower power consumption, allowing communication with bit/J with respect to bit/J of the acoustic case. A simulation campaign shows that this holds also under different network simulated topologies and considering multi-hop communication where the optical communication range (4 to m with a SNR of 12 dB) is far less than the acoustic communication range (typically 100 m).
Author Contributions
Networking and simulations, P.L. and L.B.; Dual channel modem , C.L. and S.B.;
Acknowledgments
The Authors wish to thank Claudio Moriconi for his helpful suggestions.
Conflicts of Interest
The authors declare no conflict of interest.
References
- Wynn, R.B.; Huvenne, V.A.; Le Bas, T.P.; Murton, B.J.; Connelly, D.P.; Bett, B.J.; Ruhl, H.A.; Morris, K.J.; Peakall, J.; Parsons, D.R.; et al. Autonomous Underwater Vehicles (AUVs): Their past, present and future contributions to the advancement of marine geoscience. Mar. Geol. 2014, 352, 451–468. [Google Scholar] [CrossRef] [Green Version]
- Sendra, S.; Lloret, J.; Jimenez, J.M.; Parra, L. Underwater acoustic modems. IEEE Sens. J. 2016, 16, 4063–4071. [Google Scholar] [CrossRef]
- Lloret, J. Underwater sensor nodes and networks. Sensors 2013, 13, 11782–11796. [Google Scholar] [CrossRef] [PubMed]
- Felemban, E.; Shaikh, F.K.; Qureshi, U.M.; Sheikh, A.A.; Qaisar, S.B. Underwater sensor network applications: A comprehensive survey. Int. J. Distrib. Sens. Netw. 2015, 11, 896832. [Google Scholar] [CrossRef]
- Tabacchiera, M.; Persia, S.; Cidronelli, P.; Betti, S. Routing optimization for underwater optical networks in swarm configuration. Microw. Opt. Technol. Lett. 2014, 56, 34–38. [Google Scholar] [CrossRef]
- Kaushal, H.; Kaddoum, G. Underwater optical wireless communication. IEEE Access 2016, 4, 1518–1547. [Google Scholar] [CrossRef]
- Vasilescu, I.; Kotay, K.; Rus, D.; Dunbabin, M.; Corke, P. Data collection, storage, and retrieval with an underwater sensor network. In Proceedings of the 3rd ACM International Conference on Embedded Networked Sensor Systems, San Diego, CA, USA, 2–4 November 2005; pp. 154–165. [Google Scholar]
- Han, S.; Chen, R.; Noh, Y.; Gerla, M. Real-time video streaming from mobile underwater sensors. In Proceedings of the ACM International Conference on Underwater Networks &, Systems, Rome, Italy, 12–14 November 2014; p. 21. [Google Scholar]
- Zeng, Z.; Fu, S.; Zhang, H.; Dong, Y.; Cheng, J. A survey of underwater optical wireless communications. IEEE Commun. Surv. Tutor. 2017, 19, 204–238. [Google Scholar] [CrossRef]
- Saeed, N.; Celik, A.; Al-Naffouri, T.Y.; Alouini, M.S. Energy Harvesting Hybrid Acoustic-Optical Underwater Wireless Sensor Networks Localization. Sensors 2017, 18, 51. [Google Scholar] [CrossRef] [PubMed]
- Han, S.; Noh, Y.; Liang, R.; Chen, R.; Cheng, Y.J.; Gerla, M. Evaluation of underwater optical-acoustic hybrid network. China Commun. 2014, 11, 49–59. [Google Scholar]
- Doniec, M.; Rus, D. BiDirectional optical communication with AquaOptical II. In Proceedings of the 2010 IEEE International Conference on Communication Systems (ICCS), Singapore, 17–19 November 2010; pp. 390–394. [Google Scholar]
- Campagnaro, F.; Guerra, F.; Casari, P.; Diamant, R.; Zorzi, M. Implementation of a multi-modal acoustic-optical underwater network protocol stack. In Proceedings of the IEEE OCEANS 2016-Shanghai, Shanghai, China, 10–13 April 2016; pp. 1–6. [Google Scholar]
- Farr, N.; Bowen, A.; Ware, J.; Pontbriand, C.; Tivey, M. An integrated, underwater optical/acoustic communications system. In Proceedings of the IEEE OCEANS 2010 IEEE-Sydney, Sydney, NSW, Australia, 24–27 May 2010; pp. 1–6. [Google Scholar]
- Moriconi, C.; Cupertino, G.; Betti, S.; Tabacchiera, M. Hybrid acoustic/optic communications in underwater swarms. In Proceedings of the OCEANS 2015—Genova, Genoa, Italy, 18–21 May 2015; p. 1. [Google Scholar] [CrossRef]
- Tabacchiera, M.; Marchetti, E.; Betti, S.; Persia, S. Configurations effects over Swarm Underwater Acoustic Network Performance. In Proceedings of the SENSORCOMM 2012, The Sixth International Conference on Sensor Technologies and Applications, IARIA, Rome, Italy, 19–24 August 2012; pp. 321–326. [Google Scholar]
- Giles, J.W.; Bankman, I.N. Underwater optical communications systems. Part 2: Basic design considerations. In Proceedings of the IEEE Military Communications Conference MILCOM 2005, Atlantic City, NJ, USA, 17–20 October 2005; pp. 1700–1705. [Google Scholar]
- Paull, L.; Huang, G.; Seto, M.; Leonard, J.J. Communication-constrained multi-AUV cooperative SLAM. In Proceedings of the 2015 IEEE International Conference on Robotics and Automation (ICRA), Seattle, WA, USA, 26–30 May 2015; pp. 509–516. [Google Scholar]
- Pfingsthorn, M.; Birk, A.; Vaskevicius, N.; Pathak, K. Cooperative 3d mapping under underwater communication constraints. In Proceedings of the IEEE OCEANS 2011, Waikoloa, HI, USA, 19–22 September 2011; pp. 1–9. [Google Scholar]
- Burgard, W.; Moors, M.; Fox, D.; Simmons, R.; Thrun, S. Collaborative multi-robot exploration. In Proceedings of the 2000 ICRA, Millennium Conference, IEEE International Conference on Robotics and Automation, San Francisco, CA, USA, 24–28 April 2000; Volome 1, pp. 476–481. [Google Scholar]
Figure 1.
Example of a AUV mission: The goal is to monitoring a oil pipeline.

Figure 2.
The Venus AUV—realized by ENEA [15].
Figure 2.
The Venus AUV—realized by ENEA [15].

Figure 3.
Error probability as a function of SNR in case of Gaussian and Rayleigh channels and 8-FSK modulation.
Figure 3.
Error probability as a function of SNR in case of Gaussian and Rayleigh channels and 8-FSK modulation.

Figure 4.
Maximum distance for a given in case of acoustic communication.

Figure 5.
Maximum achievable distance for a given SNR for different diffuse attenuation coefficient K.
Figure 5.
Maximum achievable distance for a given SNR for different diffuse attenuation coefficient K.

Figure 6.
Example of node grid networks for different diffuse attenuation coefficient K. (Axes are in meters).
Figure 6.
Example of node grid networks for different diffuse attenuation coefficient K. (Axes are in meters).

Figure 7.
Delay distribution probability of randomly selected pair of nodes, in the case of a linear topology.
Figure 7.
Delay distribution probability of randomly selected pair of nodes, in the case of a linear topology.

Figure 8.
Energy consumption in the case of communication among randomly selected peers on a linear topology.
Figure 8.
Energy consumption in the case of communication among randomly selected peers on a linear topology.

Figure 9.
Energy consumption in the case of communication among randomly selected peers on a linear topology—Acoustic.
Figure 9.
Energy consumption in the case of communication among randomly selected peers on a linear topology—Acoustic.

Figure 10.
Broadcast energy consumption in the case of optical communication.


Table 1.
Main difference of acoustic and optic underwater communication (order of magnitude).
| Acoustic | Optical | |
|---|---|---|
| Bitrate | 100 kbps | 10 Mbps |
| Distance | 100 m | 10 m |
| Delay | s/m | s/m |
| Energy consumption | 10 W | 100 mW |
Table 2.
MAUV Venus main features.
| Parameter | Value |
|---|---|
| length | 1 m |
| diameter | 20 cm |
| min distance | 3 m |
| average speed | 1 m/s |
| engine power | 70 W |
Table 3.
Main NEP contributions.
| NEP Contribution | Description | Value |
|---|---|---|
| Noise power accountable to the shot-noise for the solar irradiation | W | |
| Noise power accountable to the shot-noise of the received signal | W | |
| Noise power accountable to the shot-noise of the dark current of the photo-diode | W | |
| Noise power accountable to the current of the pre-amplifier | W |
Table 4.
Average bit/Joule efficiency.
| Type | Max Distance | Data Rate | Avg Bit/Joule | Avg n Hops |
|---|---|---|---|---|
| Acoustic | 100 m | 100 kbit/s | 1 | |
| Optical (K = 0.623) | 5.9 m | 2 Mbit/s | 9.0 | |
| Optical (K = 0.419) | 8.3 m | 2 Mbit/s | 4.8 | |
| Optical (K = 0.212) | 14.6 m | 2 Mbit/s | 3.0 | |
| Optical (K = 0.037) | 58.7 m | 2 Mbit/s | 1.3 |
© 2018 by the authors. Licensee MDPI, Basel, Switzerland. This article is an open access article distributed under the terms and conditions of the Creative Commons Attribution (CC BY) license (http://creativecommons.org/licenses/by/4.0/).
Share and Cite
MDPI and ACS Style
Lodovisi, C.; Loreti, P.; Bracciale, L.; Betti, S. Performance Analysis of Hybrid Optical–Acoustic AUV Swarms for Marine Monitoring. Future Internet 2018, 10, 65. https://doi.org/10.3390/fi10070065
AMA Style
Lodovisi C, Loreti P, Bracciale L, Betti S. Performance Analysis of Hybrid Optical–Acoustic AUV Swarms for Marine Monitoring. Future Internet. 2018; 10(7):65. https://doi.org/10.3390/fi10070065
Chicago/Turabian StyleLodovisi, Chiara, Pierpaolo Loreti, Lorenzo Bracciale, and Silvello Betti. 2018. "Performance Analysis of Hybrid Optical–Acoustic AUV Swarms for Marine Monitoring" Future Internet 10, no. 7: 65. https://doi.org/10.3390/fi10070065
Note that from the first issue of 2016, this journal uses article numbers instead of page numbers. See further details here.