Review

Ontology Alignment—A Survey with Focus on Visually Supported Semi-Automatic Techniques

1
Know-Center GmbH, Inffeldgasse 21a, 8010 Graz, Austria
2
MIMOS Berhad Technology Park Malaysia, 57000 Kuala Lumpur, Malaysia
3
Graz University of Technology, Inffeldgasse 21a, 8010 Graz, Austria
4
ZBW, Leibniz-Information Centre for Economy, University Kiel, Düsternbrooker Weg 120, 24105 Kiel, Germany
*
Author to whom correspondence should be addressed.
Future Internet 2010, 2(3), 238-258; https://doi.org/10.3390/fi2030238
Submission received: 1 July 2010 / Revised: 27 July 2010 / Accepted: 29 July 2010 / Published: 4 August 2010
(This article belongs to the Special Issue Metadata and Markup)

Abstract

:
Semantic technologies are of paramount importance to the future Internet. The reuse and integration of semantically described resources, such as data or services, necessitates the bringing of ontologies into mutual agreement. Ontology alignment deals with the discovery of correspondences between concepts and relations from different ontologies. Alignment provides the key ingredient to semantic interoperability. This paper gives an overview on the state of the art in the field of visually supported semi-automatic alignment techniques and presents recent trends and developments. Particular attention is given to user interfaces and visualization techniques supporting involvement of humans in the alignment process. We derive and summarize requirements for visual semi-automatic alignment systems, provide an overview of existing approaches, and discuss the possibilities for further improvements and future research.

1. Introduction

Representation and use of knowledge is gaining importance in various computer science disciplines. Based on ontologies, the so-called semantic technologies allow the externalization of knowledge and the computation with knowledge in huge, decentralized systems, for example, the Web. Herein, an ontology is an abstract model representing the real world [1] consisting of a formally organized set of concepts (or entities), attributes (which define properties of concepts), relations (which define relationships between concepts) and rules (or axioms, which define boundary conditions on entities, attributes, and relations). In contrast to traditional technologies, where knowledge is typically woven into data and software, systems based on semantic technologies employ ontologies as “external” carriers of knowledge. The main advantage of this approach is that ontologies make sharing and reuse of knowledge possible. However problems arise when integration of systems is attempted which use different ontologies to express “the same” knowledge. Since ontologies are merely a representation of reality, they will differ due to different requirements, vocabularies, modeling conventions, and also because of the subjective views of knowledge possessed by the engineers who created them.
Ontology mediation is an umbrella term covering various techniques involved in overcoming differences between ontologies with the aim of allowing their reuse. Mediation is central to enabling collaboration and integration of systems using different ontologies. This is because interoperability between ontologies and between the systems that use them, become possible only when different ontologies are brought into mutual accord. Application domains include semantic service integration, semantic agent information exchange, ontology-driven data integration, information retrieval from semantically described heterogeneous databases, personalized information delivery, and many others. Ontology mediation consists of the following [2] (note that in the literature, differences in the definitions of these terms may be encountered):
  • Ontology mapping deals with relating concepts from different ontologies and is typically concerned with the representation and storage of mappings between the concepts.
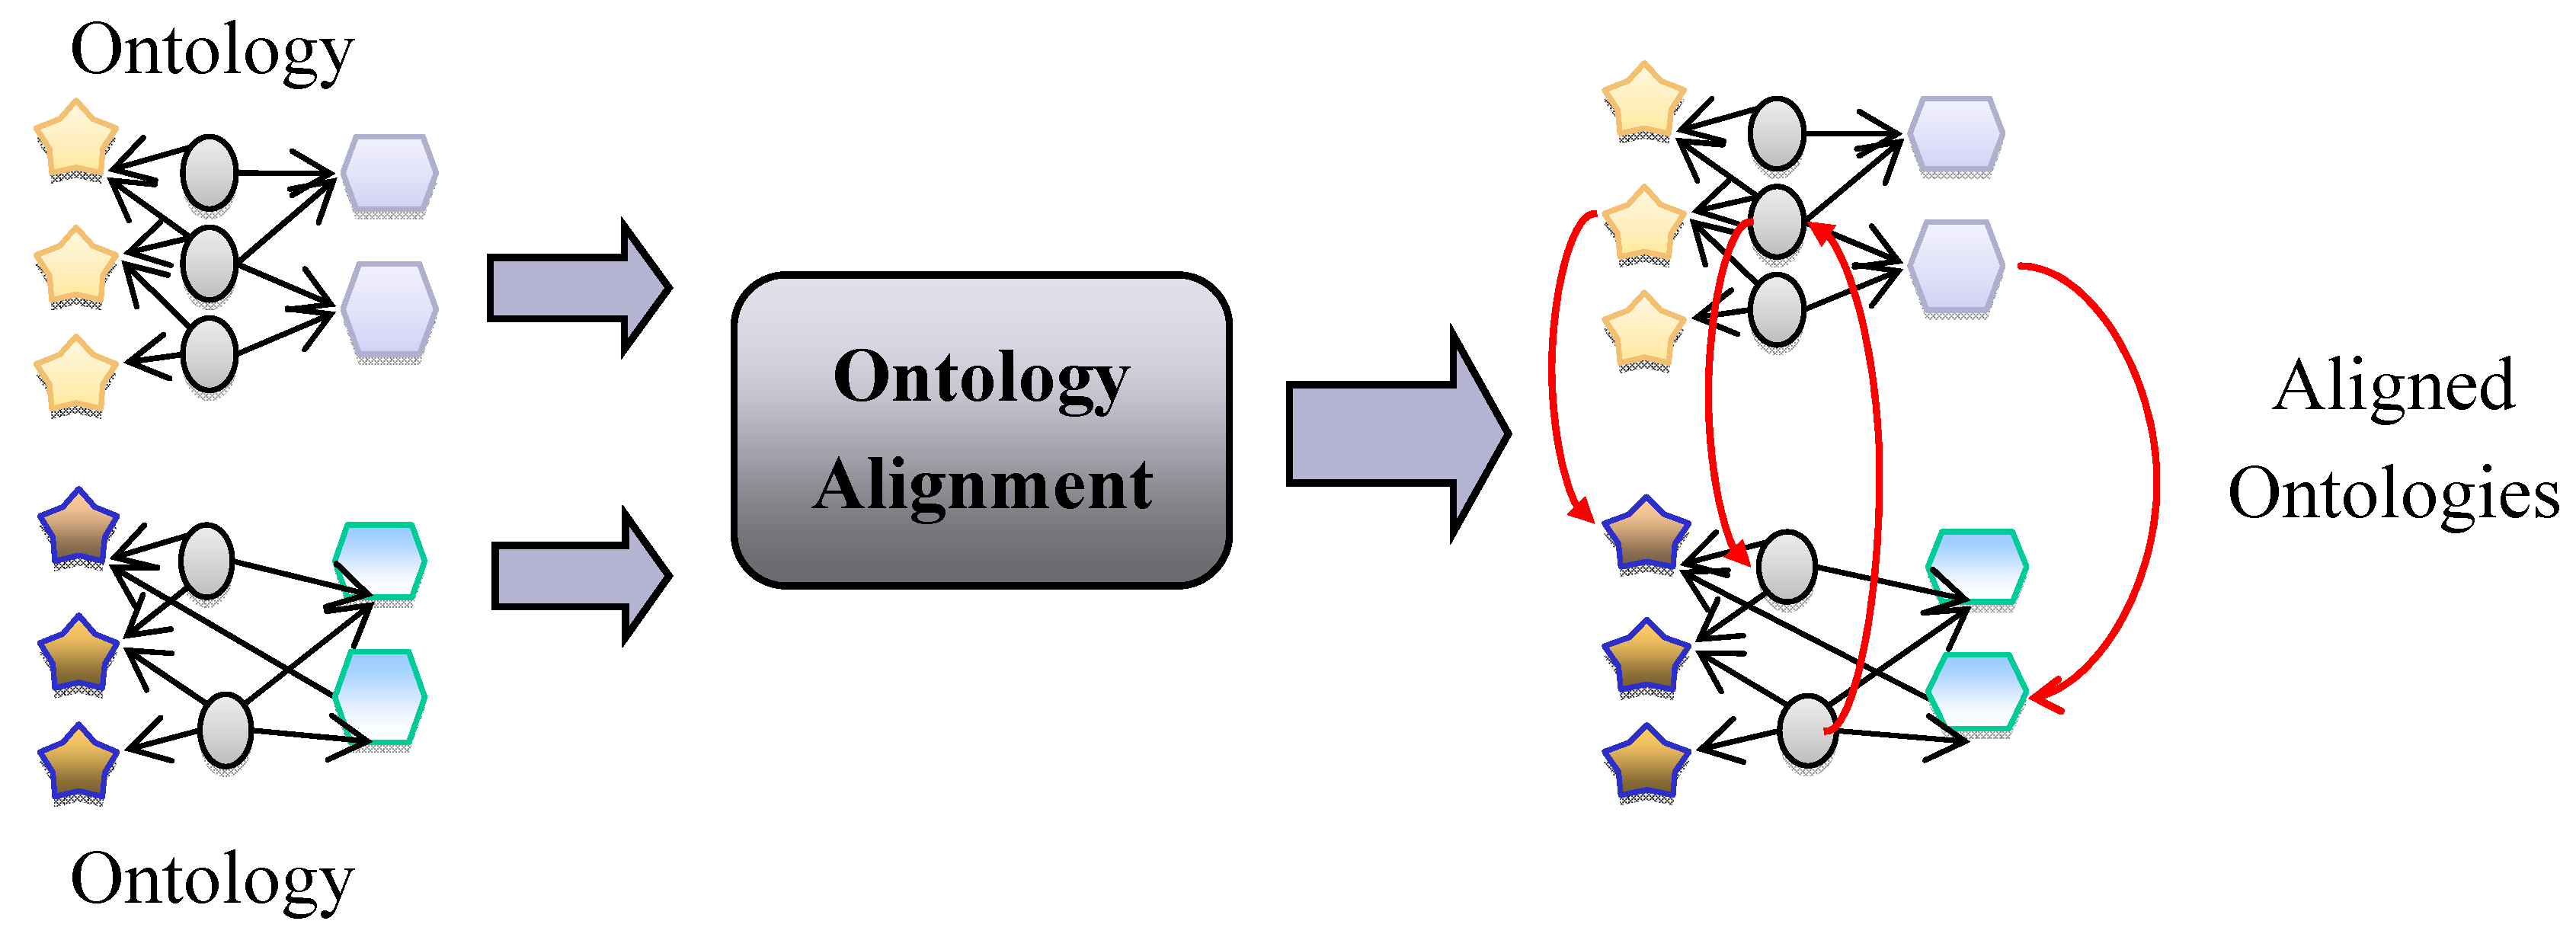
  • Ontology alignment is the process of bringing ontologies into mutual agreement by the automatic discovery of mappings between related concepts. The ontologies themselves are unaffected by the alignment process.
  • Ontology merging deals with producing a completely new ontology that ideally captures all knowledge from the original ontologies.
Ontology alignment techniques are of particular importance because the manual creation of mappings between concepts is excessively time consuming for all but very small ontologies and therefore, not generally feasible. On the other hand, both alignment and merging approaches enable interoperability between different ontologies. However, alignment is far less complex than merging since creating and maintaining links between concepts is easier and less resource-intensive than producing a completely new, consistent ontology from the original ones. Although fully automatic ontology alignment might appear as the solution of choice for the interoperability of semantic systems, results provided by fully automatic methods are rarely of sufficient quality. The challenges faced by fully automatic methods are manifold, including vocabulary differences (e.g., due to synonymy and homonymy), modeling differences (e.g., due to different model granularity or different attribute formats) and different points of view on the modeled reality.
To overcome those challenges, semi-automatic approaches have been proposed with the goal of including the knowledge and the capabilities of human experts in the alignment process. Quite obviously, for effective semi-automatic systems, the crucial point is the design of the user interface. Various visualization paradigms have been successfully applied to take advantage of human cognitive capabilities and provide intuitive overview, navigation, and detail analysis capabilities. The necessity of involving humans in the alignment process using visual interfaces has been recently outlined in [3] within a discourse on ontology alignment challenges.
However, visual alignment interfaces are most often designed in an ad hoc manner, focusing only on particular elements of the alignment task and on a specific target user group. In order to provide a richer set of visualizations covering different user needs, a comprehensive set of requirements for semi-automatic alignment systems must be derived. An analysis of existing visually supported approaches contrasted with a list of summarized requirements allows us to propose improvements for existing solutions and suggest guidelines for future research.
The rest of the paper is structured as follows: Due to the fact that semi-automatic approaches are built upon automatic methods, we first provide a brief overview of different approaches to automatic ontology alignment. Based on a short discussion of the evaluation results of automatic approaches and the results of user surveys, we derive and summarize the requirements for semi-automatic alignment systems. We argue that visual interfaces can effectively address the majority of the derived requirements, and therefore, focus on visually supported semi-automatic alignment systems. The subsequent sections present available visual interfaces for ontology alignment, and discuss their advantages and shortcomings with respect to the requirements. We conclude by summarizing the identified open issues, and provide suggestions for further improvements and future research.

2. Ontology Alignment Techniques

This section provides basic formal definitions and gives a brief overview of available approaches to ontology alignment. Despite being a new field of research, ontology alignment has already captured a lot of interest and has grown into a very active area encompassing diverse disciplines, such as computational linguistics, machine learning, graph analysis, automated reasoning, etc. Due to this wide scope, it would be beyond the purpose of this paper to capture all research directions or provide detailed insights into various alignment algorithms. Instead, this section provides an overview of different approaches to ontology alignment, and briefly discusses their advantages and shortcomings.
Although ontology alignment is still a relatively new research area, the growing importance of semantic systems has resulted in a variety of matching techniques, which are used in probably over a hundred different alignment systems. Besides giving a brief outline of the most common alignment approaches, we will also provide references to a subset of systems applying that particular approach. Interested readers can find a comprehensive overview of the field in [4] and read about the latest developments in [5].

2.1. Definitions

Given two ontologies, O1 and O2, ontology alignment is defined as the process of creating mappings in the form (c1, c2, s), where c1 ∊ O1 and c2 ∊ O2 are concepts from the two ontologies and s ∊ [0,1] is the estimated similarity between the two concepts (also called the confidence of the mapping). Alignment A between two ontologies O1 and O2 is a set of mappings defined as: A(O1, O2) = {(c1, c2, s) | c1 ∊ O1, c2 ∊ O2, s ∊ [0,1]}. Mappings may also have the extended form (c1, c2, s, r), where r is the type of the relation such as equivalence or generalization, or a restricted form (c1, c2), where the matching coefficient is not graded (see Figure 1 for a graphical illustration).
Figure 1. Alignment of two ontologies, mappings between related concepts, are shown in red.
Futureinternet 02 00238 g001

2.2. Alignment Approaches

Simple symbolic (or string-based) methods rely only on a concept’s name (label) to compute the similarity between a pair of concepts. Strings are normalized (case folding, use of a standardized encoding, blank normalization, etc.) and compared syntactically. The comparison may be either exact, i.e., concepts are matched only when the strings are equal, or approximate, where a confidence value is computed using a string of similarity metrics. Techniques for comparing a pair of strings are, for example, prefix/suffix comparison, edit distance (the number of changes required to transform one string into another), soundex index (based on pronunciation similarity in English), and n-grams (ratio between equal and all n-character sub-sequences).
While approximate string matching allows for the successful matching of concepts—even when the strings are not equal—a pure string matching approach has obvious limitations. For example, equivalent concepts described by different terms (synonyms) cannot be detected, while different concepts described by equal terms (homonyms) will mistakenly be detected as a complete match. Also, string-based matching techniques perform poorly when comparing complex strings, such as phrases, sentences, or descriptions. Systems using string based comparison for matching of concepts include COMA [6] and COMA++ [7], OLA [8], Anchor-Prompt [9], S-Match [10], and others.
Methods using language-based text analysis introduce additional techniques capable of improving on some limitations of the previous category. These include tokenization, elimination of stopwords (articles, prepositions, conjunctions), and the performing of morphological analysis for the reduction of each term (token) to its basic or stem form. Resulting terms belonging to one concept are compared to terms belonging to other concepts using string-based matching. The confidence of the matching can be computed as the ratio between the number of matching terms and the total number of terms describing both concepts. While an improvement on the simple string comparison, this approach does not match concepts on a semantic level, and will fail when, for example, correct handling of synonyms or homonyms is required. Examples of systems using language-based text analysis include COMA [6] and COMA++ [7], OLA [8], S-Match [10], Cupid [11], etc.
The employment of linguistic resources in the matching process introduces matching on a semantic level, as opposed to matching on a syntactic level. Linguistic resources used in the matching discovery process include, for example, domain specific thesauri or WordNet (http://wordnet.princeton.edu) – a lexical database for the English language, which includes a thesaurus and a dictionary. Lexical relationships, such as synonyms, antonyms, hyponyms, or hypernyms can be exploited, which not only improves matching quality, but also allows for the establishment of the type of relationship, such as equivalence or generalization. The structure of the linguistic resource can be used to compute the similarity between two terms, for example, by measuring the distance between the words in the linguistic data structure (which is typically a hierarchy or a graph). The main difficulty with this approach is that domain specific thesauri will be required for specialized application domains. Also, thesauri for languages other than English are often of lesser quality or not available at all. Examples of a system employing linguistic resources are OLA [8], Cupid [11], COMA [6], and others.
Constraint-based methods do not rely on textual descriptions, but exploit other information directly associated to the concept, such as the data types (integer, float, string, date, etc.) of key properties, data type similarities (e.g., float and double are both real number representations), permitted value ranges of the attributes, etc. OLA [8] and COMA [6] are examples of system that use this kind of information for matching.
Structure-based alignment methods differ from methods discussed above by not only considering a single concept at a time, but by utilizing the ontology structure information to compute the mappings. The fact that ontologies can be treated as graphs allows one to compare the sub-graphs belonging to different concepts using graph matching methods. For example, two concepts having similar child (or leaf) sets should be matched, while the confidence can be expressed as the ratio of equal children (or leaves). Taxonomy structure of the class hierarchy can also be considered, for example, by considering the ratio of mutual super-concepts. Similarity flooding [12], a technique based on the idea that similar nodes indicate the similarity of their neighbors, iteratively propagates similarity along the graph structure. Ontological structure is used by numerous alignment systems, such as Cupid [11], Anchor-Prompt [9], COMA [6], OLA [8], QOM [13], RiMOM [14], and many others.
Methods based on reasoning reduce the graph matching problem to pairwise node matching problems solved through the validation of a logical formula using an SAT solver. Examples of systems using this classical AI approach are CtxMatch [15] and S-Match [10].
External knowledge can be used for alignment. For example, upper (or reference, global, top-level) ontologies, such as DOLCE [16], have been designed with integration in mind. They provide reference terminology by defining general concepts, which can be used across different domains.
Alignment reuse is a technique which, given the existing alignments between Ontologies O and O1, and between O and O2, uses this information to match O1 and O2. Systems using this approach are, for example, COMA++ [7] and OLA [8].
Alignment based on machine learning methods makes use of the statistical distribution of features that are used to describe a concept. Features are usually extracted from a concept’s textual description, but may also include structural information and can even be extended using external resources, such as thesauri. When many different features and features of different types (symbolic, semantic, and structural) are used to describe concepts, computation of concept similarity becomes a non-trivial problem. Both supervised and non-supervised machine learning methods, using various similarity metrics, can be applied on the high-dimensional feature spaces to discover the matchings. Examples of systems based on the machine learning approach include GLUE [17], RiMOM [14], and others.
Composite alignment methods are combinations of the methods described above. They are commonly used by well performing systems. Since different alignment methods operate on different information types (labels, text descriptions, structure, rules, etc.) they use different similarity coefficients, which must be aggregated into a single composite coefficient. The main difficulty connected with this is that a composite method may undermine a very good single strategy. Therefore, composite methods typically include strategies to decide which alignment methods should be used and how their results should be combined (weighted). A simple example of such a strategy would be to assess the vocabulary similarity and the structural similarity of the ontology pair that will be aligned and, depending on these measures, decide whether to apply a string-based or a structure-based alignment algorithm. Examples of systems using composite alignment methods are Cupid [11], OLA [8], QOM [13], RiMOM [14], and many others.
User feedback driven methods rely on the input of the expert user, who inspects the automatically generated mappings and provides feedback, for example, by accepting or rejecting the mappings or by creating mappings manually. This information is fed beck into the system, which is capable of learning and improving its performance. Systems considering user feedback are, for example, Prompt [18] and ONION [19].

2.3. Evaluation of Alignment Techniques

Ontology Alignment Evaluation Initiative (OAEI) [20] is a yearly event, held since 2004, for the evaluation of ontology alignment systems. The main goal of OAEI is to provide a platform facilitating the evaluation of alignment systems, assessing and comparing the performance of automatic methods, and fostering collaboration between researchers developing alignment techniques. Evaluation consists of several problems (11 in 2009), including alignment of various ontologies, dictionaries, and thesauri, matching of ontologies with divergent vocabularies, and even matching of cross-lingual resources. Reports on evaluation results for years 2004 to 2009 [21] are available publicly. Although submitted results comprise only a small fraction of available alignment systems (16 systems were submitted in 2009), OAEI provides valuable insights into the performance of various automatic alignment systems in different circumstances and in different domains. Since the evaluation contest has already been running for six years, it is also possible to follow the improvement gains on a yearly basis. While tangible improvements can indeed be observed, apparently, it is also true that the improvements are diminishing from year to year despite the fact that the techniques are becoming significantly more sophisticated and more complex.

3. Requirements for Visual Semi-automatic Alignment Approaches

When automatic methods cannot fulfil the requirements in a satisfactory manner, it becomes necessary to include humans in the process. The combination of humans’ general knowledge and the immense processing power of the human visual apparatus with the enormous storage capacity and computational power of computers has been proposed, and is an active area of research [22]: visual analytics is an emerging interdisciplinary field of research focusing on reasoning facilitated by interactive visual interfaces [23]. It has also been defined as a combination of automated discovery and interactive visualization [24], introducing what is known as the visual analytics mantra: “analyze first; show the important; zoom, filter, and analyze further; details on demand”.
Visual analytics has its roots in information visualization, which is an interdisciplinary field dealing with the interactive visual representation of large, abstract data sets. As these data sets do not have a “natural” representation in the real physical world, suitable abstract visual representations must be devised. Basic principles of information visualization are summarized in the older, well-known InfoVis mantra: “overview first, zoom and filter, details on demand” [25].
For the design of visually supported alignment systems, both the visual analytics and information visualization principles have to be considered. While information visualization has a stronger focus on the presentation aspect, visual analytics can be considered more process resp. interaction oriented. Therefore, we derive user driven requirements and process driven requirements for alignment systems in the next subsections. Process driven requirements define steps and step sequences to be supported in the alignment process, and are closely related to the algorithms used. Each step utilizes different algorithms and usually requires different visual components to be conducted most effectively. On the other hand, user driven requirements impose constraints on the use of the process for an alignment task. This not only includes visual representations of ontologies and matching results, but also the establishment of collaboration and communication among users involved in the alignment task.

3.1. Process Driven Requirements

Common to the ontology alignment techniques outlined in Section 2 is a process closely resembling the well-known knowledge discovery process, as defined in [26]. This process, which we call ontology alignment process, consists of the following steps:
a)
Engineering of features describing the elements to be matched;
b)
Search for and selection of matching candidates;
c)
Similarity computation to determine relatedness between the candidates;
d)
Mapping discovery (mining) and storage of results;
e)
Presentation and interpretation of the mappings and related information;
f)
User feedback.
While automatic approaches ignore steps (e) and (f) (except during algorithm development), they are crucial in semi-automatic approaches. Through the intelligent presentation of alignment results, the interpretation on the user side can be improved, thereby yielding to a more productive alignment and user feedback. According to the visual analytics mantra, mining (step (d)) provides a “first analysis” and allows one to “show the important”. “Zoom, filter, and details on demand” then support users in doing the actual alignment and provide feedback for steps (a)–(d).

3.2. User Driven Requirements

Automated ontology alignment is central to the interoperability of semantic systems. However, since fully automatic methods produce imperfect mappings, and will most likely do so in the foreseeable future, involving human experts in the alignment process becomes a necessity. While the evaluation of automatic methods, such as those performed by OAEI [20], provides an objective assessment of their performance and indicate directions for their improvement, additional important questions need to be answered when humans should be involved in the process:
  • How to present the mappings to the user?
  • Do users consider automatically generated mappings useful and trustworthy?
  • What degree of automation is feasible (when human intervention becomes necessary)?
  • What processes and workflows are users following when creating, inspecting, and managing the mappings?
  • What are the requirements for cognitive support for ontology mapping tasks?
  • What are appropriate representations and user interactions for specific tasks and processes?
  • What is the role of collaboration and how do users wish to coordinate teamwork?
  • Which existing tools and interactive interfaces do users prefer and why do they prefer them?
  • What are the long and short term usage patterns of the systems?
  • Influence of interface usability and quality of automatic alignments on acceptance of interactive systems.
  • How can one most adequately utilize machine and human advantages?
Studies attempting to provide answers to these questions are still rare (as of 2009). In [27,28,29], user surveys and evaluation studies were conducted providing answers to most of the above questions. A main conclusion is that there is demand for interactive alignment systems. Users are willing to test and use various systems and do find automatically generated mappings useful. However, the task of creating the mappings is considered complex and working with tools is mostly described as hard. Interestingly, better cognitive support was expected to improve productivity more than advancements in the matching algorithms.
Performed user surveys and evaluation studies delivered assessments on the functionality of the existing tools as well as numerous improvement suggestions. Based on these results, we derive a summarized set of requirements for interactive ontology alignment tools:
  • Presentation of mapping candidates together with the estimated confidence and, if possible, with the inclusion of information on why the mapping was generated.
  • Navigation and exploration of ontologies providing detailed information on every element of the explored ontology.
  • Overview of the alignment results for identification of regions with promising matching candidates.
  • Capability to adjust the level of detail for the viewed data, as well as the choosing of the area of interest which shall be explored.
  • Filtering depending on features of the mappings, such as terms describing the concepts, mapping confidence, status of the mapping (confirmed, rejected, not inspected), etc.
  • Confirming and rejecting automatically generated mappings as well as adding and removing mappings manually. If possible, this should be done such that the system will learn from users’ interventions.
  • Collaboration via communication, commenting, tagging, and the voting on and annotating of mappings and ontology elements.
  • Ability to partition the mapping task into chunks assignable to team members and to monitor team member progress.
  • Saving and loading of users’ changes.
Looking at the requirements 1 to 5, it becomes clear that these make an excellent fit for visualization techniques. While the remaining requirements are usually not primarily addressed by visual methods, requirements 6 to 8 could also benefit from the use of visualization, in particular from visual components introduced to address requirements 1 to 5.

4. Visual Interfaces for Ontology Alignment

Involving humans in the alignment process has the advantage of utilizing users’ general knowledge, creativity, and intuition. Use of visualization techniques has the additional advantage of exploiting the immensely powerful visual processing capabilities of humans, enabling them to efficiently explore, understand, and discover patterns in large amounts of information at once. Visual ontology alignment has recently been discussed and advocated in [30].
Since the browsing of ontologies may be crucial for assessing the correctness of mappings produced by automatic alignment methods, most interactive systems will include ontology representation components of some form. Ontology visualization is an established area of research, with many existing systems employing various visual representations [31,32]. However, interactive visual interfaces for ontology alignment are still few (as of 2009). As ontology alignment involves browsing and analysis of ontologies rather than editing and manipulation, ontology visualizations employed in alignment systems focus primarily on navigation and inspection capabilities.
The offered functionality and the information conveyed by a visual interface depend on the characteristics of the employed visualizations. Therefore, we subdivide the presented visual interfaces into three groups, depending on the used visual paradigm: standard tree widget based interfaces, graph visualization based interfaces, and treemap-based interfaces (note that some of the six cited systems are present in more than one group). Employed visual components are usually accompanied by additional widgets providing extended functionality for displaying, inspecting, and manipulating mappings generated by the matching algorithms.

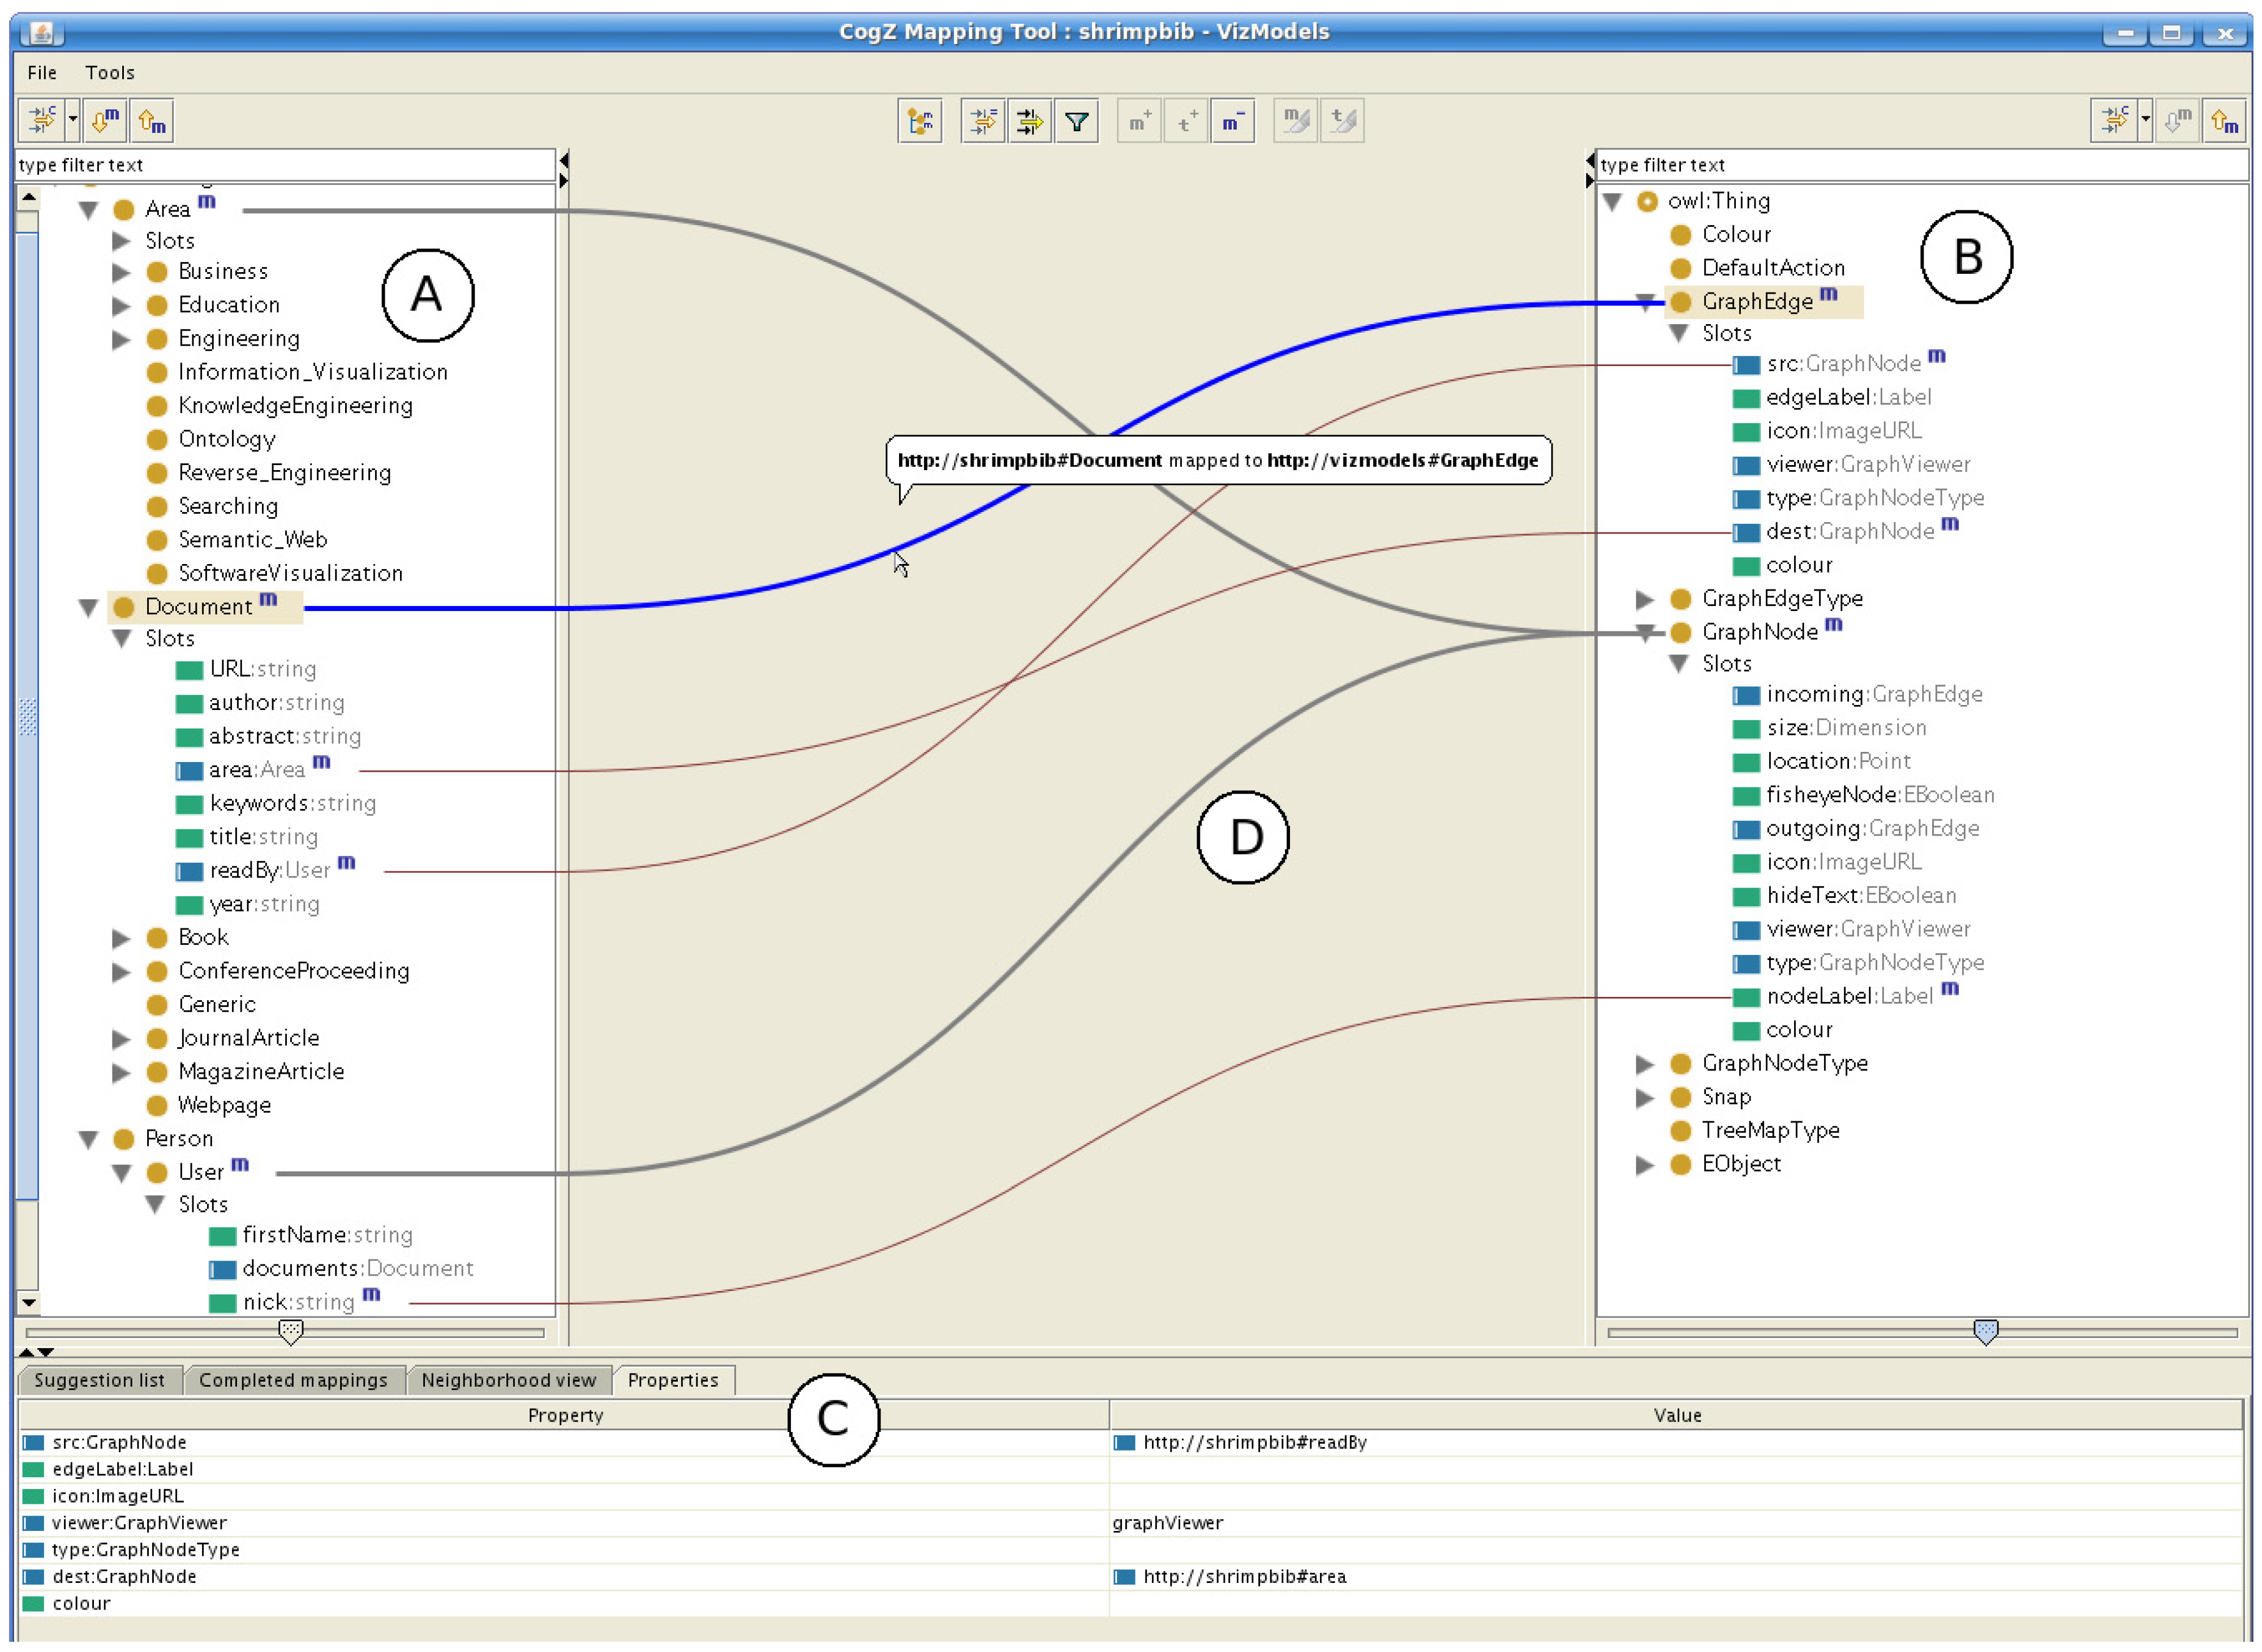
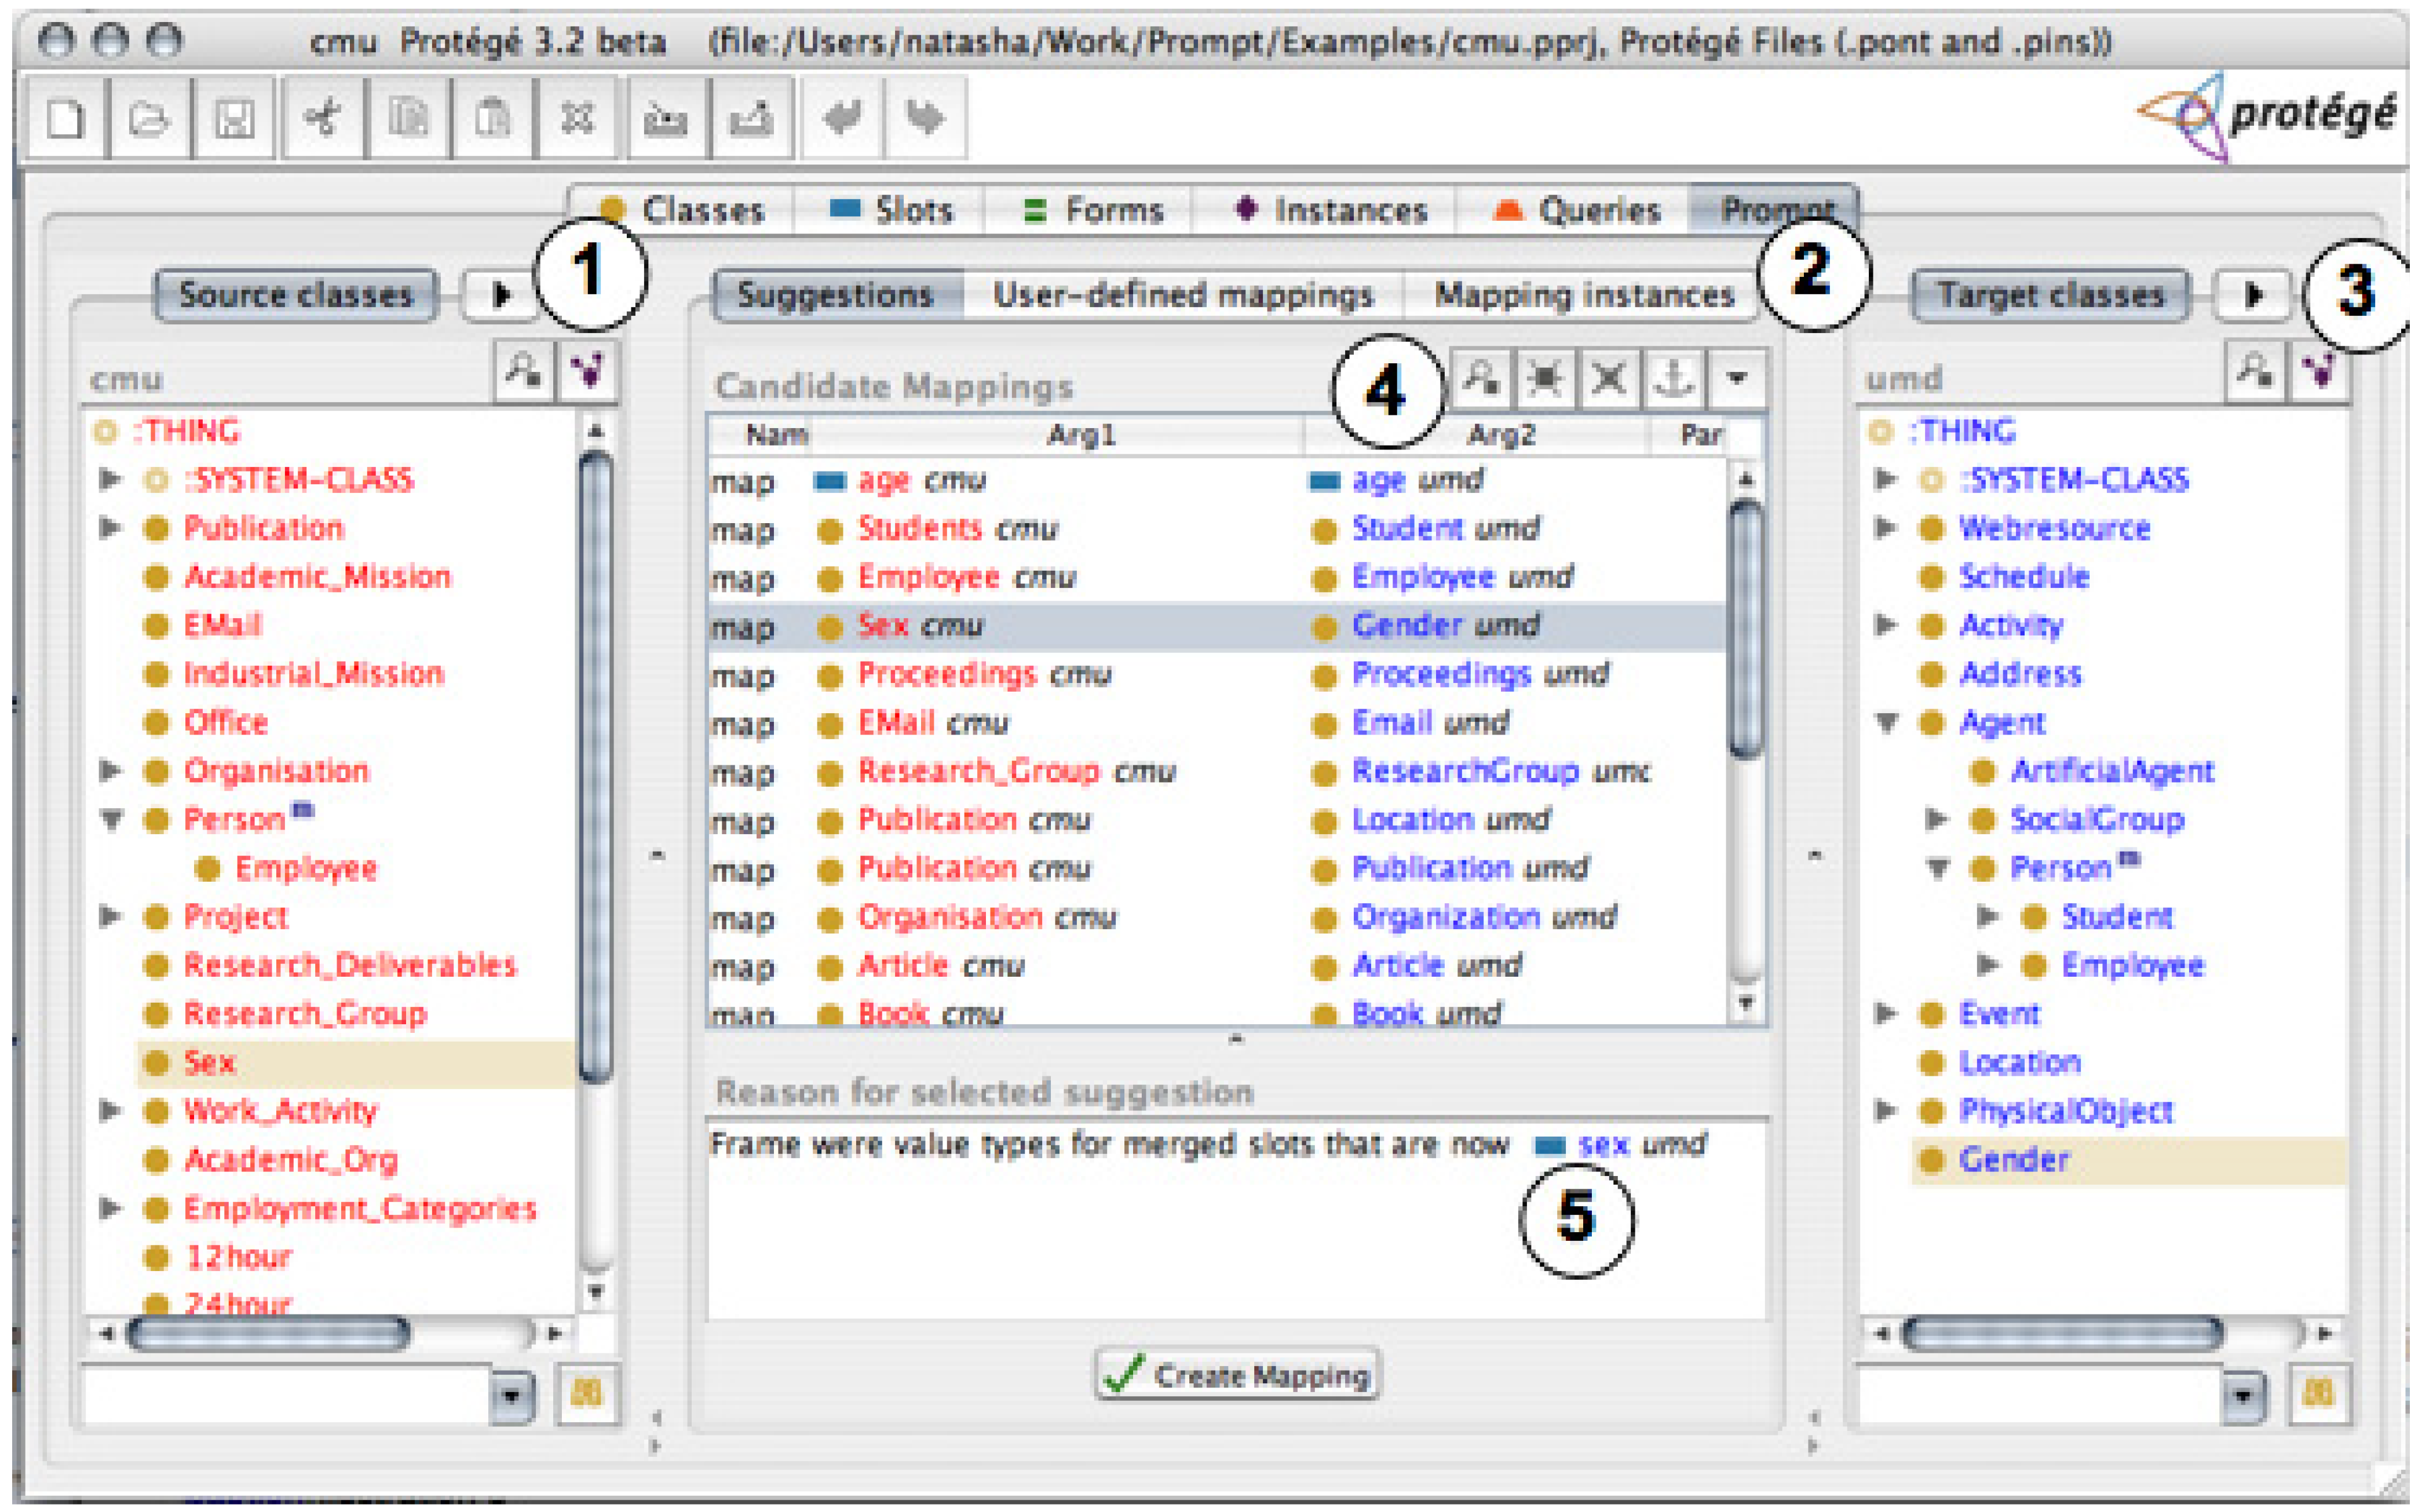
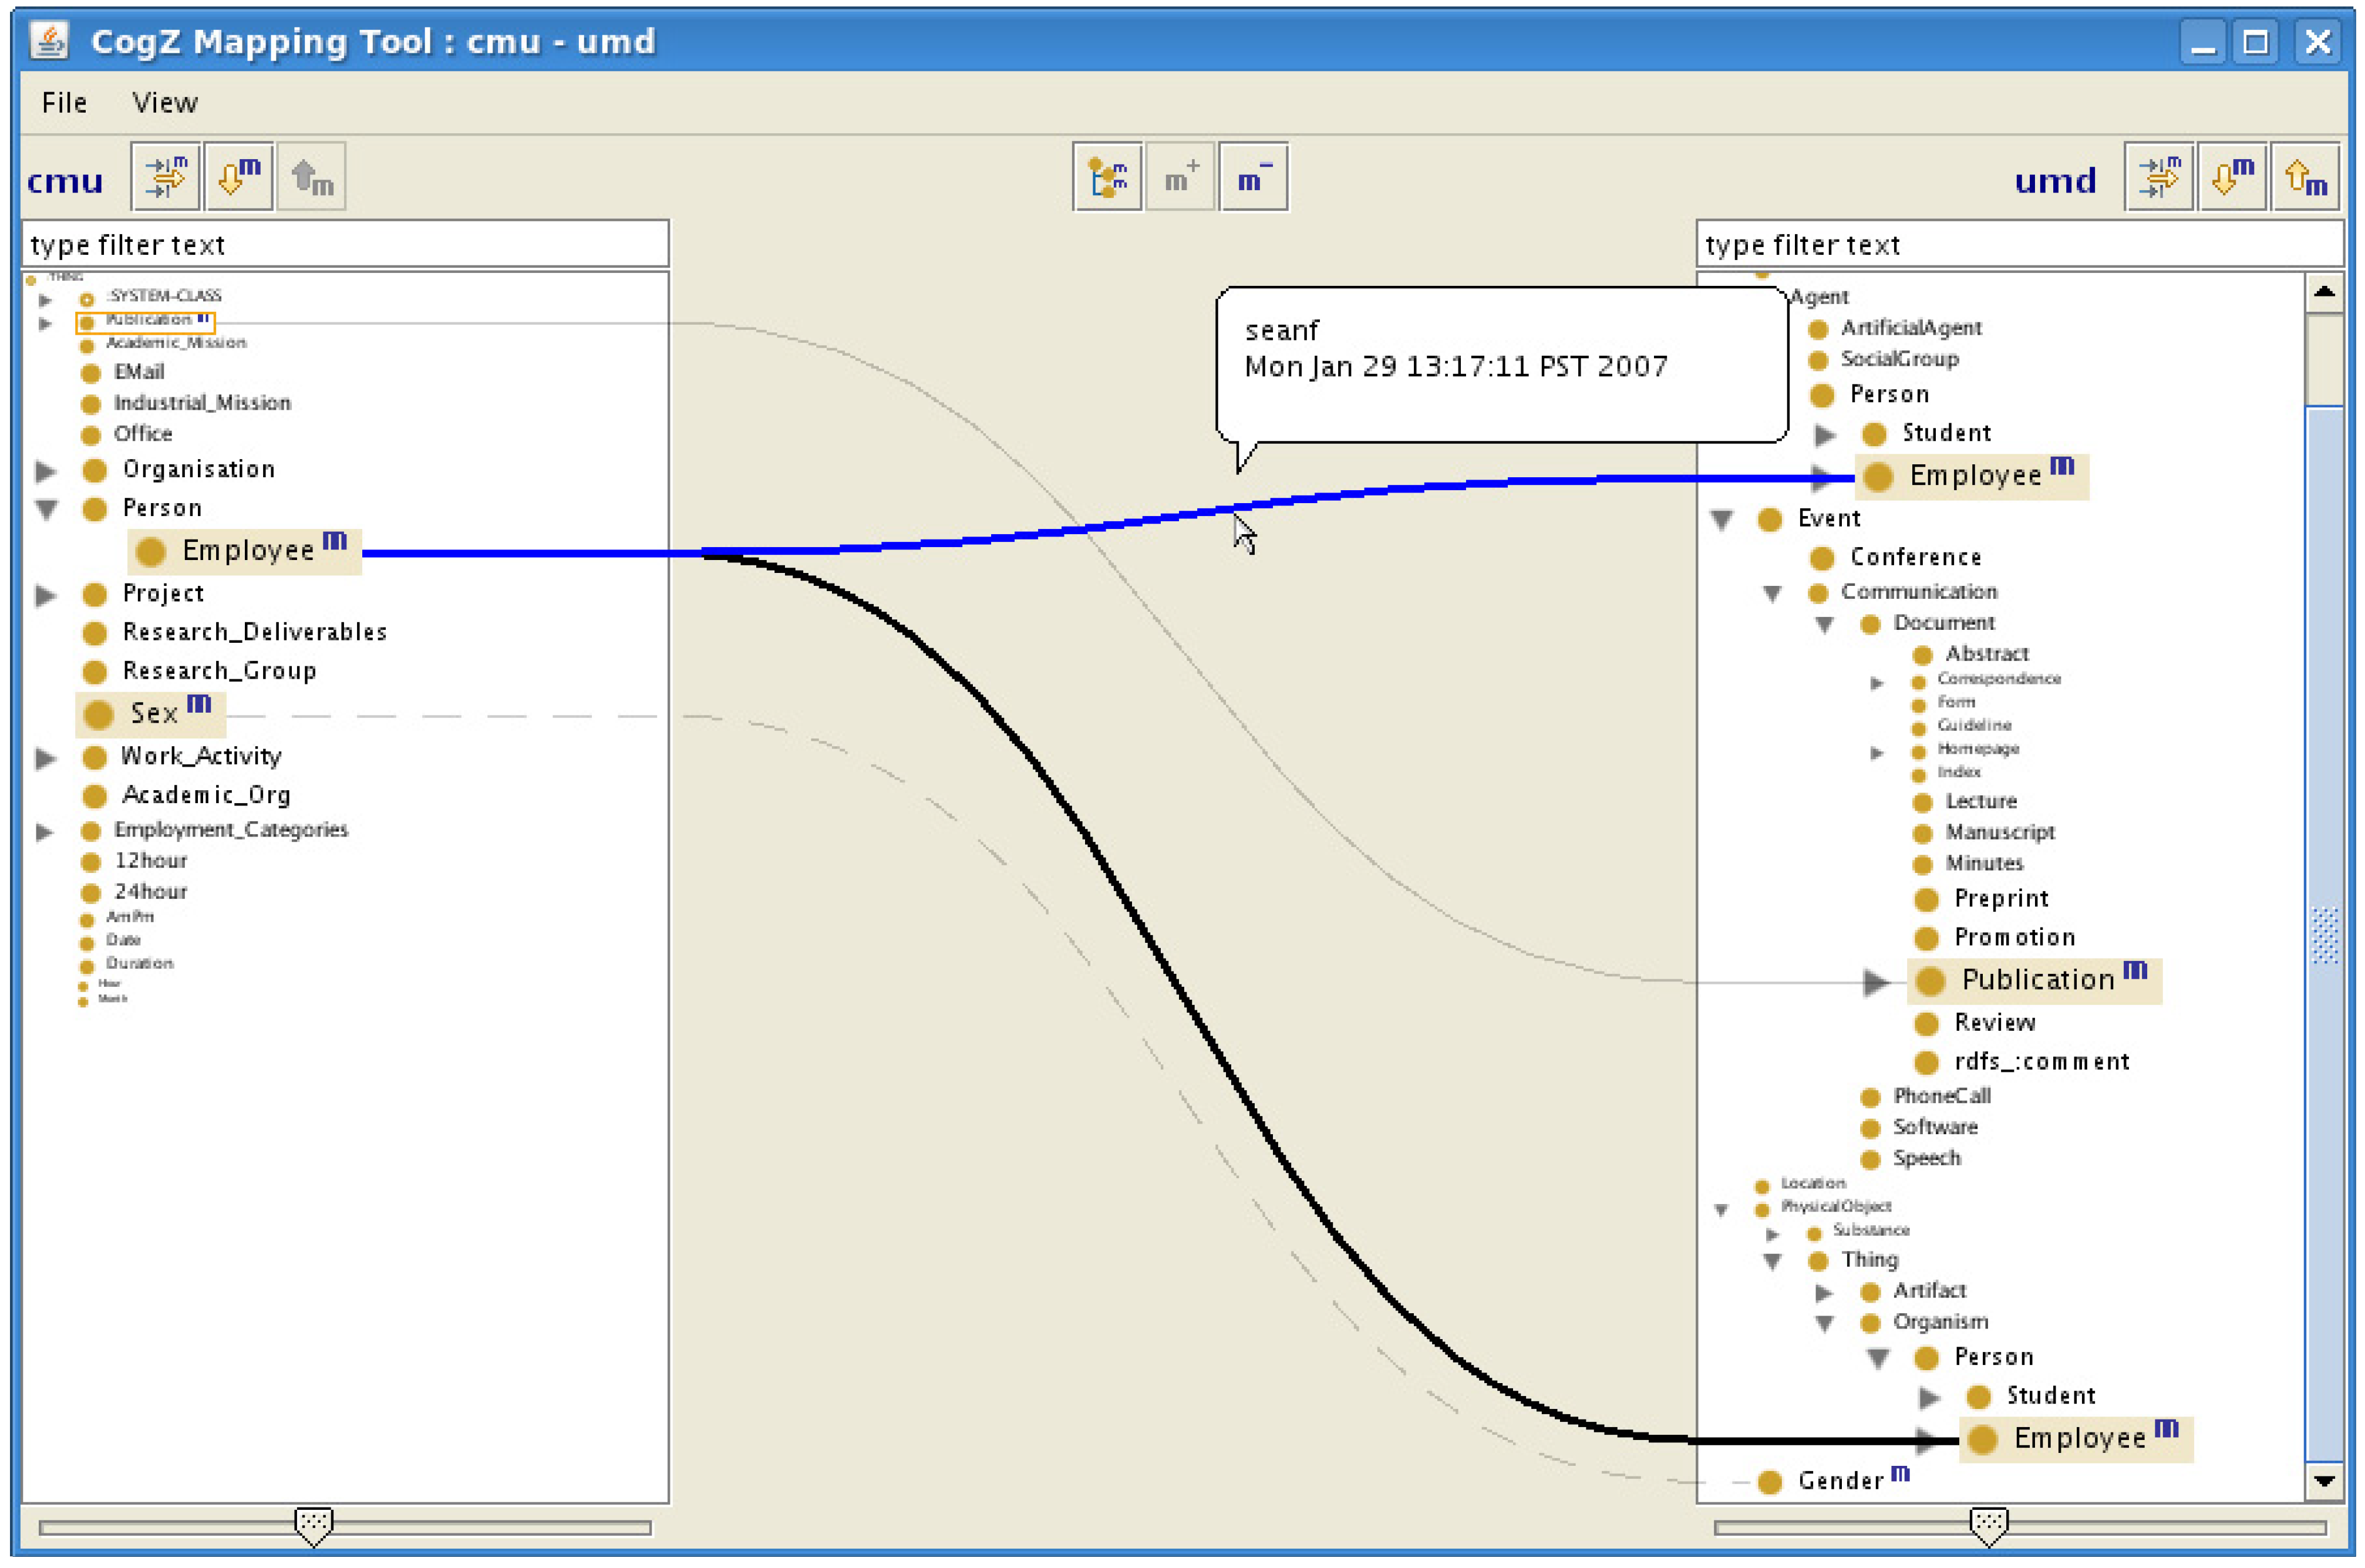
4.1. Interfaces Based on Linked Trees Widgets

Tree-based representations use the standard tree widget to present the class hierarchy of an ontology. Ontologies are usually shown side by side, while the mappings are either represented as lines or curves connecting the corresponding tree nodes, or they are displayed as a list of matching pairs.
AgreementMaker [33] shows a class hierarchy in a tree-like representation. Both ontologies are shown side by side with mappings shown as straight lines connecting matching nodes. Similarity between a pair of nodes is displayed along the link, whereby filtering of mappings can be achieved by adjusting the similarity threshold. When clicking on a node, additional properties are shown in a separate detail view. Manual manipulation of mappings is performed through node selection and the subsequent invoking of corresponding functions through a context menu.
COMA++ [7] and COGZ [34,35] offer an interface very similar to the one provided by AgreementMaker. As seen in Figure 2, the COGZ interface includes two trees showing the class hierarchy (A and B), a property viewer (C), and a component between the tree nodes showing mappings as curves connecting the tree nodes (D). COGZ improves on the AgreementMaker and COMA++ interfaces by showing mappings as curves, by displaying additional information on mappings as a tool tip, and by applying a fish-eye effect on the trees, as shown in
Figure 2. COGZ [34] matching interface including trees showing the class hierarchies (A and B), a property viewer (C), and links between the nodes (D).
Futureinternet 02 00238 g002
Figure 3. COGZ [34] matching interface with a fish-eye effect on the current focus (mapping).
Futureinternet 02 00238 g003
Figure 4. Tree-based user interface supporting interactive alignment for the PROMPT [18] system.
Futureinternet 02 00238 g004
Figure 3, to improve interface scalability and to highlight the currently viewed mappings.
In [29], user interface extensions for the PROMPT [18] alignment system are described. Tree representation is used for the class hierarchies, but lines and curves representing the mappings are replaced by a list component showing a listing of matching pairs (see Figure 4).

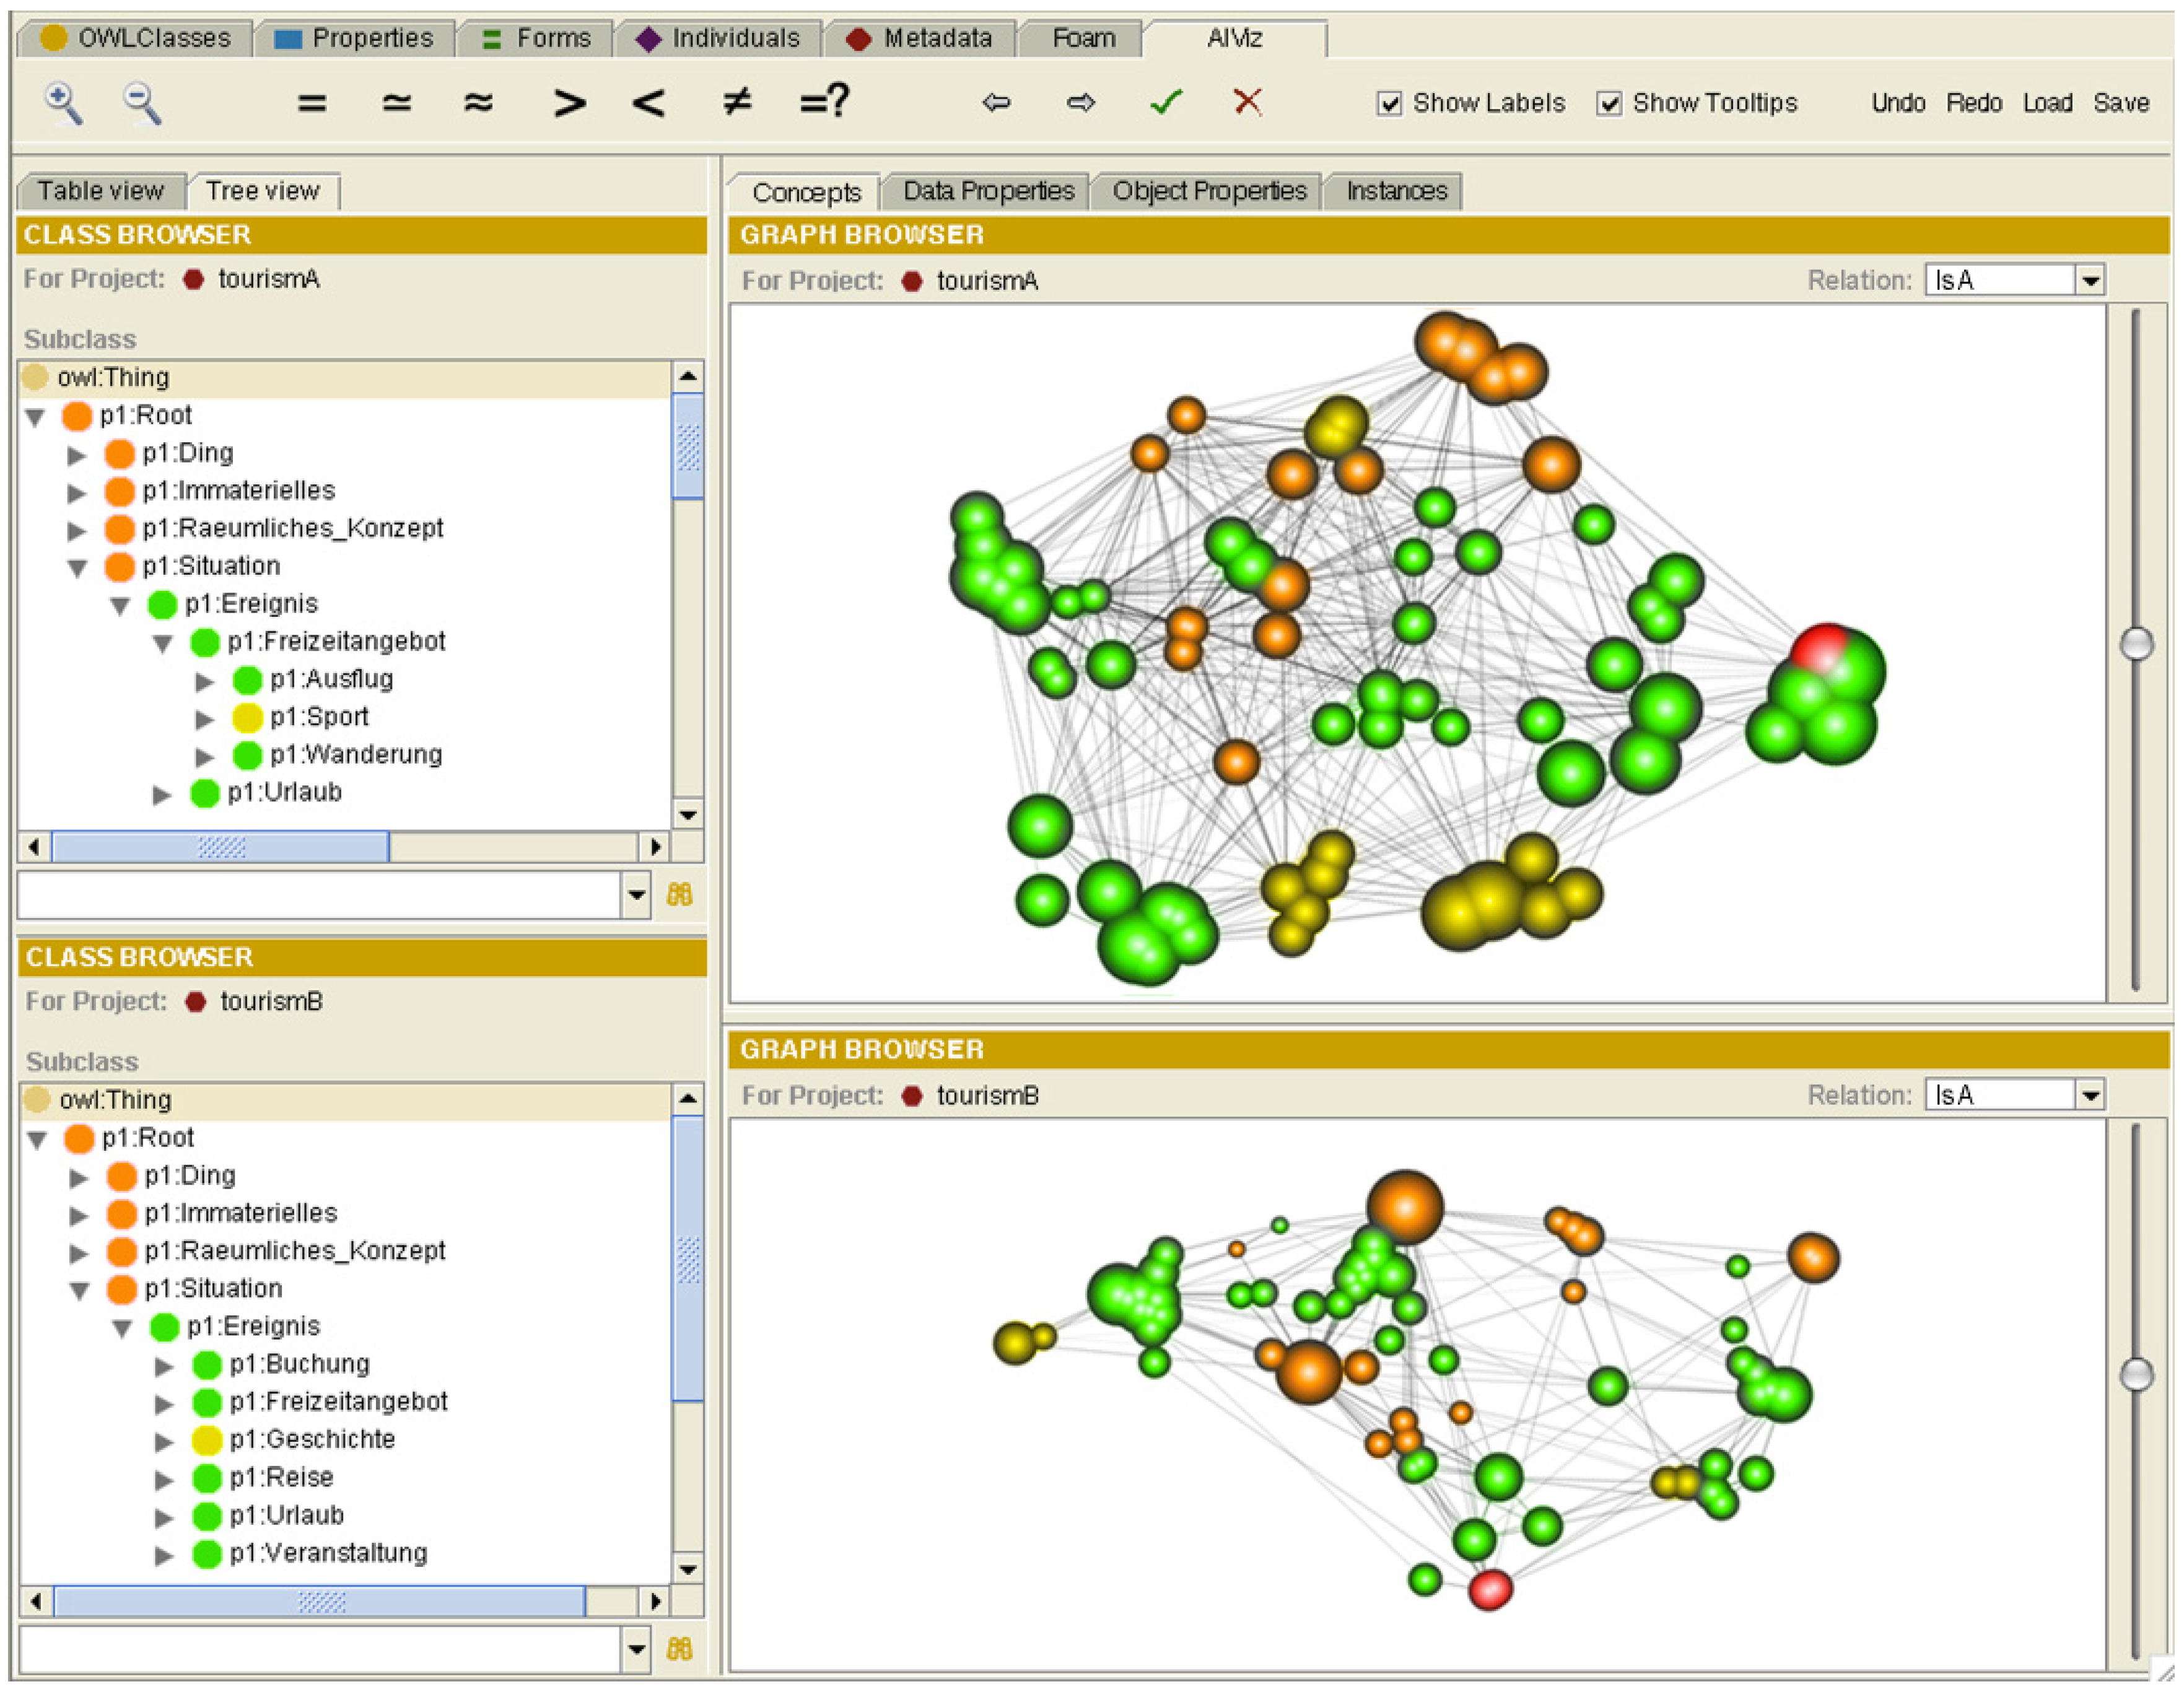
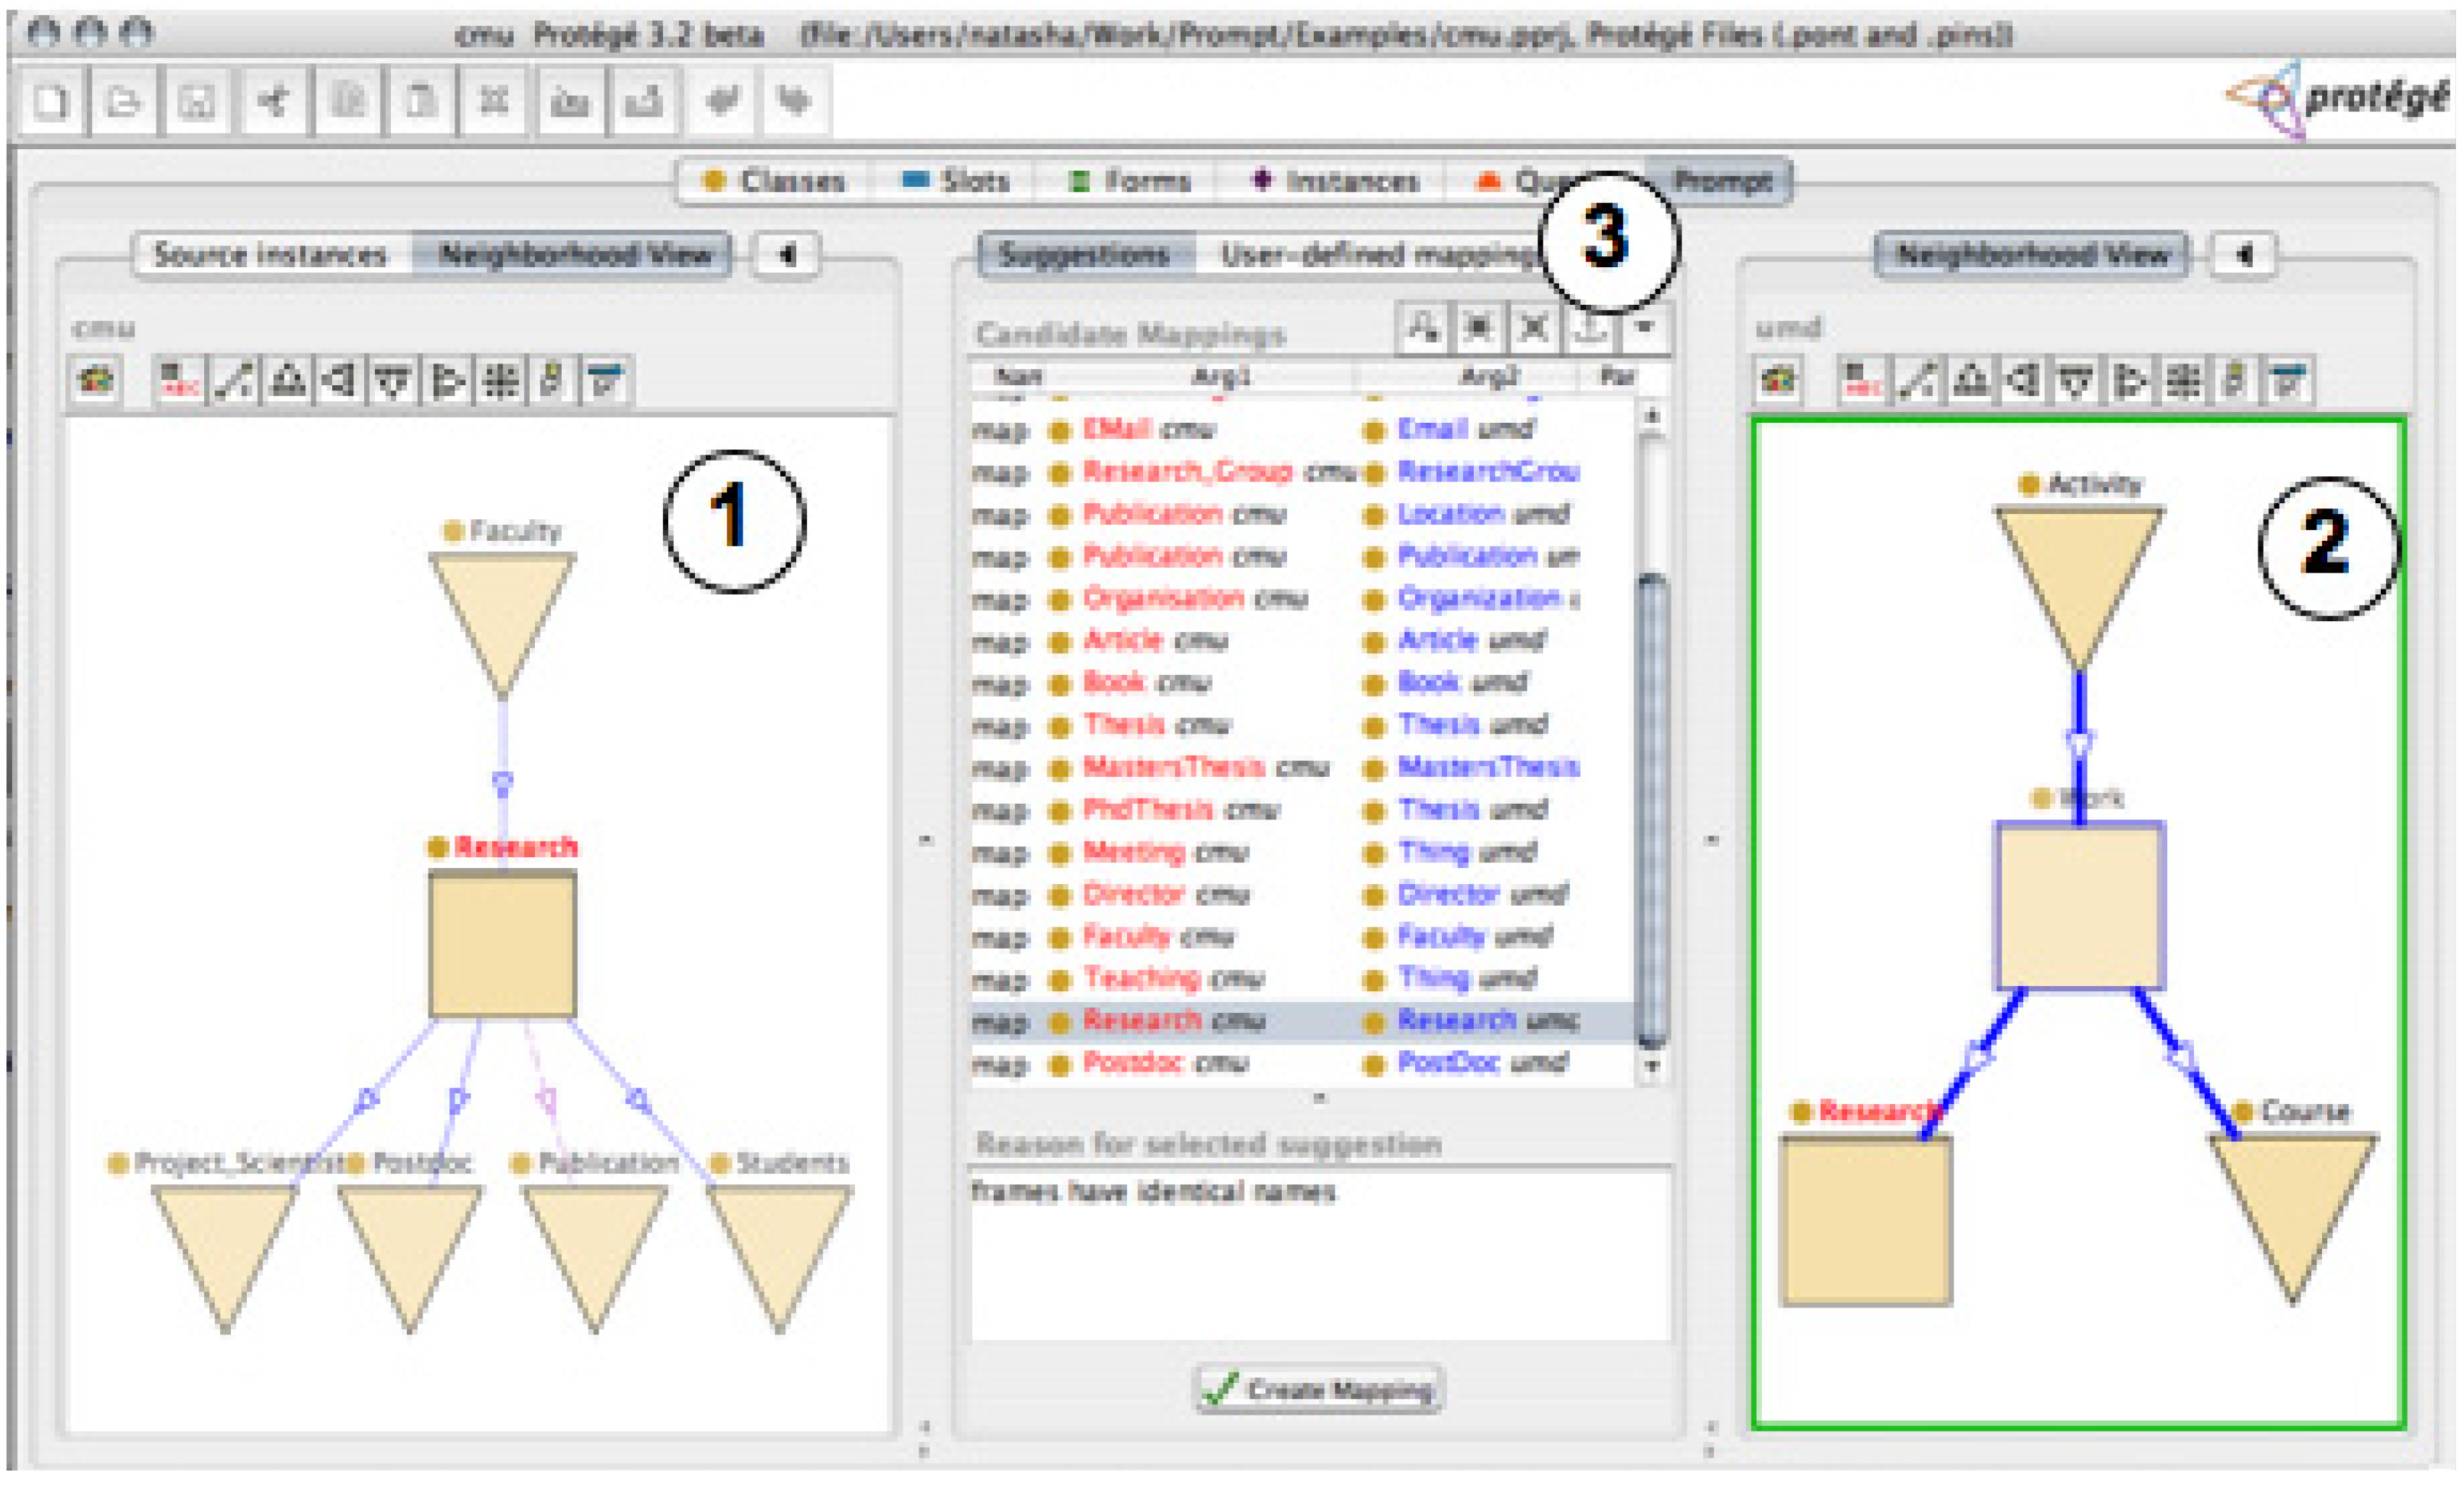
4.2. Interfaces Based on Graph Visualization

The structure of an ontology is basically a graph, which makes graph visualization probably the most natural, and definitely the most commonly used, visual representation of an ontology. There is a plethora of different graph visualization approaches, with comprehensive surveys available in [36] and [37]. Interactive alignment systems employ graph visualization for the navigation and exploration of ontologies, to provide insight into the ontology structure, and to show detailed information of every ontological element. Matching information is usually encoded through color or through additional links.
Optima [38] displays both ontologies separately in graph visualization components. Various graph layouts, such as a tree, a circle, or random, are available. Because large ontologies would appear cluttered, node clustering and node filtering are supported. Matched nodes are highlighted and displayed in blue and the user can select a node to identify the matching node in the other ontology.
The work in [39] describes extensions for the PROMPT [18] alignment system. Figure 5 shows a variant of the interface shown in Figure 4, but with tree representations of class hierarchies replaced by graph visualizations showing fragments of the ontologies. The list in the center (3) shows matching pairs, while the graph visualization (1 and 2) display neighborhoods of the currently selected mapping suggestion.
Figure 5. Graph-based user interface supporting interactive alignment in the PROMPT [18] system.
Futureinternet 02 00238 g005
AlViz [39] combines four different views: two tree representation for the class hierarchies and two graph visualizations for representation of the ontologies (see Figure 6). The clustering of nodes is performed in the graph visualization according to the selected level of detail using similarities provided by the matching algorithm. Nodes are positioned using a spring-embedded algorithm so that tightly coupled groups of nodes appear positioned close together, while loosely coupled ones are placed further apart. Node size corresponds to the number of clustered concepts, while color is used to indicate similarity between concepts from the two ontologies.
Figure 6. AlViz [39] combines tree representation for the class hierarchies with graph visualization for the representation of the ontologies.
Futureinternet 02 00238 g006

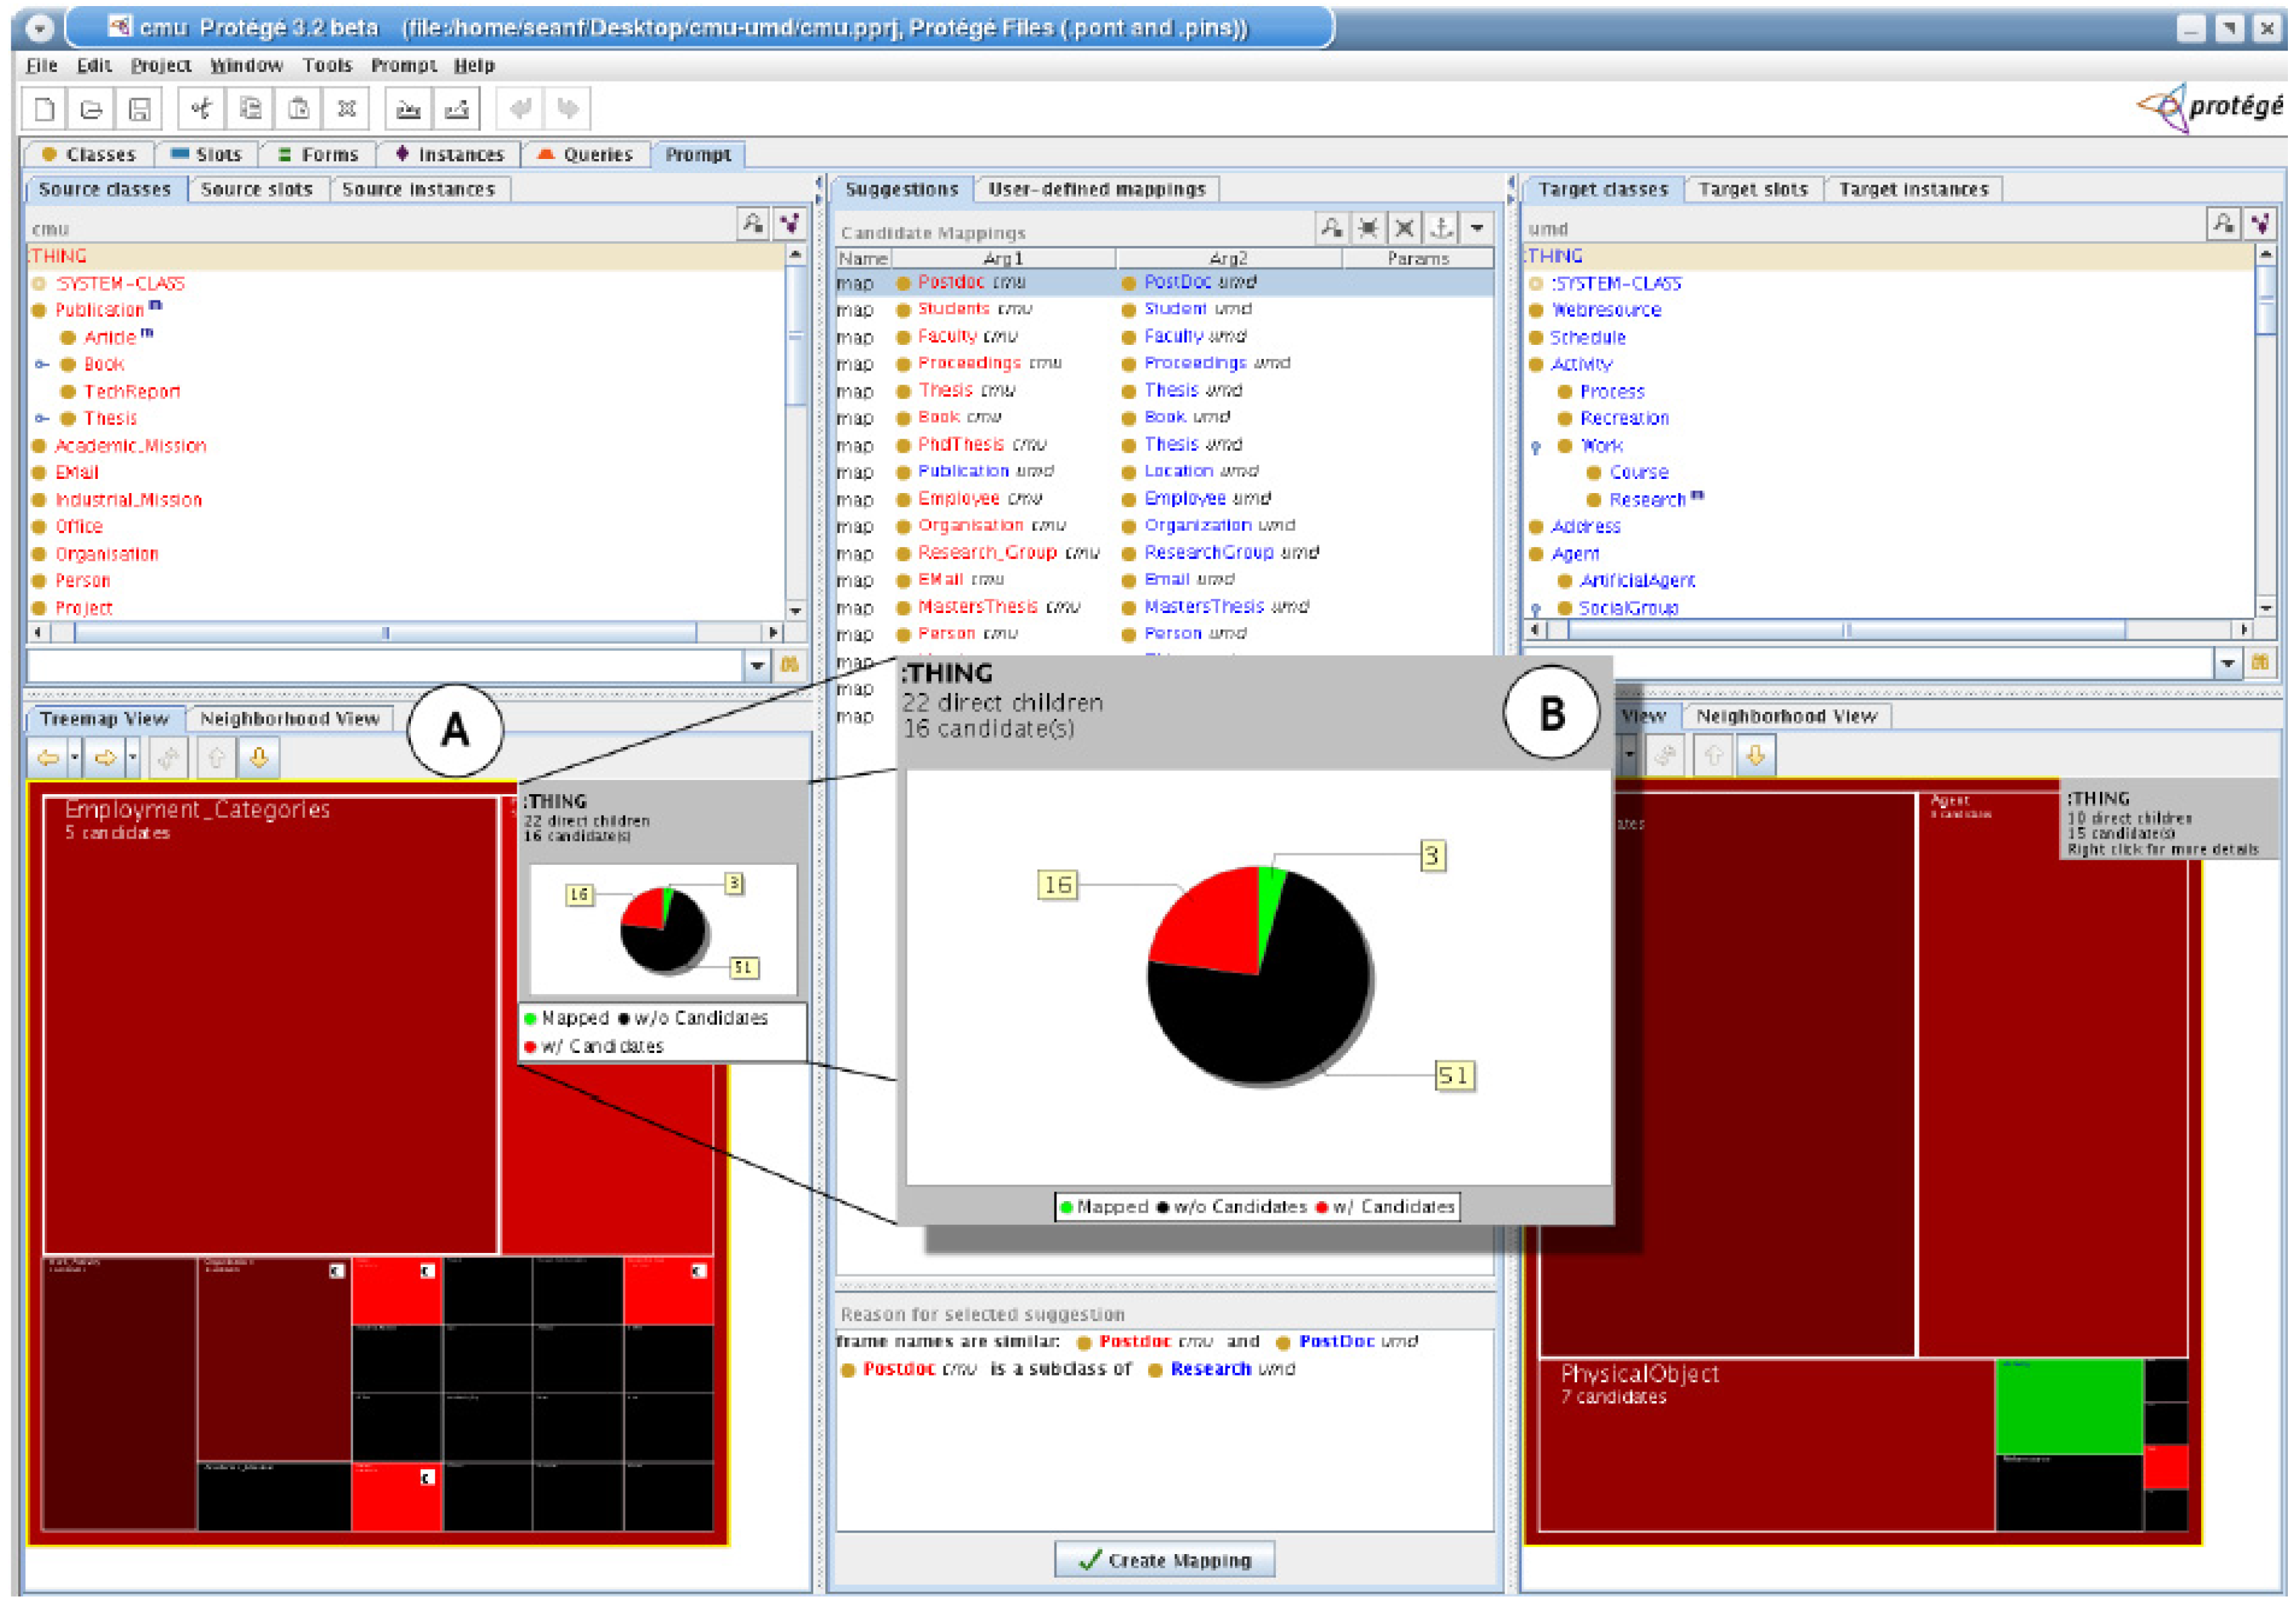
4.3. Treemap-based Interfaces

Treemap [40] is a commonly used visual representation of hierarchically organized data sets. Nodes of the hierarchy are represented as nested rectangles. The size of each rectangle corresponds to some property of the underlying data (e.g., the amount of leaves contained by the corresponding hierarchy node). Usually, color coding is used to convey further properties of a node, but other representations fitting within a node’s area, such as histograms, can be used instead. More information on treemaps is available in [41]. The main objective for the use of treemaps in ontology alignment is to provide an overview of the complete class hierarchy. As treemaps are scalable, they are suitable even for very large ontologies—the amount of screen real estate used by a treemap remains the same, regardless of ontology size.
COGZ [34,35] employs treemaps to provide an overview of the class taxonomy, and uses colors to indicate where regions with many matching candidates can be found (see Figure 7). Pie-charts are used to show additional information, such as the mapping progress (i.e., count of candidate mappings, mapped concepts, and concepts without any mapping) for different branches of the hierarchy.
Figure 7. COGZ [34] treemap view (A) with a pie chart showing information on mapping progress (B).
Futureinternet 02 00238 g007

5. Requirement Fulfilment Summary and Suggestions for Future Research

This section summarizes the capabilities of the presented visual alignment systems and discusses the advantages and disadvantages of the three visual representation groups introduced in the previous section. Each group is compared to the requirements derived in the Section 3, whereby the focus is on requirements 1 to 5, as they are most relevant to visual systems. Based on these findings, we propose improvements and provide suggestions for a visual approach to semi-automatic ontology alignment, which might successfully address all relevant requirements.

5.1. Requirements Fulfilled by Interfaces Based on Linked Trees

Representations showing class hierarchies using two tree widgets placed side by side, with mappings shown as links between the tree nodes, are useful for the exploration and inspection of the mappings. However, when mappings are too numerous, overlap and the crossing of links may result in clutter. Also, it is difficult to encode confidence and other mapping information into lines and curves connecting the tree nodes, especially when many of them should be displayed. These issues can be ameliorated by adding an additional table component which displays the mappings as a listing of matched concept pairs. Therefore, we regard requirement 1 as fulfilled if an additional table view is available, or partially fulfilled if it is absent. Trees are adequate for representing hierarchical structures, such as class hierarchies, but ontologies, which have a graph structure, cannot be represented by trees. Requirement 2 is therefore not fulfilled. Tree based representations are clearly not suitable for providing an overview since only a small part of the class hierarchy can be visible at once. However, use of a fish-eye view ameliorates the situation to some degree. Still, we see requirement 3 as largely not fulfilled. Choosing the area of interest for hierarchically organized data, such as a class hierarchy, works well with trees, but the adjustable level of detail should be considered to be very limited. As a consequence, requirement 4 is only partially fulfilled. Filtering is generally not supported in trees. However, it can be applied on the links connecting the tree nodes, so we regard requirement 5 as partially supported.

5.2. Requirements Fulfilled by Graph-based Interfaces

Graph visualizations applied on ontology alignment usually display matched nodes through color coding or icons. The disadvantage is that additional information about the mapping cannot be provided. Similar to tree-based interfaces, this can be addressed by adding a table displaying the mappings as a listing of matching concept pairs. Thus, requirement 1 can be considered fulfilled if an additional table component is present, or partially fulfilled if it is absent. Representing ontologies by interactive graph visualizations enables users to effectively navigate along the ontology structure and to view details on ontology elements. The availability of various graph layouts makes this a very flexible way of exploring ontologies. Therefore, requirement 2 can be considered completely fulfilled. Graph visualizations usually do not scale to very large data sets, which makes them unsuitable for providing an overview. Attempts have been made to address this issue by applying aggregation techniques, such as clustering. However, aggregation may hinder the user in gaining insight because nodes and relations will appear “merged”, which would prevent the visibility of separate mappings. We conclude that the requirement 3 is only partially fulfilled. Results of aggregation techniques can be used to provide a dynamic level of detail. As long as the labels describing the aggregated entities are aggregated too, the resulting visual representation can be used to identify and select areas of interest. Therefore, we consider requirement 4 to be mostly fulfilled. Filtering is usually supported by graph visualization components. However, combining visual aggregation with filtering may prove to be problematic, because filtering effects may be obscured for elements which have been “merged” by aggregation. Therefore we consider the requirement 5 as only partially fulfilled.

5.3. Requirements Fulfilled by Treemap-based Interfaces

While treemaps are good at providing an overview, single data entities cannot be visualized, disqualifying this visual representation for requirement 1. However, treemaps were successfully combined with a table view showing the mappings as a listing of matching concept pairs. Similar to tree-based and graph-based interfaces, this fulfils the requirement 1. As treemap visualization is organized along the displayed class hierarchy, it does not provide a means of navigating the ontology graph structure. Therefore, requirement 2 is not fulfilled. The main strength of treemaps is the provision of an overview for the complete class hierarchy, and the indication of candidate-rich regions through color. Hence, requirement 3 is considered fulfilled. Treemaps provide guided navigation along the visualized hierarchy and will display more detailed information as the user navigates down the hierarchy. Therefore, we consider requirement 4 to be largely fulfilled. Treemaps usually do not visualize single data entities and thus do not support filtering functionality, so that the requirement 5 is not fulfilled.

5.4. Suggestions for Future Work

By analyzing existing visual semi-automatic alignment tools, it is clear that not all relevant requirements are actually supported by available systems (see Table 1). Hence, the full potential of information visualization and visual analytics is not realized yet.
Table 1. Requirement fulfillment overview for the three visual interface groups.
Requirement/InterfaceLinked Trees-basedGraph-basedTreemap-based
1. Detailed mapping information provided+ 1+ 1+ 1
2. Ontology navigation and exploration+
3. Overview of alignment results−/++
4. Selectable level of detail and area of interest+/−++
5. Filtering−/+−/+
1 Requirement considered fully supported only if an additional table view is employed for displaying detailed mapping information.
Comparing the three groups of visual alignment systems, one can see that treemap interfaces, and in particular, the graph-based interfaces, come closer to fulfilling the requirements than the tree-based interfaces. Although graph-based and treemap-based approaches both have weaknesses and strong points, these are, to a certain degree, complementary, so a combination of these two approaches appears reasonable: a treemap could be used for providing an overview, while a graph visualization would provide navigation and exploration of the ontologies. A point common to all three interface groups is that no matter how mappings are incorporated into a visualization, a table displaying detailed mapping information is indispensable. A requirement which is not addressed in a completely satisfactory manner by any system is filtering.
We propose an interface consisting of graph visualizations for ontology navigation and exploration, a table component displaying detailed information on the mappings, and a dedicated overview component, such as a treemap, for providing an overview and for identifying regions of interest containing promising matching candidates. To address the issue with filtering, the treemap could be replaced with another component suitable for providing an overview, such as an information landscape. An information landscape is a visualization paradigm based on a geographic map metaphor, suitable for providing an overview. It is typically applied for the discovery of patterns in large data sets by conveying relatedness in the data through spatial proximity in the visualization [43]. Due to the fact that mapped concepts would be grouped together because of the high relatedness computed by the alignment algorithm, identification of mapping candidate-rich regions would be supported (requirement 3). Filtering and highlighting (requirement 5) are naturally supported because all concepts involved in the alignment process would be displayed at once. Interactive zooming and panning, as well as labeling, which is automatically adjusted to the current zoom factor, would also be available (requirement 4). Therefore, a visual user interface employing graph visualization for ontology exploration, a table for the presentation of the mappings, and an information landscape as an overview component, would completely fulfil requirements 1 to 5.
Employing an information landscape as an overview component could bring some additional advantages. For example, the fact that concepts identified as mapping candidates are grouped together, combined with the dynamic level of detail-dependent labeling, could be used to identify mapping candidate-heavy regions covering a particular topic of interest. This is not only relevant to requirement 4, but could also be used to assign the identified mapping candidates to an expert on that particular topic, thus supporting requirement 8.
As we have seen in the above discussion, no single visual representation is capable of fulfilling all requirements. To overcome this, visual interfaces have to be built by combining several components. Coordinated multiple views (CMVs) techniques [42] are commonly used for combining multiple components. Through CMV techniques, tight coupling of several visual components can be achieved, effectively “fusing” them into a single unified, coherent user interface. As a result, interactions performed in one component are reflected in all other components within the user interface. The same CMV mechanism could be extended to work over the network, in order to coordinate multiple users working on the same data set and to provide real-time collaboration features (requirement 7).

6. Conclusions

Visually supported semi-automatic ontology alignment systems appear as a very promising approach because they are attempts to tap both machine and human resources in such a way as to utilize the strengths and avoid the weaknesses of both. However, this is still a nascent area of research. Available approaches introduce promising ideas addressing various problems identified by user surveys. However, an intuitive solution addressing all points from the requirement list in Section 3.2 will necessitate further cycles of research, prototyping, and user testing.
Since in the semi-automatic ontology alignment, automated mapping generation and interactive visual representation are very closely coupled, we believe that the application of visual analytics techniques will prove to be a promising way for obtaining a highly usable, interactive visual interface, which could fulfil the majority of identified user requirements. Further, including feedback in the ontology alignment process allows utilization of valuable human judgements. The handling of very large, complex, evolving ontologies is another challenge, which has appeared on the radar of ontology alignment researchers. Addressing these challenges by the means of visual interfaces is supported by the fact that techniques, which used visual analytics, are designed to handle huge, complex, dynamically changing, incomplete, and even conflicting information.

Acknowledgements

We thank the authors of the original publications for the permission to use the provided screenshots. The images were taken from original publications or were included as provided, in both cases without performing any modifications.
The Know-Center is funded within the Austrian COMET Program—Competence Centers for Excellent Technologies—under the auspices of the Austrian Ministry of Transport, Innovation and Technology, the Austrian Ministry of Economics and Labor and by the State of Styria. COMET is managed by the Austrian Research Promotion Agency (FFG).
MIMOS Berhad is funded by the Malaysian government through the Ministry of Science, Technology and Innovation (MOSTI).

References and Notes

  1. Gruber, T.R. Toward Principles for the Design of Ontologies Used for Knowledge Sharing. Int. J. Hum. Comput. Stud. 1995, 43, 907–928. [Google Scholar] [CrossRef]
  2. de Bruijn, J.; Ehrig, M.; Feier, C.; Martíns-Recuerda, F.; Scharffe, F.; Weiten, M. Ontology mediation, merging, and aligning. In Semantic Web Technologies: Trends and Research in Ontology-Based Systems; Davies, J., Studer, R., Warren, P., Eds.; John Wiley & Sons Ltd.: Chichester, UK, 2006. [Google Scholar]
  3. Kotis, K.; Lanzenberger, M. Ontology Matching: Status and Challenges. IEEE Intell. Syst. 2008, 23, 84–85. [Google Scholar] [CrossRef]
  4. Euzenat, J.; Le Bach, T.; Barrasa, J.; Bouquet, P.; De Bo, J.; Dieng, R.; Ehrig, M.; Hauswirth, M.; Jarrar, M.; Lara, R.; Maynard, D.; Napoli, A.; Stamou, G.; Stuckenschmidt, H.; Shvaisko, P.; Tessaris, S.; Van Acker, S.; Zaihrayeu, I. D2.2.3: State of the Art on Ontology Alignment; KWEB/2004/D2.2.3/v1.2; Technical Report for Knowledge Web Project IST-2004-507482; Knowledge Web Consortium, August 2004. [Google Scholar]
  5. Gal, A.; Shvaiko, P. Advances in Ontology Matching. In Advances in Web Semantics I: Ontologies, Web Services and Applied Semantic Web; Springer-Verlag: Berlin, Heidelberg, Germany, 2008; pp. 176–198. [Google Scholar]
  6. Do, H.-H.; Rahm, E. COMA: A system for flexible combination of schema matching approaches. In Proceedings of the 28th international conference on Very Large Data Bases, Hong Kong, China, 20–23 August 2002; pp. 610–621.
  7. Aumueller, D.; Do, H.-H.; Massmann, S.; Rahm, E. Schema and ontology matching with COMA++. In Proceedings of the ACM SIGMOD, Baltimore, MD, USA, 14–16 June 2005; pp. 906–908.
  8. Euzenat, J.; Valtchev, P. Similarity-based ontology alignment in OWL-lite. In Proceedings of the 16th European Conference on Artificial Intelligence, Valencia, Spain, 22–27 August 2004; pp. 333–337.
  9. Noy, N.; Musen, M. Anchor-PROMPT: Using non-local context for semantic matching. In Proceedings of IJCAI 2001 Workshop on Ontology and Information Sharing, Seattle, WA, USA, August 2001; pp. 63–70.
  10. Giunchiglia, F.; Shvaiko, P.; Yatskevich, M. S-match: An algorithm and an implementation of semantic matching. In Proceedings of the 1st European Semantic Web Symposium, Heraklion, Greece, 10–12 May 2004; pp. 61–75.
  11. Madhavan, J.; Bernstein, P.; Rahm, E. Generic schema matching with Cupid. In Proceedings of the 27th International Conference on Very Large Data Bases, Roma, Italy, 11–14 September 2001; pp. 49–58.
  12. Melnik, S.; Garcia-Molina, H.; Rahm, E. Similarity Flooding: A Versatile Graph Matching Algorithm and its Application to Schema Matching. In Proceedings of 18th International Conference on Data Engineering, San Jose, CA, USA, 26 February–1 March 2002; pp. 117–128.
  13. Ehrig, M.; Staab, S. QOM—Quick Ontology Mapping. In Proceedings of the 3rd International Semantic Web Conference, Hiroshima, Japan, 7–11 November 2004; pp. 683–697.
  14. Li, J.; Tang, J.; Li, Y.; Luo, Q. RiMOM: A Dynamic Multi-Strategy Ontology Alignment Framework. IEEE Trans. Knowl. Data Eng. 2009, 21, 1218–1232. [Google Scholar] [CrossRef]
  15. Bouquet, P.; Serafini, L.; Zanobini, S. Semantic coordination: A new approach and an application. In Proceedings of the 2nd International Semantic Web Conference, Sanibel Island, FL, USA, 20–23 October 2003; pp. 130–145.
  16. DOLCE: A Descriptive Ontology for Linguistic and Cognitive Engineering, 2009. Available online: http://www.loa-cnr.it/DOLCE.html/ (accessed on 13 July 2010).
  17. Doan, A.; Madhavan, J.; Dhamankar, R.; Domingos, P.; Halevy, A.Y. Learning to Match Ontologies on the Semantic Web. VLDB J. 2003, 12, 303–319. [Google Scholar] [CrossRef]
  18. Noy, N.F.; Musen, M.A. The PROMPT Suite: Interactive Tools for Ontology Merging and Mapping. Int. J. Hum. Comput. Stud. 2003, 59, 983–1024. [Google Scholar] [CrossRef]
  19. Mitra, P.; Wiederhold, G. Resolving terminological heterogeneity in ontologies. In Proceedings of Workshop on Ontologies and Semantic Interoperability at the 15th European Conference on Artificial Intelligence, Lyon, France, 21–26 July 2002.
  20. Ontology Alignment Evaluation Initiative (OAEI), 2009. Available online: http://oaei.ontologymatching.org/ (accessed on 13 July 2010).
  21. Euzenat, J.; Ferrara, A.; Hollink, L.; Hollink, L.; Isaac, A.; Joslyn, C.; Malaisé, V.; Meilicke, C.; Nikolov, A.; Pane, J.; Sabou, M.; Scharffe, F.; Shvaiko, P.; Spiliopoulos, V.; Stuckenschmidt, H.; Šváb-Zamazal, O.; Svátek, V.; Trojahn, C.; Vouros, G.; Shenghui, W. Results of the Ontology Alignment Evaluation Initiative 2009. Available online: http://oaei.ontologymatching.org/2009/results/oaei2009.pdf/ (accessed on 13 July 2010).
  22. Shneiderman, B. Inventing discovery tools: Combining information visualization with data mining. Inform. Visual. 2002, 1, 5–12. [Google Scholar] [CrossRef]
  23. Wong, P.C.; Thomas, J. Visual Analytics. IEEE Comput. Graph. Appl. 2004, 24, 20–21. [Google Scholar] [CrossRef] [PubMed]
  24. Keim, D.A.; Mansmann, F.; Oelke, D.; Ziegler, H. Visual Analytics: Combining Automated Discovery with Interactive Visualizations. Discov. Sci. 2008, 5255, 2–14. [Google Scholar]
  25. Shneiderman, B. The Eyes Have It: A Task by Data Type Taxonomy for Information Visualizations. In Proceedings of the 1996 IEEE Symposium on Visual Languages, Boulder, CO, USA, 3–6 September 1996; p. 336.
  26. Fayyad, U.; Piatetsky-Shapiro, G.; Smyth, P. From Data Mining to Knowledge Discovery: An Overview. In Advances in Knowledge Discovery and Data Mining; AAAI Press/The MIT Press: Menlo Park, CA, 1996; pp. 1–34. [Google Scholar]
  27. Falconer, S.M.; Noy, N.F.; Storey, M.-A. Ontology Mapping—A User Survey. In Proceedings of the 2nd International Workshop on Ontology Matching at ISWC 07 and ASWC 07, Busan, Korea, 11 November 2007.
  28. Conroy, C.; O'Sullivan, D.; Lewis, D. Towards Ontology Mapping for Ordinary People. In Proceedings of European Semantic Web Conference, PhD Symposium, Tenerife, Spain, 1–5 June 2008.
  29. Falconer, S.M.; Noy, N.; Storey, M.-A. Towards understanding the needs of cognitive support for ontology mapping. In Proceedings of the Ontology Matching Workshop (5th International Semantic Web Conference), Athens, Giorgia, USA, 5 November 2006; pp. 25–36.
  30. Lanzenberger, M.; Sampson, J.J.; Rester, M.; Naudet, Y.; Latour, T. Visual ontology alignment for knowledge sharing and reuse. J. Knowl. Manage. 2008, 12, 192–120. [Google Scholar] [CrossRef]
  31. Katifori, A.; Halatsis, C.; Lepouras, G.; Vassilakis, C.; Giannopoulou, E. Ontology Visualization Methods—A Survey. In ACM Computing Surveys (CSUR); ACM: New York, NY, USA, 2007; Volume 39. [Google Scholar]
  32. Lanzenberger, M.; Sampson, J.; Rester, M. Visualization in Ontology Tools. In Proceedings of the International Conference on Complex, Intelligent and Software Intensive Systems, Fukuoka, Japan, 16–19 March 2009; pp. 705–711.
  33. Cruz, I.F.; Sunna, W.; Makar, N.; Bathala, S. A visual tool for ontology alignment to enable geospatial interoperability. J. Visual Lang. Comput. 2007, 18, 230–254. [Google Scholar] [CrossRef]
  34. Falconer, S.M.; Storey, M.-A. A cognitive support framework for ontology mapping. In Proceedings of International Semantic Web Conference, Busan, Korea, November 2007; pp. 114–127.
  35. Falconer, S.M.; Bull, R.I.; Grammel, L.; Storey, M.-A. Creating visualizations through ontology mapping. In Proceedings of the 2nd International Workshop on Ontology Alignment and Visualization, Fukuoka, Japan, 16–19 March 2009.
  36. Herman, I.; Melancon, G.; Marshall, M.S. Graph Visualization and Navigation in Information: A Survey. In IEEE Transactions on Visualization and Computer Graphics, Los Alamitos, CA, USA; 2000; Volume 6, pp. 24–43. [Google Scholar]
  37. Cui, W. A Survey on Graph Visualization. PhD Qualifying Exam (PQE) Report. Computer Science Department, Hong Kong University of Science and Technology: Kowloon, Hong Kong, 2007. Available online: http://www.cse.ust.hk/~weiwei/PQE/WeiweiPQE.pdf/ (accessed on 13 July 2010).
  38. Kolli, R.; Doshi, P. OPTIMA: Tool for Ontology Alignment with Application to Semantic Reconciliation of Sensor Metadata for Publication in SensorMap. In Proceedings of the second IEEE International Conference on Semantic Computing, Santa Clara, CA, USA, 4–7 August 2008; pp. 484–485.
  39. Lanzenberger, M.; Sampson, J. AlViz—A Tool for Visual Ontology Alignment. In Proceedings of the 10th International Conference on Information Visulization, London, UK, July 2006; Banissi, E., Burkhard, R.A., Ursyn, A., et al., Eds.; IEEE Computer Science Society: Washington, DC, USA, 2006; pp. 430–440. [Google Scholar]
  40. Shneiderman, B. Tree visualization with Tree-maps: A 2-d space-filling approach. ACM Trans. Graphic. 1991, 11, 92–99. [Google Scholar] [CrossRef]
  41. Kerwin, T. Survey of treemap techniques, retrieved 2009. Available online: http://www.cse.ohio-state.edu/~kerwin/treemap-survey.html/ (accessed on 13 July 2010).
  42. Müller, F. Granularity based multiple coordinated views to improve the information seeking process. PhD Thesis, University of Konstanz, Konstanz, Germany, 2005. [Google Scholar]
  43. Sabol, V.; Kienreich, W.; Muhr, M.; Klieber, W.; Granitzer, M. Visual Knowledge Discovery in Dynamic Enterprise Text Repositories. In Proceedings of the 13th International Conference on Information Visualisation, Barcelona, Spain, 14–17 July 2009; pp. 361–368.

