Natural Resource Knowledge and Information Management via the Victorian Resources Online Website

Abstract
: Since 1997, the Victorian Resources Online (VRO) website ( http://www.dpi.vic.gov.au/vro) has been a key means for the dissemination of landscape-based natural resources information via the internet in Victoria, Australia. The website currently consists of approximately 11,000 web pages, including 1900 maps and 1000 downloadable documents. Information is provided at a range of scales—from statewide and regional overviews to more detailed catchment and sub-catchment levels. At all these levels of generalisation, information is arranged in an organisationally agnostic way around key knowledge “domains” (e.g., soil, landform, water). VRO represents a useful model for the effective dissemination of a wide range of natural resources information; relying on partnerships with key subject matter experts and data custodians, including a “knowledge network” of retired land resource assessment specialists. In this paper, case studies are presented that illustrate various approaches to information and knowledge management with a focus on presentation of spatially contexted soil and landscape information at different levels of generalisation. Examples are provided of adapting site-based information into clickable maps that reveal site-specific details, as well as “spatialising” data from specialist internal databases to improve accessibility to a wider audience. Legacy information sources have also been consolidated and spatially referenced. More recent incorporation of interactive visualisation products (such as landscape panoramas, videos and animations) is providing interactive rich media content. Currently the site attracts an average of 1190 user visits per day and user evaluation has indicated a wide range of users, including students, teachers, consultants, researchers and extension staff. The wide range of uses for information and, in particular, the benefits for natural resource education, research and extension has also been identified.1. Introduction
In his review of the Australian natural resource management knowledge system, Campbell (2006) notes that better knowledge is needed to manage our natural resources more sustainably and that any natural resource management knowledge system must seek ways to share tacit knowledge more widely and minimise its inexorable erosion as experienced people disappear [1]. Information access is therefore a key component of a knowledge system. Campbell also recognises that people require different information at different stages of their learning and decision-making processes, in forms that suit their individual learning styles; and that web-based applications lend themselves well to this model [1].
Knowledge management was raised as a critical issue in the State of Victoria's most recent catchment condition report [2]. In Victoria, there has been a long-term investment in development of natural resource knowledge assets in the form of reports, unpublished material, spatial and non-spatial datasets, information systems, models and applications [3]. There is also a wealth of tacit knowledge held by experienced individuals, many who are now retired or may retire within the next 5 years.
The Victorian Resources Online (VRO) website ( http://www.dpi.vic.gov.au/vro) has developed over the past 14 years to become a significant repository of natural resources information for Victoria. It relies on working with data and information custodians as well as experienced subject matter specialists to develop web-based information products and maps. In this article we provide an overview of the development history, website design and functionality of the VRO website. We then discuss approaches to managing information and knowledge, with a particular focus on soil and landform as a key theme. We argue that harnessing information and knowledge—in forms understood by a wide target audience—and disseminating via the web, will support natural resource related research, planning, extension and education. Some user perspectives are provided to support this argument.
1.1. The Data-Information-Knowledge-Wisdom Hierarchy
Ackoff (1989) proposed a hierarchy based on the levels of data, information, knowledge, understanding and wisdom [4]. This data-information-knowledge-wisdom (DIKW) hierarchy (also variously referred to as the “knowledge hierarchy”, “information hierarchy” and “knowledge pyramid”) is considered to be one of the most fundamental and widely recognised models in the information and knowledge literatures [5]. It has since been modified by different authors and used to contextualise data, information, knowledge, and sometimes wisdom, with respect to each other, and identify processes involved in the transformation from a lower level to the next level.
Bellinger et al. (2004), in an online article [6], proposed a modification of Ackoff's DIKW hierarchy to represent the transition from data to information to knowledge, and finally to wisdom, whereby “understanding” supports the transition from each level to the next. Information is created by understanding relations between data; knowledge is created by understanding patterns in information; and wisdom embodies an understanding of fundamental principles embodied within the knowledge. According to Bellinger et al., people who have “understanding” can undertake useful actions because they can synthesise new knowledge, or at least new information, from what is previously known and understood [6]. In this article, we have used an adaptation of this hierarchy to discuss VRO approaches to information and knowledge management–as discussed in Section 3.
Zack (1999) notes that “data” represents non-contextualised observations, or facts, which are not always directly meaningful; whereas “information” results from placing data within a meaningful context. Knowledge is what a user believes and values, and is based on the organised accumulation of information through experience, communication or inference. Knowledge can be viewed both as something to be stored and manipulated, as well as applying expertise [7]. Davenport et al. (1998) describe knowledge as “information combined with experience, context, interpretation, reflection and perspective” [8]. They contend that it is a high value form of information that can be used to make decisions. Groff and Jones (2003) also believe that information and data can only merely inform (or confuse), but that knowledge can guide action [9]. According to Ackoff (1989) knowledge can be obtained either by transmission from someone who has it, i.e., by instruction, or by extracting it from experience [4]. Wiig (2000) contends that knowledge is therefore possessed by humans (e.g., beliefs, perspectives, concepts, judgments, methodologies and know-how) and is used to “receive” information (e.g., recognise and identify; analyse, interpret and evaluate; synthesise, assess and decide) and act on it [10].
Choo et al. (2000) described the progression of data into information and then into knowledge [11]. To produce information, data needs to be framed, categorised, aggregated and contextualised. Transformation from information to knowledge occurs as the result of two complementary dynamics: the “structuring” of data and information that imposes or reveals order and pattern; as well as the human “acting” on information that attributes sense and salience. Information depends on an aggregation of data, whilst knowledge builds on accumulated experience. Wiig (2000) describes the discontinuity between information and knowledge being caused by how new knowledge is created from received information. To become knowledge, new insights need to be internalised by establishing links with already existing knowledge. Therefore, prior knowledge is used to make sense of received information to create new knowledge [10].
Wisdom is a less tangible concept and is only defined in three of the 15 textbooks on information and knowledge management reviewed by Rowley (2006) [5]. Bellinger et al. suggest that moving from knowledge to wisdom involves “understanding principles” and that only wisdom deals with the future because it incorporates vision and design, whereas data, information and knowledge relate to the past, dealing only with what has been or what is known [6]. Awad and Ghaziri (2004) believe that wisdom is the highest level of abstraction and involves vision, foresight and the ability to “see beyond the horizon” [12]. Jessup and Valacich (2003) see wisdom as “accumulated knowledge” that allows a person to apply concepts across domains [13]. We consider senior and retired specialists, who each have decades of experience in soil and landform assessment, as having this accumulated knowledge, or “wisdom”.
1.2. Knowledge Management
Knowledge management (KM) as a discipline has existed for a number of decades and numerous definitions of, and approaches to, exist in the literature. In the broadest sense, KM encompasses all aspects of creating, maintaining, organising, classifying, representing, storing, retrieving, analysing and presenting knowledge [14]. An informal study conducted by Dalkir (2005) identified over 100 published definitions of knowledge management, which he describes as a continuous cycle of three processes: (i) knowledge creation and capture; (ii) knowledge sharing and dissemination; and (iii) knowledge acquisition and application [15]. According to Ruggles (1999), KM is a term that is now used to describe everything from organisational learning efforts to database management tools— but should be considered to be more of “an approach that adds or creates value by more actively leveraging the know-how, experience, and judgment resident within and, in many cases, outside of an organisation” [16]. This view of KM is supported by the authors of this paper in relation to the management of soil and landscape information on VRO. In the Victorian Department of Primary Industries (DPI) there are only two staff remaining with over 20 years experience in soil and land survey assessment and mapping. They work in partnership with external and retired specialists to develop web-based information at various levels of generalisation.
According to Duffy (2000), explicit knowledge is knowledge that is “documented and public; structured, fixed-content, externalised, and conscious”. Tacit knowledge, on the other hand, is “personal, undocumented knowledge; context sensitive, dynamically-created and derived, internalised, and experience-based; often resides in the human mind, behaviour and perception” [17]. In the context of soil and landscape assessment discussed in this paper, tacit knowledge of subject specialists has been developed experientially through decades of field-based work involving the characterisation and mapping of soil and landscapes and understanding their nature, distribution and genesis.
Knowledge management involves the conversion of tacit knowledge into explicit knowledge. Explicit knowledge tends to represent the final product, whereas tacit knowledge is the “know-how” or all of the processes required to produce the final product. Awad and Ghaziri (2004) describe tacit knowledge as embedded within the human mind, whereas explicit knowledge is codified and digitised (e.g., in documents, reports, training courses) [12]. Rowley (2007) offers a perspective that it is difficult to argue that explicit knowledge recorded in documents and information systems is anything other then “information” [5]. Dalkir (2005) describes a popular misconception that KM focuses on rendering whatever is tacit into more explicit or tangible forms, and then storing (or archiving) these into a knowledge portal. He argues that KM is even broader and includes leveraging the value of organisational knowledge and know-how that accumulates over time [15]. VRO leverages organisational knowledge and can therefore be considered a form of knowledge management, whereby tacit knowledge is harnessed to create web-based information.
Zack (1999) describes how many organisations have become complex and that their knowledge is often fragmented, difficult to locate and share [7]. Knowledge repositories are usually intranet sites or portals that preserve, manage, and leverage organisational memory [15]. Meyer and Zack (1996) analysed the major developmental stages of a knowledge repository and mapped these onto a KM cycle that involves: acquisition of data or information; refinement (i.e., analyse, interpret, report, edit, format); storage and retrieval (i.e., indexed and linked), distribution (i.e., form of delivery, such as, internet, CD-ROM) and presentation (e.g., interactive). They also note that ensuring ease of use and sufficient functionality is a key requirement of the information product [18]. VRO is a knowledge repository that preserves, manages and leverages both current and predecessor organisational memory as web-based information, particularly related to the nature and distribution of Victoria's soil and landforms.
1.3. Web-Based Access to Natural Resource Data, Information and Knowledge
Many natural resource agencies have moved away from paper reports and maps to digital formats, and the types and quantity of electronic publications available on the internet have multiplied dramatically. Internet search has allowed wide and easy access to a range of data and information products.
There are many websites throughout the world that provide access to spatially-based natural resource data and information. The degree to which these sites contain data, information and “knowledge” differs. Data “clearinghouses” or “warehouses”, for example, function as portals to access and download geospatial data offered by organisations, but may include an interactive map viewer or the ability to produce customised maps. Metadata descriptions inform users about the data sources that can be viewed and/or downloaded. Web-based GIS (webGIS) applications for accessing natural resource data and map services are now prevalent. Using an interface within a web browser, users are able to access an organisation's Internet Map Server, send queries and create customised maps. Some sites also provide more of an “atlas” function, providing access to static map presentations. Examples of a range of websites with differing functionality include:
The Florida Geographic Data Library ( http://www.fgdl.org/) provides a mechanism for distributing spatial data for the State of Florida in the USA, including data on land use, land cover, soils and hydrography. This is basically a repository of data that can be downloaded following a key word search.
The Alaska Geospatial Data Clearinghouse ( http://agdc.usgs.gov/) provides a metadata description for key datasets and allows downloading of shapefiles and database files from Departments such as the US Geological Survey and Bureau of Land Management (e.g., water resources, national geochemical survey, elevation, geology and ecoregions).
The Montana GIS Portal ( http://gisportal.mt.gov) enables the discovery and access of spatial data and web mapping services for use in web-based mapping tools. The Montana Geographic Information Clearinghouse ( http://nris.mt.gov/gis/) offers access to GIS data resources for GIS professionals, as well as access to maps and interactive mapping tools for the general public. It also has an “Atlas” function, in that maps (in GIF and PDF formats) can be accessed via a search based on a geographic area of interest (e.g., statewide, county, watershed), The Digital Atlas of Montana ( http://maps2.nris.mt.gov/mapper/) is an interactive mapping tool that allows users to customise maps for individual datasets that they specify.
There are few natural resource data warehouses in Australia; the Victorian Water Resources Data Warehouse ( http://www.vicwaterdata.net/vicwaterdata/home.aspx) being one example. This site has been operational since 2000 and is dedicated to providing water resource data for the State of Victoria. It provides access to both raw and summary data on both water quality and quantity and is a repository for published documents produced from this data. Data can be sourced via a GIS map interface.
The interactive web GIS service Florida Seminole County Watershed Atlas ( http://www.seminole.wateratlas.usf.edu/) allows access to data and metadata (including real-time) as well as map generation and viewing associated with water and environment.
The Atlas of Canada ( http://atlas.nrcan.gc.ca/site/english/index.html), initially launched in 1994, is a collection of interactive maps (web GIS), graphics, images and multi-media resources of environment, history, climate change, and freshwater datasets.
In Australia, the Western Australian NRM Shared Land Information Platform (SLIP) provides access to a range of spatial data and information products from state repositories via an interactive map interface. Maps can be selected based on NRM region and datasets include soil-landscape mapping, invasive species and soil-landscape capability ( http://spatial.agric.wa.gov.au/slip/). The South Australian e-NRIMS (Natural Resource Information Management System) provides access to geospatial data, including soils, using a map viewer ( http://e-nrims.dwlbc.sa.gov.au/). The New South Wales Natural Resource Atlas ( http://www.nratlas.nsw.gov.au/) is a portal to maps and data for environmental management, planning, research and education—providing a catalogue of natural resource databases and geographic information that can be accessed statewide or by NRM region.
The VRO website is neither a data warehouse nor an interactive mapping facility. It is instead a long-running spatially-based information and knowledge repository that provides static image-based maps (mainly GIF format), presented as information products at an appropriate scale. Many of the maps also have a “spatial indexing” function, being clickable to access relevant information elsewhere on the website. Much of the information provided is not available in a corporate-wide GIS, and is sometimes derived from data that is not suited to being made publicly accessible (e.g., it is in a form that could be misinterpreted by non-specialists or may be subject to privacy restrictions in the case of some data collected on private land). VRO is also a significant grey literature repository, containing around 500 contemporary and legacy reports that have been digitally captured and made available as downloadable documents. Brizga and Geraghty (2011) note that data, information and knowledge needs to be indexed so that it can be found, and describe the VRO website as a “good example of an in-house indexing and knowledge retrieval system within the Victorian Government” [19].
2. Development and Management of the Victorian Resources Online Website
2.1. Development Background
The Victorian Resources Online website was launched in 1997 when hosted by the former Department of Natural Resources and Environment (NRE). It was originally conceived to replace the hardcopy Atlas of Victoria [20] and provide access to statewide overview maps of natural resources information for the knowledge domains of “climate”, “landform”, “land use”, “water” and “soil”. When launched in 2007 it consisted of around 200 web pages and 50 image-based maps. Additional domains of “biodiversity”, “marine”, and “land and water management” have been included in ensuing years. “Land and water management” was established as a domain to manage a range of natural resource theme areas not directly relevant to the “soil”, “landform”, “water” or “land use”; and that have a broader catchment and land management focus—including “salinity management”, “catchment management”, “irrigated agriculture”, “land degradation” and “invasive plants”.
Central to Victoria's catchment management framework are ten Catchment Management Authorities (CMAs) established under Victoria's main NRM act, the Catchment and Land Protection Act (1994) [21]. Regional VRO sub-sites were established in 2000 to provide access to more regionally contexted information based on these 10 catchment management regions. Links have been established, wherever relevant, between regionally contexted information and relevant statewide and overview information.
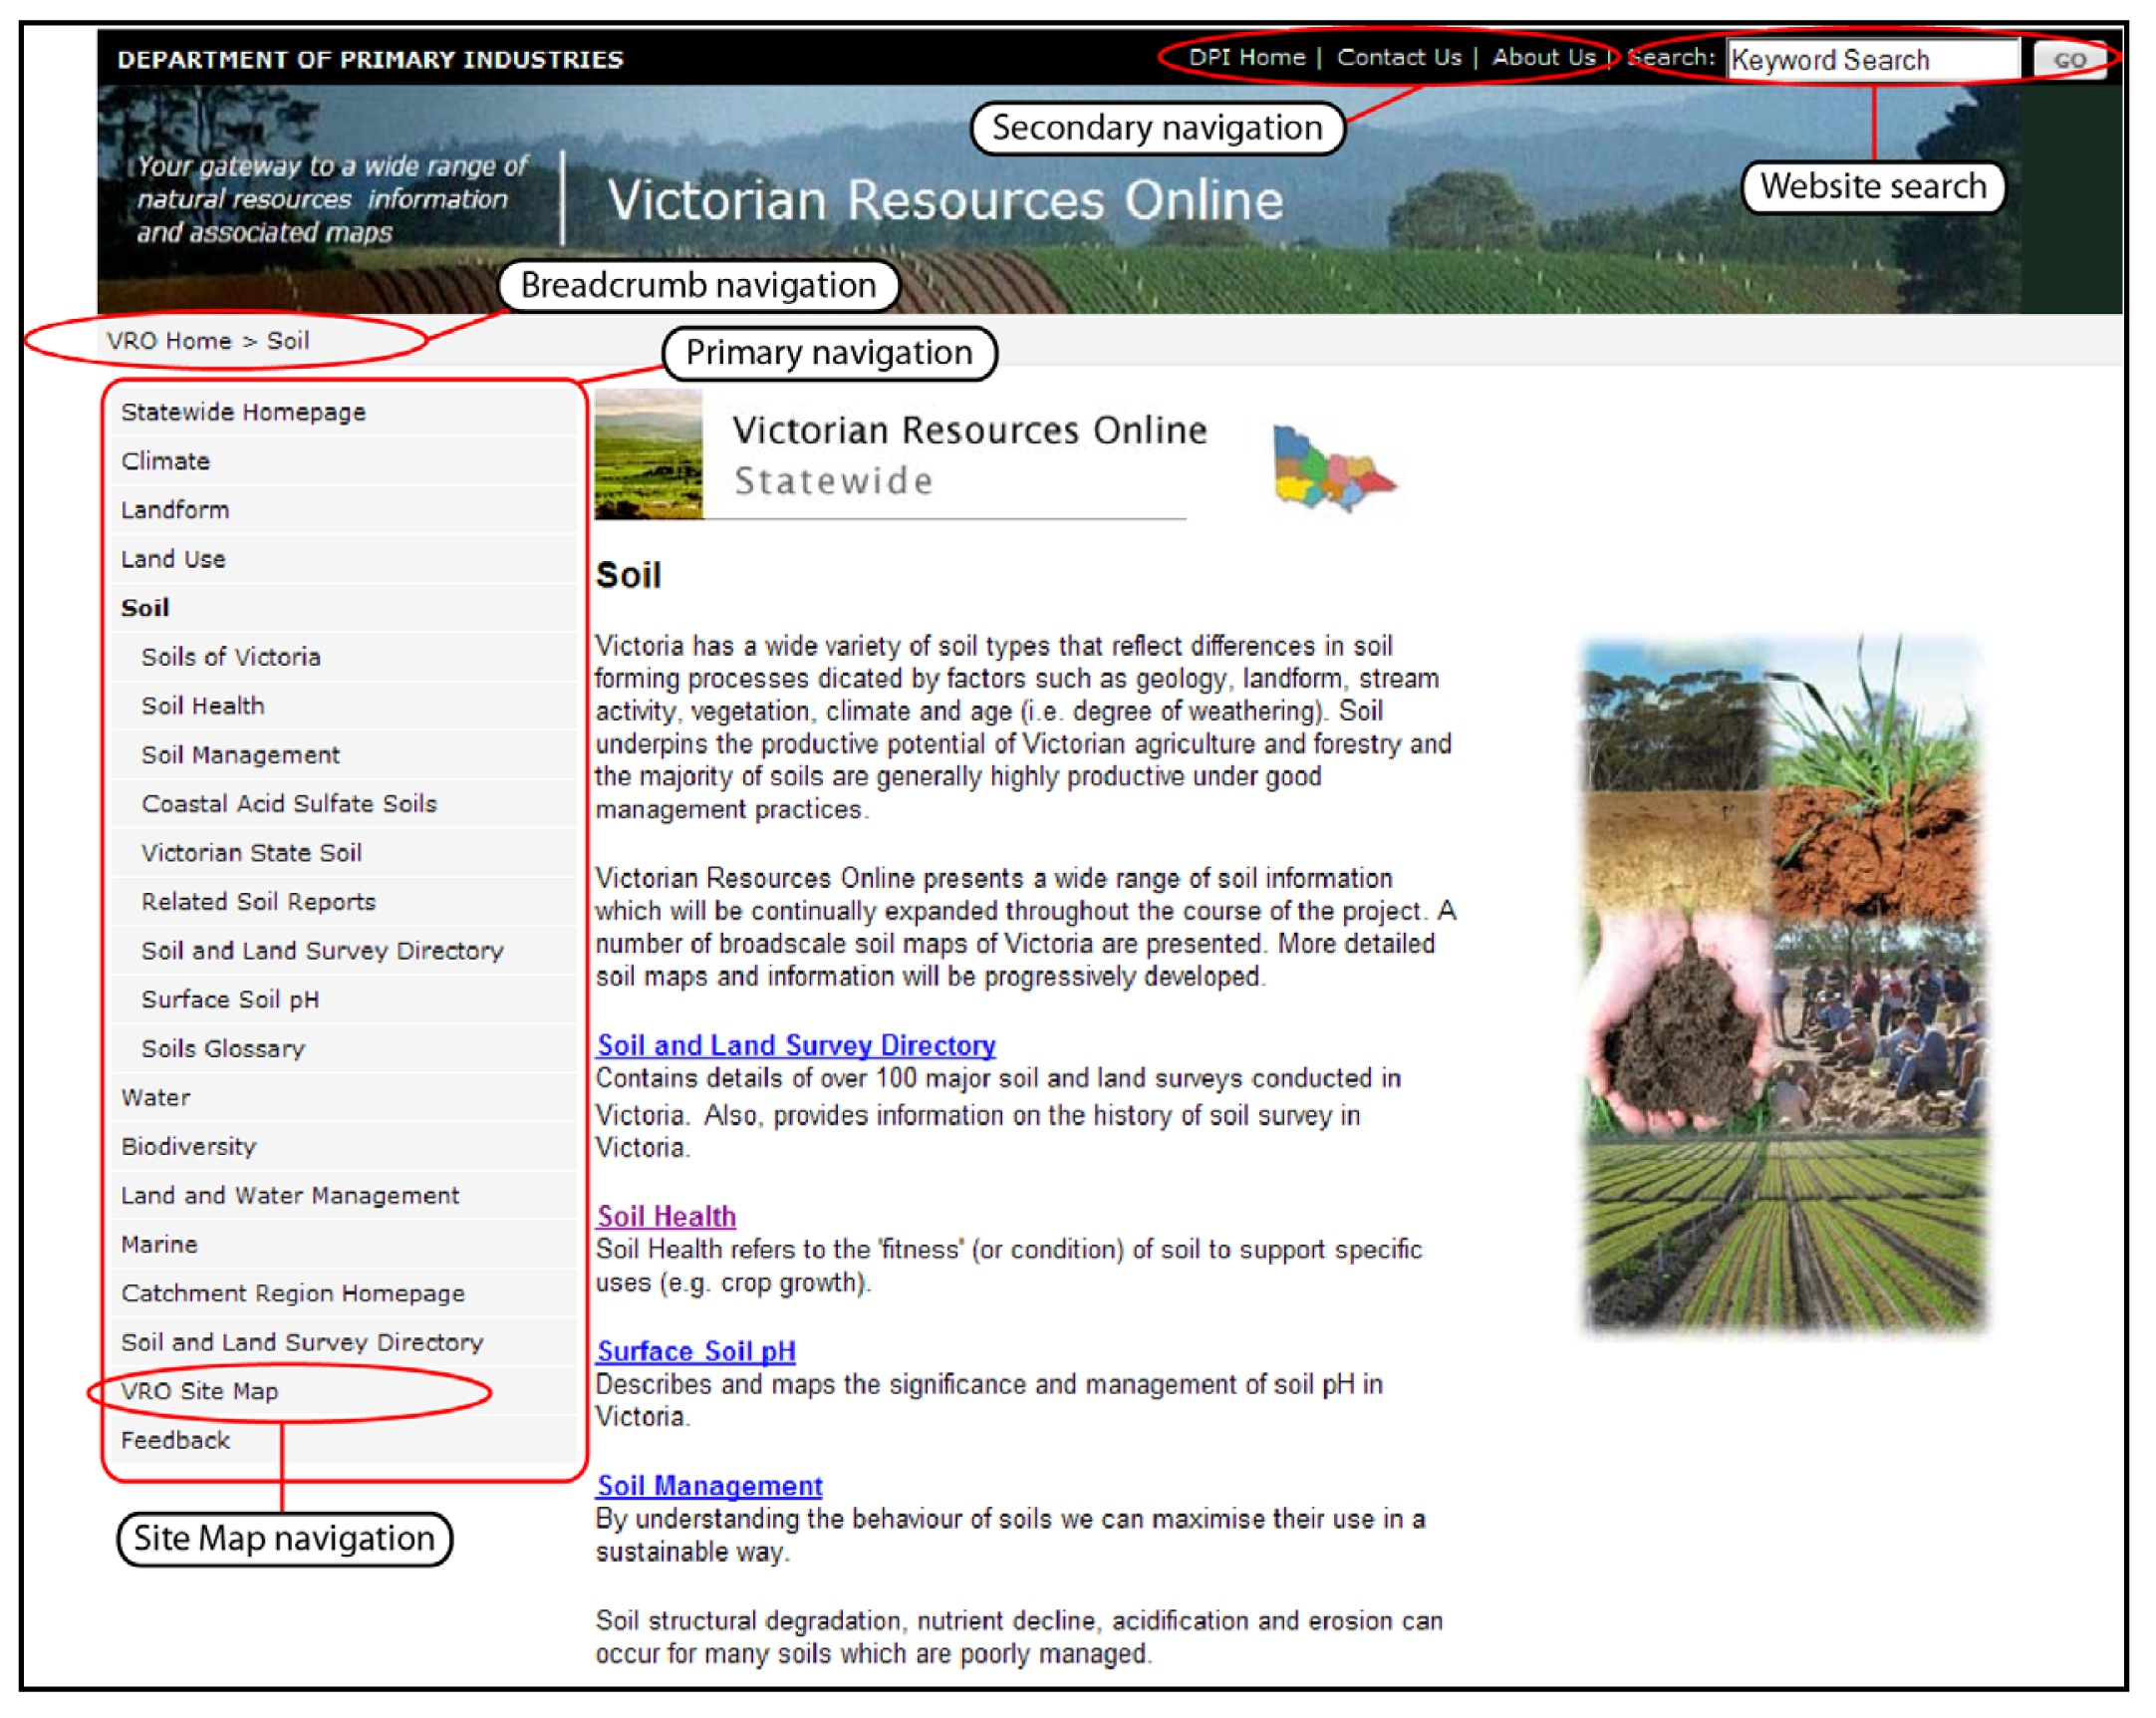
In January 2003, most of the functions of the former NRE were moved into the newly created Department of Sustainability and Environment (DSE) and Department of Primary Industries (DPI). The hosting of the VRO website has since been undertaken by DPI, with DSE providing co-funding support. The Future Farming Systems Research Division (FFSR) within DPI is the custodian of Victorian data related to soils and land use and is responsible for managing the VRO project. DSE became the custodian of key data related to water, vegetation and biodiversity, necessitating some changes to VRO content, particularly in the “water” section, that now largely signposts users to relevant information on the DSE website. VRO currently consists of around 11,000 web pages as well as 1900 maps and 1000 downloadable documents. Information is provided at a range of scales—from statewide to more detailed catchment management region and sub-catchment levels. The current VRO homepage is shown in Figure 1.
2.2. The VRO Website Solution
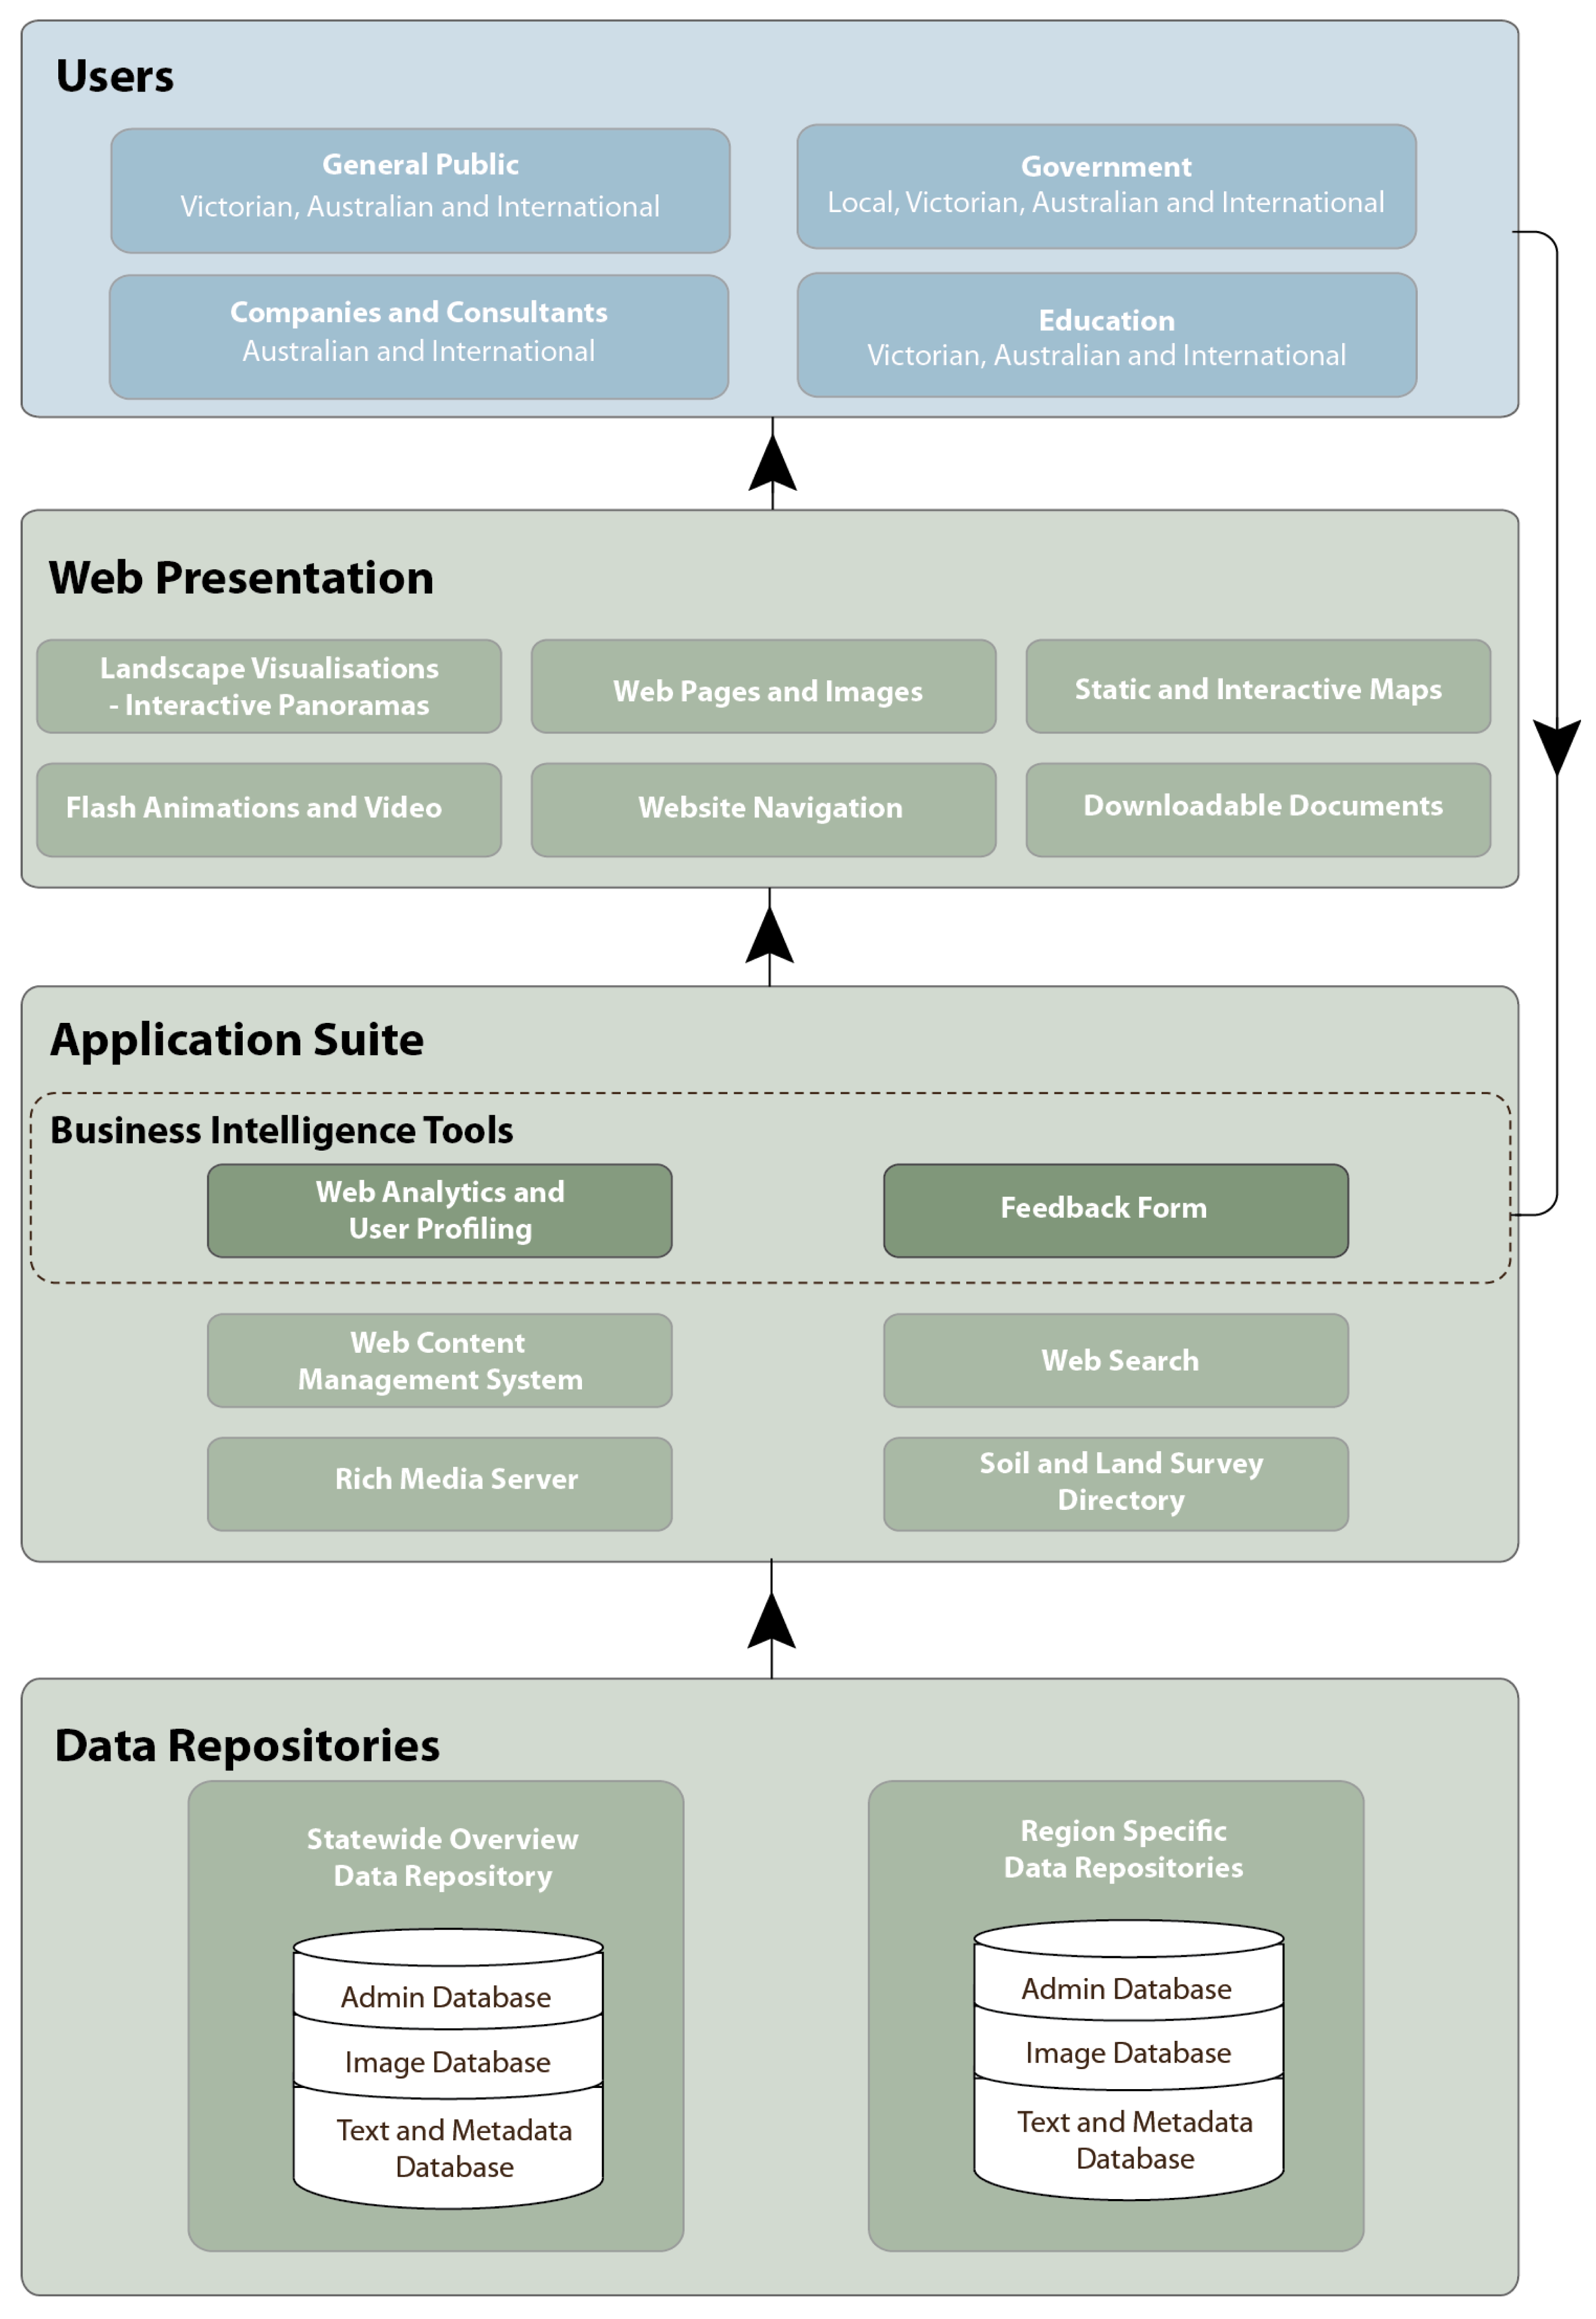
The structure and functionality of the VRO website has evolved significantly throughout the last 14 years. During its evolution, additional databases have been developed to manage regionally specific content. The Application Suite has expanded to enhance website functionality, understand user interaction with the website and, in recent years, deliver rich media. Web presentation techniques have been enhanced to include interactive and static visualisations. Figure 2 provides a schematic representation of the current VRO Website Solution, the components of which are described below.
2.2.1. Data Repositories
One statewide overview data repository and ten regional specific repositories comprise the overall VRO data environment. Separate repositories exist for each of Victoria's catchment management regions (i.e., Mallee, Wimmera, Glenelg-Hopkins, Corangamite, Port Phillip and Westernport, West Gippsland, East Gippsland, North East, Goulburn Broken and North Central). For each of the 11 data repositories, there are three separate Lotus Notes databases, one for text and metadata, and one each for images and administration. The administration databases are used to store website template “schemes” and database-specific images.
2.2.2. Application Suite
The VRO Application Suite includes the Web Content Management System (WCMS), together with the server environment and various functionalities including search, security and authorisation workflow and delivery of rich media via an external server.
Web Content Management System (WCMS)
Text and metadata, images and administration functions are all managed within the VRO WCMS. The WCMS has been specifically developed using IBM Lotus Notes and operates on a Lotus Domino server environment. Content is added to the WCMS databases using Lotus Notes.
Rich Media Server
A third party hosting environment is used to deliver rich media elements, including animations and video content, that overcomes the limitation of the Lotus Notes WCMS—that is, the inability to pass parameters within URLs.
Soil and Land Survey Directory
The Soil and Land Survey Directory (SLSD) was developed as a separate Lotus Notes database to facilitate access to over 100 soil and land survey reports. Specific search capability allows users to locate content by various attributes used to categorise content (e.g., by “keyword”, or spatially by “local government area” or “catchment management region”).
Website Search
A third-party website search allows for text, metadata and downloadable document searching across all of the VRO repositories.
Business Intelligence Tools
The VRO project uses various tools to collect user interaction data to inform development of future content and ways to enhance accessibility. Web usage is tracked using a browser side Web Analytics package (Google Analytics). Further analysis of this data allows users to be allocated to a particular origin network, providing useful user-affiliation intelligence (User Profiling). Customised Feedback Forms have been developed using a third-party service to allow for user feedback on specific content areas.
2.2.3. Web Presentation
Web content is developed in many different formats, including HTML, PDF, Flash, JPEG, GIF and video, and managed within the WCMS. Increasingly, rich media content is being used to enhance information delivery.
Static and Interactive Maps
Many maps are provided on the website as images (GIF and PNG formats) exported from GIS and modified in Photoshop. In some cases, higher resolution PDF format maps are also provided for higher quality printing. Many of the image-based maps on VRO have limited interactivity in that they are clickable, via hyperlinks, to enable access to associated information. More recently, image-based maps have been enhanced by draping aerial photography over the Digital Elevation Model (DEM) and setting 50% transparency, creating a 3D relief effect.
Interactive Landscape Panoramas
Interactive landscape panoramas have been recently developed using Flash-based software and included on the website. In-house customisations have been made to an “out of the box” website panorama viewer application to increase functionality and interactivity. These are hosted via a third-party hosting environment.
Flash Animations and Video
Incorporation of video is now routine within VRO. These include landscape “flyover” scenes developed within GIS. Screen-capture software is used to record a video file that is then converted to Flash format for integration in web pages. Videos are published in both high and low quality formats to suit different users. Animation sequences that are web-enabled using Flash are also provided.
Downloadable Documents
Approximately 500 “grey literature” documents (the majority legacy reports) are provided on VRO as downloadable PDF documents maintained at a maximum size of 2 Mb (Department standard). For larger reports or maps, this usually requires documents to be split into separate downloadable files. Optimisation is also required to ensure that documents are of good readable and printable quality and within the maximum allowable file size. Most legacy reports (i.e., before 1995) are not available in digital form, so need to be re-typed and/or text scanned using optical character recognition. After scanning, documents require re-formatting and spell-checking. Diagrams and maps are often separately scanned and re-inserted into the digital version of the document.
2.2.4. Website Users
The primary target audience for the VRO website has been Government staff involved in natural resource management–including research, extension, policy, planning and extension. However, user evaluation (as discussed in Section 4 of this article) has indicated a range of additional beneficiaries including education (students and teachers), the general public and consultants.
2.3. Information Architecture
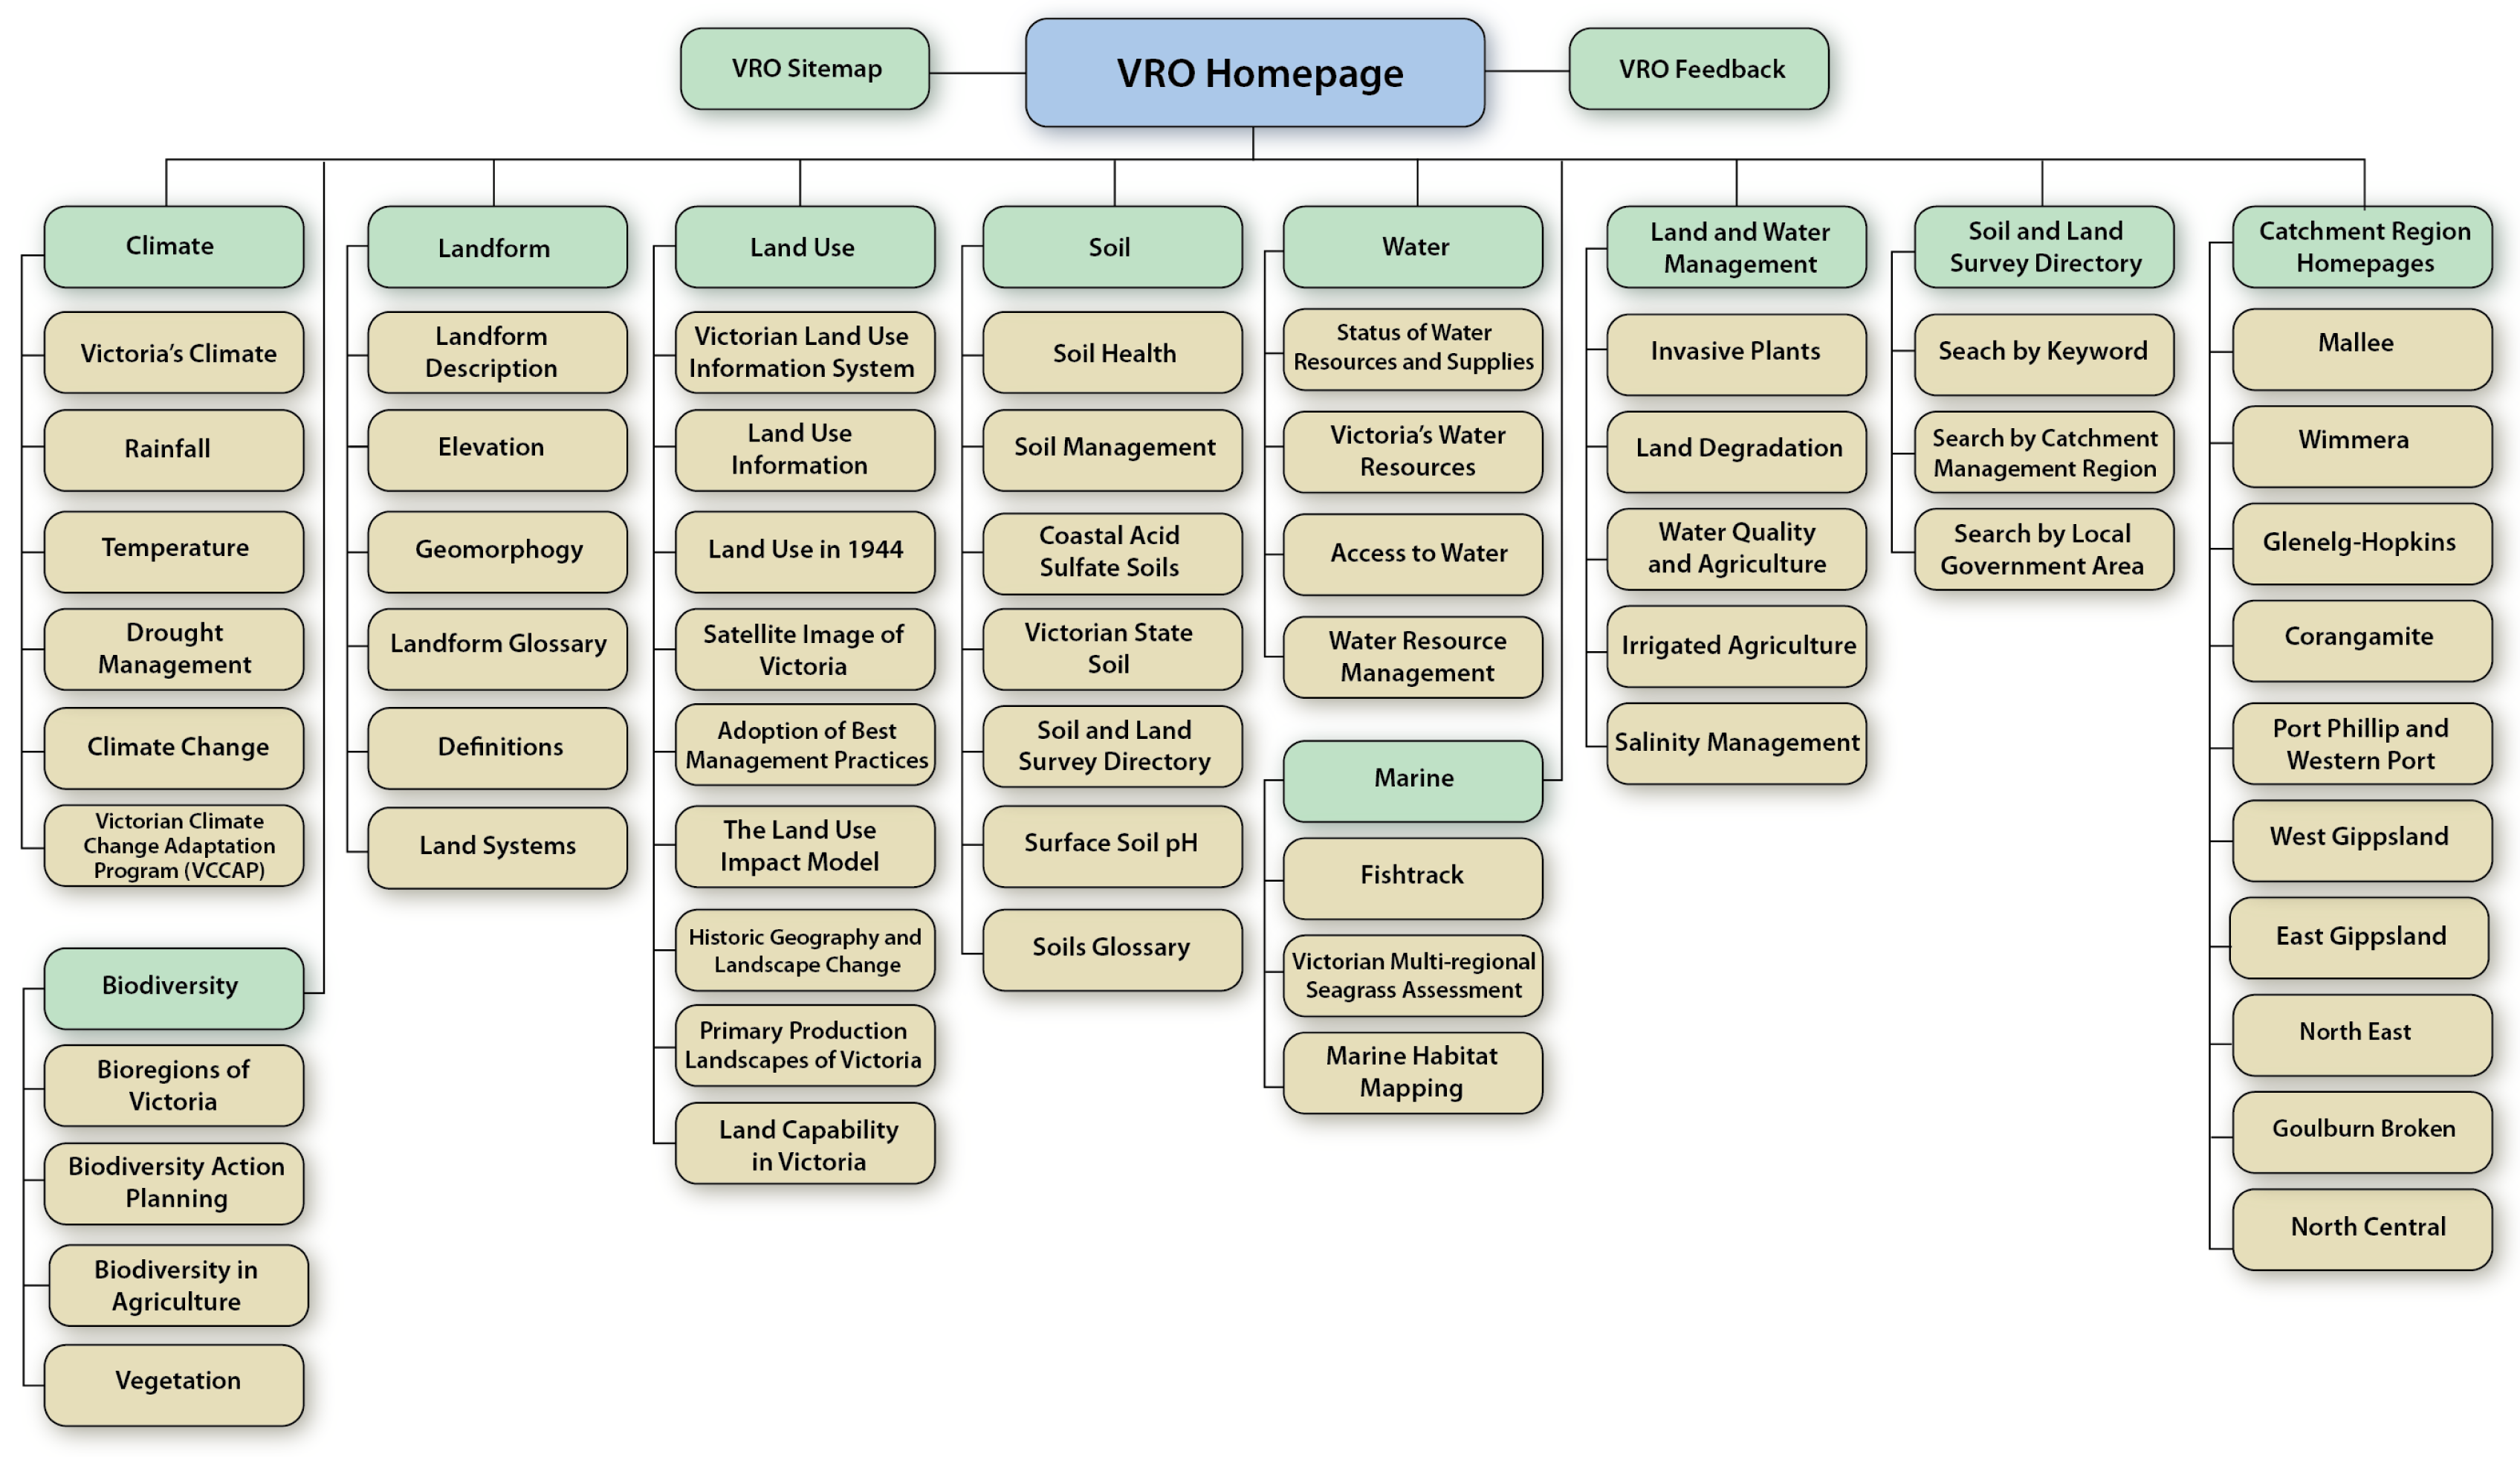
The VRO Information Architecture (IA) is essentially “organisationally-agnostic” as it is based around natural resource themes rather than departmental structures, and is relevant to not just a single Department. This structure has proved to be adaptable and remained largely unchanged in the transition from NRE to DPI, but is also flexible, having allowed for organic growth in content areas over 14 years. Information is provided at a range of scales—from statewide and regional overviews to sometimes more detailed catchment and sub-catchment levels. Information at all spatial levels is organised around key secondary level knowledge domains. Figure 4 provides a schematic overview of the VRO Information Architecture at the statewide level that includes major tertiary level content categories within each of the domains. The same approach is applied to each of the regional sub-sites, but they have fewer, and more regionally-specific, tertiary level categories.
3. Approaches to Managing Soil and Landscape Information and Knowledge
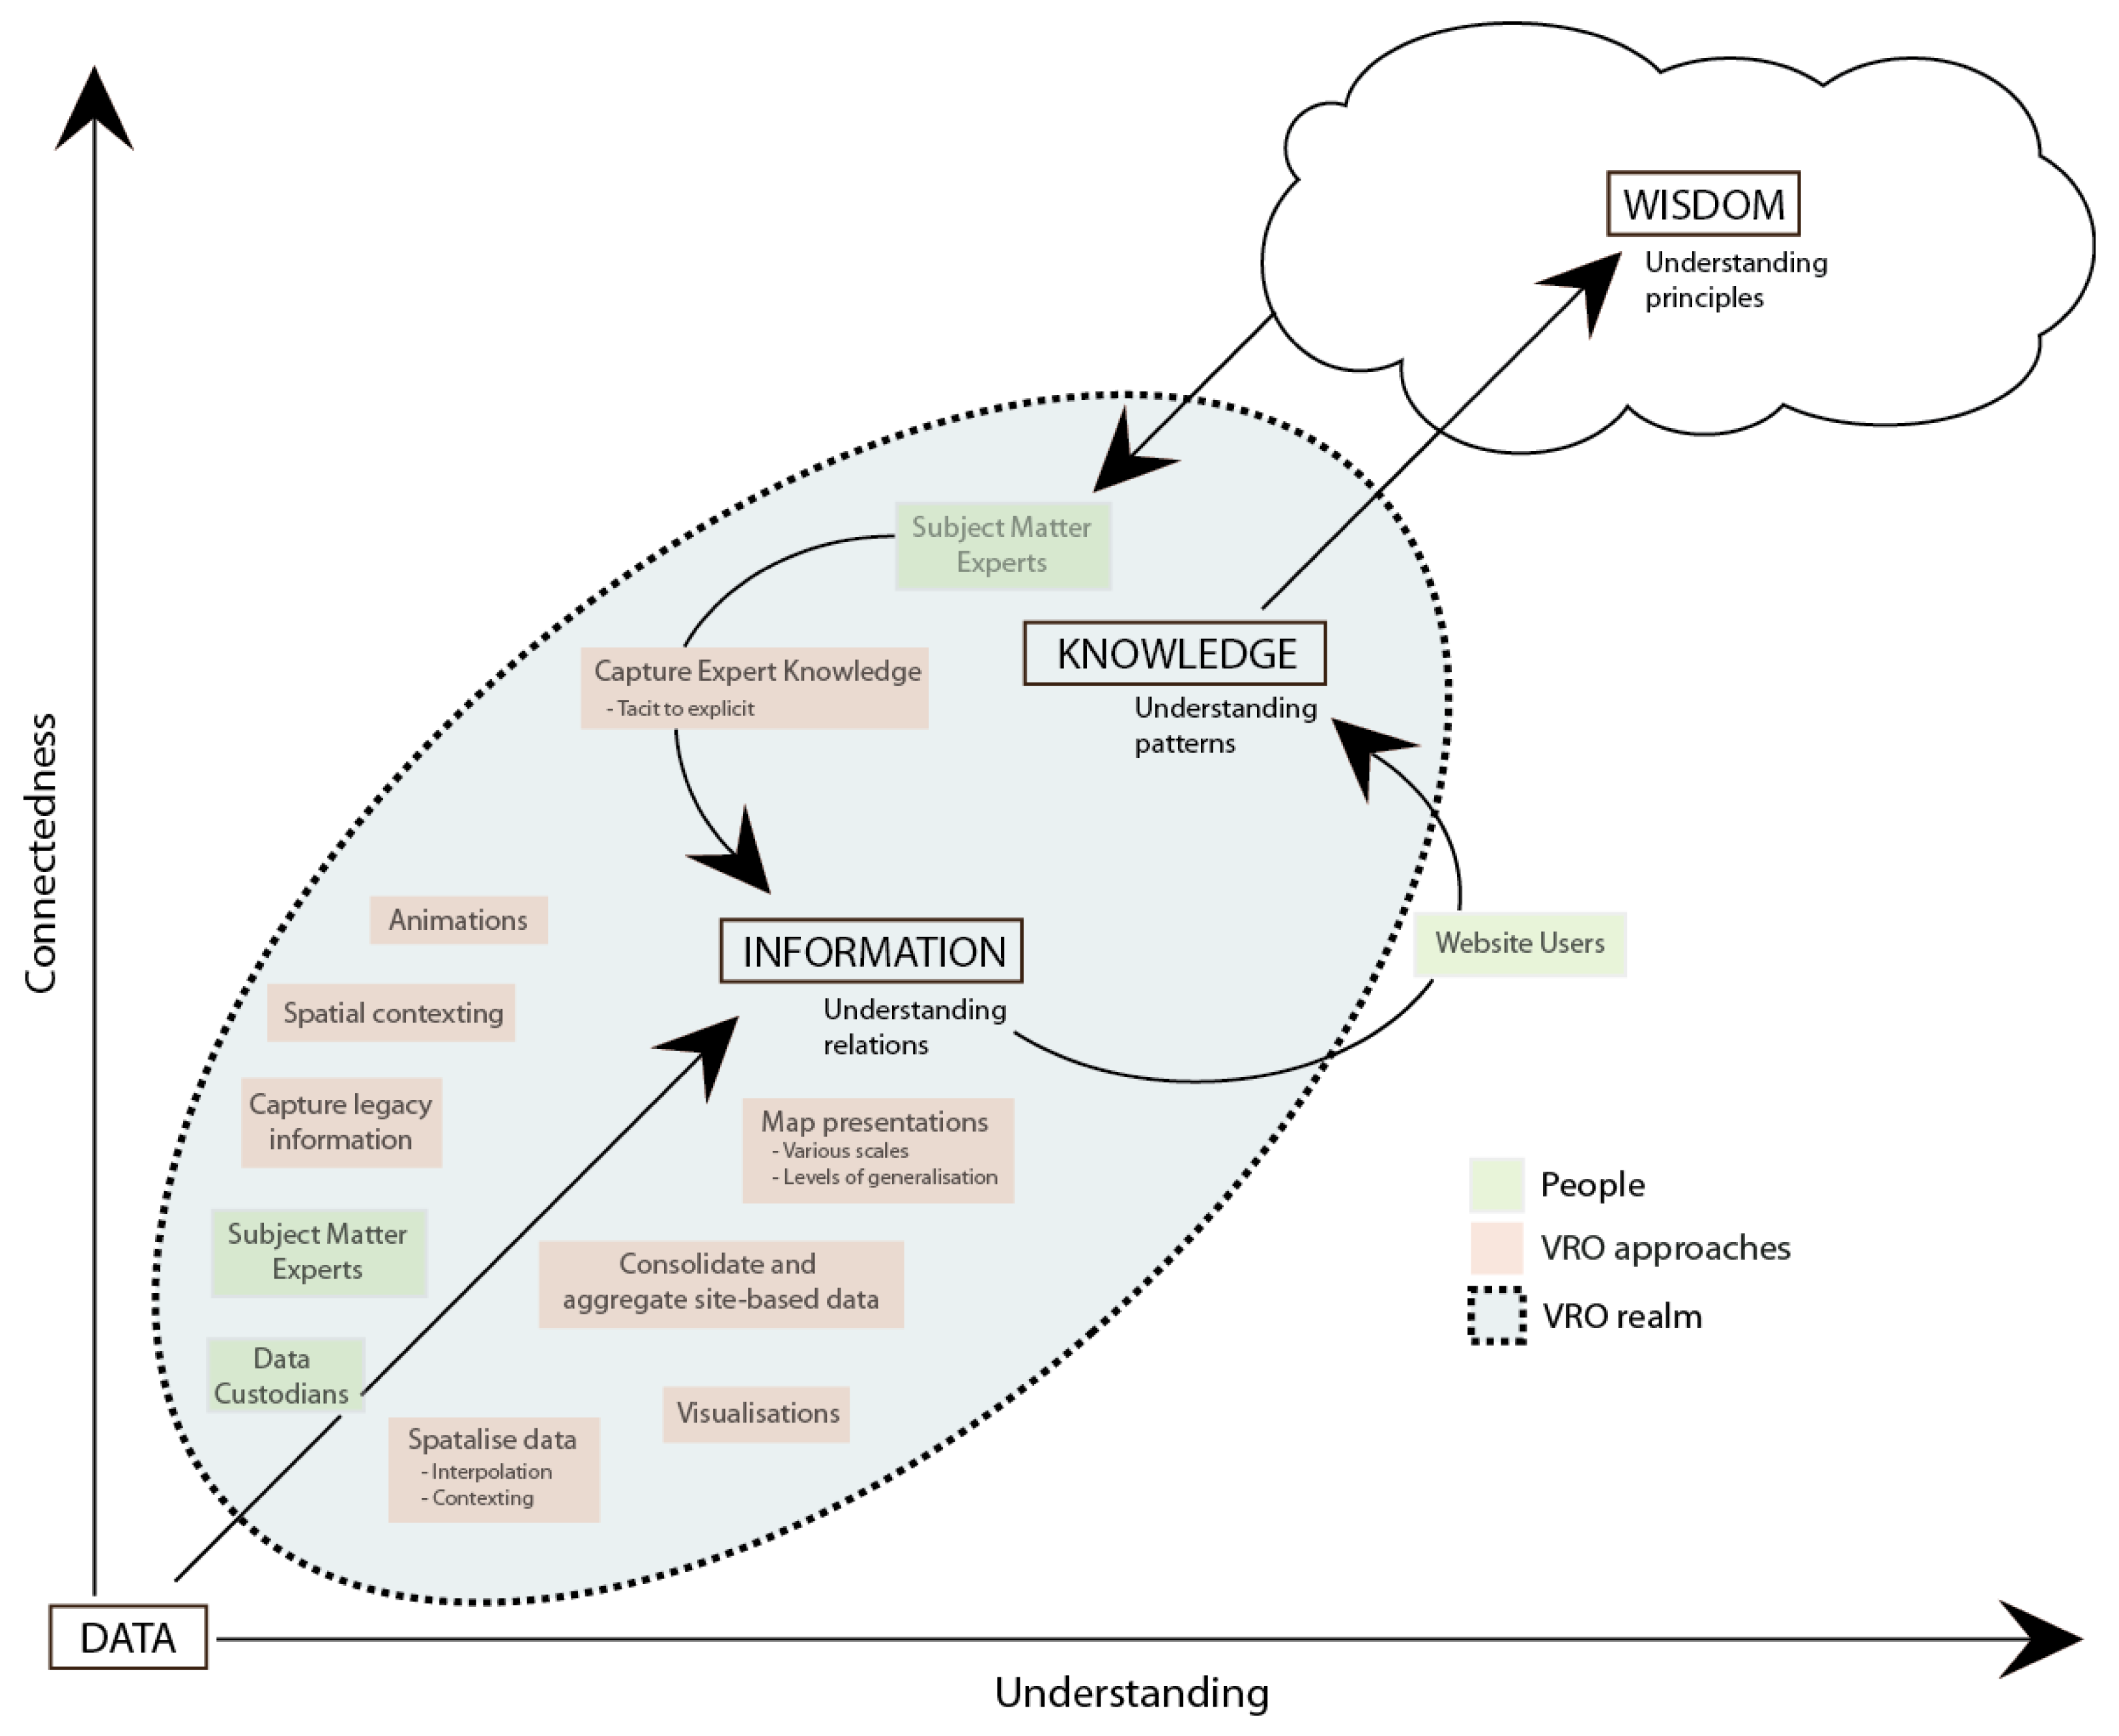
Various approaches to information and knowledge creation and management have been utilised by the VRO project. In this section, some of these approaches are discussed in relation to soil- and landform-based information and related to a “knowledge hierarchy” adapted from a hierarchy proposed by Bellinger et al. (2004) that displays the transition from data to information to knowledge to wisdom in relation to the degree of connectedness and understanding [6]. A similar hierarchy was applied by MacEwan (2008) to assess spatial modelling and planning for natural resource management [22]. Figure 5 shows the hierarchy that we use as a framework for discussing soil and landscape information and knowledge management via the VRO website. It depicts the VRO “realm”; associated groups of people, and information and knowledge management approaches that are utilised. The progression from data to information is undertaken in association with data custodians and subject matter experts and involves various approaches, some of which are discussed. Information products are made available on the website for users who may gain knowledge as a result to guide their actions. Wisdom is depicted as a more “nebulous” concept, but the wisdom–or “accumulated knowledge” as referred to by Jessup and Valacich [13]—of subject matter experts–is harnessed to create information on the website.
3.1. Spatialising Site-Based Data form Specialty Databases to Create Information Products
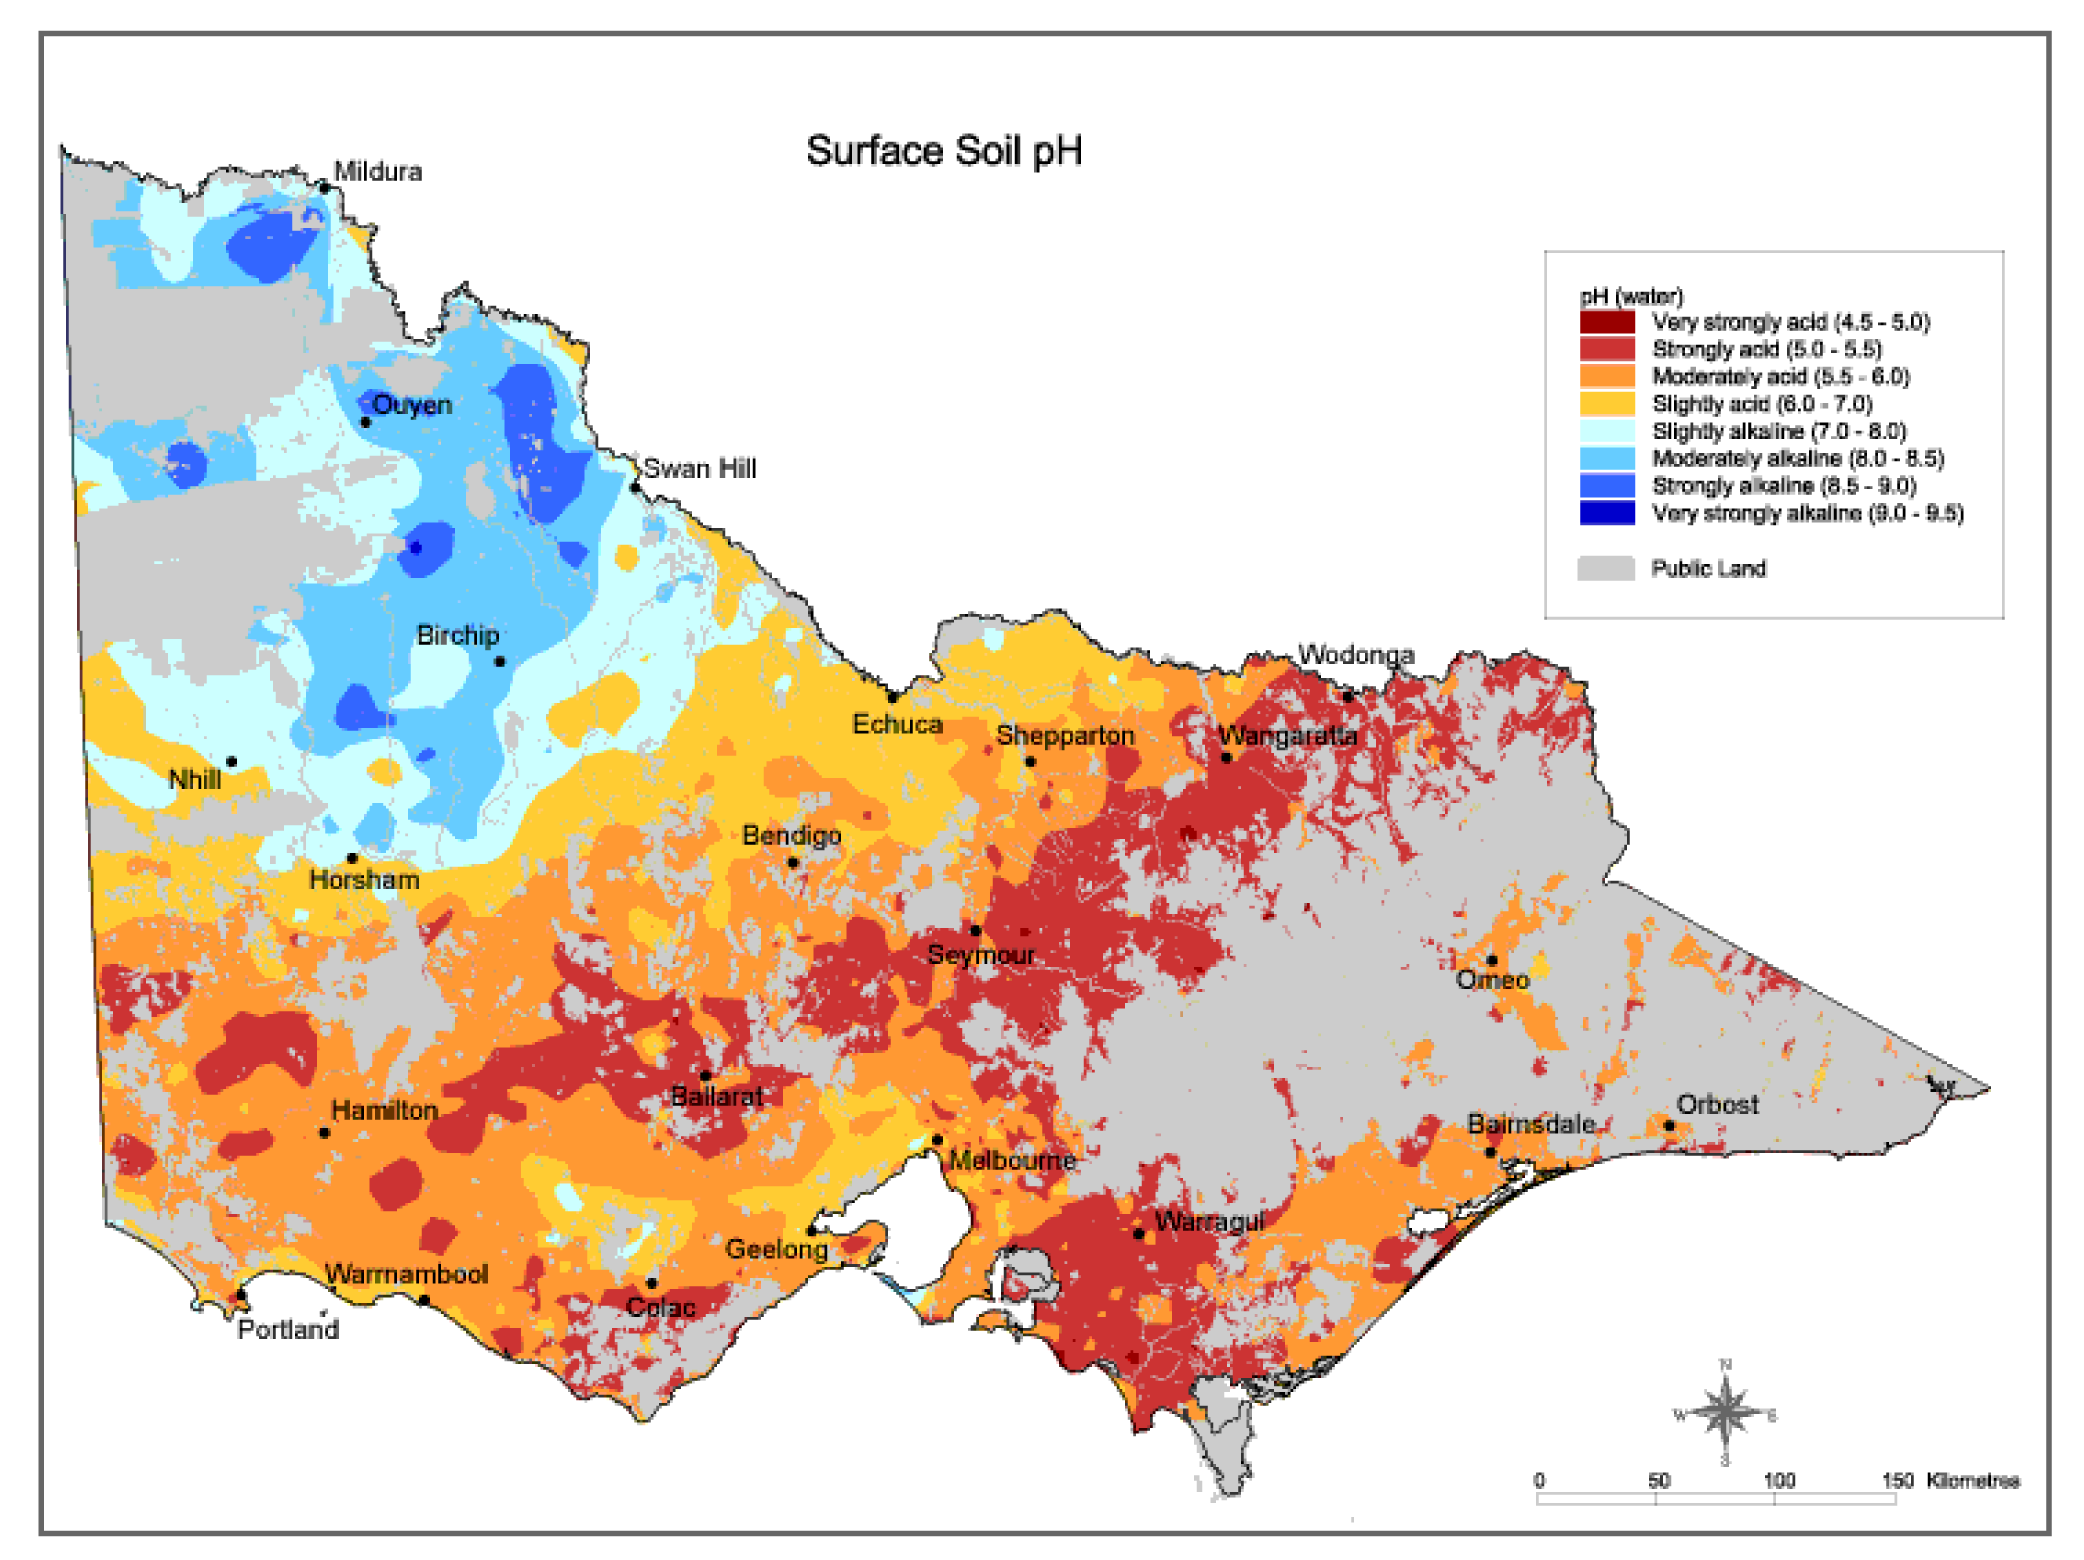
Useful map products have been created from site-based data held in internal Departmental databases that have access usually restricted to appropriate in-house specialists or data custodians. A statewide surface soil pH map (Figure 6), for example, was created by applying geo-statistical spatial interpolation (kriging) to an internal statewide dataset based on measured pH values from approximately 80,000 farms between 1973 and 1994. This work was undertaken in association with the data custodian and is an example of providing spatial context to a large dataset to create an information product that provides a spatial overview of soil surface pH across the state. Contextual information on the website explains the geographic trends in acidity and alkalinity across the state (e.g., relationship with rainfall).
3.2. Spatialising and Consolidating Site-Based Information from Legacy Reports
Natural resource data and information is not always located in corporate databases, but can instead be incorporated in legacy reports that are often scarce. By connecting site-based information (e.g., soil pit sites, sites of geomorphological significance, environmental monitoring sites and groundwater observation bores) to clickable maps on VRO, associated data and information is more readily accessible. By way of example, information provided in the “Sites of Geomorphological and Geological Significance” section of the website has been derived from a number of scarce publications. Fourteen reports led by Dr Neville Rosengren were developed during the period 1981 to 1993 where approximately 1150 sites of significance in various parts of southern Victoria are described. The original hardcopy reports, apart from being published in limited numbers, are not very durable and prone to breaking apart over time due to poor binding and have since become scarce. In collaboration with Mr Rosengren, site descriptions from these reports have been published on VRO. This has significantly increased accessibility to this information and allowed spatial indexing of sites from a number of separate reports into regional map presentations.
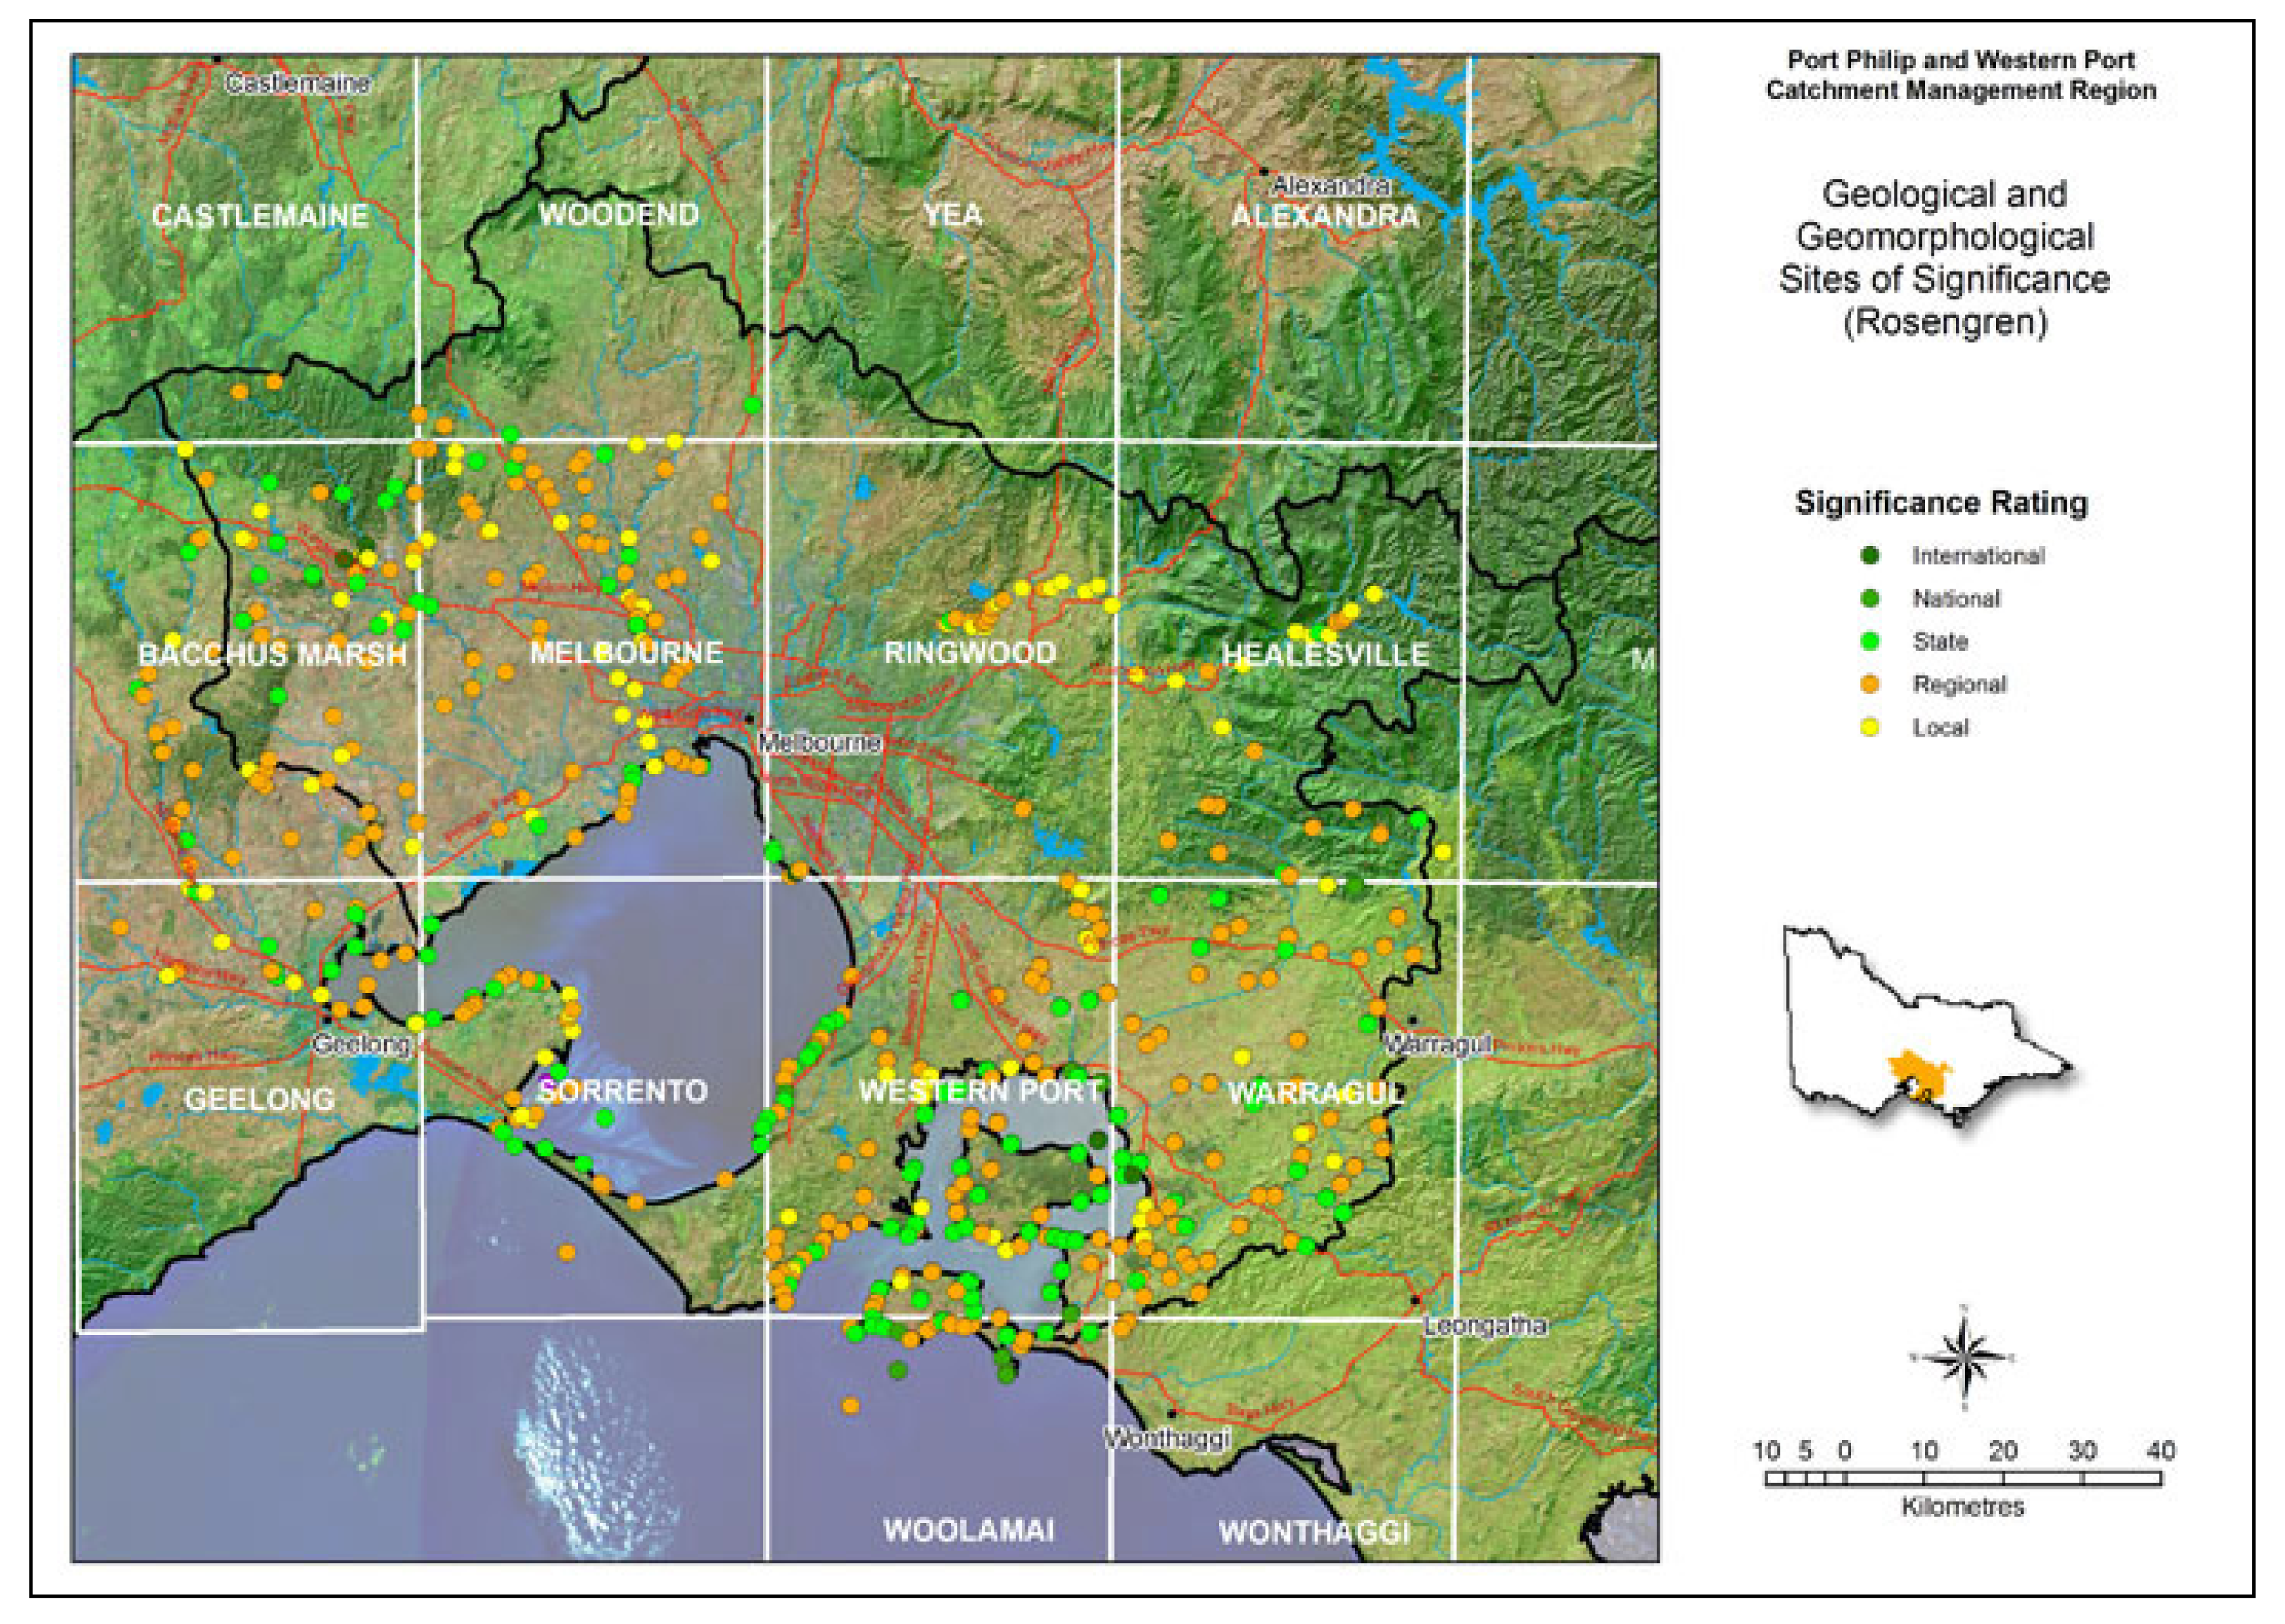
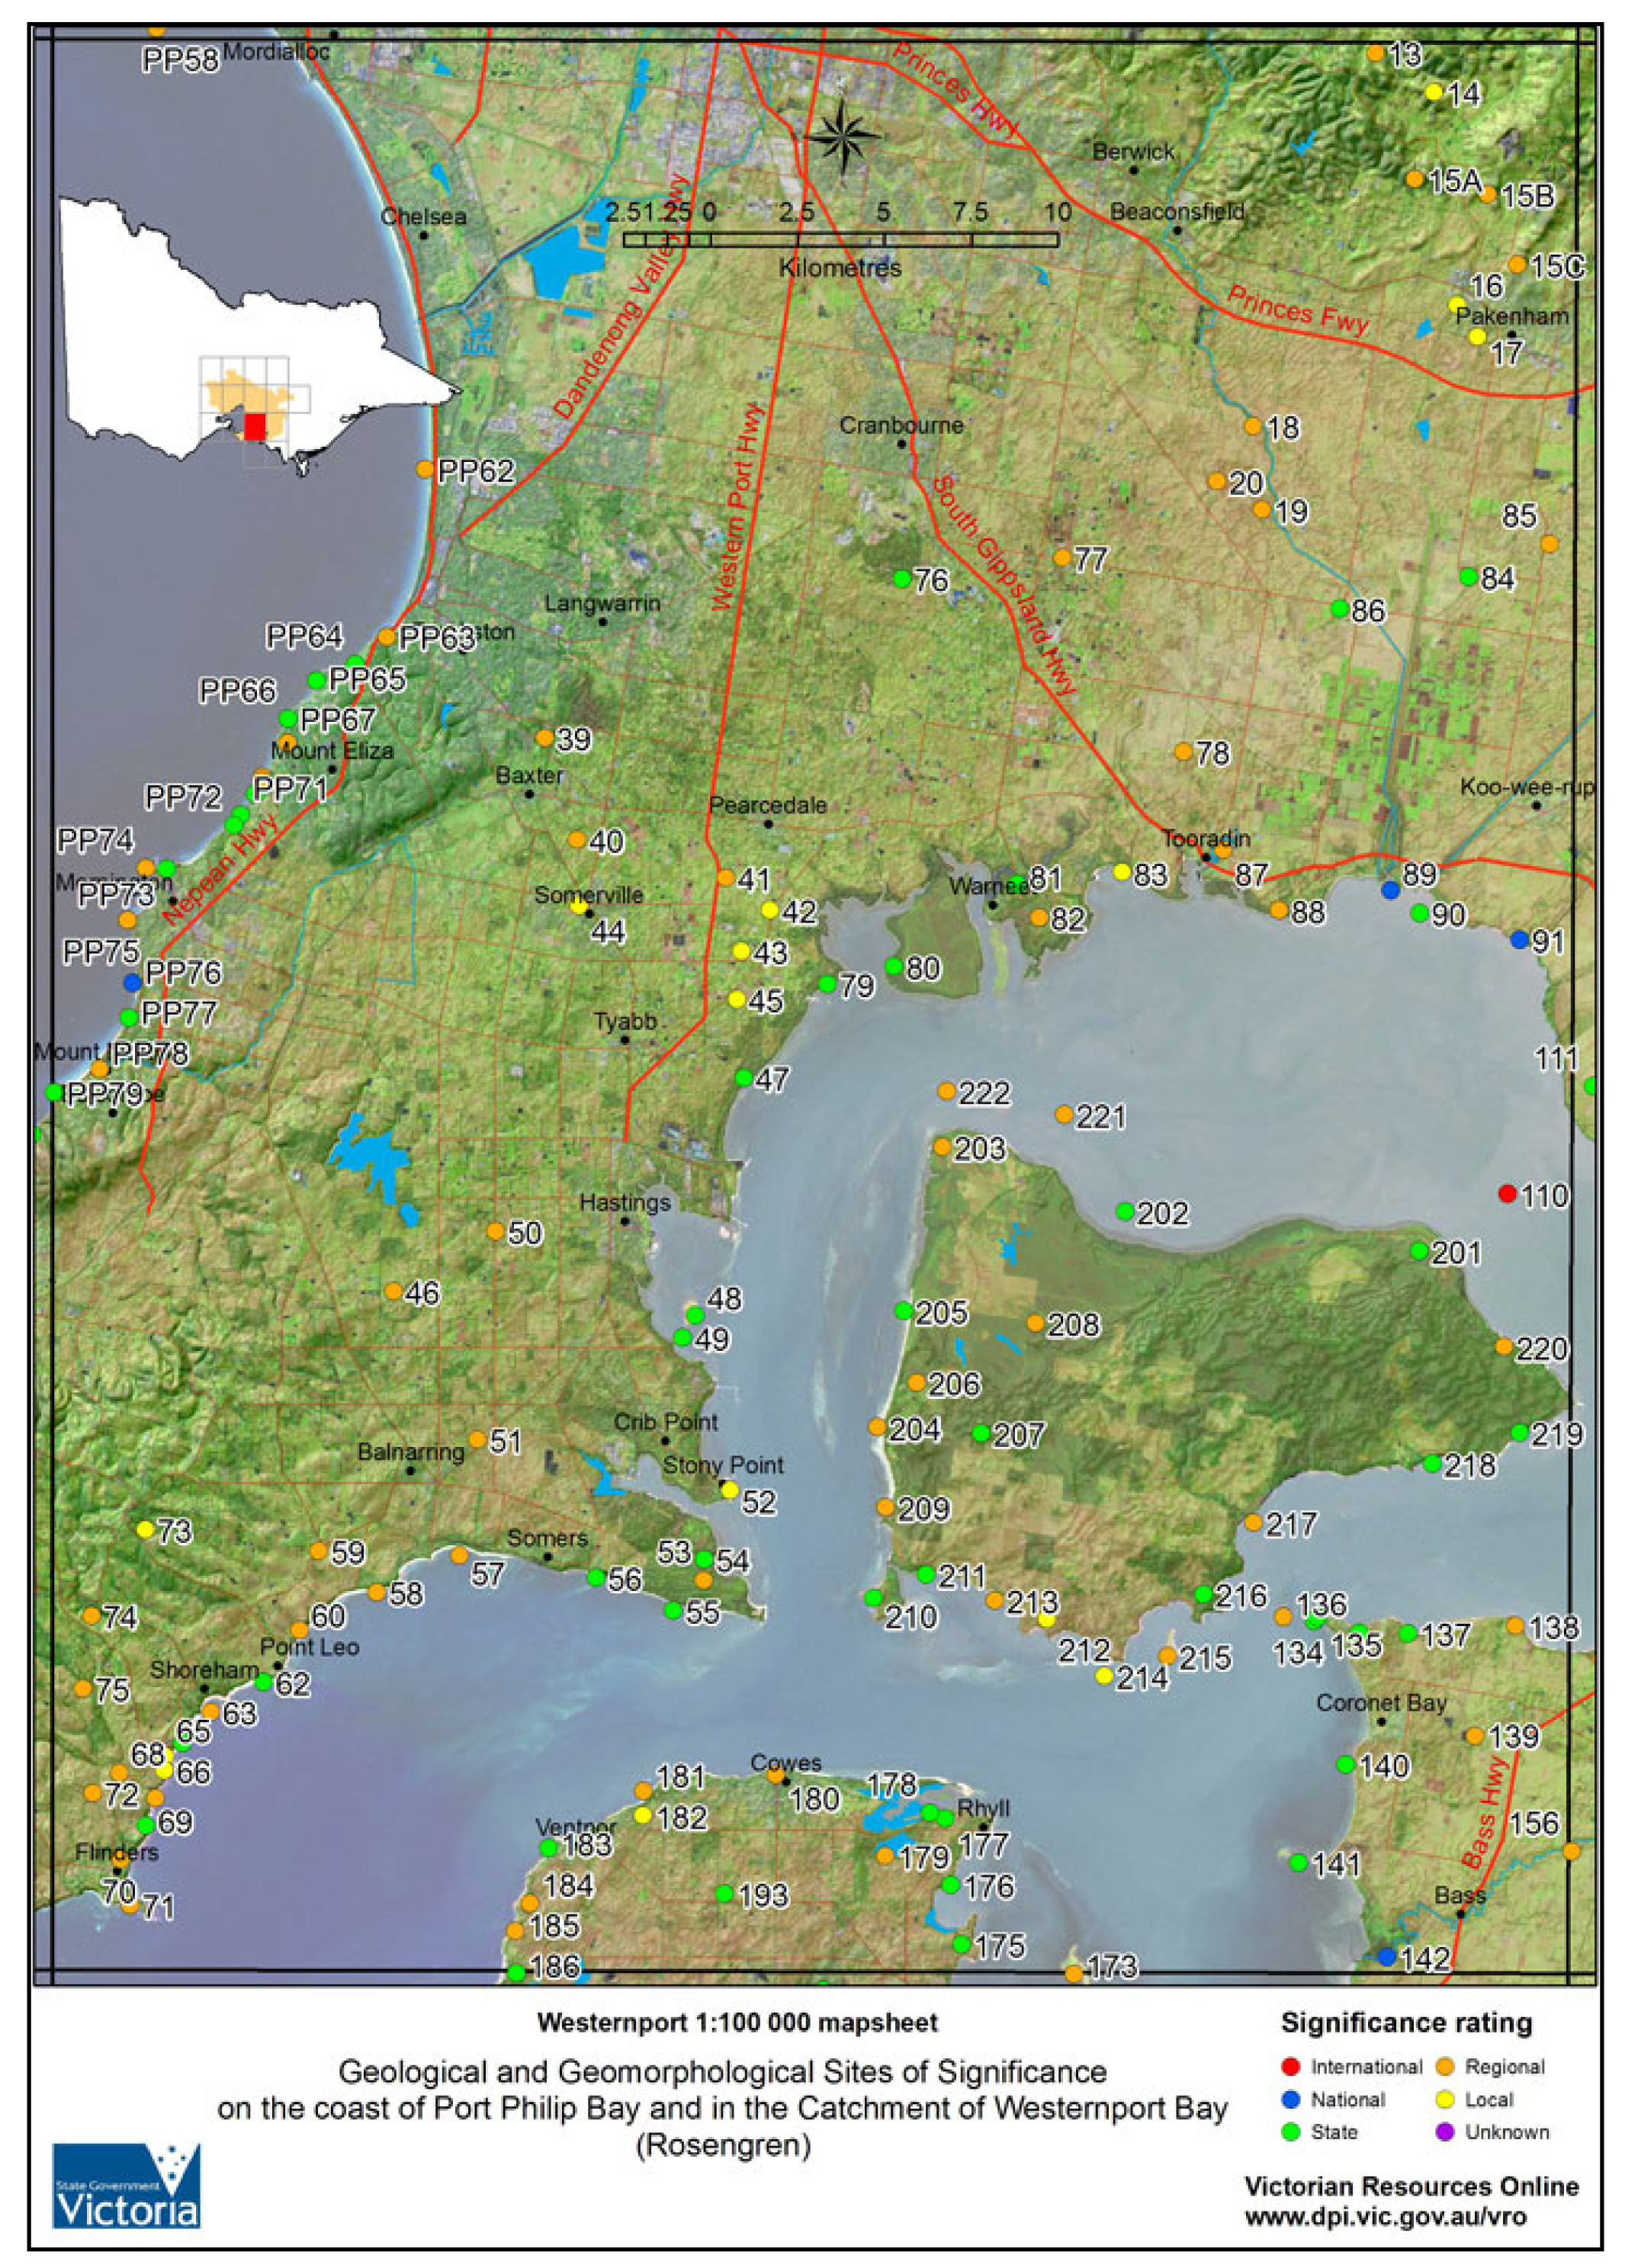
In the Port Phillip and Westernport region, sites from five separate publications [23–27] have been spatially consolidated into a single regional overview map (as shown in Figure 7) that can be clicked to access a relevant 1:100 000 map sheet. Each map sheet (an example of which is shown in Figure 8) displays clickable site locations (designated as either local, regional state or national significance) linked to HTML pages incorporating text, photographs and scanned maps derived from the original reports.
The standard 1:100,000 map sheet tiles (of which there are 119 that extend across Victoria) provide a standardised format for spatially depicting site locations on the website. These map sheets incorporate a satellite image with 3D relief background, as well as major roads, rivers and towns, to provide location and landscape context for marked sites. This format is used extensively and allows optimal webpage viewing coverage, independent of any regionalisation (i.e., regions may change in areal extent, but map sheets do not).
New information or images related to the sites, that have become available since the original reports were published, can now be incorporated as well as links to other relevant VRO content. Visualisations such as landscape flyover videos are being included to provide more interactive content (as discussed in 3.5 of this article).
3.3. Providing Spatially Contexted Soil and Landform Information at Different Levels of Generalisation
Victoria has a rich legacy of soil and landform mapping that dates back to the 1940s and there are more than 100 published reports covering different areas of the State. These vary greatly with respect to mapping scale, survey method and purpose, intensity of site observations and soil classification methodology. In the past 15 years, a number of regional revisions to this mapping have been undertaken but there still remains a variety of polygonal soil/landform mapping coverages in the corporate GIS database, at varying scales and without sufficient attribution to be useful to non-specialists. Image-based maps are prepared for the VRO website in association with appropriate specialists to provide the best-available map coverage, presented at the most appropriate scale and linked to associated descriptive content.
The Geomorphology Reference Group was established in 1995 with the aim of reviewing the Geomorphic Divisions of Victoria. The group consists of seven mainly retired specialists (most now into their late seventies and eighties) who, between them, have over 200 years experience in soil, landform and geological survey in Victoria. The VRO project has been effectively working with members of the GRG since 1997, forming an informal “knowledge network” to guide the development of a revised mapping framework for Victoria. This association has resulted in clickable maps depicting geomorphological units for each region in Victoria, linked to map unit descriptions developed by GRG members and including images provided by them (as slides and photographs that have been scanned).
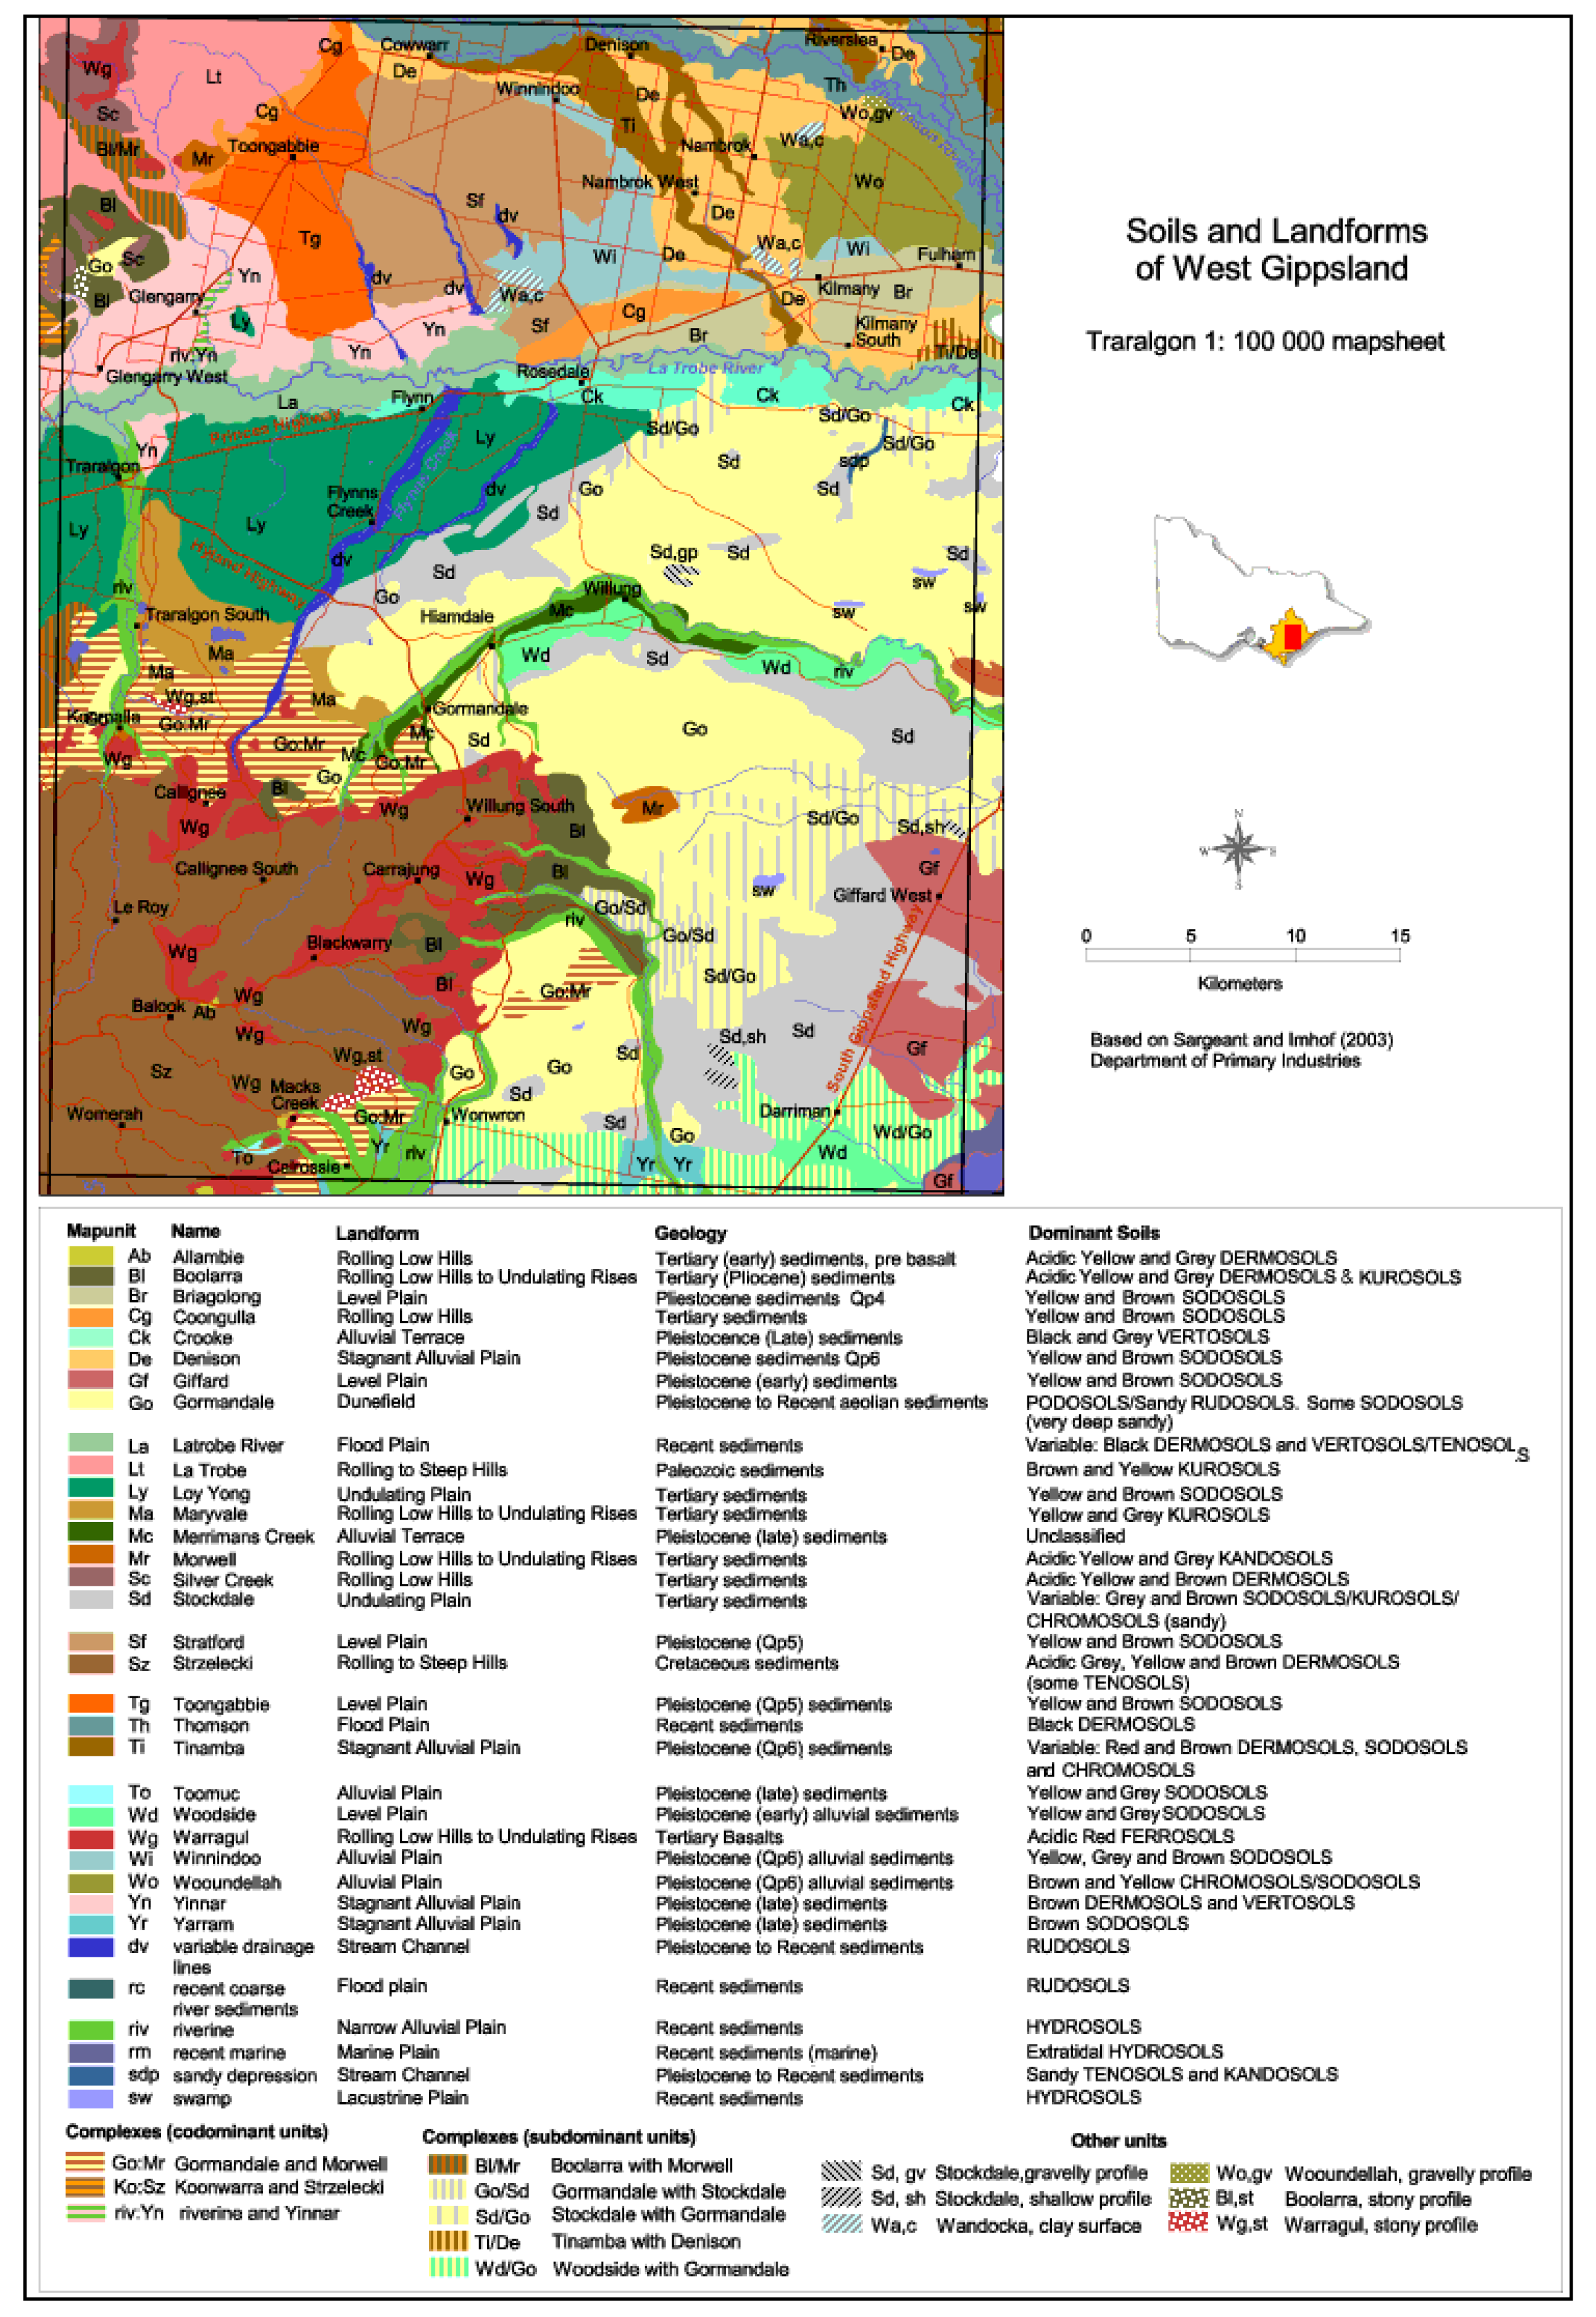
The VRO website displays region-specific soil/landform mapping at various scales and levels of generalisation. An example is the development of soil and landform information for the West Gippsland region of Victoria. Revised soil/landform survey mapping (1:100 000 scale) was undertaken over an eight year period beginning in 1994 by Dr Ian Sargeant, a retired Departmental employee (and member of the GRG) and subject matter expert on the soils and landforms of West Gippsland region. Information developed from this survey was progressively published on the website, on a map sheet basis. Web content includes regional overview soil maps, 1:100,000 soil/landscape maps, soil pit site descriptions and associated descriptive information. Throughout the survey, a focus was maintained on capturing the tacit knowledge of the expert and making it explicit as spatially-based information products. Figure 9 is an example of a 1:100,000 scale soil/landform map for part of the West Gippsland region. The legend of this map is clickable, leading to descriptions of map units (as shown in Figure 10). Map unit descriptions provide context with respect to regional distribution, geology, landform, vegetation and soil types. Much of this context resides as tacit knowledge in the expert's mind and can be made explicit through text, images and diagrammatic representations (an example of which is shown in Figure 10–being a diagrammatic representation of the relationship between mapping units and local geomorphology).
Representative soil site descriptions and analytical data collected during surveys are provided for many of the map units (Figure 11 is an example). This is an example of “spatial contexting”, whereby data is only made accessible on VRO if it is appropriately contexted (in this case to a soil/landscape mapping unit) which in essence makes it “information”. Some interpretation of data is provided (e.g., management considerations) as well as graphical representations where appropriate (e.g., showing change in key soil properties with depth). Web publishing provides the flexibility to incorporate updated information, including additional soil site descriptions as they become available. Non-linear user exploration is catered for, via appropriate links to associated information elsewhere on the site.
Some users seek overviews that synthesise more complex information into more easily understandable and generalised forms, whilst others require the most detailed and largest scale available. By way of example, small-scale (1:500,000) overview soil maps are also provided for most regions. These have been developed in association with regional specialists by generalising information from a number of existing larger scale (i.e., more detailed) soil/landform maps, together with tacit knowledge of soil and their distribution in regions of Victoria. Figure 12 is an example of a regional overview map showing the distribution of a broad Soil Order (Sodosols) across the West Gippsland region that has been generalised from 1:100,000 scale soil/landform mapping. Overview maps are provided for all the major Soil Orders in each region.
Wherever possible, VRO attempts to “bridge the gap” in information availability and comprehension for a wide target audience. To be useful for soil professionals, for example, correct terminology and up-to-date standards need to be utilised. To be useful to a wider target audience, appropriate explanatory material also needs to be provided. A “Soil Glossary” was established in the early years of website development to provide definitions of soil-related terms, including relevant visual aids. Hypertext links are provided throughout to link technical terms to a glossary definition that may also include relevant images or diagrams.
3.4. Improving Access to Legacy Information
Alberani et al. (1990) describe “grey literature” as documents (such as technical reports, theses and conference proceedings) that are not available through conventional commercial channels [28]. Luzi (2000) provides a review of the trends and evolution in the development of grey literature and concludes that, despite problems of quality, stability and intellectual property, the amount of information accessible on the internet has contributed to changing the expectations and behaviour of users, introducing models of information transfer closer to direct communication between producers and users [29]. In many research and development organisations, grey literature documents are valuable information assets and need to be carefully curated [30]. The internet has provided a number of opportunities to increase dissemination of such documents, both internally to an organisation and to a wider external audience.
Capturing legacy information is a critical knowledge management function provided by the VRO project, and the website is a repository for many grey literature documents. Of these, 80% are legacy reports associated with former departments that are now only available in limited numbers in hardcopy format and can be difficult to access. Some have never been formally published. Subject matter specialists provide advice on (and sometimes access to) the most relevant legacy reports to be included on the website.
A Soil and Land Survey Directory ( http://www.dpi.vic.gov.au/dpi/vro/vrosite.nsf/pages/soil-land-directory) was established on the VRO website in 1997 to facilitate spatially-based access to over 100 legacy soil and land survey reports printed over the past 70 years. Users can search for these reports, on either a local government or catchment management area basis, or by a keyword search. Reports are located within the website in a related regional and/or content area. An example of a web page incorporating downloadable legacy report information is shown in Figure 13.
Maps from legacy reports that are now scarce have been made separately available in downloadable forms suitable for printing. These include over 80 detailed irrigation region soil maps produced in the 1960s that are still widely used. Historic maps that depict land use and land degradation in 1944 are also available and have proven useful to users assessing change over time.
Some retired specialists have contributed previously unpublished information, maps and slides that have been incorporated into web-based information. An example is an overview map of gully erosion density, based on intensive aerial photo interpretation from the 1970s and reassessed in 1982 by Ian Sargeant (unpublished) that still remains the only overview of gully erosion in Victoria. The map was used as part of a Journal article by Ford et al. in 1993 [31] but only digitised in 2001 from the original hardcopy map and made available on VRO. Data on tunnel erosion occurrence in Victoria provided by Dr Stuart Boucher [32] has also been digitised and combined with the gully erosion density data to create a new map depicting the distribution of tunnel erosion in relation to gully density in Victoria (Figure 14). Regions can be identified where gully and tunnel erosion co-occur, and elsewhere where tunnel erosion is significant but not gully erosion, due to different soil and landscape factors. These maps are supported by associated web pages describing the distribution of erosion across Victoria, initiation and development processes, and appropriate reclamation techniques.
3.5. Incorporating Animations and Visualisations
Digital products can be augmented with a broad range of multimedia components, such as interactive animation, to help explain soil and landscape related concepts. The literature provides strong support to the notion that media richness, focused attention, interactivity, playfulness and flow contribute towards effectiveness of learning [33]. However, Tversky et al. (2002) note that animations can often be too complex or too fast to be accurately perceived, but that judicious use of interactivity may overcome both these disadvantages [34]. A study by Lowe (2003) concluded that the potential of animation, as a learning tool, may not be fully realised unless the design of such presentations supports learners' extraction of domain-relevant information and its incorporation into existing knowledge structures [35].
Visualisation techniques are now being used on the VRO website to better communicate spatial and scientific information about soils and landscapes to a range of users such as scientists, administrators, educators, students and the general public. Three dimensional graphics and animation bring more life-like digital reality to computer-based information, and the use of video files adds rich information content to otherwise static web pages.
Animations have been developed in consultation with Departmental scientists to visually explain processes that occur in the soil and landscape. To date, animations published on VRO depict the soil carbon and nitrogen cycles, and processes related to soil acidification and coastal acid sulfate soils; all within the context of an agro-ecosystem. These have been developed from “storyboards” (a series of hand-drawn sketches that outline all the events in the animation) created with relevant soil scientists. This process is an example of harnessing the tacit knowledge of scientists, and providing context, to create an information product suitable for a broad range of users. In the case of the nitrogen cycle animation, five soil scientists provided input, each with a slightly different focus (i.e., farming system, soil biology, chemistry and greenhouse gas perspectives). Figure 15 is an example screen-captured image from the soil acidification animation sequence that is a useful inclusion to existing information related to soil pH and acidification in Victoria. Each frame displays various graphical elements, and text and voice-over have been incorporated to fulfill accessibility guidelines.
Other visualisation products used on the VRO website include landscape fly-over videos that provide “virtual tours” of landscape features (e.g., Figure 16). Video clips are now being routinely used and range from historic video (e.g., soil erosion captured in the 1970s) to retired specialists describing landscapes in the field (e.g., Figure 17).
The most recent visualisation addition has been interactive landscape panoramas. A series of 360 degree panorama images can now be accessed online with zoom and pan functionality and clickable image and text boxes. These provide an interactive landscape “exploration” experience for users who can move from one panorama image to another and access landscape related information (e.g., soil pit descriptions, observations, site-based data). Figure 18 is an example of a screen-captured image from a landscape panorama.
4. User Evaluation
Mulvenna et al. (2000) note that little attention to date has been paid to evaluating the utility of websites for users and that, even though statistics provided by Web log analysis tools provide metrics for evaluating the success of serving pages to users, no insights are available regarding the usefulness of the content [36]. The success of any information and knowledge management activity should be assessed by evaluating how users interact with the information and knowledge provided to create value with the work they do. Prusak (2001) takes a “human capital” approach to discussing information and knowledge management, noting that there should be a focus on value as a function of user satisfaction and how it benefits the recipient and the organisation that they work for, rather than the efficiency of the technology that houses and delivers the information [37]. The focus should also be on knowledge use, not just knowledge availability.
A mixed-method approach has been used to understand user interactions with the VRO website. User analytics and surveys provide a quantitative approach to assessing gross usage patterns. Opportunistic feedback (largely via the “VRO Feedback” facility) provides more powerful user-specific examples of value of the website and how it contributes to what they do. This feedback provides examples that relate to the DIKW progression of Figure 5–demonstrating how website users apply information gained from the website to improve their level of understanding (and therefore knowledge) to guide actions.
4.1. User analytics
VRO website users are evaluated in general by measuring user sessions per day and average number of pages viewed per day. During the past 12 months there has been an average of 1190 “user visits” per day, accessing an average of 2929 “pageviews” per day. Web usage has continued to increase during the course of the website's existence, increasing from an average of 50 visits per day in 1999, to 170 per day in 2002 and 770 per day in 2003.
IP Tracking has been undertaken in recent years to provide analysis of IP addresses and relevant ISPs. Figure 19 provides an overview of IP tracking profile for all soil and landform related content in the 12 month period to June 2011. Of the clearly defined user groups, “Victorian Government” (4.5%) and “Victorian Education” (3.7%) represent significant usage. DPI and DSE represent over 80% of the “Victorian Government” usage and universities are the major component of “Victorian Education”. “Australian ISPs” are a significant component of usage, but it is not possible to attribute user affiliations to this category.
4.2. Internal Survey
Internal (DPI and DSE) users are a key audience for the VRO website and user analytics suggests that there is an average of around 35 visits per day from this group. In 2007, an internal DPI project surveyed staff involved in landscape analysis about where they access data and knowledge; including sources such as corporate databases, internet, libraries, primary research, DPI/DSE staff and non-DPI/DSE colleagues. Of the 29 respondents to a questionnaire, 55% indicated that they used VRO as a “data source” and VRO was rated the most accessible and easy to use source of data. VRO was used by 86% of respondents as a “knowledge source” [38].
4.3. User Feedback
Feedback is received via the “VRO Feedback” facility as well as from solicited and unsolicited responses from key users. Some examples below demonstrate ways in which VRO develops human capital, as described by Prusak (2001) that can be harnessed in support of natural resource management [37].
Feedback provided from users requiring soil data include a crop modeller working for a regional cropping group, who indicated that the website has been useful for “determining what types of soil users are likely to have given their location, and also generic physical and chemical properties for regional soils, which are used as inputs for simulation”. Similar feedback has been received from other modellers who are after representative soil site information contexted to spatial mapping.
Feedback from users of soil information has indicated the value of the website for natural resource management, particularly for identifying the nature and distribution of regional soils. A DPI project officer, for example, noted: “I found the VRO website extremely useful. It is a fantastic one-stop shop to find biophysical information quickly and easily in the one website. I have recently used the soils pages to compile an inventory of the most valuable soils in our project area. The historical information on the website has been extremely useful as well”. A Landcare facilitator working for a regional Catchment Management Authority provided the following feedback: “I was able to use the VRO website to augment a presentation I provided at a recent field day. The soil maps held on this site are extremely useful, as are the descriptions of the regional soils and associated glossaries and explanatory notes. It is interesting to note that a number of landholders who attended the workshop were already aware of the existence of VRO and had previously accessed information from it”.
Feedback from users of the “Sites of Geological and Geomorphological Significance” content (as discussed in Section 3.2) highlights the value of making this information more widely accessible on the web. A planner for a metropolitan water authority has noted that: “as environmental managers, we seek to incorporate all available information to feed into our planning at all levels, and our interactions with the development industry. This site provides a very handy and powerful summary for accessing this otherwise hard to find information…I hope to see more pages such as this bring out useful spatial data that is otherwise buried in reports and the like”. For this planner, discovering this information on the website has improved his knowledge of what is significant in his region and take this into account for planning. A cultural heritage consultant provided feedback that: “it's crucial to work out the relationship between the geology/geomorphology of an area, and where we are finding archaeological remains, which helps us to predict where artefacts are likely to be located in the future…it is difficult to get hold of Rosengren's maps, so the Victorian Resources Online website is very much appreciated!”. This consultant has been able to utilise information found on the website to add to her own discipline knowledge, thus creating value-added knowledge.
Feedback received from users of the recently published animations (as described in Section 3.5) indicates that they are proving to be useful to support education and extension. A university lecturer has indicated that “the C and N cycles are excellent” and that he “will be using them during lectures to refresh the memory of second and third year undergraduate students”. Recent feedback from Departmental extension staff has included: “I am involved in giving talks on soil pH and nitrogen…a great resource to have”, and that the introduction of voice-overs “makes the animations now really friendly to use with farmers”.
Feedback from educators highlights the value of accessible soil data and information for teaching purposes. A university lecturer in soils noted: “how useful the VRO website is for me as a reference site for many rare soil reports on areas of Victoria (and) contemporary soil data… from across the state” and that his “students use the website extensively for assignment research”. Another lecturer provided feedback that: “the data available for various soil types across the state has become an extremely useful teaching resource, so much so that I have developed a student assessment task that requires the use of the website and the analysis of the data provided…it also allows students to experience the wide variety of soil types that exist…it is anticipated that the degree will make greater use of the other aspects of the VRO website such as climate, land use, water management, not to mention the soil and land survey directory where I was able to access a copy of a soil survey from which I was able to direct students to as part of their soil survey assignments”.
5. Conclusions
The Victorian Resources Online (VRO) website represents a useful model for the effective dissemination of a wide range of natural resources data, information and knowledge. It relies on approaches such as:
“spatialising” data to provide contexted information products and maps;
a continuous improvement approach to product development, including rich media content;
displaying information at various scales and levels of generalisation;
attempting, where possible, to overcome user's knowledge gaps;
capturing legacy information, including grey literature.
In an era of corporate downsizing and loss of long-serving expert staff due to retirement, the need for harnessing knowledge and making it accessible via information and knowledge repositories is as strong as ever. The WWW provides an opportunity to facilitate access to this information and knowledge in forms that can be utilised by a diverse audience. However, this involves developing partnerships with appropriate subject matter experts and data custodians, and working with them to create useful information products. To achieve this, the VRO project has over 14 years maintained a focus on working with practicing and retired specialists to capture, store and retain their knowledge.
The value and impact of web-based information products can be enhanced using appropriate visualisation techniques. The “learning public”, particularly those coming through school and university are now used to (and expect) high quality graphics and animation. The challenge for communicators is to match high levels of graphic reproduction with good quality and stimulating information. Working with appropriate subject matter experts is part of the solution.
Web-based GIS applications for accessing natural resource data and map services are now prevalent, but they are suited to more GIS savvy users and are based on mapping data held in corporate databases. It is suggested that websites such as VRO can co-exist with these more interactive sites by providing an authoritative information repository that these others can link to.
Feedback from VRO users is providing valuable insights into how information is utilised and highlights the wide range of uses for soil and landscape information and, in particular, the benefits for education and for people involved in natural resource management research, development and extension.
6. Future Work
There is an ongoing need to capture expert knowledge and create useful information products that can be accessed via the web, as specialists are aging and are not being replaced with new sources of tacit knowledge. Significant potential exists, for example, to supplement landscape information with audiovisual recordings of retired experts describing landscapes in the field–integrated into virtual landscape models (such as interactive panoramas). It is proposed to increase visual and interactive material currently being presented on the website, making soil and landscape-based information more attractive and understandable for a wide audience. A prototype “Virtual Soil Profile” is currently under development that will provide an interactive exploration of a soil profile. Overview soil mapping will be updated to provide a consistent statewide overview soil map that will, in time, link to virtual soil profile models for each of Victoria's main soil types. The usability of these interactive visualisations will be assessed using appropriate visual analytic tools.


Acknowledgments
The authors are grateful for the in-kind contribution from many DPI and DSE staff, and from members of the “Geomorphology Reference Group” (John Martin, Ian Sargeant, Jim Rowan, Ken Rowe, John Neilson, Neville Rosengren, Bernie Joyce and Peter Dahlhaus). Stuart Boucher, Doug Crawford, Gemma Heemskerk, Nathan Robinson, Richard MacEwan, David Cummings and Shaun Ashdowne have been particularly helpful in many ways.
References
- Campbell, A. The Australian Natural Resource Management Knowledge System; Land and Water Australia: Canberra, Australia, 2006. [Google Scholar]
- Victorian Catchment Management Council (VCMC). The Health of Our Catchments: A Victorian Report Card; VCMC: Melbourne, Australia, 2007. [Google Scholar]
- Pettit, C.; Ewing, S.; Coffey, B.; Geraghty, P.; Hocking, G.; Meyers, N.; Butters, S.; Weston, M. Exploring the potential of knowledge brokering to enhance natural resource management: Lessons from the catchment knowledge exchange project in Victoria. Aust. J. Environ. Manag. 2011. [Google Scholar] [CrossRef]
- Ackoff, R.L. From Data to Wisdom. J. Appl. Syst. Anal. 1989, 16, 3–9. [Google Scholar]
- Rowley, J. The wisdom hierarchy: Representations of the DIKW hierarchy. J. Inf. Sci. 2007, 33, 163–180. [Google Scholar]
- Bellinger, G.; Castro, D.; Mills, A. Data, information, knowledge and wisdom. 2004. Available online: http://www.systems-thinking.org/dikw/dikw.htm (accessed on 20 July 2011). [Google Scholar]
- Zack, M.H. Managing codified knowledge. Sloan Manag. Rev. 1999, 40, 45–58. [Google Scholar]
- Davenport, T.H.; De Long, D.W.; Beers, M.C. Successful knowledge management projects. Sloan Manag. Rev. 1998, 39, 43–57. [Google Scholar]
- Groff, T.R.; Jones, T.P. Introduction to Knowledge Management: KM in Business; Heinemann: Amsterdam, The Netherlands, 2003. [Google Scholar]
- Wiig, K. Knowledge Management: An Emerging Discipline Rooted in a Long History. In Knowledge Horizons—The Present and the Promise of Knowledge Management; Despres, C., Chauvel, D., Eds.; Butterworth-Heinemann: Woburn, MA, USA, 2000. [Google Scholar]
- Choo, CW.; Detlor, B.; Turnbull, D. Web Work – Information Seeking and Knowledge Work on the World Wide Web; Kluwer Academic Publishers: Dordrecht, The Netherlands, 2000. [Google Scholar]
- Awad, E.M.; Ghaziri, H.M. Knowledge Management; Pearson Education International: Upper Saddle River, NJ, USA, 2004. [Google Scholar]
- Jessup, L.M.; Valacich, J.S. Information Systems Today; Prentice Hall: Upper Saddle River, NJ, USA, 2003. [Google Scholar]
- Bostock, A. Avoiding Information Overload: Knowledge Management on the Internet. 2002. Available online: http://www.jisc.ac.uk/whatwedo/services/techwatch/reports/horizonscanning/hs0202.aspx (accessed on 23 July 2011). [Google Scholar]
- Dalkir, K. Knowledge Management in Theory and Practice; Elsevier Butterworth-Heinemann: Burlington, MA, USA, 2005. [Google Scholar]
- Ruggles, R. The State of the Notion: Knowledge Management in Practice. In The Knowledge Management Yearbook1999–2000; Cortada, J.W., Woods, J.A., Eds.; Butterworth-Heinemann: Woburn, MA, USA, 1999. [Google Scholar]
- Duffy, J. Knowledge management: To be or not to be? Inf. Manag. J. 2000, 34, 64–67. [Google Scholar]
- Meyer, M.H.; Zack, M.H. The design and development of information products. Sloan Manag. Rev. 1996, 37, 43–59. [Google Scholar]
- Brizga, S.; Geraghty, P. Strategic Framework for Integrated Natural Resource Knowledge Management; Victorian Catchment Management Council: Melbourne, Australia, 2011. [Google Scholar]
- State of Victoria. Atlas of Victoria, 3rd ed.; Duncan, J.S., Ed.; State Government Printer: Melbourne, Australia, 1982. [Google Scholar]
- Catchment and Land Protection Act 1994. Victorian Government, 2007. Available online: http://www.legislation.vic.gov.au/domino/Web_notes/LDMS/LTObject_Store/LTObjSt1.nsf/d1a8d8a9bed958efca25761600042ef5/a6c08457004d6b0eca257761001b712e/$FILE/94-52a041.pdf (accessed on 23 July 2011).
- MacEwan, R. Reading between the Lines: Knowledge for Natural Resource Management. In Landscape Analysis and Visualisation—Spatial Models for Natural Resource Management and Planning; Pettit, C., Cartwright, J.A., Bishop, I., Eds.; Springer-Verlag: Berlin/Heidelberg, Germany, 2008. [Google Scholar]
- Rosengren, N.; Frood, D.; Lowe, K. Sites of Geological and Geomorphological Significance in the Flood Plain of the Upper Yarra Valley Region; University of Melbourne: Melbourne, Australia, 1983. [Google Scholar]
- Rosengren, N. Sites of Geological and Geomorphological Significance in the Westernport Bay Catchment; Ministry for Conservation: Melbourne, Australia, 1984. [Google Scholar]
- Rosengren, N. Sites of Geological and Geomorphological Significance in the Western Region of Melbourne; Western Region Commission: Melbourne, Australia, 1986. [Google Scholar]
- Rosengren, N. Sites of Geological and Geomorphological Significance on the Coast of Port Phillip Bay; Ministry for Planning and Environment: Melbourne, Australia, 1988. [Google Scholar]
- Rosengren, N. The Merri Creek Sites of Geological and Geomorphological Significance; La Trobe University: Bendigo, Australia, 1993. [Google Scholar]
- Alberani, V.; De Castro Pietrangeli, P.; Mazza, A.M. The use of grey literature in health sciences: A preliminary survey. Bull. Med. Libr. Assoc. 1990, 78, 358–363. [Google Scholar]
- Luzi, D. Trends and evolution in the development of grey literature: A review. Int. J. Grey Lit. 2000, 1, 106–116. [Google Scholar]
- Jeffery, K.G. An architecture for grey literature in a R&D context. Int. J. Grey Lit. 2000, 1, 64–72. [Google Scholar]
- Ford, G.W.; Martin, J.J.; Rengasamy, P.; Boucher, S.C.; Ellington, A. Soil sodicity in Victoria. Aust. J. Soil Res. 1993, 31, 869–909. [Google Scholar]
- Boucher, S.C. Field Tunnel Erosion: Its Characteristics and Amelioration; Clayton and Department of Conservation and Environment, Monash University: East Melbourne, Australia, 1990. [Google Scholar]
- Guru, A.; Nah, F.H. Effect of Hypertext and Animation on Learning. In Managing Internet and Intranet Technologies in Organizations: Challenges and Opportunities; Dasgupta, S., Ed.; Idea Group Publishing: Hershey, PA, USA, 2001; pp. 50–61. [Google Scholar]
- Tversky, B.; Bauer Morrison, J.; Betrancourt, M. Animation: Can it facilitate? Int. J. Hum.-Comput. Stud. 2002, 57, 247–262. [Google Scholar]
- Lowe, R.K. Animation and learning: Selective processing of information in dynamic graphics. Learn. Instr. 2003, 13, 157–176. [Google Scholar]
- Mulvenna, M.D.; Anand, S.S.; Buchner, A.G. Personalization on the net using web mining? Commun. ACM 2000, 43, 122–125. [Google Scholar]
- Prusak, L. Where did knowledge management come from? IBM Syst. J. 2001, 40, 1002–1007. [Google Scholar]
- Heemskerk, G.; MacEwan, R. An Evaluation of DPI Science Capacity for Landscape Analysis; Department of Primary Industries: Melbourne, Australia, 2007. [Google Scholar]
© 2011 by the State Government of Victoria; licensee MDPI, Basel, Switzerland. This article is an open access article distributed under the terms and conditions of the Creative Commons Attribution license (http://creativecommons.org/licenses/by/3.0/).
Share and Cite
Imhof, M.; Cox, M.; Fadersen, A.; Harvey, W.; Thompson, S.; Rees, D.; Pettit, C. Natural Resource Knowledge and Information Management via the Victorian Resources Online Website. Future Internet 2011, 3, 248-280. https://doi.org/10.3390/fi3040248
Imhof M, Cox M, Fadersen A, Harvey W, Thompson S, Rees D, Pettit C. Natural Resource Knowledge and Information Management via the Victorian Resources Online Website. Future Internet. 2011; 3(4):248-280. https://doi.org/10.3390/fi3040248
Chicago/Turabian StyleImhof, Mark, Matthew Cox, Angela Fadersen, Wayne Harvey, Sonia Thompson, David Rees, and Christopher Pettit. 2011. "Natural Resource Knowledge and Information Management via the Victorian Resources Online Website" Future Internet 3, no. 4: 248-280. https://doi.org/10.3390/fi3040248