1. Introduction
Social web analysis is all about the users who are actively engaged and generate content. This content is dynamic, reflecting the societal and sentimental fluctuations of the authors as well as the ever-changing use of language. Social networks are pools of a wide range of articulation methods, from simple “Like” buttons to complete articles, their content representing the diversity of opinions of the public. User activities on social networking sites are often triggered by specific events and related entities (e.g., sports events, celebrations, crises, news articles) and topics (e.g., global warming, financial crisis, swine flu).
The ARCOMEM project [
1] aims to extract, analyse and correlate information relevant for the preservation of community memories from a vast number of heterogeneous Web resources, including multimedia, based on an iterative cycle consisting of (1) targeted archiving/crawling of Web objects; (2) entity, topic, opinion and event (ETOE) extraction; and (3) refinement of crawling strategy. In this paper, we focus on the opinion mining component, which not only aims to detect opinions about events and entities, but also to rate documents for their opinion interestingness, and to find bursts of interesting activity in terms of these opinion events. We thus combine work on opinion detection from text using NLP techniques, with work on opinion burst detection. In this way, we can examine which events might have happened which have driven changes in opinion: for example, a particular decision or statement by a politician might influence people to change their opinions about a person, topic or political party.
The project itself focused on two very different domains: socially aware federated political archiving (realised by the national parliaments of Greece and Austria), and socially contextualized broadcaster web archiving (realised by two large multimedia broadcasting organizations based in Germany: Sudwestrundfunk and Deutsche Welle). The ultimate aim is to help journalists and archivists answer questions such as what the opinions are on crucial social events, how they are distributed, how they have evolved, who the opinion leaders are, and what their impact and influence is. In this work, however, we have evaluated the tools in some cases with respect to different corpora/domains because these have provided us with more suitable and/or higher quality data for the evaluation.
This paper describes the approach we take to the analysis of social media, based on the capturing of opinions from text and their dynamics. We focus on a particular use case, which is to help archivists select material for inclusion in an archive of social media for preserving community memories, moving towards structured preservation around semantic categories. Social media data has the form of a continuous stream of newly created documents. In contrast to methods such as polls, which only allow sampling at discrete time points, this makes continuous and real-time monitoring possible. Typically such opinion timelines show the average opinion or the sum of opinions towards one or more entities over time. They are useful to illustrate the public’s reaction towards external events. However, on their own the timelines require careful interpretation, typically by experts with the necessary background knowledge, to understand the reasons for changes in opinion.
We have developed applications in GATE [
2] to extract named entities, terms and events and to detect opinions about them, which are then used as the starting point for opinion event detection. The textual approach we take is knowledge-based and builds on a number of sub-components, taking into account issues inherent in social media such as noisy ungrammatical text, use of swear words, sarcasm
etc. The opinions are then aggregated over larger sections of text, to give some overall sentiment about topics and documents, and also some degree of information about interestingness based on opinion diversity. Opinions are then grouped according to a temporal dimension and bursts of activity are found corresponding to opinion events,
i.e., periods where a change in opinion towards an entity happens, and labelling these events using the content of the documents containing the opinions.
2. Related Work
While much work has recently focused on the analysis of social media in order to get a feel for what people think about current topics of interest, there are, however, still many challenges to be faced. State-of-the-art opinion mining approaches that focus on product reviews are not necessarily suitable for our task, partly because they typically operate within a single narrow domain, and partly because the target of the opinion is either known in advance or at least has a limited subset (e.g., film titles, product names, companies, political parties,
etc.). Furthermore, quality is often still not that good: a recent survey of 9 state-of-the-art tools tested on a set of 30,000 short texts found that the average accuracy was only 50% [
3].
In general, sentiment detection techniques can be roughly divided into lexicon-based methods [
4] and machine-learning methods, e.g., [
5]. Lexicon-based methods rely on a sentiment lexicon, a collection of known and pre-compiled sentiment terms. Machine learning approaches make use of syntactic and/or linguistic features, and hybrid approaches are very common, with sentiment lexicons playing a key role in the majority of methods. For example, Moghaddam
et al. [
6] establish the polarity of reviews by identifying the polarity of the adjectives that appear in them, with a reported accuracy of about 10% higher than pure machine learning techniques. However, such relatively successful techniques often fail when moved to new domains or text types, because they are inflexible regarding the ambiguity of sentiment terms. The context in which a term is used can change its meaning, particularly for adjectives in sentiment lexicons [
7]. Several evaluations have shown the usefulness of contextual information [
8], and have identified context words with a high impact on the polarity of ambiguous terms [
9]. A further bottleneck is the time-consuming creation of these sentiment dictionaries, though solutions have been proposed in the form of crowdsourcing techniques [
10].
Almost all the work on opinion mining from Twitter has used machine learning techniques. Pak and Paroubek [
11] aimed to classify arbitrary tweets on the basis of positive, negative and neutral sentiment, constructing a simple binary classifier which used n-gram and POS features, and trained on instances which had been annotated according to the existence of positive and negative emoticons. Their approach has much in common with an earlier sentiment classifier constructed by Go
et al. [
12], which also used unigrams, bigrams and POS tags, though the former demonstrated through analysis that the distribution of certain POS tags varies between positive and negative posts. One of the reasons for the relative paucity of linguistic techniques for opinion mining on social media is most likely due to the difficulties in using NLP on low quality text [
13]; for example, the Stanford NER drops from 90.8% F1 to 45.88% when applied to a corpus of tweets [
14]. More recent work, however, has attempted to overcome this problem: see e.g., [
15].
Our work includes the detection and analysis of sarcasm, which is a particular problem for opinion mining in social media, which no systems to our knowledge have addressed satisfactorily, although there have been a number of recent works attempting to detect sarcasm in tweets and other user-generated content, e.g., [
16,
17,
18,
19]. It appears that none of these approaches go beyond this step of sarcasm detection: even when a statement is known to be sarcastic, one cannot necessarily predict how this will affect the sentiment expressed. In this paper, we do not describe in detail our work on sarcasm detection, but details can be found in [
20].
Our approach to opinion mining takes inspiration from a number of sources. The opinion extraction and classification is most similar to the work of [
4] in terms of technique, but because we focus on social media, we need to employ some different strategies to deal with the linguistic issues imposed. For example, we incorporate detection of swear words, sarcasm, questions, conditional statements and so on, while our entity-centric approach focuses the opinions on specific topics and makes use of linguistic relations.
As social media data tends to reflect current events with a very short delay, it has inspired much research on the reaction to current events and the detection of trends. Texts from social media such as Twitter and blogs have been used to predict global social trends [
21,
22] and product sales [
23], amongst other things. Using Twitter data, Thelwall
et al. [
24] found that the occurrence of popular events is linked to increases in negative opinions. Using Facebook data, Kramer [
25] found that the opinions contained in status updates varied with occurrences of events.
Opinion information has also been used to detect significant events. For example, Balog
et al. [
26] use LiveJournal mood labels to detect events based on times where mood timeseries has bursts. Similarly, Nguyen
et al. [
27] use a similar dataset to find the most positive or negative periods of a time period (macro events) as well as local bursts (micro events). These two papers both show that detecting events using opinions is possible. However, the data provides only a global view of the opinions and therefore they detect mostly well-known events such as holidays (Christmas, Thanksgiving) or important political events (e.g., the anniversary of 9/11). We look at opinions about individual entities and can therefore detect events related only to that entity, which makes our method more suitable for targeted exploration of a document collection.
Akcora
et al. [
28] also try to detect changes in public opinion. They track changes in the frequency of word use on social media, based on the idea that during an ongoing event, there are changes to the topics discussed, and therefore also to which words are used. Again, our work looks at opinions about individual entities and is therefore able to detect more fine-grained events.
3. Entity-Driven Opinion Identification
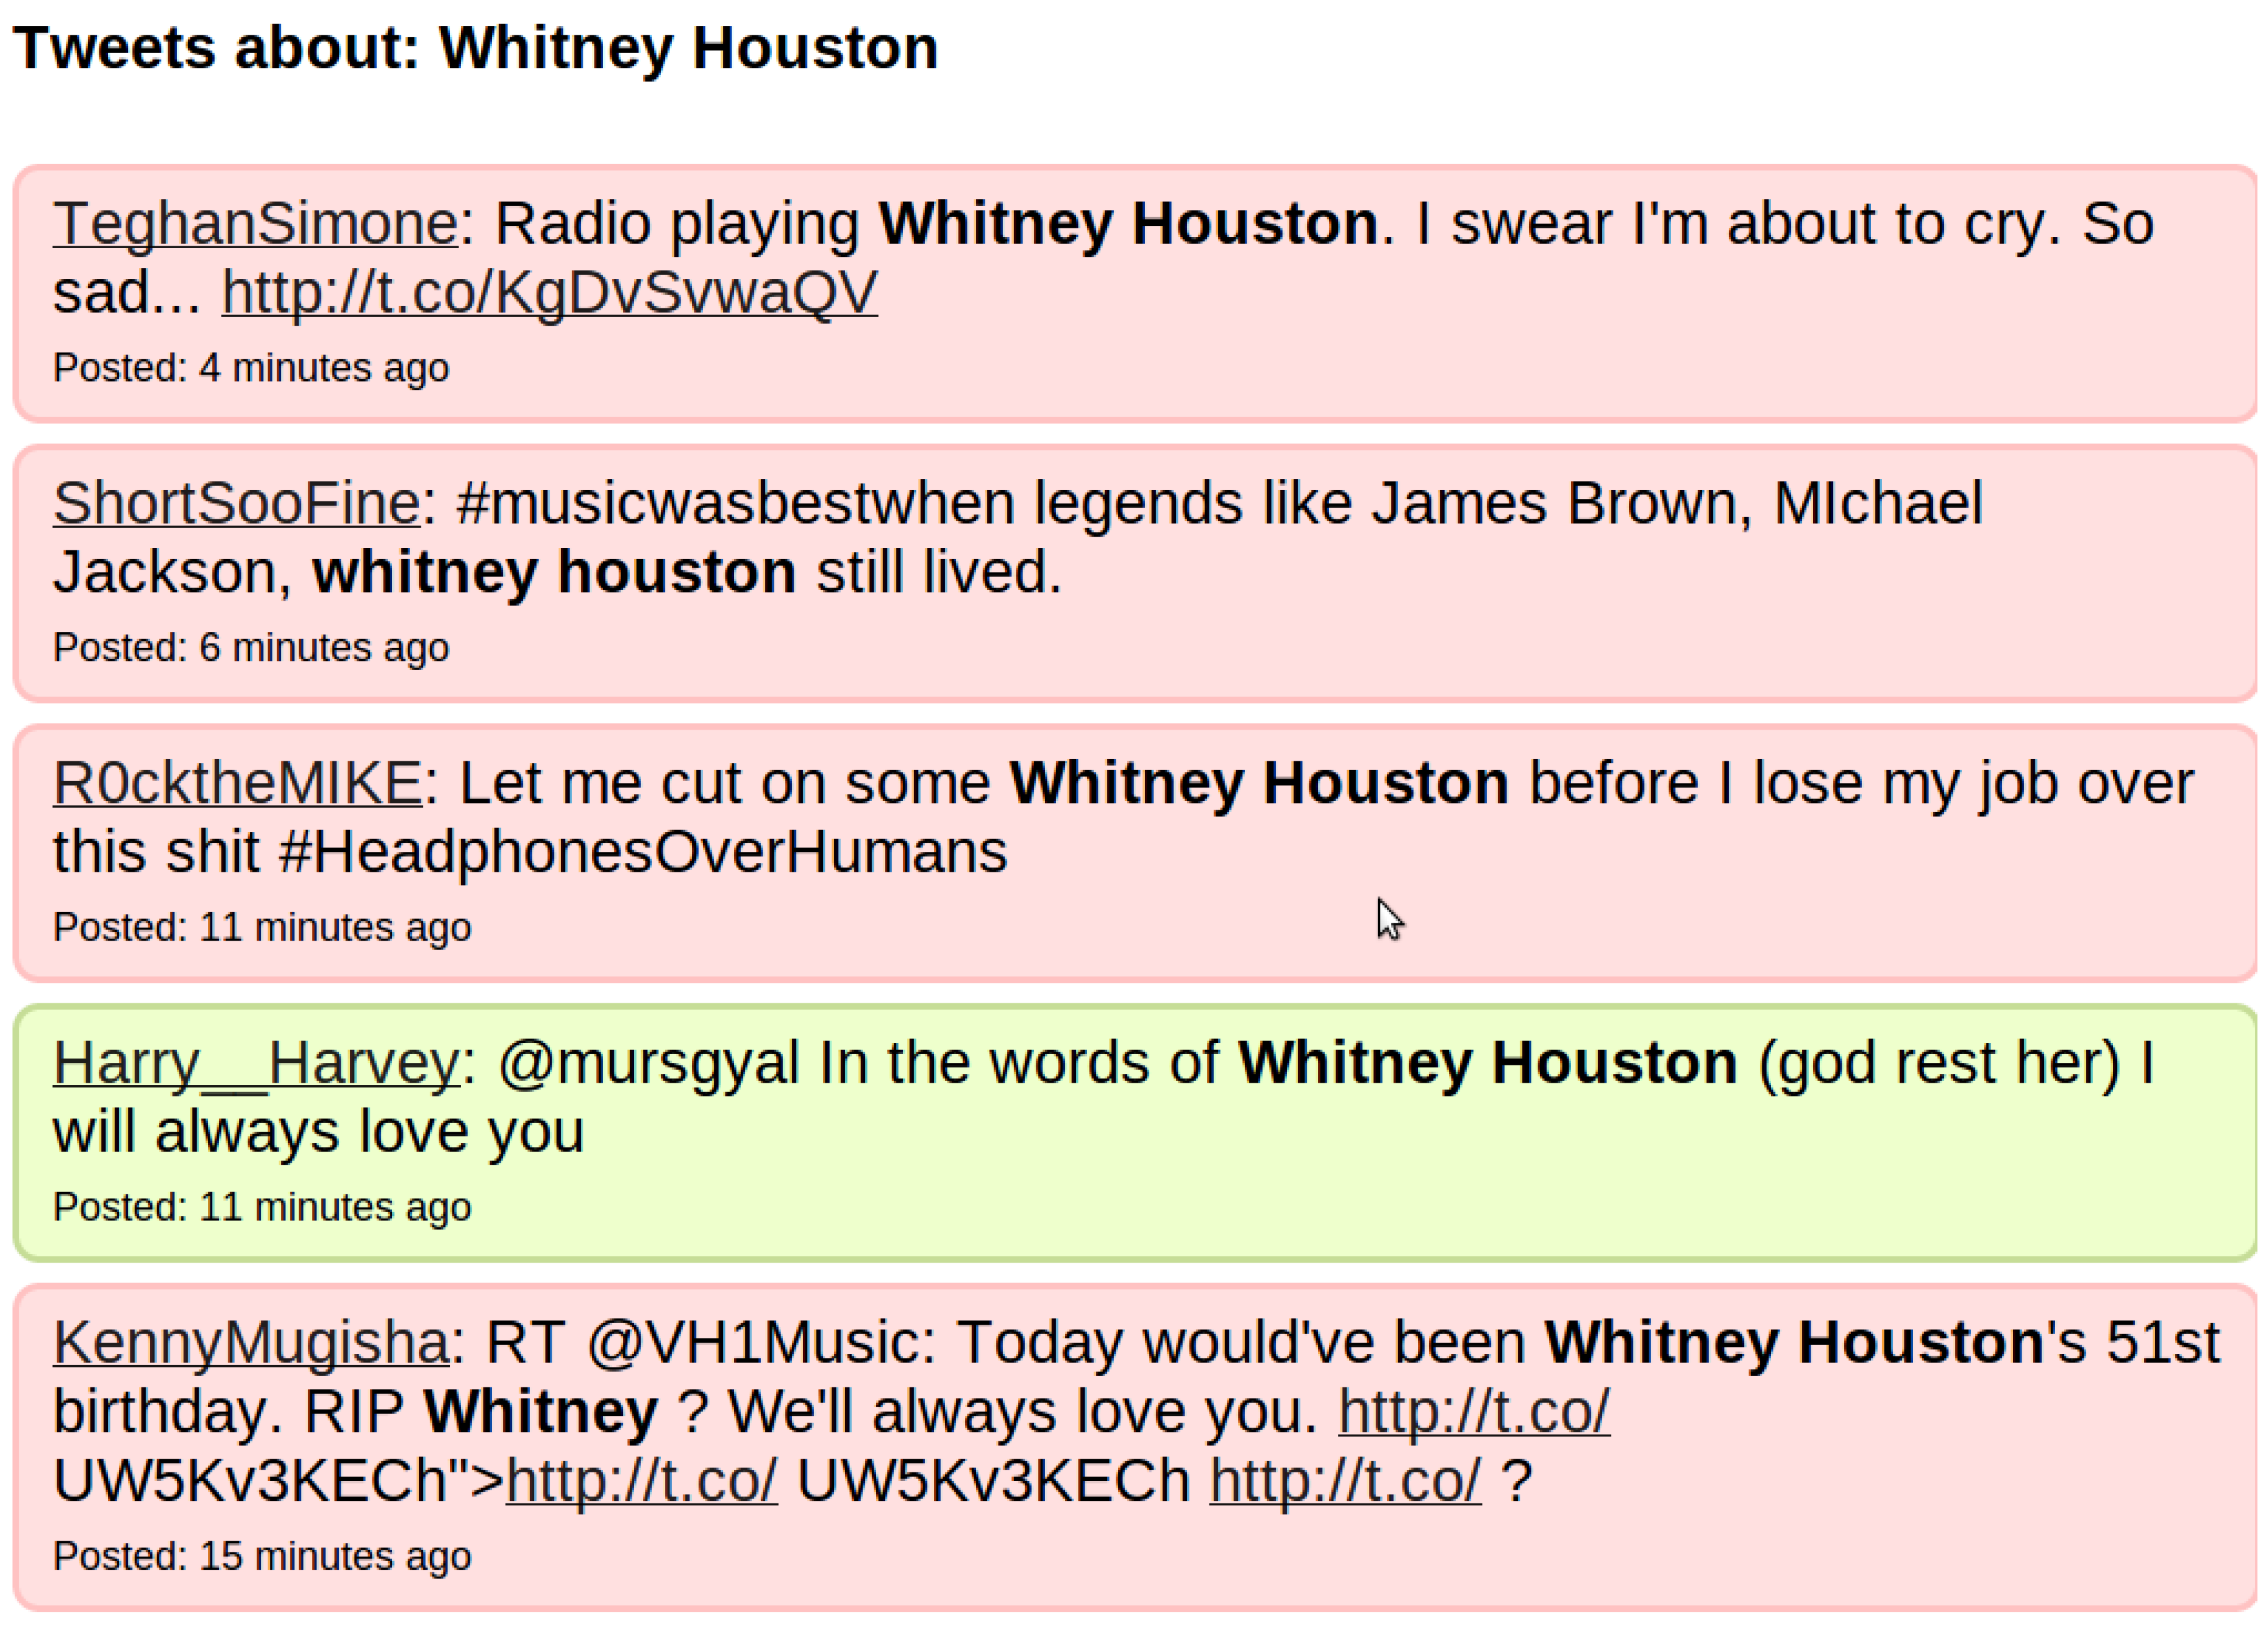
In this work, we make use of entities to drive the extraction of opinions from text. The reason for this is that it is not enough in our case simply to know whether a tweet is positive or negative in general, but rather, we need to know what exactly it is positive or negative about. It is thus important to relate the opinion to a target (topic); for example, a tweet may be negative overall (e.g., sadness about the death of a famous person) but positive about the actual person. After Whitney Houston’s death, many tweets expressed sadness at her death. However, most existing sentiment analysis tools interpreted these tweets as being negative about Whitney Houston, because of the expression of sadness, as depicted in
Figure 1.
Figure 1.
Tweets about Whitney Houston’s death
Figure 1.
Tweets about Whitney Houston’s death
However, even detecting opinions related to the right entity (“Whitney Houston” in this case) is not sufficient—what we actually need is to relate the opinion to the event of her death. We therefore use the entities and events as possible targets to which the opinions are anchored. This means that instead of just annotating a tweet about Whitney Houston’s death as being negative, we annotate instead the event of her death as being a negative experience (from the point of view of the author), i.e., that the author is sad about the death, rather than just identifying that the tweet affords a negative opinion. Opinions and sentiments are first gathered at the sentence and word level from text-based documents, based on the recognition of sentiment referring to the entities and events previously identified. Opinions can then be aggregated over wider elements such as whole documents or individual blog posts, and fed into the knowledge store along with the individual sentiments.
It has been argued recently [
29] that traditional opinion mining techniques which focus primarily on identifying positive and negative sentences from product reviews or tweets are not sufficient for many more complex needs, particularly with respect to the analysis of social media. We believe that this case holds exactly here, where detecting opinions in pre-defined areas of text is only partially useful, and that simply beating existing state-of-the-art evaluation scores on such tasks is not sufficient. In the case of the ARCOMEM system, we want to be able to connect opinions across entities and documents, and to enable the perspective of the end user to be taken into account: for example, knowing whether a document is positive or negative is not useful, but visualising the diversification of opinions about a topic is far more interesting. We investigate such issues further in
Section 5.
4. Sentiment Analysis from Text
In our model, opinion captures sentiments about information. The information regarding opinions in the ARCOMEM system is expressed by means of three basic concepts, as follows:
Opinion Holder: the author/contributor;
Sentiment Classification: a classification of the way in which the opinion is expressed. The classification of opinion types is restricted to two classes:
Polarity represents the basic positive/negative/neutral classification;
Scale indicates a gradient classification from e.g., very negative to very positive, represented numerically by a figure between −1 and +1;
Opinion Target: the entities, events etc. the opinion is about.
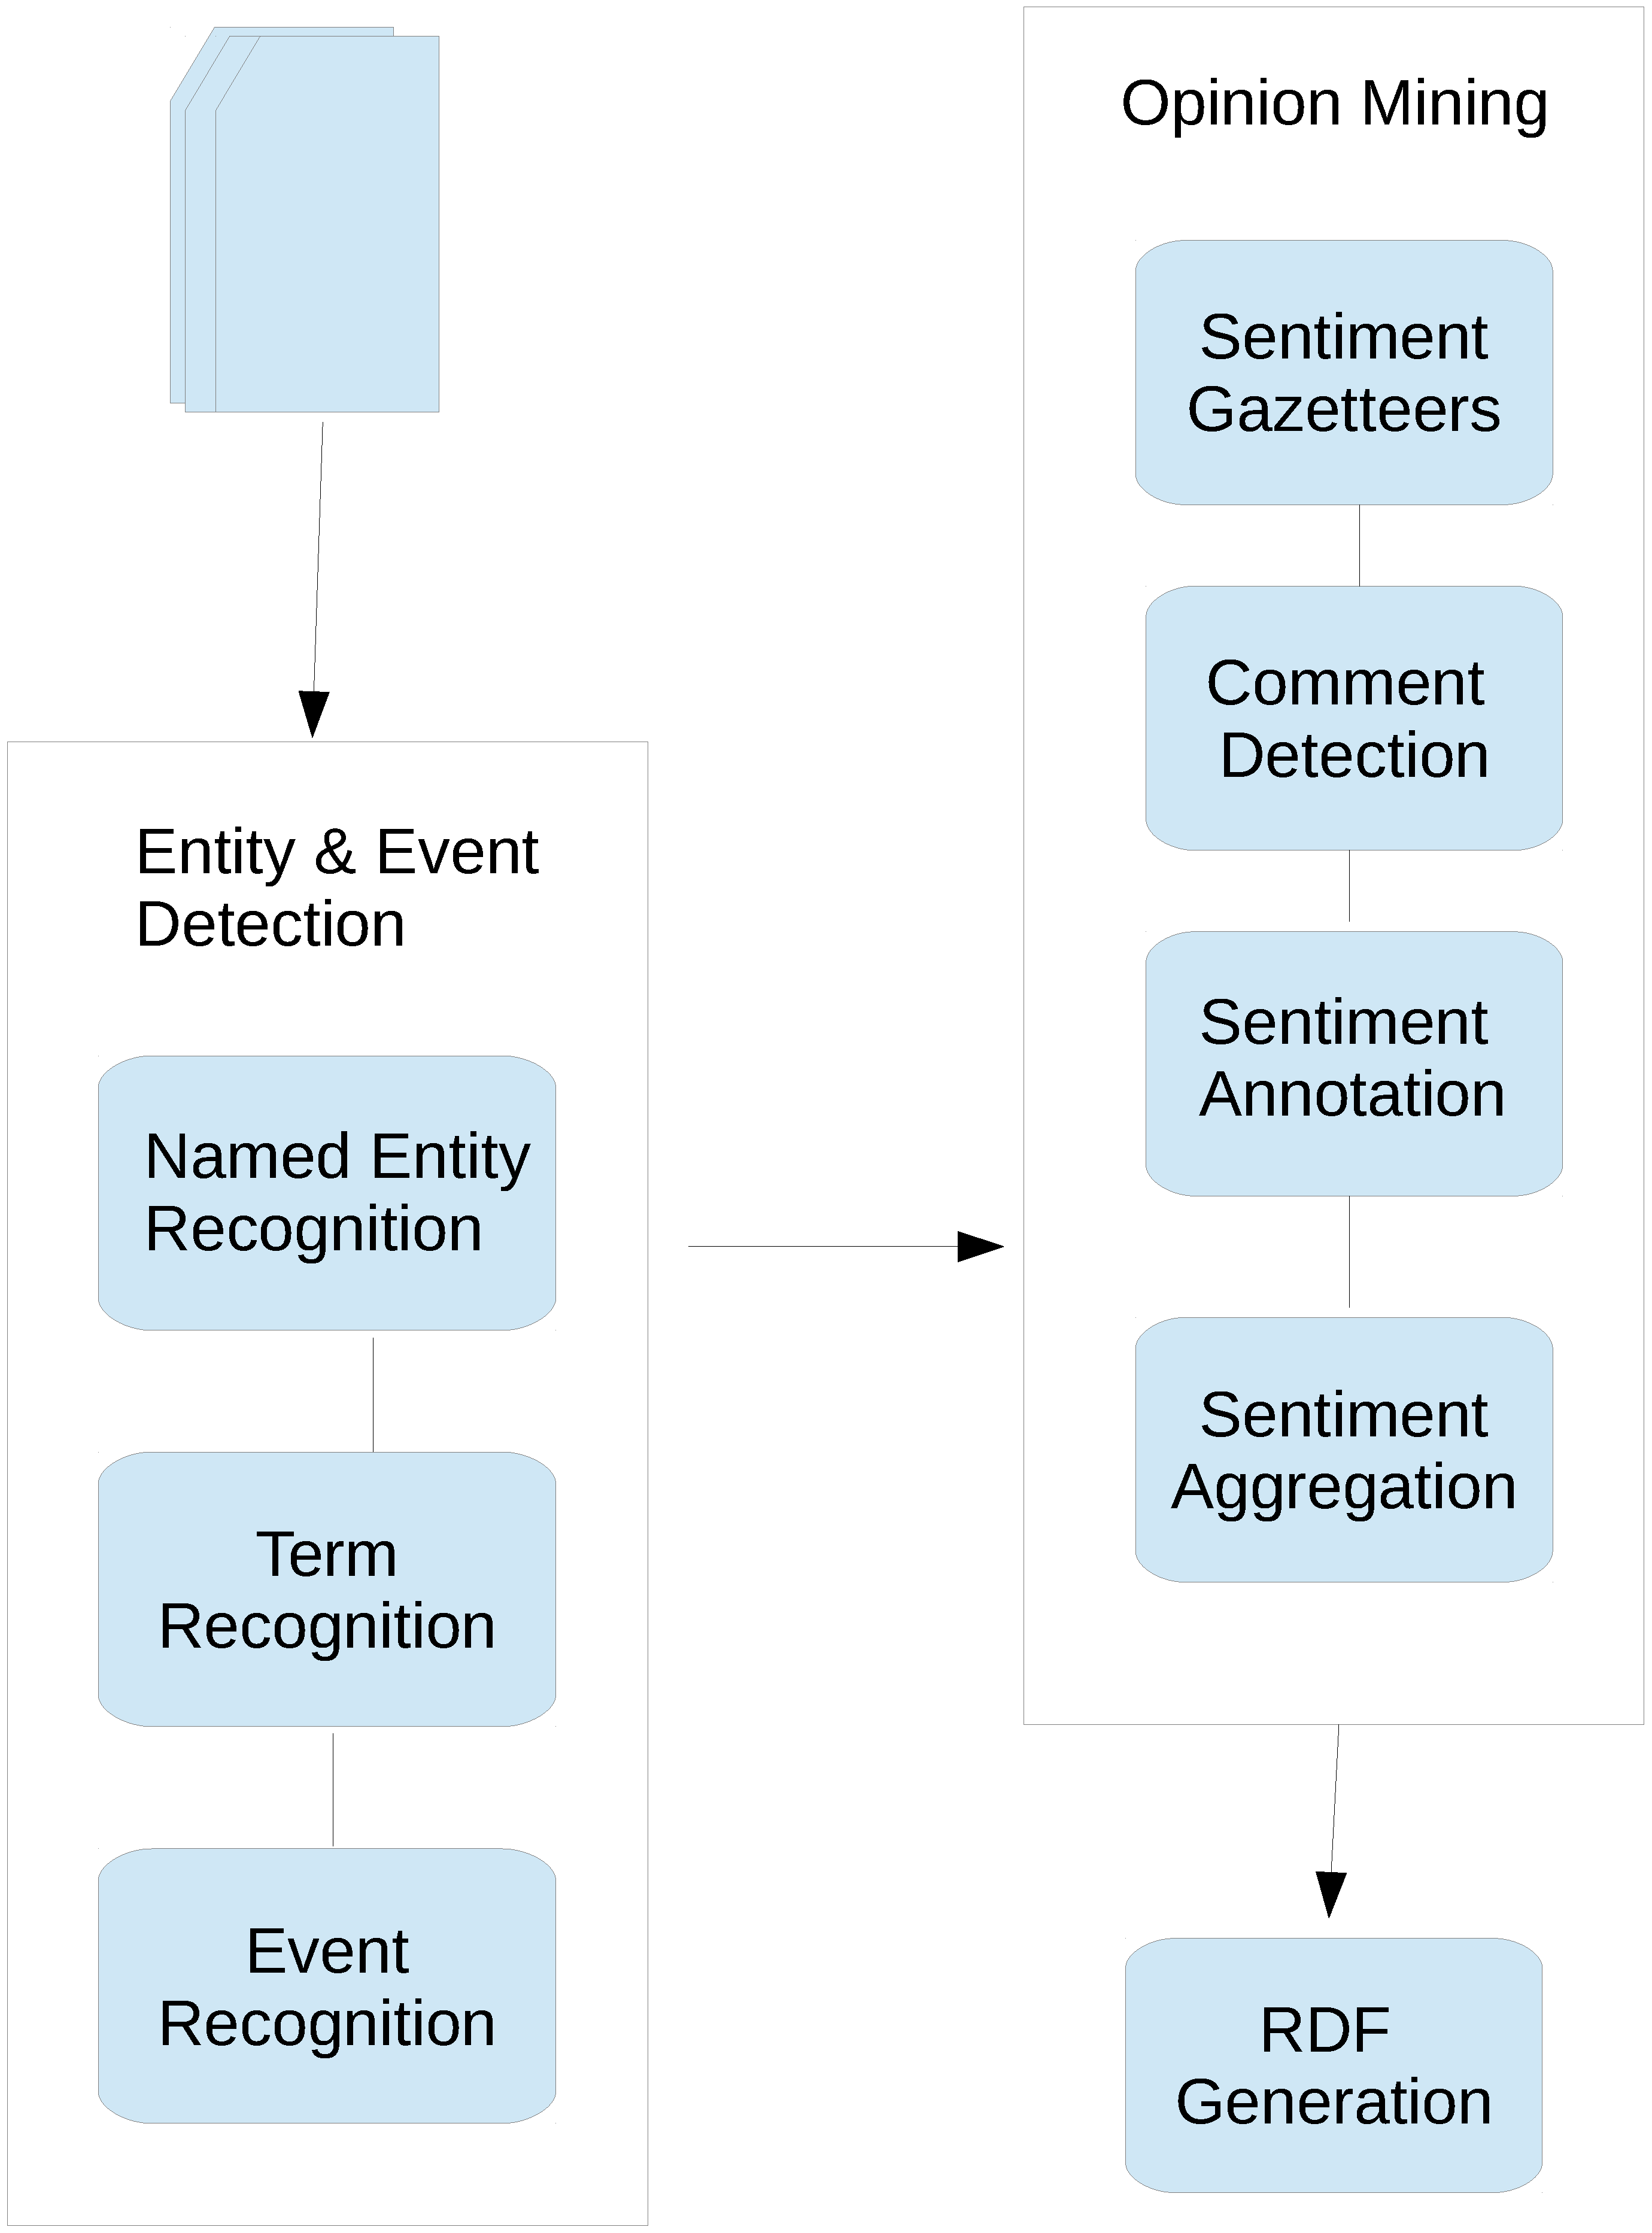
The sentiment analysis application is developed in GATE, and is designed to run on text annotated with entities and events, and the relevant linguistic processing associated with these (sentences, tokens, POS tags, morphological analysis, Noun Phrase (NP) and Verb Phrase (VP) chunks). We shall not describe the entity and event recognition system here as it is fully covered in [
30,
31]. However,
Figure 2 shows how the two systems fit together.
The sentiment analysis application depicted on the right hand side of
Figure 2 comprises the following components:
Flexible Gazetteer Lookup: this matches lists of affect/emotion words against the text. We use a flexible gazetteer, which means that the words in the list are matched according to their root form. This enables different lexicalisations, e.g., plurals, different verb forms etc. to match against each other. However, we do restrain the matching (at a later point in the grammar rules) so that a match is only valid if the same POS applies to both, i.e., a verb will not be matched with an adjective. This is because many sentiment-bearing words differ in sentiment when used as different parts of speech (compare e.g., “I like it" with “someone like me”);
Regular Gazetteer Lookup: this uses a regular gazetteer, and matches lists of affect/emotion words against the text only if they occur in exactly the same form as the list, i.e., different lexicalisations are not matched, because these tend to be specific terms such as swear words or phrases. For example, “bloody” is often used as a swear word, but “blood” is not, so we only want a match with a swearing sentiment when it is used as an adjective;
Comment Detector: this set of JAPE grammars identifies comments found in news texts and blogs and annotates them separately from the main articles, so that sentiments can be aggregated appropriately;
Sentiment Grammars: sets of hand-crafted JAPE rules which annotate sentiments and link them with the relevant targets and opinion holders. It includes modules for detection of conditional sentences, questions, sarcasm, swearing etc;
Sentiment Aggregation: Groovy scripts which combine the scores for sentiments over sentences, paragraphs and documents and output an aggregated score for each;
RDF Generation: creates the relevant RDF-XML according to the data model from the annotations. This enables the output to be used by other applications, such as the opinion event detection module.
Figure 2.
System Architecture.
Figure 2.
System Architecture.
More detailed description of these components and the method used for sentiment analysis can be found in [
32,
33], while detailed description of the mechanisms for sarcasm detection can be found in [
20]. In short, we use a combination of sentiment dictionary lookup, where every sentiment-containing word has a starting score, and then sets of rules which attach the sentiments to the correct target and opinion holder entities, and which adjust the score of the sentiment overall by considering not just the combination of sentiment words but also negatives, adverbs, sarcasm, conditional sentences, and so on, all of which affect the score. For example, a negative word will flip the polarity of the word or phrase that is negated; an adverb or swear word will generally enhance the value of a sentiment that is in a linguistic relation with it.
5. Opinion Aggregation and Summarisation
While opinions are clearly interesting, simply finding opinions about entities and events is not particularly useful in isolation: what is needed is some kind of aggregation at a higher level, in order to find e.g., opinions about documents as a whole, or to correlate all the opinions by different people about the same topic or entity. A novel aspect to our work thus concerns the type of aggregation that can be applied to opinions to be extracted from various sources and co-referred. In classical information extraction, this can be applied to the extracted information in a straightforward way: data can be merged if there are no inconsistencies, e.g., on the properties of an entity. Opinions behave differently in social media, however: multiple opinions can be attached to an entity and need to be modelled separately, as explained below. In temporal terms, an important question is whether one should just store the mean of opinions detected within a specific interval of time (as current opinion visualisation methods do), or if more detailed approaches are preferable, such as modelling the sources and strength of conflicting opinions and how they change over time.
5.1. Detecting Opinions in Comments
When dealing with online news articles, one problem for opinion mining is that they frequently contain not only opinionated comments about a topic, but also comments from readers. It is useful to understand not only the opinions in the main story, but those of the different readers, and to separate the two things. Furthermore, the opinions expressed in these comments may relate either to the main story, or to one or more of the other comments. There are many reasons why we might want to analyse not only the story itself, but also the comments: to give us a better understanding of the different sides to the main story; to give us an idea about the prevailing views of the readers; to give us insight into further issues not mentioned in the story, and so on.
Typically, opinion mining tools either look at the webpage as a whole, and ignore this distinction between story and comment, or they look at the story and disregard the comments. In the case of the former, this might provide erroneous opinion analysis over the document as a whole. For example, a story in the online press about rigged voting machines in the recent US elections had a very negative tone overall, but many of the comments were positive (often about other, related, issues), so an overall opinion analysis did not show the negativity adequately. When analysed by our standard opinion mining system [
32], the aggregated score for the document was +0.286, showing a small amount of positivity, but the standard deviation was 0.567, showing a lot of variance. For archiving purposes, we are particularly interested in getting a cross-section of the views of the community about certain topics and events, so this analysis of comments is vital.
Table 1 shows some examples of opinionated sentences from a document, including the entity that is considered the target of the opinion, and the scores associated with the opinion. We can see that the mentions of the entities have already been co-referenced with the longest mention in the document of that entity (e.g., “Romney” has been co-referenced with “Mitt Romney”, which is used as the label for the entity and its URI). In this document, the aggregated opinion score for Obama was 0.167 with a standard deviation of 0.577, while the aggregation opinion score for Romney was 0.5 with a standard deviation of 0. The overall opinion score for the document was 0.385, with a standard deviation of 0.416.
Table 1.
Examples of opinionated sentences.
Table 1.
Examples of opinionated sentences.
| Sentence | Entity | Score |
|---|
| President Obama has failed Michigan | President Obama | −0.5 |
| Mitt Romney did us all a great favor by offering his life and time to work for us. | Mitt Romney | 0.75 |
| It should have been a landslide that sent Obama into a dust heap of failed presidencies. | President Obama | −0.7 |
| Indeed, Romney is one of the best presidential candidates the Republicans have ever fielded. | Mitt Romney | 0.5 |
Our overall strategy is as follows. First, we have to identify which is the main story and which is the comment section. For this we use a number of heuristics, such as looking for some specific <div> and <span> tags in the HTML, or a section labelled “Comments” or similar. We annotate these two sections as Text and CommentSection respectively. Next, we identify the individual comments, again using similar sets of heuristics, and use the results of our earlier NER processing to identify the author name, date/time of posting and so on, and to associate these with the correct comment. Following that, we analyse the opinion in each comment separately (if one exists) and relate it to the correct target, determining whether it is about the main story or something else (e.g., another comment). Finally, we aggregate these opinions by author and by target (entity). We thus output opinions in a variety of different ways: all are represented as an Opinion, with different types, as shown below:
a single opinionated sentence, represented with type individual and with an Entity or Event as the target, and which has score, polarity and hasTarget properties;
an average opinion over a whole document, represented with type document, and which has no Target (since it makes no sense over a whole document). It has score, scoreStdDev (standard deviation), and polarity properties;
an average opinion produced from all the opinions in the document which have the same target. This has type documentTarget and has properties hasTarget, score, scoreStdDev and polarity;
an average opinion produced over all the comments in the document, without regard to the targets, and which has the type commentSet. It has score, scoreStdDev, and polarity properties.
Of course, this kind of approach will not solve the problem on all kinds of documents, but it is nevertheless a useful first step which can easily be adapted to other document types which do not match the same kind of format. The formats we have examined and to which these methods have been applied do occur very frequently and are of a standard type used in news articles, forums and so on, so we can be confident that many cases are covered. A more general approach would probably not be feasible given the widely differing kinds of texts we deal with, but it is currently part of future work to investigate how this could be extended.
5.2. Opinion Interestingness
Typically, opinion aggregation involves simply combining all the positive and negative scores about a topic, document or corpus. However, there is some debate in the literature about the relative balance between positive and negative opinions in a document set. For example, [
34,
35] found that extremely negative information can prompt spontaneous judgment formation in a way that extremely positive information does not: an excellent overview of this debate can be found in [
36]. In some cases, people are more likely to post positive than negative reviews or opinions; in other cases, the opposite is true. Moreover, in product reviews, positive and negative comments outweigh neutral ones, but this is not necessarily true of news articles, for example, or even random tweet collections. Some variations have therefore been proposed, depending on the domain: such as additionally weighting neutral sentiment as slightly positive [
37]. The theory behind this is that a neutral sentiment expressed actually has slightly more value than no sentiment expressed at all. So for example an equal combination of positive and negative sentiment expressed about a single topic swings very slightly towards the positive side and should be treated differently from something which contains no sentiment.
In our system, the users in our test case considered that having a single opinion about a document (i.e., whether it is overall positive or negative) was not useful unless it was related to something specific (e.g., “This document is positive about Obama"). However, a simple aggregation of document scores will not provide this information, because it is often impossible to associate a single entity as the target of the aggregated opinions. Furthermore, one cannot simply associate the overall opinion with the most frequent entity, or even an entity which is clearly the topic of the document, because not all opinions will be about this entity. On the other hand, knowing the range of diversity of opinions in the document is potentially useful, so that one can see whether the document is highly opinionated, and whether the opinions cover a wide range of topics. One possibility for finding interesting documents in terms of opinions is to find documents which contain outlying opinions about entities. This is in some sense the opposite of calculating reputation trust. There, a user is considered trustworthy if their opinions typically match those of the majority of users, since we typically trust the majority opinion about a topic (such as a book or film review). In ARCOMEM, however, we want to find things which are unusual, such as a lone voice of dissent.
We have implemented an approach that involves finding entities with outlying opinion scores in a document, as follows:
For each entity which is the target of an opinion in the corpus, calculate the mean and standard deviation of the opinion scores for that entity (across all documents in the corpus). Opinions that do not have a specific target are included in the global (corpus-wide) statistics, but not in any target’s statistics;
Calculate the target-interestingness of each targeted opinion based on how far out of a range around that target’s mean its opinion score is (opinion scores within the range have an interest score of 0). Calculate the global interestingness of each opinion the same way, but using the global statistics (mean and standard deviation);
Calculate the interest score of each document as the mean of the global interest scores of the opinions it contains. Outliers therefore make a document more interesting, and opinions close to the average make it less interesting.
The approach is realised in the following way. After annotating and scoring all the opinions in a corpus as usual, we then:
Scan through the whole corpus and build up a data structure that contains for each opinion annotation:
Calculate the mean and standard deviation (target and , respectively) of the opinion scores for each target t as well as for all the opinions in the corpus (global and σ);
Scan the corpus again and for each opinion’s score , calculate the “global interestingness” of its score with respect to all the opinions in the corpus and its “target interestingness” with respect to all the opinions about the same target, and add these values as features of the opinion annotation. We use a boringness coefficient b to mark the “middle of the road opinions” (scores in the range or ) as uninteresting, either globally or with respect to the target, and to calculate the interestingness of each opinion based on the distance between its score and the edges of the boring range. For an opinion with score and target t, is the interestingness with respect to its target t, and is the global interestingness—in each case, the distance outside the boring middle range;
Add to each document an annotation with a feature containing the mean interestingness score of the opinions in it.
6. Opinion Event Detection in the Social Web
Social media data has the form of a continuous stream of newly created documents. In contrast to previous methods such as polls which only allowed sampling at discrete time points, this makes continuous and real-time monitoring possible. It allows us therefore to get faster and deeper insights, but makes it a necessity to develop automatic methods to analyze and summarize the data to keep up with the huge number of documents produced.
The use of opinion mining on social media data can be seen during the 2012 US presidential election. In the run-up to the election, many news organizations used opinion timelines, especially from Twitter, in their reporting, and Twitter itself provided a real-time chart of the opinions towards the two presidential candidates, called Twindex[
38].
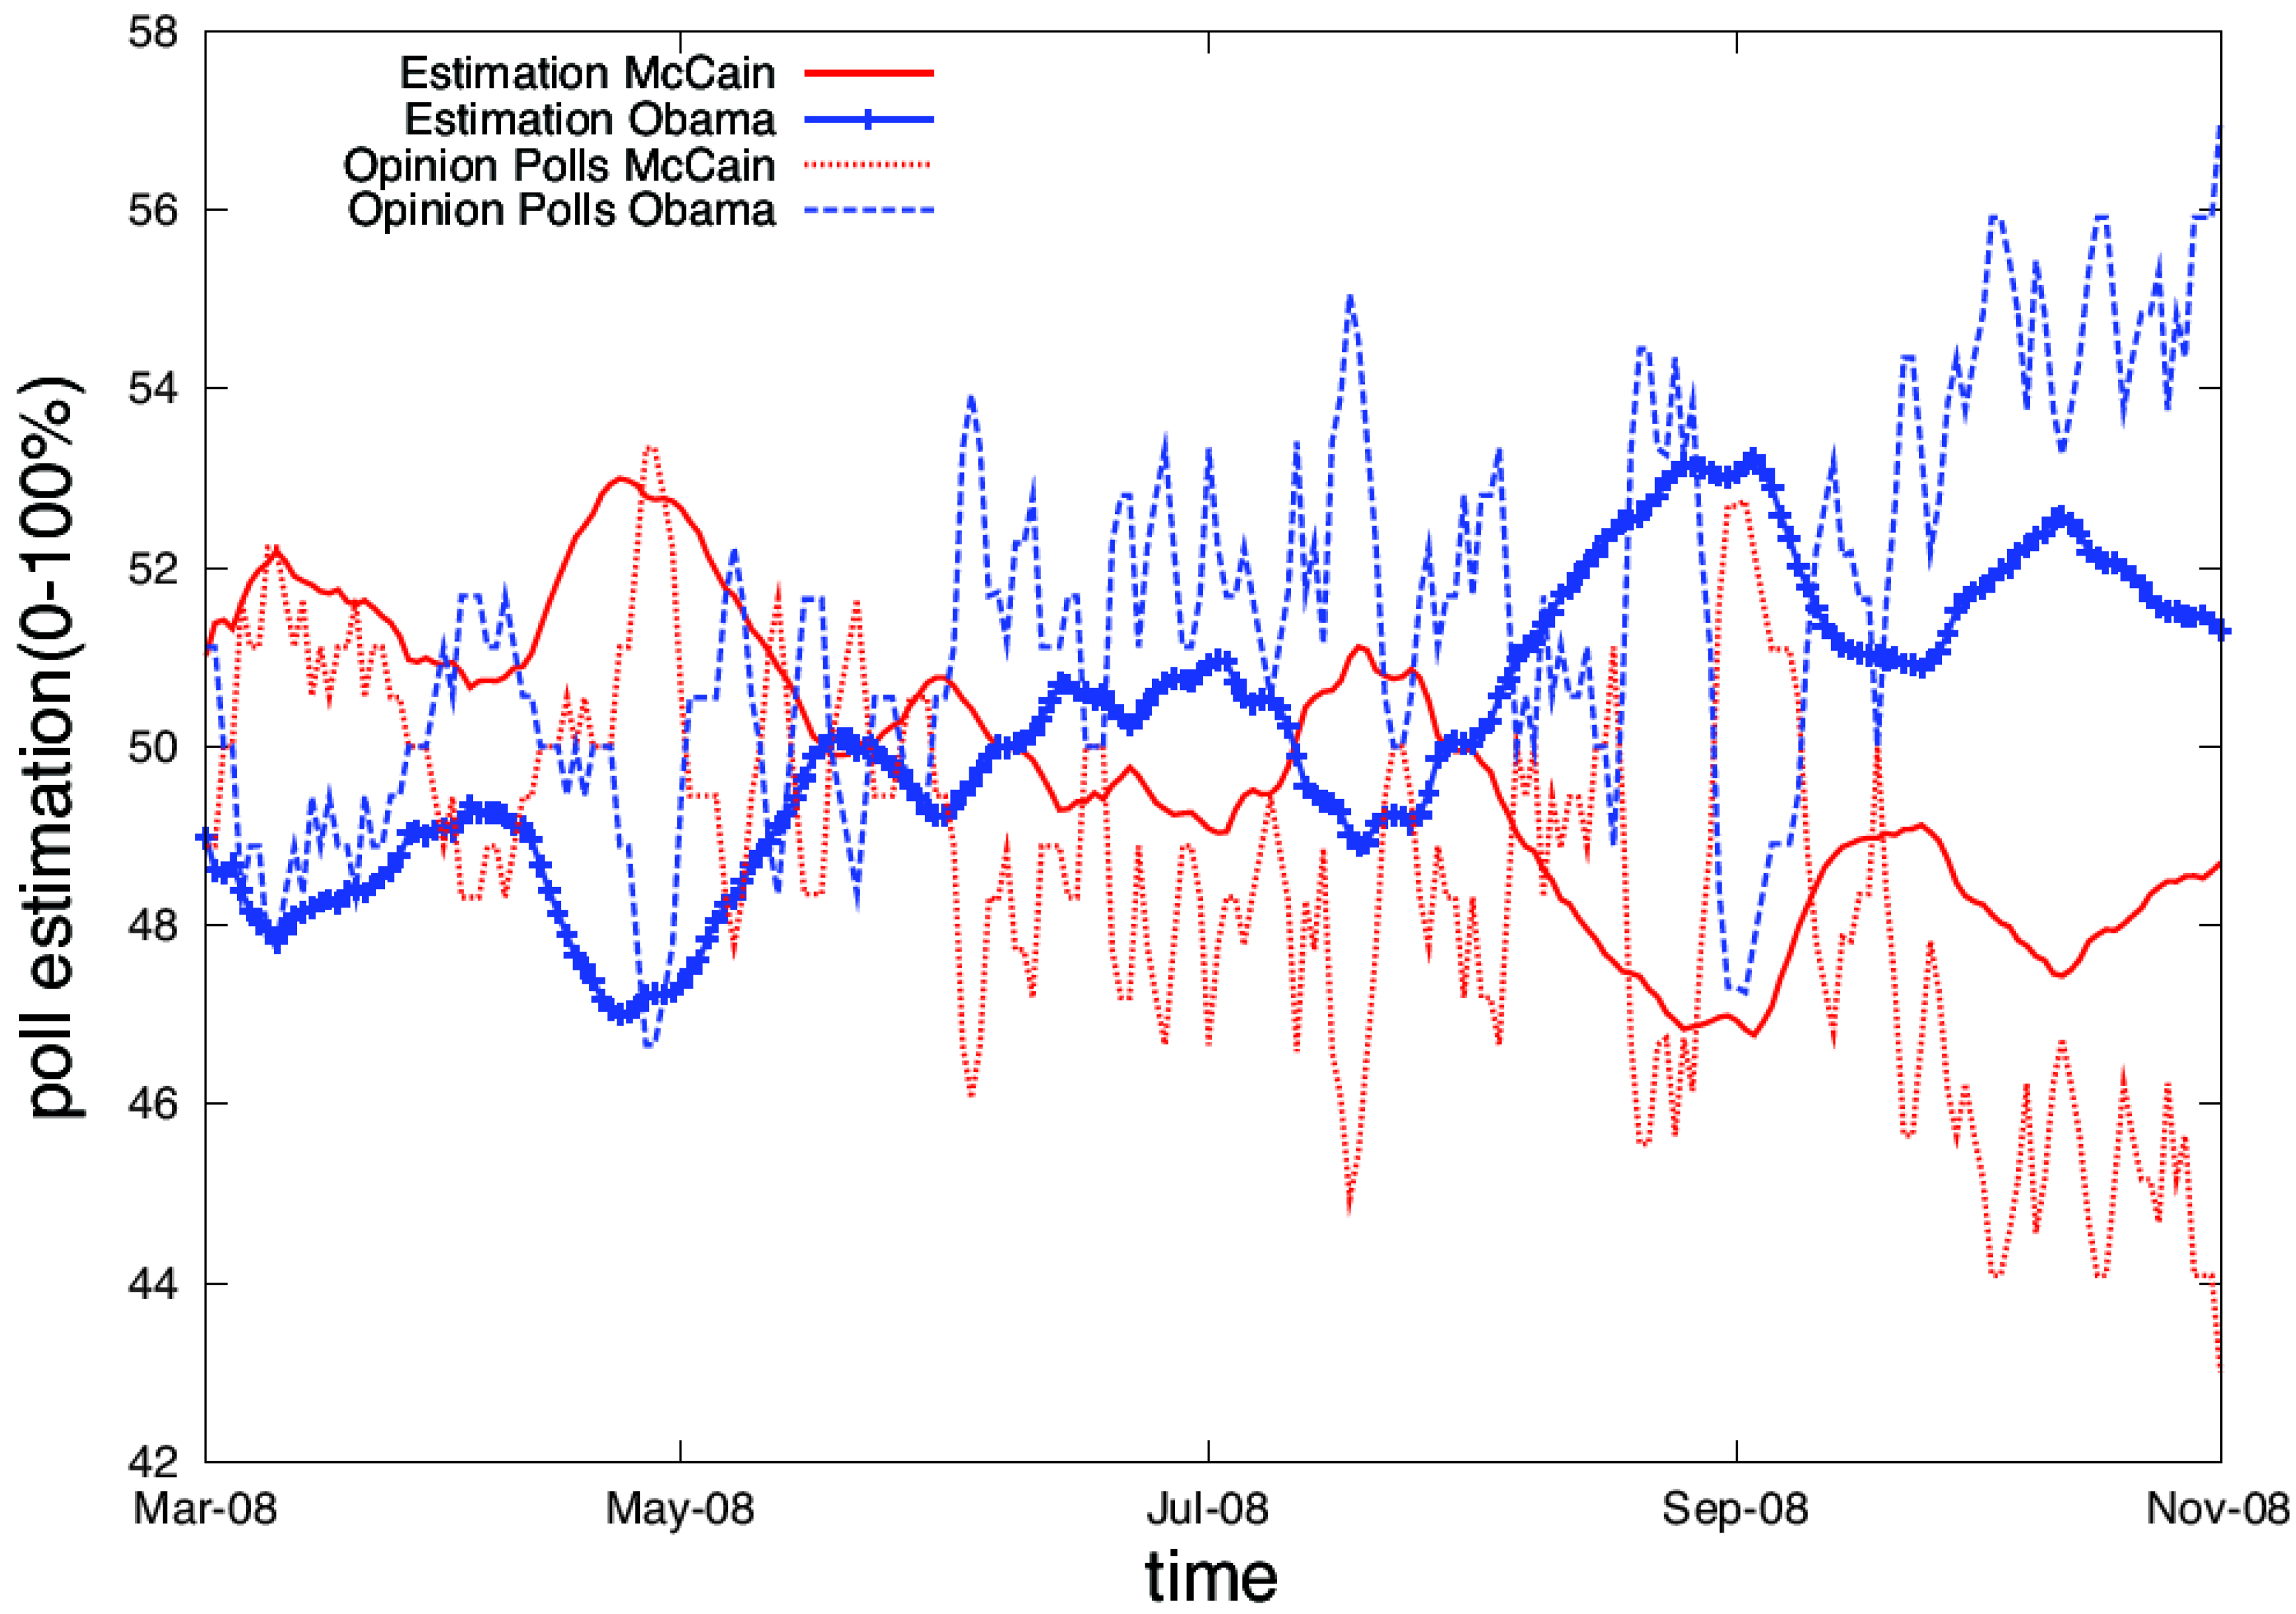
Typically such opinion timelines show the average opinion or the sum of opinions towards one or more entities over time (see
Figure 3). They are useful to illustrate the public’s reaction towards external events. However, on their own the timelines are hard to understand, as the cause for opinion changes is not apparent from the chart. Careful interpretation, typically by experts with the necessary background knowledge, is necessary to gain a better understanding. This limits the usefulness of opinion timelines, because the potential users have neither the necessary background knowledge nor access to domain experts.
Figure 3.
Typical representation of opinions over time (from [
22]). This figure compares an estimation of the opinions in the blogosphere towards the two candidates of the 2008 US presidential election to traditional opinion polls.
Figure 3.
Typical representation of opinions over time (from [
22]). This figure compares an estimation of the opinions in the blogosphere towards the two candidates of the 2008 US presidential election to traditional opinion polls.
By developing methods that increase the understandability of opinion timelines, we can make social media document collections more useful to users such as researchers, journalists and analysts. For example, journalists can use these methods to understand the opinions during a major political event in a foreign country (e.g., the Arab Spring) and historians or political scientists can use them as a starting point when exploring a web archive several years or decades later.
One established way to make sense of large amounts of social media data is “event detection", where the frequency of mentions of given entities is tracked over time and sudden increases in that frequency are taken as indicators of an ongoing event involving that entity. Such sudden increases are typically called “bursts", while the class of algorithms that detect such bursts are called “burst detection algorithms" accordingly. In this work, we transfer this approach to the mining of opinion timelines: instead of looking at the frequency of entity mentions, we look at several timelines describing opinions, and try to detect bursts in them. We hypothesize that the resulting events are a subset of the events found using equivalent event detection methods, their defining characteristic being that they reflect an event where social media users are emotionally more involved. As a result, these so-called opinion events are very useful to understand the ongoing developments.
To allow a quick understanding of a timeline, a good labeling of detected events is essential. We provide labeling of opinion events using tag clouds of descriptive keywords. This method is widely used and provides an easily understood way to summarize the underlying documents.
In this work, we concentrate on opinion event detection from blog documents, as the text in blog documents is typically longer, and the language is of higher quality and therefore easier to process with existing tools. However, the algorithm is agnostic to the type of data processed and can be easily adapted to other data sources.
Our main contributions to this topic are:
We propose an unsupervised approach to detect opinion events from social media documents. This method aggregates several measures of extracted opinions over time and uses burst detection to find event periods;
We describe and evaluate a method to label such opinion events using keywords extracted from the documents, which provides an easily understandable way to summarize the event;
We demonstrate the use of opinion aggregation functions that go beyond the simple counts or averages that are typically used in related work. We show that this increases the recall for the detection of events and provides us with more information about the type of event;
We show a tool that can be used to explore the detected and labeled events. Users can also use this as a starting point to further explore the document collection from which the opinions were extracted.
In this remainder of this section, we formally define the general method to detect opinion events, and describe the building blocks of the algorithm. We then present details about our implementation and discuss the implementation choices made.
6.1. Definitions
An opinion o is a triple , where is the entity or topic the opinion is about, the point in time when the opinion was expressed and is the polarity of the opinion, where corresponds to a highly positive and to a highly negative opinion. We call the opinion of some textual document written at , if it contains an opinion about with polarity .
A (time) bin is a period in time of a fixed, predetermined length (for example a day or a week). A time series is a function that returns a real value for each bin. Examples for such functions are the average opinion of the documents in the given bin about an entity or the number of documents in the bin mentioning that entity. An opinion timeline is a set of time series.
A change indicator describes a change in one specific feature. It consists of the textual name n and a direction .
A proto-event consists of the time interval , a set of change indicators and the set of evidence documents used to find the proto-event.
An event e is a triple , where is a time interval, is a set of change indicators and is an event description. The event description can be for example a weighted vector of prominent keywords or a textual summary.
6.2. Opinion Event Detection Algorithm
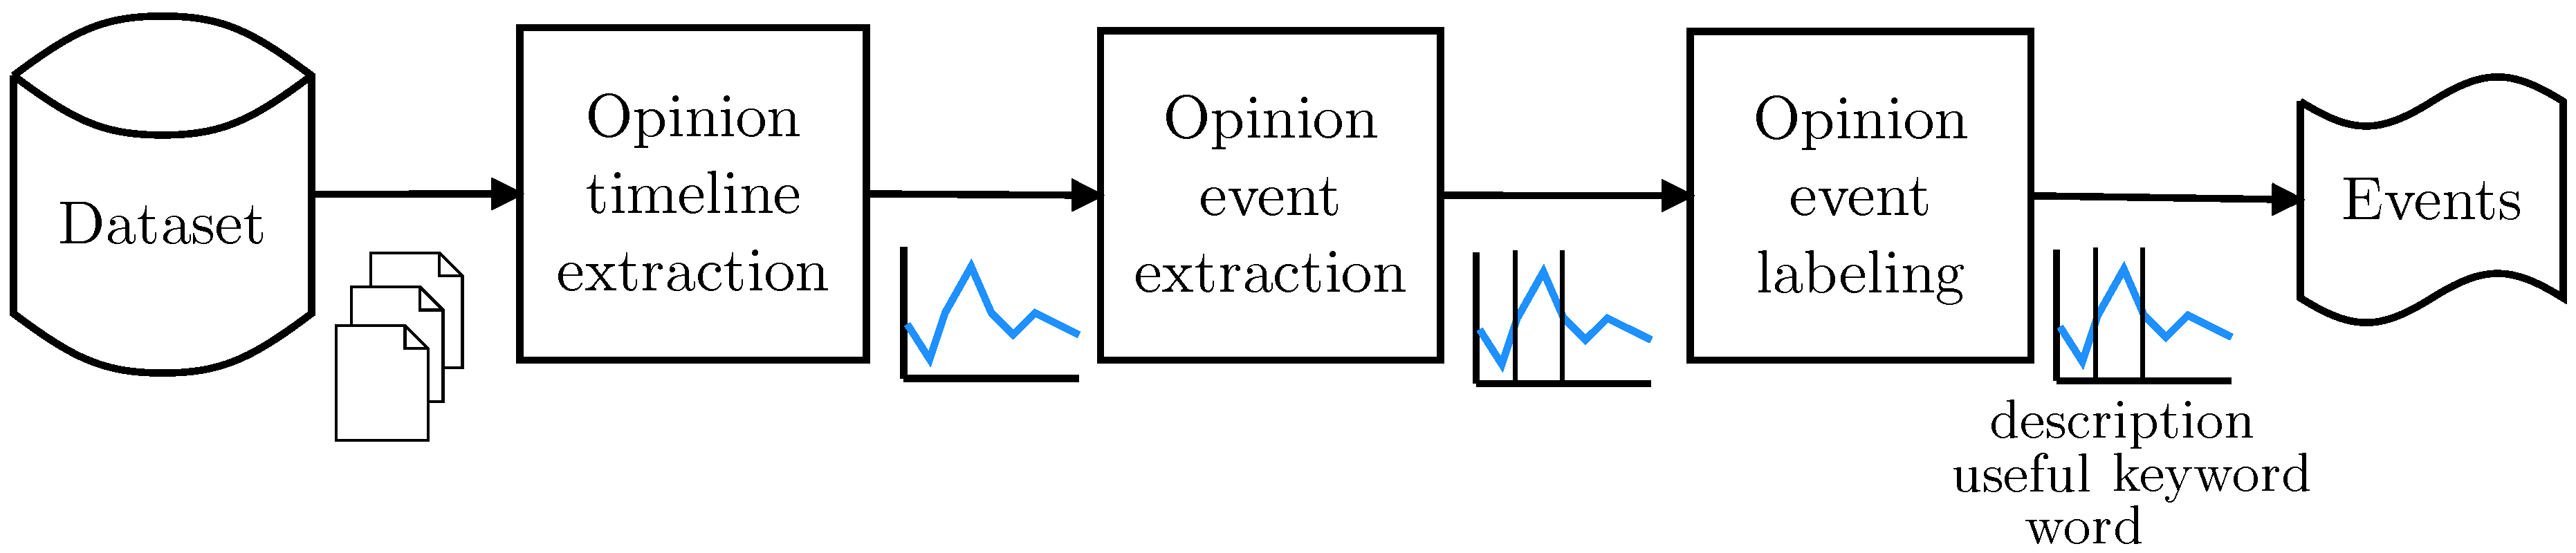
The system consists of three components (see
Figure 4). The first component is the
opinion timeline extraction which takes as input the raw, time-stamped documents corresponding to an entity of interest, and outputs an opinion timeline. The second component is the
event detection component which takes as input the opinion timeline and outputs a list of proto-events. The last component is the
event labeling component, which transforms the proto-events into events with a full description using the evidence documents of the proto-events as source material.
Figure 4.
Architecture of the system.
Figure 4.
Architecture of the system.
The “opinion timeline extraction" runs the opinion detection algorithm on the source documents and extracts all opinions about the target entity. They are grouped into bins
, where each bin contains all opinions in a certain time period. For each bin we can compute a number of different values:
the sum and average of the opinions;
the sum and average of the subjectivity as the sum/average of the absolute value of the opinions;
the number of positive and negative opinions;
the total number of opinions.
Each of these values is computed for each bucket, giving one time series per value type. Using several time series instead of only using the average opinion allows us to detect and distinguish different kinds of opinion change, e.g., an increase/decrease in average opinion vs. increase/decrease in polarization.
The “event detection component" takes the opinion timeline and detects bursts in any of the contained time series to find opinion change events. As the time series are highly correlated, we will often have parallel bursts in more than one time series. We merge these bursts if they have an overlap larger than ω. Each of those bursts corresponds to a proto-event, where the time span is equal to the time span of the burst, in the case of merged bursts to the union of the original bursts’ time span. The change indicator of the proto-event is the name of the time series where the burst occurs and the sign of the burst (values inside the burst are larger/smaller than outside it). We assign the documents published in containing the target entity to the proto-event as evidence documents.
Finally, the “event labeling component" takes the proto-events and detects a useful label for summarizing it based on the evidence documents. Summarization is a broad area of research [
39]. The sort of information contained in a summary differs according to the mechanism used in the summarization process. It may highlight the basic idea (generic summarization), or it may highlight the specific user’s individual area of interest (personalized summarization [
40]). In this work, we focus on generic summarization and we create the label as the
k terms from the evidence documents that have the highest
tf-idf value. However, based on the use case many other possible labeling algorithms such as multi-document summaries are possible [
41].
6.3. Implementation
In this section we describe the architecture presented above in
Section 6.2 and
Figure 4 in more detail.
6.3.1. Opinion Timeline Extraction
In the first step, we extract the opinions expressed about a specific entity in the documents contained in the dataset. Here we make use of the methods to extract and summarize opinions that are described in
Section 3,
Section 4 and
Section 5. We partition the opinions (summarized by document) about an entity by their publication date into weekly bins. For each bin
we compute the average opinion
, the number of positive
and negative
opinions, as well as the sum of
and
as
as the number of subjective opinion mentions.
6.3.2. Opinion Event Extraction
An opinion event is for us a period of time where there is a sudden and significant change in either the number or the value of opinions expressed about an entity. We can therefore use burst detection algorithms to find the time span of an event. A burst detection algorithm takes as input a list of values , where each value represents a time period i of fixed size and returns the time periods that differ significantly from their context.
There are several possible burst detection algorithms. For our experiments we used a variant of Kleinberg’s method [
42]. We chose this algorithm because it is less sensitive to noise in the input value, and therefore less prone to split continuous events into multiple parts than other, threshold-based, methods. Kleinberg’s algorithm models a stream as being produced by a probability distribution that has multiple states. Each state corresponds to a specific output frequency. The states are arranged as a sequence such that low output frequencies correspond to small state indices and high output frequencies to large ones. Each state transition is associated with a cost. Using dynamic programming, the burst detector finds an optimal state sequence that balances the difference of the value
and the expected value of the state at index
i against the cost of state transition. Bursts correspond to the indices where the optimal state sequence has a state other than the base state.
We adapted Kleinberg’s algorithm in two ways. First, the algorithm is designed only for frequency values. In our implementation we introduce states that are shifts by a multiple of the standard deviation of the input data. This allows us to find bursts in any real-valued time series. Second, the algorithm can only detect bursts corresponding to an increase, as it only models states where the value is above average. We introduce additional burst states that correspond to values below average and are thus also able to find bursts corresponding to a decrease, i.e., periods where the value is significantly below average. The latter modification is especially useful for real-valued time series such as the series of the average opinion.
To detect events, we run the modified burst detection algorithm on each of the following 5 time series:
average opinion: the average opinion per bin;
frequency: the total number of opinions per bin;
negative opinions: the number of positive opinions per bin;
positive opinions: the number of negative opinions per bin;
subjectivity: the average subjectivity of a bin as the average of the absolute value of the opinions.
We assign event types based on the bursting time series and direction of burst (see
Table 2). As the different time series are often correlated, we typically find similar bursts on more than one time series. We merge the resulting events when they overlap for at least
of their durations, by setting the time span of the final event as the union of the individual event’s time spans. The final event also has multiple event types. In our experiments we chose
.
Table 2.
The type of a detected opinion event depends on the time series from which it was extracted and the direction of change. For example, an increase of the average opinion has the type “opinion+”.
Table 2.
The type of a detected opinion event depends on the time series from which it was extracted and the direction of change. For example, an increase of the average opinion has the type “opinion+”.
| Time series | Increase | Decrease |
|---|
| Average opinion | Opinion+ | Opinion− |
| Avg. absolute opinion | Subjectivity+ | Subjectivity− |
| # Positive opinions | Positive+ | Positive− |
| # Negative opinions | Negative+ | Negative− |
| # Opinions | Frequency+ | Frequency− |
6.3.3. Opinion Event Labeling
The final component provides the descriptions of the detected events. In this work, we label each event using descriptive keywords. We extract the keywords from the documents that contain opinions about the target entity and are in the time span of the event.
We consider as keyword candidates all terms that are contained in at least 5 of the related documents, are at least 3 characters long and consist only of alphabetic symbols. We also remove terms that are substrings of the target entity’s name, as they would not add any new information. The terms are stemmed using the Porter stemming algorithm [
43] implemented in Lucene. The remaining terms are ranked by their
tf-idf value and we choose the
k highest values. The number of keywords
k can be easily changed to accommodate different use cases.
7. Evaluation
In this section, we describe some experiments we have undertaken to evaluate the opinion event detection and discuss the results. We also describe a tool we have developed for evaluation and exploration.
7.1. Exploration and Evaluation Tool
To show the results of the algorithm, we developed a small web application [
44] that allows users to explore a document collection using the detected events. The dataset we used for the evaluation was the TREC-BLOG collection, described in
Section 7.2.1. On the first page of the application (
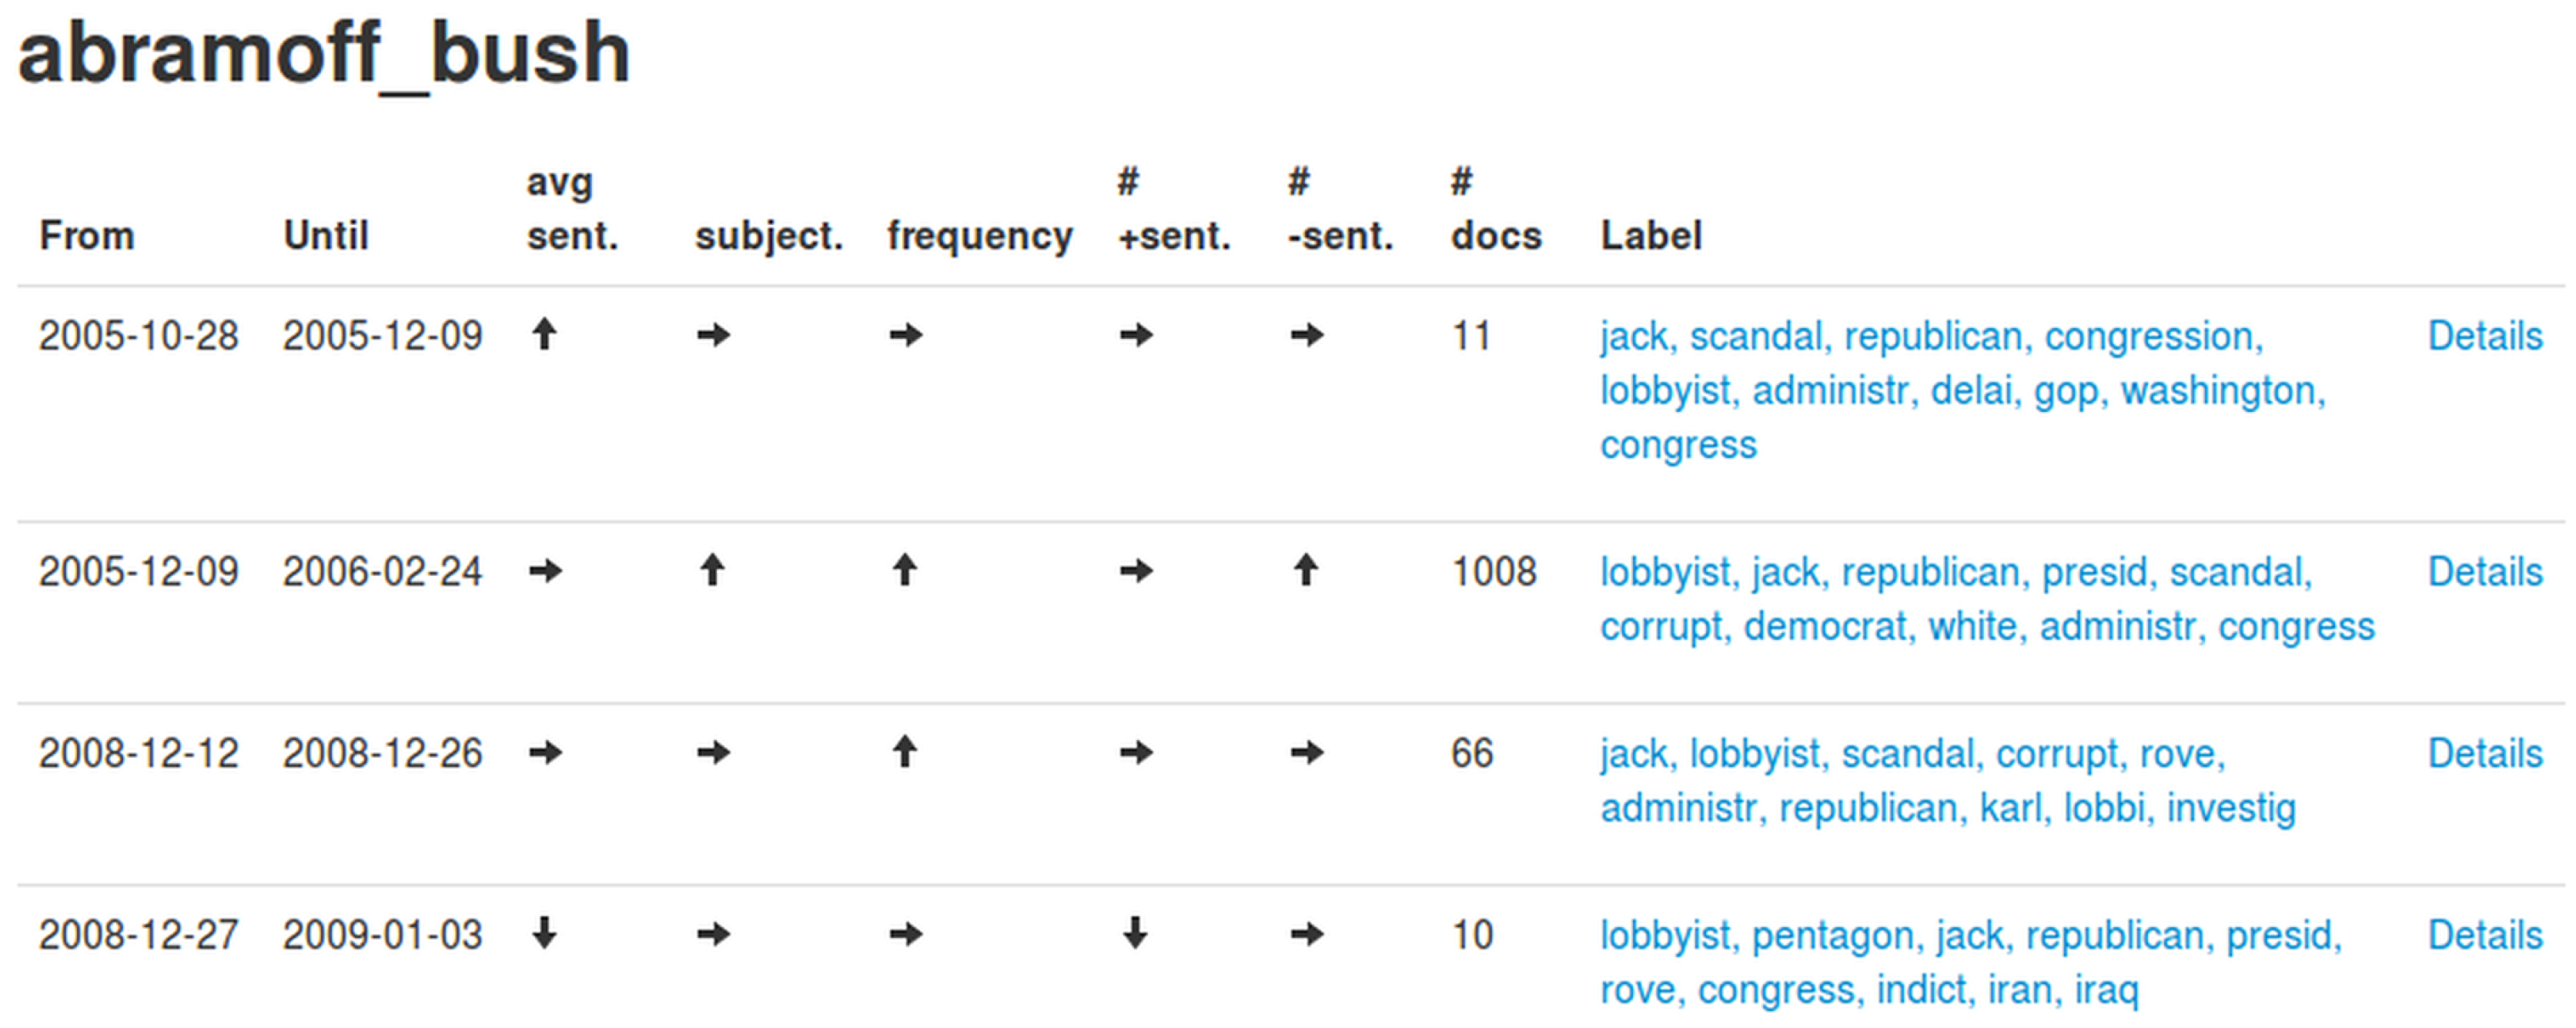
Figure 5), we show a list of all detected events, including the corresponding time period and the extracted labels. From here, the user can click through to a detailed view of an event (
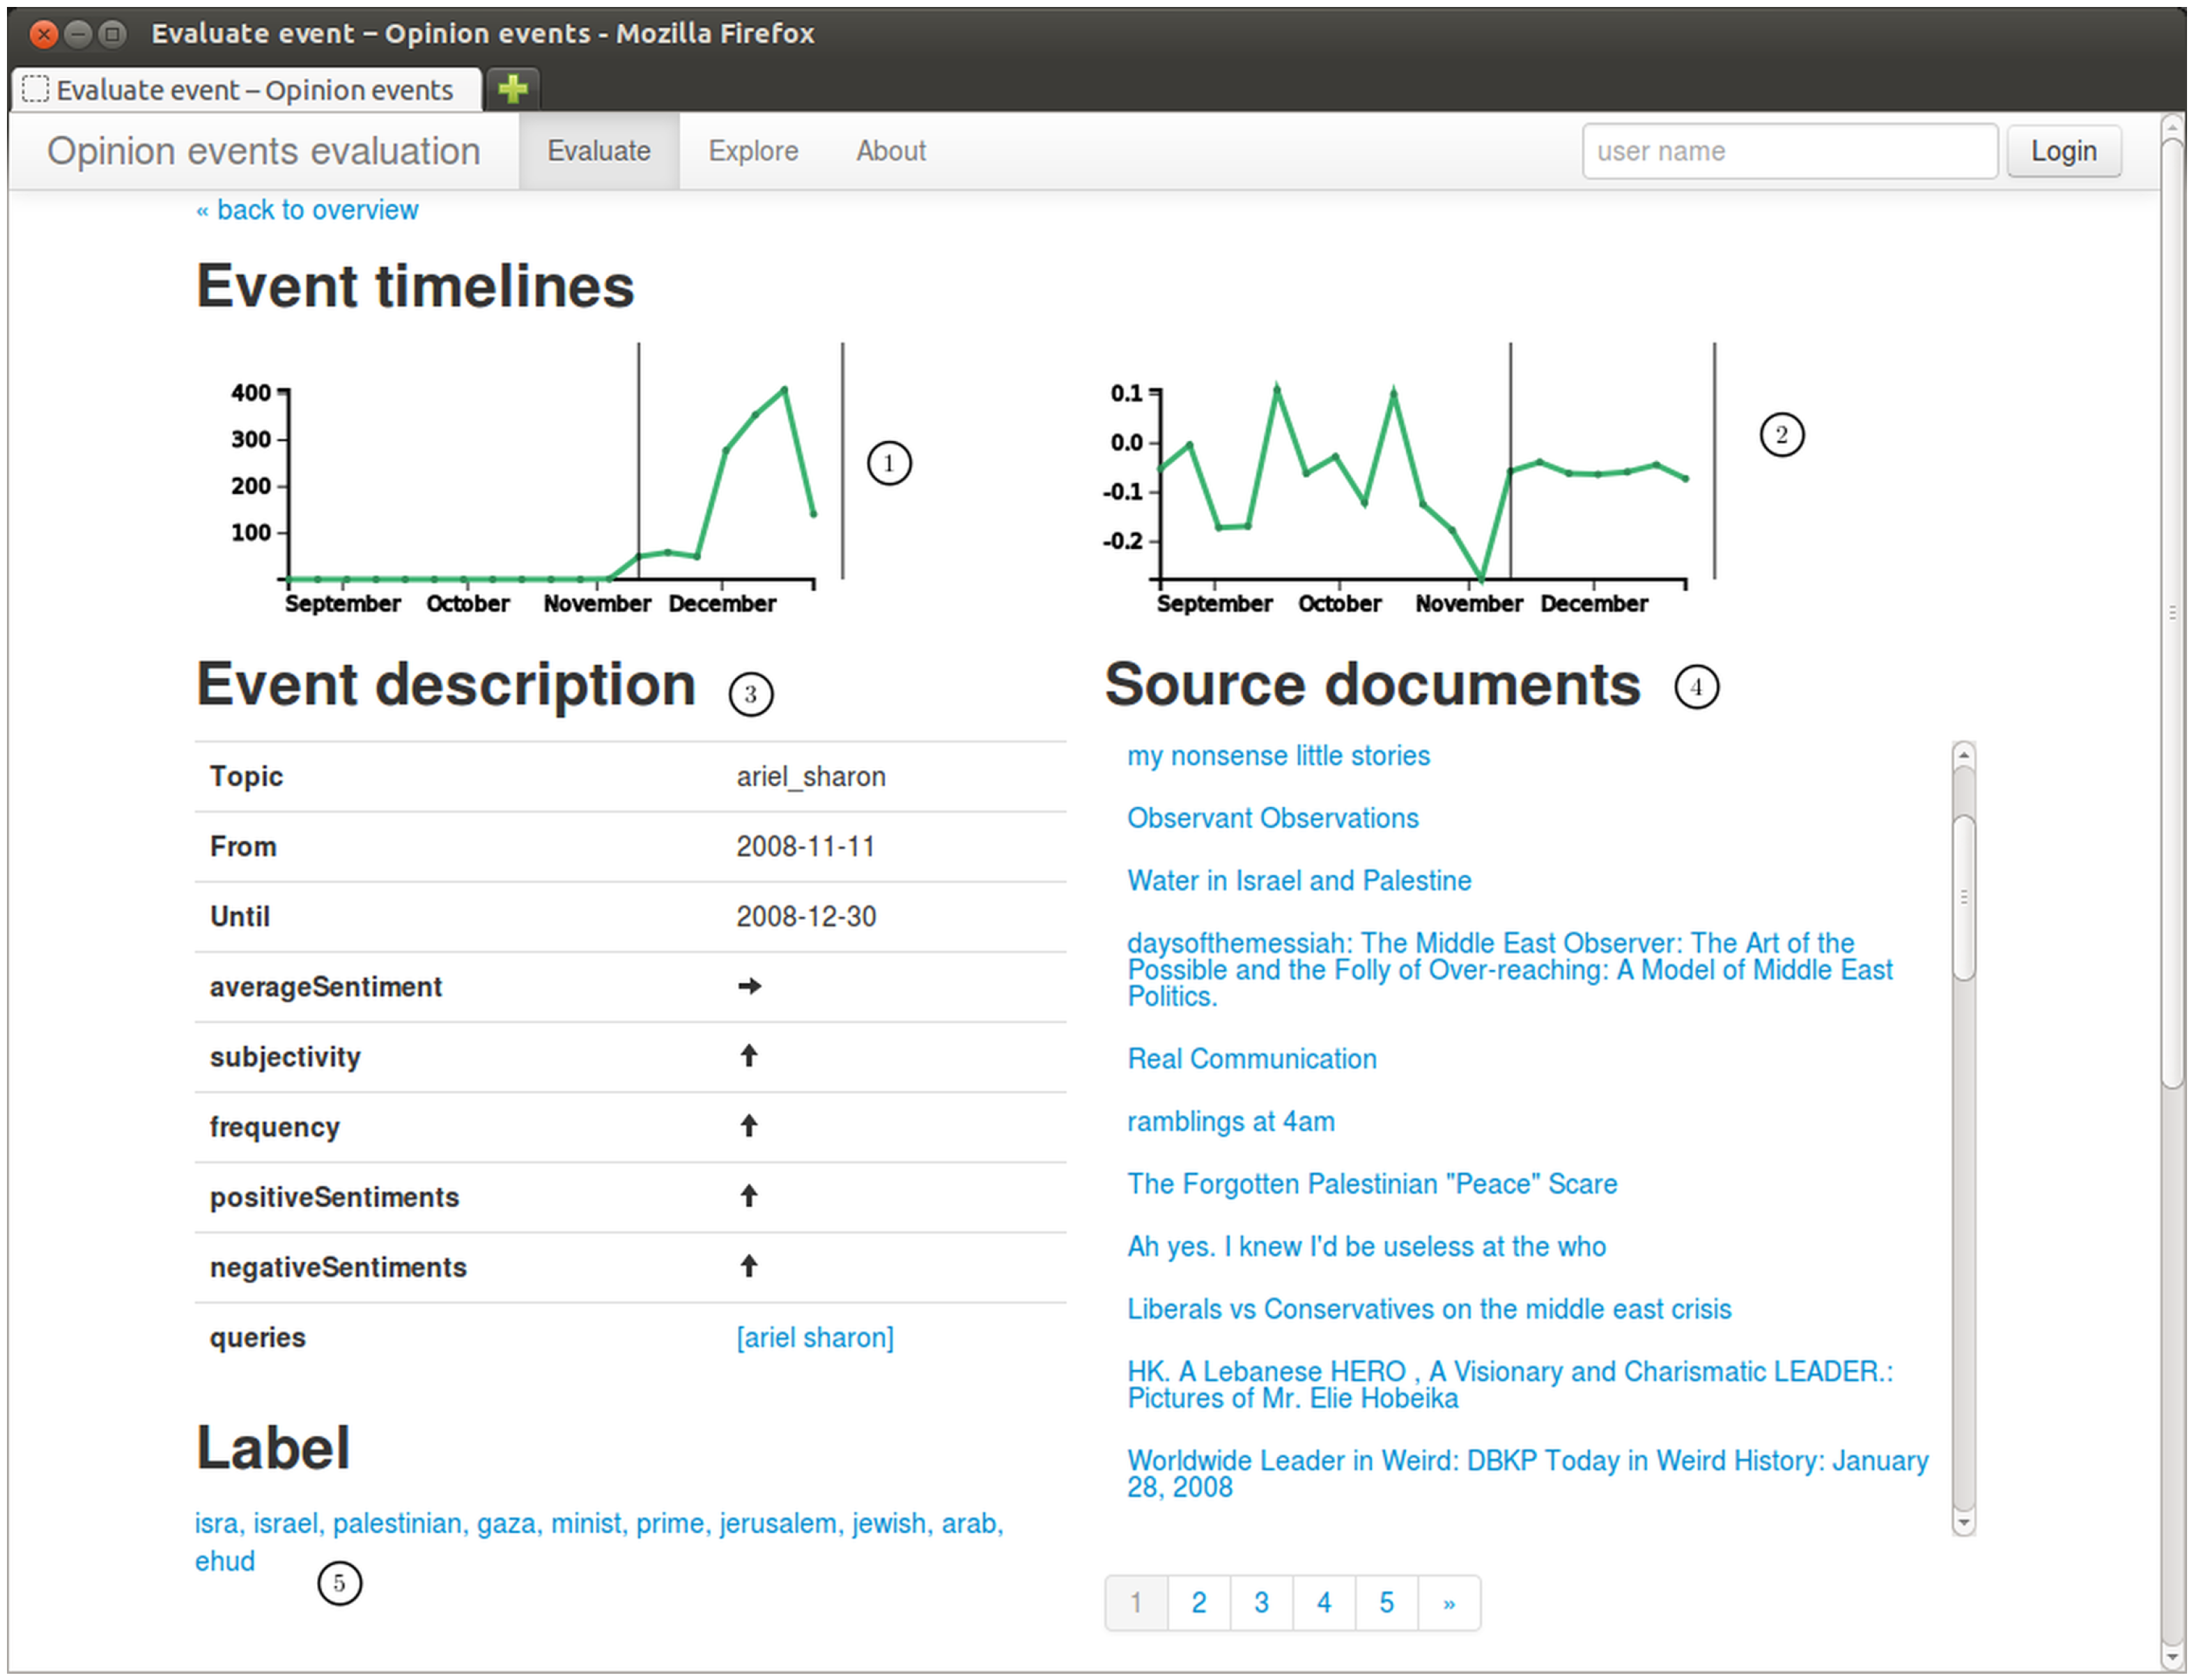
Figure 6), which shows all available metadata about the event, the label and also a list of the documents belonging to the event.
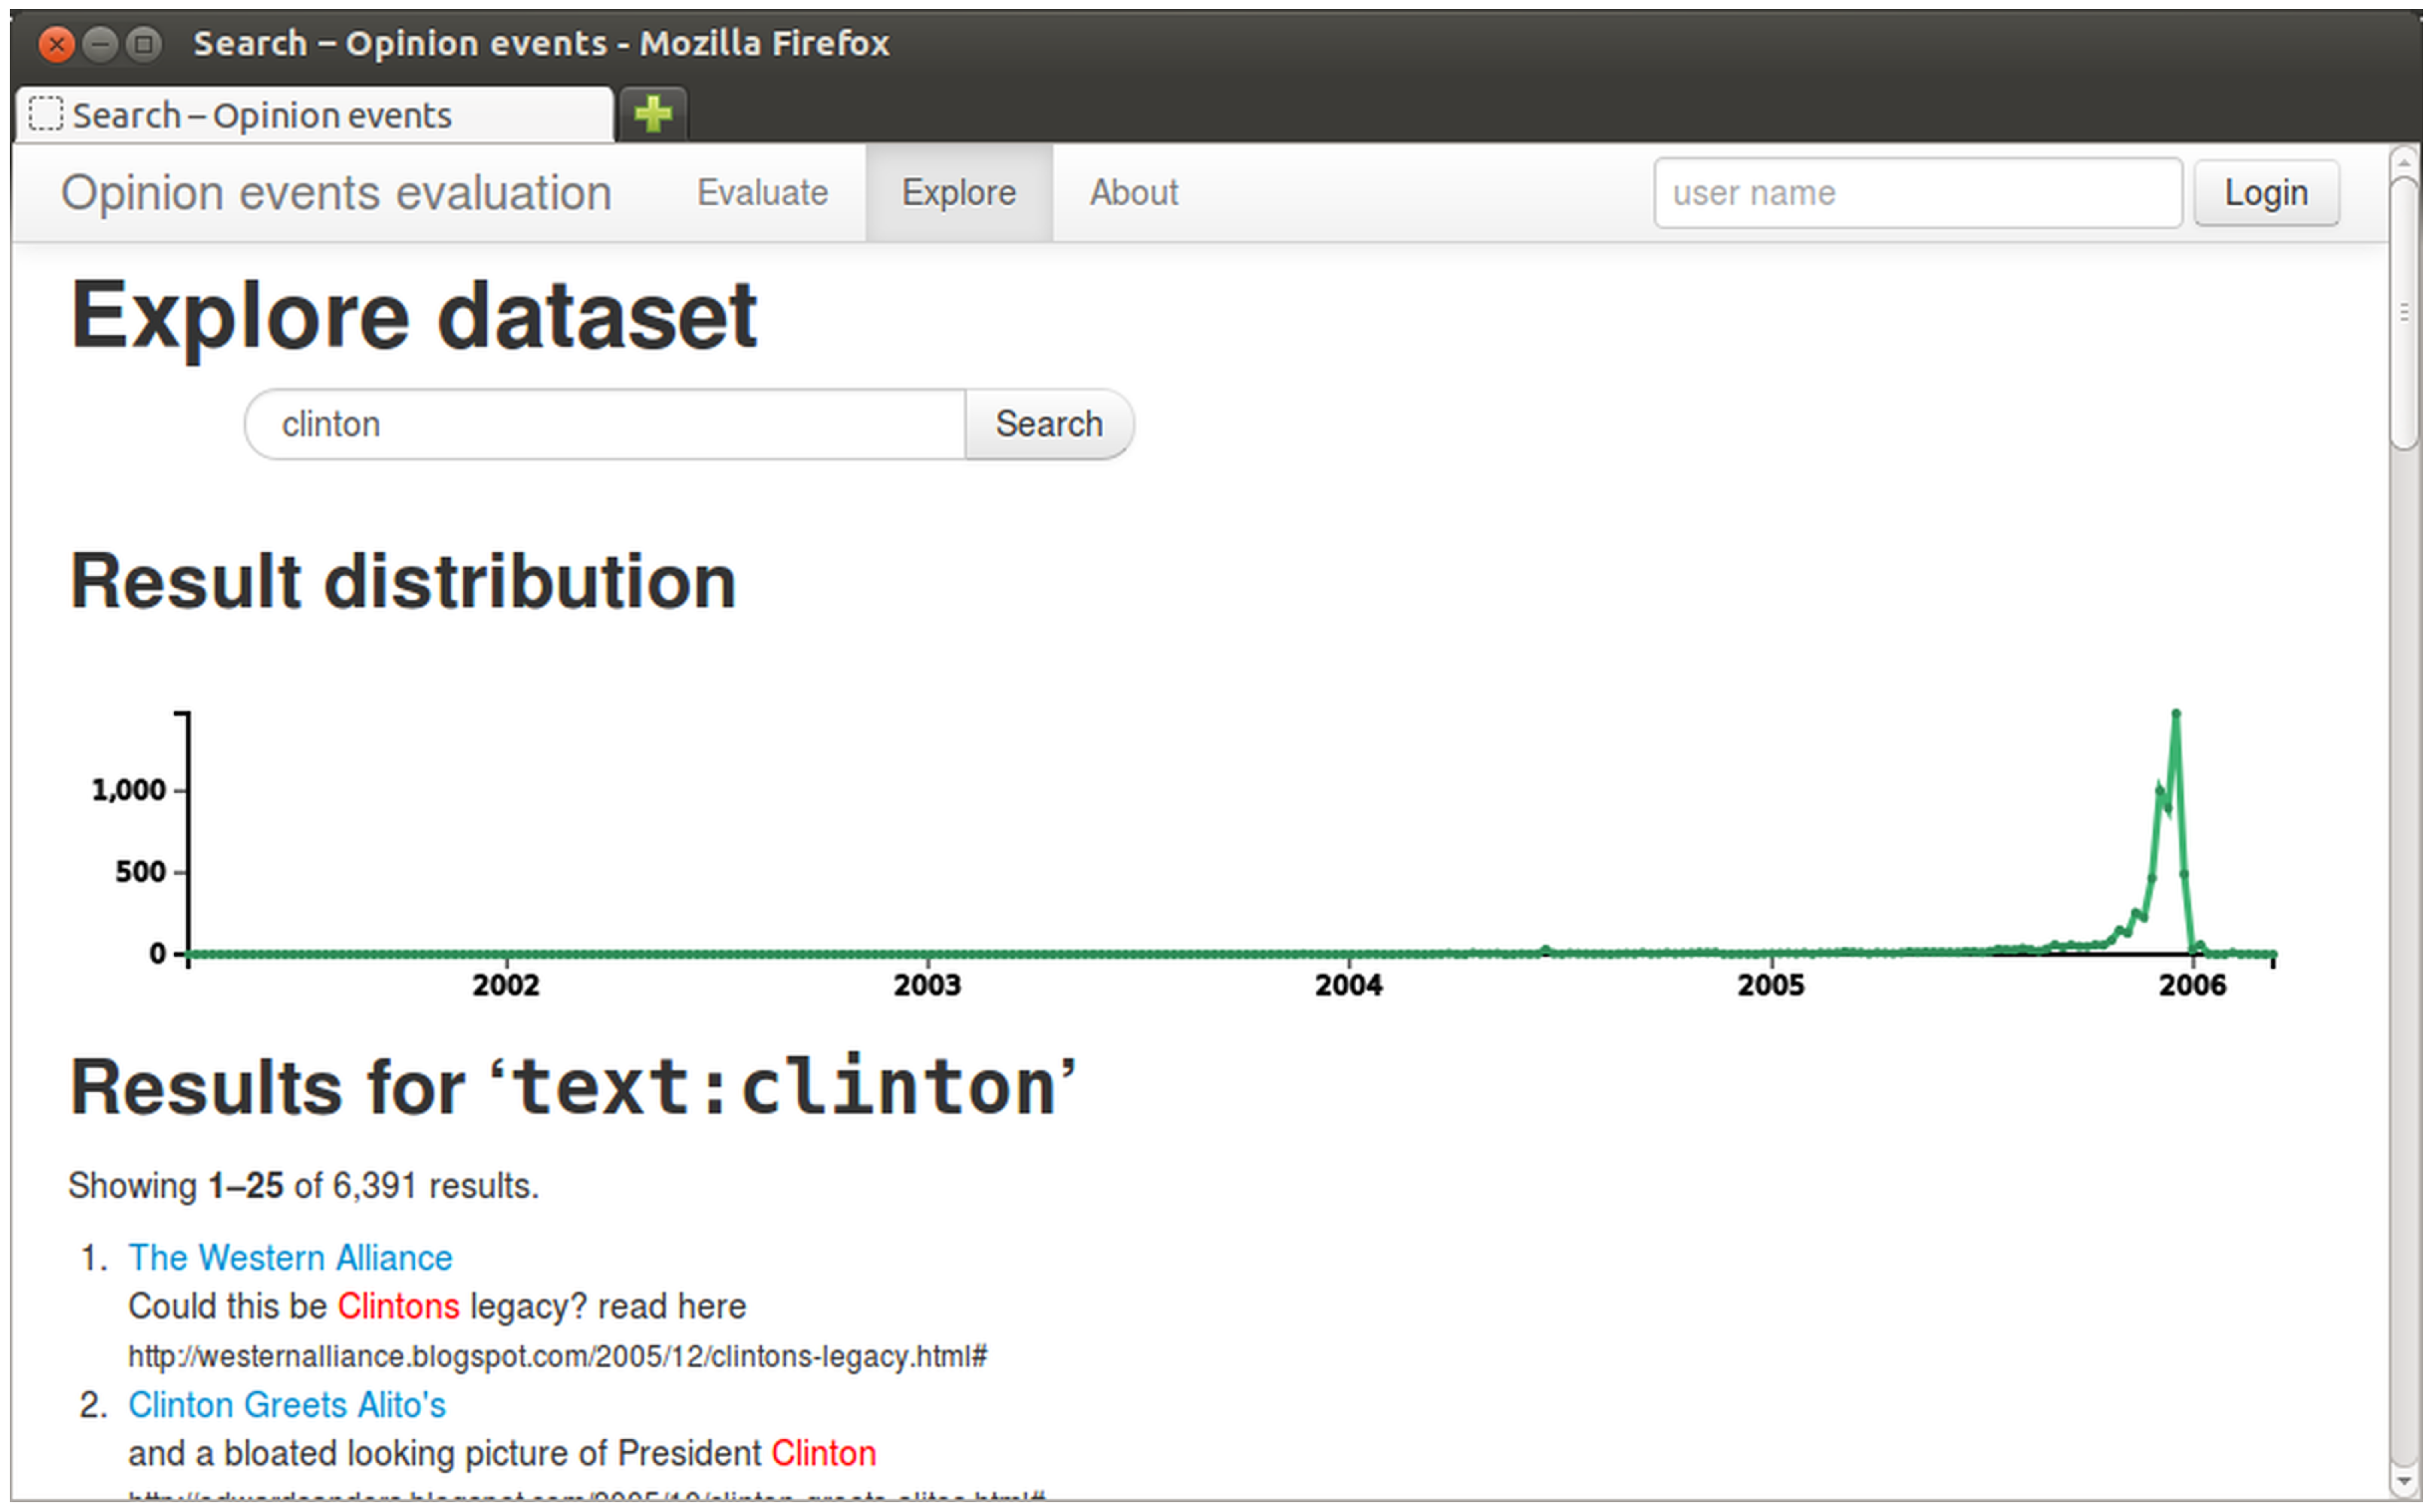
In addition, the system allows a keyword search in the dataset, showing the distribution of result documents over time in a graph (
Figure 7). Together, these functions allow an easy and efficient exploration of the document collection.
Figure 5.
List of detected events for the topic “abramoff_bush”.
Figure 5.
List of detected events for the topic “abramoff_bush”.
Figure 6.
Screenshot of evaluation interface showing one extracted event for the entity “ariel sharon” as well as some timelines and related documents. Elements of the interface include: (1) frequency of topic mentions; (2) average opinion; (3) event metadata; (4) titles and links to documents from which the event was extracted; and (5) event label (keywords).
Figure 7.
Keyword search in the exploration tool. The graph shows the distribution of result documents over time.
Figure 7.
Keyword search in the exploration tool. The graph shows the distribution of result documents over time.
7.2. Evaluation
The goal of our experiments is two-fold. On the one hand we want to determine how relevant the detected opinion events are. On the other hand we also want to quantify how well the extracted event labels describe the event. As opinion event detection is a novel problem, there are no existing benchmark datasets that we could use as a comparison. We therefore chose to manually judge the detected events and their labels.
7.2.1. Data Sets
We evaluate our approach on the data from the TREC-BLOG challenges 2006 [
45] and 2008 [
46]. We removed all the known spam blogs from the TREC-BLOG 2006 dataset and extracted the textual content using the Goose system [
47]. This gives us a dataset of 26.7 M documents spanning the time between 2004 and 2008. All documents without a publication date or a date outside this time range were ignored.
The target entities are derived from the 50 topics of the BLOG 2006 opinion retrieval challenge. The topic names correspond to one or more entity names. We use all documents that contain these names as the source documents for finding the opinion events for this topic. On average, the document collection had 5350 documents for each topic. As expected for such a highly subjective medium as blogs, most of the documents contained opinions. Per topic we found on average 5100 opinionated documents. The average opinion over all used documents was 0.05, i.e., slightly positive, with an average standard deviation per topic of 0.16.
In total, we found 248 events for the given topics. The distribution by type is shown in
Table 3. As we can see, none of the time series alone is enough to find all events. By including all of them instead of using only the average opinion, as is typically done in the related work, we are able to find almost twice as many events. This validates our approach to use several perspectives of the opinion timeline.
Table 3.
Number of detected events by bursting time series (note that one event can contain multiple parallel bursts).
Table 3.
Number of detected events by bursting time series (note that one event can contain multiple parallel bursts).
| Time series | Increase | Decrease | Total |
|---|
| Average opinion | 95 | 35 | 130 |
| Frequency | 62 | 5 | 67 |
| Negative opinions | 68 | 16 | 84 |
| Positive opinions | 69 | 17 | 86 |
| Subjectivity | 72 | 8 | 80 |
Table 3 also shows that the number of events with an increase of the underlying time series is much larger than the number of events with a decrease. Intuitively this makes sense, because for most time series the non-bursting state corresponds to a value close to zero (e.g., for counts in periods where the entity is never mentioned). For those time series, a decrease can only occur in long periods of higher entity activity, as only in those periods does a larger value become effectively the expected value. However, detection of negative bursts is still a very novel topic, and further research might find better ways to characterize their behavior.
If we examine the number of parallel bursts per event, we see that about two thirds of the events (163) occur only in a single time series, while the number of events spanning 3 or 4 bursts (31 for each) is larger than the number of events containing 2 bursts (16) and 5 bursts (7). This seems to indicate that some of the time series are correlated. To investigate further, we can look in
Table 4 at the number of co-occurrences of bursts on different timelines in the same event. The data shows that there are several strong correlations, for example between positiveOpinions and subjectivity, but none of them is strong enough to account for the pattern of burst co-occurrence we saw above. Therefore we conclude that we cannot exclude any of the timeseries from the opinion event detection without losing information.
Table 4.
Co-occurrence of bursts from different time series. The value in each cell gives the number of events that contain both a burst of the timeseries corresponding to the row and the column label.
Table 4.
Co-occurrence of bursts from different time series. The value in each cell gives the number of events that contain both a burst of the timeseries corresponding to the row and the column label.
| | Average opinion | Frequency | Negative opinions | Positive opinions | Subjectivity |
|---|
| Average opinion | — | 10 | 12 | 12 | 13 |
| Frequency | | — | 43 | 52 | 54 |
| Negative opinions | | | — | 49 | 55 |
| Positive opinions | | | | — | 65 |
| Subjectivity | | | | | — |
7.2.2. Evaluation Method
We ran our algorithm using the dataset described above and extracted the labeled events. Two raters annotated at randomly selected events whether they were correct events, and provided a rating on a scale from 1 to 5 (1 worst, 5 best) for the labels of correct events. In total we got 134 ratings for 72 distinct events (64 with ratings by both annotators). Both raters are computer science researchers with a background in event detection and opinion mining and were provided with a short annotation guideline.
7.2.3. Results
7.2.3.1. Opinion Event Detection
The results for the event detection show that it is hard even for human annotators to detect when an opinion event happens, as we only got a moderate inter-annotator agreement (calculated as Spearman’s correlation ρ) of . For 44 of the 72 events, both evaluators agreed that the event was correct, resulting in a precision of . If we count an event as correct if at least one of the annotators marks it as correct, which is reasonable given the low inter-annotator agreement, the precision increases to . In future, we could consider investigating the effect of adding more annotators in order to get a better consensus.
In this work, we did not specifically check the recall of the event detection algorithm, as we had no ground truth to compare with. Creating such a baseline would require defining an explicit threshold of when an opinion change becomes significant. This decision is however inherently context-dependent: the strength of opinions and consequently also of opinion changes depends on the opinion target, the culture in which the event happens or on other events happening at the same time. It is therefore hard to find a universal minimal threshold, even though it is easy to verify major opinion events such as Whitney Houston’s death (described above). As the primary application of opinion event detection is in the exploration of a document collection, we concentrated in our work on correctly identifying the most prominent events. End user applications should allow an adaptation of the event detection sensitivity to allow the user to find opinion events relevant for their specific interests and contexts.
7.2.3.2. Opinion Event Description
Finding good event descriptions is necessary to make the extracted events useful as an exploration tool for a web collection. In this work, we used a tag cloud of relevant keywords, which provides a simple and well understood method to provide a brief overview of the content.
In our experiment, two annotators gave a rating of 1–5 (1 worst, 5 best) to each event determined as relevant earlier. The inter-annotator agreement, calculated as Spearman’s rank correlation ρ, was moderate with . This again shows that this problem has a high amount of subjectivity and is therefore hard to solve algorithmically.
The average rating for the labels was . An analysis of the labels revealed that many contained non-content keywords from web page boilerplate text. When several documents containing such keywords are included in an event, these non-descriptive terms appear to be more relevant than other keywords.
Table 5 shows some examples of extracted event descriptions.
Figure 6 presents a screenshot of the application used during the evaluation, which shows the event metadata, the frequency and averageOpinion time series used to detect bursts and the source documents.
Table 5.
Sample events extracted using burst detection on opinion values.
Table 5.
Sample events extracted using burst detection on opinion values.
| Topic | Time Span | # docs | Description | Type |
|---|
| american idol | 31 May 2005–26 July 2005 | 32 | underwood, singer, sing, winner, show, singl, new, carri, fan, latest | opinion+ |
| ariel sharon | 29 November 2005–6 December 2005 | 44 | isra, israel, likud, palestinian, minist, prime, jewish, arab, polit, parti | opinion+ |
| brokeback mountain | 2 December 2005–17 February 2006 | 4085 | movi, gai, film, cowboi, heath, ledger, oscar, gyllenha, award, stori | negative+ |
| bruce bartlett | 3 February 2006–17 February 2006 | 23 | impostor, bush, reagan, republican, bankrupt, betrai, legaci, georg, critic, conserv | subjectivity+ |
| muhammad cartoon | 3 December 2005–25 February 2006 | 772 | muslim, danish, ciliegi, scandal, controversi, islam, arab, newspap, cameroonian, hama | opinion+, frequency+ |
8. Conclusions
In this paper, we have described an approach for the analysis of opinions in social media, studying both the detection and characterisation of sentiment in text, and its interestingness and relevance. We have described opinion event detection as a novel way to summarize a collection of social media documents along a timeline. This opinion event timeline helps users such as researchers, journalists or analysts to quickly understand and explore that collection. We use an opinion mining algorithm to extract the opinions from individual documents about an entity, which form the basis of several time series such as the average opinion or subjectivity. From these time series we extract opinion events using a burst detection algorithm, and label them using representative keywords.
It is clear that both the detection of opinions and opinion events in general, and the wider analysis of social media, are difficult tasks, and there are still a number of unresolved issues. The modular nature of our approach, however, lends itself to new advances in a range of subtasks: from the difficulties of analysing the noisy forms of language inherent in tweets, to the problems of dealing with sarcasm in social media, to the ambiguities inherent in such forms of web content that inhibit textual analysis tools. To our knowledge this is the first system that attempts to combine such kinds of textual analysis tools in an integrated system, and our results are very promising, despite the problems that we encountered: manual evaluation of such data is very tricky and there are no suitable large datasets for this kind of task. There is still, however, plenty of future work needed to improve the tools further: as discussed earlier, deeper linguistic analysis of the data would lead to better opinion polarity and target detection, which would also improve the opinion event detection process. There is clearly room for improvement here, although opinion mining is a very hard task due to the nature of language, and we cannot ever expect to achieve perfect results. Subjectivity of both opinion and event detection is also problematic: further tests of the whole ARCOMEM system with real users would help to highlight the benefits and pitfalls of our approach and its usefulness in the real world.


