7R Data Value Framework for Open Data in Practice: Fusepool

1
Swissdat, Landoltstrasse 62, 3007 Bern, Switzerland
2
Bern University of Applied Sciences, E-Government Unit, Postfach 305, 3014 Bern, Switzerland
*
Author to whom correspondence should be addressed.
Future Internet 2014, 6(3), 556-583; https://doi.org/10.3390/fi6030556
Submission received: 18 March 2014
/
Revised: 7 August 2014
/
Accepted: 14 August 2014
/
Published: 8 September 2014
(This article belongs to the Special Issue Open Government Meets Social Data)
Abstract
:Based on existing literature, this article makes a case for open (government) data as supporting political efficiency, socio-economic innovation and administrative efficiency, but also finds a lack of measurable impact. It attributes the lack of impact to shortcomings regarding data access (must be efficient) and data usefulness (must be effective). To address these shortcomings, seven key activities that add value to data are identified and are combined into the 7R Data Value Framework, which is an applied methodology for linked data to systematically address both technical and social shortcomings. The 7R Data Value Framework is then applied to the international Fusepool project that develops a set of integrated software components to ease the publishing of open data based on linked data and associated best practices. Real-life applications for the Dutch Parliament and the Libraries of Free University of Berlin are presented, followed by a concluding discussion.
1. Introduction
Open data has reached an inflection point where stakeholders are looking for measurable impacts and are asking the right question: how to move open data forward to create a positive impact. This research addresses the question of how to make data actionable. “Actionable” here refers to information that allows a decision to be made or an action to be taken. Many decisions are made without taking into account available data. Sometimes, evidence is intentionally ignored. Evidence-based decision-making, according to the Australian Bureau of Statistics, “requires a systematic and rational approach to researching and analyzing available evidence to inform the policy making process” [1]. Making data actionable means making citizens and businesses more effective in their decisions and actions based on data that informs their choices.
This article first makes a case for open (government) data as supporting political efficiency, socio-economic innovation and administrative efficiency. It describes the current shortcomings for open data to yield measurable impacts: data access (must be efficient) and data usefulness (must be effective). It then identifies technical problems with existing approaches to make data open and connected seamlessly across applications, enterprises and community boundaries.
The second chapter introduces the 7R Data Value Framework as an applied methodology to systematically address the current shortcomings, both technical and social. The third chapter then presents the application of the 7R Data Value Framework in the Fusepool project. Fusepool is an international research project co-funded by the European Research and Innovation Framework to develop a set of integrated software components to ease the publishing of open data based on linked data and a set of associated best practices [2]. The final chapter shows first how Fusepool components support data processing and publishing at public agencies and then finishes with a conclusion and outline future work.
1.1. Open Government
Open government can be understood as an anti-thesis to the secrecy often constructed around government work. One such example, to illustrate the case, goes as follows (as quoted from [3]):
The Citizen asked the National Research Council a simple question: What’s this joint study that you and NASA are doing on falling snow? The federal department never agreed to an interview. It sent an email instead, with technical details on equipment but without much information on the nature of the project. It never even explained the study’s topic. Before sending even that modest response, however, it took a small army of staffers—11 of them by our count—to decide how to answer, and dozens of emails back and forth to circulate the Citizen’s request, discuss its motivation, develop their response, and “massage” its text.
In the cited example, this federal department constructed a sense of secrecy because NASA experts had already answered the questions. Sometimes, the construction of secrecy serves the intentional purpose of perceived efficiency by keeping inquiries away. At other times, it may happen unintentionally due to a lack of or ambiguous rules about what to communicate about an issue. In both cases, the default is to communicate as less as possible. While there are cases that indisputably require secrecy, such as citizens’ private data or undercover police deployments, open government requires openness to be the new default and secrecy the exception in all cases where it is warranted.
The general reasoning behind open government can be traced back at least to the era of the Enlightenment and the French revolution, where the accountability of the state became a constitutional right manifest in the Declaration of the Rights of Man and of the Citizen. Particularly with the advance of the Internet, there came a renewed interest in the Freedom of Information Act of 1966 of the United States, as exemplified by the Open Government Act of 2007, while in Europe, major milestones are the U.K.’s Freedom of Information Act of 2000, Germany’s freedom of information law of 2005 and the European Union Directive 2003/98/EC on the re-use of public sector information of 2003.
1.1.1. Political Efficiency
Political efficiency, in contrast to technological and economic efficiency, “enable[s] the political machinery to keep working”; focusing only on technological and economic efficiency endangers the efficiency of the political system [4]. The “political machinery” itself has been opened to involve many more players in the policy process [5]. Multi-nodal politics refers to the political process in which new opportunities for political action arise, interest groups and social/political movements and coalitions intervene and new policy spaces on local and supranational levels create a multi-layered, multi-stakeholder policy-making process [6]. However, despite these fundamental changes in policy-making, and despite technological advancements, the way essential information required for an efficient policy-making process is distributed among stakeholders has not changed much.
Efficiency in politics, as well as in economics, is the result of informed and rational participants interacting and competing with each other and reaching agreement on a deal [7]. If there is no agreement, then there is no deal, which is inefficient. As in economics, rational decision-making requires that all participants have access to the same information. Wittman [7] further argues that even if there is a deal, an efficient solution is widely debated and accepted and, therefore, less likely to be overthrown in later stages. Indeed, efficient solutions are those that are supported by influential stakeholders and are characterized by self-selection of influential participants (based on their perceived needs), by opposing views aligned through mutual adjustment and incremental decision-making [8]. The focus in this line of thinking is on the efficiency of the policy-making process, that is, how sustainable and equitable the outcomes are. If they are more sustainable and equitable for more stakeholders, then they are more efficient.
1.1.2. Open Government Data
Many governments and public bodies around the world have started to make their non-classified and non-personal data available to the public. Examples include urban planning data, locations of public swimming pools, construction sites, bike lanes, air-quality monitoring, tax expenditures per area, farm subsidy spending, parliament sessions, and much more. Third-party developers build services on top of that data. For example, Mapnificent is a service that finds places to live based on the duration of the commute to work and housing prices. Fusepool developer, Weyeser, created a data transparency mash-up for the Dutch Parliament that scans thousands of parliamentary discussions, extracts and visualizes the topics and lets citizens investigate topics and read documents to follow the debates.
There are at least two motivations for doing so: socio-political and socio-economic ones. Both interact closely together to improve the efficiency of the political system. Transparency and citizens’ rights are of a socio-political nature, while social and economic innovation has clear economic implications. Both are essential for the well-being of political systems and economic markets [9].
Socio-political motivations can be attributed to the open government movement aiming at ensuring participation, transparency and citizens’ rights to access government documents [10]. This is sometimes extended by arguing that the tax money spent on the data collected by the government gives taxpayers the right to own that data. This move is partly due to the advance of information technologies under the rubric of open government data (OGD) [11]. This line of thinking coalesces with the one on the efficiency of the policy-making process, i.e., political efficiency.
Socio-economic motivations for making government data available to the public focus on two arguments, where one emphasizes innovation and the other administrative efficiency. The former stresses the potential for innovation that may result from opening government data and letting citizens and entrepreneurs reuse this data to develop innovative services, such as Mapnificent or Weyeser’s data transparency mash-up. The idea is that the reuse of existing data (e.g., statistical data, geo-data, traffic data) creates new value [12]. The reasoning behind administrative efficiency holds that data sharing and collaboration between public agencies make the production and distribution of public services more efficient, enhance their quality and expose administrative inefficiencies and fraud [13].
1.1.3. Current Shortcomings
The major problem with open government data, and with open data in general, is that the data is not fully open for reuse and that potentially valuable data remains restricted. The result of the open data Barometer Global Report 2013 demonstrates that exactly the data that is most valuable in terms of political efficiency, socio-economic innovation or administrative efficiency is rarely available [11]:
- only 7% of datasets surveyed are open in machine-readable forms and under open licenses;
- rarely available are politically or economically important datasets for holding governments and companies accountable or for improving entrepreneurship and policy;
- much statistical data is available only as highly aggregated, with unclear or restrictive licenses;
- even in countries with OGD policies, for almost half of the questions asking for impacts, no examples were given, and the overall impact score was 1.7 out of 10.
These results may not be surprising given what data is made available and how it is made available. For example, highly aggregated statistical data about monthly deaths and births available in spreadsheets are not the type of data and format that is likely to trigger political efficiency, socio-economic innovation or administrative efficiency. To yield measurable impact, it is not sufficient to just make data “available”; it must become “actionable”. For all of the reasons stated before, government agencies should publish the data proactively with a mission to attract uptake. That requires data stewardship and a data strategy. The current shortcomings identified in the open data Barometer Global Report 2013 are two-fold:
We conclude that making data access more efficient and data usefulness more effective for solving real problems is critical for open data to yield measurable impact. In order to become “actionable” and yield a tangible impact, government data must become reliable and useful data resources that can be accessed via multiple devices and tools, including mobile applications. New intermediaries between data publisher and data consumer are integrated within conventional structures in modern democracies in addition to classical mass media and political parties [16]. Technology can make data access more efficient, and it can support human stewardship and curation in making data usefulness more effective by identifying valuable data.
1.2. Linked Data
Governments hold rich data in many areas that are of direct interest for citizens or companies and other data consumers, including other government agencies. Examples include city planning, traffic, administrative data, environment, education, leisure information, infrastructure and many more. Publishing this data for reuse by others can quickly become both inefficient, due to the administrative overhead, and ineffective, if it fails to address the needs of data consumers. One major reason why access is inefficient concerns data delivery: data comes in unsuitable data structures or in legacy data formats and trapped in closed files or in fragmented databases. Linked data lends itself to large-scale integration and sharing of distributed data sources [13]. In 2006, Tim Berners Lee [17] stipulated that interlinking all this data makes it more useful by having data:
- (1)
- available on the Internet;
- (2)
- machine-readable (i.e., interpreted by software);
- (3)
- in non-proprietary data formats;
- (4)
- in the RDF (Resource Description Framework) data format; and
- (5)
- interlinked to other data by pointing at it (via hyperlinks).
1.2.1. Data Structures and Models
Data structures and models provide the definition and format of the data. Matthew West, whose life-long work at Shell Corporation focused on global data standards, emphasizes the importance: “If this is done consistently across systems then compatibility of data can be achieved. If the same data structures are used to store and access data, then different applications can share data” ((p. 7), [18]). However, different systems from different vendors implement different data structures and models. Stressing this point, West continues: “Data models for different systems are arbitrarily different. The result of this is that complex interfaces are required between systems that share data. These interfaces can account for between 25% and 70% of the cost of current systems. Data cannot be shared electronically with customers and suppliers, because the structure and meaning of data has not been standardized” (emphasis added). Standardization comes with advantages, such as reuse and compatibility, and disadvantages, such as additional costs and constraints.
Data structures and models are often created inconsistently without planning for broader reuse and therefore are unsuitable for any other case than the initially envisioned use case. However, precious and relevant data have become too important and scarce to neglect how they are structured and, thereby, made more usable to others. Data structures and models (just like hierarchical file systems) define structure, and the better they are described and aligned to the task(s) at hand, the more actionable they become. In addition, one user’s data needs may very well be similar to another user’s needs. Rather than reinventing dozens of ill-specified data structures and models for similar use cases, community-driven standards are able to pool the expertise and resources to develop richer data structures and models that are not only well-designed, but also widely shared and adopted. RDF (Resource Description Framework) is a widely adopted data format for linked data and excels when reusability and sharing of data is the main concern: every datum becomes part of a large graph of knowledge distributed across the Internet. An application can retrieve and integrate these statements through the query language, SPARQL (Semantic Protocol and RDF Query Language).
1.2.2. Web of Linked Data
Linked data is a technique for using hyperlinks to link data items [19]. Instead of pointing a user to a web page, the hyperlink points to a specific value of that data item, such as its location, distance or height. Obviously, a data item has many such hyperlinks that link to respective values. For example, the value “300 meters” can relate both to distance or height. Hence, each hyperlink also specifies the type of relation it creates. One way to think of this is using hyperlinks to create specific statements about something. For example, the statement “The Eiffel Tower is located in Paris” links two data items, Eiffel Tower and Paris. The link also describes the type of relation between them, “is located in”.
Data models make statements about an entity (subject) in the form of subject-predicate-object expressions, similar to entity-attribute-value expressions in relational databases. As in natural language sentences, the predicate defines what the subject does or what it is like and is accompanied by the object to complete its meaning. For example, a geographic aspect of the Eiffel Tower can be described in a triple as “Eiffel Tower (subject) is located in (predicate) Paris (object)”. However, it is more efficient to describe it as “Eiffel Tower (subject) has coordinates (predicate) 48.8584°N, 2.2946°E (object)”, because coordinates can be collected by sensors without a person having to write “Paris” to define the object. Similarly, the geographic area covered by the city of Paris is specified in a registry, so it can be described as “Paris (subject) covers (predicate) some-polygons (object)”. A simple machine (i.e., software) operation can then conclude that the Eiffel Tower is in Paris and show this to a user. There is no need to specify that fact, as shown in the first triple.
Of course, “Paris” needs to be uniquely identified as holding data about the city of Paris, instead of the singer, Paris Hilton, for example. Each entity, thing or person, therefore, must have one or more unique identifiers, which is nothing else than a web address. Under that web address are values and hyperlinks to values of that entity, for example, something like “coordinates = 48.8584°N, 2.2946°E” for the Eiffel Tower. If someone wanted the Eiffel Tower to be explicitly linked to Paris as shown in the first triple above, under the Eiffel Tower’s web address (“web page”), there would be a hyperlink to the web address that uniquely identifies the city of Paris, something like “locality = Paris (hyperlink)”. In this way, linked data enables data to be shared and reused across applications, enterprises and community boundaries [20]. In the words of Tim Berners-Lee, the “founder” of the hyperlinked world-wide-web, it creates “a web of data that can be processed directly and indirectly by machines” [21] (the term “machine” typically refers to software).
With linked data, data structures are defined in so-called ontologies or vocabularies that model the domain of the data (e.g., representing sets of classes and their properties or attributes), as well as the semantics of data (e.g., expressing constraints, such as inheritance relationships). For example, there are ontologies for describing people, such as names and addresses, and how to relate people to other things, for example to organizations or projects. This information on the structure of the data, so-called metadata (data about data and relationships to other data), is called a schema. With linked data, (database) schemas are no longer confined to a closed and proprietary database system, but open and shared among others. Shared schemas enable large amounts of data currently being trapped in existing databases and applications to be published and reused by others in the enterprise or publicly, including other software (hence machine-readable).
2. 7R Data Value Framework
The previous section described the current shortcomings for open data to yield a measurable impact:
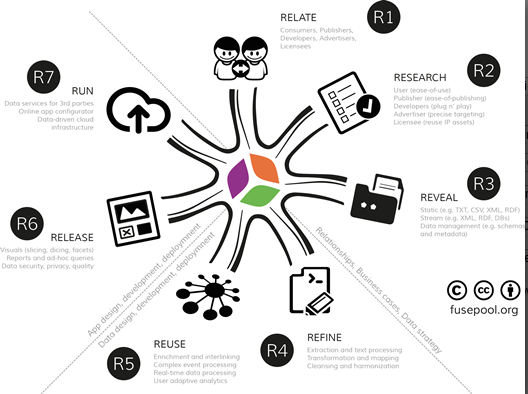
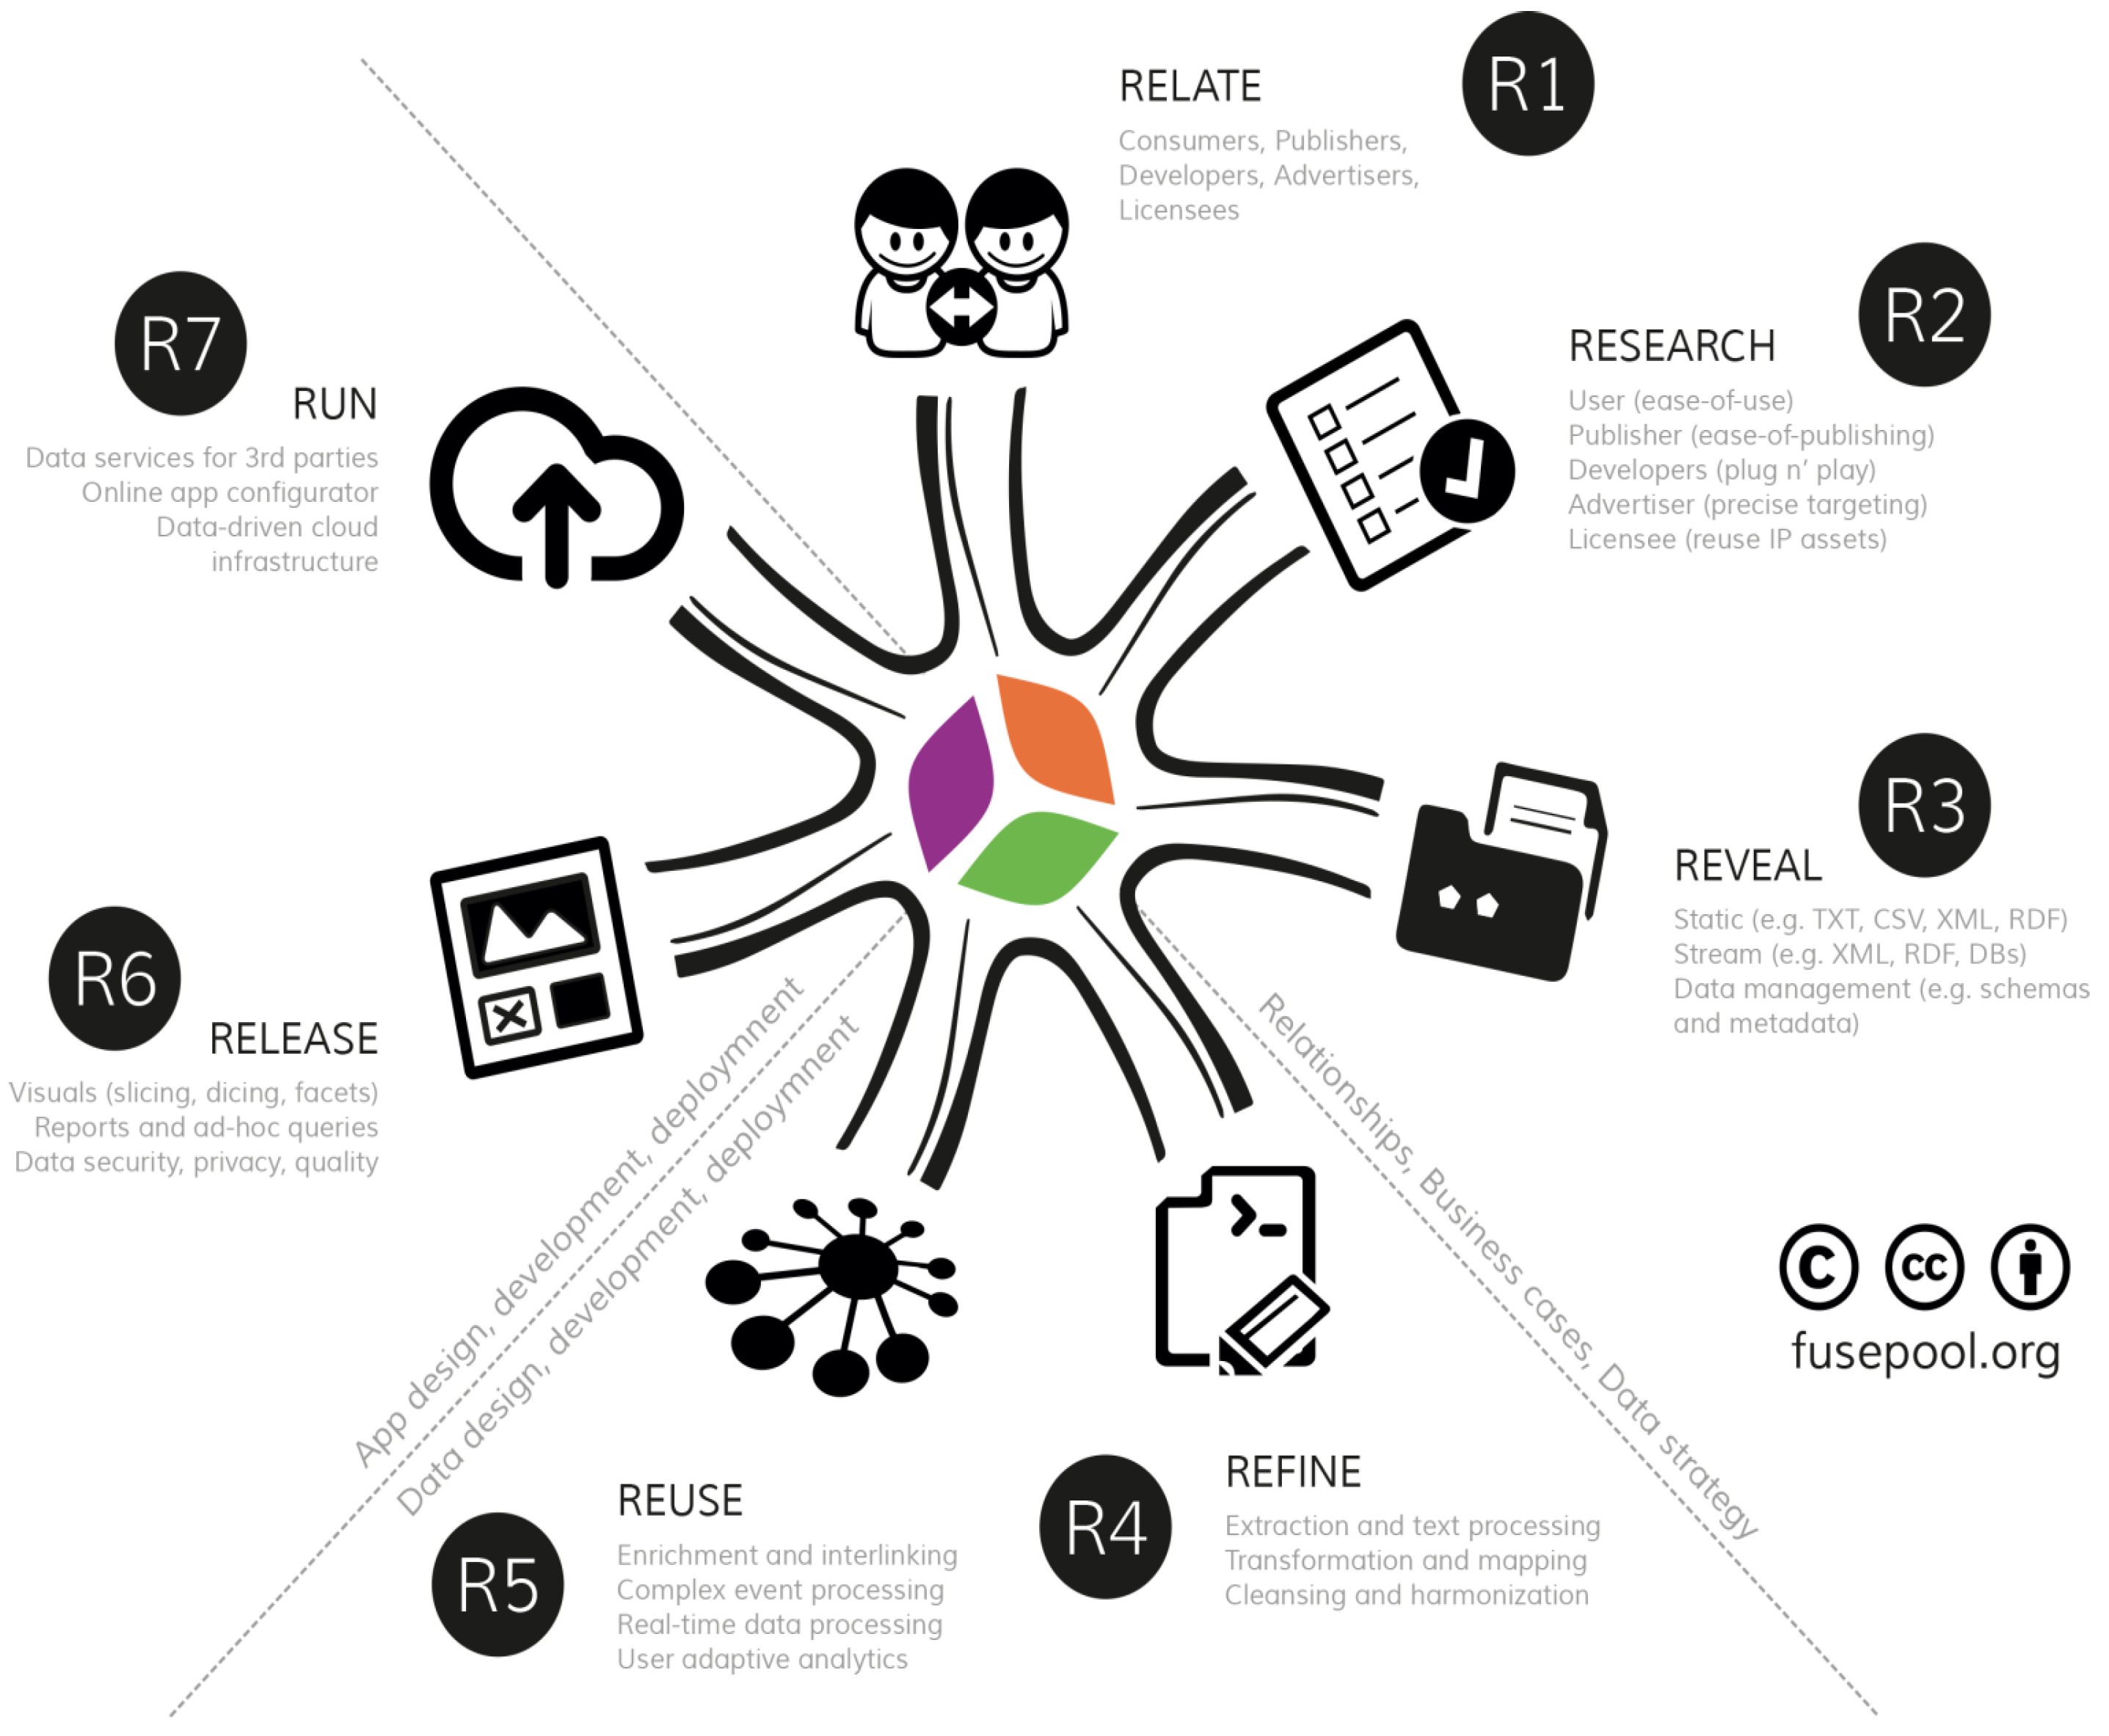
It identified problems with existing approaches to make data open and connect seamlessly across applications, enterprises and community boundaries and suggested linked data as a solution to make data access more efficient and data usefulness more effective. This section provides an overview of the 7R Data Value Framework (see Figure 1): R1 (relate), R2 (research), R3 (reveal), R4 (refine), R5 (reuse), R6 (release) and R7 (run)—a framework for collaboration along the data value chain that has evolved over many years and that is well documented [22].
The first three key activities involve the business activities of developing stakeholder engagement (R1, relate), the requirements (R2, research) and the data strategy (R3, reveal data). The next two key activities involve the data design, development and deployment activities of data staging (R4, refine data) and data analytics (R5, reuse data). The final two key activities involve the application design, development and deployment activities of data presentation (R6, release data) and data delivery (R7, run data-driven apps).
Figure 1.
7R Data Value Framework.

2.1. Stakeholder Relationships, Business Cases and Data Strategy
Stakeholder relationships, business cases and data strategy aim at getting buy-in from stakeholder communities for the open data project and co-create requirements and the data strategy. Instead of making arbitrary spreadsheets with highly aggregated statistical data available, value-adding data publishers engage with their stakeholders to maximize the positive impacts that open data has on political efficiency, socio-economic innovation and administrative efficiency.
2.1.1. R1 (Relate): Stakeholder Relationships
The R1 key activity defines and engages stakeholders across all other key activities of the data value chain. Several channels and materials are used for broader engagement, especially the open calls to harvest ideas (e.g., hackathons), social media, online publications, conferences and workshops. Open calls originated in the performing arts for applicants to demonstrate their skills. At a hackathon, participants “hack” (quick fix) a solution to a challenge. Dissemination in social media and key online publications, such as TechCrunch, the Huffington Post, Venture Beat, BuzzFeed, etc., are utilized to publish invitations and results. Combined across projects, tasks under the R1 activity aim at building a community with a purpose around the open data strategy targeting five stakeholders in particular:
- Data publishers: have an interest to make their data interlink across datasets;
- Data developers: create data models and business cases based on Fusepool data;
- Software developers: create new data enhancers for the Fusepool open-source platform;
- Expert users: professional users who annotate and curate data to improve data quality;
- Consumers: use Fusepool in their business and workflows (may also be part of “the crowd”).
2.1.2. R2: Researching Business Cases and Requirements
Due to its important linking task among stakeholders in the open data project, the R2 activity takes on a coordination role across other key activities involving all required stakeholders and balancing their requirements. Direct one-to-one talks, workshops and discussions, as well as online questionnaires are the primary means to gather requirements from stakeholders. The results of the engagement with stakeholders are used to prioritize and reassess the different types of information sources and potential uses and their role in specific application scenarios in order to develop and refine concrete use cases. During presentations or demos of possible applications, stakeholders interactively participate by asking clarification questions and providing their views and assessment (ad hoc).
2.1.3. R3: Revealing Data
The R3 key activity is about understanding the data and data sources, which become the source material for all subsequent key activities, as well as integrated metadata, information life-cycle management and the efficiency and effectiveness of outcomes from subsequent key activities. Revealing data involves the identification and gathering of potentially relevant data sources to be published as linked data (open or enterprise). It includes performance evaluation and optimization to identify data that points to related data currently not on the agenda for being reused.
Data sources can be unstructured or semi-structured, e.g., raw text, as well as structured, e.g., spreadsheets. The goal is to select the relevant data sources with high impact value if reused and interlinked with other sources. Hence, the first outcome here is the best practices for selecting potentially relevant data sources. Learning from others is greatly facilitated by the reuse of shared ontologies and vocabularies to model the data. Hence, a second outcome is best practices to model the data along commonly shared and interoperable conventions (e.g., DCAT Data Catalog Vocabulary). In addition, stakeholders should understand the benefits of linked data and the seven best practices for producing linked data [7].
2.2. Data Design, Development and Deployment
A very common scenario in public administrations and private organizations cross-publishing data involves gathering data from several highly heterogeneous sources. These sources contain messy, unclean and redundant data that is often expressed according to non-uniform schemas. Because this is the area that benefits heavily from linked data, we recall Matthew West’s data integration experience at Shell Corporation: “Data cannot be shared electronically with customers and suppliers, because the structure and meaning of data has not been standardised” (p. 7 [18]). The process of cleaning up the data and re-mapping it to a common schema is not trivial and requires a deep understanding of the practitioner’s domain. However, it has to be done for data to yield positive impacts beyond the initially sketched use case.
2.2.1. R4 (Refine): Data Rationalization, Staging and Semantics
The R4 key activity is about data integration, data quality, semantic enrichment, data governance and data privacy, including data transformation and business rules to standardize, cleanse, enrich, validate and profile data as it moves through data staging into target repositories. It also involves implementing best practices for data curation and data publishing to connect existing processes with processes that create sustainable open data publishing operations. This refers to elements of Forrester’s BI Reference Architecture, such as extract, transform, load (ETL), master data management (MDM), data quality and data governance [22]. We also include here elements from that reference architecture, such as text analytics and natural language processing (NLP) for extracting additional meaning. It also includes the direct mapping and parsing of structured data sources. The results obtained through these steps are expressed as linked data.
The transformation from unstructured or semi-structured content to semantic knowledge involves the selection of an ontology that provides concepts and properties that cover the domain of interest, the definition of patterns to create dereferenceable (unique) identifiers for entities and the selection of a mapping language to map elements from other sources to terms in the ontology. Many ontologies are published for reuse and are well accepted within the linked data community. If no suitable ontology is available, an initial ontology can be created based on existing standards, such as SDMX (Statistical Data and Metadata Exchange). The result of the refining step is data cleansing, extraction and schema alignment between the raw data and the desired (light-weight) ontology [23].
2.2.2. R5 (Reuse): Advanced Enrichment and Predictive Analytics
The R5 key activity is about advanced semantic enrichment (e.g., schema alignment), as well as predictive analytics to identify meaningful patterns and correlations in the data to predict events, behavior or interests. It can also include process analytics based on real-time information about how the data is used by end users, as well as performance management to track the success of initiatives, goals, progress and key performance indicators. Advanced semantic enrichment includes easy-to-deploy and easy-to-use tools for the interlinking of datasets in the web of data and enabling reuse of ontologies and dereferenceable (unique) identifiers across applications and domains.
Advanced semantic enrichment is sometimes called schema alignment, ontology resolution or de-duplication. Because different publishers can use different identifiers (web addresses) for the same entity, a method is needed to find and express when two different identifiers refer to the same entity, so that the triples describing the two entities can be merged. This is a well-known problem in database management, where it is referred to as duplicate detection, record linkage or entity reconciliation.
The R4 and R5 key activities implement what Gartner analyst Beyer [24] calls the three most salient aspects, using semantics which:
- are defined externally to the application through data creation and use case processes in a data management layer;
- orchestrate internal and external integration and sharing of data assets; and
- leverage both steady-state data assets in repositories and services in a flexible, audited model.
2.3. Application Design, Development and Deployment
When publishing data, a data publisher always has the target audience in mind and how they are going to consume that data. This should be no different with open data. Obtaining measurable impacts with open data for political efficiency, socio-economic innovation and administrative efficiency requires a holistic view and strategy across the data value chain. One objective is to make data available via graphical user interfaces and visualization frameworks. Another objective is to establish (or reuse) a sustainable software infrastructure for providing data-as-a-service for software applications that consume that data.
2.3.1. R6 (Release): GUI, Data Visualizations, Apps
The R6 key activity is about graphical user interfaces, data visualizations, application development for reports and ad hoc queries, “slicing and dicing” the data (e.g., facets) and user dashboards for data exploration and discovery. It refers to elements of Forrester’s Business Intelligence Reference Architecture, such as event-driven alerting, portal integration and mobile apps, as well as collaboration. Publishing large data sets is of no value if these cannot be consumed via appropriate software applications or mash-ups to support decision-making [22].
The objective is to provide graphical user interfaces and visualization frameworks for consumers and app developers that reduce the complexity of interacting with the data. For example, easy access to data visualization libraries enables developers and data journalists to more quickly and intuitively display and understand the data. As multidimensional data, linked data lends itself to analytical processing, such as consolidation (e.g., aggregation within a dimension), drill-down (e.g., navigating through the details) and slicing and dicing (e.g., viewing an aspect from different dimensions). The graphical user interface and information visualization framework embraces the variety of different platforms including desktop and mobile devices.
2.3.2. R7 (Run): Running Scalable Data-Driven Apps
The R7 key activity is about data delivery to consumers based on scalable cloud infrastructures for data services to applications, data portals, collaboration tools and mobile app frameworks. A federated ecosystem based on a set of common standards guarantees the interoperability of essential functions within which variation can take place. In addition, a federated ecosystem is compatible with commercial and proprietary solutions, because the reality in which many public agencies and private organizations find themselves is dotted with open-source and proprietary solutions.
A linked data platform should support the emerging linked data platform specification [2]. Existing open-source projects at the Apache Software Foundation, the world’s commercially most active and successful open-source community, ensures quality and visibility to a large community of software developers and commercial users. There are server applications that bundle central linked data technologies to offer integrated services. They can be used, extended and deployed easily by organizations publishing linked data or build custom applications on top of it. The linked data platform provides a read-write linked data server and may offer linked data updates and integration management of metadata and content, making both accessible in a uniform way. Some linked data platforms also support advance querying, versioning and reasoning capabilities.
3. 7R Data Value Framework in Practice
This section provides an overview of the results achieved by applying the 7R Data Value Framework in practice. The amount of work invested into developing software components varies between open data projects. Fusepool leans towards software development to create and integrate components for a seamless data publishing workflow. The Fusepool work described here may sound overwhelming, because of its focus on creating a suite of reusable software components. Typically, open data projects do not dive that deep into programming and stakeholder engagement, but at least the latter needs attention. For the former, the components developed by Fusepool make publishing open data as linked data easier.
3.1. Stakeholder Relationships, Business Cases and Data Strategy
Stakeholder relationships, business cases and data strategy aim at getting buy-in from stakeholder communities for the open data project and co-create requirements and the data strategy. In Fusepool, the co-creation with stakeholders was an important element, because the project’s goal was to create a set of reusable components that can be used for many open data publishing scenarios. Stakeholders included end users from different domains, such as private companies, public private partnerships and government agencies, as well as developers and software consultancies.
3.1.1. R1 (Relate): Stakeholder Engagement
During the first year of the project, Fusepool launched the Open Call for Users followed by the Open Call for Developers in the second year, which took place at Data Hack Award 2014 in Berlin. The open calls follow a similar script:
- Internal and external discussion and finalization of the tasks to be performed by applicants;
- Launch and promotion of the Open Call with tasks, selection criteria and important dates;
- Application period of 30 to 60 days during which applications are submitted within deadline;
- Selection process based on internal and external discussion and transparent communication;
- Signing of contracts with successful candidates and kick-off followed by one or more events.
A communication and marketing campaign was launched for promotion of the Open Call for Users resulting in 35 applications received by applicants from 15 European countries. The business areas covered by those applicants were bio-medical, life sciences, IT/telecommunications, education, digital media, renewable energies and innovation services for SMEs. There was a well-balanced mix of profiles from small companies, research and intermediaries (incubators, accelerators, etc.).
The evaluation of the 35 applicants followed a two-stage evaluation process. First, internal and external experts were able to comment on each applicant, so that a first selection was made and the selected candidates were asked to clarify open issues. Then, experts reassessed the selected candidates and arrived at 15 candidates who received a contract for the co-creation sessions.
3.1.2. R2: Researching Requirements
The two-day user kick-off workshop presented the Fusepool platform and created important feedback for optimizing the Fusepool functionalities. Exemplary functionalities that were translated into system requirements included:
- Mapping and clustering functions (cluster visualization of documents);
- trending and classification functions (e.g., for patents/PubMed);
- predictive analytics to improve search results;
- annotation functions for users (required for predictive analytics);
- multi-language facilities for search, filtering, notifications;
- hiding functionalities for lay users, suggestions for advanced users;
- showing organizations, person names, and locations;
- overview of all data pooled in the platform;
- connecting people to documents, to optimize searching.
At the following workshop, users were asked to provide their own scenarios on how to take things further. To maximize creative thinking and presenting, no strict format was given. Users could present in any way they preferred, which resulted in new ideas that were later prioritized. Almost all user pitches emphasized the combination of funding and partner matching tools to be of high importance for them. A majority of users also mentioned that if such a tool existed, they would most likely merge the service directly into their own business workflow. The results were analyzed, prioritized and translated into system requirements by Fusepool members.
EXAMPLE: Patent Explorer Use Case
Rationale
In the joint publication titled Why researchers should care about patents, the European Commission (DG Research) and the European Patent Office emphasize that approximately 80% of scientific and technical information can be derived from patents. The publication lists a number of reasons:
- Avoid duplication of R&D efforts and spending: Patents are the broadest source of technical information. Many companies do not disclose their R&D results in any other form. Looking up patents therefore is an efficient way to avoid duplication of R&D work; up to 30% of all expenditure in R&D is wasted on redeveloping existing inventions;
- Gather business intelligence: Patent information not only reveals the state-of-the-art in certain technology areas, but also enables monitoring the innovation strategies of competitors and other players at a very early stage.
The bibliographic metadata of patents provides important information for identifying potential partners for cross-licensing and collaboration. Hence, the PatentExplorer and PartnerMatch use cases provide concrete examples with real business value for interlinking two traditionally separated datasets.
Use Case
In my role as researcher (manager/adviser), I want to assess the patent landscape of the research field in order to understand potential business risks (infringement) and opportunities (collaboration).
- (1)
- Felix enters a text string describing the research and starts the search;
- (2)
- Felix views retrieved entities ranked based on the relevance score of searched entities;
- (3)
- Felix limits retrieved entities to “patent” (displayed are only the patents);
- (4)
- Felix leaves the default display type of retrieved entities at “landscape”;
- (5)
- In the resulting map of patent clusters (described by the most frequently occurring terms in them), Felix hovers over a patent in a cluster and views description and metadata.
User Stories
- “a service for our customers to boost competitive intelligence … [by] monitor[ing] the status of their technology and possible competitors in the area in which they undertake their activity”;
- “patent analysis is not easy and there are not many tools that could help us, so Fusepool patent analysis … could be a great resource to be more effective in the search”;
- “provide [our] clients with patent tips for close-to-market opportunities (in preparing Technology Offers/Request for the Enterprise Europe Network Marketplace)”;
- “The most important feature is definitely around the collection, gathering and processing of various sources of information in the intellectual property sector, possibly also interlinked with other areas of product development such as research funding and collaboration opportunities”;
- “PatentExplorer will help scope our clients’ ideas into a minimal prototype that is not infringing on already granted rights”
During the demos and presentations of Fusepool applications, the stakeholders interactively participated by asking clarification questions and providing their views and assessment (ad hoc). The discussions, as well as the questionnaire sent out after the workshop favored three application scenarios: FundingFinder, Partner/ExpertMatch and Patent/PublicationsExplorer.
- PatentExplorer (PublicationExplorer): Millions of patents are freely available in XML, with the majority in English, German and French related to the medical domain. All patents have the base properties with patent classification codes. Millions of medical journal articles for establishing prior articles are freely available in XML with the base properties;
- FundingFinder: Funding includes available public and private tenders or calls for proposals. Following the guidelines by the data publishers, some of the funding datasets are available to data subscribers only;
- PartnerMatch (ExpertMatch): Fusepool PartnerMatch helps find partners with similar or complementary capabilities for product research and development. Following the guidelines by the data publishers, some of the partner datasets are available to data subscribers only.
These Fusepool application scenarios have in common that they find information that is best suited to address a specific user need. Hence, all application scenarios share these three core functionalities:
- Searching and retrieving information: The search engine uses the search index of all information available to identify and rank the most relevant results based on a scoring algorithm. The resulting screen is split into two sections, a large one for displaying the search results and a smaller one for displaying parameters to refine the search results;
- Limiting retrieved entities or retrieving related information: The user limits the search results by clicking on one of the facets and/or extends the results to retrieve related information by clicking on one or more entities;
- Providing feedback or annotations to a result: The user “writes” back to the data pool by adding personal annotations and customizations that can be shared among multiple users. For example, predicted labels automatically describe patent clusters, but a user may choose to give it a more descriptive name and share that label with colleagues.
3.1.3. R3: Revealing Data
The datasets were chosen to support the application scenarios defined above aimed at a generic prototype as a showcase. At least three datasets were needed: patents, scientific articles and funding opportunities. For each of the three initial datasets, its data size, format and standard had to be taken into account. Patents and publication articles are very large datasets provided as XML files with different schemas. Funding opportunities are provided as spreadsheet without reusable schemas. The concepts behind the datasets had to be understood by analyzing the XML documents or spreadsheets and other documentation available from the data publisher. For patents, the European Patent Office and, for funding opportunities, EUresearch provided additional information by e-mail.
- Patents: A patent document has metadata attributes, such as the inventors, patent application status, publication date, country, claims and description. There are four major classification systems for patents. These taxonomies come with around 150,000 concepts. Patent documents can be downloaded from the European Patent Office or the United States Patent and Trademark Office in XML format. MAREC (Matrixware Research Collection) contains a corpus of over 19 million patents in XML format from the World Intellectual Property Organization (WIPO);
- Publications: PubMed is an archive of biomedical and life sciences articles published by different journals. The National Library of Medicine at the U.S. National Institute of Health maintains the archive. The articles are freely accessible from the PubMed website according to its release policy. A free license to use this dataset was requested and approved. The dataset is divided in folders, each containing articles from a journal. The XML document contains bibliographic information, such as title, abstract, authors and affiliation, license, citations, classifications and identifiers (DOI, digital object identifiers);
- Funding opportunities: The European Commission funds research and innovation programs through specific calls to which companies and research organizations apply. A call belongs to challenges that target one or more objectives. A company or organization must search in the portal among these objectives to which call it wants to participate. Each call has a title or number, description, publication date and deadline, area, funding scheme, budget allocated and topics. EUresearch, a Swiss organization that supports companies and institutions applying to research grants, has provided the dataset as a schema-free spreadsheet.
3.2. Data Design, Development and Deployment
Data design, development and deployment concern the process of cleaning up the data and re-mapping it to a common schema, which requires a deep understanding of the specific domain. What is often underestimated is the amount of time required to get the data into a usable format. In data analytics projects, the majority of the entire project time is easily spent on making data interoperable and reusable. Fusepool provides a suite of core components for enriching data with semantic meaning, as well as providing keyword search functions that together lends itself as a linked data content management system.
3.2.1. R4 (Refine): Data Rationalization, Staging and Semantics
The transformation from semi-structured content to semantic knowledge involves the selection of an ontology that provides concepts and properties that cover the domain of interest, a definition of patterns to create dereferenceable (unique) identifiers for entities and the selection of a mapping language to map elements from non-ontological resources to terms in the ontology.
The MAREC corpus contains nearly 20 million patents. Publications are retrieved from the PubMed Central website consisting of nearly 2.7 million articles. Funding calls and topics are acquired from EUresearch consisting of less than thousand documents for one year. For the patent domain, a specific ontology, called Patent Expert, is used that provides terms to which all of the elements and attributes in the XML document are mapped. Well-known ontologies, such as Dublin Core and Bibliographic Ontology, cover PubMed documents. A lightweight ontology is used for data about funding opportunities.
Because the format of the MAREC and PubMed documents is XML, the EXtensible Stylesheet Language language XSLT is used to define the mapping between these documents and their RDF/XML representation. Funding opportunities are provided as non-standard CSV files for experimental purposes. The approach taken transforms structural elements of the data into RDF and then uses the SPARQL CONSTRUCT rule language to map the intermediate RDF to terms in the ontology to arrive at the final RDF data. Besides the common vocabularies (such as RDF and the Web Ontology Language OWL), Dublin Core terms are used for resource publications, and the FOAF (Friend of a Friend) vocabulary is used to represent persons and organizations. PROV-O (provenance ontology) is used for provenance. SKOS (Simple Knowledge Organization System) and XKOS (extension to SKOS) are used to cover concepts, schemes and their relationships to one another.
Each entity (data item) mapped to RDF must also be assigned a web addresses as a unique identifier. In cases where the unique identifier can be constructed from the data source or follow a common pattern (e.g., patent IDs), they are used directly in the pattern in order to create predictable (resource-friendly) and human-friendly web addresses. In all other cases where the occurrences of things or concepts cannot be absolutely differentiated from one another (e.g., person names), universally unique identifiers (UUID) are generated.
Three transformer engines for mapping the source data to linked data are provided as Fusepool enhancer components covering two subtasks. One subtask, data mapping, concerns the development of the transformations for the documents that are chosen as source: patents from the MAREC corpus, PubMed articles and EUresearch funding opportunities. The second subtask, RDFizers, concerns including such transformations into Java OSGi bundles in order to quickly deploy those transformations within the Fusepool platform (OSGi provides a component model for Java and is sponsored by the Open Service Gateway initiative). The first two transformations are from XML to RDF/XML and are provided as XSLT style sheets. The funding opportunities are transformed into RDF using SPARQL rules.
EXAMPLE: Data processing and analytics components
- Data life cycle (DLC): DLC implements the processing chain for data imports for RDF mapping, interlinking and smushing into the RDF content graph;
- DLC patents: Java OSGi bundle with the DLC components needed to process patent data including the service to transform patents from MAREC XML format to RDF;
- Dictionary matching algorithm: Implementation of a dictionary-matching algorithm as Fusepool enhancer engine that outputs RDF triples from extracted entities from text documents;
- SILK linking: OSGi bundle that wraps the SILK Link Discovery Framework for the interlinked service into the Fusepool platform.
3.2.2. R5 (Reuse): Advanced Enrichment and Predictive Analytics
Reusing data describes the work done on enrichment of the data and the interlinking of different data sets. Interlinking of two entities that were computed as being the same establishes predicates such as “same as” (owl:sameAs), “see also” (rdfs:seeAlso) and “is format of” (dcterms:isFormatOf), between these two entities, more precisely, between their dereferenceable (unique) identifiers. Each entity (e.g., author) mentioned in the document and digested by the RDFizer is assigned a universally unique identifier (UUID). The same entity found in another document may be assigned a different UUID, because the RDFizer does not have enough contextual information to determine whether the two entities are indeed the same.
In order to connect different representations of the same entity, extracted from different documents and processes, reconciliation or interlinking is required. In linked data, interlinking has a more precise meaning as the process in which a resource of a triple in a dataset (e.g., subject) is linked through a predicate (e.g., owl:sameAs) to an entity in a different dataset (e.g., object). The purpose of interlinking is to connect two or more different representations of the same entity and merge the predicates about them to augment the knowledge about it (hence enrichment).
To uniquely identify each entity type, criteria must be defined based on the available information. After an element of an XML document is mapped to an ontological term, its value can be used in a meaningful way to disambiguate an entity. One such term is the type of the entity that states which class the entity is member of (e.g., patent). The type predicate is particularly useful when the classes of which the entities are members are disjoint, so that an entity cannot be member of more than one of those classes. Entities of type person, that are found in patents for instance, have other properties, such as name, country and which patents for which they are the inventors.
A description based on properties, like name, affiliation and publications, can be sufficient to disambiguate two persons within the publications dataset, and a description based on properties, like name, patents granted and organization, can be sufficient to disambiguate two persons within the patents dataset. A problem arises when disambiguating two entities coming from two different datasets, such as patents and publications. To interlink entities from very different datasets, only values of properties that have the same semantics can be compared. In this case, the properties to be compared are a subset of the properties in the preceding descriptions, in order to avoid false negatives. On the other hand, we have to state whether these common properties are enough to disambiguate those entities in order to avoid false positives.
In the case of patents and publications, we want to interlink different representations of the same entity in the two datasets, such as inventors and authors. In this case, the semantically-equivalent properties that can be used to disambiguate persons are type and name. Using only these two properties will lead to ambiguities, as the comparison will result in false positives in the case of homonymy, and a human intervention will be needed for disambiguation. Other properties can be used to help in disambiguating two representations of the same entity, even if they are not directly related to the entity. Inventors of a patent are related to an organization that is the applicant of the patent. Authors of a publication have an affiliation to an organization. The names of the organizations can be added to the descriptions of persons to improve the precision of the comparison.
The interlinking process is implemented in Fusepool as a component that compares an entity’s description extracted by an RDFizer with descriptions of entities stored in the Fusepool data store. Every time two UUIDs are found to represent the same entity with a confidence value above a certain threshold, a new triple is created with one entity’s UUIDs as subject, the predicate (e.g., owl:sameAs), and the other entity’s UUIDs as the object. For each such new triple, information is created to store that fact to the interlinking engine that stated it along with the confidence value and date.
The interlinking process can be done towards different knowledge bases. The described process is done towards the local knowledge in the Fusepool data store to find duplicates within it. To interlink these with “external” entities described via unique identifiers in other well-known repositories, such as those within the linked open data cloud, the same interlinking process is applied towards these repositories.
The Silk Link Discovery Framework is used to be included as a Fusepool component for the interlinking process. Silk provides a link-specification language to configure the interlinking process between two data sources. The main elements of the specification are the source and target data sources that can be files or SPARQL endpoints, different similarity metrics to compare the properties of resources and restrictions expressed in SPARQL to filter entities to be compared. Other parameters can be specified to improve performances.
It is useful to distinguish at this point between the interlinking process and the linking process. The linking process is used to link a string that represents a concept, the name of an entity for instance, to a unique identifier in a local repository or in a public one in the linked open data cloud. The linking process is supported by keyword indexing of the data store using Apache Solr, which provides the query language to make keyword searches. When a keyword is sent to the search server, it sends back a ranked list of unique identifiers that may represent that entity.
3.3. Application Design, Development and Deployment
Application design, development and deployment are aimed at making data available via graphical user interfaces and visualization frameworks. Another objective is to establish (or reuse) a sustainable software infrastructure for providing data-as-a-service for software applications that consume that data.
3.3.1. R6 (Release): GUI, Data Visualizations, Apps
The objective is to provide appropriate user interfaces for the data provided by the Fusepool platform. While many big data platforms only focus on velocity and volume, the Fusepool platform also supports variety, as shown by the different data sources. A dashboard is needed to enable the user to search, browse and augment the data. For different use cases, it is possible to have specific graphical interfaces, which are leveraging the same data in different ways. The Fusepool GUI implementation (codenamed Firstswim) is written in a modern JavaScript Application Framework and implements all visual and interaction functionality in the browser. The data intensive calculations are running on the Java-based platform, which is accessed by REST interfaces. These REST interfaces are delivering the necessary information for the GUI client as linked data graphs.
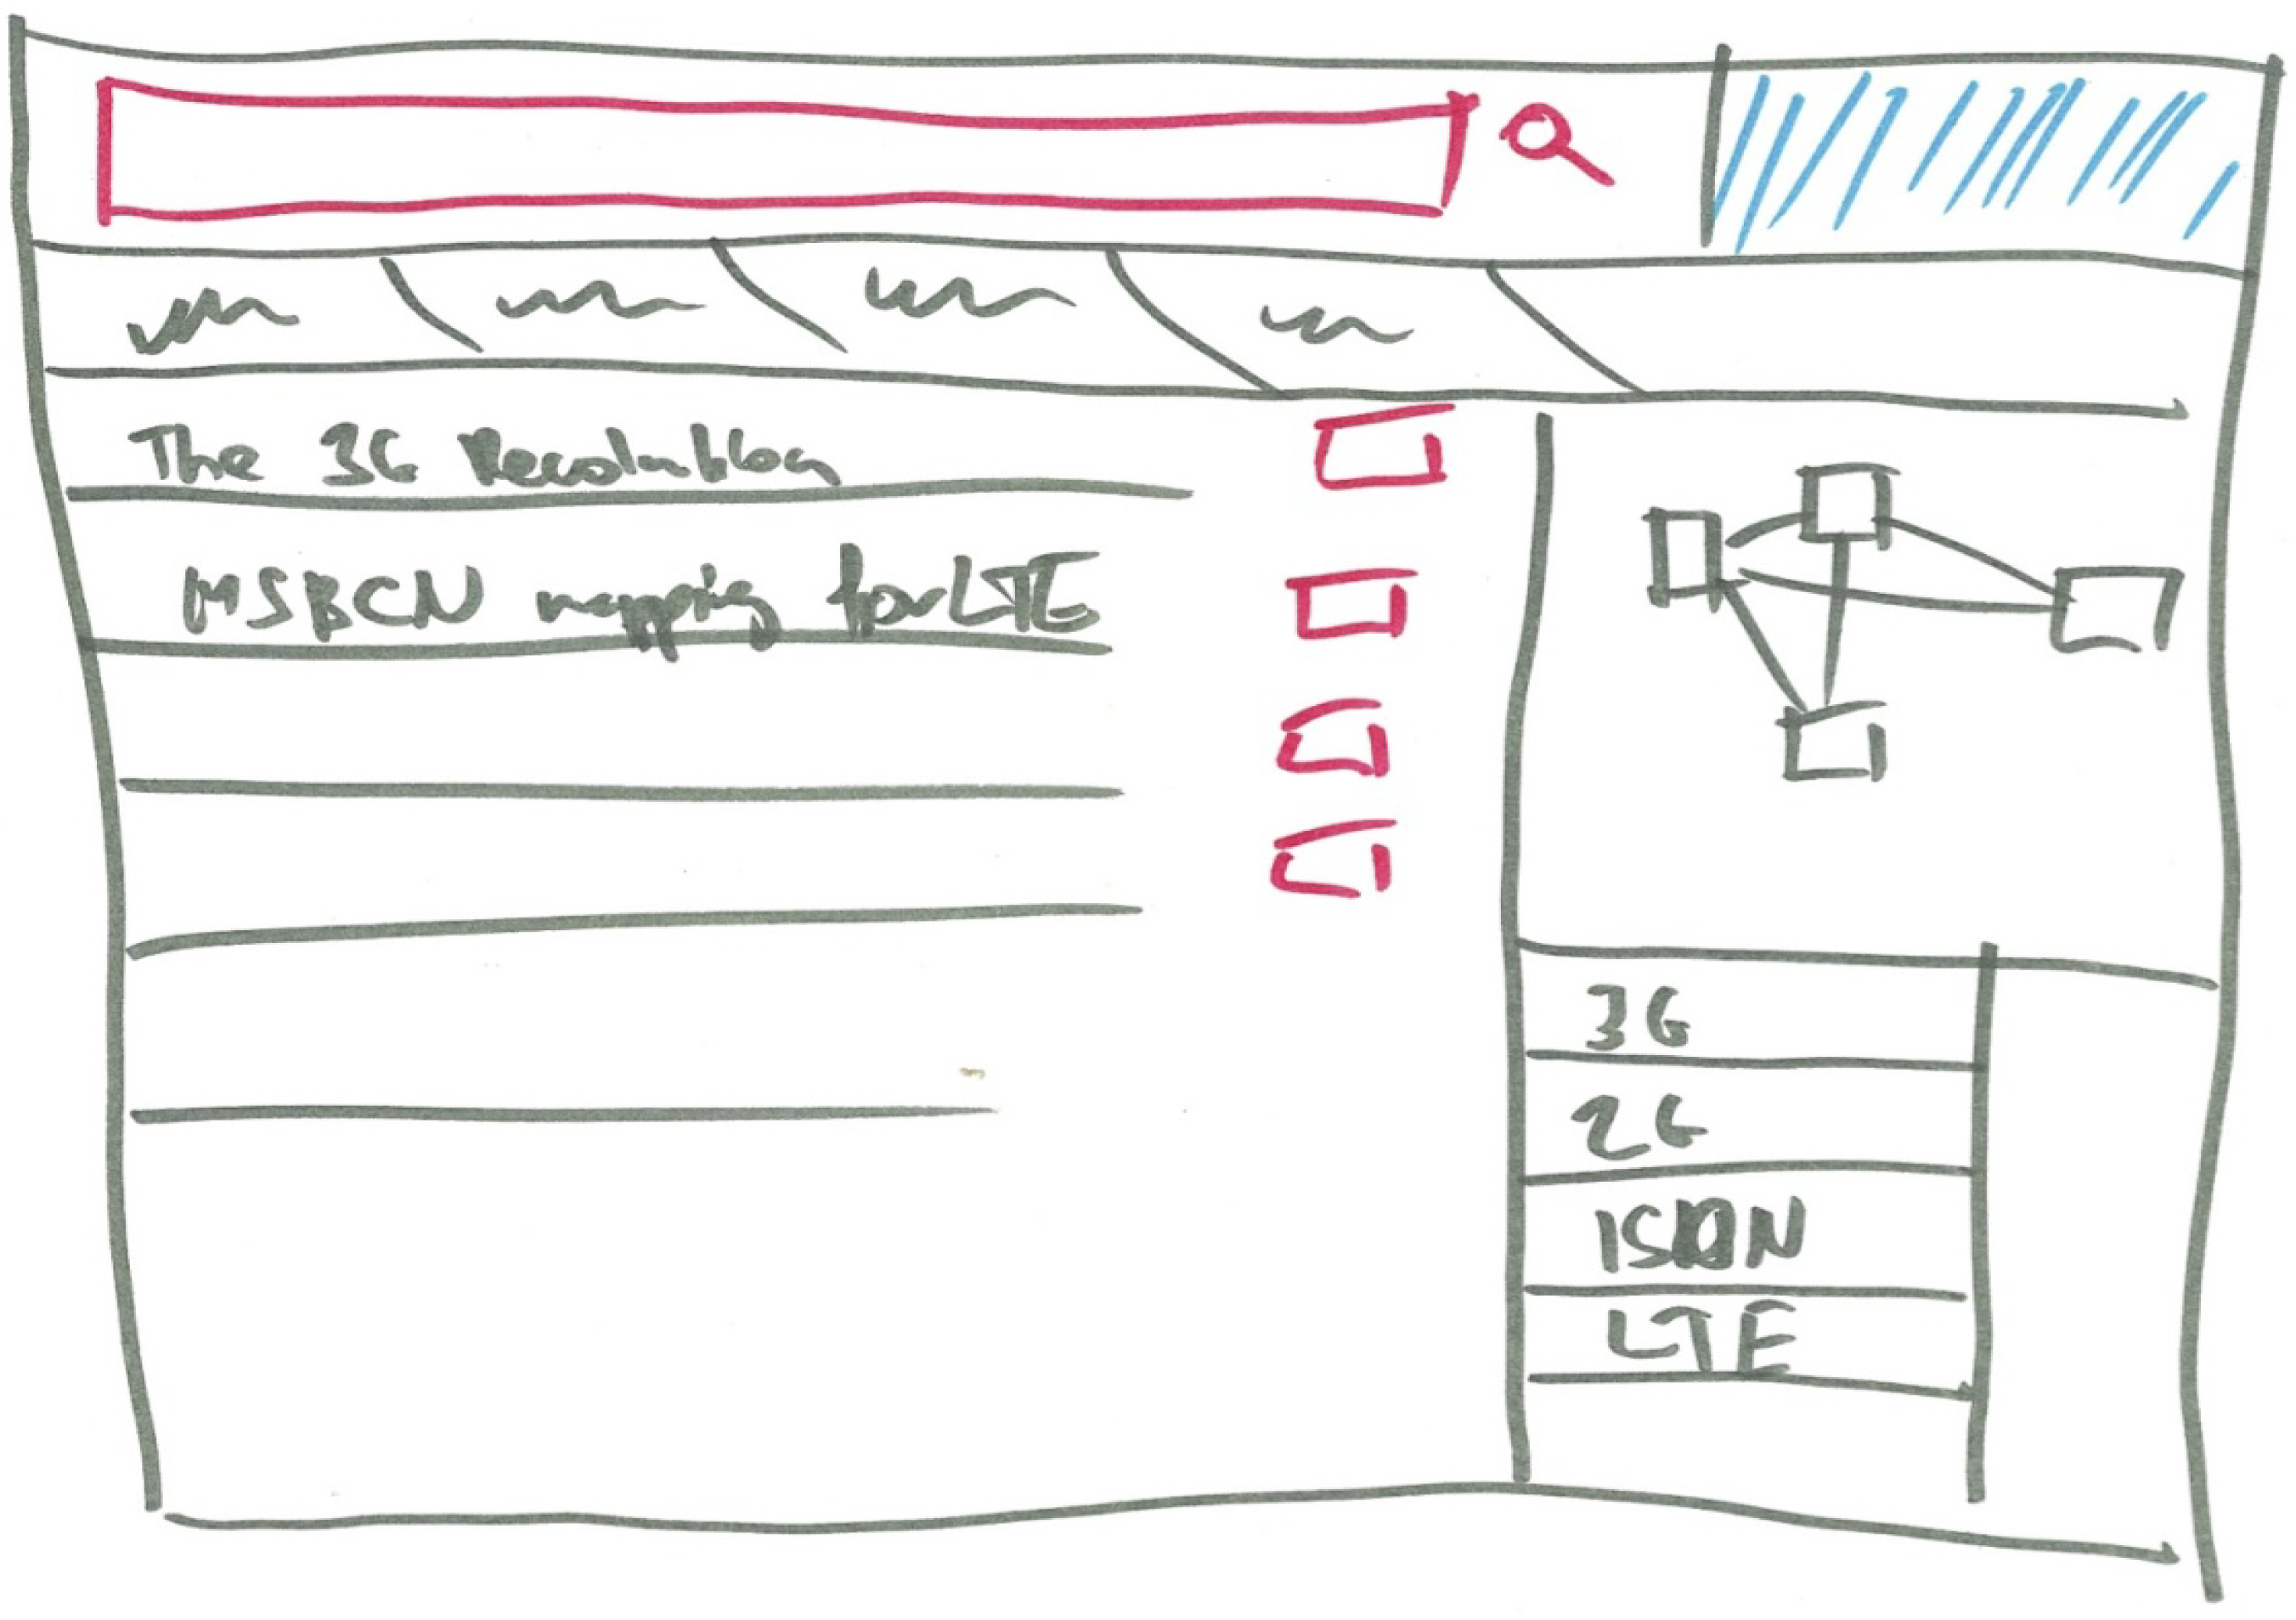
The interface is built on Enyo, which has different modes for smartphone, tablet or personal computer interfacing. The search data is fetched from a specialized server in JSON, which is responsible for the search query processing and querying of the RDF data. The detailed data of the entries is than fetched directly from a SPARQL endpoint to the client. During the user workshops, the need of a widget for visualizing a graph positioned by a given distance between the elements became evident. The widget was also needed to get the elements selected. The design and layout of the graphical user interface was co-created with the stakeholders at the Fusepool stakeholder workshops (see Figure 2 and Figure 3).
Figure 2.
Mockup of the graphical user interface dashboard.

Figure 3.
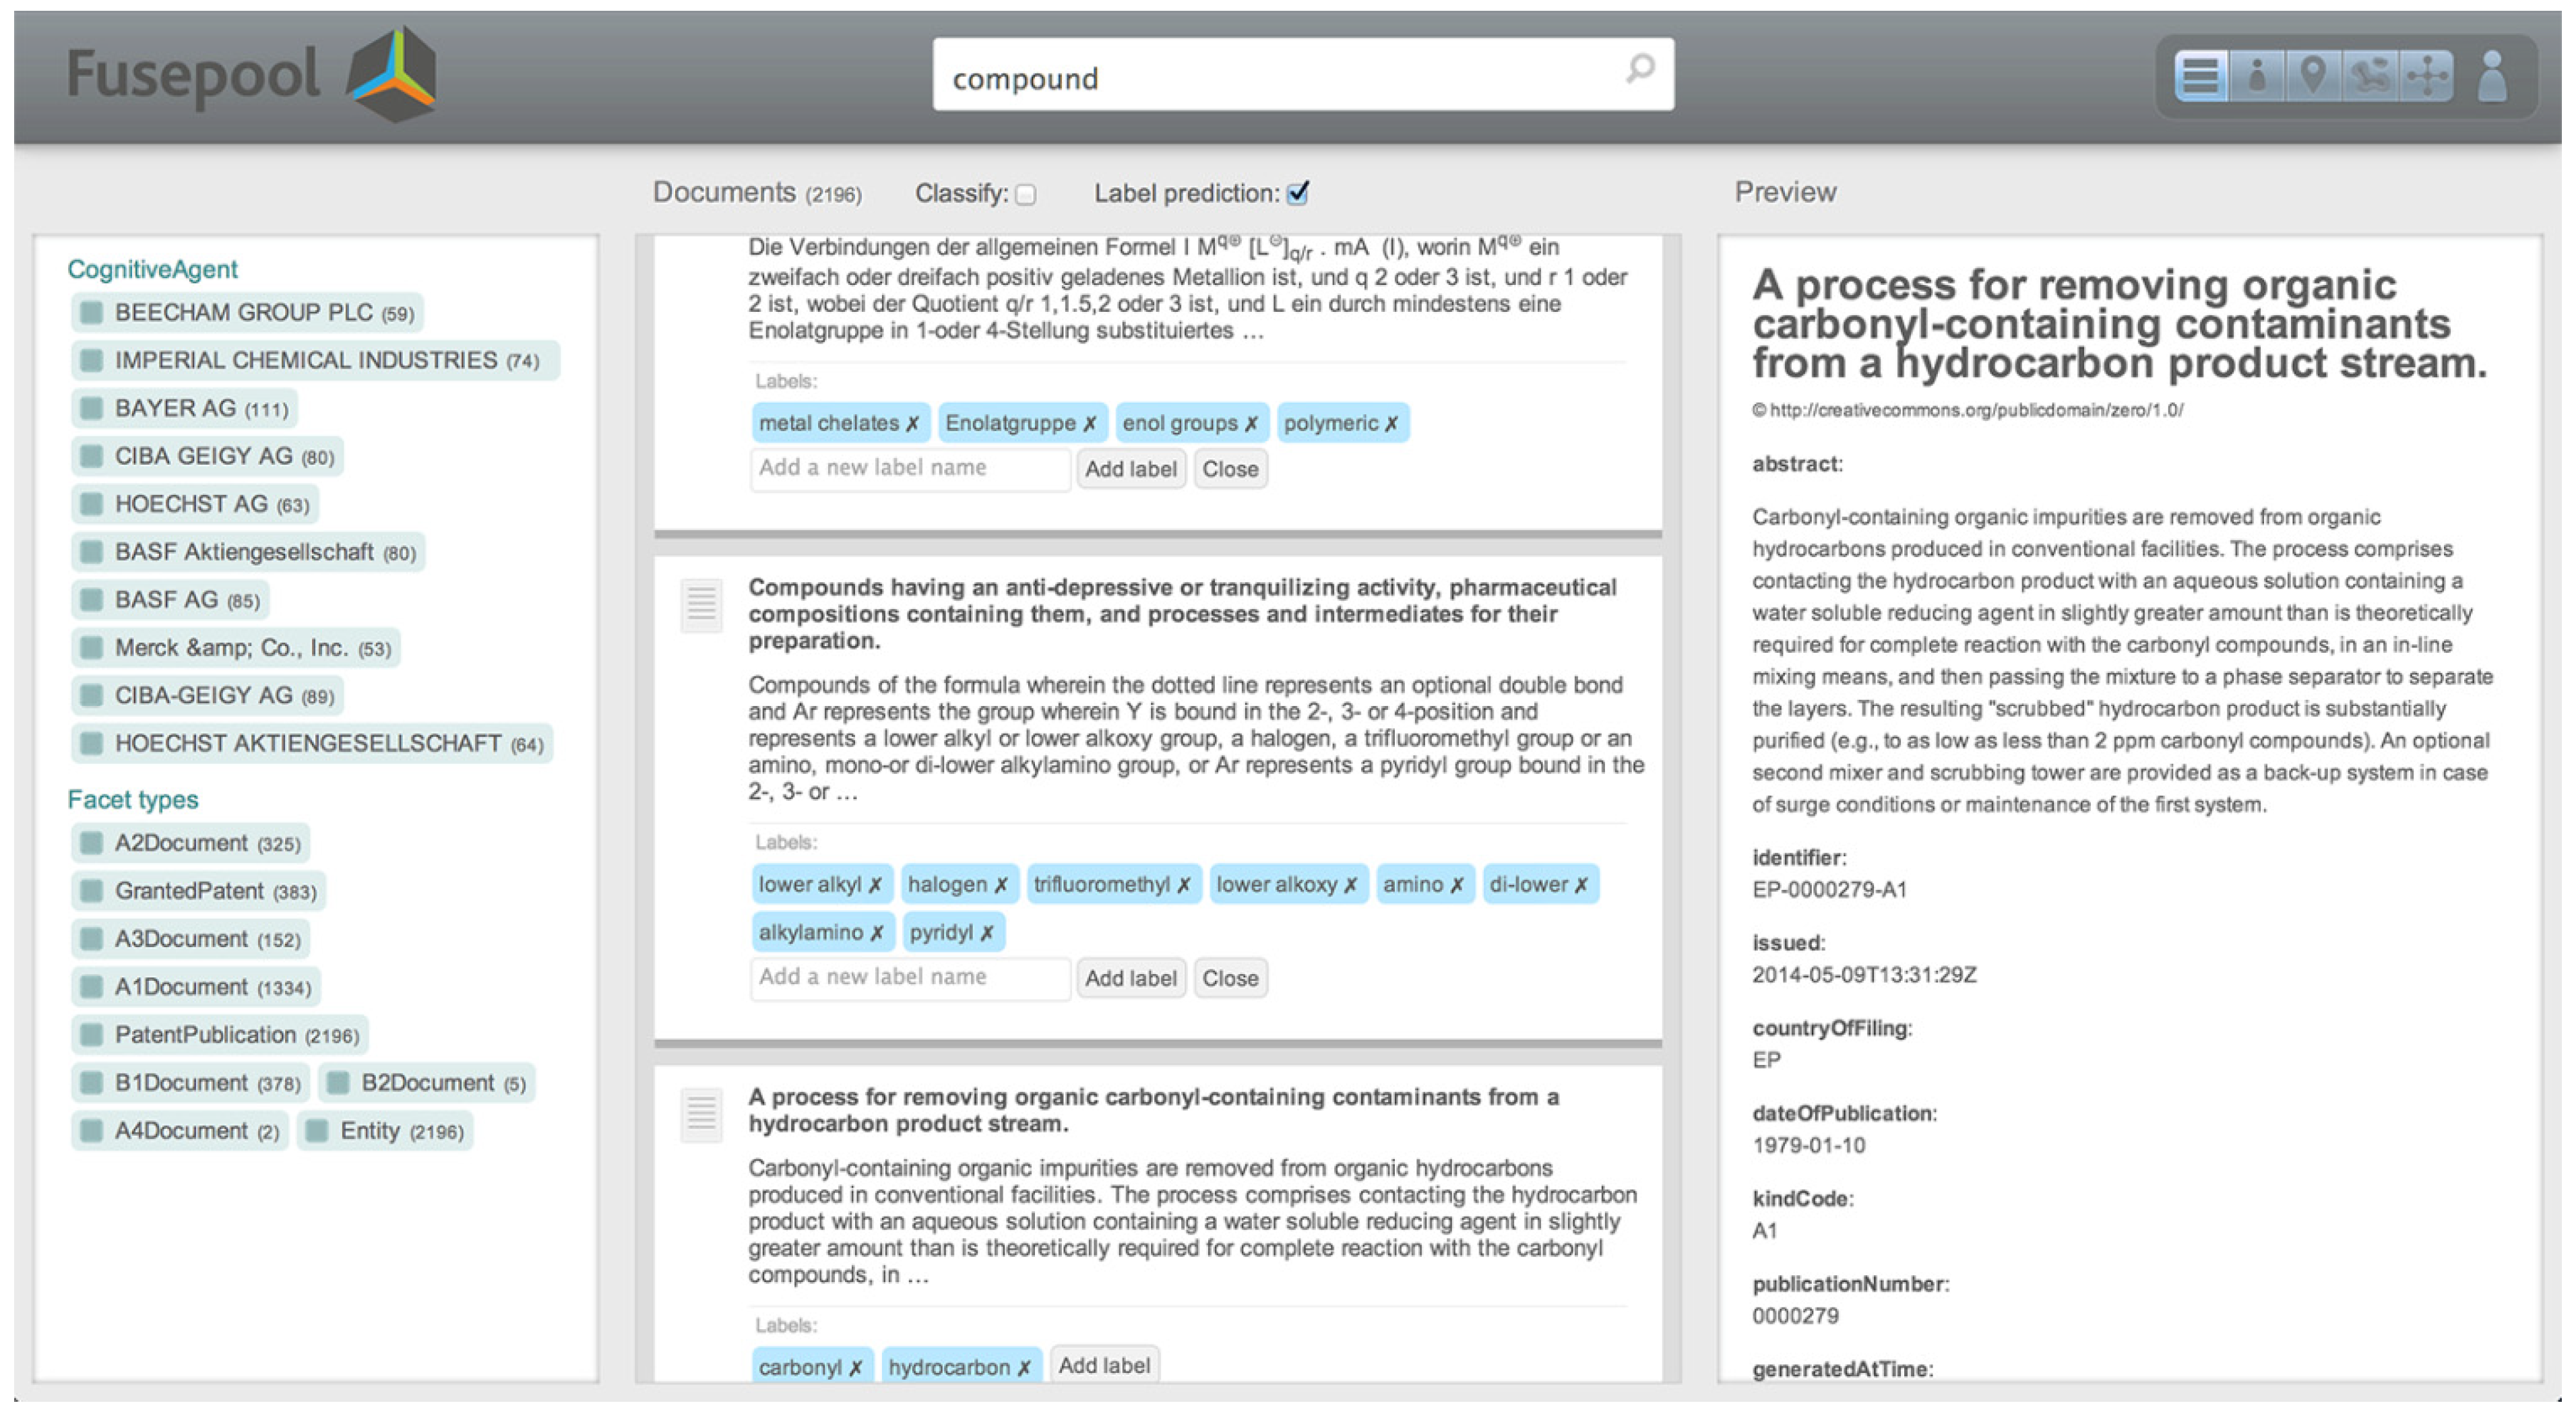
Graphical user interface of the Fusepool Firstswim dashboard.

3.3.2. R7 (Run): Running Scalable Data-Driven Apps
The Fusepool platform and applications consist of a set of components and frameworks, some from existing Apache projects and Java frameworks. Fusepool added key technologies and integration to the existing features and contributed new open-source components. Some of the main frameworks include:
- Apache Stanbol: The result from a previous project, Stanbol offers a wide range of tools to discover entities in unstructured text documents. The Stanbol enhancers provide an extensible mechanism to process and semantically enrich content, including components for transformation to text, as well as for natural language processing;
- OSGi component architecture: OSGi specifies component architecture for the local interaction within a Java virtual machine. OSGi promotes modularization of the application providing a model for versioned libraries, as well as service architecture. The Fusepool platform relies on the core OSGi specification, as well as on the declarative service specification of the OSGi compendium [25]. The latter allows it to easily build services extending platform functionality;
- Authentication and authorization: In effect, Apache Stanbol had no authentication or access control mechanisms. The adopted approach leverages existing security mechanisms built into the Java Platform and some libraries from Apache Clerezza. All security-related code was contributed to the Apache Stanbol project and accepted by the Stanbol community and part of the Stanbol distribution;
- Search and indexing: Apache Lucene and Apache Solr are fast and scalable indexing and search tools running on the Java platform. Lucene provides basic search and indexing. Solr frontends Lucene with an HTTP interface.
The Fusepool platform and applications are running on a cloud infrastructure provided by Amazon Web Services. Installation was no different than on a local platform running the UNIX operating system. To estimate cloud infrastructure costs, a controlled testing environment is needed. A controlled testing environment allows performance measuring under predefined scenarios to test the application and evaluate run-time costs under realistic production scenarios and usage conditions.
The test environment was set up early in the project on local servers that were later moved to cloud servers. The benefit of a controlled testing environment is that the project team exactly knows what versions, components and functionalities are running. Through Fusepool end user involvement and tasks assigned to them, the project team also knows how many users are using a particular functionality at a given point in time. If done over time, the project team learns how changes to the software affect performance and run-time costs. The closer the testing environment resembles the real-time conditions, the more valid are the results. The outline of cost measurement provides guidelines for measuring costs in a controlled testing environment.
Typical cost drivers of cloud computing infrastructure:
- CPU clock usage hours;
- Persistent storage levels;
- I/O requests, API requests;
- Data transfer (outbound).
Typical questions to investigate when measuring cloud computing costs:
- Cost of storing a document?
- Cost of one entity extraction?
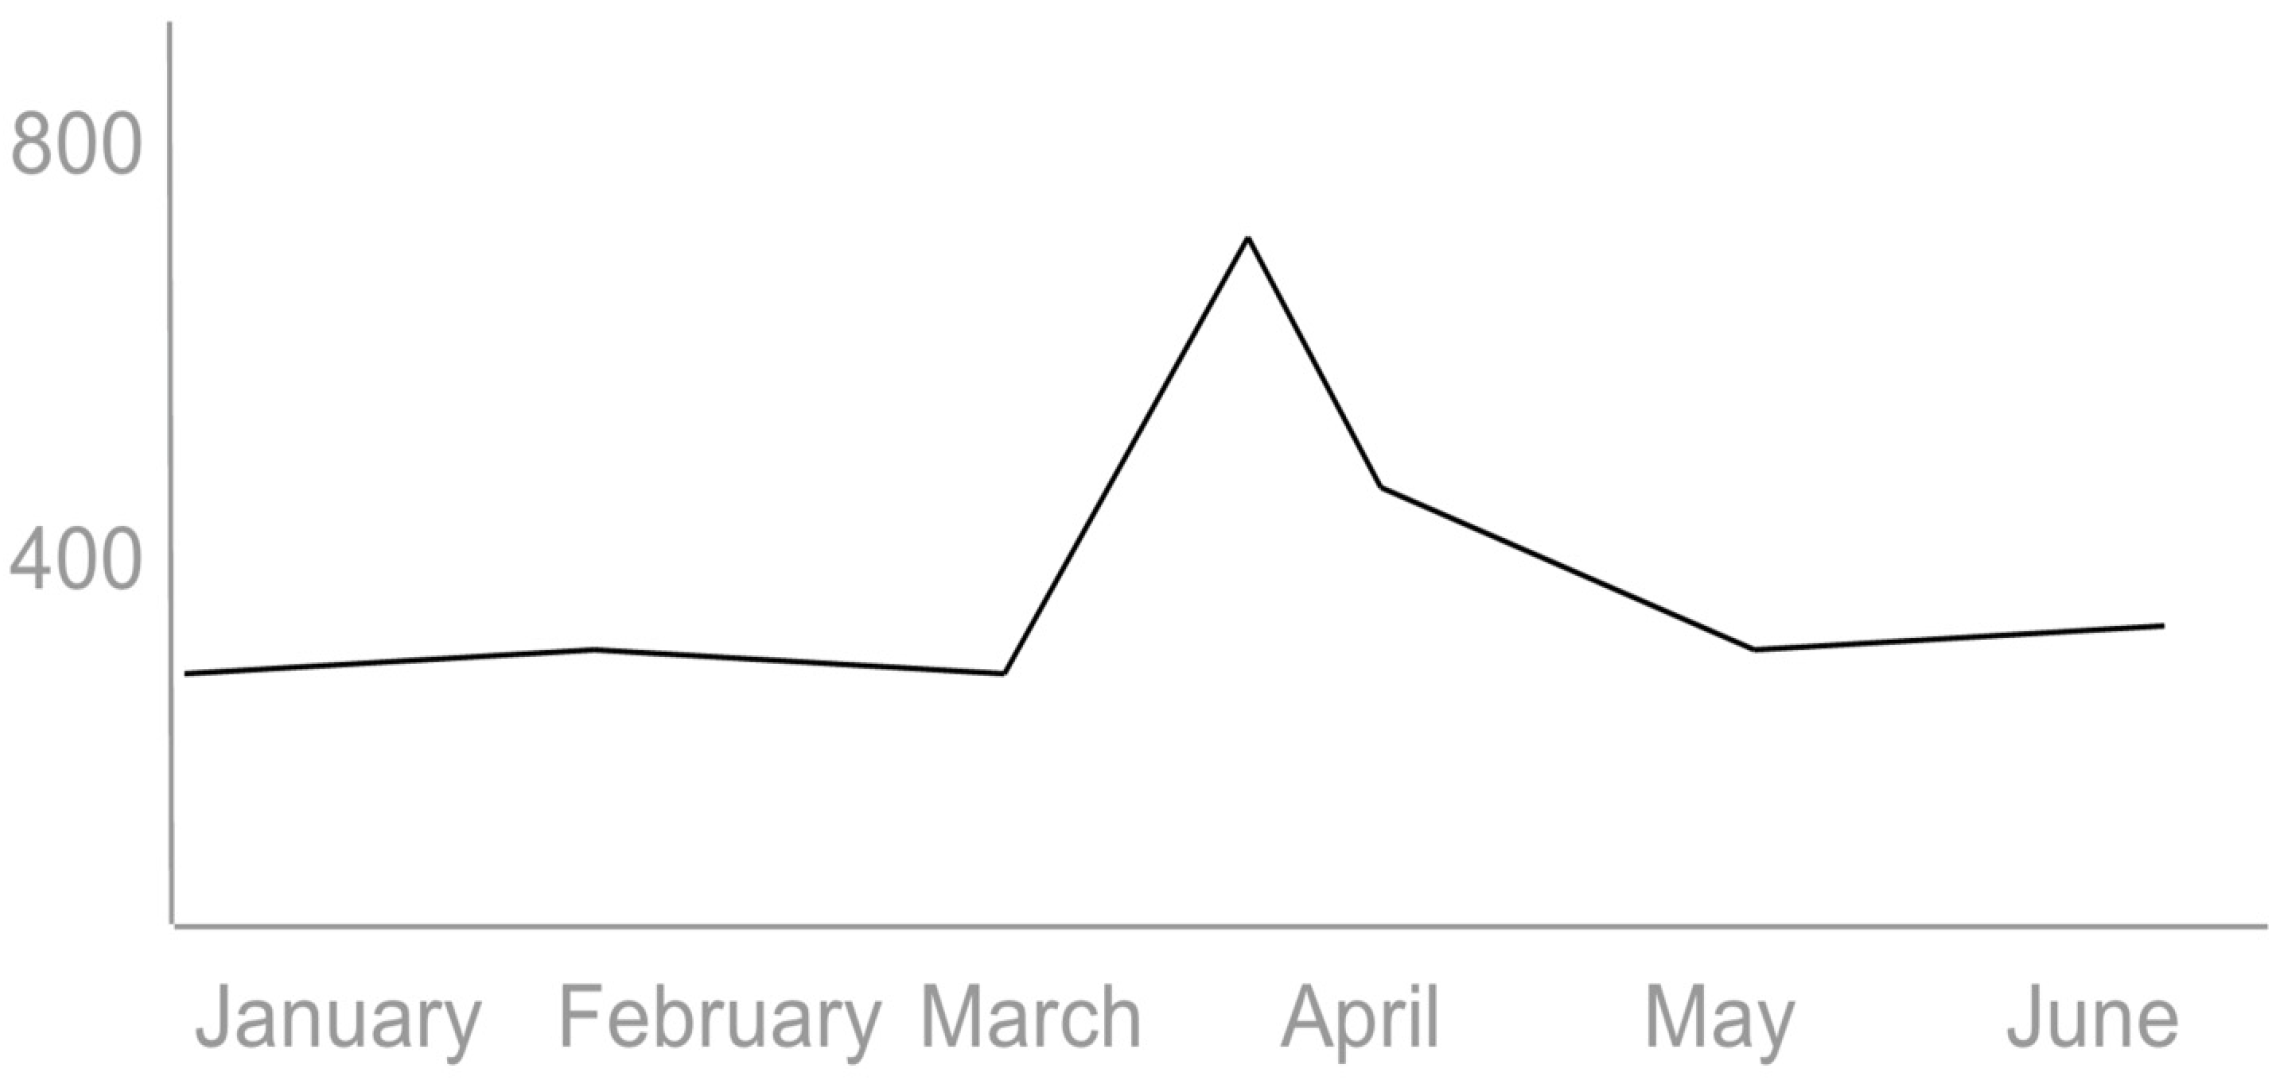
- Cost of one entity interlinking? Figure 4 below shows a spike in costs during the high volume of interlinking activity on the Fusepool cloud platform hosted on Amazon Web Services.
- Cost of supporting one user?
Controlled testing plan for Fusepool:
- Functions and usage (e.g., interlinking);
- Components and services (e.g., SILK);
- Track cost factors over time (e.g., CPU, data store);
- Link resource usage (e.g., time, downloads) to cost factors (e.g., Amazon bill).
Figure 4.
Spike in costs during the high volume of interlinking activity.

4. Discussion
This article first made a case for open (government) data as supporting political efficiency, socio-economic innovation and administrative efficiency. It described the current shortcomings for open data to yield measurable impacts: data access (must be efficient) and data usefulness (must be effective). It then identified technical problems with existing approaches to make data open and connect seamlessly across applications, enterprises and community boundaries and suggested linked data as a solution. The second chapter introduced the 7R Data Value Framework as an applied methodology to systematically address the current shortcomings, both technical and social. The third chapter presented the application of the 7R Data Value Framework in the Fusepool project. This final chapter shows first how Fusepool components support data processing and publishing at public agencies and then finishes with a conclusion and outline of future work.
4.1. Fusepool in Practice
The amount of work invested into developing software components varies between open data projects. Fusepool leaned towards software development to create and integrate components for a seamless data publishing workflow. The Fusepool work described in the previous chapter may sound overwhelming because of its focus on creating a suite of reusable software components. Typically, open data projects do not dive that deep into programming and stakeholder engagement, but at least the latter should be done. For the former, the components developed by Fusepool make publishing open data as linked data easier. This section describes how Fusepool components are used in content lookup and discovery by the Libraries of Free University of Berlin and as data transparency mash-up for the Dutch Parliament by software consultancy Weyeser.
4.1.1. Content Lookup and Discovery Engine by the Libraries of Free University of Berlin
The Free University Berlin is one of Germany’s top-ranked universities and hosts many of the nation’s research excellence centers. The libraries of the Free University Berlin comprise the University Library (UB) and around forty departmental libraries with total holdings of around eight million printed items, 38,000 e-journals, 400,000 e-books and 1,300 databases. A library representative participated in the hackathon of the Data Hack Award 2014 in Berlin (DHA14) and developed a winning proposal that was implemented in less than a month and presented at the Fusepool showcase event in Brussels.
The library system offers their own state-of-the art online search system. However, many of the external works are only full-text indexed, but not labeled with controlled keywords, which results in imprecise search results. As a consequence, users divert to other search tools that benefit from massive global amounts of data and are therefore more likely to retrieve relevant results just from full-text indices.
For many years, printed materials (local holdings) where indexed by librarians using keywords from well-elaborated subject terminologies (such as GND, Integrated Authority File). Using subject terminologies enables grouping related materials and browsing them via semantic relations of concept identifiers (broader, narrower, related). However, manually indexing the vast amount of external material is not feasible. Resources from external providers do not share the same “language” (terminologies) with the local holdings, which makes it harder to deliver coherent search results beyond the local holdings. End users have to compensate for this semantic gap by guessing about synonyms that may appear in their desired results.
Given this context, the main goals are two-fold:
- tools supporting library staff in the time consuming task of manual subject indexing;
- new services that improve results and attract usage of library online search systems.
The Fusepool SMA component (string matching algorithm) compares each word of a plain text input with strings provided in a dictionary in order to identify a match. Hence, the main question was how to use SMA to support librarians in subject indexing. For the proof of concept, the library used a set of controlled subject headings as a dictionary (a subset of GND published by the German National Library).
Each identifier (GND Number) is dereferenceable following linked data principles. For example, the keyword “linked data” is represented using the unique identifier http://d-nb.info/gnd/7863462-3. However, the SMA requires the actual string “linked data” for computing the match. This did not pose a problem, because the GND authority data is represented as a thesaurus, which also includes alternative labels for most of the GND concepts. As a result, it is possible to automatically assign the correct identifier, 7863462-3, even when a text contains a synonym, e.g., “linked open data”.
The following usage scenarios are foreseen, depending on the perspective of the stakeholder:
- Library staff: support in the time-consuming task of manual indexing the acquired materials. It should be possible to suggest identifiers based on the text input of book reviews, table of contents, abstracts and full texts;
- Researchers: suggestions of related content for their research topics. It should be possible to start research at any location in the WWW (not only library catalogue). Users want to collect significant text phrases and get suggestions of related content available in their library;
- Publishers/authors: improve the findability of their content by adding controlled keywords (i.e., concept identifiers) easily. Their contents should be scanned automatically for phrases that can be represented with unique identifiers.
The proof of concept consists of a software application that is built on top of the Fusepool platform and uses its REST services (Figure 5). As of now, the app supports librarians in subject indexing by:
- showing most used concepts in a tag cloud, based on their appearance in the text;
- gathering synonyms of a concept into a group labeled with the preferred denotation; and
- providing background information about each concept to support the process of choosing correct concepts between homonyms.
Figure 5.
node.js application built on top of the Fusepool platform using its REST services.

The application not only supports librarians, but also library users. It allows clicking on the recognized concepts to construct a search query that can be sent to any other content management system.
In the future, the library wants to extend the prototype with additional data sources and dictionaries for matching and to examine the use of other enhancement engines, such as Spotlight, within the toolset. Another goal is to examine ways to integrate the presented method into the existing search system to make the new services available there. For example, one stated goal is to align external resources from aggregators (e.g., Thomson Reuters, ProQuest). Often, these have no GND identifiers assigned. It may be of great value to analyze their metadata (title, abstract, plain text, keywords) to recommend local content; or vice versa. Finally, the library will improve the usability of the application and may open it as a service for a broader community.
4.1.2. Weyeser’s Data Transparency Mash-Up for the Dutch Parliament
Weyeser is a Dutch software consultancy working with private and government clients. They participated in the boot camp of the Data|Hack|Award|2014 in Berlin (DHA14) and presented their work at the hackathon. Together with Tulp Interactive, they implemented in less than two month a complete data processing system based on core components of the Fusepool platform and added a new visualization implementation on top of it. Weyeser and Tulp Interactive presented the final system at the Fusepool showcase event in Brussels.
Weyeser envisioned an application together with the Dutch Parliament to classify and visualize the data stream of parliamentary work. Citizens face significant hurdles to get a grip on what is discussed or voted on in parliament. Such insight empowers citizens: they can more actively engage in the conversation with their representatives. At the same time, the overview of actively discussed and voted on topics helps fulfill government’s transparency agenda. Fusepool enabled Weyeser to re-use hand-classified documents collected over decades to build a content labeling system within the platform.
To get started, Weyeser had Fusepool and its components at their disposal and a clear goal:
- single entry for parliamentary documents and visualization of the evolution of topics over time;
- amend the platform with new tools to visually analyze the results and emerging patterns.
The data consisted of the database from the Dutch parliament which contains all parliamentary documents that had been generated over the past 30 years, all hand classified and in full-text. The data provided a rich stock for the Fusepool platform to build dictionary annotators.
The work involved in getting the VIP data into the Fusepool platform required building RDFizers to get the XML structures of the VIP data mapped to RDF and extracting the classes to build the annotators. The data is then loaded into the Fusepool platform and ran through the processing steps to index and annotate the documents. At this point, all the built-in features of the platform are available to end users. Weyeser then built their own data visualization layer on top of it to display results.
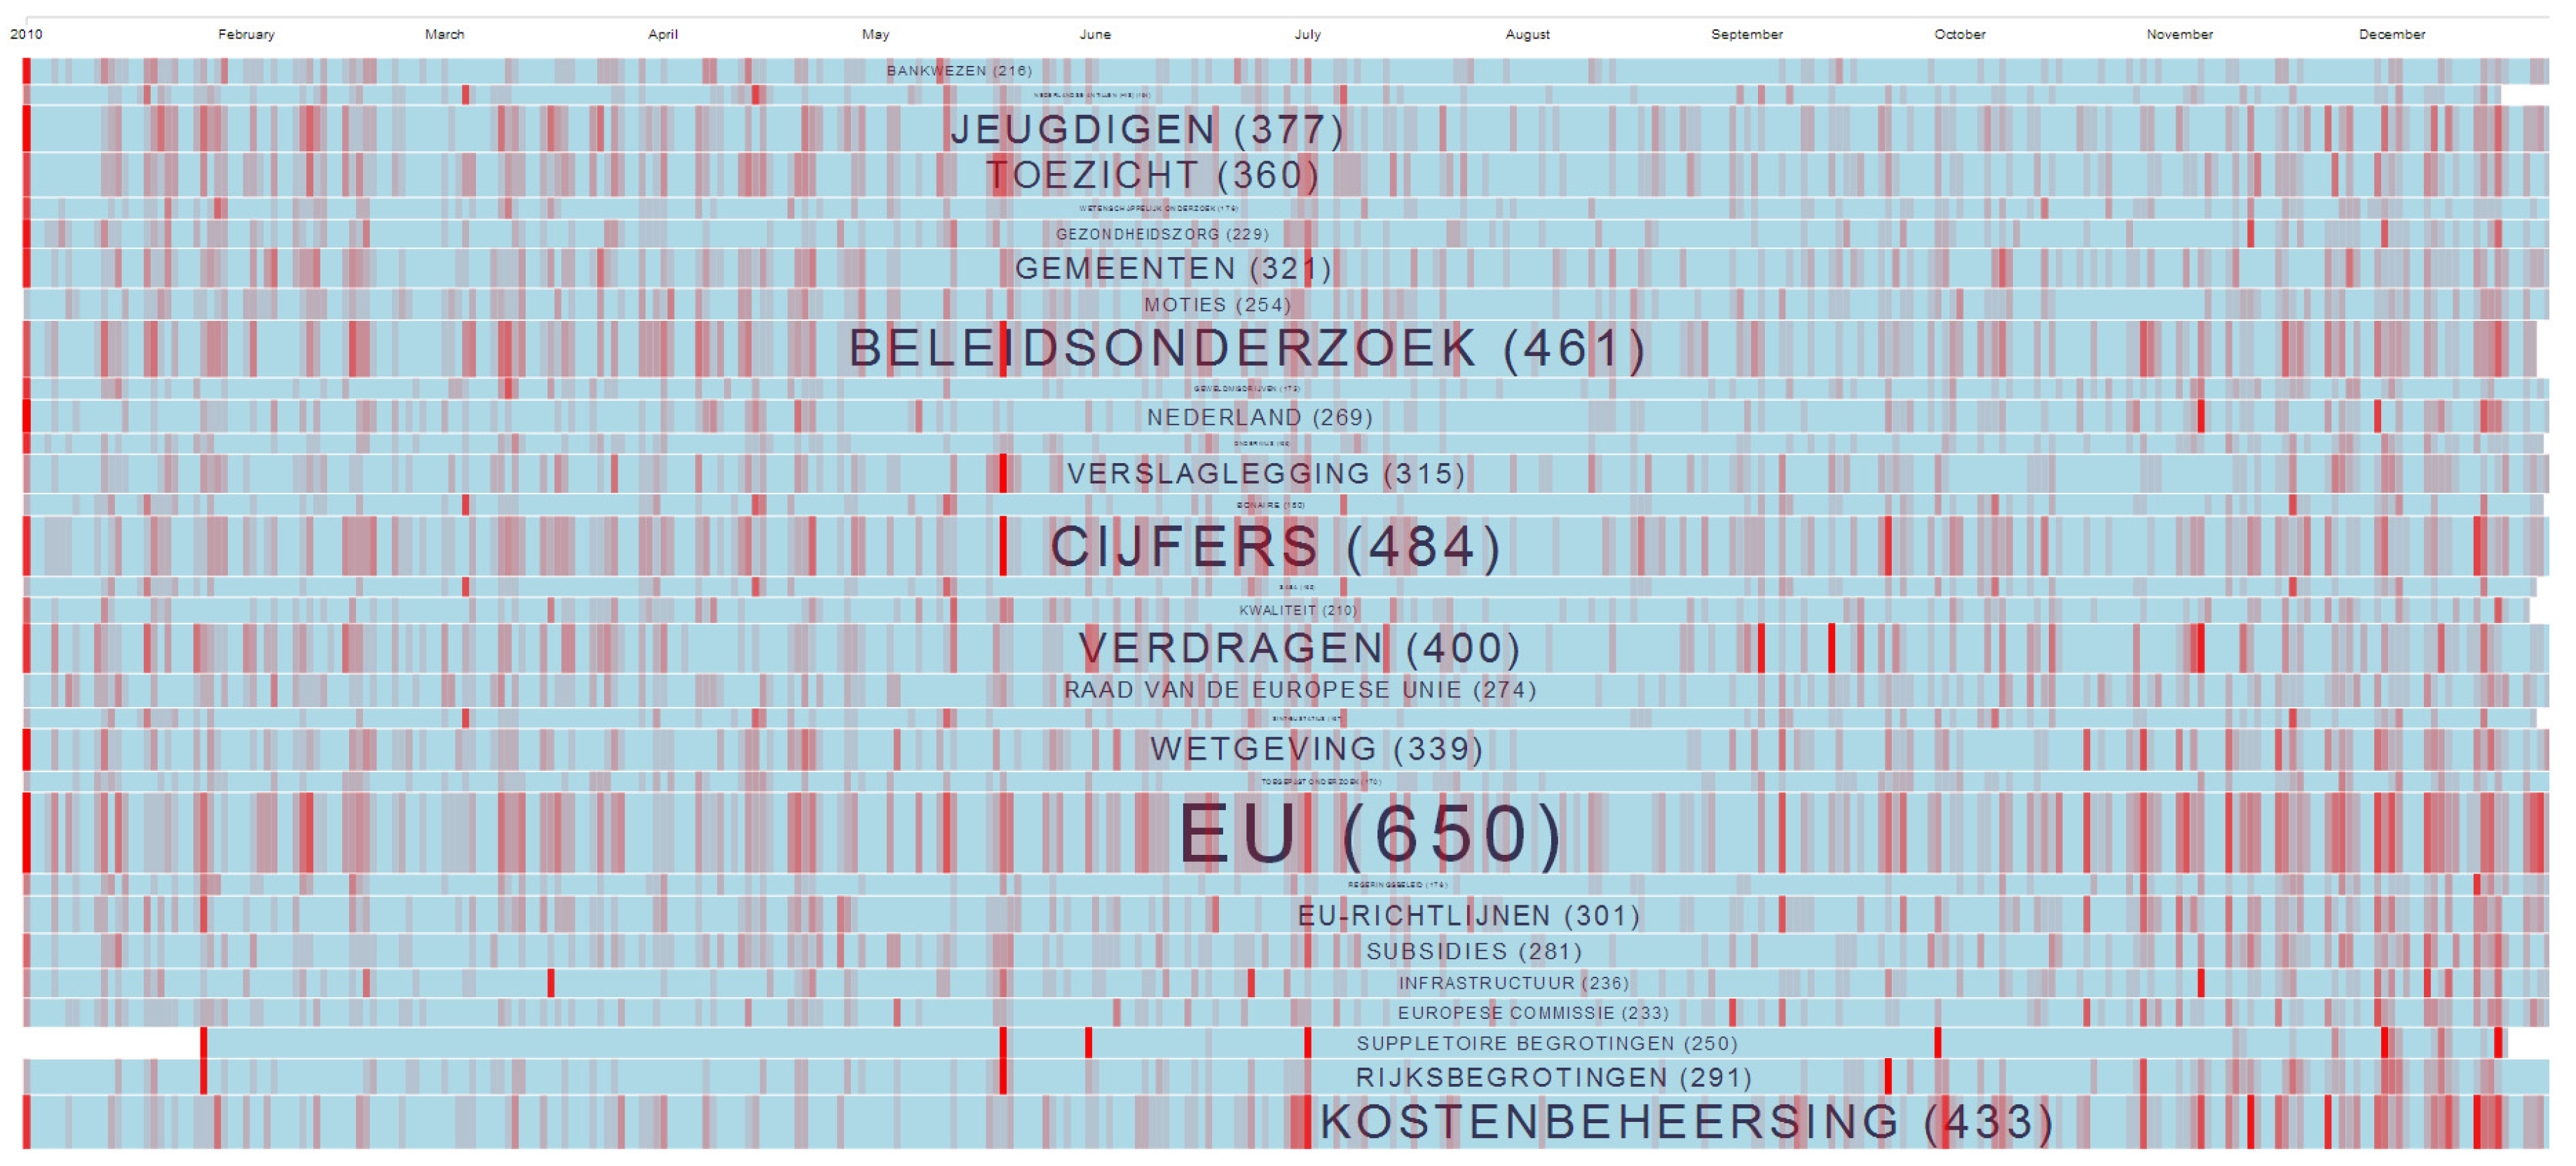
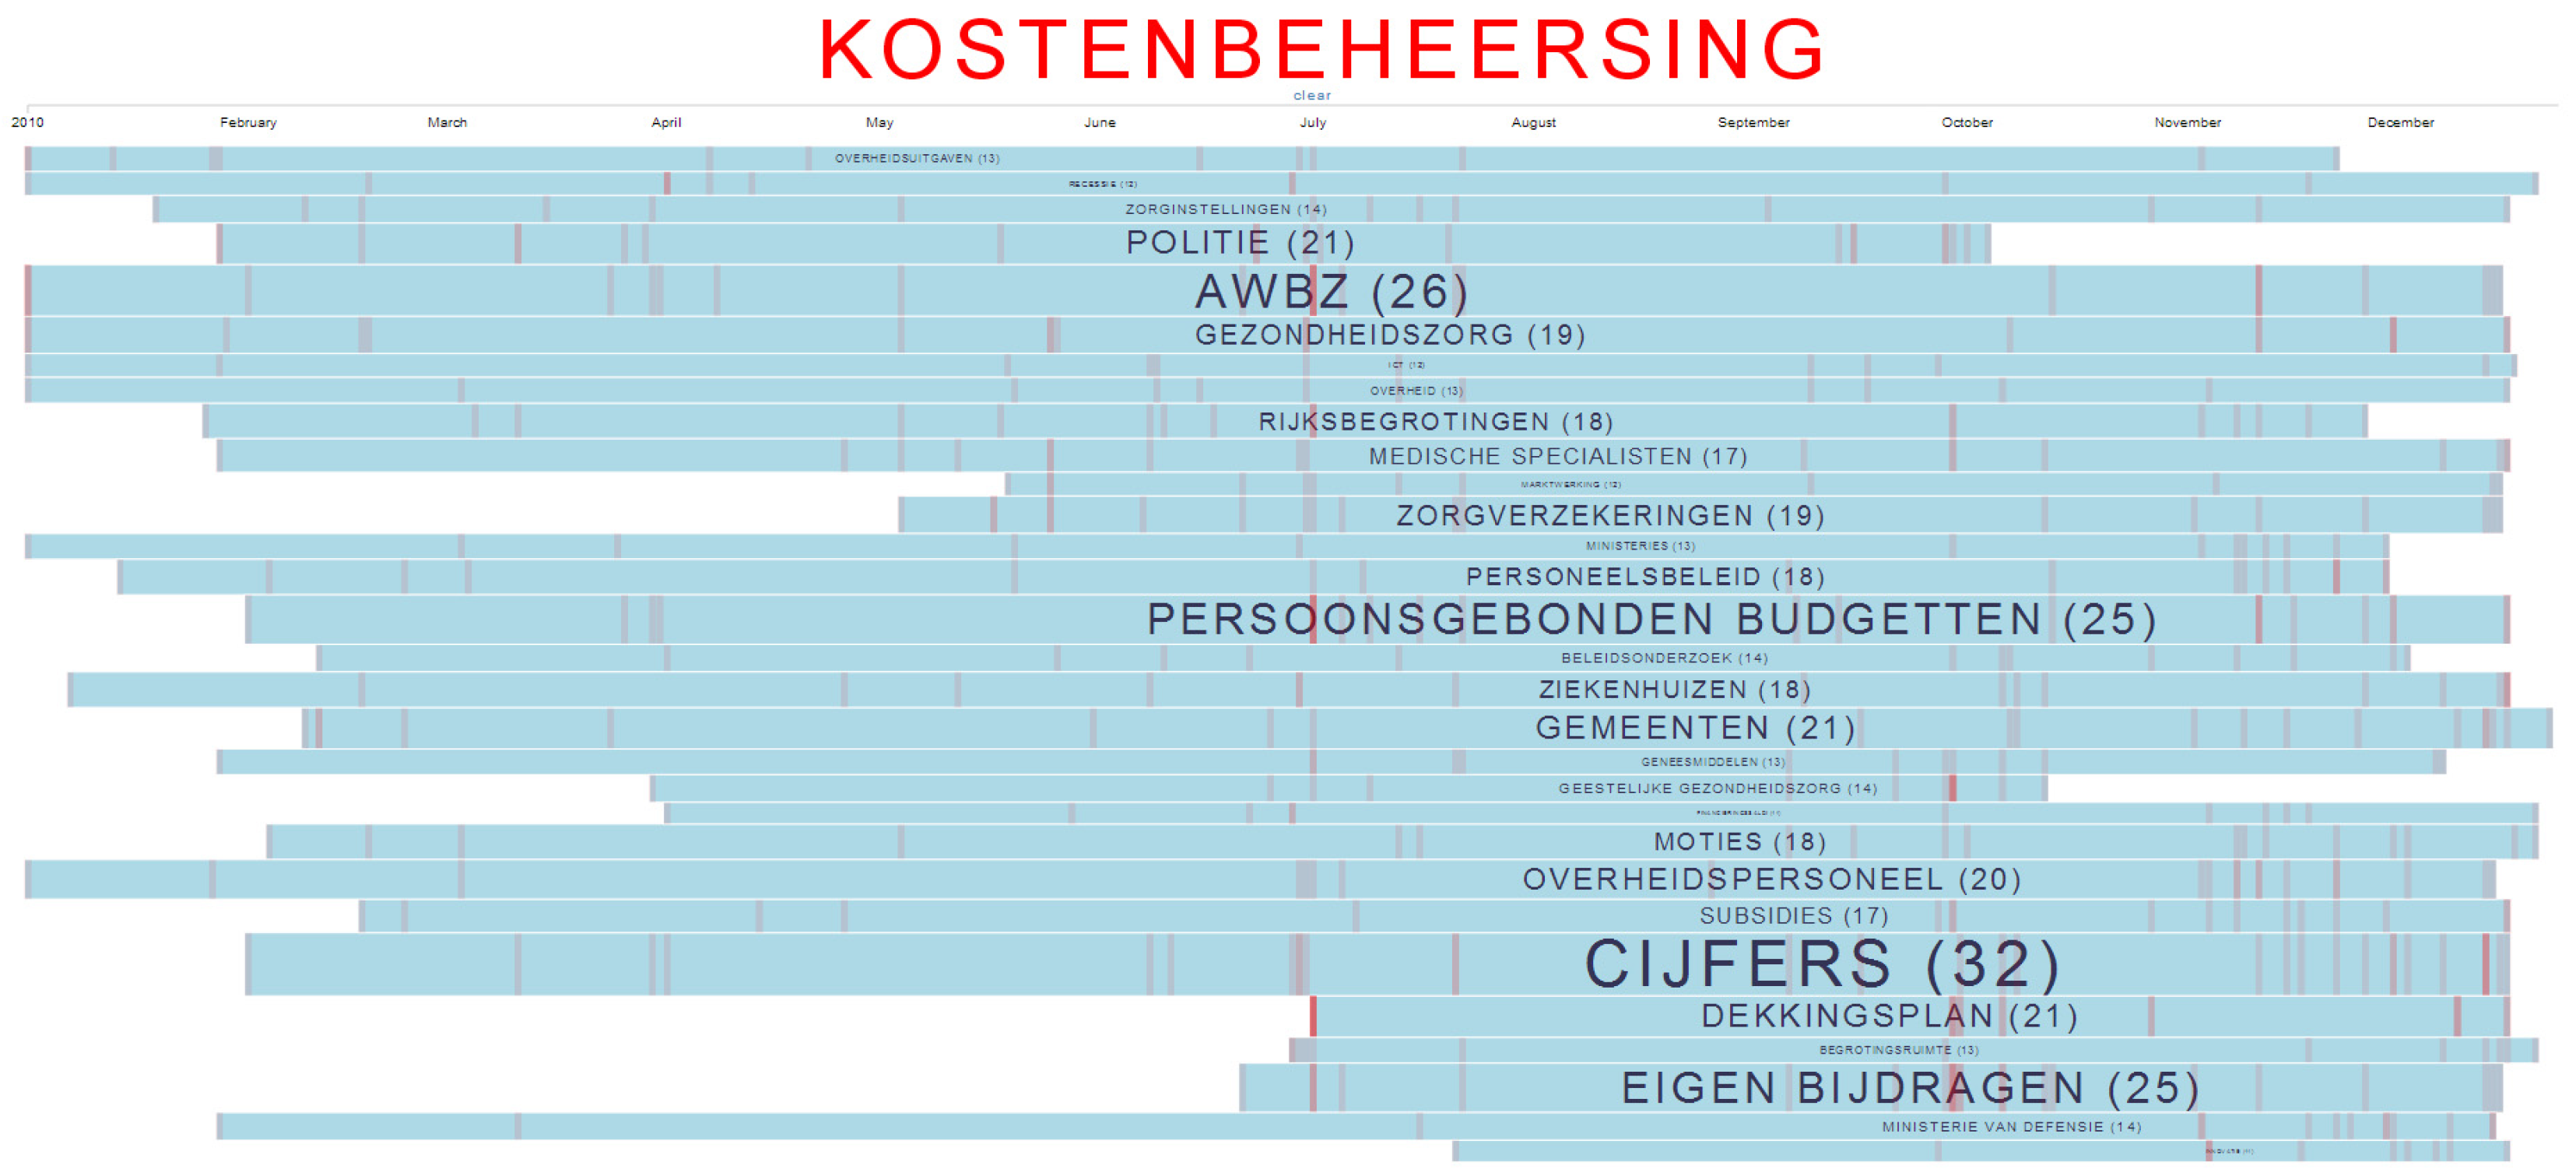
Figure 6 and Figure 7 show the 2010 subset of the VIP data. Each row displays the documents (red line) that mention the label shown in the middle of the row. More mentions make the row display thicker than others, and the total count over the year is shown in brackets. In this example, citizens learn that cost control (Kostenbeheersing) was an active topic in 2010 (Figure 6). They can proceed to click on it and see how cost control relates to other topics in 2010 (Figure 7). This enables citizens to inspect topics discussed in relationship to cost control and get a clearer picture of how they are related.
Figure 6.
Cost control (Kostenbeheersing) has been an active topic in 2010.

Figure 7.
How cost control relates to other topics in 2010.

5. Conclusions and Future Work
Improving political efficiency, socio-economic innovation and administrative efficiency is a public effort; not one or two agencies, businesses or enthusiasts alone are bringing about the desired impacts. Public effort needs some good will from all to go that extra mile that may not be needed to fulfill one’s own goals, but benefits all. As a slow, but steady process, open data and its impact does not arrive overnight. There is much effort going on regarding data access (must be efficient) and projects, such as Fusepool and those it reuses, as examples. Regarding the second key prerequisite, data usefulness (must be effective), this article emphasized stakeholder engagement and co-creation. In addition, Fusepool comes with predictive labeling and user labeling and annotations that guide data publishers as to what data may be desired. There is, however, a stickier aspect that impedes publishing useful data: useful data is often commercially interesting, which leads data publishers to assume that it creates value if kept away. The view that sharing creates value is just starting to set in.
Our experience shows that public agencies are generally interested, but often overwhelmed with publishing open data, and they actively seek best practices proven elsewhere. They understand that doing it alone locally or regionally risks hitting hurdles, particularly concerning interoperability, finding and interlinking of datasets. Another focus of this research is therefore to inform about and adopt standards and best practices.
The 7R Framework and the Fusepool project described in this article can have a strong impact on the uptake of open data, because of its focus on an integrated publishing and development environment. Data publishers usually shy away from installing many different components and tweaking around to get results. Similarly, app developers at large, not the few early adopters, want a stable and proven environment in which they can release their software. When these elemental infrastructure requirements are met and the benefits become visible, a self-sustaining momentum is likely to set in that accelerates the adoption of open data and yields measurable impacts.
Fusepool goes beyond existing projects, because its focus is on creating a consistent and integrated linked data processing and publishing platform rather than individual components. This enables data publishers to stream data and app developers to reuse that data while lowering manual intervention. Because data is up-to-date, adheres to metadata standards and is served from a high-performance platform, app developers can integrate that data into their apps and present that to their end users. Currently, the market for mobile is confined to “stores” that are controlled by a few players, where each requires specific protocols and programming that creates a lock-in for both app developers and consumers. Apps enabled by linked data run via proven W3C mobile web application standards and can be developed and consumed by all web-capable devices.
Acknowledgments
Work reported in this article was conducted in the Fusepool project partly funded by the European Framework Program for Innovation under Grant Number 296192.
Author Contributions
All sections were authored and edited by Dr. Michael Kaschesky, except Section 3.1.3, Section 3.2.1 and Section 3.2.2, which were authored by Luigi Selmi, Section 4.1.1, contributed by Johannes Hercher, and Section 4.1.2, contributed by Alexandro Mancusi.
Conflicts of Interest
The authors declare no conflict of interest.
References
- Australian Bureau of Statistics. A Guide for Using Statistics for Evidence Based Policy. Available online: http://www.abs.gov.au/ausstats/[email protected]/lookup/1500.0chapter32010 (accessed on 16 March 2014).
- World Wide Web Consortium (W3C). Linked Data Platform 1.0. Available online: http://www.w3.org/TR/ldp (accessed on 16 March 2014).
- Spears, T. Canadian bureaucracy and a joint study with NASA. Available online: http://www.ottawacitizen.com/technology/Canadian+bureaucracy+joint+study+with+NASA/6493201/story.html (accessed on 16 March 2014).
- Wildavsky, A. The political economy of efficiency. Public Adm. Rev. 1966, 26, 292–310. [Google Scholar] [CrossRef]
- Cerny, P.G. Reconstructing the political in a globalizing world: States, institutions, actors and governance. In Globalization and the Nation-State; Buelens, F., Ed.; Edward Elgar: Cheltenham, UK, 1999; pp. 89–137. [Google Scholar]
- Cerny, P.G. Multi-nodal politics: Toward a political process theory of globalization. In Proceedings of the Annual Conference of the International Political Economy Society, Stanford, CA, USA, 9–10 November 2007.
- Wittman, D. Why democracies produce efficient results. J. Political Econ. 1989, 97, 1395–1424. [Google Scholar]
- Kaschesky, M.; Riedl, R. Top-Level Decisions Through Public Deliberation on the Internet: Evidence from the Evolution of Java Governance. In Proceedings of the 2009 10th Annual International Conference on Digital Government Research, Puebla, Mexico, 17–20 May 2010; pp. 42–55.
- Cucciniello, M.; Nasi, G.; Valotti, G. Assessing Transparency in Government: Rhetoric, Reality and Desire. In Proceedings of the 45th Hawaii International Conference on System Sciences, Maui, HI, USA, 4–7 January 2012; pp. 2451–2461.
- Lathrop, D.; Ruma, L. Open Government: Transparency, Collaboration and Participation in Practice; Lathrop, D., Ruma, L., Eds.; O’Reilly Media: Sebastopol, CA, USA, 2010. [Google Scholar]
- Davies, T. Open Data Barometer—2013 Global Report. Released 31/10/2013. Web Foundation & Data Institute. Available online: http://www.opendataresearch.org/dl/odb2013/Open-Data-Barometer-2013-Global-Report.pdf (accessed on 16 March 2014).
- Neuroni, A.; Riedl, R.; Brugger, J. Swiss Executive Authorities on Open Government Data—Policy Making Beyond Transparency and Participation. In Proceedings of the 46th Hawaii International Conference on System Sciences, Wailea, HI, USA, 7–10 January 2013; pp. 1911–1920.
- Alani, H.; Dupplaw, D.; Sheridan, J.; O’Hara, K.; Darlington, J.; Shadbolt, N.; Tullo, C. Unlocking the Potential of Public Sector Information with Semantic Web Technology. In Proceedings of the Semantic Web Conference, Busan, Korea, 24 August 2007; Volume 4825, pp. 708–721.
- Klischewski, R. Identifying Informational Needs for Open Government: The Case of Egypt. In Proceedings of the 2012 45th Hawaii International Conference on System Sciences, Maui, HI, USA, 4–7 January 2012; pp. 2482–2490.
- Dawes, S.S. Stewardship and usefulness: Policy principles for information-based transparency. Gov. Inform. Quart. 2010, 27, 377–383. [Google Scholar] [CrossRef]
- Heckmann, D. Open government—Retooling democracy for the 21st Century. In Proceedings of the 44th Hawaii International Conference on System Sciences (HICSS), Kauai, HI, USA, 4–7 January 2011; pp. 1–11.
- Berners-Lee, T. Five Principles of Linked Data. Available online: http://www.w3.org/DesignIssues/LinkedData.html (accessed on 16 March 2014).
- West, M.; Fowler, J. Developing High Quality Data Models; Morgan Kaufmann: Burlington, MA, USA, 2011. [Google Scholar]
- World Wide Web Consortium (W3C). Linked Data Cookbook. Available online: http://www.w3.org/2011/gld/wiki/Linked_Data_Cookbook (accessed on 16 March 2014).
- World Wide Web Consortium (W3C). Semantic Web Activity. Available online: http://www.w3.org/2001/sw/Activity (accessed on 16 March 2014).
- Berners-Lee, T.; Hendler, J.; Lassila, O. The Semantic Web. Scientific American Magazine, 17 May 2001; 35–43. [Google Scholar]
- Evelson, B.; Yuhanna, N. Craft Your Future State BI Reference Architecture; Forrester Research Inc.: Cambridge, MA, USA, 2012. [Google Scholar]
- Linstedt, D. Physical Data Models and Ontologies. Available online: http://danlinstedt.com/datavaultcat/physical-data-models-and-ontologies (accessed on 16 March 2014).
- Beyer, M. Leading the Logical Data Warehouse Charge Has Its Challenges. Available online: http://blogs.gartner.com/merv-adrian/2012/02/24/guest-post-leading-the-logical-data-warehouse-charge-has-its-challenges (accessed on 16 March 2014).
- OSGi Alliance. OSGi Service Platform Service Compendium. Available online: http://www.osgi.org/download/r4v42/r4.cmpn.pdf (accessed on 16 March 2014).
© 2014 by the authors; licensee MDPI, Basel, Switzerland. This article is an open access article distributed under the terms and conditions of the Creative Commons Attribution license (http://creativecommons.org/licenses/by/3.0/).
Share and Cite
MDPI and ACS Style
Kaschesky, M.; Selmi, L. 7R Data Value Framework for Open Data in Practice: Fusepool. Future Internet 2014, 6, 556-583. https://doi.org/10.3390/fi6030556
AMA Style
Kaschesky M, Selmi L. 7R Data Value Framework for Open Data in Practice: Fusepool. Future Internet. 2014; 6(3):556-583. https://doi.org/10.3390/fi6030556
Chicago/Turabian StyleKaschesky, Michael, and Luigi Selmi. 2014. "7R Data Value Framework for Open Data in Practice: Fusepool" Future Internet 6, no. 3: 556-583. https://doi.org/10.3390/fi6030556