1. Introduction
Climate and weather information are essential for farm management and decision support systems in agriculture. Farmers gain their knowledge by looking at how crops respond to historical climate conditions. Information of future weather and climate in the coming cropping season will help farmers make proper plans for farm management. Based on these requirements, agronomists and application developers provide decision support systems, which require historical climate conditions and future weather conditions of the coming season for farmers. Good accessibility to farm-scale climatological data is one of the most important requirements for developing decision making systems, such as DSSAT (
http://dssat.net), which is being developed through international collaboration. Gridded climate data are readily available, which provide historical climate and weather data. For example, The National Agriculture and Food Research Organization (NARO) has been providing gridded climatological data for the whole of Japan [
1]. Gridded data are very useful for regional decision making, such as developing crop suitability maps or estimating regional crop development, because they provide weather and climate data in a spatially-distributed way. Long-term climatological data are vital for analyzing the impact of climate changes on cropping, as well as modeling future weather scenarios. On the other hand, farmers’ interests focus more on each individual farm, which is a specific point; thus, decision support systems for farmers are usually made to utilize data sources that have a point-based structure. In general, point-based weather information can be obtained from weather stations, although long-term climate is hardly available in most situations. Official weather stations provide a point-based data source; however, they are often located far away from farms. Fusing gridded data with local point data could provide more useful information for decision support systems for agriculture. The heterogeneity of the data source is increasing as the field sensor network system is expanding to agriculture fields under the concept of the Internet of Things (IoT). In this situation, the standard web API that secures the interoperability on various meteorological data and other agro-environmental data is becoming more important.
Our primary objective is to develop single data access mechanism on a web API by which agricultural applications can obtain climate data regardless of the data type, i.e., point-based or gridded data, and the difference in the data structure. Application developers do not need to spend precious time on learning the data structure of each data source one by one, and obtaining data from a system will be the same, whether gridded or point-based weather data. We used the gridded climate data source from NARO for this development. With this data source, agricultural applications can seamlessly obtain weather data and long-term historical climate data to run simulations and scenario analysis.
2. Basic Concepts and Related Information
2.1. Climatological Data in Agricultural Applications
Climate is one of the most important factors that controls crop growth. Climate condition heavily influences every process of crop production starting from planting until harvesting. Climatological data are used for not only simulating crop growth, but also for agricultural management and farmer decision making [
2]. Simulation models for crop are often based on climatological data in the form of daily intervals for estimating crop growth and yield [
3]. The key climate variables that impact crops are temperature, solar radiation and precipitation [
4]. Temperature substantially affects photosynthesis and respiration, plant growth and phenological development, while solar radiation significantly affects plant photosynthesis [
5]. Precipitation represents water availability in an area. Meteorological variables are used as input for weather generator models and crop modeling. Commonly-required variables are maximum temperature, minimum temperature, solar radiation and precipitation in the form of daily intervals.
2.2. Data Source
NARO developed a daily Agro-meteorological Grid Square Data system (AmGSD) [
1]. AmGSD seamlessly combines three different data produced by the Japan Meteorological Agency (JMA), including data acquires from the Automated Meteorological Data Acquisition System (AMeDAS), nine-day numerical weather prediction and daily climatic normal value [
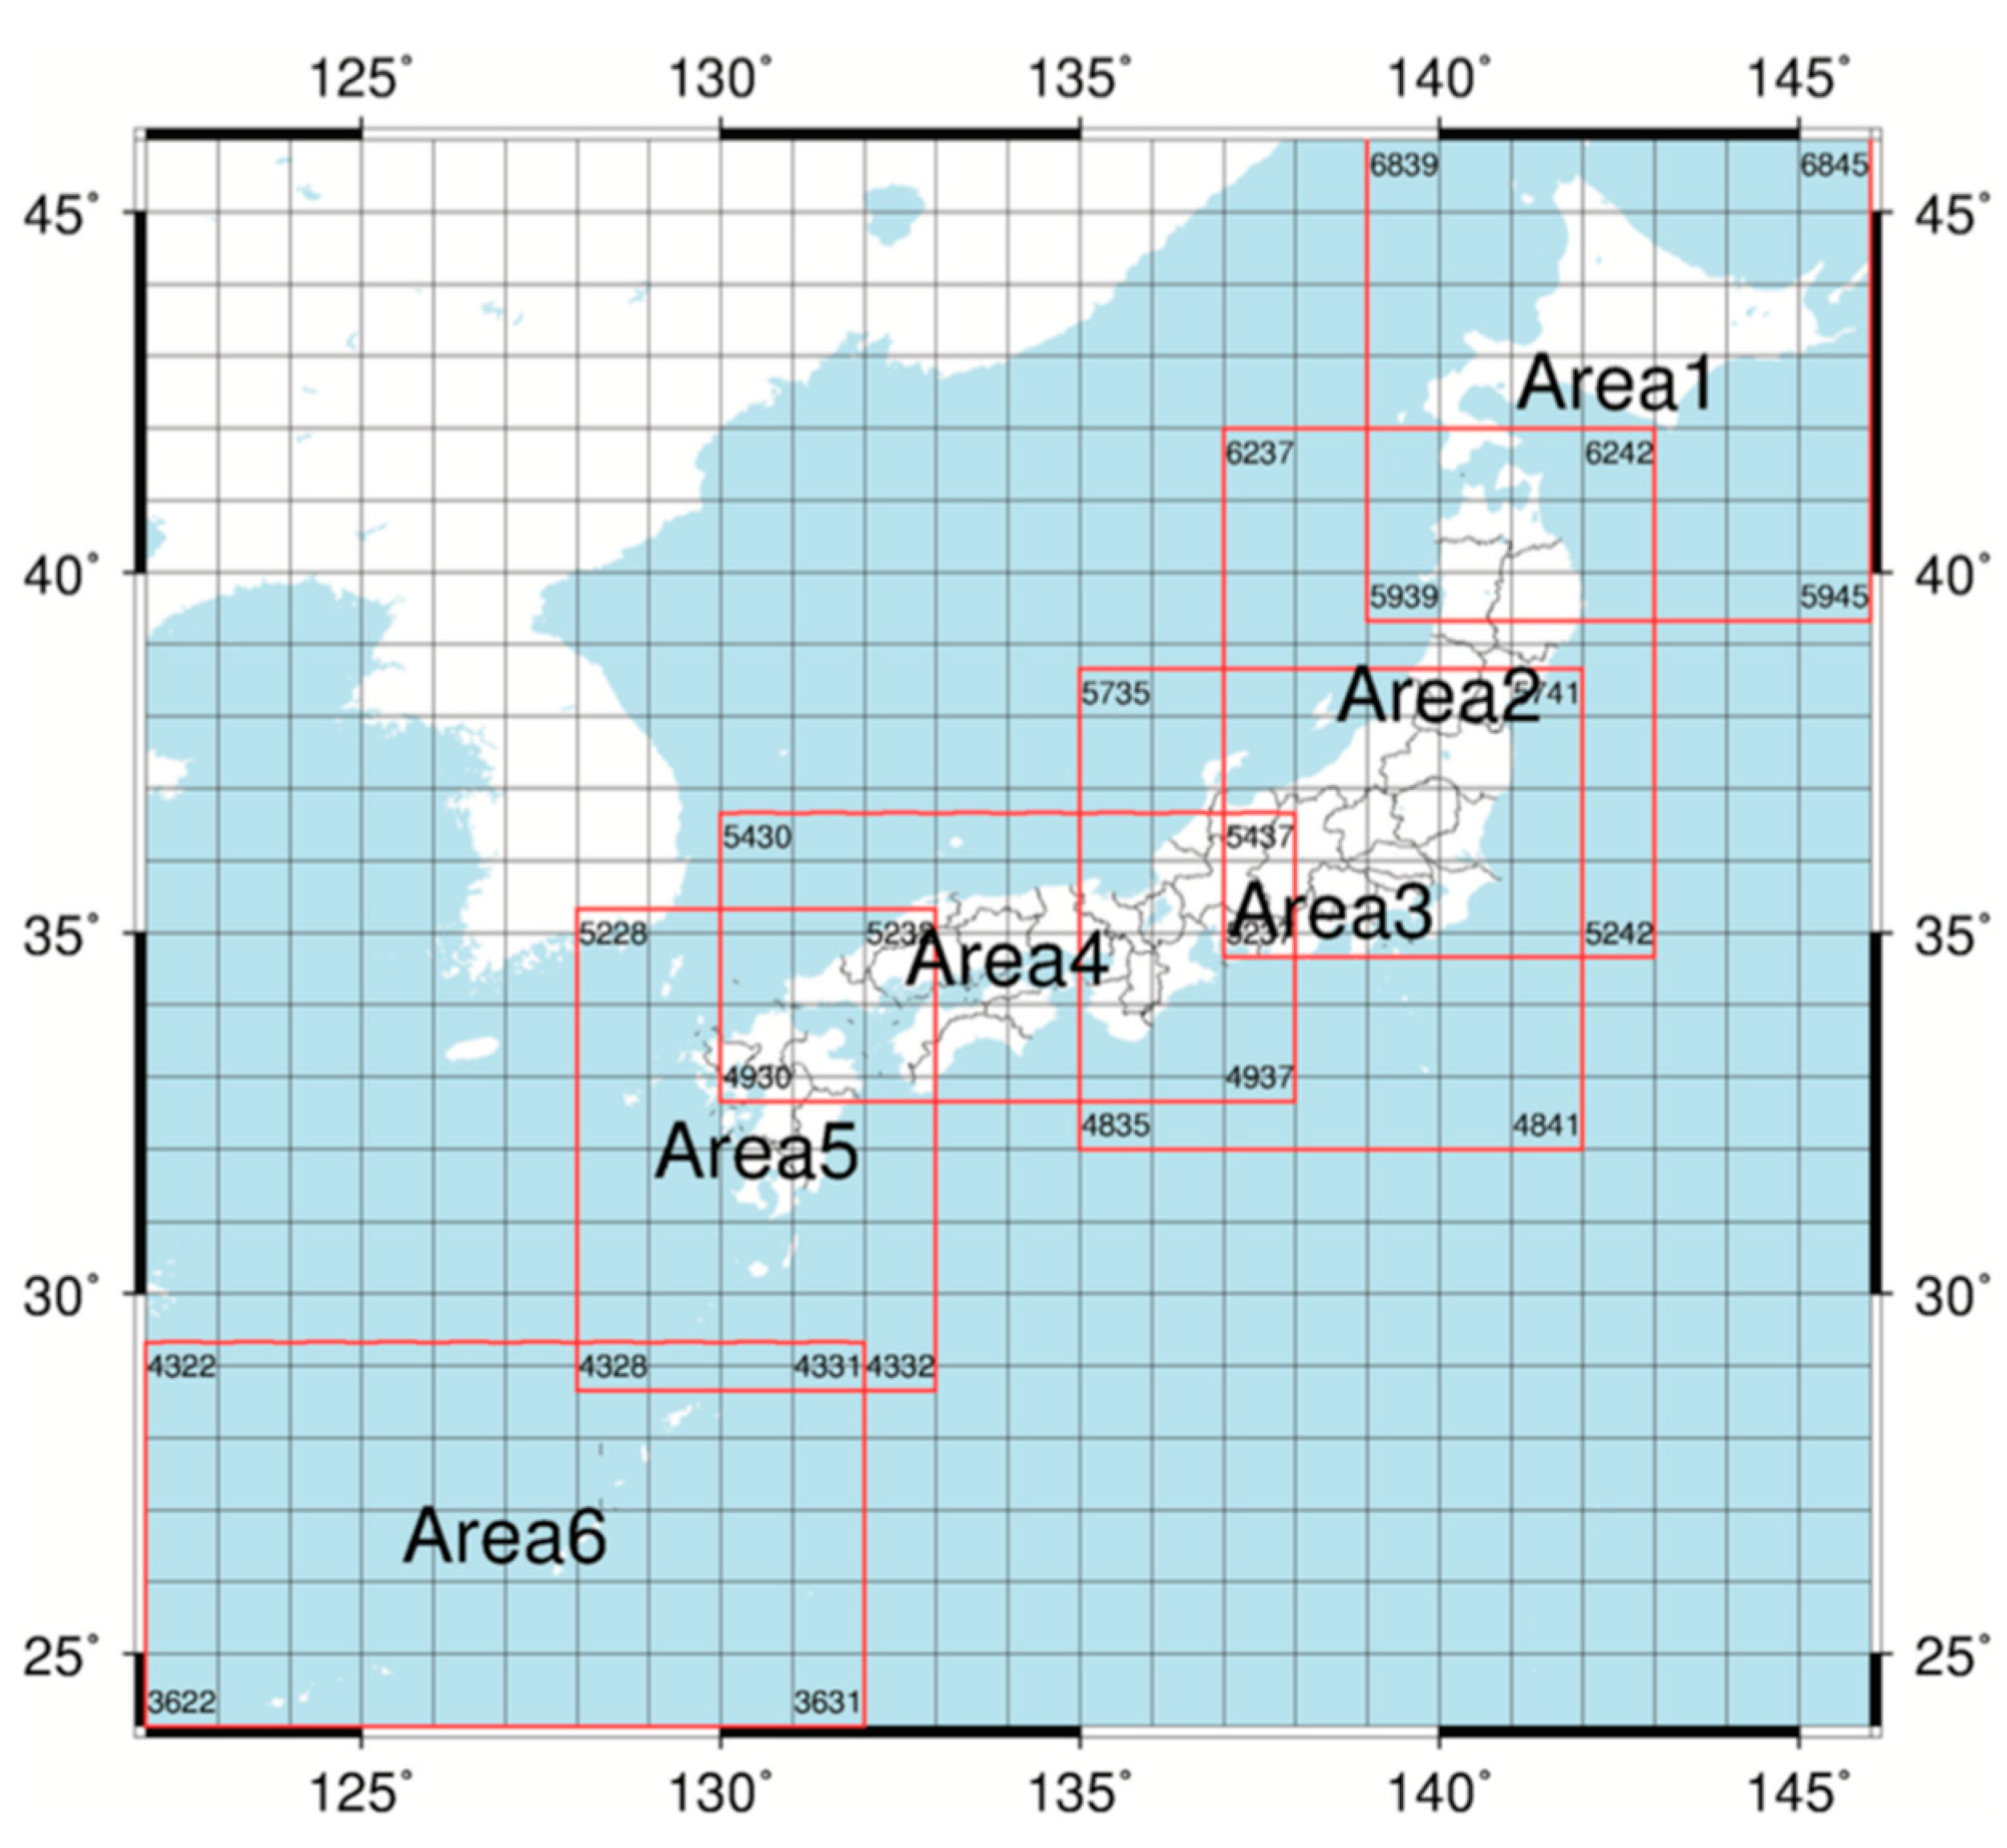
6]. AmGSD provides meteorological dataset at approximately 1-km resolution from 1980 to the present, and new weather data are updated every day. The data are available for the whole of Japan in six areas, as shown in
Figure 1.
Each grid contains nine daily meteorological variables, which are average air temperature, maximum air temperature, minimum air temperature, average relative humidity, sunshine duration, global solar radiation, downward long-wave radiation, precipitation and average wind speed. AmGSD uses Japanese third order mesh code that has an eight-digit integer defined by Japanese Industrial Standard JIS X0410. Land use information for each grid is provided by the National Land Information Division, MILT of Japan [
7].
The data are encoded in Network Common Data Form (NetCDF). Each file contains one year of daily data of a specific meteorological variable. The file is separately stored in the “Area/Year/Item” directory structure on their server. For example, maximum air temperature of Area 1 in the year 1980 is kept in /Area1/1980/AMD_Area1_TMP_max.nc. Metadata are recorded separately from data. For example, land use information is kept in the GEODATA NetCDF file in a separate directory.
Due to the complicated hierarchical structure and internal defined structure, it is not convenient for ordinary scientists and programmers themselves to access AmGSD and convert the data into point-based climate data.
NARO provides AMD_Tools for connecting and retrieving data from AmGSD. AMD_Tools is written in the Python programming language and available at NARO’s homepage [
1]. Even if AMD_Tools is provided, a user still needs an extra program for calling the AMD_Tools, as well as understanding the structure of the data and the coverage of each area.
2.3. IoT and Interoperable Sensor Network
Internet-connected devices and services have been growing rapidly. The concept of IoT is defined as a “global infrastructure for the information society, enabling advanced services by interconnecting (physical and virtual) things based on existing and evolving interoperable information and communication technologies" [
8]. Field sensor networks that collect data from various kinds of sensors in agricultural fields are considered as one of the IoT platforms. Consequently, according to IoT growth, protocol and data format become heterogeneous, which causes the problem of data exchanging and application development. To enable information interoperability among IoT devices and applications, the open standard web API plays an important role.
The Open Geospatial Consortium (OGC) is an international consortium established in 1994 that has been contributing geospatial interoperability, including sensor interoperability. According to the growing demand for information interoperability, OGC developed SWE (Sensor Web Enablement) for enabling sensors, transducers and sensor data repositories to be discoverable and accessible via the web [
9]. The main concept of SWE is to develop a global framework of standards that integrate diverse sensors and network technologies, then to achieve sensor network interoperability. The SWE framework includes, i.e., Sensor Model Language (SensorML), Observation and Measurements (O&M) and the web API named Sensor Observation Service (SOS).
2.4. Sensor Observation Service
SOS is a standard protocol and application program interface (APIs), which was adopted as an OGC standard in the SWE framework for accessing measured sensor observations and sensor metadata registered. Official OGC implementation specification Version 2.0 is available [
10]. Clients can obtain point weather data through the SOS API in the same format and mechanism even though data are from different data sources or structures. Once users experience SOS API, they can retrieve data from any source with SOS support. The same program can be reused without modification. SOS API assures the interoperability of point-based weather data in time series format.
The main objectives of SOS are accessing observed data in a standard way and being a mediator of data exchange and the sensor system while hiding the heterogeneous structure of sensor data formats and protocols. Three core operations required for SOS are:
1. getCapabilities: This operation allows clients to access metadata and a list of available operations on the SOS server. The request and response format is defined in [
11].
2. describeSensor: This is the operation for retrieving the metadata of physical sensors. Sensor Model Language (SensorML) is used for encoding sensor metadata [
12].
3. getObservation: This operation is for accessing observed data by allowing spatial, temporal and thematic filtering. The data are returned in O&M document encoding approved as an OGC standard, which is XML format [
11]. O&M is used for encoding data observed by sensors. The observation comprises timestamp, value, observed property and the feature of interest.
There are several examples of applications and services, which manage weather data and metadata, using SOS API, such as the agriculture service application [
13] and the crop simulation application [
14]. These applications have been providing information to farmers in Japan. They retrieve weather data from various kinds of sensors from various sources through the same program. The National Oceanic and Atmospheric Administration (NOAA) has been utilizing SOS API for providing weather data, such as in [
15].
SOS API is suitable as an intermediate layer for providing weather data to applications. A system can request metadata and data without knowing how the data are stored in the database, but just following the API specification. Applications do not need to prepare data accessing routines for each data source, which reduces the time and cost of programming [
16] demonstrated the efficiency of SOS in an agricultural application that accesses several different sensor systems.
The Ministry of Internal Affairs and Communications in Japan accepts SOS as one of the standard APIs for managing agro-environmental sensor data in agriculture [
17].
In this regard, we utilize AmGSD as the data source for providing point weather data to agriculture applications through SOS API. To seamlessly provide pointed climate data from the grid data source, several mechanisms are developed as described in the Methodology Section.
3. Methodology
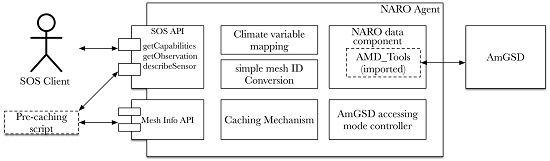
We develop a system named NARO Agent that works as an intermediate layer between AmGSD and the client. It translates gridded climate data into point-based data and then responds to clients’ requests through SOS API. NARO Agent absorbs the complicated structure of AmGSD with SOS API and internal components. NARO Agent consists of several components, as shown in
Figure 2. Each component supports each other to provide sufficient SOS API for agricultural applications. To efficiently serve data for agricultural applications, several internal components, such as caching, mesh system conversion, controlling multi-process and threading access modes, are implemented.
NARO Agent is written in Python programing language in the Flask framework [
17]. It has been deployed on Conoha [
18], an OpenStack cloud platform, for easy maintenance, scalability and future migration purposes.
The detail of each component is described consequently as follows.
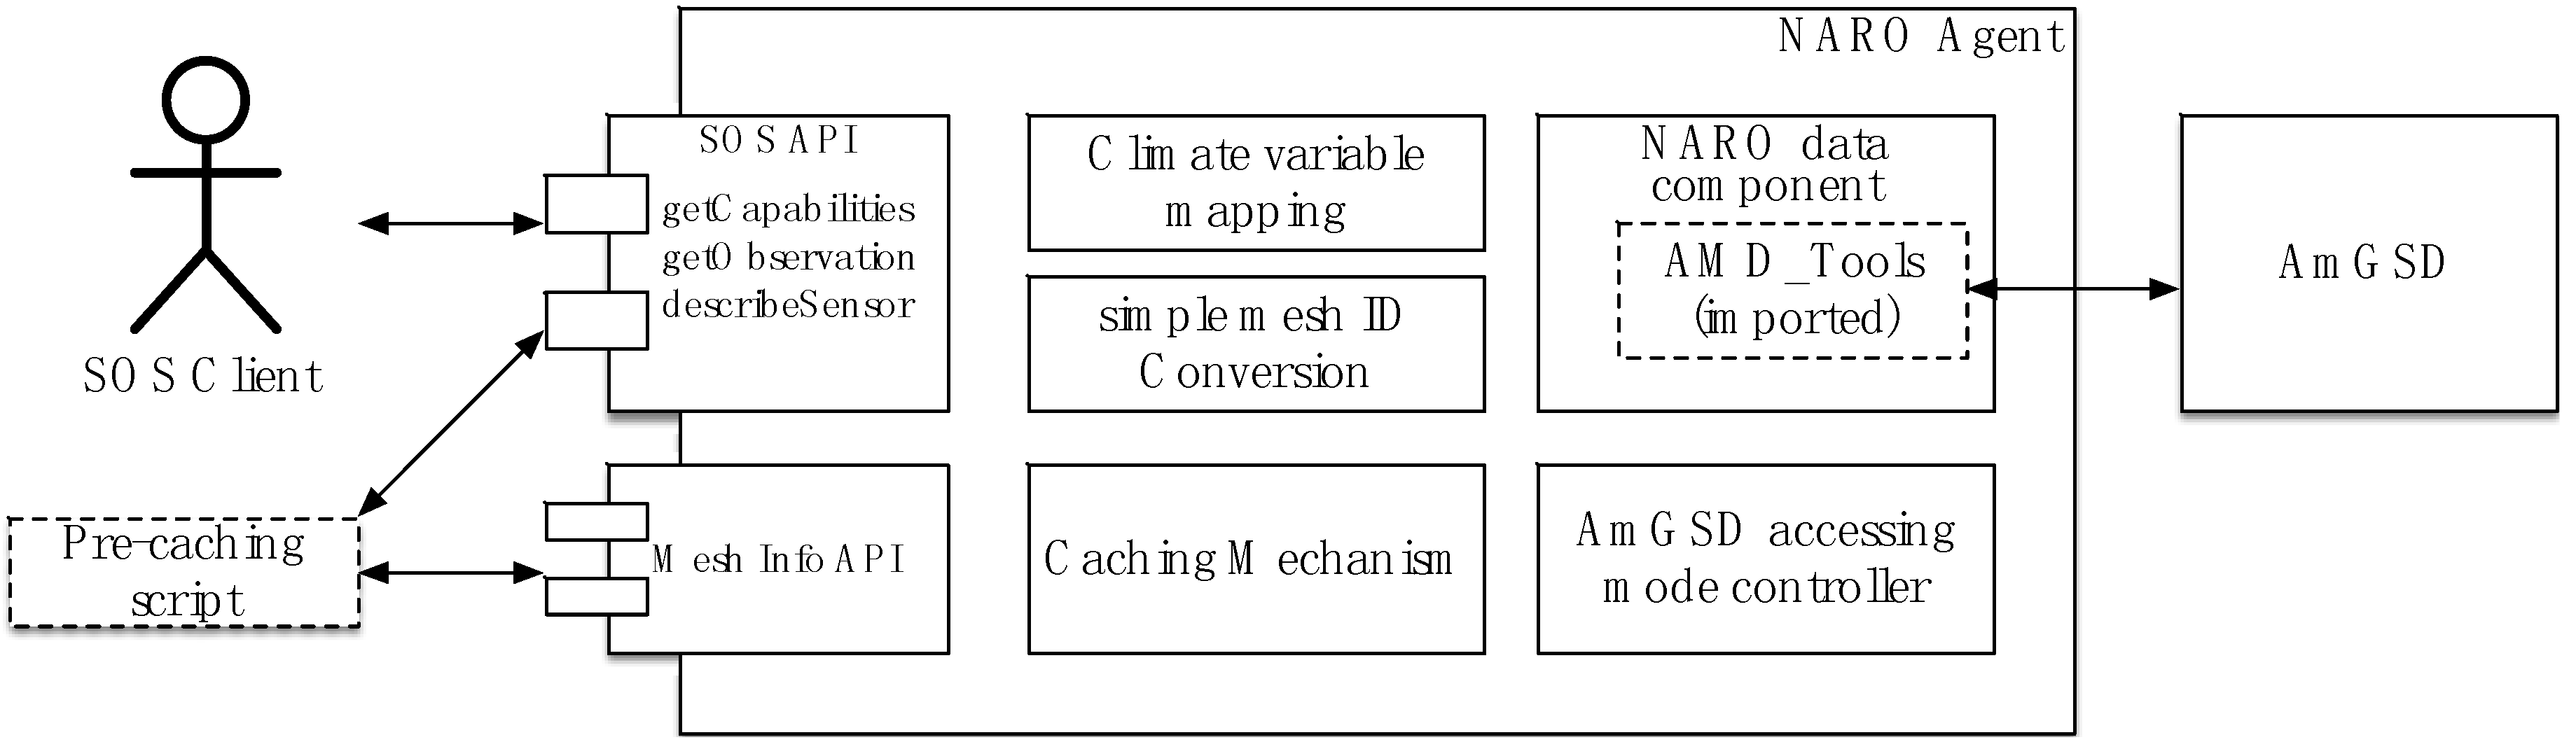
3.1. NARO Data Component
The NARO data component is for managing the internal data of the NARO Agent system. It also works on retrieving data from AmGSD. The NARO data component imports AMD_Tools for retrieving data from AmGSD.
Figure 3 demonstrates the data flow from AmGSD to a client and how the NARO data component processes the data. When there is a request from a client, the NARO data component calls the getData function of AMD_Tools for retrieving data, and then, the data are returned to AMD_Tools in an array format. The NARO data component converts the data array into a CSV file, which is the internal data model used for caching. Later, the data are converted into SOS format and returned to the client.
A client only issues a getObservation request to SOS API of NARO Agent; then, it can receive a response. The client does not need to know the data structure of AmGSD and the functions of AMD_Tools. Request and response are independent of programming language. A client only needs to know the specification of SOS API and the service endpoint.
3.2. AmGSD Accessing Mode Controller
AmGSD has a structured four items for 30 years; the NARO Data component calls AMD_Tools; then, AMD_Tools accesses 120 NetCDF files of AmGSD in a sequence. AMD_Tools combines data into one piece and then returns to the NARO data component. This process takes a long time. To improve response time, we develop three accessing mode controllers for issuing a request to AmGSD as follows.
3.2.1. The Single-Process Accessing Mode
This mode is to call one getData request of AMD_Tools for a whole period, for example 30 years, from AmGSD. This mode as explained above consumes the least memory and CPU, but the response is slow.
3.2.2. The Multi-Process Mode
This mode is to run a requesting process for each element of each year for one request. For example, when a client requests four climate variables for ten years of data, then the NARO data component will generate 40 processes. Each process calls the getData function of AMD_Tools for retrieving the data of one climate variable for one year. After AMD_Tools returns the data of each climate variable for each year, the NARO data component combines each year’s data into one piece, which contains four climate variables of ten years of data, and then returns this to the client. This mode consumes high memory and CPU, but gives the best response time. The maximum number of processing is set to 120 processes to allow users to access a 30-year time span of four climate items. This number was decided by the memory available on our server, which is 1 GB. For instance, a user requests 30 years of 5 climate variables; the number of process is 150, which exceeds the maximum processing. Due to the request exceeding the maximum number of process, the exception message, “The number of properties and year (30 × 5) exceeds the maximum (120). Reduce either”, is given in response. The admin can optimize the number of processes regarding the hardware availability and user requirement.
3.2.3. The Multithread Mode
This mode is similar to multi-process mode, but generates threads instead of complete processes. If a user requests four meteorological variables for ten years, 40 threads are generated for retrieving the data. The CPU and memory load of a thread are lighter than those of a process; thus, we allow users to request all nine variables for the whole observation period.
3.3. Simple Mesh ID Conversion
As for each grid, AmGSD internally uses a mesh ID system that follows the Japanese public third order mesh ID [
7]. This Japanese ID system requires rather complicated calculation to encode latitude and longitude or to decode the mesh ID into latitude and longitude. To simplify encoding and decoding on latitude and longitude into the mesh ID, we implement a simple mesh ID equation.
Equation:
where:
latitude is the latitude of the target grid in degrees
longitude is the longitude of the target grid in degrees
lat0 = 24; lowest latitude of AmGSD coverage in degrees
lon0 = 122; lowest longitude of AmGSD coverage in degrees
Δlat = 30; grid spacing of AmGSD in latitude in arcseconds
Δlon = 45; grid spacing of AmGSD in longitude in arcseconds
Clients can filter data within the grid of interest by specifying the simple mesh ID to retrieve data instead of using a bounding box. We use the Uniform Resource Name (URN) concept to refer to AmGSD and each grid in SOS. Concatenation of the procedure name and the simple mesh ID indicates the specific grid for querying data, as described in
Table 1. For instance, a user wants to retrieve climatological data of farms that are located on or around latitude 42.8 and longitude 143.2. By referring to the area in the mesh, the location in the latitude and longitude is converted to the simple mesh ID. In this case, the simple mesh ID is 22561696. To filter data within this mesh, the URN is urn:NARO1km:Agro:22561696. Additionally, this URN is a filter parameter for offering the tag in the getObservation request, which is described in
Section 3.5.3. If clients want to use a bounding box for filtering grids, clients should use a bounding box that has two identical points, which is equivalent to a single coordinate.
3.4. Meteorological Variable Mapping
SOS API publishes the available observedProperty in the SOS response to inform clients of the data availability. The names of the climate variable of AmGSD are mapped to the observedProperty of SOS. These observed properties are published for securing the interoperability of climate data. observedProperty is also used as a filtering parameter in querying data through SOS API.
Climate variables of AmGSD are named internally. To understand the meaning of each name, clients have to go through the AmGSD manual. From the viewpoints of clients, the names published need to be comprehensible by humans and machines, so that data flow can be done automatically and smoothly.
We proposed a naming concept of agro-environmental elements, and the Japanese government declared it as a standard guideline, which is available on their website [
17]. According to the guideline, the meteorological variables are renamed to be self-descriptive names, as shown in
Table 2. Clients can clearly understand the property of the data without going through specification of AmGSD. These names are used in SOS API for publishing and filtering services.
3.5. SOS API
To ensure interoperability, NARO Agent provides sensor data and metadata through SOS API conforming to OGC SOS 2.0. Three core operations of SOS, getCapabilities, getObservation and describeSensor, are implemented. The list of APIs and their documents is available at
http://133.130.90.193/static/index.html. We applied the IP restriction to the API according to the NARO requirement for user registration to access data.
As mentioned above that the structure of AmGSD is keeping data based on area, year and a climate item, while SOS is based on the observed property in a time series structure. To simultaneously provide point time series data in SOS API while maintaining grid information, the climate variable of AmGSD is mapped to the observedProperty of SOS as mentioned in
Table 2. AmGSD is considered as a sensor platform, which performs the observations. AmGSD is named as urn:NARO:AgroWeatherMesh, which refers to the whole system and covers all grids. A specific grid can be referred to by the simple mesh ID as described in
Table 1 or by a bounding box that is equivalent to a single coordinate.
We implement SOS API, which supports the HTTP GET and POST methods. For the GET method, a user can request data by specifying the service endpoint of each service. For the POST method, a user has to send an XML request for processing each operation. Each operation is described separately as follows:
3.5.1. getCapabilities
Clients can ask for available services of urn:NARO:AgroWeatherMesh by issuing getCapabilities request to the service endpoint. The service endpoint of getCapabilities is [
19]. An example of an XML request is available at [
20].
Table 3 represents the request’s parameter of getCapabilities. The response is the information of the available observedProperty and data availability in temporal and spatial dimensions. The metadata of the data source can be obtained from the getCapabilities operation.
The response of getCapabilities request is in XML encoding. Some part of the response is represented as follows.
<swes:offering>
  <sos:ObservationOffering>
    <swes:description>Agro-Meteorological Grid Square Data System</swes:description>
  <swes:identifier>urn:NARO:AgroWeatherMesh</swes:identifier>
    <swes:name>Chubu University</swes:name>
	   <swes:procedure>urn:NARO:AgroWeatherMesh</swes:procedure>
    <swes:observableProperty>daily_average_air_temperature</swes:observableProperty>
	   <swes:observableProperty>daily_maximum_air_temperature</swes:observableProperty>
    <swes:observableProperty>daily_minimum_air_temperature</swes:observableProperty>
    <swes:observableProperty>daily_average_relative_humidity</swes:observableProperty>
    <swes:observableProperty>daily_sunshine_duration</swes:observableProperty>
    <swes:observableProperty>daily_global_solar_radiant_exposure</swes:observableProperty>
    <swes:observableProperty>daily_downward_longwave_radiant_exposure</swes:observableProperty>
    <swes:observableProperty>daily_precipitation</swes:observableProperty>
    <swes:observableProperty>daily_average_wind_speed</swes:observableProperty>
    <sos:observedArea>
      <gml:Envelope srsName="http://www.opengis.net/def/crs/EPSG/0/4326">
        <gml:lowerCorner>24.0 122.0</gml:lowerCorner>
        <gml:upperCorner>46.0 146.0</gml:upperCorner>
      </gml:Envelope>
    </sos:observedArea>
    <sos:phenomenonTime>
      <gml:TimePeriod gml:id="phenomenonTime0">
         <gml:beginPosition>1980-01-01T00:00:00+0900</gml:beginPosition>
         <gml:endPosition>2016-04-24T00:00:00+0900</gml:endPosition>
      </gml:TimePeriod>
    </sos:phenomenonTime>
  </sos:ObservationOffering>
</swes:offering>
|
The above response means nine of the observedProperty are available for requesting. The coverage area of the service is within 24.0 122.0 and 46.0 146.0, and the data are available from 1st January 1980 until 24th April 2016. According to the getCapabilities response, clients can filter data on the getObservation operation.
3.5.2. getObservation
For retrieving data, clients issue the getObservation request to a service endpoint of the getObservation operation, which is published at [
21]. An example of an XML request is available at [
22]. Clients can filter data based on the observedProperty item and the temporal and spatial dimension shown in
Table 4. Clients define the grid of interest by setting the simple mesh ID in the offering parameter.
When clients request long-term data, such as a 35-year period, for the first time, it will take a long time to respond and transfer those data to clients. Once a grid is accessed, data are cached in NARO Agent. The “external” parameter is provided for requesting data and asking for the response in a link to the CSV file, which contains the data. The data are not directly transferred to clients. Clients only receive a temporal link, which points to the CSV data.
The response of the HTTP POST method is the O&M document by default. The value of the observed property is represented in the value tag with the time sequence.
3.5.3. describeSensor
Clients issue describeSensor requests in order to obtain the metadata of the platform. The service endpoint is published at [
23]. The SOS parameter is for defining the response encoding either SensorML or JSON. Parameters for requesting metadata from describeSensor are available in
Table 5.
An example of an XML request is available at [
24]. The response of the HTTP POST method is the SensorML document by default.
3.6. Mesh Info API
AmGSD provides a proportion of the land use class of each grid as a percentage. There are eleven land use classes, as shown in in
Table 6.
This information can be used as a filter parameter in order to provide data for agriculture purposes. Moreover, it can be used to enhance response performance. Based on the given information, we developed the Utilities API, which allows clients to query data, for which the parameters are mentioned in
Table 7, which included latitude, longitude, land use, threshold and sort. Mesh Info API supports only the HTTP GET method. The Mesh Info API is shown in the [Utility] section at [
25].
Sort is for accessing frequency and timestamp. The Mesh Info API will filter the grid ID within given parameters. The threshold is applied to limit the storage usage, so that it will not exceed the plan.
3.7. Caching Mechanism
The total Japanese territory is 377,972 km
2, while the NetCDF mesh count is 2,457,600 meshes. The total area of farmland in Japan is 4.5 million hectares, which is equivalent to 45,000 km
2 [
26]. We cannot simply store all data on the cloud platform, as this requires huge disk space and leads to expensive system maintenance.
Referring to the cloud platform pricing list at
https://www.conoha.jp/en/pricing, we focus on a basic plan, which is 1 GB of RAM, 2 cores of CPU and 50 GB of storage. One fifth of the storage is used for operation, and the rest is for the caching system.
Each time when NARO Agent responds to an SOS getObservation request, the simple mesh ID is recorded, and the data are cached in the system. The grids in the cache system are updated every day because we expect that users may frequently access the same grids. The access timestamp and frequency are recorded whenever users access them, so that we can dynamically optimize the caching system. When the amount of cached data exceeds the threshold, the grids that have seldom been accessed will be removed from the cache. In this way, the agent can respond quickly to often-accessed grids with no need to keep all data.
According to the AmGSD land use information of each grid, we utilize this information for initializing the most efficient cache by identifying grids to be pre-cached in the system with criteria based on land use status and prefecture.
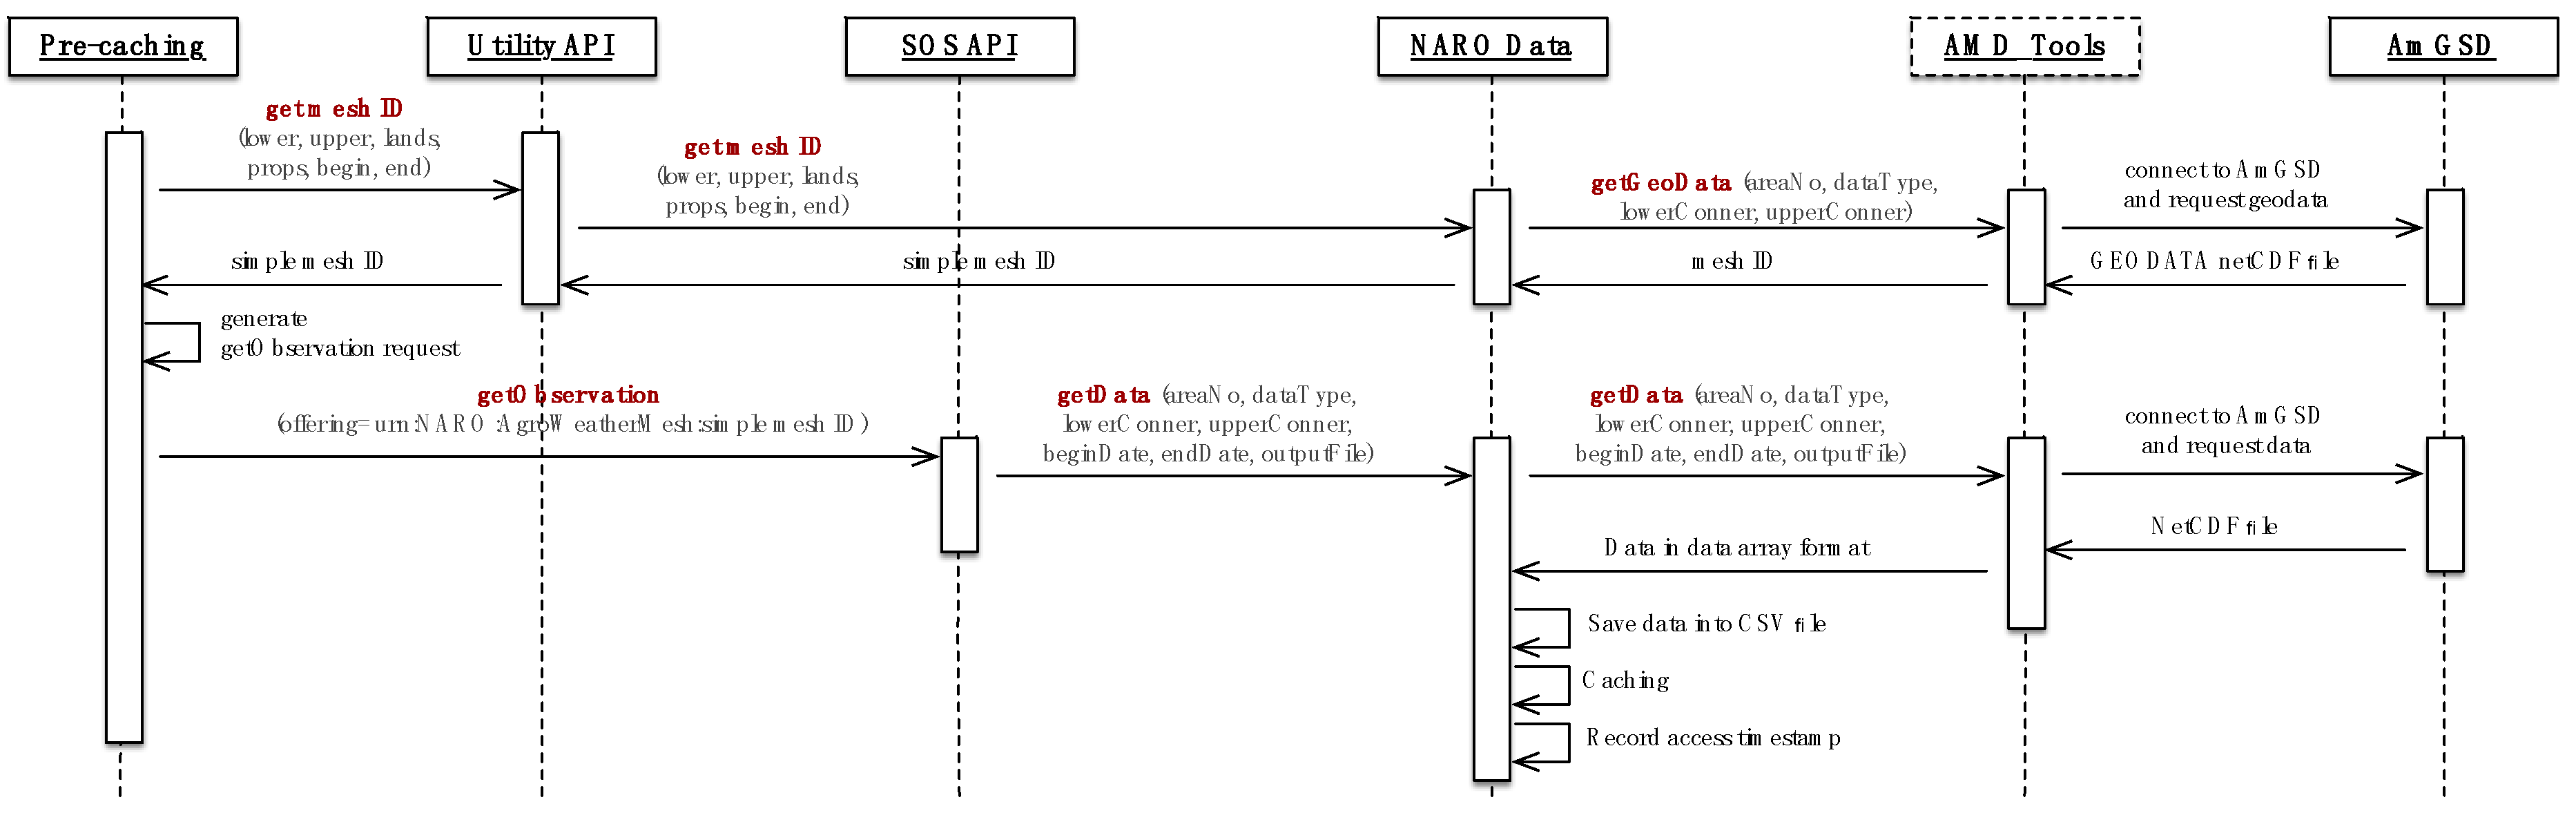
Pre-Caching Mechanism
The caching system explained in the previous section improves the response time from the second access. To maximize the response from the first access, we introduced a pre-caching mechanism. We developed this system primarily for agriculture applications. Therefore, we expected that most grids that are accessed will be in farmland. Before starting the SOS API service, we developed a pre-caching script. The script issued the getObservation request to grids that would have a high frequency of access to register them into the caching system. The grids to be pre-cached were selected based on land use and prefecture. We identified and counted grids that had an agricultural land use ratio greater than a certain threshold.
This research is a part of an agricultural project that mainly focuses on rice cropping in Aichi prefecture. Thus, grids within Aichi prefecture that contain paddy fields of more than 20 percent are cached into the system before the clients’ requests. We utilize Mesh Info API for retrieving grids that correspond to the given parameters, as shown in
Table 8.
The curl command for requesting the simple mesh ID is as follows.
   curl -X GET --header 'Accept: application/json'
   'http://133.130.90.193/api/util/mesh?lower=34.573540%20136.671033&upper=35.424788%20137.83
   8116&landuse=landuse H210100&ratio=20'
An example response of a grid that corresponds to the conditions is presented as follows:
    {
     "cached": 0,
     "center": "34.5833333333 137.025",
     "date": "",
     "frequency": 0,
     "id": "51377002",
     "landuse": "landuse_H210100",
     "percent": "27.0",
     "simpleID": "12701202",
     "timestamp": 0
    }
The information shows that the grid, simple mesh ID 12701202, contains 27 percent of paddy field. The number of grids, which contain more than 20 percent of paddy field in Aichi prefecture, was counted as 1471.
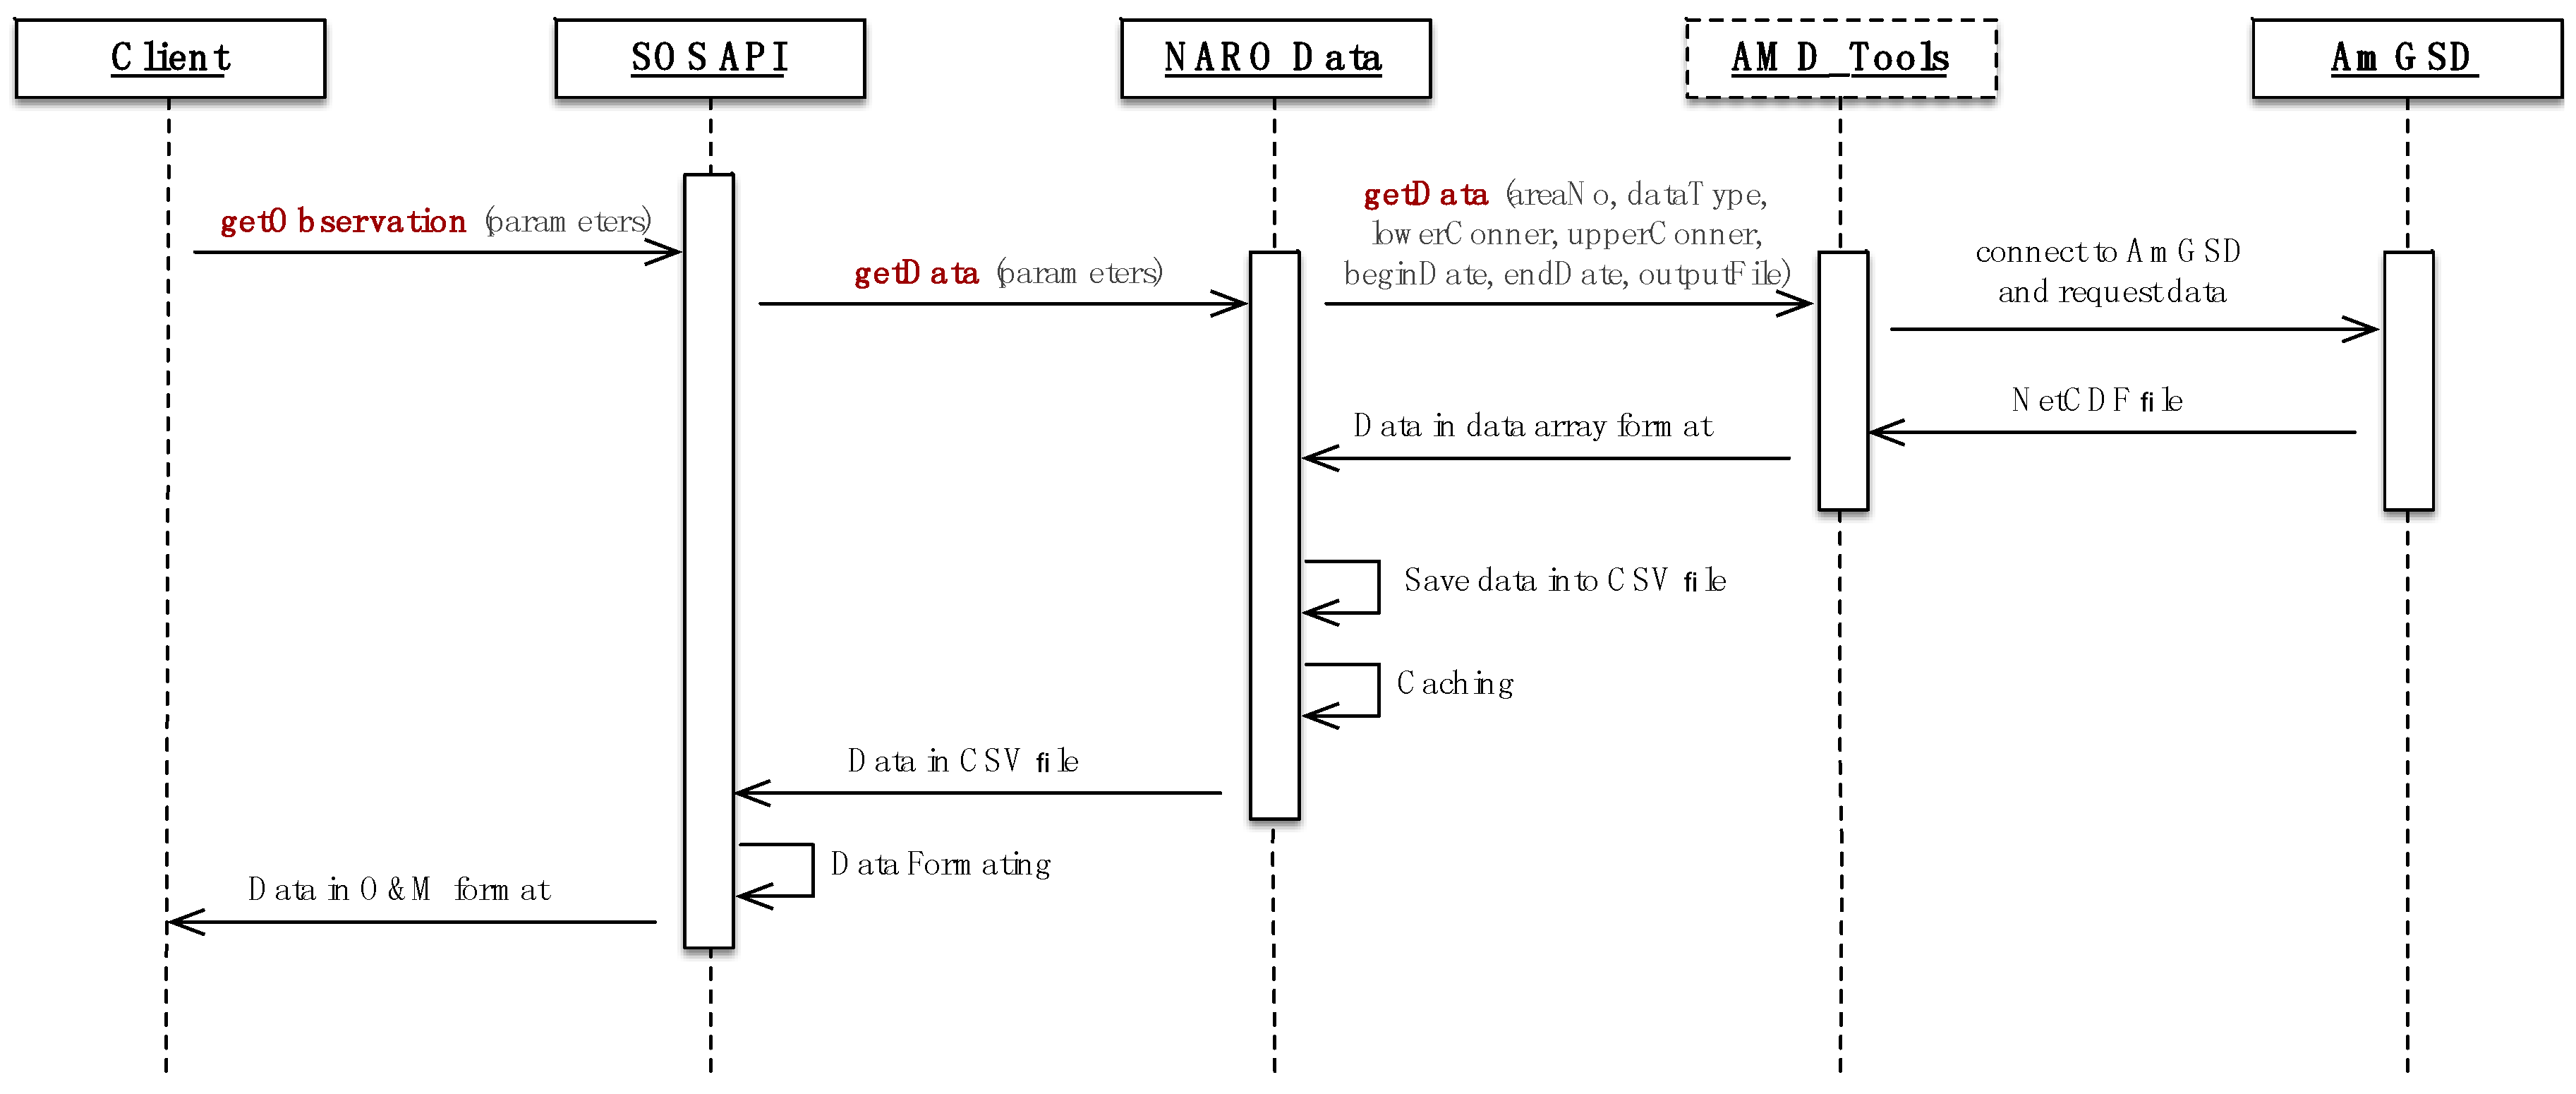
After receiving the list of grids, getObservation is issued for requesting the data of those grids. The sequence of data and reaction of each component is described in
Figure 4.
This mechanism enhances the response time even for the first request in the study area. With pre-caching, the first request in the study area ensures response performance. The pre-caching mechanism can be expanded to other areas based on disk space and the admin’s decisions.
4. Evaluation of SOS API Performance
We evaluated the performance of NARO Agent by setting up realistic accessing scenarios, which is considered as a requirement to support agricultural applications. The scenarios were tested to measure the response time, as well as to evaluate the contribution of the accelerating mechanism implemented internally.
The characteristics of accesses from actual applications vary. Some applications may require only a single climate variable for one year or a lesser time period. Other applications require several items for a long-term period. Some applications need a good response time for further processing. For example, the development of the weather generator as a web service [
27] requires four meteorological variables as long-term climatological data in the range of several tens of years for generating weather scenarios in a targeted area. This application requires not only long-term data, but also a good response time for further processing. Crop models such as DSSAT [
28] and ORYZA [
29] require daily data of four climate variables, namely maximum temperature, minimum temperature, solar irradiance and precipitation for simulating crop growth.
With regard to the actual requirement of agricultural applications, we define conditions for testing the performance of our mechanism as follows.
4.1. Targeted Area
The point for retrieving data is longitude = 137.0854 and latitude = 35.1113. This is the location of the experimental farm in the study area.
4.2. Meteorological Variable
The number of meteorological variable requested in the scenarios is one and four. For one element, we use daily_average_air_temperature. For four elements, we use daily_minimum_air_temperature, daily_maximum_air_temperature, daily_precipitation and daily_sunshine_duration.
4.3. Data Range
There are two types of data ranges, one year and 30 years. For the one-year range, the request is between 1st January 2015 and 31th October 2015. For the 30-year range, the request is between 1st January 1986 and 31th October 2015.
4.4. Accessing Mode Control
There are three accessing modes for testing, single-process, multi-process and multithread.
4.5. Caching Status
There are two conditions of caching a request: yes and no.
The responses of a one-year range of one-element in
Table 9 show a similarly good result in any accessing mode and caching status condition. As the challenge of this research is to provide long-term data with multi-meteorological variables, we then tried requesting a 30-year range with four meteorological variables. The responses of requesting data without caching on single- and multi-thread mode are very slow. The slow responses were caused by the structure of AmGSD, which stores each climate variable of each year separately. This means that 120 NetCDF files of AmGSD are read and then returned to NARO Agent. Under multi-processing mode, the response time reduces to 91.882 s, an improvement of 86 percent. The multi-processing mode is therefore a practical option for this structure. From the viewpoint of a service provider, the optimization of the response performance and CPU load can be done by setting a maximum number of processes depending on the number of available CPUs. In our case, we set the maximum processing number to 120 processes as mentioned in the AmGSD accessing mode. The multi-processing is set as the default for providing the service.
The response with caching of all scenarios shows a similar time, between 0.6 and 1.6 s, which is in the acceptable range for users based on the response time guideline from the information visualizer [
30]. Response performance is significantly improved by the combination of caching and the multi-process implementation.
5. Result and Discussion
In this research, a grid climatological data source, AmGSD, is wrapped and exposed through a standard web service, SOS API. Connecting AmGSD to SOS API can expand the usability of AmGSD, while agricultural applications have more options to receive point-based climatological data throughout Japan from 1980 to the present. Supported by a Japanese national agricultural project, we are developing an application that visualizes the impact of weather variabilities on cropping yield at the farm scale by utilizing AmGSD data through our SOS API. It retrieves 30 years of climatological data to generate hundreds of weather scenarios that visualize the variability of possible future weather. Then, the scenarios are inputted to a crop model for simulating cropping yield, as well as generating a distribution of expected yields that indicates the impact of the weather variability on the yield. SOS API demonstrates the ability to simplify data retrieval as the complicated heterogeneous data source and the data format are hidden behind the SOS API. As a result, agriculture applications can easily query data through SOS API and obtain point-based time series data by issuing getObservation. Developers do not need to spend time on learning a proprietary structure of a data source and a data format one by one. The benefit of retrieving data through SOS API provides the same data accessing mechanism no matter whether it is a gridded climate data source or a point-based data source. In this regard, the data fusion of a gridded climate and a point-based weather data source can be easily implemented in agricultural applications. Data availability in terms of coverage and temporal scale will be broader. This means that agricultural applications will have more data sources to utilize. SOS API compliance with the international standard ensures interoperability between gridded climate data and point-based data. Our mechanism contributes to the agricultural society by providing a standard API for obtaining climate data, introducing a mechanism that can be applied to meteorological sources to improve data-providing services and make the development of agricultural applications much more convenient.
The coverage of the data source in this research is only in Japan; however, similar mechanisms can be applied to a global-scale gridded climate data source. Accordingly, SOS API is the international standard and globally used in various sectors, not only in agriculture, but also in environmental monitoring, such as terrestrial environmental observatories [
31] and disaster warning systems, such as the Sensor-based Landslide Early Warning System (SLEWS) [
32].
One of the further developments is implementing SOS API authentication based on a user key rather than an IP restriction, so that SOS API can be an easier interface to other data sources based on each data source’s accessing policy. User access history can be recorded, which can be used for analyzing the user of interest. On the top of SOS API, we are implementing automatic wiring data sources with SOS API for weather generator models, then SOS API can be used to invoke the model and retrieve simulated future data based on historical data.
Acknowledgments
This research is partly supported by the Cabinet Office, Government of Japan, Cross-ministerial Strategic Innovation Promotion Program (SIP), "Technologies for creating next-generation agriculture, forestry and fisheries" (funding agency: Bio-oriented Technology Research Advancement Institution, NARO). NARO gives permission to use AmGSD in this research. We thank Amor V. M. Ines for reviewing the preliminary version of this paper.
Author Contributions
R.C. and K.H. conceived, designed and implemented the system; R.C. evaluated the system; R.C. wrote the paper; K.H. reviewed the draft.
Conflicts of Interest
The authors declare no conflict of interest.
References
- Ohno, H. User’s manual of the Agro-Meteorological Grid Square Data, NARO/CRARC. Miscellaneous Publ. NARO Agric. Res. Center 2014, 9, 1–77. [Google Scholar]
- Iizumi, T.; Ramankutty, N. How do weather and climate influence cropping area and intensity? Glob. Food Secur. 2015, 4, 46–50. [Google Scholar] [CrossRef]
- Murthy, V.R.K. Crop Growth Modeling and its Applications in Agricultural Meteorology. Satell. Remote Sens. GIS Appl. Agric. Meteorol. 2011, 236, 235–261. [Google Scholar]
- Hollinger, S.E.; Angel, J.R. Weather and Crops. In Illinois Agronomy Handbook, Illinois, Illinois Agronomy Handbook; Illinois College of Aces: Chicago, IL, USA, 2013. [Google Scholar]
- White, D.H.; Howden, S.M. Soils, Plant Growth and Crop Production; EOLSS Publishers Co Ltd.: Gent, Belgium, 2010; Volume 1. [Google Scholar]
- Ohno, H.; Sasaki, K.; Ohara, G.; Nakazono, K. Development of grid square air temperature and precipitation data compiled from observed, forecasted, and climatic normal data. Clim. Bioshere 2016, 16, 71–79. [Google Scholar] [CrossRef]
- National Land Information Division, MILT of Japan. National Land Numerical Information Download Service. Available online: http://nlftp.mlit.go.jp/ksj/old/old_data_mesh.html (accessed on 8 May 2016).
- ITU. Telecommunication Standardization Sector of ITU. In Proceedings of Series Y: Global Information Infrastructure, Internet Protocol Aspects and Next-generation Networks, Geneva, Switzerland, 15 June 2012.
- Percivall, G. Sensor Web Enablement (SWE). Available online: http://www.opengeospatial.org/ogc/markets-technologies/swe (accessed on 13 July 2016).
- Open Geospatial Consortium. OGC Sensor Observation Serice Interface Standard. 20 April 2012. Available online: http://www.opengis.net/doc/IS/SOS/2.0 (accessed on 20 June 2016).
- Open Geospatial Consortium. Observations and Measurements (O&M). 2016. Available online: http://www.ogcnetwork.net/om (accessed on 27 April 2016).
- Open Geospatial Consortium. Sensor Model Language (SensorML). 2016. Available online: http://www.opengeospatial.org/standards/sensorml (accessed on 20 June 2016).
- Honda, K.; Yui, A.; Ines, A.V. FieldTouch: An Innovative Agriculture Decision Support Service Based on Multi-scale Sensor Platform. In Proceedings of Annual SRII Global Conference, San Francisco, CA, USA, 23–25 April 2014.
- Chinnachodteeranun, R.; Honda, K.; Ines, A.V. Web-Based Wheat Simulation by DSSAT on Sensor Observation Service Standard API. In Proceedings of SICE Annual Conference, Hangzhou, China, 28–30 July 2015.
- National Oceanic and Atmospheric Administration. IOOS Sensor Observation Service (SOS). 2016. Available online: http://sdf.ndbc.noaa.gov/sos/ (accessed on 25 April 2016). [Google Scholar]
- Honda, K.; Ines, A.; Akihiro, Y. Agriculture Information Service Built on Geospatial Data Infrastructure and Crop Modeling. In Proceedings of International Workshop on Web Intelligence and Smart Sensing, Saint Etienne, France, 1–2 September 2014.
- Prime Minister of Japan and His Cabinet. Guideline for the data element in agricultural IT System. Available online: http://www.kantei.go.jp/jp/singi/it2/senmon_bunka/nougyou.html (accessed on 20 June 2016).
- Armin, R. Flask Framework. Available online: http://flask.pocoo.org (accessed on 2 May 2016).
- GMO Internet. Conoha. Available online: https://www.conoha.jp/en/ (accessed on 6 May 2016).
- Chinnachodteeranun, R.; Honda, K. GetCapability of NARO Agent API. Available online: http://133.130.90.193/api/sos/getcapabilities (accessed on 5 June 2016).
- Chinnachodteeranun, R.; Honda, K. Example of getCapability request. Available online: http://133.130.90.193/static/sosxmls/GetCapabilities.xml (accessed on 5 June 2016).
- Chinnachodteeranun, R.; Honda, K. GetObservation of NARO Agent API. Available online: http://133.130.90.193/api/sos/getobservation (accessed on 1 June 2016).
- Chinnachodteeranun, R.; Honda, K. Example file of getObservation. Available online: http://133.130.90.193/static/sosxmls/GetObservation.xml (accessed on 10 June 2016).
- Chinnachodteeranun, R.; Honda, K. DescribeSensor of NARO Agent API. Available online: http://133.130.90.193/api/sos/describesensor (accessed on 10 June 2016).
- Chinnachodteeranun, R.; Honda, K. Example file of requesting describeSensor. Available online: http://133.130.90.193/static/sosxmls/DescribeSensor.xml (accessed on 2 June 2016).
- Chinnachodteeranun, R.; Honda, K. Utilities Section of NARO Agent API. Available online: http://133.130.90.193/static/index.html#!/Utilities/get_api_util_mesh (accessed on 30 July 2016).
- Ministry of Agriculture, Forestry and Fisheries. Statistics On Agricultural Land In Japan. Available online: http://www.maff.go.jp/j/tokei/sihyo/data/10.html (accessed on 21 April 2016).
- Chinnachodteeranun, R.; Hung, N.D.; Kiyoshi, H. Designing dynamic binding framework for weather generator web service. IETCE Tech. Rep. 2015, 115, 155–156. [Google Scholar]
- Hoogenboom, G.; Jones, J.; Wilkens, P. Decision Support System for Agrotechnology Transfer (DSSAT) Version 4.6. Available online: http://dssat.net (accessed on 22 June 2016).
- Bouman, B.; Kropff, M.; Tuong, T. ORYZA2000: Modeling Lowland Rice, Version 2.13 ed.; Hardy, B., Ed.; International Rice Research Institute: Wageningen, Netherlands, 2009. [Google Scholar]
- Card, S.K.; Robertson, G.G.; Mackinlay, J.D. The information visualizer: An information workspace. In Proceedings of ACM CHI’91 Conference, New Orleans, LA, USA, 28 April–5 June 1991.
- Devaraju, A.; Jirka, S.; Kunkel, R.; Sorg, J. Q-SOS—A Sensor Observation Service for Accessing Quality Descriptions of Environmental Data. ISPRS Int. J. Geo-Information 2015, 4, 1346–1365. [Google Scholar] [CrossRef]
© 2016 by the authors; licensee MDPI, Basel, Switzerland. This article is an open access article distributed under the terms and conditions of the Creative Commons Attribution (CC-BY) license (http://creativecommons.org/licenses/by/4.0/).


