
Data-Enabled Design for Social Change: Two Case Studies


1
Department of Social, Political and Cognitive Science, University of Siena, Siena 53100, Italy
2
Department of Industrial Design, Eindhoven University of Technology, Eindhoven 5600 MB, The Netherlands
3
School of Sport Studies Eindhoven, Fontys University of Applied Sciences, Eindhoven 5612 MA, The Netherlands
*
Author to whom correspondence should be addressed.
Future Internet 2016, 8(4), 46; https://doi.org/10.3390/fi8040046
Submission received: 11 April 2016
/
Revised: 7 September 2016
/
Accepted: 8 September 2016
/
Published: 23 September 2016
(This article belongs to the Special Issue Ecosystemic Evolution Feeded by Smart Systems)
Abstract
:Smartness in contemporary society implies the use of massive data to improve the experience of people with connected services and products. The use of big data to collect information about people’s behaviours opens a new concept of “user-centred design” where users are remotely monitored, observed and profiled. In this paradigm, users are considered as sources of information and their participation in the design process is limited to a role of data generators. There is a need to identify methodologies that actively involve people and communities at the core of ecosystems of interconnected products and services. Our contribution to designing for social innovation in ecosystems relies on developing new methods and approaches to transform data-driven design using a participatory and co-creative data-enabled design approach. To this end, we present one of the methods we have developed to design “smart” systems called Experiential Design Landscapes (EDL), and two sample projects, Social Stairs and [Y]our Perspective. Social Stairs faces the topic of behaviour change mediated by sensing technologies. [Y]our Perspective is a social platform to sustain processes of deliberative democracy. Both projects exemplify our approach to data-enabled design as a social proactive participatory design approach.
1. Introduction
A series of pervasive, spontaneous phenomena emerge every day in connection with the use of “smart technologies”. Hienz [1] states that the way we understand and embrace the data movement at present will shape how it impacts all of our futures, our lives, economies, societies, and the choices we make. This author also believes that changes will be for the better.
However, the connected and ubiquitous nature of these systems, associated with the enormous amount of data generated by billions of people using them, at an incredibly fast pace, poses new challenges in the design of such systems and confronts us with societal challenges that require a novel way of thinking about innovation.
Gardien et al. [2] refer to this evolution as a process of systemic innovation in an ecosystem approach. By ecosystems they mean “interconnected products, services and solutions that grow and adapt with the user to bring new value and meaning”.
The Paradigm Framework developed by Brand and Rocchi [3] effectively describes the change in people’s concept of value and meaning in ecosystems. The framework depicts a fundamental shift from the industrial and experience paradigm (from delivering a single product to a specific user, to delivering targeted experiences for customer segmentations) to the so-called knowledge paradigm, connected to delivering meaningful experiences in ecosystems, whereby both consumers and experts have become the developers of the knowledge needed to create these meaningful experiences.
The knowledge paradigm implies a change in the development of technology; it requires sensitivity with respect to how people behave and make sense of their lives as well as adaptivity to changes. New kinds of pervasive sensor-based and embedded technologies used in ecosystems demand a very different understanding from traditional user-interface design activities. People need to make sense of the composition of different system elements at the logical level (what can be done, what can go together with what and for what purpose), the functional level (how to use it), the physical level (it must be possible to see what fits together and how to manipulate it), and at the experience level (what does this mean for me, what are the implications in the long term, and does the system respect my privacy and rights?).
Proactive social participation is essential to coping with this complexity. The design of products, services and technological systems is, in fact, inextricably and inevitably linked with society, and has very profound social consequences.
Our contribution to designing for social innovation in ecosystems relies on developing and experimenting with methodologies that bring people and communities at the core of ecosystems of interconnected products and services.
In what follows we will first review related works using massive data to drive the design process. Later we define our approach to data-enabled design in ecosystems by presenting the Experiential Design Landscapes (EDL) methodology, and two sample projects, Social Stairs and [Y]our Perspective.
In the conclusion, we will discuss the challenges and potential of data-enabled design in smart ecosystems.
2. Related Work
Data has attracted the enthusiasm and attention of researchers for its potential in several areas of applications. A new generation of products, systems and services aims at changing people’s behaviour, following and creating trends of quantified self [4], wearables [5] and Internet of Things (IoT) [6]. These new elements are always connected and present in our everyday lives and rely on increasingly more intelligent interactions to make our lives better. This introduces the realm of Big Data to design, as these new product systems and services continuously generate data. Big Data also offers new opportunities for learning to designers, as it is possible to investigate and analyse large body of information about people, their habits, preferences and behaviours, and gain insights for new designs. Marr [7] describes the 5 V’s of Big Data, being Volume, Velocity, Variety, Veracity and Value. In design we see an emphasis on Variety, the diversity of data, and Value. Designers have to figure out new processes of research. They must learn how to deal with data, how to visualise them and make sense of them. They have to experiment with new approaches to observe people’s behaviour remotely and to envision new forms of participation for users who they will likely never meet, in order to create new value through their designs and the underlying data.
There are different challenges in what Bogers et al. [8] call data-enabled design. They aim at developing a data-enabled design framework for designing intelligent products, services and ecosystems targeting behaviour change. They see three necessary building blocks for developing such a framework: user involvement, methodologies for technology-mediated data collection from the field, and the use of interactive prototypes [8]. Their work builds on the EDL approach we describe in this paper (see paragraph 3). Here, we take a closer look at these three challenges.
The first challenge relates to the involvement of users in the design process. Marti and Bannon [9] examine some of the difficulties one may encounter in performing user-centred design. They argue that while a user-centred perspective is required at all times in the design team, the forms of participation of users in the design process need to fit the context in the broadest sense (physical, sociocultural, emotional), and can vary significantly from that presented as the prototypical user-centred design approach.
Apparently, the turn to big data is opening up a new era in user-centred design, where people are systematically and remotely monitored, observed and profiled. To give an example, some researchers have taken advantage of the spread of mobile telephones to involve ordinary citizens as potential data gatherers, to collect every day a whole series of data accurately, all over the world, at a very low cost. An illustration of this approach can be found in the Citizen Science project of Paulos et al. [10,11], whereby mobile phones are used as ‘networked mobile personal measurement instruments’ e.g., to measure the quality of San Francisco air by deploying sensing systems (CO, NOx, O3, temperature, humidity data and GPS) on over half the fleet of street sweepers and collecting several months of data. The various field studies presented by Paulos et al [11], using different mobile devices as measurement instruments, show that even if there are no real-time sharing mechanisms or informed interface for people involved in the study, an amazing interest of citizens in making sense of data clearly emerges. Most participants reported that from the study they learned that there were unsafe levels of air quality in their city beyond what the government or news agency had reported to them before. Many of them complained about politicians for not informing them adequately and for not enacting a legislation to improve the air quality in the name of public health. The project also stimulated participants in discussing and interpreting the data they collected every day. They also shared strategies adopted when they had captured dangerously high readings, such as finding alternate routes to be less polluted.
Other examples of new recent forms of participation in large amount of data gathering are known as Participatory Sensing (PS). This is a movement that observes and collects masses of highly detailed information that can then be used to improve quality of life in a great variety of different sectors, from environment to health and culture [12]. This approach involves citizens in the monitoring and control of the environment they live in, in the broadest sense of the term, meaning both territory and sociocultural space.
Illustrious examples of PS include the Citizen Science project described above, but also embrace those developed by the University of California, Los Angeles, where students were involved in projects ranging from improvement of transportation to recycling, water monitoring, safety and health [13]. However PS sees citizens primarily as “data gatherers” rather than partners of a sense-making and interpretation process of the generated data. The Timestreams Platform, developed by Jesse Blum et al. [14], tries to move more towards sense-making. This platform uses ubiquitous and pervasive computing for gathering and externalising a variety of data (e.g., CO2, temperature, humidity, images and videos) by artists, to boost a societal discussion about climate change. The Brazilian artist Ali created a record whose speed when played was controlled by the CO2 data collected on the Timestreams platform. Although citizens have a different role in this project, the gatherers of information are not the same persons as the ones interpreting the data.
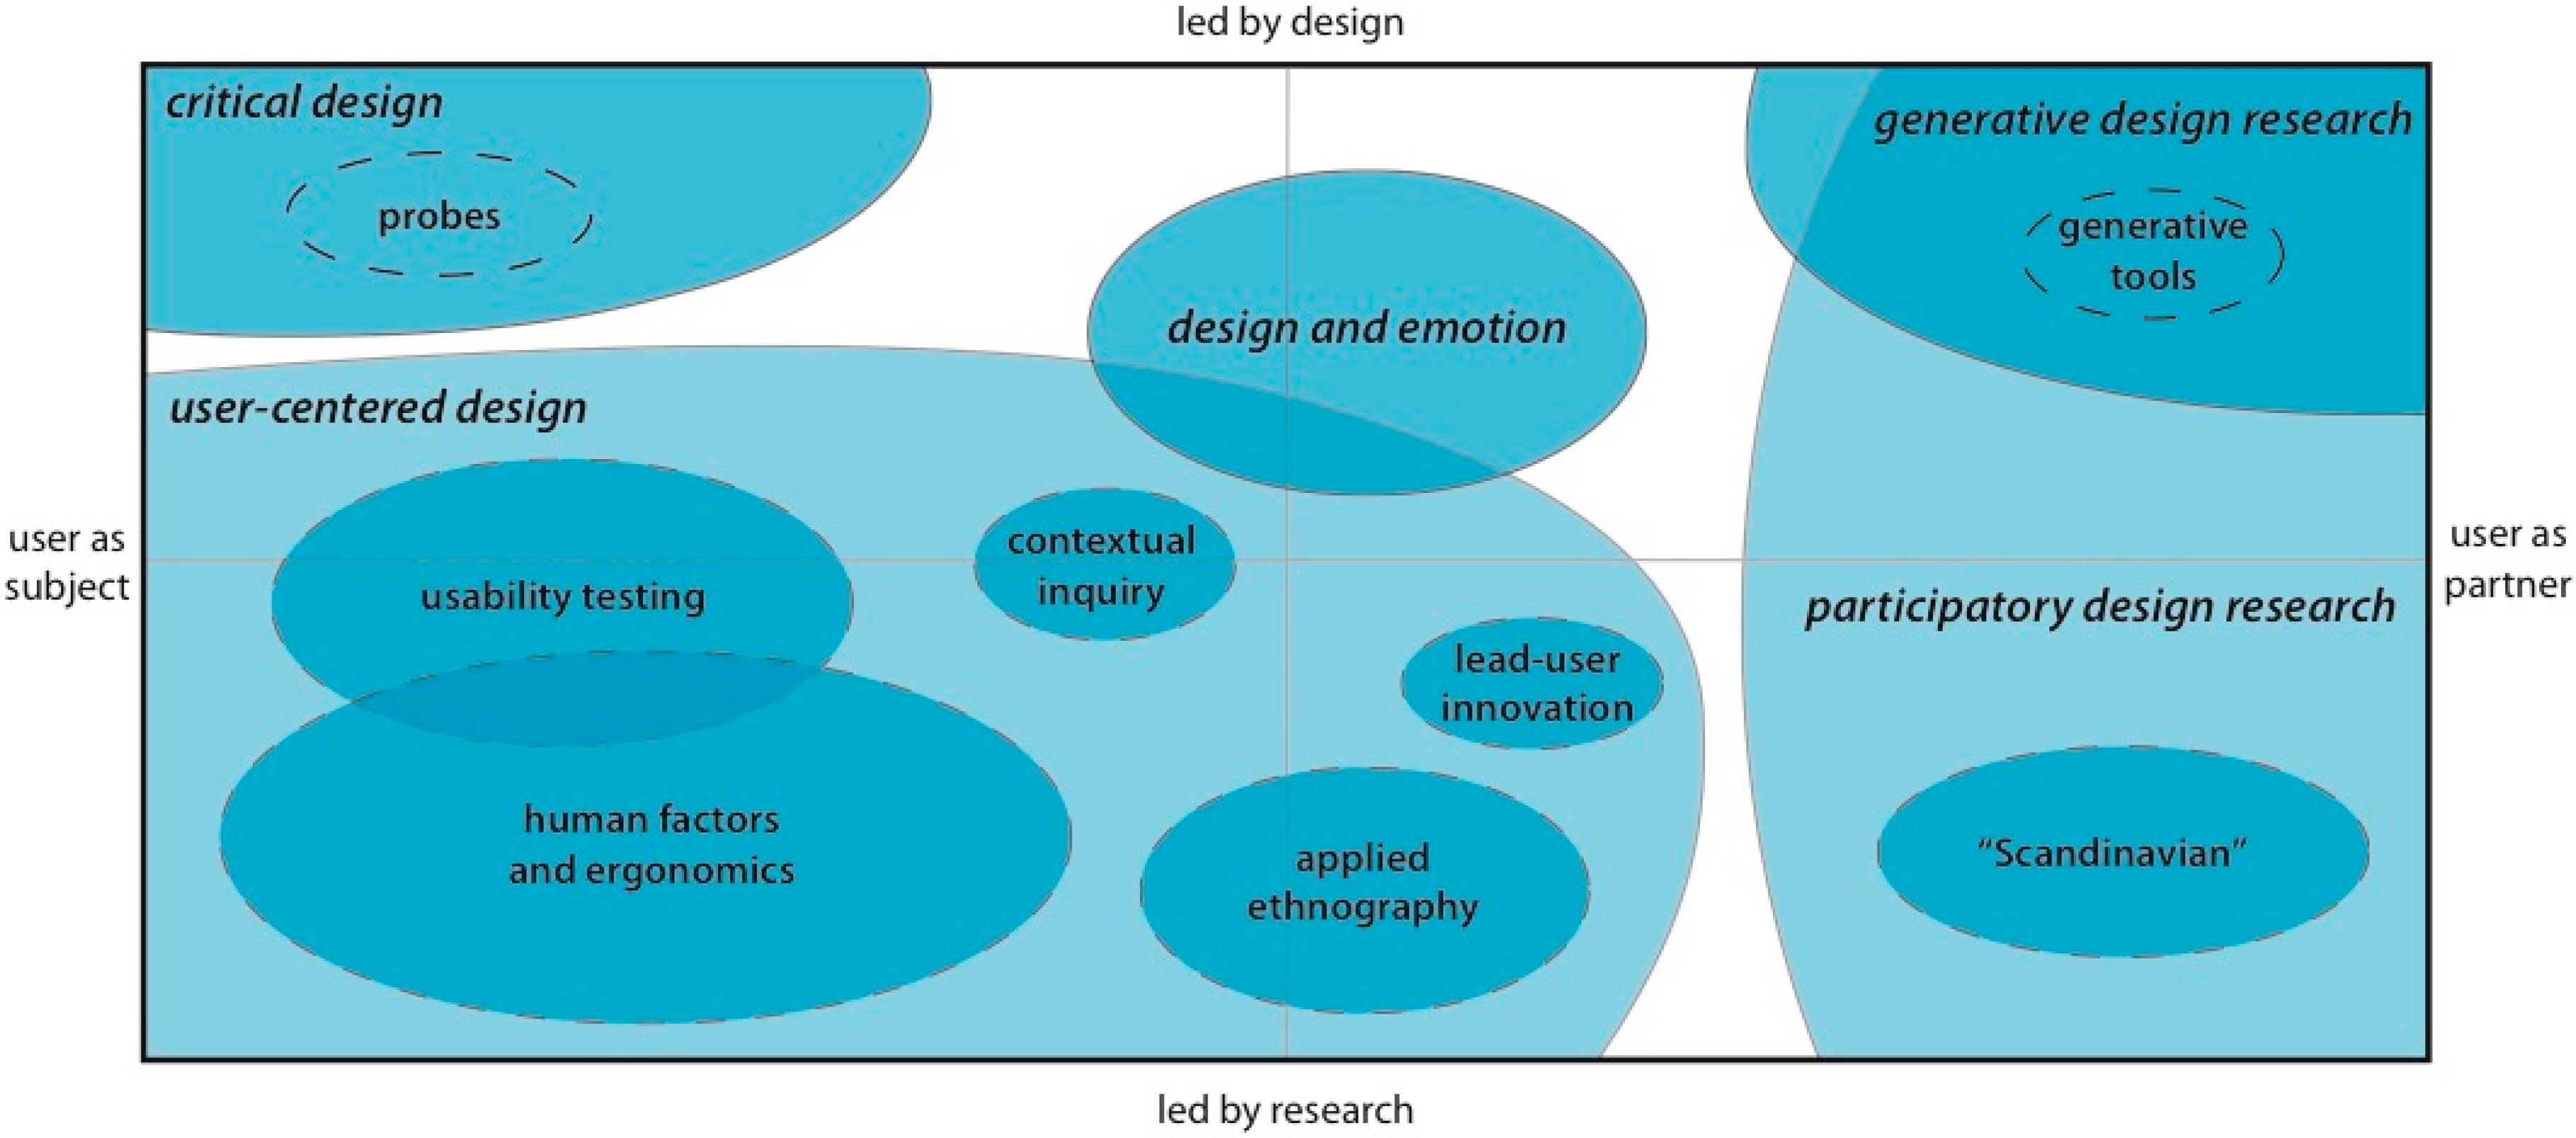
So it seems that citizens can take up various roles in user-centred data-related design. As Sanders and Stappers [15] show in their map of UCD research (see Figure 1), most of the approaches to user-involvement can be mapped on a two-dimensional chart ranging from “users as subject and source of information” (user-centred design) to “users as participants and/or design partner” (participatory design, co-design, co-creation). The approaches share a fundamental issue in defining a suitable role for the users to deal with complex smart ecosystems.
An example of data-related user-centered design approach that is positioned on the left side of the figure is Cell Phone Intervention for You (CITY), where young adults are involved in user tests during which they receive behavioural interventions on their mobile phones to stimulate them to lose weight [16]. The above-mentioned examples of PS and citizen science are more centred around the middle or moving to the right when users have a more equal and participatory role (Figure 1). In our own data-enabled design approach we also try to explore the right side of this figure.
The second challenge is related to techniques and methodologies for performing data-enabled design research. These methodologies range from screen-based approaches such as Virtual Ethnography [17] that adapts traditional observational methods to online fieldwork to the use of sensing technology worn by the users (see PS described above), and to approaches combining opinion-based and behaviour-based data [8,18].
This also creates challenges for design researchers. As described above, the roles of users are changing due to technological developments such as ubiquitous wireless networking, an explosive growth of Web 2.0 sites and connected IoT technology. That means that the amount of data generated by citizens as “amateur professionals” (instead of the previous passive consumer who was merely digesting professionally created content) is exploding and by far exceeding the quantity of professionally created content [19]. Just imagine how much data the 600 million daily active users of Facebook, the 359 million active users of Google+ or the 300 million users of Twitter [20,21] could produce if they were involved in data-enabled design. On the one hand, technological developments such as machine learning can support the analytics of huge amounts of data to deal with the volume, variety and veracity in an automated and learning way. On the other hand, the users also play an important role in the data-enabled design process. In our opinion, the role of citizens should not merely focus on PS (participatory sensing), but on participatory sense-making, a term coined by de Jaegher and di Paolo [22] referring to the shared meaning-making process of people grounded in ongoing embodied and situated interactions in a shared action space. The data-enabled design process follows the translation from data to valuable information.
The third challenge is related to the use of interactive prototypes as a vehicle for experience and value probing, and a means of obtaining data of various kinds in an iterative way, starting early on in the design process. Prototypes can be used in many ways and forms, from the abstract to the sensorial. Prototyping creates insight and knowledge through the mechanism of reflection in and on action [23,24] and by offering a variety of experienceable prototypes through quick iterations. Designers enable people to have access to and express meaning in their everyday context, and through behavior-based data inform the designers about potential directions in which to go.
In line with these approaches, we see a value in data-enabled methods, since they offer the possibility to collect rich datasets of user’s behaviours, in particular when combined with participatory approaches where people can actually contribute to the design process.
In what follows we will describe the data-enabled design method EDL, which we have developed to design “smart” systems [25,26]. The description of the method is accompanied by the presentation of two sample projects, Social Stairs [27] and [Y]our Perspective that will highlight challenges and opportunities of data-enabled design.
The projects explore data-enabled design from two different perspectives.
In Social Stairs we collected multimodal data 24/7 on people’s changing or emergent behaviour in the use of stairs in a public building. The dataset was later used in participatory meetings with employees to envision social activities implying physical movement in the workplace.
[Y]our Perspective takes a different approach to data-enabled design. The social platform stimulates people in expressing a value proposition related to the place they cross in a specific moment. The system sends notifications related to the ongoing public debate and the place, and people can respond to this with their point of view. All comments are geo-localised and shared in the community, including the municipality. People can set new pools as well. Data are interpreted and discussed in public Open Space Technology meetings [28].
3. Experiential Design Landscapes
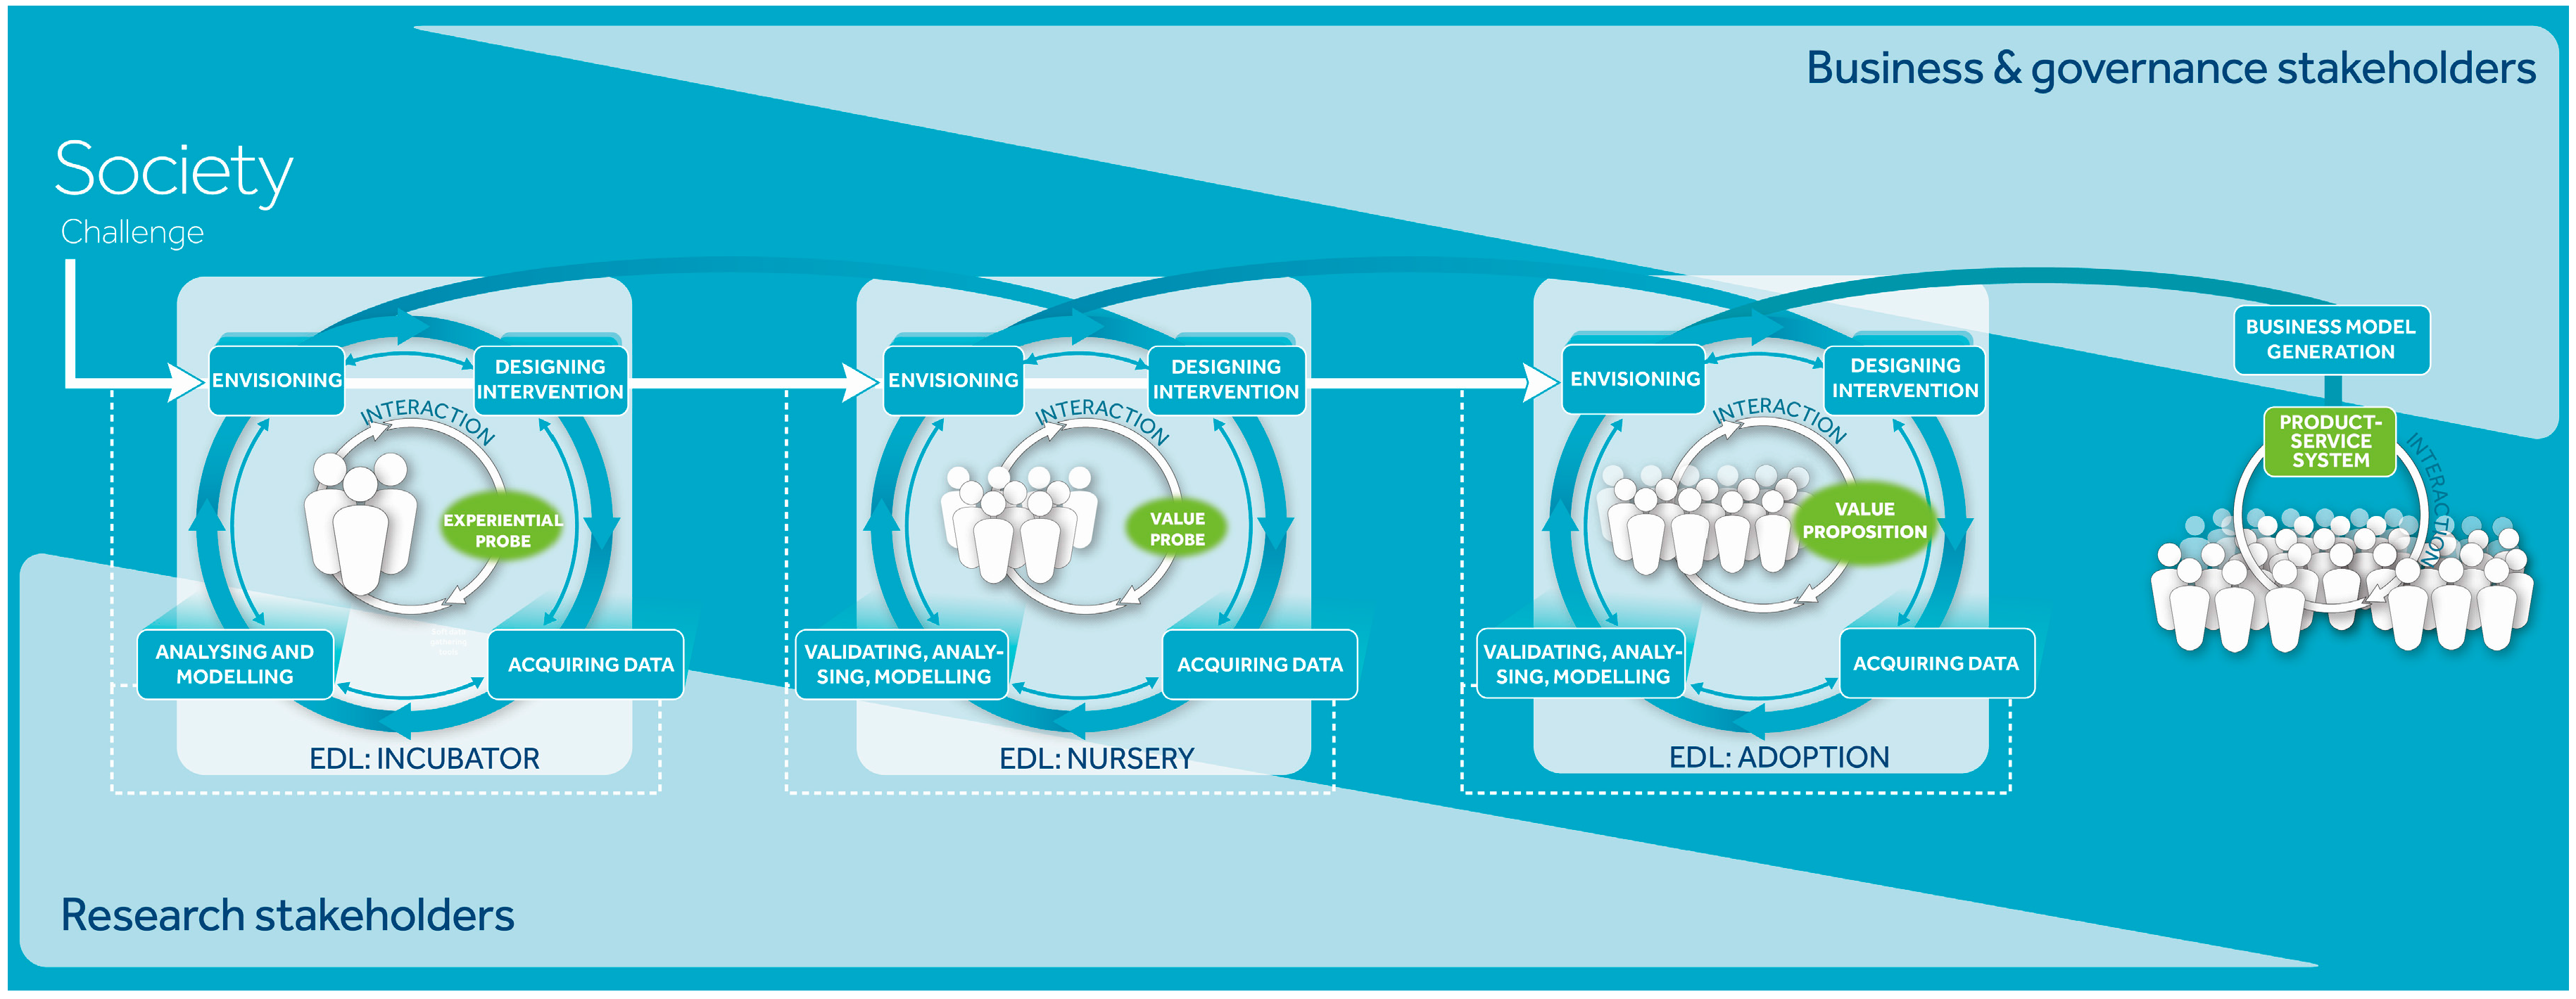
The Experiential Design Landscapes (EDL) method is a design research method aimed at designing for and with people in their natural environment, to find ways to support them in structurally changing their behaviour on a local scale, and to address global societal issues in the long run. EDLs are environments, be it physical or virtual, that are part of society (e.g., designated areas in cities, sports parks, virtual platforms, etc.) in which a design research team meets people in their everyday lives. EDLs can be seen as a specific type of Living Lab or Field Lab. For the exact difference, please refer to the paper by Peeters et al. [26]. The EDL method is society-aware, design-enabled and inspired. The EDL method is based on 4 process steps of envisioning, designing interventions, acquiring data, and analysing and validating this data [25] (see Figure 2).
Moreover, the entire development process shifts via several stages from first explorations to value propositions that can be upscaled to a market-ready product or system, based on the growth plan as proposed by Ross et al. [29] through phases of incubation, nursery, adoption and product launch (Figure 3).
Open, disruptive, and intelligent propositions—which we call Experiential probes (EP)—can easily be created; introduced and tailored in the EDL. These EPs are open, sensor-enhanced, networked products-service systems that enable citizens to develop new and emerging behaviour. In a parallel manner they enable detailed analysis of the emerging data patterns by researchers and designers as a source of inspiration for the development of future systems; products and services. The environments and designed propositions are instrumented with smart sensors solutions to analyse changing behaviour and new emerging patterns. Through analysis, insight is gained on the behaviour of people and the influence of the design on the interaction and on society. EP can best be described as a physicalisation of “open scripts and intentionality” that aims to play an active role in the relationship between humans and their world [30]. They are multi-stable [31]; i.e., context and relationship dependent. Depending on the relationship people have or build up with these artefacts or the context in which they are used, the probes can have different interpretations; intentionalities and identities.
The multistable interpretations, intentionalities and identities of the EP are not a result found after product launch, but can be explored, steered, challenged and radically changed during the design research process, based on people’s behaviour and the design research team’s vision of its future society. This creates a new process of design in which the design research team creates a dialogue through design with people in the EDL.
3.1. Social Stairs
Due to several causes, society is moving toward a sedentary and inactive lifestyle, with resulting consequences for the health and well-being of its citizens [32]. One of these causes is the way our daily work has changed from physical to cognitive tasks, mostly performed in a stationary state. Work occupies a large part of our day and thus is of great influence on our lifestyle and health. Van der Ploeg et al. [33] showed that sitting for more than eleven hours has such an effect on our health that exercising will not redress the damage caused by sitting this long. With the abovementioned in mind, we describe the first EDL, called Social Stairs, a design proposition for an intelligent staircase, installed in both the main buildings of the Eindhoven University of Technology and KPN, a Dutch landline and mobile telecommunications company.
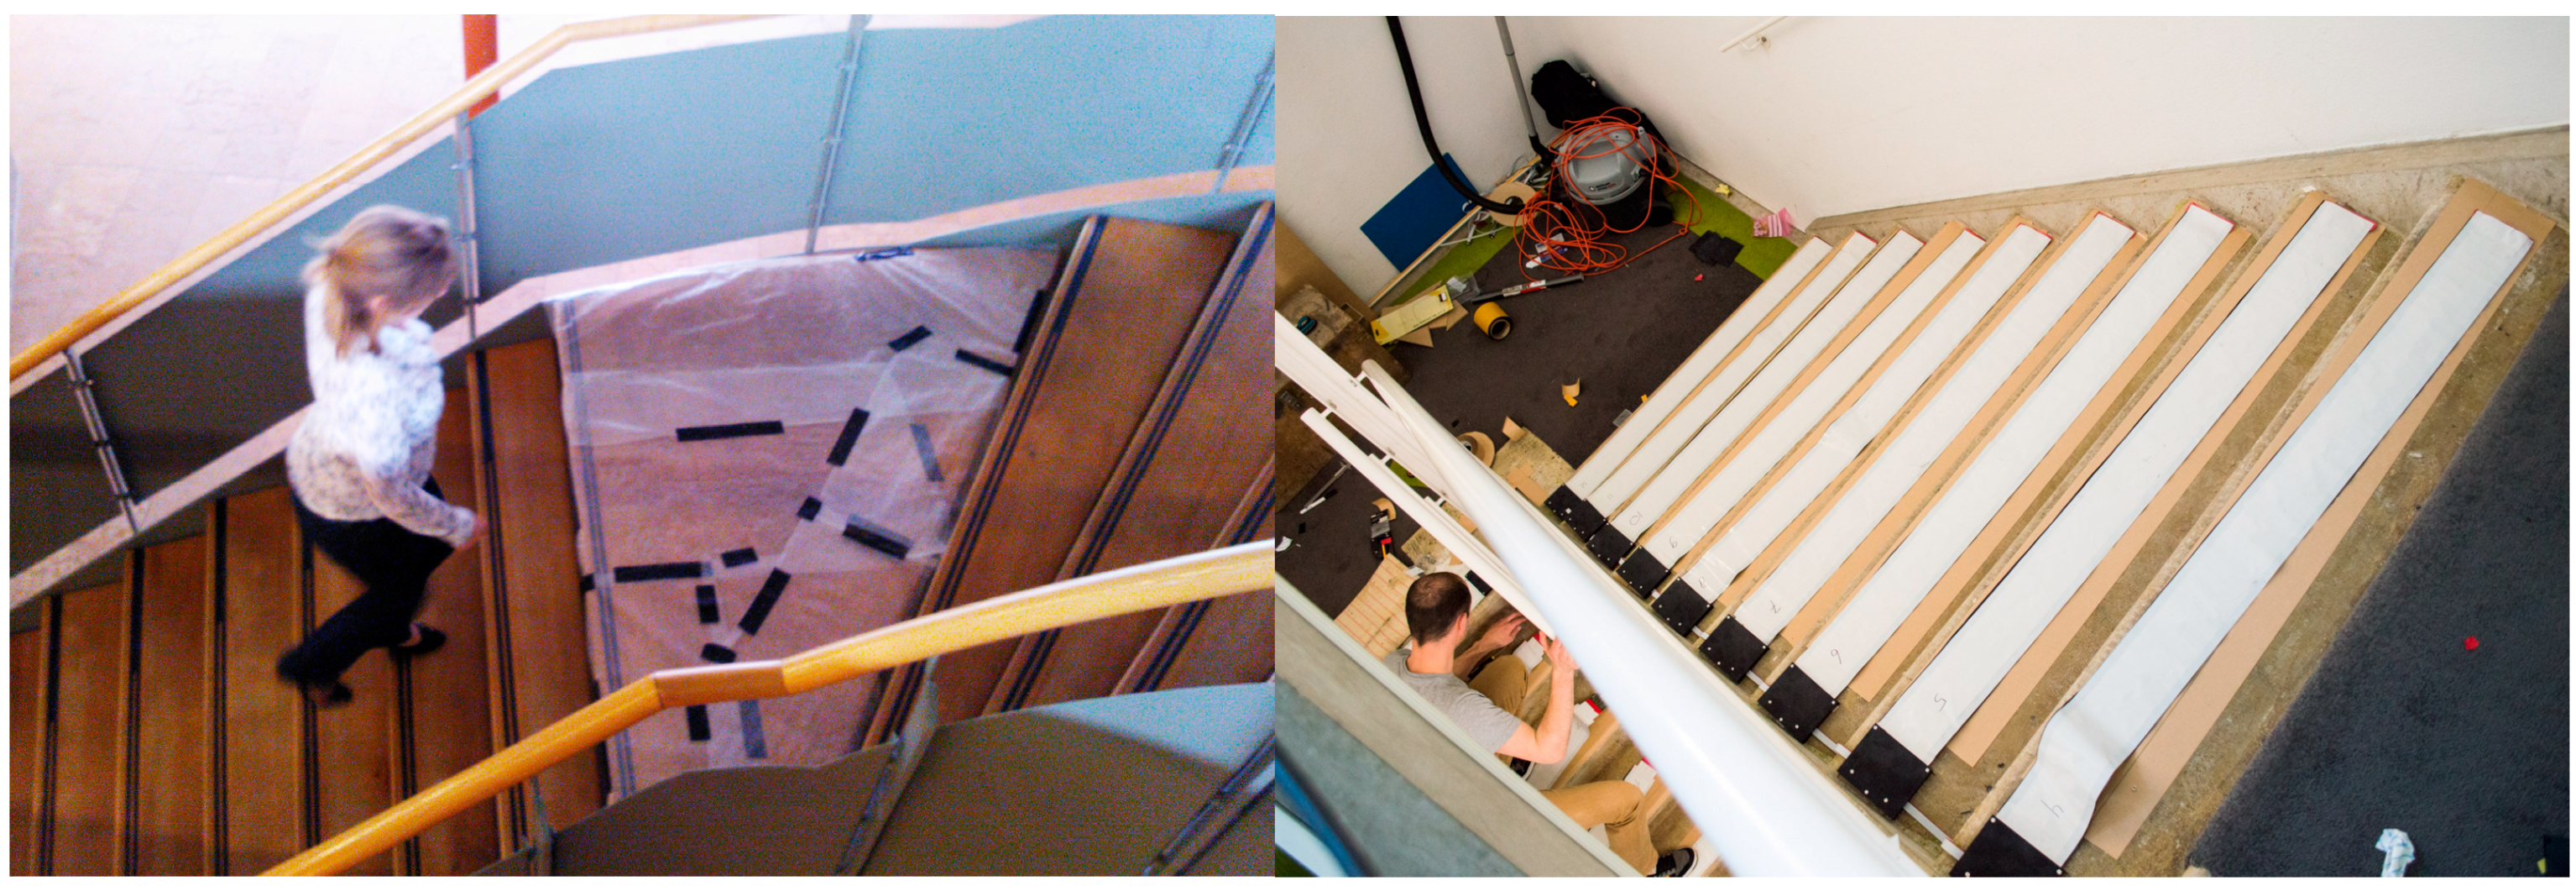
On two flights of stairs, each stair detects footsteps and triggers sound accordingly. The stairs make sounds when a person walks up or down (and thus interacts with) the stairs. These interactions allow the design research team to offer a new stair-walking experience and to explore opportunities to get people using the stairs more frequently and differently. The Social Stairs aims at disrupting the usual way of transit between floors in the building. Over the course of time, different EP, i.e., various types of stair-walking experiences and accompanying soundscape designs, were developed based on this inspiration and vision of walking and playing in the Social Stairs EDL. These EP contained multiple layers of complexity and offered different sound experiences ranging from musical and rhythmical sounds to surprising sounds, echoes and even complete compositions. People could jointly explore and deepen the interaction with the Social Stairs (Figure 4). Based on the behaviour and interaction of the people on/with the Social Stairs, each EP would react differently.
The Social Stairs EDL has been installed and carried out in the two separate locations where both EDLs ran for more than 6 months (Figure 5). The initial version of the Social Stairs was a result of an educational master course, where students created the first explorative probe of an instrumented and interactive stairs in the Eindhoven University of Technology main building. The first quick and low fidelity probe consisted of applying bubble wrap to a staircase. The observed resulting emerging behaviour led to new cycles of the EDL, where each stair was provided with a sensor. Two iterations have been installed between the first and second floor, on one side of the staircase, giving people the option between the Social Stairs and a normal staircase. The second iteration was built for a duration of six months, during which 4 main different EP were developed, tested, experienced and iterated. The probes differed for the sounds they created, ranging from “bloomy” echoing soundscapes to staccato drum sounds. The design research team found the different probes to result in different kinds of emerging behaviour [13]. This EDL in the main building lead to the interest of KPN to also have a Social Stairs EDL in their building, between the ground and first floor. Here a new and more robust Social Stairs was built, allowing the design research team to explore the Social Stairs concept in this new context and together with a business stakeholder.
The aim of the Social Stairs EDL was to explore ways to address the societal issue of increasing daily inactivity by being placed in an office environment. The designers wanted to find out whether they could get people working in an office environment to become more active, by both taking the stairs instead of the elevator, and increasing activity on the stairs. Although this will only lead to brief moments of physical activity during the day, it can show that designing such rich interactive environments in our sedentary environments can help to address the issue. For the designers to see whether people would change their behaviour and in what way, the Social Stairs EDL has been instrumented with sensors and cameras, to keep track of the behaviour patterns that would occur. The resulting data is again of great interest for the designers, as insights into possible emerging behaviour can further influence the design and design process towards the intended and envisioned goals.
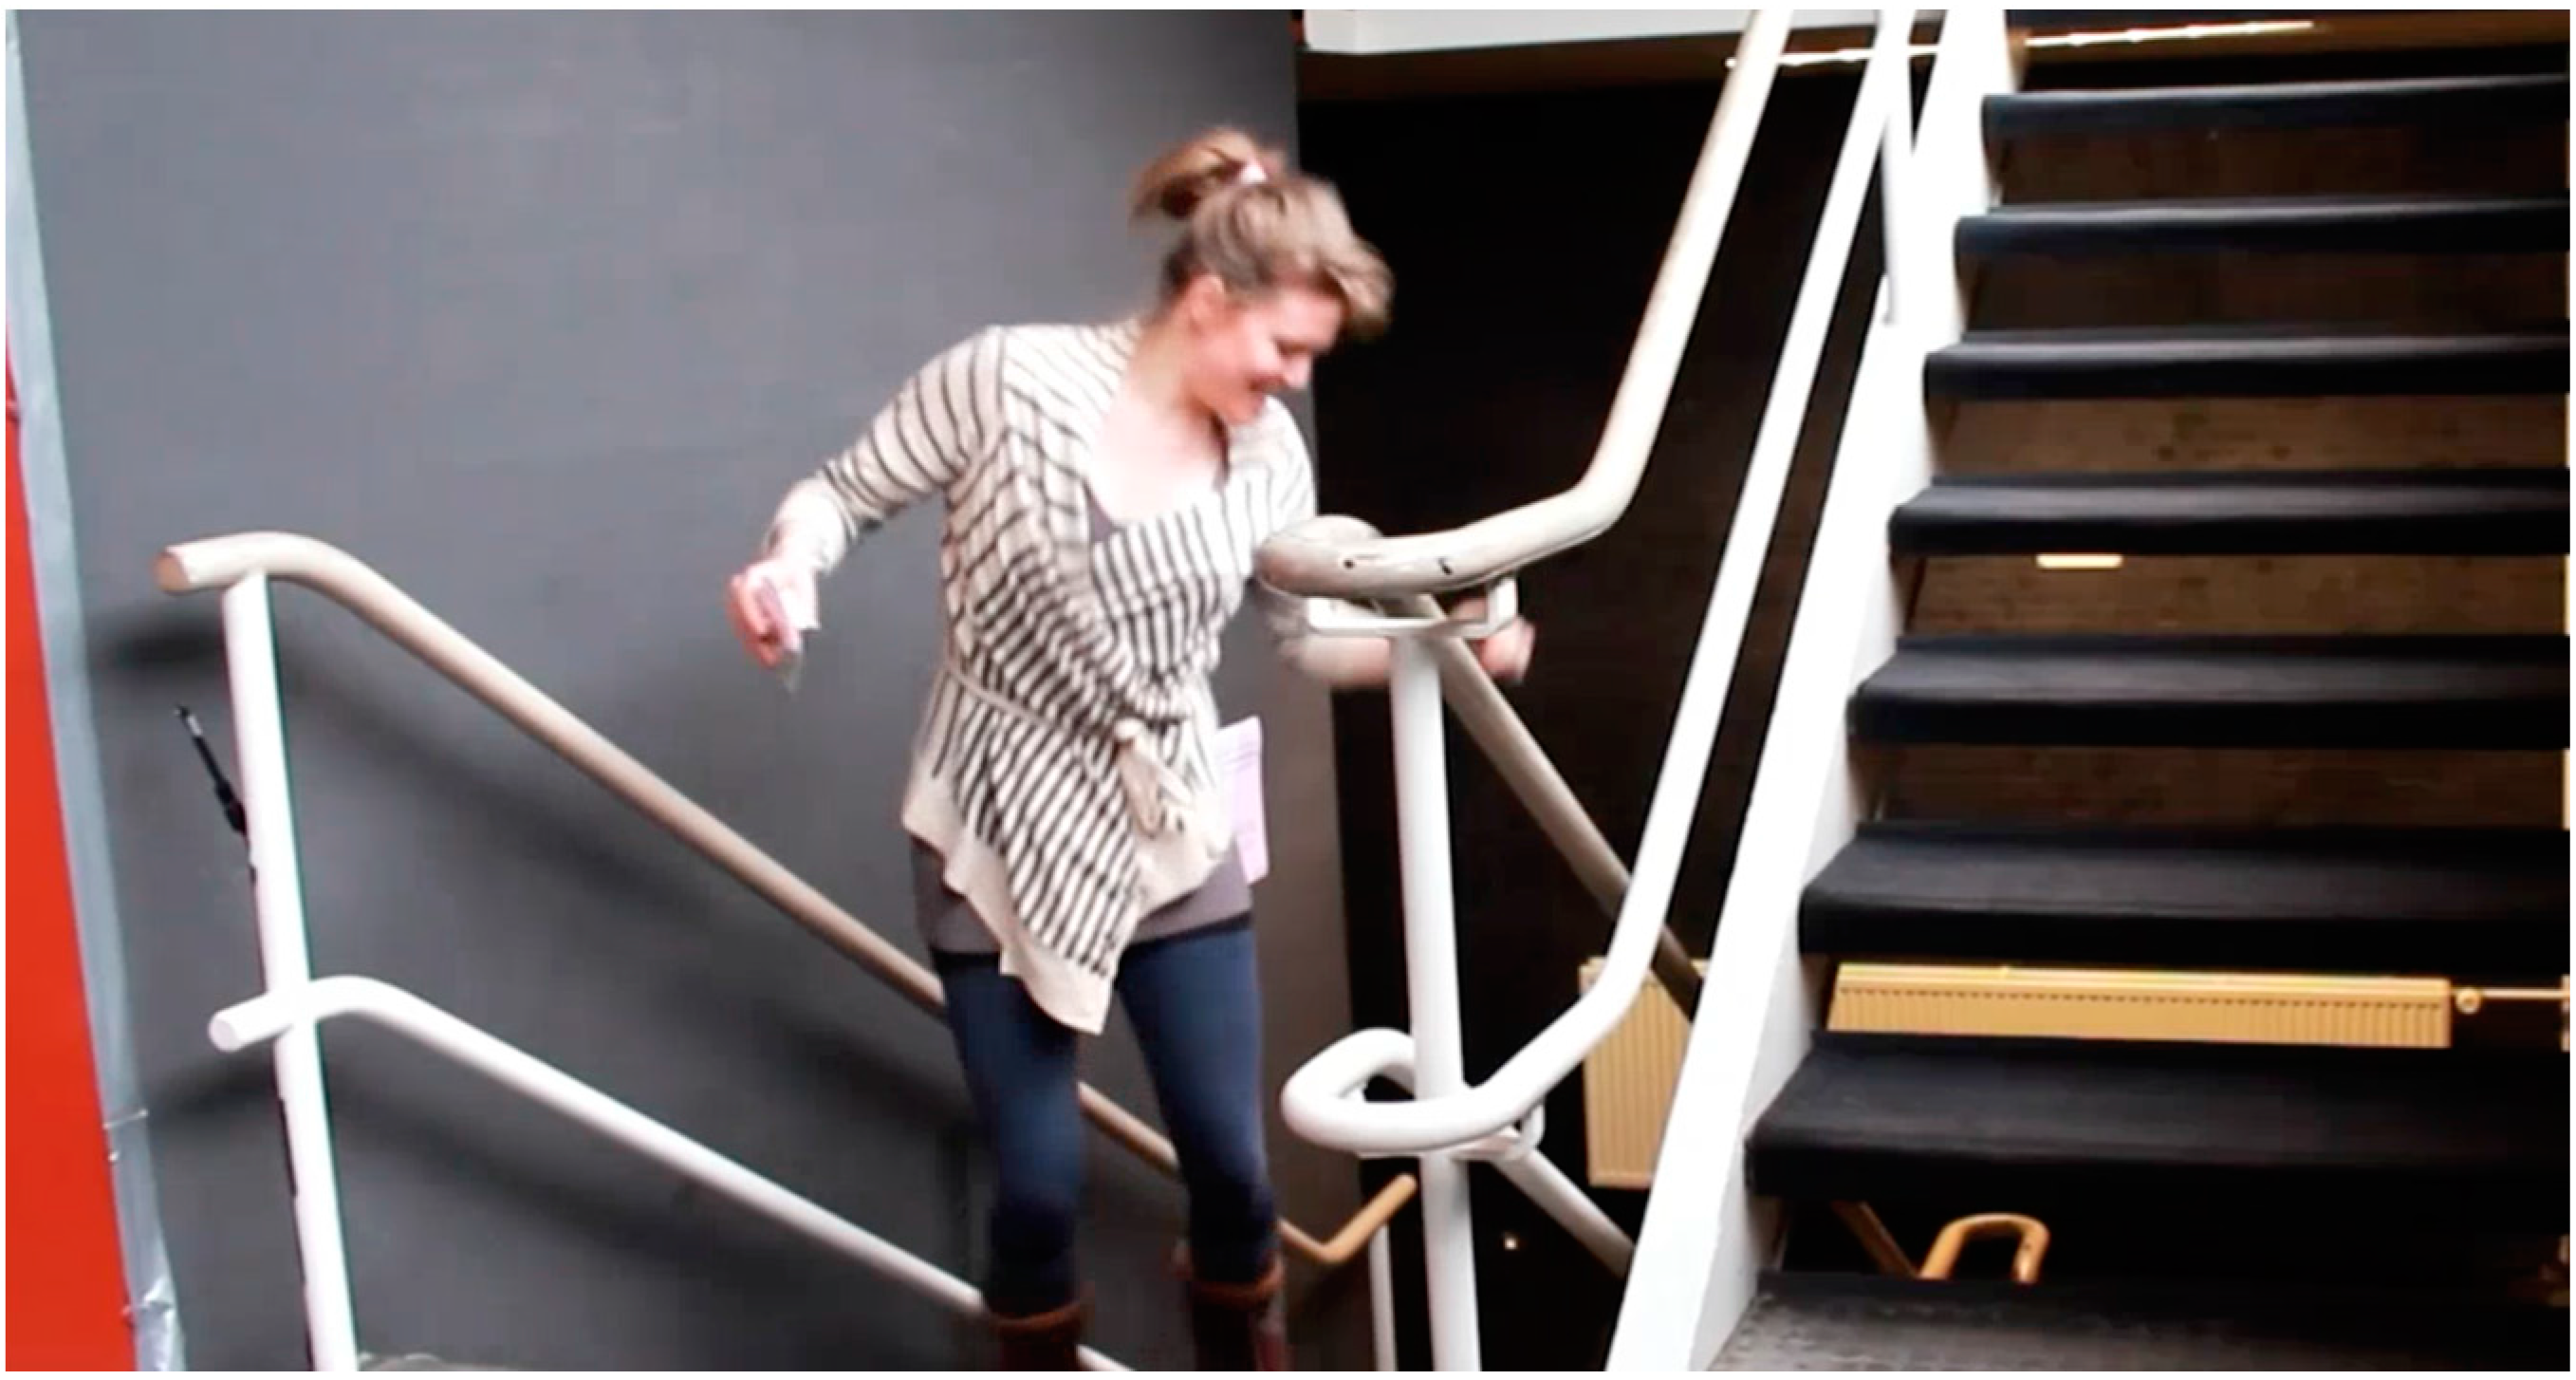
When introducing the EP, the design team subsequently observes, interviews and questions the people in the EDL. This way, the design research team acquired data that helped in finding or addressing specific examples of behaviour and learning more about why people express this behaviour. By means of the EDL architecture the design research team could acquire multimodal data 24/7 on people’s possible changing or emergent behaviour on the Social Stairs. By saving the event logs of the steps, the design research team could keep track of which steps were taken (or not) by people and check if there were any interesting deviating behavioural patterns. Simultaneously, through the concealed miniature camera, the design research team could regularly check or real-time tap into the video to see what was going on in the Social Stairs. To gain a deeper understanding of why people were behaving in certain ways, interviews were held on the stairs as well (Figure 6). Aside from these interviews, doing maintenance and iterations on the stairs also proved to be a valuable way of gaining more insight, as people on the stairs approached the design research to share their experiences and thoughts, resulting in a more natural and spur-of-the moment user participation. On the basis of these insights the design research team could take decisions on how to iterate the current EP, or come up with a new probe.
As an example, through some early experiential probing it was found that people would engage and invite each other to the stairs. This emergent behaviour was mirrored to the design research team’s initial vision on how to design for a more active and healthy society. Subsequently, this inspired them and sparked new ideas on designing different EP using louder and orchestral sounds that played with the social behaviour. Doing so would create new invitations and possibilities for behaviour on the stairs. The design research team did not predict the behaviour of people inviting other people to the stairs and playing with them together, but it did fit their vision even better on how to get people active.
Both the Social Stairs EDLs ran for over 6 months, resulting in a large dataset of recorded steps and timestamps. Through several iterations of data processing and visualisations a format was developed which allowed the design research team to see individual behaviour patterns in the data. By plotting steps over time in sequential rows the difference could be seen between “normal” stairs usage and new deviant behaviour patterns, showing new kinds of behaviour that non-instrumented stairs would not elicit. Normal stair usage would mean going up and down the stairs, hitting each (or every second) step in sequence, as can be seen in the top pattern in Figure 7. With the Social Stairs EDL new behaviour patterns emerged where people would jump, skip and repeat steps instead of normal descending or ascending behaviour. An example of this can be seen in the bottom pattern in Figure 7. Through plotting the data in this manner, the design research team was able to see human behaviour in detail, enabling them to appreciate the differences between normal and deviant behaviour patterns.
With over 60,000 use sessions in total the design research team found a wide range of different emergent behaviour patterns, ranging from jumping, dancing, skipping steps, trying to play a song, trying to mimic earlier patterns, etc. (Figure 8). By constructing a set of rules to determine deviant behaviour patterns from normal behaviour patterns the design research team analysed a total of 60,000 use sessions (individual behaviour patterns). Using three of the different Experiential Probes they compared the deviant behaviour patterns, both on measured data such as measured steps and time as well as clustering on the visual characteristics of the data patterns. In this analysis they found a significant difference (p < 0.05) between the steps and time of the use sessions of these three probes, showing a difference in the behaviour between the three different designs and their resulting emerging behaviour. Next, the team asked six fellow researchers to cluster individual use sessions on their similarities in appearance and related these clusters to the different probes through multidimensional scaling [25], through which it became clear that the deviant stair use patterns of the EP themselves differed.
The design research found in this way of visualising the data, in combination with the recorded video, is a suitable way to find deviant behaviour patterns in the EDL. The data is therefore a good indicator for the design research team to see what happens in the EDL. The analysis, now done mostly by hand, has to be and can be automated to deal with these and larger quantities of data. Machine learning can here help in creating pattern recognition of the different types of deviant behaviour, as new types of behaviour constantly emerge. The interviews and user participation are however necessary to get an understanding why people are behaving the way they do.
Although we got an impression of the user behaviour in the EDL, the study also had drawbacks, mainly related to measuring behaviour change over time. Firstly, we didn’t perform a baseline measurement. This is due to the fact that the Social Stairs was set up as a design exploration at first, not as a research study. By exploring and building upon design ideas the Social Stairs EP was created and set out on the go, without first measuring a baseline for a few weeks. The designers didn’t know beforehand what the design would be about or that the Social Stairs would be the outcome. This highly explorative nature of the project led to the omission of a baseline measurement. The longitudinal aspect of the EDL method—the fact that Social Stairs was run for over several months—does help with creating an understanding of changes in time.
Secondly, we only measured the overall behaviour on the staircase to research if we could see different behaviour in people in relation to different behaviour/feedback on the stairs. But we did not have a set-up that enabled us to measure behaviour change on an individual level, let alone measure any long-lasting behaviour change. Our current research is moving in this direction. Our goal is to design and research systems, products and services in a way that would enable personal and social transformation. Our “design and theory for transformative qualities” aims to design and research qualities and beauty in materials and interaction, which can elevate (transform) personal/social ethics and related behaviour from an embodied interaction perspective. And with this transformation we mean long-term transformation. There are a multitude of studies that indicate, for example, the difficulty of long-lasting health-related behaviour change, such as stopping smoking, maintaining a healthy weight, or living a healthy life after a cardiac disease. As the complications of an unhealthy lifestyle are often deferred, especially with diseases such as diabetes, obesity and congestive heart failure, the motivation to adhere to therapy or a healthy lifestyle is often weak [34].
Consequently, we are looking for designs that can enable users to tap into their intrinsic motivation and connect to their own values. Now that IoT is spreading and weaving into our everyday lives, and our environment and objects are becoming interactive and smart, designs such as Social Stairs will become more regular and affordable. Our challenge is not merely to entice transformation through design, which is already huge, but also how to measure this transformation. Consequently, we are further refining the EDL method and the Data-Enabled Design approach [8] and hope to progress towards longitudinal, fully societally-embedded EDLs, in which technology enables personal and social transformation in a participatory data-enabled design process.
3.2. [Y]our Perspective
The second project we describe is [Y]our Perspective, which was developed within the larger “Light through Culture” educational project [35,36] lasting from 2011 to 2014. The project was promoted by the University of Siena, Eindhoven University of Technology and Interactive Institute Swedish ICT, Umeå. The aim of this educational project is to involve young designers (Bachelor’s, Master’s and Ph.D. students) in the development of innovative solutions for facing major social challenges of life today. The latest edition of the project was inspired by the political, economic and value-related crisis that is now affecting all of Europe. It aimed to explore how citizens can cope with the crisis and be engaged in envisioning the future of their cities. The project was developed in Siena (Italy), a city that has historically been accustomed to attributing to local communities (e.g., “contradas”; public associations) the role of promoting initiatives for safeguarding the organisation and the cultural and economical development of the territory. Unfortunately, the most important institutions in the city, which have historically supported the local community, are now experiencing a crisis that directly affects the forms of institutional arrangements, both public and private. This situation requires constant dialogue with citizens and a return to the participatory approach that characterised the life of the city in the past.
But how can citizens be actively involved in these new forms of dialogue? How is it possible to generate the right motivation, convincing citizens of the need for and importance of their participation in society? How can young people be encouraged to take part in politics, a world they now consider and perceive as some sort of parallel universe, far removed from the problems of everyday life? These are the questions the students of various disciplines (communication, design, engineering, political science) and different cultural backgrounds (Sweden, The Netherlands, Italy, Brazil, India) attempted to answer in a two-week course.
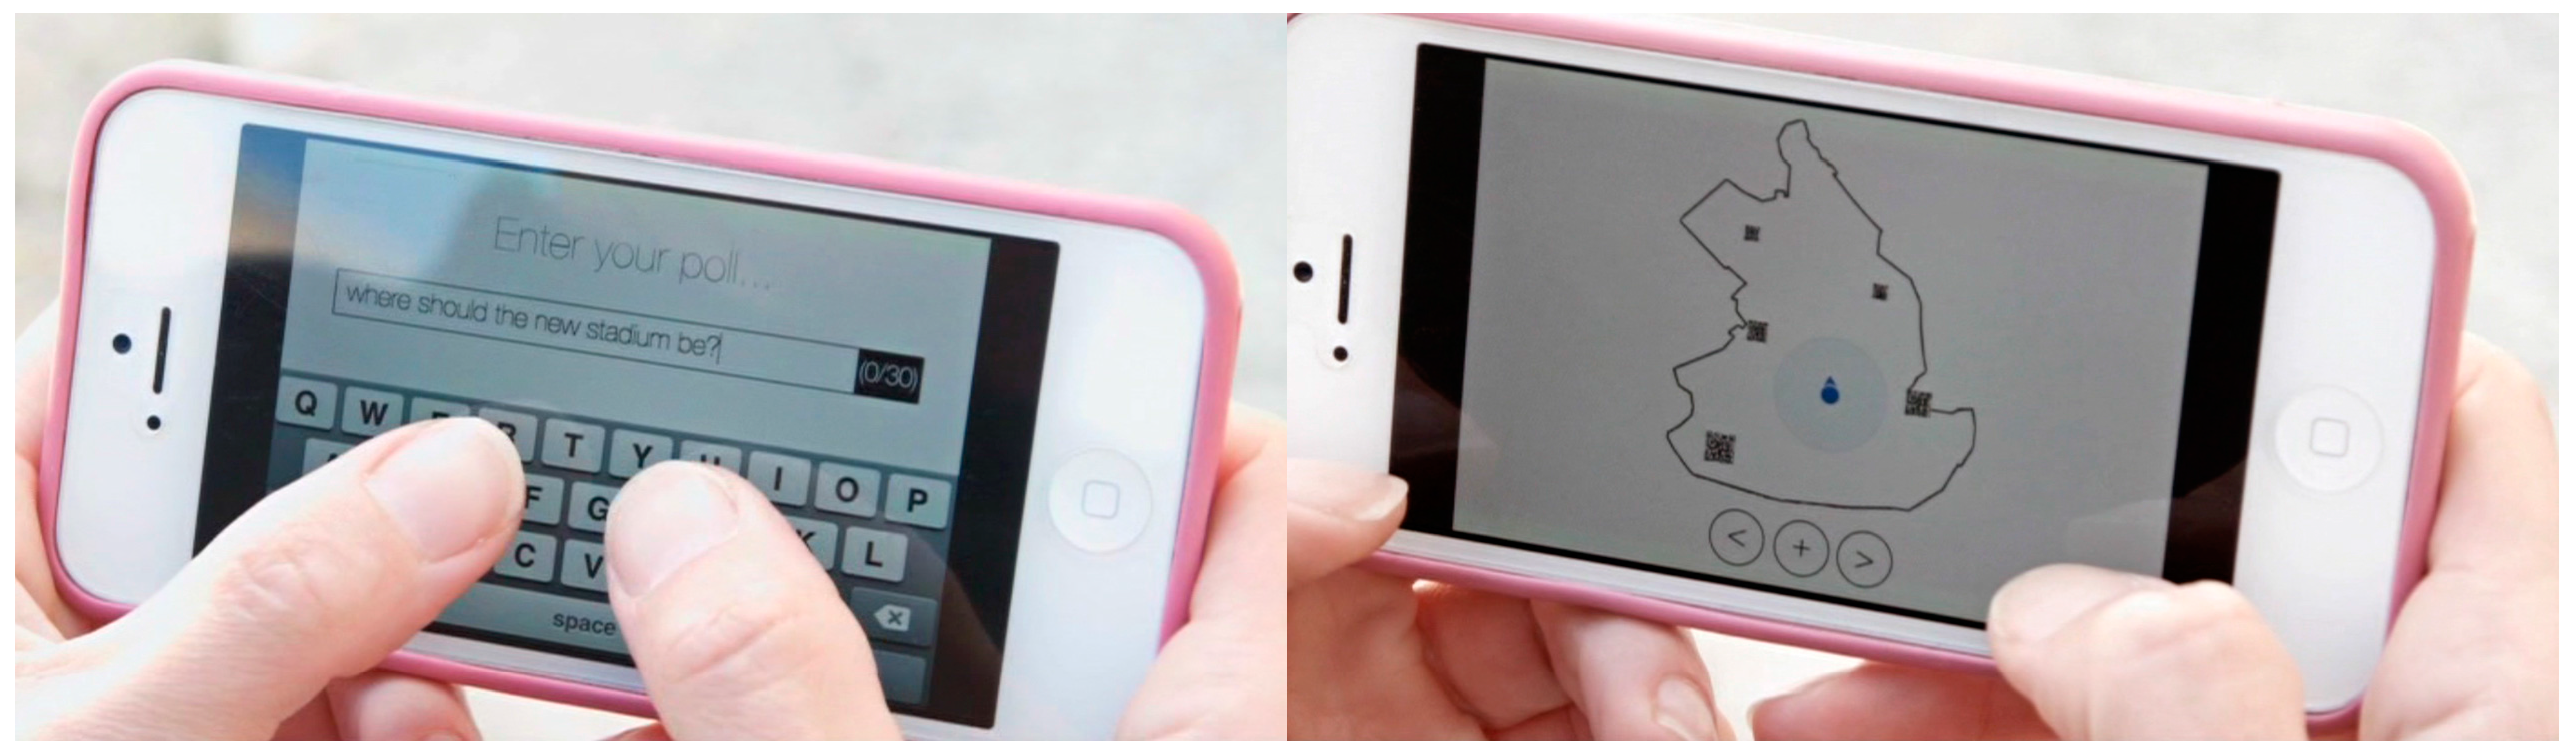
One of the design teams developed [Y]our Perspective, the design concept of an app allowing citizens and administrators to launch consultations regarding issues of public interest via smartphones. Polls are spatialised, that is, made accessible in the parts of the city involved in the consultation. For example, citizens who pass by the area where the stadium is to be built may launch a survey of people’s opinions on the advisability of building a stadium in the historical centre of the city (Figure 9 left). When another person walks by the area where the stadium is to be built, the app sends the poll, in push mode (Figure 9 right). The person receiving the notification may respond to the question posed while on the site, viewing the context.
Responses will be made available to the community, and participants will be able to state the reasons for their decisions. Responses to the poll are expressed in terms of value propositions, that is a statement of value that the person acknowledges. With the proposition, the person highlights the value or benefit that s/he would like to see and experience. Examples of value propositions are “ecology”, “carbon-free”, “hospitality” etc.
With reference to Marr’s [7] 5 Vs of Big Data, [Y]our perspective tries to elicit mainly Variety and Value. The variety of data consists of the collection of geo-localised data, temporal data and qualitative data (topics of the pools). Value data consist of value proposition statements that highlight the personal interpretation and sense-making of people responding or proposing a poll. It is worth mentioning that the design of [Y]our perspective is conceived as a network of people gathering, but also proposing and making sense of information during the data collection. The mechanism is based on data sharing where the collection can originate from the municipality as well as from citizens. This opens up the possibility for a new dialogue between citizens and institutions.
The design of the app was driven by an investigation of different theories and methods of deliberative democracy carried out with experts’ assistance.
Bobbio [37] identifies three levels of participation in democratic life. In the first level, participants merely listen to the technicians and administrators with the aim of formulating and assessing their contributions. With this approach, the administrators have the decision-making power in their hands. In the second level of participation, citizens become directly involved in the choice of plans, and are asked to debate a topic, contributing their own vision and offering the technicians an opportunity to work with the observations they have thus collected. In this case the influence of the recipients depends on the facilitator’s ability to bring out the participants’ demands and the ability to listen to the technicians and those promoting the process. At this level of interaction, it is still the technicians who hold the power to make decisions, and to decide whether to apply the participants’ suggestions. The third level is made up of citizens who play an active role in the process, working actively with the administration, possibly with the assistance of an external facilitator, to seek a solution to a problem considered to be everyone’s problem. In this case, the community plays an important and influential role, and is considered the key player in social change.
The third level includes decision-making, precisely because of the consideration and value placed on citizens’ proposals and active participation. In this model, citizens become involved right away, from the earliest phases of formation of a shared political conscience, including searching for and identifying the subsequent phases of reflection on the themes of the debate. Therefore, this model potentially offers a way to encourage citizens to cooperate in the search for solutions to social and political dilemmas, instigating active involvement which does not stop at the choice of people to represent them in political elections.
On the basis of this theoretical framework as well as interviews conducted with citizens on issues of common interest, and of the study of examples of good government taken from the history of the city of Siena, students developed a video concept that was used as the basis for participatory design sessions with Sienese citizens. The video is included in a larger video documentary available at [38].
The design of the poll mechanism of the app was inspired by the “Conflict Spectrum”, a methodology used in deliberative democracy to solve conflicts at an early stage [39]. The method allows people to understand the motivations of other people taking a certain position as well as the number of people sharing certain opinions. It requires that participants publicly express their point of view which is used only when people feel comfortable enough to take a stand openly. The method works like a bodystorming. Participants have to align themselves along a virtual line connecting two corners in the room. People who are firmly convinced of a certain position move to one corner. People who are convinced of the opposite move to the opposite corner. The participants are informed that infinite shades may exist between the two positions represented in the room by intermediate positions between the two corners. Each participant takes the position in the room corresponding to his/her view, and when people are placed along the spectrum, the facilitator asks them to briefly explain why they chose to get in that position. During the explanation, people are allowed to change their position in the spectrum toward a more convincing stand. If anyone chooses a new location, s/he is invited to explain why. The expected result is a better understanding of the personal opinion and that of the others, the acquisition of a more collaborative and open stand towards the opinion of others and hopefully the conflict resolution.
Inspired by this method, the graphical interface of the app was designed as a virtual conflict spectrum with opposite opinions placed at the extremes of a line (Figure 10). The person responding to a poll can position her opinion along the line, expressing also the values or expected benefits from voting that position. He/she can also read other responses to the poll. These data are stored in the system and the results of the pool are dynamically visualised on a public large screen display in the city hall.
From the perspective of transformation, both empowerment and recognition of the other are strongly present in the design of this app. The spectrum empowers by offering virtual space for expressing the own voice, giving to the citizens a concrete, spatial frame of reference in which to locate their beliefs and points of view. It also creates an implicit sense of connection to the others: even those who stand at the opposite end of the spectrum stand in a continuum with the others. Also, cooperation with one‘s opponent in a joint activity dedicated to elucidating the views through value propositions in a positive and constructive way, creates a temporary ritual of common purpose.
[Y]our Perspective platform was designed through a number of participatory design activities that involved designers, students, experts in the field of political science, citizens and representatives of local public administration. The process did not however include any behavioural data sensing, mining or analysis with the actual prototype which served the purpose of consolidating the design concept rather than actually collecting data on the field through the platform.
However, participatory design sessions involved a large number of stakeholders (up to 150 as explained below) and highlighted a number of issues that clearly show the importance of a participatory approach to data-enabled design. First of all the interviewees stated that they would use the system only in the event that the municipality ensures that the measures discussed and approved by the citizens were actually placed on the political agenda. In this way, users would be strongly encouraged to contribute by using the app and feel they would want to continue to do so in the long term. In other words, gathering data without the chance to see it implemented was not seen to be worthwhile.
Yet it appears that the use of the app would be appreciated and spread if it turns out to be a social platform for communication and sharing, rather than a simple poll used by the municipality to monitor the citizenship’s opinions. People do not feel at ease generating data without taking part in the interpretation and implementation process. The fact that both parties (citizens and municipality) can propose a topic is a valuable point, because in this way the system would not be seen as a means for the public administration to achieve political consensus, but as a real attempt at communication and listening.
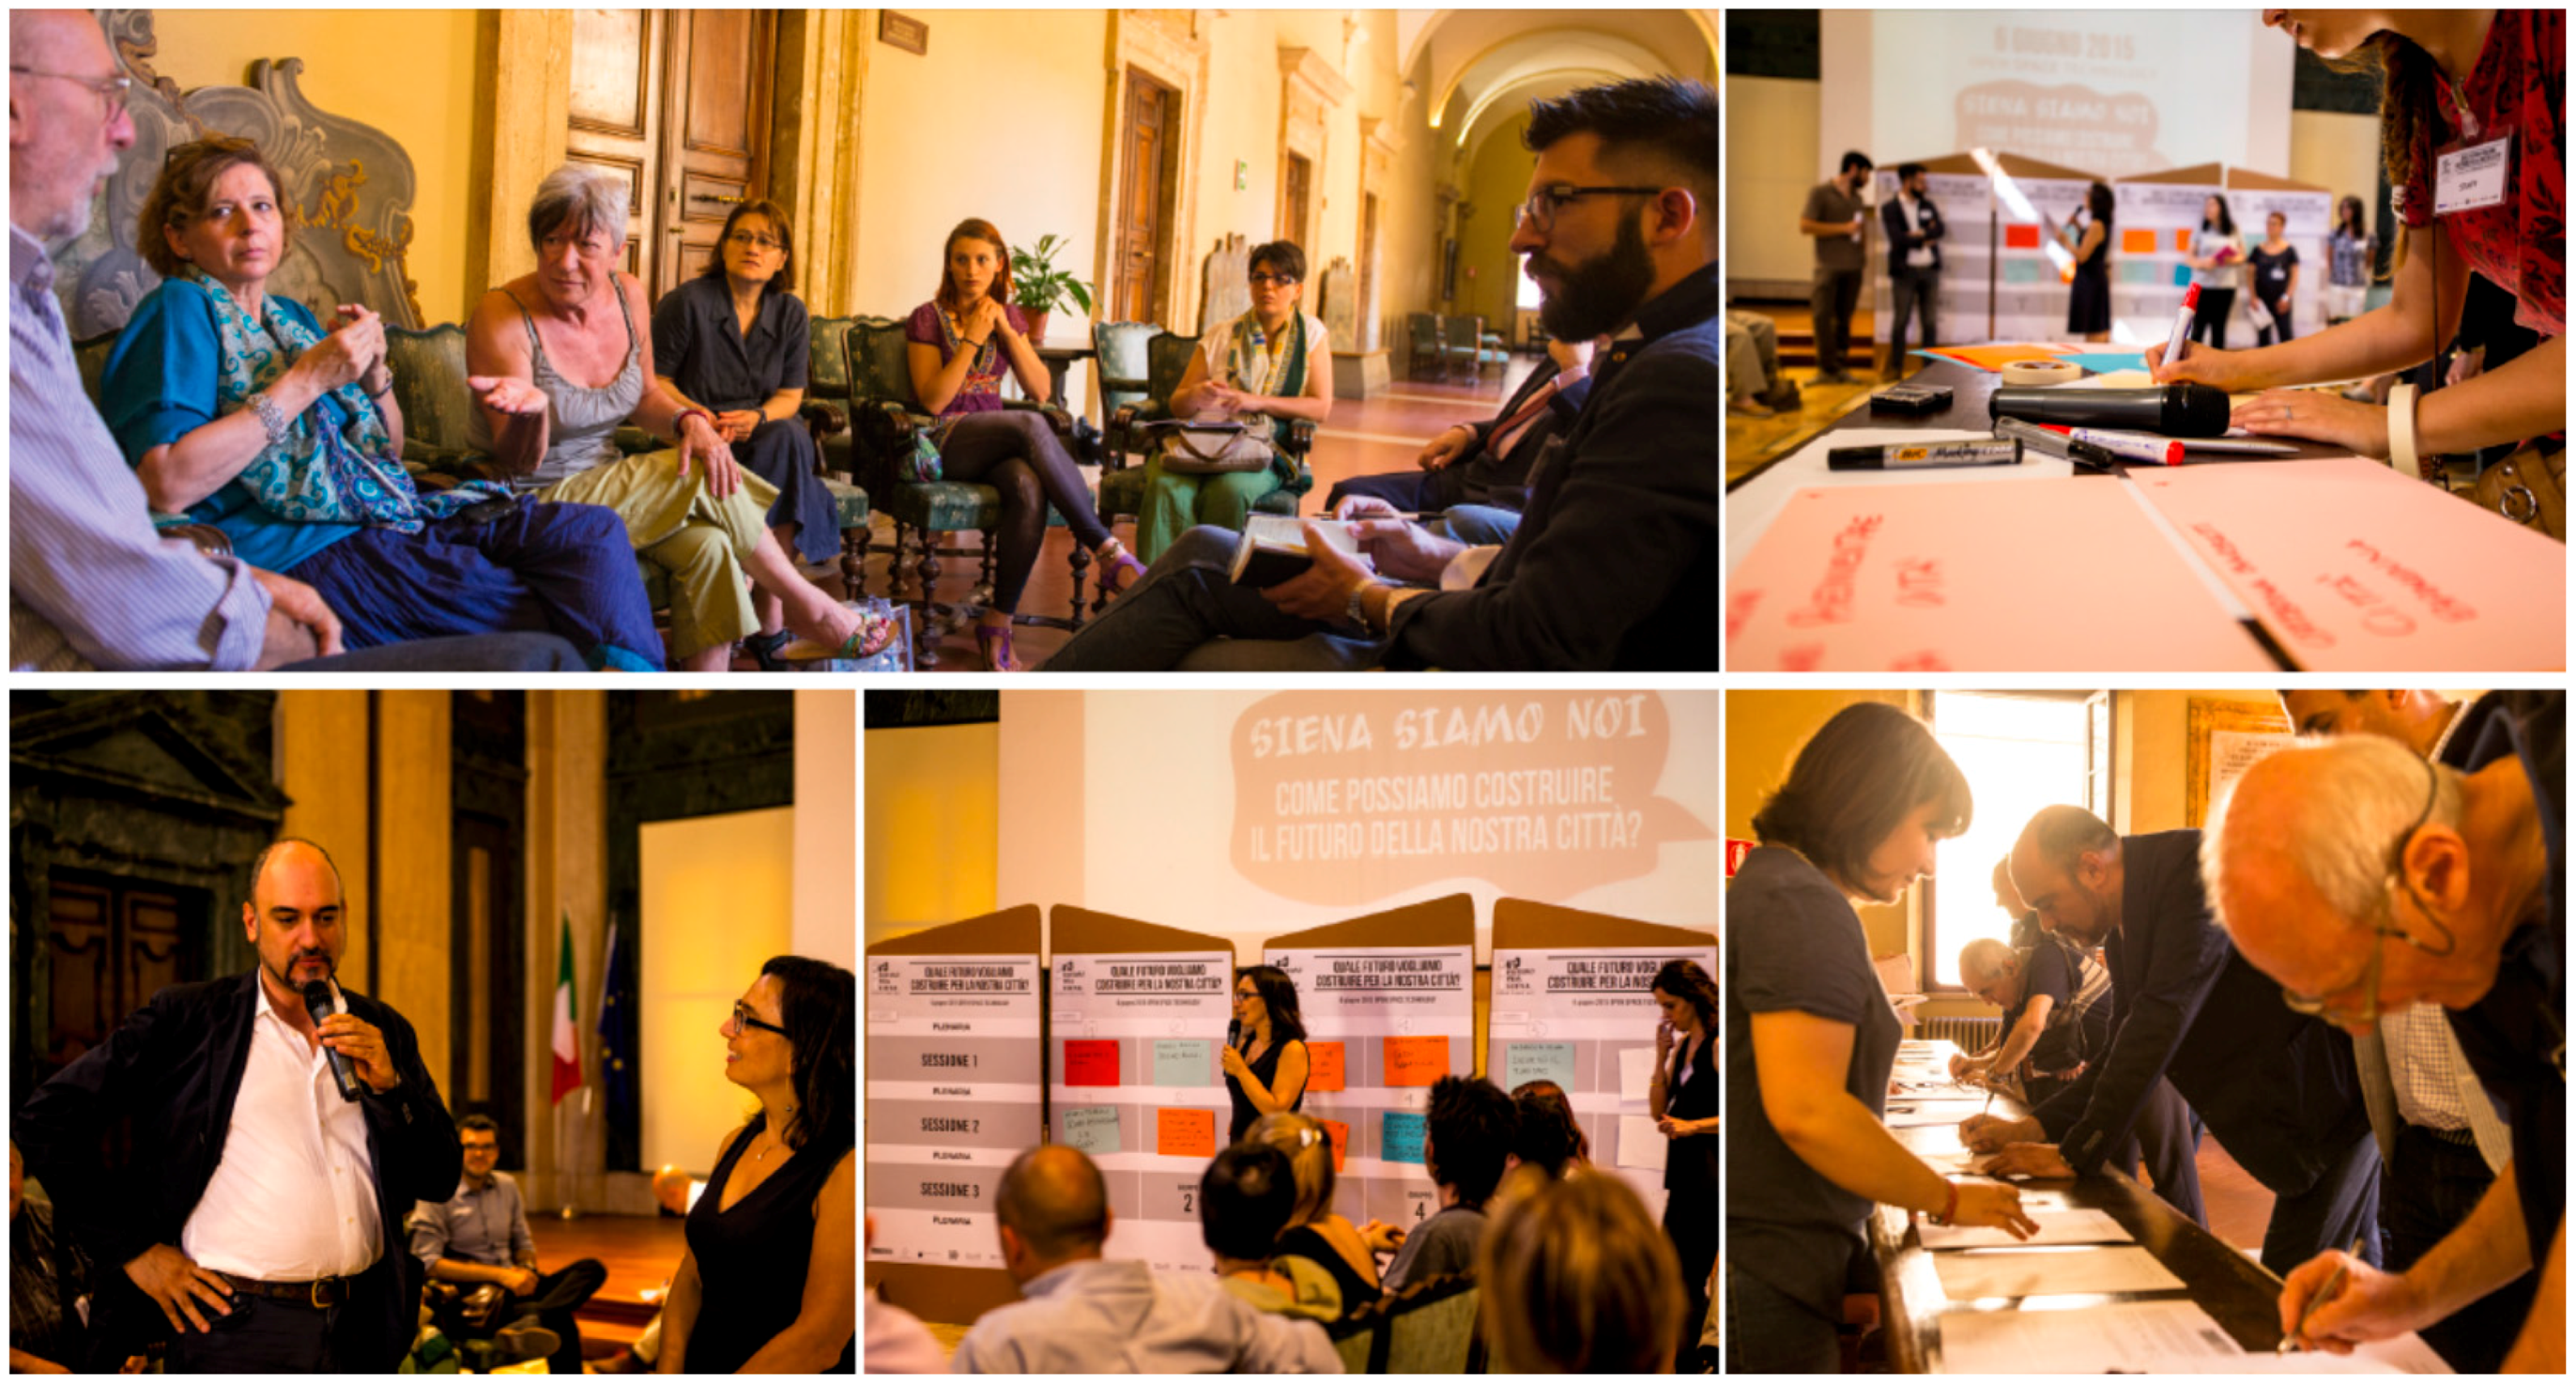
Another aspect expressed by almost all participants of the participatory design sessions is the importance of continuing the online discussions in public meetings with other citizens and local government representatives. A proposal should not halt at the level of exchanging views, but should result in subsequent collective deliberation, subject to the monopoly of the government on specific issues. This suggestion was elaborated a few months later in a follow-up project consisting in a large public consultation organised in Siena in the form of an Open Space Technology (OST) meeting involving around 150 participants (Figure 11). Some of the themes discussed during the OST have been recognised as priorities in the political agenda of the municipality of Siena.
The OST served as a means to simulate the sense-making process that the app could stimulate on the basis of the data gathered on different pools.
4. Conclusions
In this paper, through two projects we elucidated our approach to data-enabled design as a social proactive participatory design approach. In line with the paper from Bogers et al. [8] we see three important building blocks for a data-enabled design approach: user involvement in participatory co-design processes, methodologies for technology-mediated data collection from the field, and the use of interactive prototyping as a vehicle for experience and value probing and a means to obtain data starting early on in the design process.
Our projects and the underlying EDL method were built on the notion that the strength of these building blocks can be found in their synergy. Using processes of (1) Envisioning; (2) Designing interventions; (3) Acquiring data; and (4) Analysing and modelling, we have tools to start tackling societal challenges together with other stakeholders. We believe that the design of smart systems would benefit from a data-enabled design approach considering big data about personal and social behaviour patterns from a user-centred perspective. This perspective sees people not only as data gatherers but as active participants in the process of interpreting and making sense of data. That is why we frame our approach as data-enabled design, which includes a participatory/co-design approach with a high level of prototyping (from lo-fi to hi-fi) throughout the process, thus developing wise systems that acknowledge and include our sociocultural context. In the data-enabled design approach we see fluent connections between the physical and the digital, the technical and the socio-cultural, the designers/developers and the citizens/customers, and between synthesis and analysis.
The projects that we show in this paper are merely a start to explore this new and exciting road towards data-enabled design, where technology is used to bring people and communities at the core of ecosystems of interconnected products and services, thus finding a more successful way to cope with the current complexity and our societal challenges. By developing new methods and approaches such as the EDL, which aims to transform data-driven design in a participatory and co-creative data-enabled design approach, we hope to offer others refreshing ways to design “smart” systems. Given the new prosumers-drive in the knowledge economy, we like to make it as concrete, open and accessible as possible and invite others to experiment with it.
Acknowledgments
We would like to thank the students of the Eindhoven University of Technology and the University of Siena for their enthusiastic and dedicated participation in the projects described in this paper. Many people actively contributed to the two projects and we would like to sincerely thank them. For Social Stairs: Michel Peeters, Sander Bogers, Aarnout Brombacher, Mathias Funk, Jean-Bernard Martens, Nick Hermans, Bart Wolfs, Rhys Duindam, Max Sakovich, Nadine van Amersfoort, Stijn Stumpel as well as the students and colleagues of the Eindhoven University of Technology who used and tested the Social Stairs. We thank Koninklijke KPN for enabling us to build a version for their headquarters. For [Y]our Perspective: Pierangelo Isemia, Iolanda Romano, Nigel Papworth, Ambra Trotto, Evert Wolters, Iolanda Iacono, Rosa De Piano, Michele Tittarelli, Arvid Jense, Trieuvy Luu as well as the students from the Eindhoven University of Technology, University of Siena and Interactive Institute Swedish ICT Umeå, who participated in this Light through Culture project. Finally, we like to thank Comune di Siena, the Archivio di Stato di Siena, the Contrada della Lupa and Necker van Naem for their support during this project.
Author Contributions
The authors equally contributed to the paper defining the concept of participatory data-enabled design. Caroline Hummels and Patrizia Marti conceived the educational project “Light through Culture” and coordinated the educational programme for four years (2011–2014). They supervised the students’ project [Y]our perspective, organised the participatory sessions in the city of Siena and contributed to the data analysis and interpretation. Carl Megens created the Experiential Design Landscapes Master’s course for three years, from which the Social Stairs project emerged. This project was then further developed for research purposes.
Conflicts of Interest
The authors declare no conflict of interest.
Abbreviations
The following abbreviations are used in this manuscript:
| EDL | Experiential Design Landscape |
| EP | Experiential Probe |
| OST | Open Space Technology |
| PS | Participatory Sensing |
References
- Hienz, J. The Future of Data-Driven Innovation. U.S. Chamber of Commerce Foundation, 2014. Available online: https://www.uschamberfoundation.org/future-data-driven-innovation (accessed on 16 September 2016).
- Gardien, P.; Deckers, E.; Christiaansen, C. Innovating Innovation—Deliver meaningful experiences in ecosystems. DMI Acad. Des. Manag. Conf. Lond. 2014, 9, 36–46. [Google Scholar]
- Brand, R.; Rocchi, S. Rethinking Value in a Changing Landscape: A Model for Strategic Reflection and business Transformation. Eindh.: Philips Des. 2011. Available online: http://www.design.philips.com/philips/shared/assets/design_assets/pdf/nvbD/april2011/paradigms.pdf (accessed on 16 September 2016). [Google Scholar]
- Swan, M. The Quantified Self. Big Data 2013, 1, BD85–BD99. [Google Scholar] [CrossRef] [PubMed]
- Tomico, O.; van Zijverden, M.; Fejér, T.; Chen, Y.; Lubbers, E.; Heuvelings, M.; Schepperheyn, V. Crafting wearables: Interaction design meets fashion design. In CHI'13 Extended Abstracts on Human Factors in Computing Systems; ACM: New York, NY, USA, April 2013; pp. 2875–2876. [Google Scholar]
- Weber, R.H.; Weber, R. Internet of Things; Springer: New York, NY, USA, 2010; Volume 12. [Google Scholar]
- Marr, B. Big Data: Using SMART Big Data, Analytics and Metrics to Make Better Decisions and Improve Performance; John Wiley & Sons: Hoboken, NJ, USA, 2015. [Google Scholar]
- Bogers, S.; Frens, J.; Kollenburg, J.; Deckers, E.; Hummels, C. Connected Baby Bottle: A Design Case Study towards A Framework for Data-Enabled Design. In Proceedings of the Designing Interactive Systems Conference, Brisbane, Australia, 4–8 June 2016.
- Marti, P.; Bannon, L. Exploring User-Centred Design in Practice: Some Caveats. Knowledge Technol. Policy 2009, 22, 7–15. [Google Scholar] [CrossRef]
- Acki, P.; Honicky, R.; Hooker, B.; Mainwaring, A.; Myers, C.; Paulos, E.; Subramanian, S.; Woodruff, A. A Vehicle for Research: Using Street Sweepers to Explore the Landscape of Environmental Community Action. Available online: http://www.urban-atmospheres.net/CitizenScience/ (accessed on 9 August 2016).
- Paulos, E.; Honicky, R.; Hooker, B. Citizen Science: Enabling Participatory Urbanism. In Handbook of Research on Urban Informatics: The Practice and Promise of the Real-Time City; Foth, M., Ed.; Information Science Reference, IGI Global: Hershey, PA, USA, 2009. [Google Scholar]
- Goldman, J.; Shilton, K.; Burke, J.; Estrin, D.; Hansen, M.; Ramanathan, N.; Reddy, S.; Samanta, V.; Srivastava, M; West, R. Participatory Sensing: A Citizen-powered Approach to Illuminating the Patterns that Shape Our World (White Paper); Woodrow Wilson International Center for Scholars: Washington, DC, USA, 2009. [Google Scholar]
- Participatory Sensing. Available online: http://www.mobilizingcs.org/about/participatory-sensing (accessed on 16 September 2016).
- Blum, J.; Flintham, M.; Jacobs, R.; Shipp, V.; Kefalidou, G.; Brown, M.; McAuley, D. The Timestreams platform: Artist mediated participatory sensing for environmental discourse. In Proceedings of the 2013 ACM International Joint Conference on Pervasive and Ubiquitous Computing (UbiComp ‘13), Zurich, Switzerland, 8–12 September 2013; pp. 285–294.
- Sanders, E.B.N.; Stappers, P.J. Co-creation and the new landscapes of design. CoDesign 2008, 4, 5–18. [Google Scholar] [CrossRef]
- Batch, B.; Tyson, C.; Bagwell, J.; Corsino, L.; Intille, S.; Lin, P.; Lazenka, T.; Bennett, G.; Bosworth, H.; Voils, C.; et al. Weight loss intervention for young adults using mobile technology: Design and rationale of a randomized controlled trial. Cell Phone Intervention for You (CITY). Contemp. Clin. Trials 2014, 37, 333–341. [Google Scholar] [CrossRef] [PubMed]
- Hine, C. Virtual ethnography: Modes, varieties, affordances. In SAGE Handbook of Online Research Methods; SAGE: New York, NY, USA, 2008; pp. 257–270. [Google Scholar]
- Bolt, N.; Tulathimutte, T. Remote Research; Rosenfeld Media, LLC: New York, NY, USA, 2010; p. 266. [Google Scholar]
- Gardien, P.; Djajadiningrat, J.P.; Hummels, C.C.M.; Brombacher, A.C. Changing your hammer: The implications of paradigmatic innovation for design practice. Int. J. Des. 2014, 8, 119–139. [Google Scholar]
- Tam, D. Facebook by the Numbers: 1.06 Billion Monthly Active Users. Available online: http://news.cnet.com/8301-1023_3-57566550-93/facebook-by-the-numbers-1.06-billion-monthly-active-users/ (accessed on 25 October 2013).
- Watkins, T. Suddenly, Google Plus is Outpacing Twitter to Become the World’s Second Largest Social Network. Available online: http://www.businessinsider.com/google-plus-is-outpacing-twitter-2013-5#ixzz2aNZf9cYb (accessed on 16 September 2016).
- De Jaegher, H.; di Paolo, E. Participatory sense-making: An enactive approach to social cognition. Phenomenol. Cogn. Sci. 2007, 6, 485–507. [Google Scholar] [CrossRef]
- Dewey, J. Experience and Education; Touchstone: New York, NY, USA, 1938. [Google Scholar]
- Schön, D. The Reflective Practitioner; Basic Books: New York, NY, USA, 1983. [Google Scholar]
- Peeters, M.; Megens, C. Experiential Design Landscapes: How To Design For Behaviour Change, Towards an Active Lifestyle. Ph.D. Thesis, Technische Universiteit Eindhoven, Eindhoven, The Netherlands, 15 April 2014. [Google Scholar]
- Peeters, M.; Megens, C.; Ijsselsteijn, W.; Hummels, C.; Brombacher, A. Experiential Design Landscapes: Design research in the wild. In Proceedings of Nordic Design Research Conference, Copenhagen, Denmark, 9–12 June 2013.
- Peeters, M.; Megens, C.; van den Hoven, E.; Hummels, C.; Brombacher, A. Social Stairs: Taking the Piano Staircase towards Long-Term Behavioural Change. Persuas. Technol. 2013, 7822, 174–179. [Google Scholar]
- Owen, H. Open Space Technology: A User’s Guide, 3rd ed.; Berrett-Koehler: Oakland, CA, USA, 2008. [Google Scholar]
- Ross, P.; Tomico, O. The Growth Plan: An approach for considering social implications in Ambient Intelligent system design. In Proceedings of the AISB 2009 Convention, Edinburgh, Scotland, 6–9 April 2009.
- Verbeek, P.P. Materializing morality design ethics and technological mediation. Sci. Technol. Hum. Values 2006, 31, 361–380. [Google Scholar] [CrossRef]
- Ihde, D. Technology and the Lifeworld: From Garden to Earth; Indiana University Press: Bloomington, IN, USA, 1990; No. 560. [Google Scholar]
- MacCallum, L.; Howson, N.; Gopu, N. Designed to Move: A Physical Action Agenda; NIKE: Kokkedal, Denmark, 2012. [Google Scholar]
- Van der Ploeg, H.P.; Chey, T.; Korda, R.J.; Banks, E.; Bauman, A. Sitting time and all-cause mortality risk in 222 497 Australian adults. Arch. Intern. Med. 2012, 172, 494–500. [Google Scholar] [CrossRef] [PubMed]
- Christensen, C.; Grossman, M.; Hwang, J. The Innovator’s Prescription; How Disruptive Innovation Can Transform Health Care; The McGraw-Hill Companies: New York, NY, USA, 2009. [Google Scholar]
- Marti, P.; Overbeeke, K. Designing Complexity in Context: Light through Culture. In Proceedings of the Ninth Conference of the Italian Chapter of ACM SIGCHI (Association for Computer Machinery—Special Interest Group on Computer-Human Interaction), Alghero, Italy, 13–16 September 2011; pp. 65–70.
- Marti, P.; Trotto, A.; Peters, J.; Hummels, C. Instilling Cultural Values through Bodily Engagement with Human Rights. In Proceedings of the Tenth Conference of the Italian Chapter of ACM SIGCHI (Association for Computer Machinery—Special Interest Group on Computer-Human Interaction), Trento, Italy, 16–19 September 2013.
- Bobbio, L. A Più Voci. Amministrazioni pubbliche, Imprese, Associazioni e Cittadini nei Processi Decisionali Inclusivi; Edizioni Scientifiche Italiane: Roma, Italy, 2004. [Google Scholar]
- Design for Politics LtC. Available online: http://vimeo.com/98062969 (accessed on 16 September 2016).
- Kraybill, R. Facilitation Skills for Interpersonal Transformation, Berghof Handbook for Conflict Transformation; Berghof Research Center for Constructive Conflict Management: London, UK, August 2004. [Google Scholar]
Figure 1.
The current landscape of user-centered design research by Sanders and Stappers [15].
Figure 1.
The current landscape of user-centered design research by Sanders and Stappers [15].

Figure 2.
A schematic overview of the Experiential Design Landscapes (EDL) method, showing the cyclic nature of the method.
Figure 2.
A schematic overview of the Experiential Design Landscapes (EDL) method, showing the cyclic nature of the method.
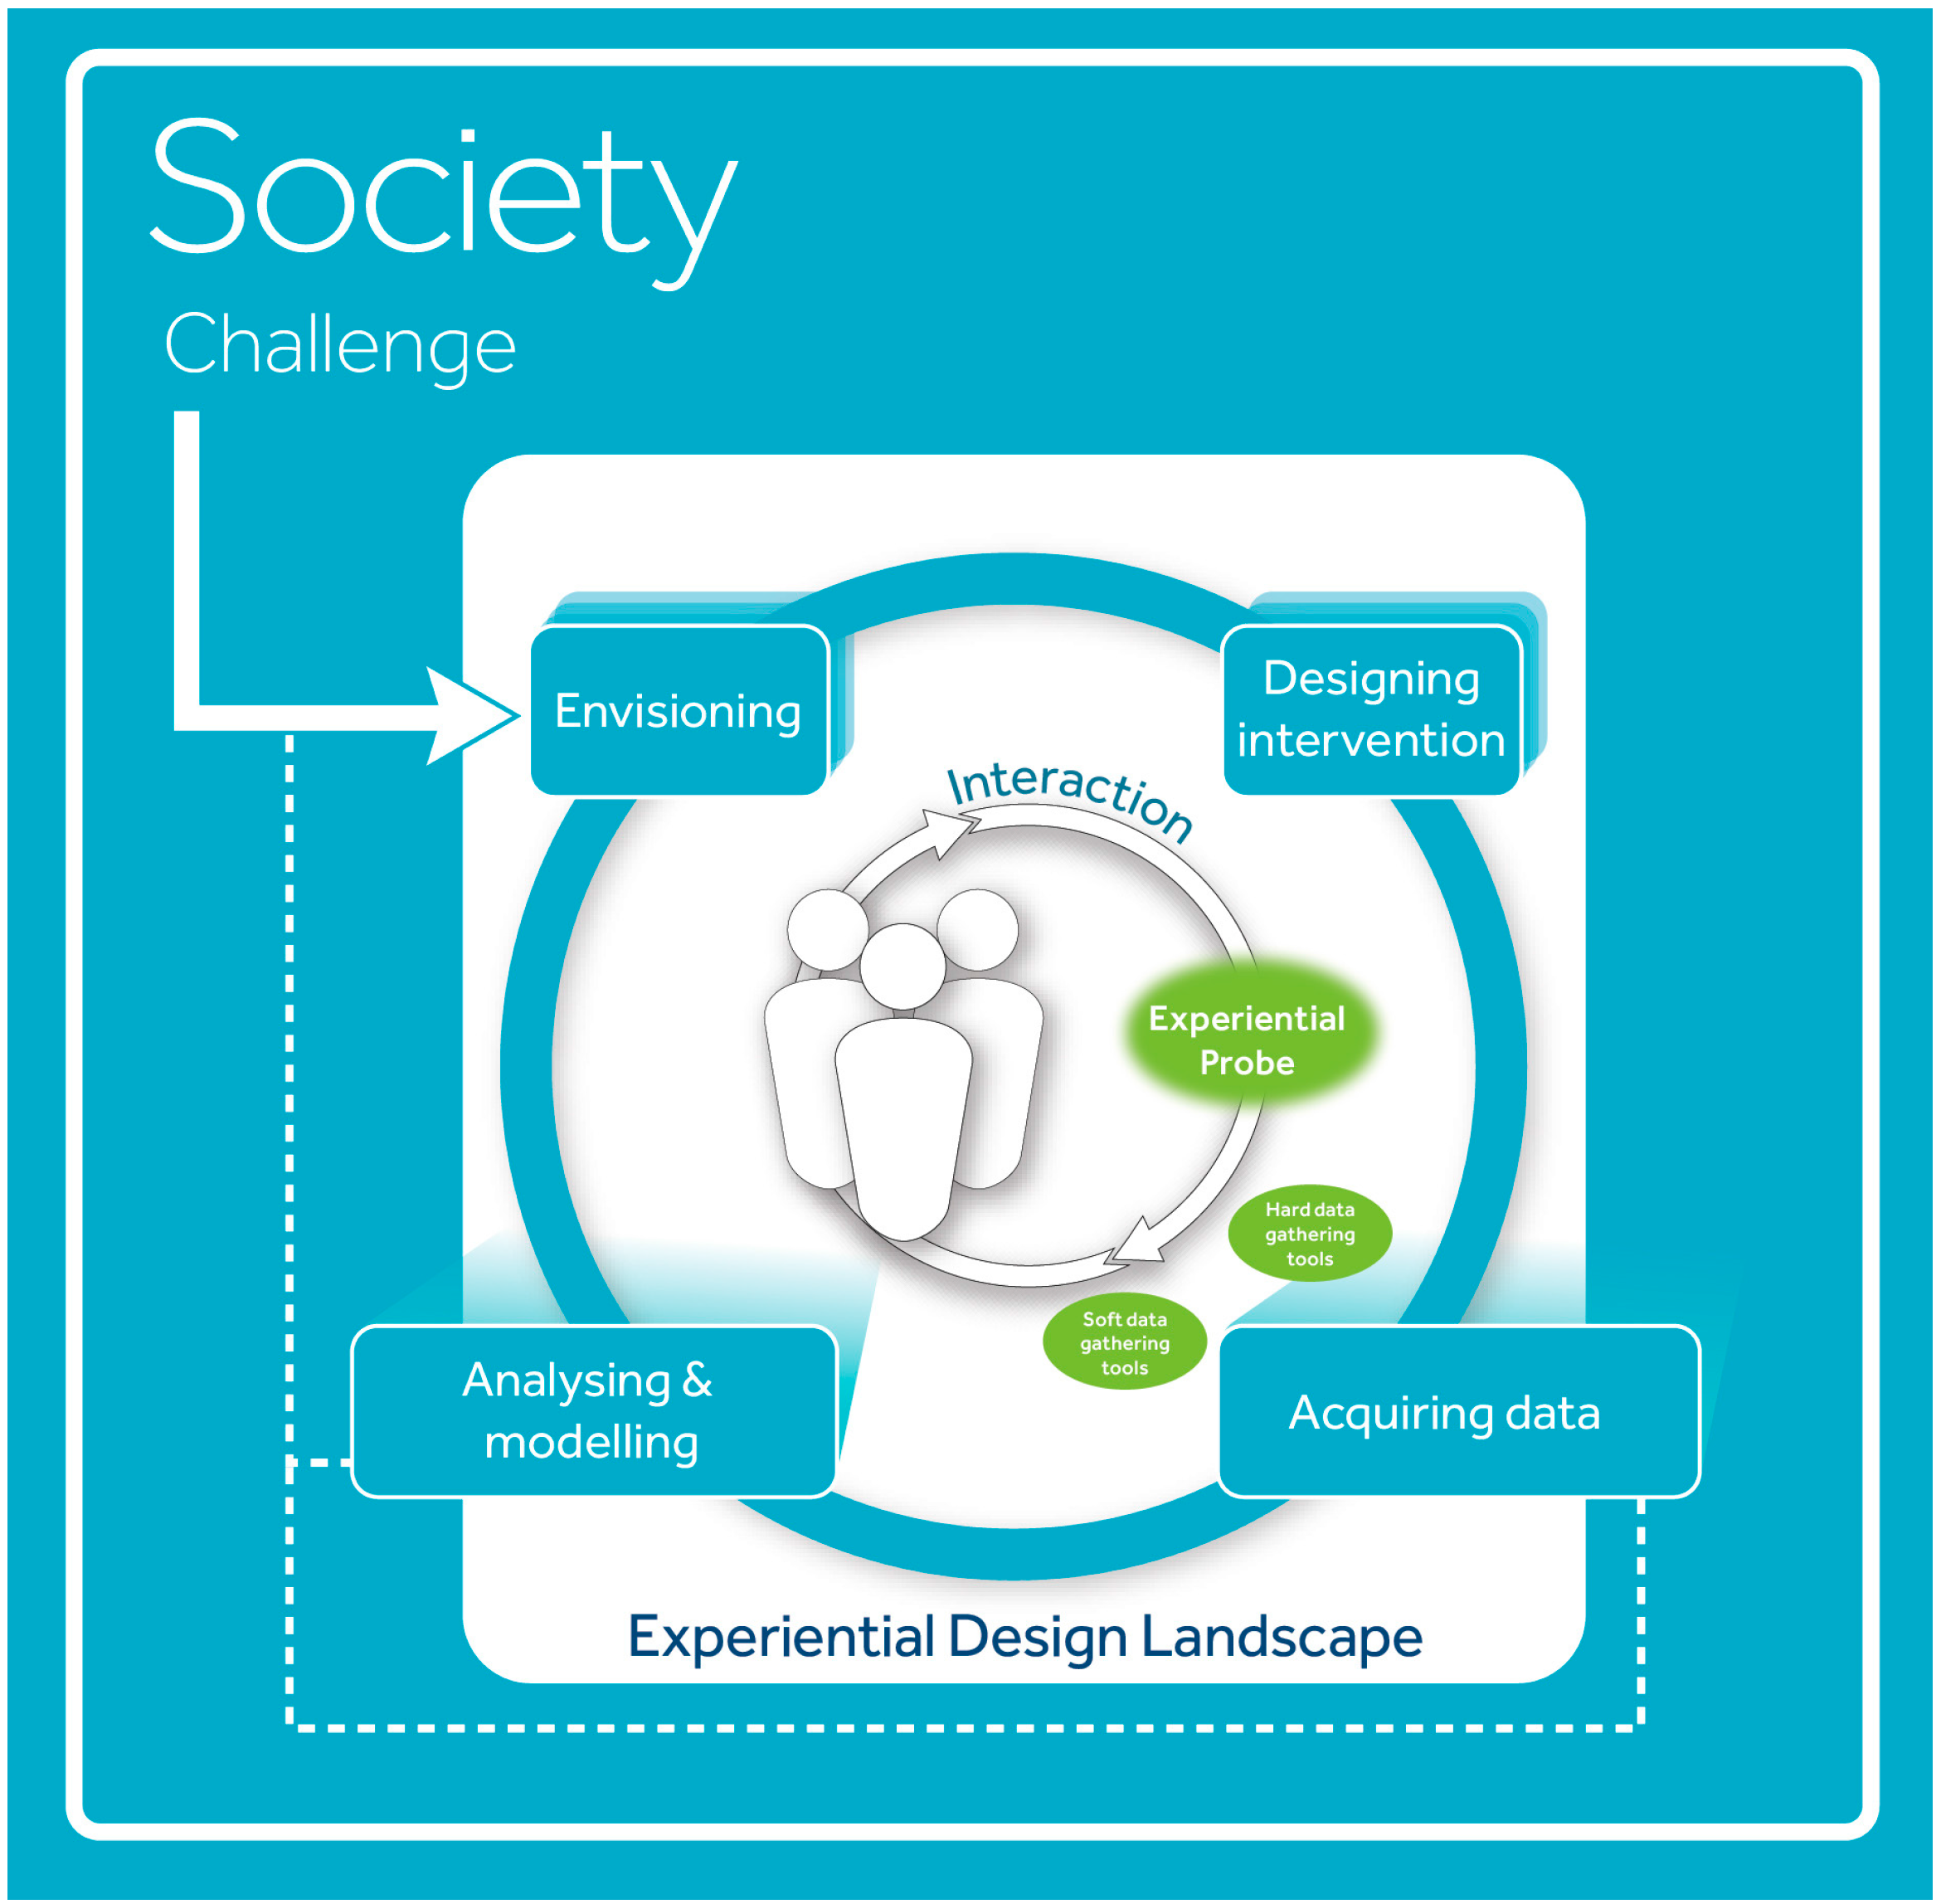
Figure 3.
A schematic overview of the EDL method, showing the cyclic nature of the method and the progress from explorations towards value propositions.
Figure 3.
A schematic overview of the EDL method, showing the cyclic nature of the method and the progress from explorations towards value propositions.

Figure 4.
Social Stairs elicited various types of emerging behaviour. Jumping and dancing on the stairs to create music was one of the most common ones.
Figure 4.
Social Stairs elicited various types of emerging behaviour. Jumping and dancing on the stairs to create music was one of the most common ones.

Figure 5.
From the first exploration to a sustainable EDL that can last for 6 months, which allowed the design research team to explore several Experiential Probes (EP) and the resulting emerging behaviour.
Figure 5.
From the first exploration to a sustainable EDL that can last for 6 months, which allowed the design research team to explore several Experiential Probes (EP) and the resulting emerging behaviour.

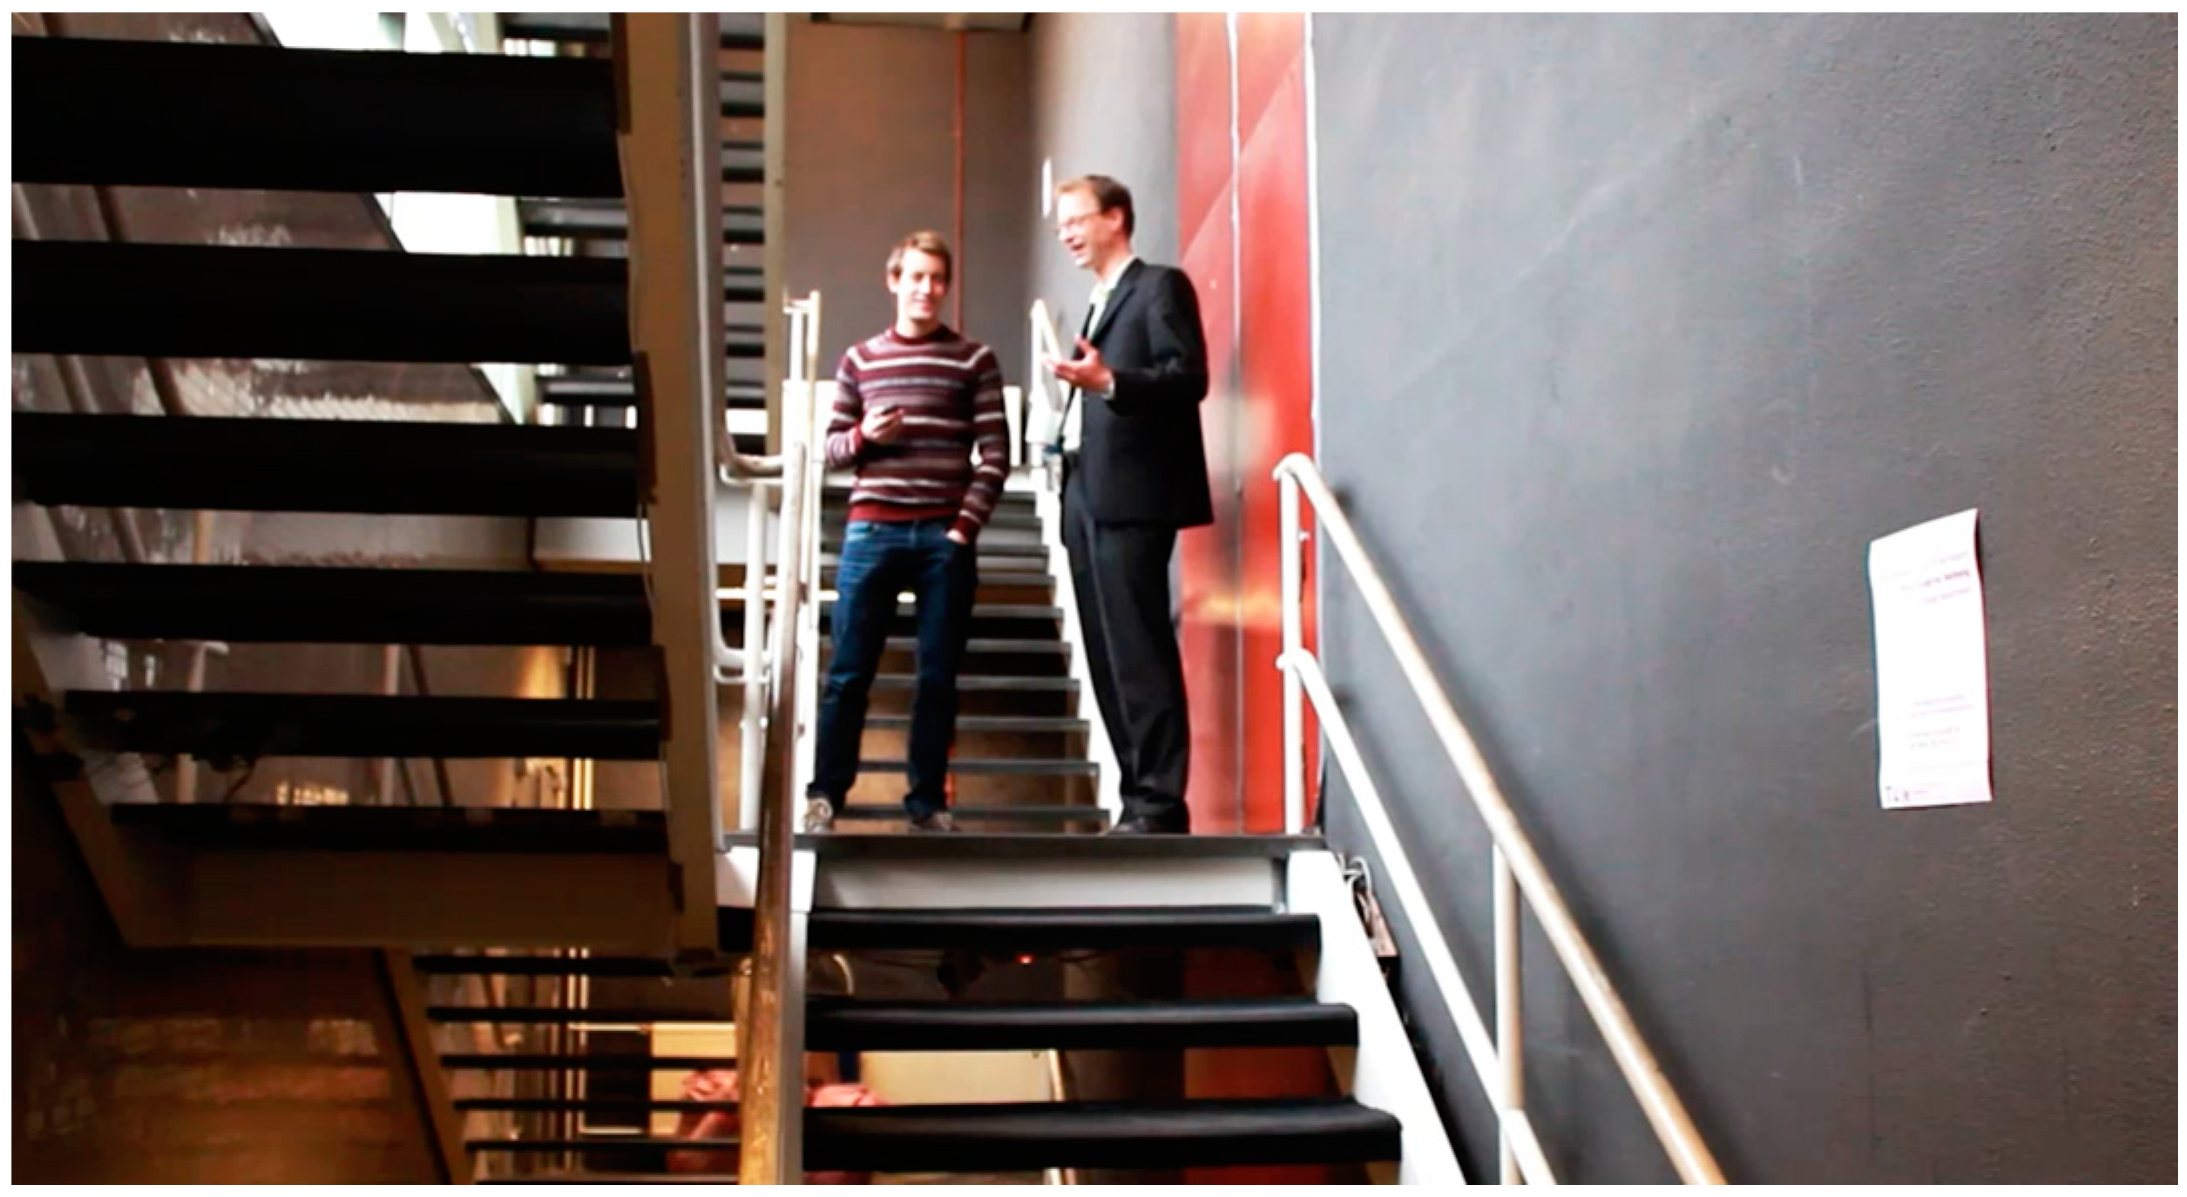
Figure 6.
Over the 6 months of the Social Stairs EDL several interviews were held in the EDL with the aim of gathering insights into why people behaved in the ways they did.
Figure 6.
Over the 6 months of the Social Stairs EDL several interviews were held in the EDL with the aim of gathering insights into why people behaved in the ways they did.

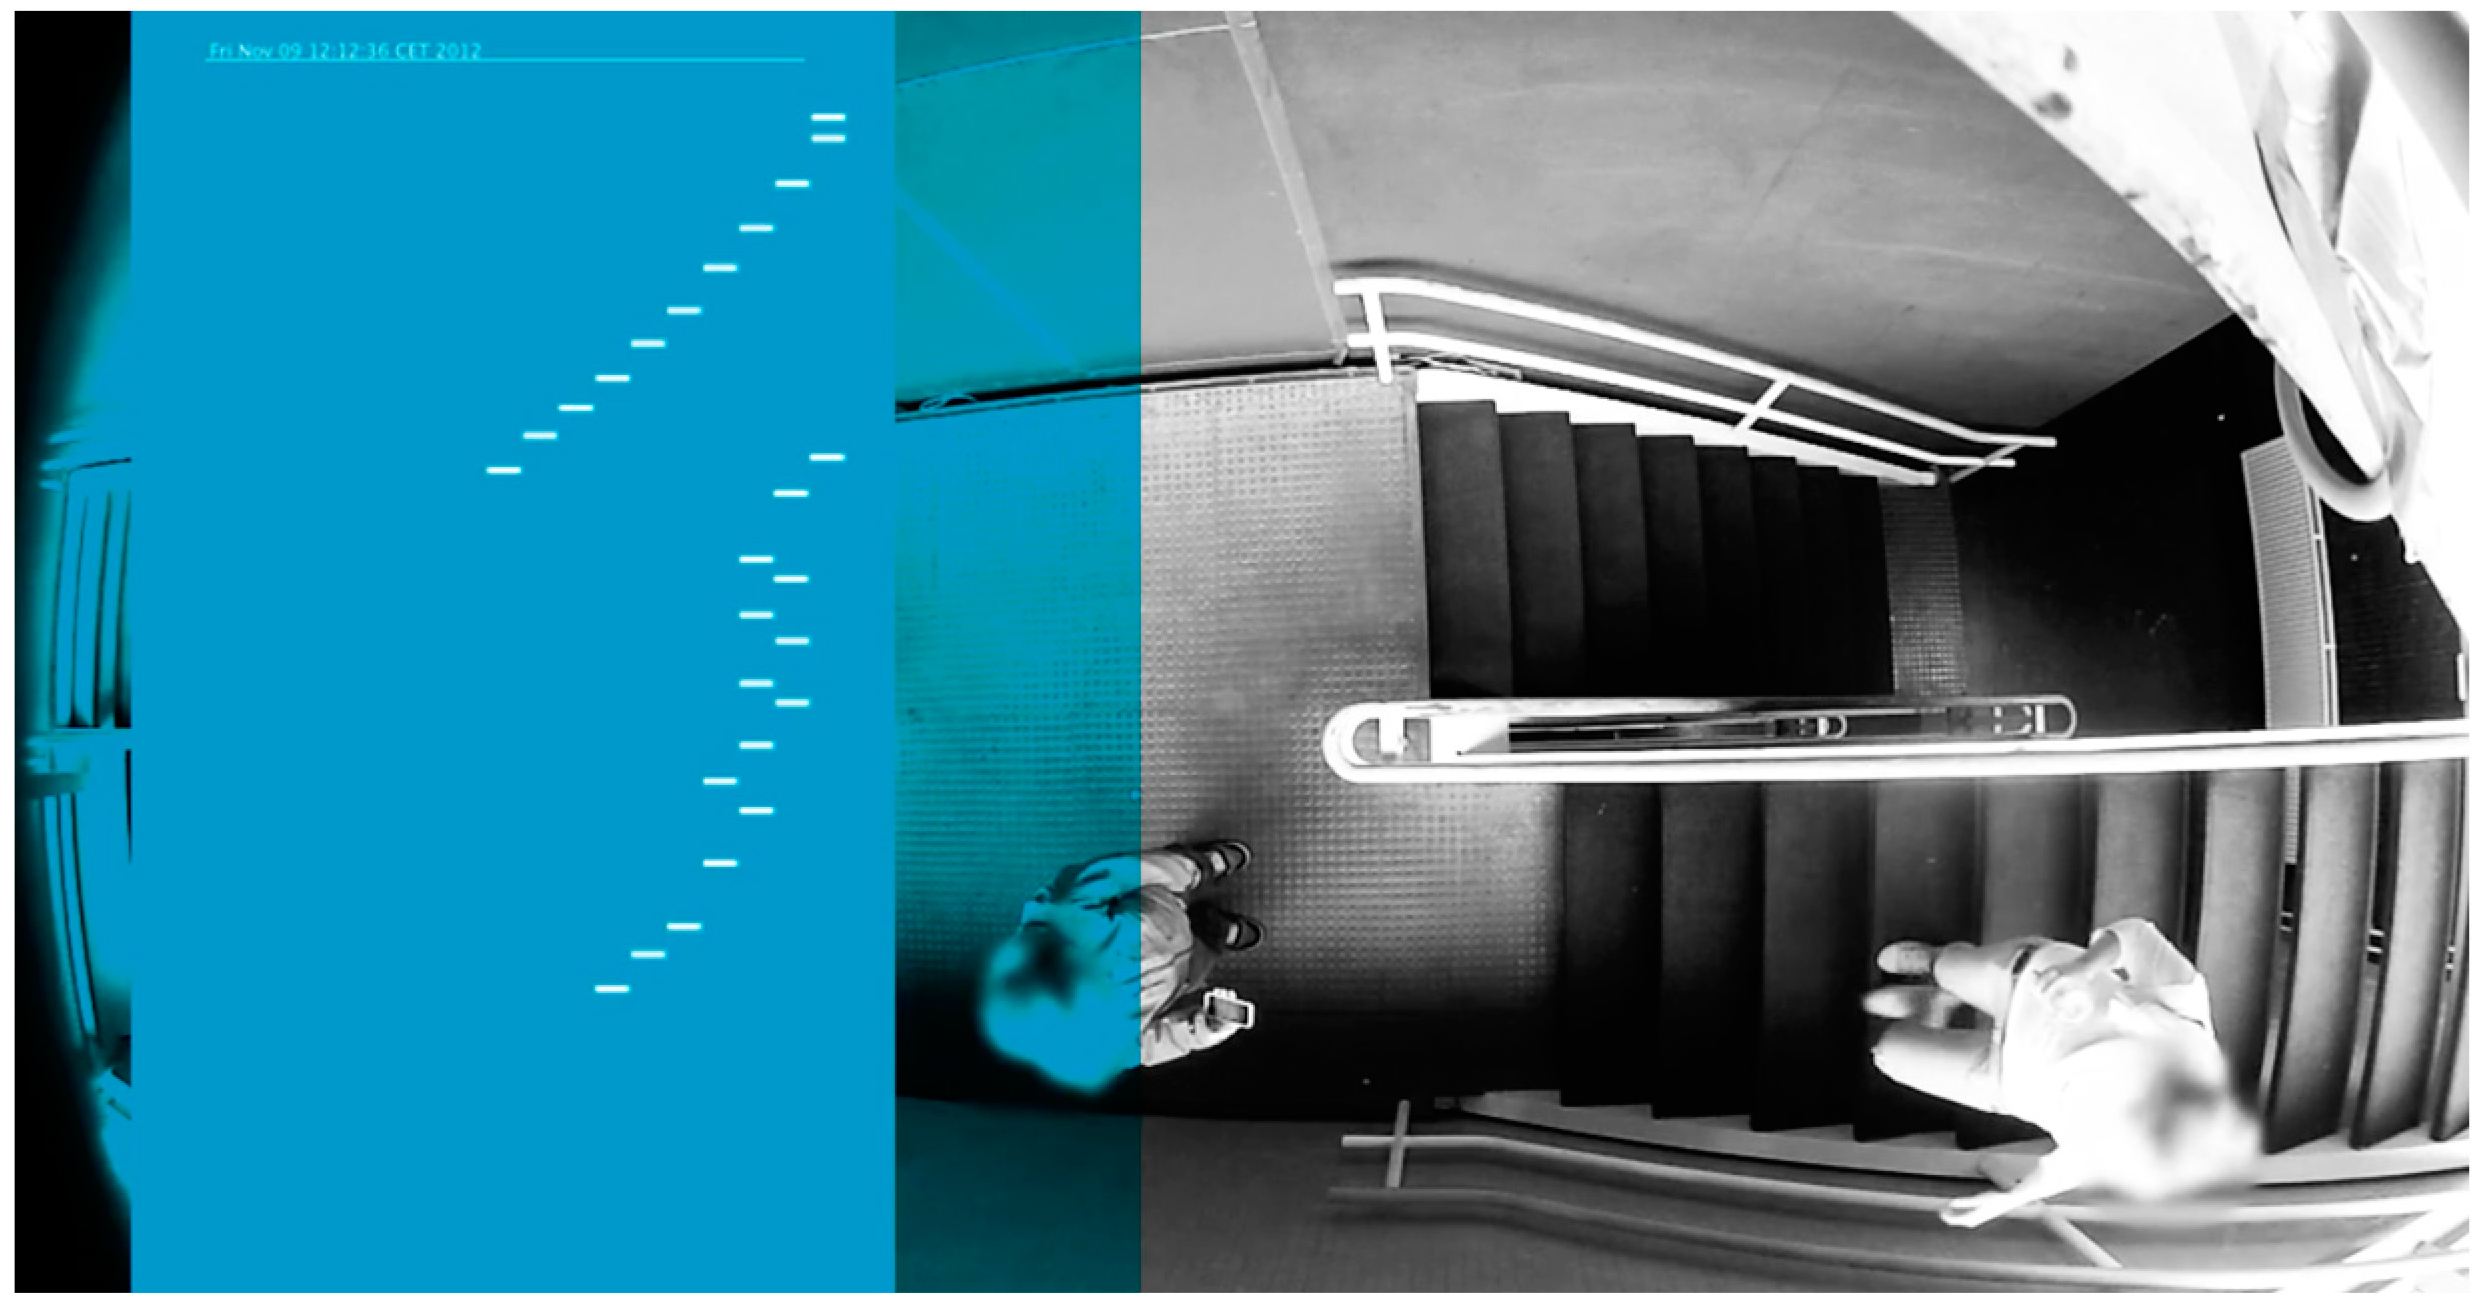
Figure 7.
The difference between a “normal” behaviour pattern (top) versus a deviant behaviour pattern (bottom) in the Social Stairs EDL in one use session.
Figure 7.
The difference between a “normal” behaviour pattern (top) versus a deviant behaviour pattern (bottom) in the Social Stairs EDL in one use session.

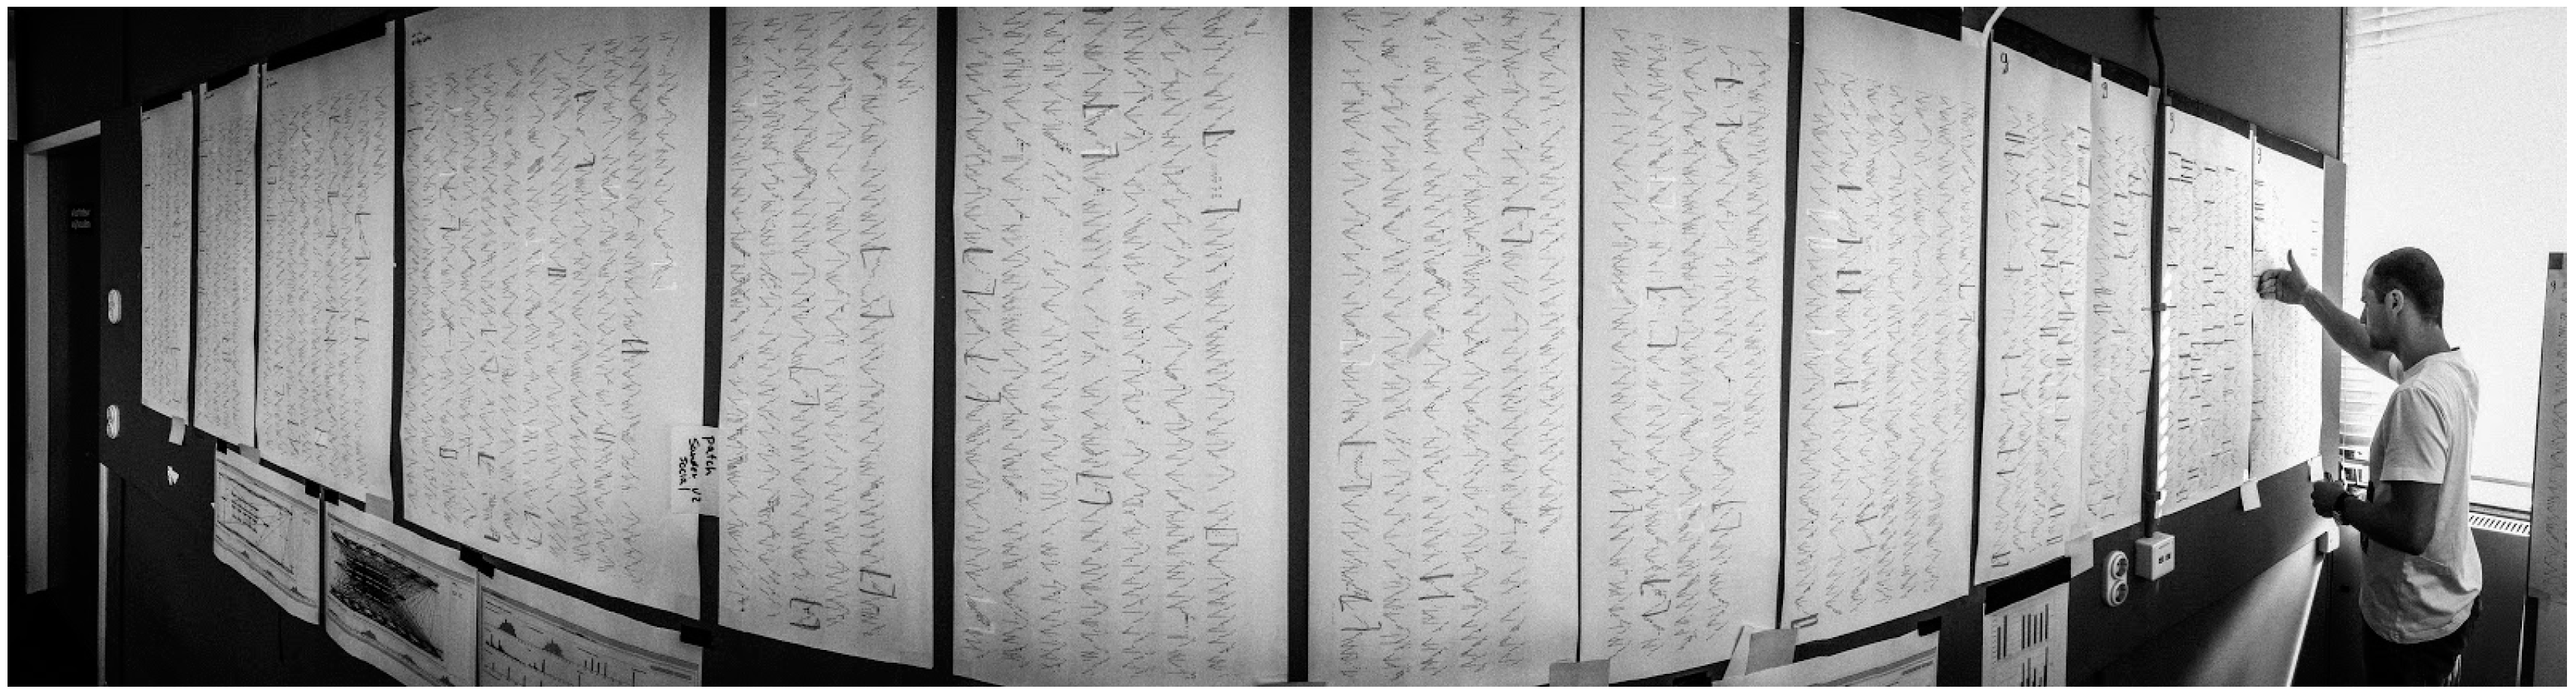
Figure 8.
The initial analysis of the data of the Social Stairs EDL at the Eindhoven University of Technology. Each sheet represents one day of data. This figure shows 13 days out of the total 6 months of data.
Figure 8.
The initial analysis of the data of the Social Stairs EDL at the Eindhoven University of Technology. Each sheet represents one day of data. This figure shows 13 days out of the total 6 months of data.

Figure 9.
The app [Y]our Perspective. A person launches a poll about the advisability of building the new stadium in the historical centre of the city (left); Another person receives the poll when walking in the area (right).
Figure 9.
The app [Y]our Perspective. A person launches a poll about the advisability of building the new stadium in the historical centre of the city (left); Another person receives the poll when walking in the area (right).

Figure 10.
The graphical interface of [Y]our Perspective inspired by the Conflict Spectrum.
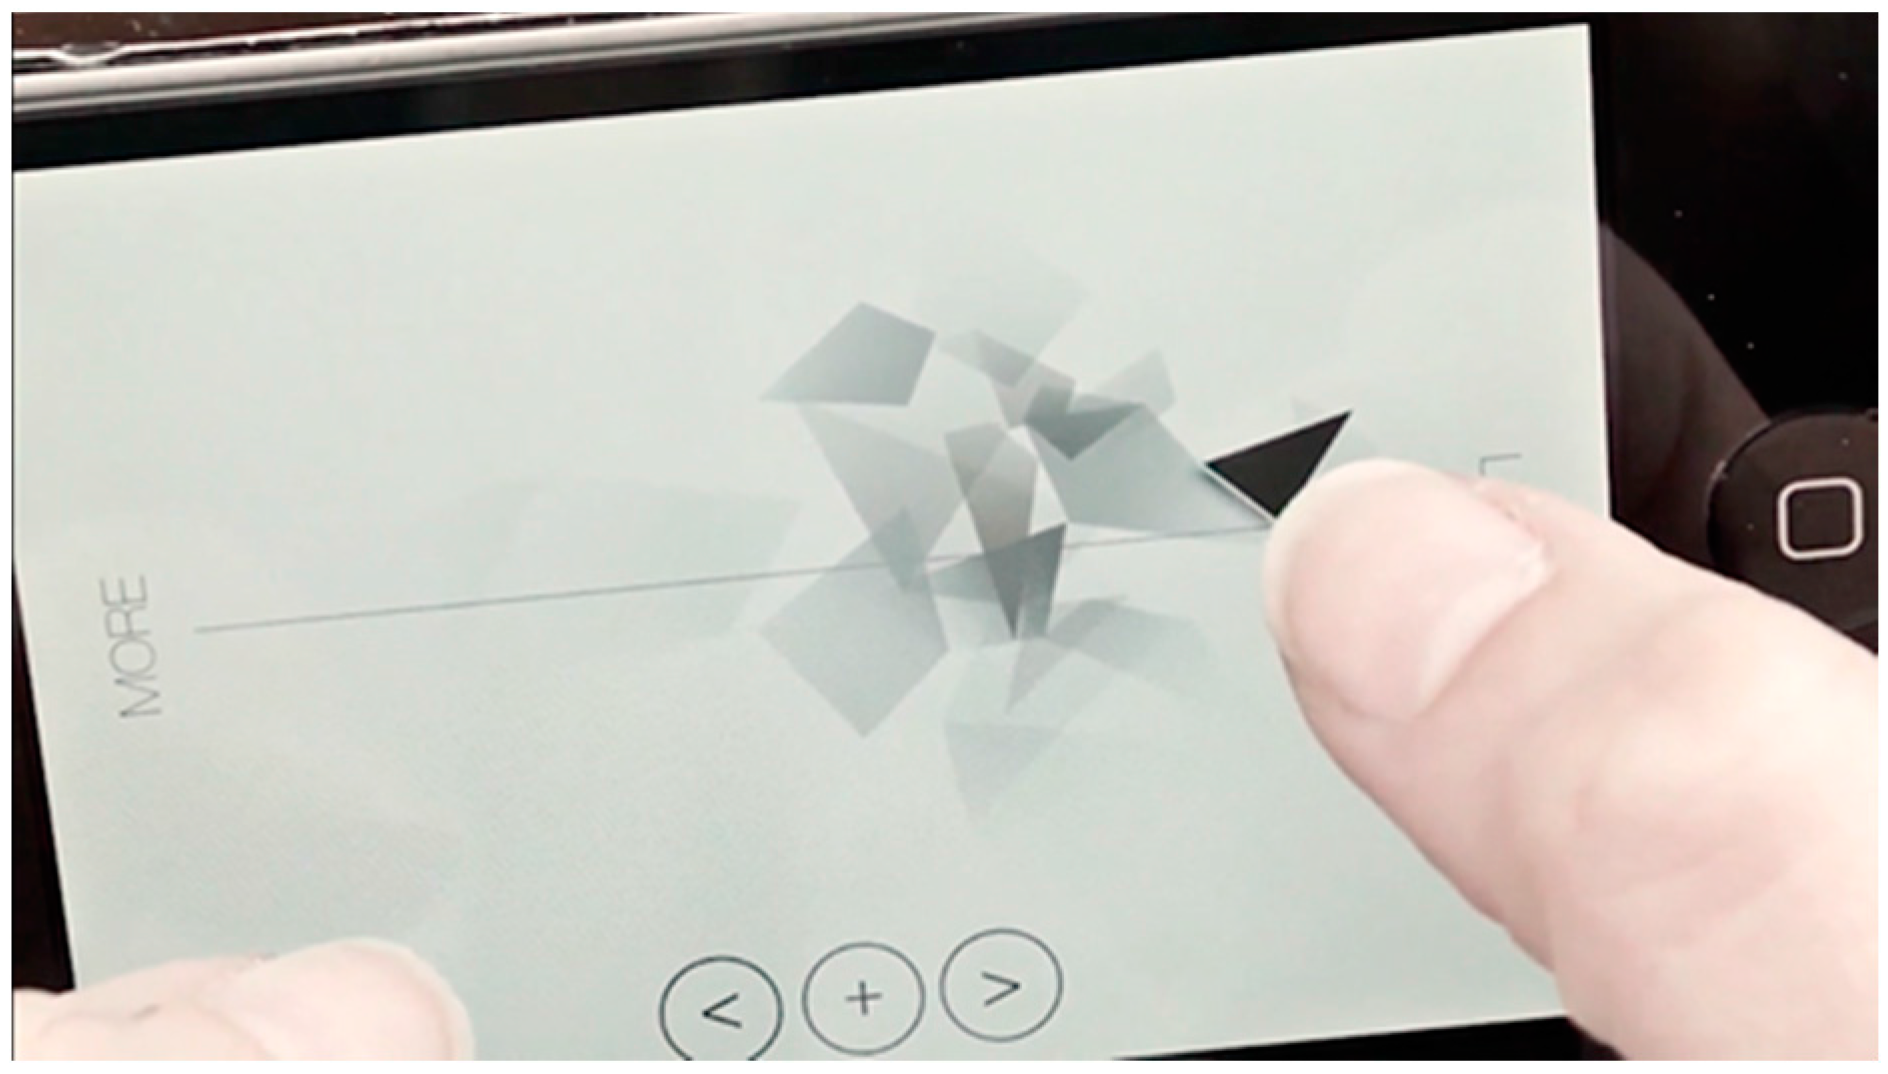
Figure 11.
The public consultation organised in Siena.

© 2016 by the authors; licensee MDPI, Basel, Switzerland. This article is an open access article distributed under the terms and conditions of the Creative Commons Attribution (CC-BY) license (http://creativecommons.org/licenses/by/4.0/).
Share and Cite
MDPI and ACS Style
Marti, P.; Megens, C.; Hummels, C. Data-Enabled Design for Social Change: Two Case Studies. Future Internet 2016, 8, 46. https://doi.org/10.3390/fi8040046
AMA Style
Marti P, Megens C, Hummels C. Data-Enabled Design for Social Change: Two Case Studies. Future Internet. 2016; 8(4):46. https://doi.org/10.3390/fi8040046
Chicago/Turabian StyleMarti, Patrizia, Carl Megens, and Caroline Hummels. 2016. "Data-Enabled Design for Social Change: Two Case Studies" Future Internet 8, no. 4: 46. https://doi.org/10.3390/fi8040046
Note that from the first issue of 2016, this journal uses article numbers instead of page numbers. See further details here.