1. Introduction
With the emergence of the global information era, computer networks have become an indispensable infrastructure. As a result of the continuous development of computer network technologies, the number of network offenses has been increasing rapidly, which has evolved from technical issues to global social issues, forcing national governments to adopt ways of maintaining the right of users and to implement tough sanctions on network criminals. In this context, network forensics can play an important role by offering scientifically proven methods to gather, process, interpret and use digital evidence to provide a conclusive description of cyber-crime activities [
1]. Both traditional digital forensics and network forensics would need to obtain or identify the potential electronic evidence. However, network forensics is different from traditional digital forensics in that it needs to extract and analyze dynamic communication data over the network to provide valid electronic evidences about the activities of attackers to the court. Network forensics have some common features with network intrusion detection, i.e., they all need to acquire network packets for analysis [
2]. The main difference is that while network intrusion detection only needs to detect intrusions and then respond to them, network forensics is the science of dealing with capturing, recording and analyzing network events and traffic in order to obtain the evidences of the intrusions.
Network forensic analysis is a process that analyzes intrusion evidence in the networked environments to identify suspicious users as well as actions in an attack scenario. Unfortunately, the overwhelming amount and low quality of network data makes it very difficult for analysts to obtain succinct presentation of complex multi-staged intrusions. In the current literature, network forensics techniques have been studied on the basis of forensic tools, process models and framework implementations. However, there is still a lack of comprehensive study on cybercrime investigation that uses network forensics frameworks along with a critical review of present network forensics techniques [
3].
In this paper, we present a modular analysis process in which evidence graph and evidence reasoning are applied to network forensics analysis. While the evidence graph provides the basis for evidence analysis, vulnerability evidence reasoning algorithm is used to reconstruct attack scenarios so as to backtrack the network packets to derive the original evidences. We will also perform some experiments to validate our proposed method and to compare our method to Wang’s network forensics analysis method [
4] primarily through using MIT Lincoln Laboratory LLDOS 1.0 and LLDOS 2.0.2 datasets [
5] to demonstrate the effectiveness and the accuracy of our method. Experiment results will demonstrate that evidence graph constructed using the proposed method is effective with certain reasoning ability and thus can be used as a powerful tool for rapid and effective network forensics analysis.
The remainder of this paper is organized as follows.
Section 2 contains a literature review of related research work.
Section 3 presents the proposed method and
Section 4 describes the experiments as well as the analysis of the results.
Section 5 summarizes the work that we have done and outlines some ideas for future work.
2. Related Work
Frequent occurrence of computer offenses has prompted the development of network forensic technologies. In the United States, computer-derived evidence has been accepted by the court since 1969. Network forensics was first proposed in the 1990s by Ranum [
6], who has been credited with defining network forensics as the “capture, recording and analysis of network events in order to discover the source of security attacks or other problem incidents”. Network forensics is defined by Palmer as “the use of scientifically proven techniques to collect, identify, examine, correlate, analyze, and document digital evidence from multiple, actively processing digital sources for the purpose of uncovering facts related to unauthorized activities meant to disrupt, corrupt, and/or compromise system components as well as providing information to assist in response to or to recover from these activities” [
7]. Based on the above definitions, Schwartz described the aim of network forensics as the reconstruction of network events to provide sufficient evidence to allow perpetrators to be prosecuted [
8].
In order to acquire evidences, various network forensic methods have been proposed to collect and analyze network data. Pilli proposed a method that collects packets under the TCP/IP protocol to analyze the common characteristics of attacks so as to filter suspicious packets [
9]. However, high data rate of network traffic creates difficulties for network forensics in the capture and preservation of all network packets [
10]. Kaushik, through scanning ports, found that attackers could find potential loopholes and then use these vulnerabilities to attack hosts [
11]. Roussev et al. outlined a method of collecting relevant data by utilizing latency-optimized target acquisition (LOTA) whereby the data is collected sequentially without the need for continually seeking to locate data [
12]. Data integrity plays a vital role in the process of network forensics, which expresses the ability of keeping accurate, complete and consistent data in the network. Mukkamala proposed a method that uses artificial intelligence techniques, such as ANNs (Artificial Neural Networks) and SVMs (Support Vector Machines), to ensure the integrity of evidence in network forensics [
13]. Xie et al. designed and implemented PIDAS, a Provenance aware Intrusion Detection and Analysis System that integrates both online intrusion detection and offline forensic analysis. The method expresses and reveals the causality-based relationship between the invasion process and the files that are infected [
14]. However, network forensics is different from intrusion detection and analysis by emphasizing on different points. Rekhis and Boudriga developed an Investigation-based Temporal Logic of Actions and a high level specification language for digital investigation [
15], entitled I-TLA and I-TLA
+, respectively. I-TLA
+ can be used to generate executable specifications of attack scenarios, showing sufficient details about how an attack is conducted and how the system behaves accordingly. Our method will generate attack scenarios and identify multi-staged attacks through evidential reasoning.
Today’s Industrial Control Systems (ICSs) operating in critical infrastructures (CIs) are becoming increasingly complex. Settanni et al. presented a collaborative approach to protecting cyber incident information in which extensive use of the proposed pan-European incident management system was outlined [
16]. Cherdantseva et al. indicated that although there were already a number of risk assessment methods for SCADA (Supervisory Control and Data Acquisition) systems, there was still the need for further research and improvement [
17]. While being able to aid the investigation of attacks by tracing the attacks back to their sources and attributing crimes to individuals, hosts or networks, network forensics should also have the ability to predict future attacks by constructing attack patterns from existing traces of intrusion data [
18]. Network forensics should provide functionalities such as attacker identification and attack reconstruction to complement the traditional intrusion detection and perimeter defense techniques in building a robust security mechanism. Chen et al. proposed a scalable forensics mechanism to identify the origin of stealthy self-propagating attacks [
19] in which spatial and temporal contact activities are utilized to reduce the traffic volume and to back track the attacks. Causality reasoning on network events can help relationship discovery and provide detailed insights on event relations. Zhang et al. applied machine learning methods to detecting malware activities through network traffic analysis [
20] and developed an approach to analyze programs as black boxes from the network perspective. However, the problem is different from the one that we concern about.
Ammann proposed a method based on the “map” of network vulnerability analysis, which shows the evidences using an evidence graph [
21]. Palmer proposed a method that uses an attack graph to display the route of attackers and takes the attack graph as the evidence [
7]. Rasmi et al. proposed to use attack graphs for network intrusion detection to identify the intentions of attackers, which can provide help for the detection of network intrusions [
22,
23]. Liu suggested a method to codify federal rules on digital evidence in a Prolog based tool to construct an evidence graph to visualize the corresponding attack scenarios that have happened in an attacked network [
24]. Wang and Daniels (2008) developed a graph-based approach toward network forensics analysis. An evidence graph model would facilitate evidence presentation and automated reasoning [
25]. Tian developed a real-time network intrusion forensics method called NetForensic [
2], thus introducing vulnerabilities into the network intrusion forensics field. The evidence graph that is used to display network evidences has been gradually improved over the years.
Nonetheless, current network forensics methods exhibit the following common shortcomings:
Evidence from a single source (only network packets or alerts from network intrusion detection systems) may lead to incomplete or misleading evidences.
Data preprocessing methods used in the network forensics may lead to accuracy problem since such methods are generally less accurate to ensure that the result data is truly related to the particular crime event.
Some methods do not employ data preprocessing, resulting in low efficiency when dealing with a huge quantity of data.
The network forensics method that we propose in this paper thus has the following merits:
Our method can process data from multiple sources, which would help to produce more and complete evidences.
Our method uses the machine learning algorithm of SVM to filter suspicious data.
Our method uses Event Vector (EV) to unify heterogeneous data before storing and analyzing them.
Our method employs network vulnerability analysis to derive forensic results.
3. The Proposed Method
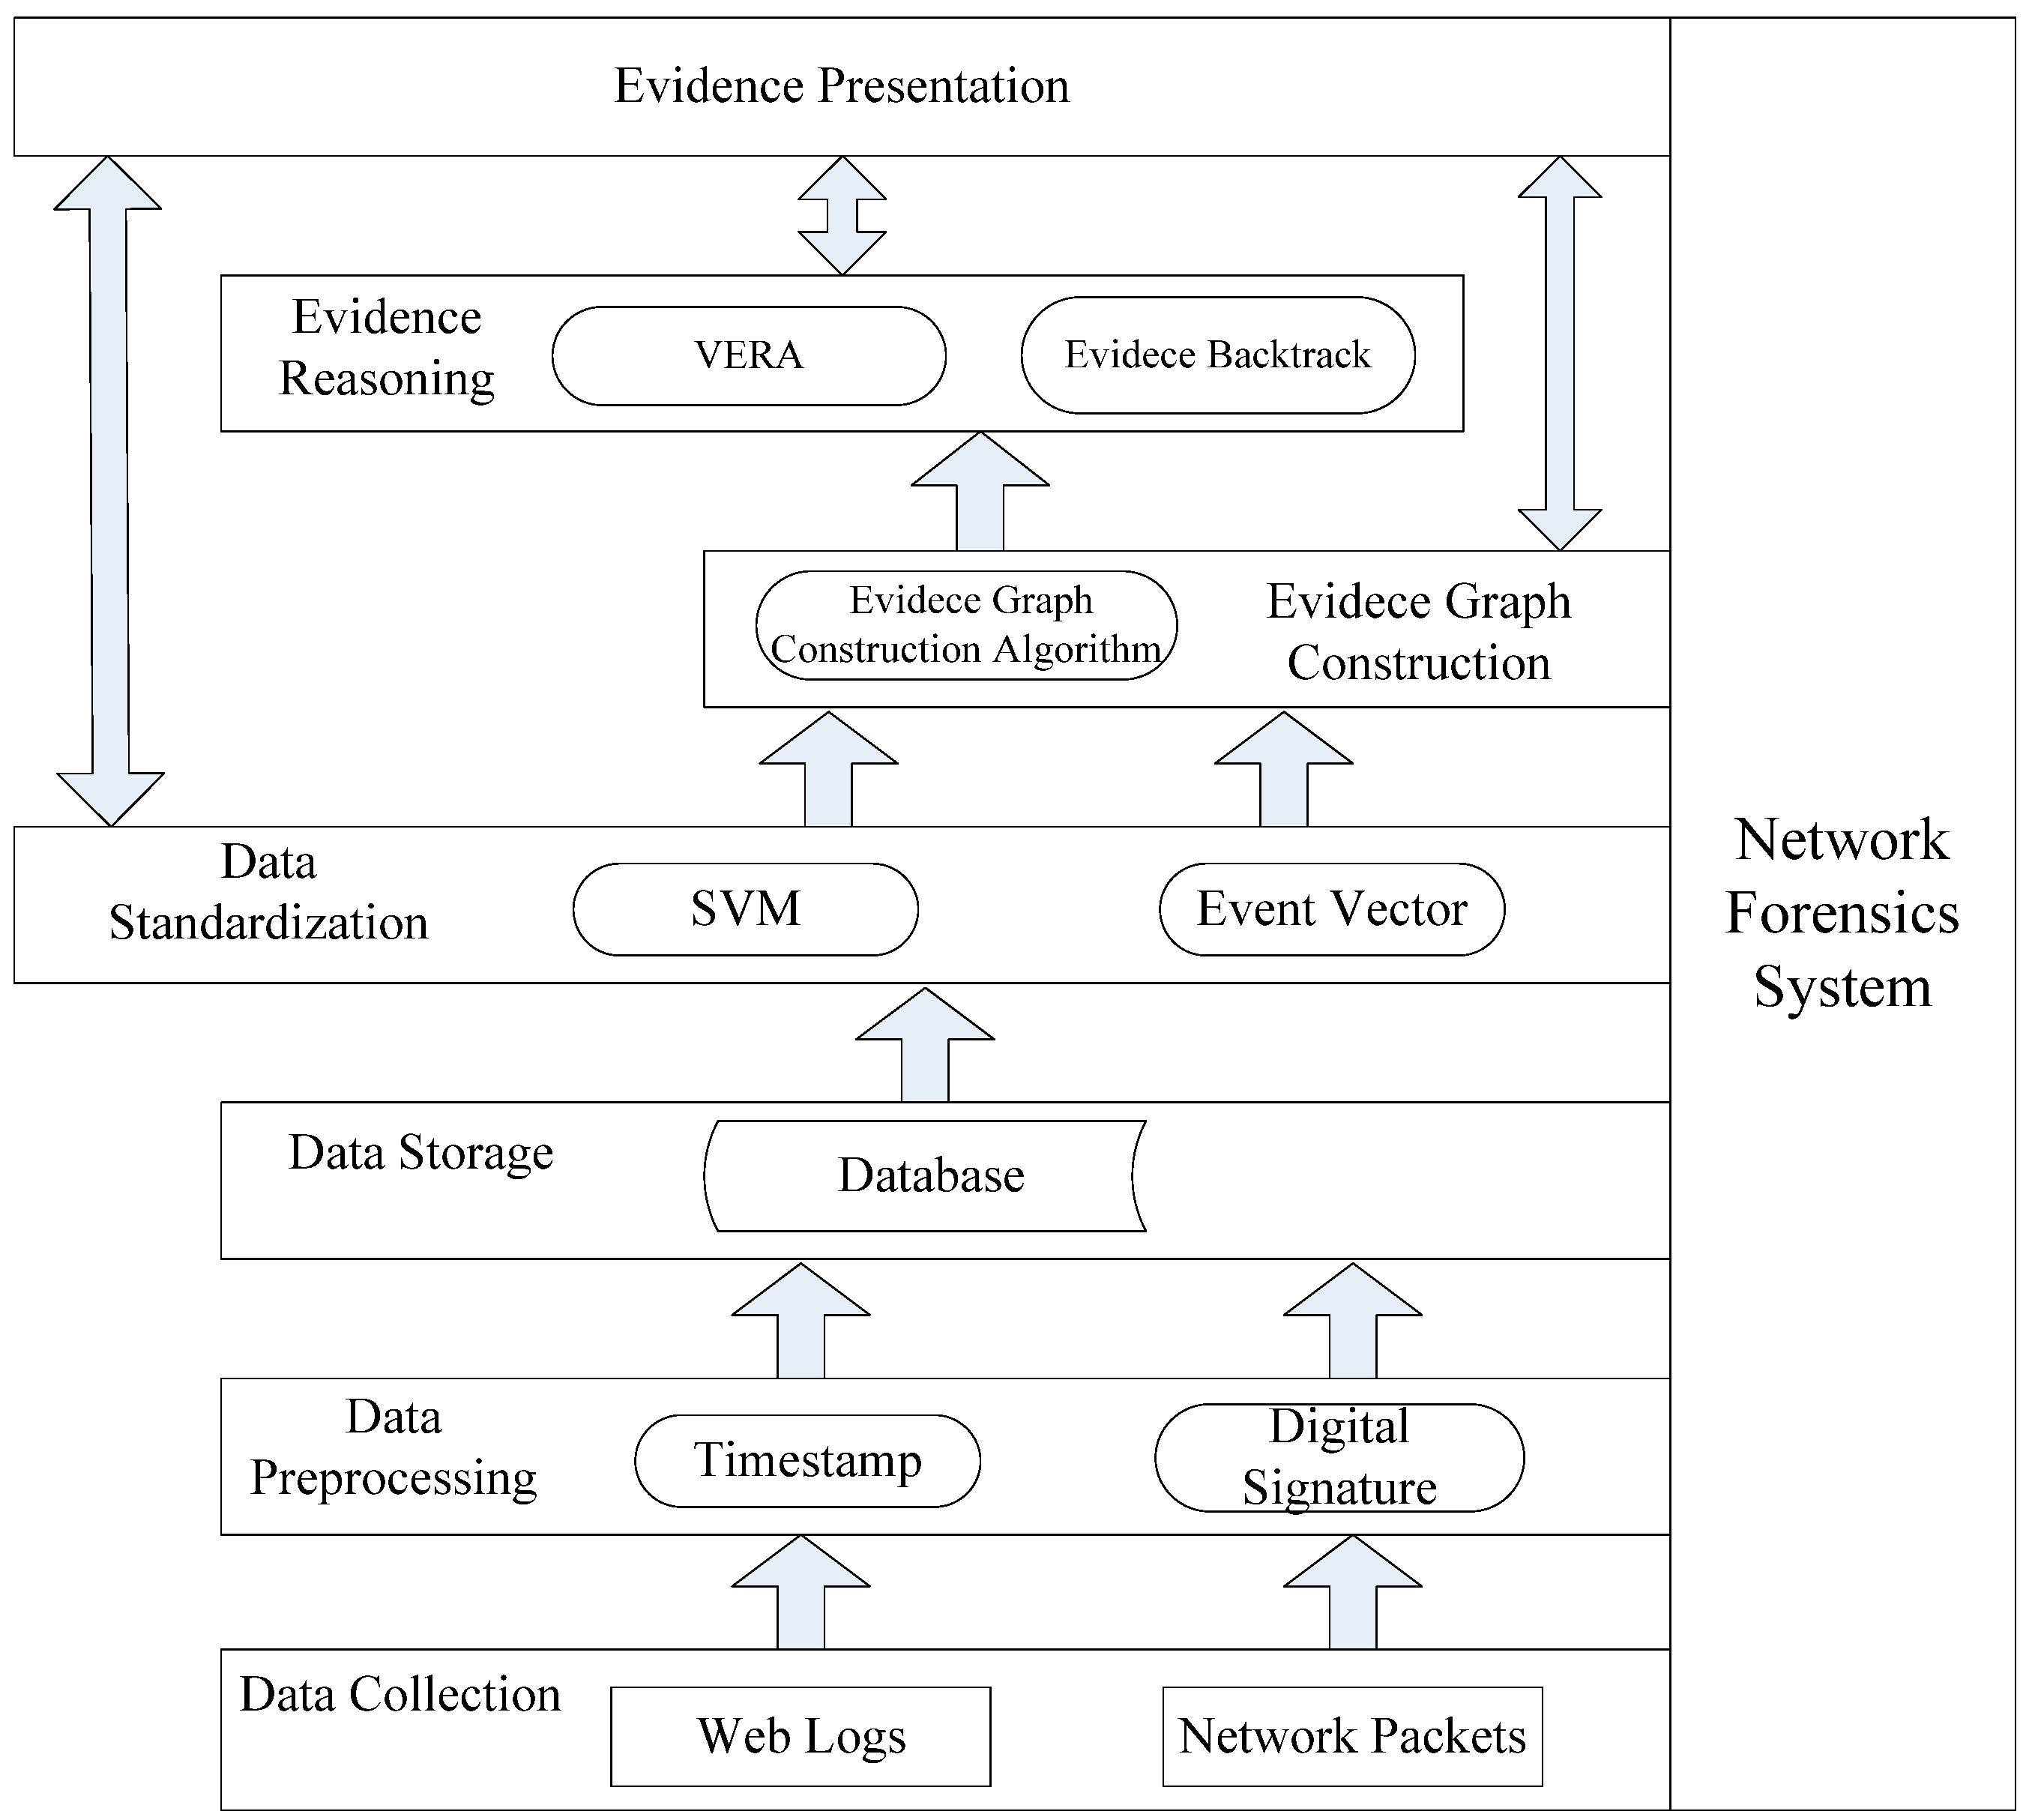
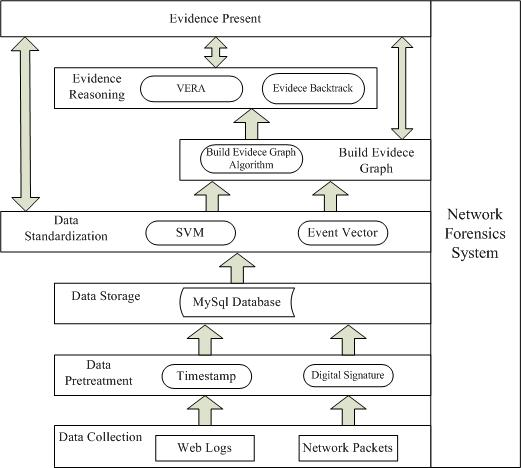
Our proposed method combines evidence graph and vulnerability reasoning. To ensure that the method follows certain procedures, we first propose a new network forensics framework that conforms to the general principles of network forensics. The framework is shown in
Figure 1.
The functionality of each component in the framework is briefly described below:
Data collection module collects digital evidence (network program logs and network packets) from heterogeneous nodes deployed in the network in which network packets are the primary sources and network program logs are the accessorial ones.
Data preprocessing module adds digital signature and timestamp to digital evidence to ensure the integrity of the data.
Data storage module stores collected data into a database to ensure data authority and non-repudiation.
Data standardization module extracts the common fields from the collected data, converts them into a unified format and presents the results as an event vector. In addition, SVM is used to filter out benign packets and suspicious packets so as to reconstruct accurate evidence graph using the suspicious packets.
Evidence reasoning module uses the vulnerability evidence reasoning algorithm (VERA) to infer attacked nodes as well as the attacking routes. Primary data can also be backtracked to provide more and clearer evidence.
Evidence presentation module uses the evidence graph to show final evidence, which would include the intrusion nodes as well as the operations between nodes.
Note that core to our analysis method are the data standardization module, the evidence graph construction module and the evidence reasoning module. The evidence graph construction module constructs the evidence graph based on preprocessed data and updates graph attributes. Afterwards, the evidence reasoning module performs attack scenario inference based on the graph structure. In the following, we will describe these main modules in more details.
3.1. Data Collection
The Scientific Working Group for Digital Evidence (SWGDE) defined electronic evidence as information of probative value that is stored or transmitted in a binary form [
26]. Casey noted electronic evidence as any constitution or relevant digital data that is enough to prove a crime in terms of computer and network storage media [
27]. In order to make the evidence from network forensics valid, the following principles should always be obeyed:
Primitiveness of evidence: evidence should never be changed or destroyed.
Integrity of evidence: analysis and transmission process must ensure the integrity of data.
Continuity of evidence: when network evidence is submitted to the court, the evidence should illustrate the process of the relevant events.
Authentication of evidence: the whole process of evidence collection must be properly supervised.
The evidence in network forensics may come from multiple sources or different channels. In our study, cyber-crime data include but are not limited to the following sources:
Network packets;
Operating system log files;
Anti-virus software log files;
IIS server log files, FTP server log files, etc.;
Firewall log files.
Heterogeneous data is collected from the above sources, among which network packets are the primary source. Although attributes of evidence may vary with different sources, some essential fields apply to all categories of evidence and should be converted into a unified format.
3.2. Data Standardization
Tasks in the data standardization stage include normalization and filtration. All types of evidence from heterogeneous sources should be converted into a uniform format for analysis.
3.2.1. Event Vector
Event vector (EV) is defined as: EV = <ID, Source, Target, Operation, Timestamp, Data_Source>, which can be expressed as:
In an EV, source represents the main enforcer, target represents the object that is the bearer of the event, operation is an action that is executed by the source that would influence the target, timestamp indicates the time of the operation, and Data_Source indicates where the digital vector originates from, i.e., a network packet or a log file. These data fields are stored in the form of an event vector, which would help to construct the evidence graph.
According to the definition of EV, a child process that is invoked by a parent process can be expressed as:
The parent process is the source, the child process is the target and fork is the operation. If the child process writes into a file next, it can be expressed as:
The child process is the source, the file is the target and write is the operation.
Similarly, according to the definition of EV, a network packet can be defined as <ID, IP1, IP2, Visit, Timestamp, Net packet>, which can be expressed as:
Event vectors are used to unify the collected data which will be used to construct the evidence graph to facilitate the analysis of evidence for investigation.
3.2.2. Support Vector Machine (SVM)
Machine learning techniques are widely used in data mining in general and network traffic analysis in particular. Support vector machine (SVM) [
28] is one of the most popular supervised learning algorithms for both regression and classification problems due to its robustness and high accuracy. SVM is capable of accurately classifying network traffic through using a small set of training samples, making it an effective tool to perform network packet classification. We will use the widely popular open source SVM code LIBSVM [
29] in our experiments to separate suspicious packets from all other packets. This is because the large percentage of redundancy that exists in network packets would make it difficult to analyze attacks in an efficient manner. We thus use SVM to filter out benign packets and suspicious packets and then use the suspicious packets to construct an accurate evidence graph.
The use of the LIBSVM generally involves two steps: first, training a data set to obtain a model and second, using the model to predict information of a testing data set. We adopt the data that was acquired from the 1998 DARPA intrusion detection evaluation program which is blasted with multiple attacks in a local area network (LAN) that simulated a typical U.S. Air Force LAN. For each TCP/IP connection, 41 various quantitative and qualitative features (KDD-CUP-99 [
30] Task Description) were extracted. We partition the packets into two classes: normal and attack, where the attack packets consist of the collection of all 22 different attacks. In the experiment, all attack packets are classified and labeled as +1 and normal data as −1. We use a training set of 7312 data items with 41 features. The data set contains benign packets and suspicious packets.
First, we transform each and every packet into a matrix that consists of 41 features and a class flag as shown in the following example records:
| duration, protocol_type, service, flag, src_bytes, dst_bytes, land, wrong_fragment, urgent, hot, num_failed_logins, Logged in, num_compromised, root_shell, SU_attempted, num_root, num_file_creations, num_shells, num_access_files, num_outbound_cmds, is_hot_login, is_guest_login, count, serror_rate, rerror_rate, same_srv_rate, diff_srv_rate, srv_count, srv_serror_rate, srv_rerror_rate, srv_diff_host_rate, dst_host_count, dst_host_srv_count, dst_host_same_srv_rate, dst_host_diff_srv_rate, dst_host_same_src_port_rate, dst_host_srv_diff_host_rate, dst_host_serror_rate, dst_host_srv_serror_rate, dst_host_rerror_rate, dst_host_srv_rerror_rate |
| 0,tcp,http,SF,210,151,0,0,0,0,0,1,0,0,0,0,0,0,0,0,0,0,8,8,0.00,0.00,0.00,0.00,1.00,0.00,0.00,8,89,1.00,0.00,0.12,0.04,0.00,0.00,0.00,0.00 |
| |
| 0,tcp,http,SF,212,786,0,0,0,1,0,1,0,0,0,0,0,0,0,0,0,0,8,8,0.00,0.00,0.00,0.00,1.00,0.00,0.00,8,99,1.00,0.00,0.12,0.05,0.00,0.00,0.00,0.00 |
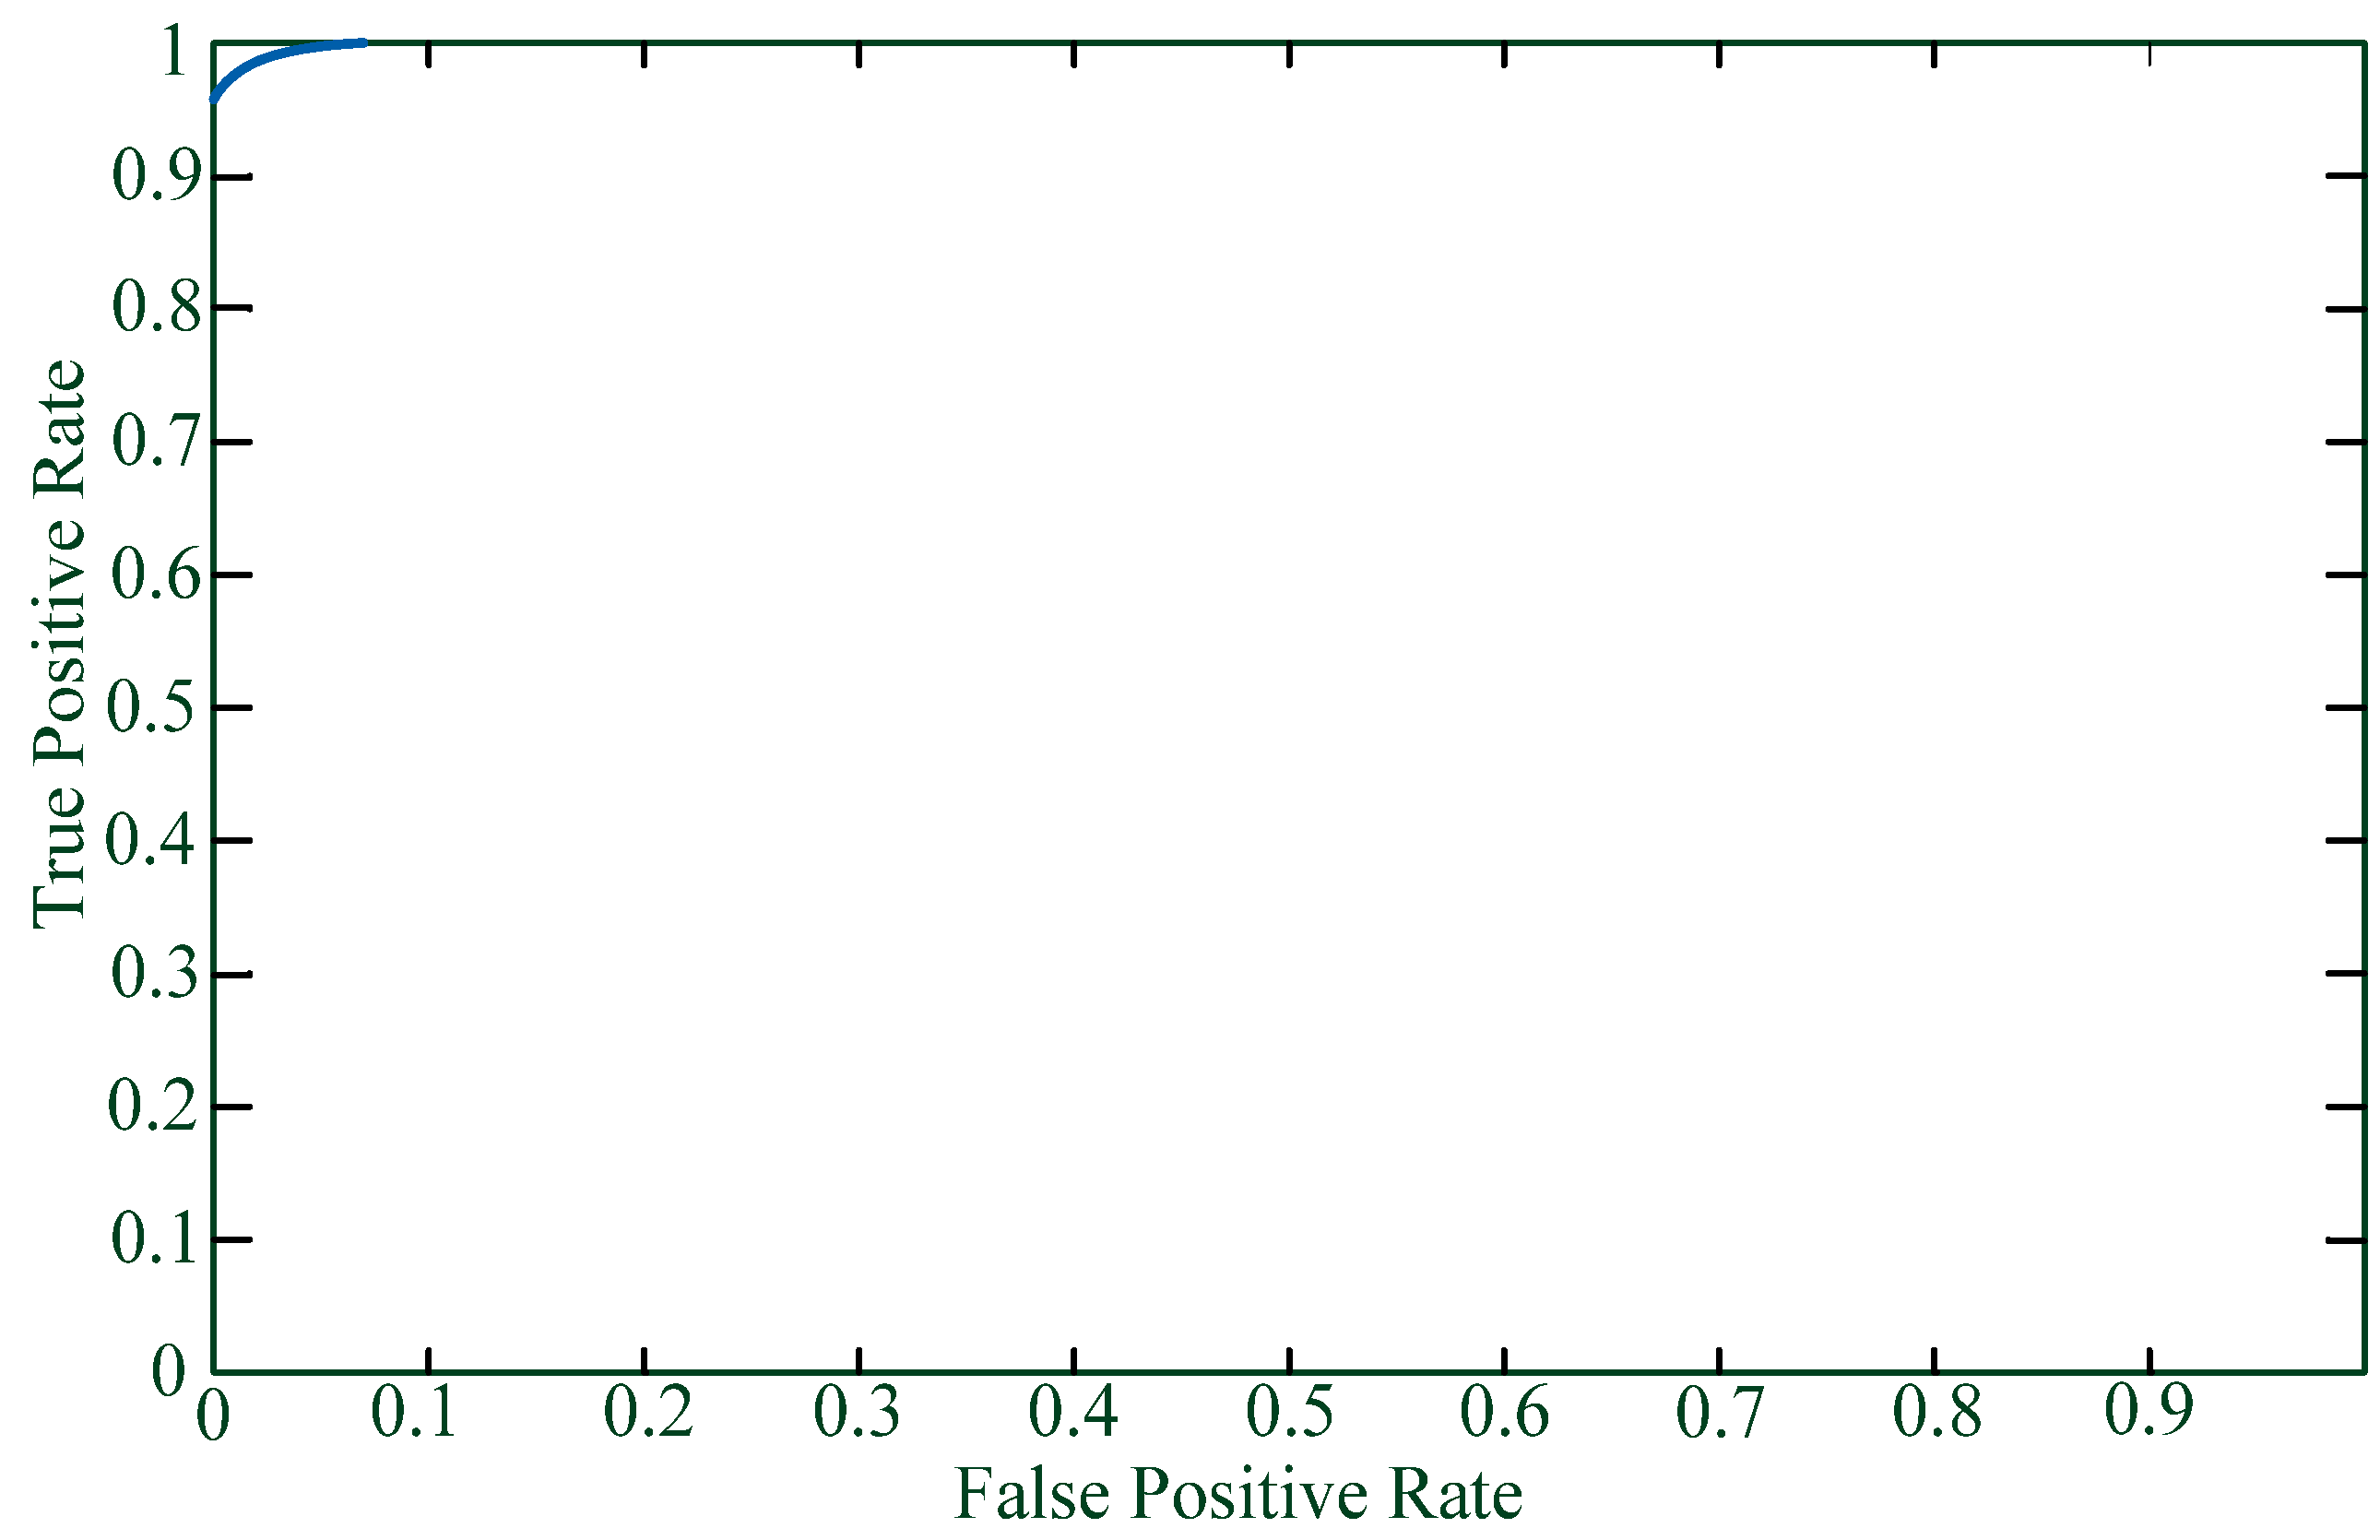
All packets are transformed into the above format and are then stored in a matrix named “data” as the training data. Then, we place the class tag (1 or −1) in a “label” variable. The “data” matrix is an attribute matrix where the number of rows and columns are determined by the number of samples and the number of attributes, respectively. The “label” variable is a class tag (1 or −1). Lastly, we use LIBSVM to build a classification model which we have used to test 6980 data items with 41 features. The method of processing the test data is the same as the above and
Table 1 lists the results while
Figure 2 shows the ROC curve.
Network packet classification would filter out suspicious packets from a dataset and the result will be stored in the form of the event vector. With data standardization, we can use standardized data to construct an evidence graph.
SVM is used to filter out benign packets and suspicious packets so as to construct a more accurate evidence graph using the suspicious packets. Therefore, the key to SVM classification is to filter out suspicious packets and the ROC curve shows the TPR and FPR of attack class. TPR expresses the true positive rate as the
Y axis of the ROC curve while FPR expresses the false positive rate as the
X axis of ROC curve. We can see from
Figure 2 the high accuracy of SVM in filtering out suspicious packets.
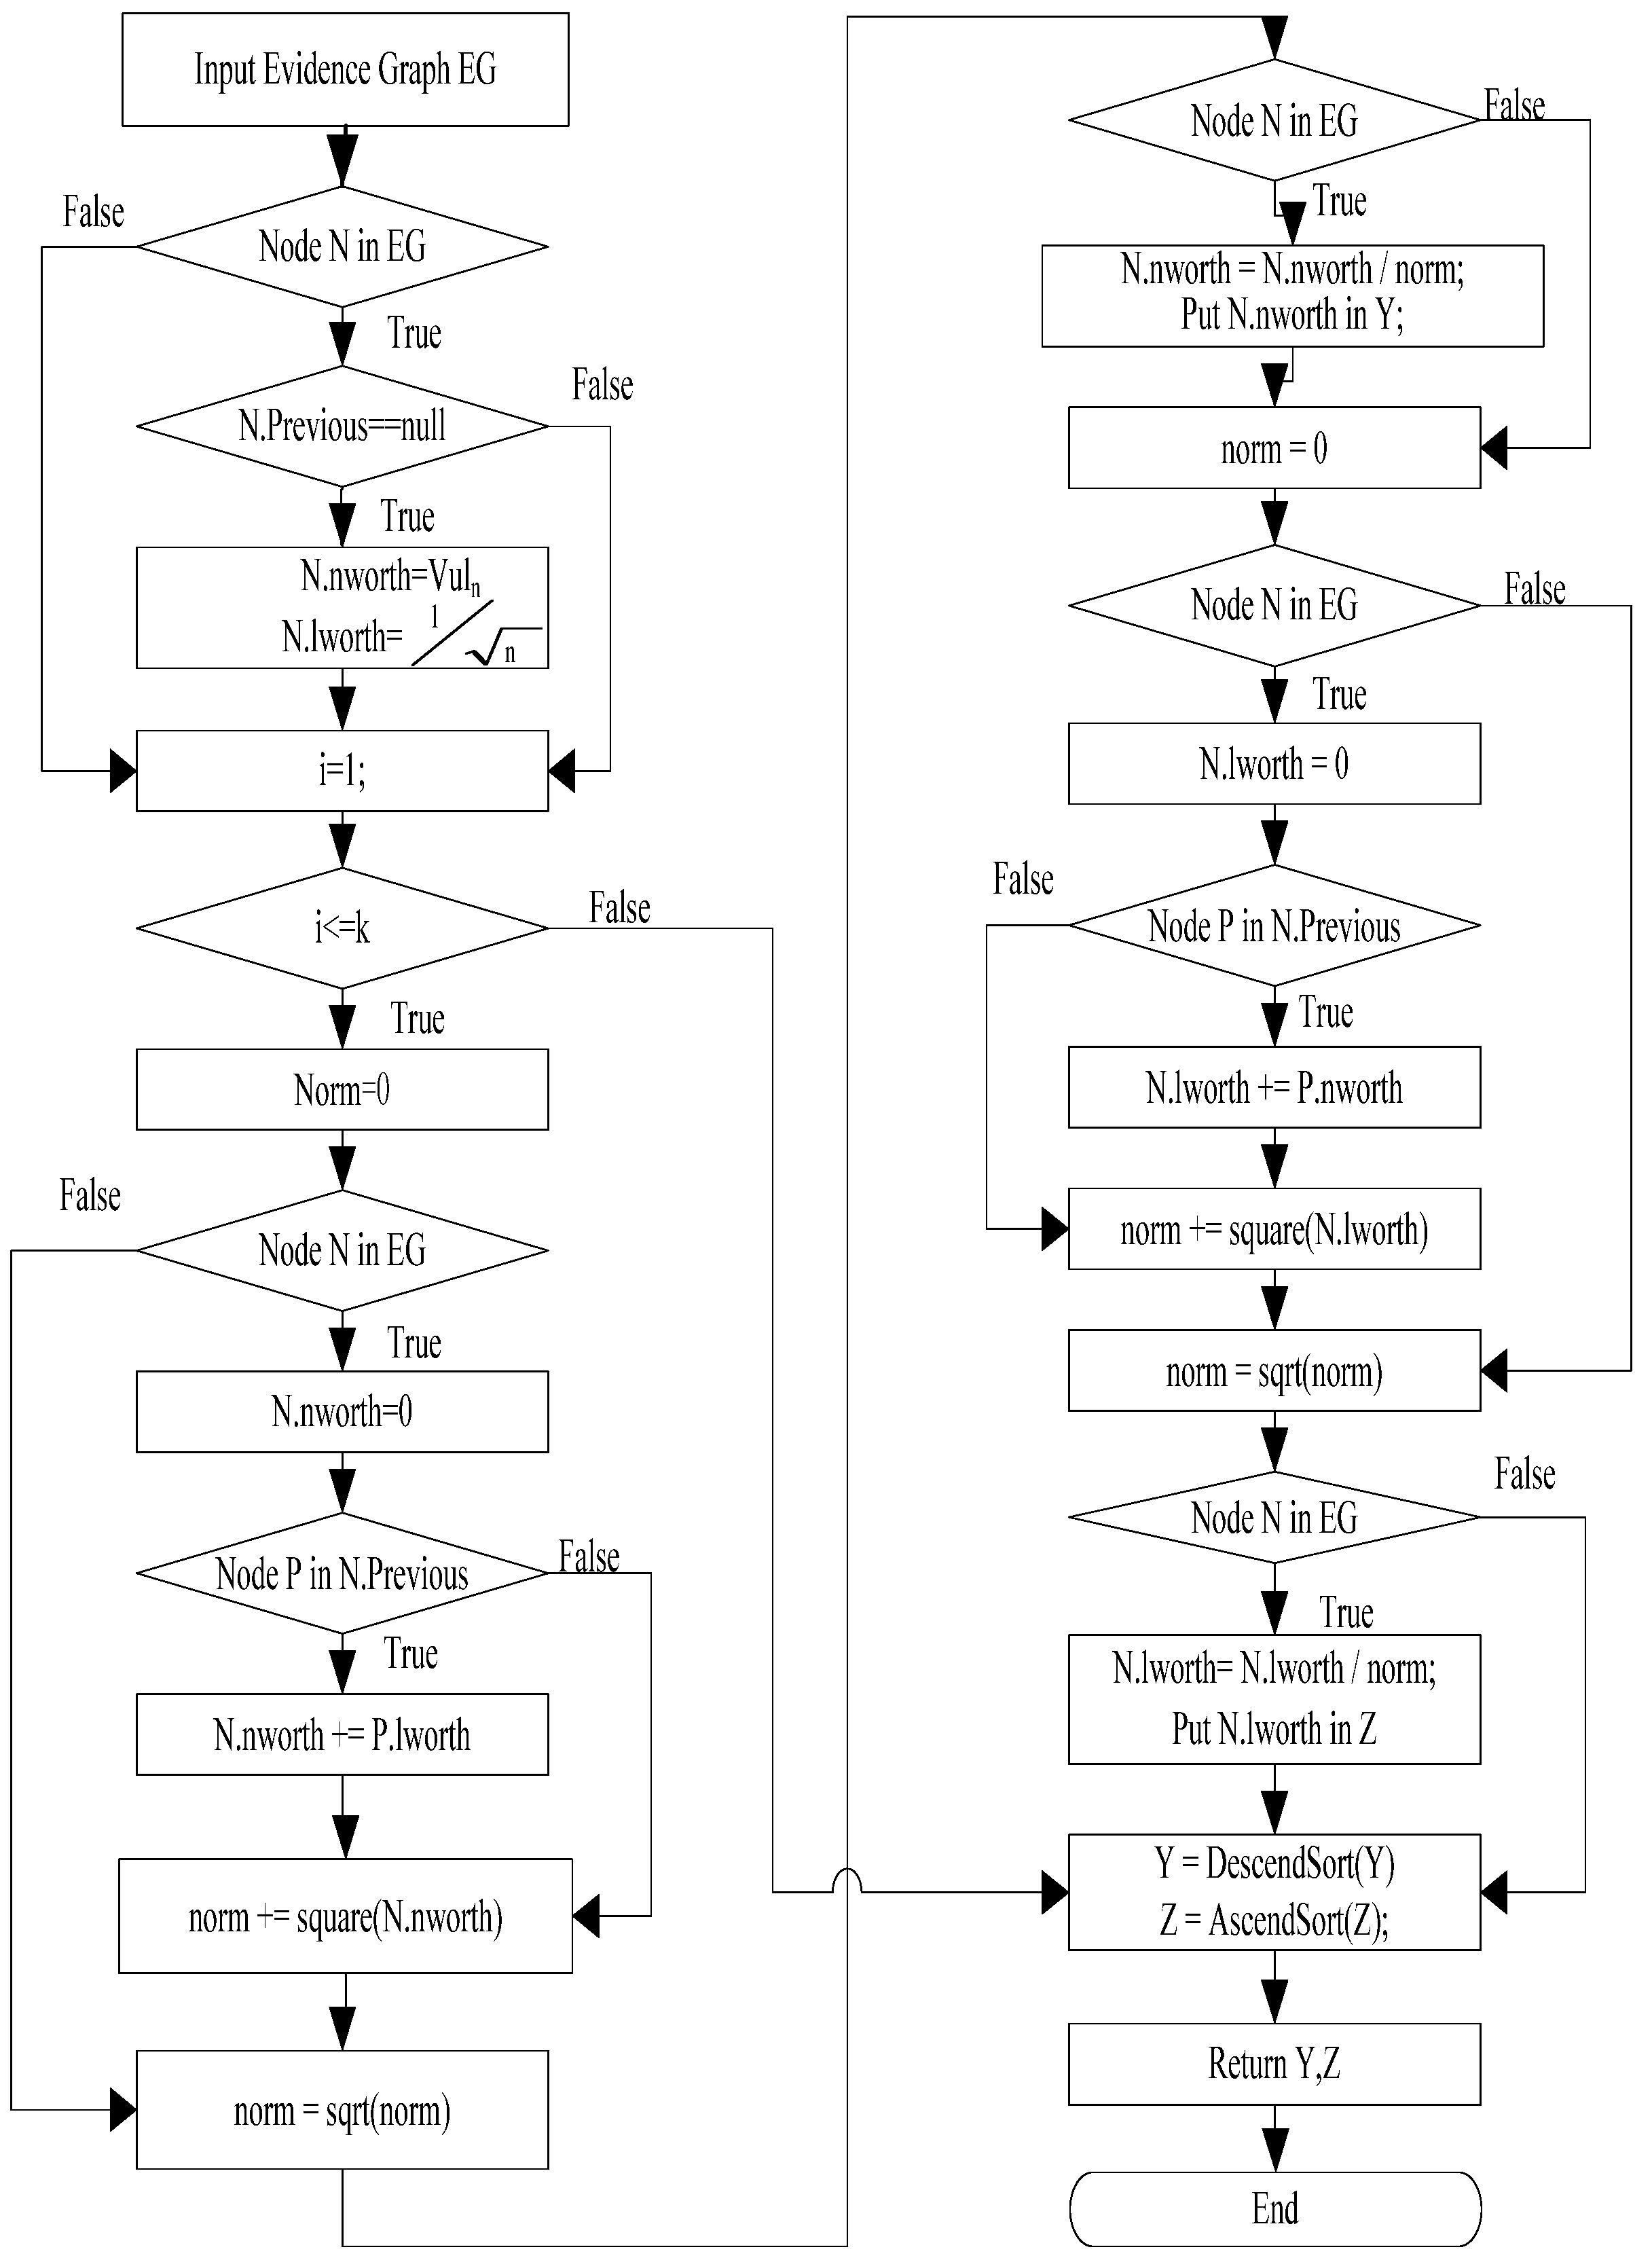
3.3. Evidence Graph
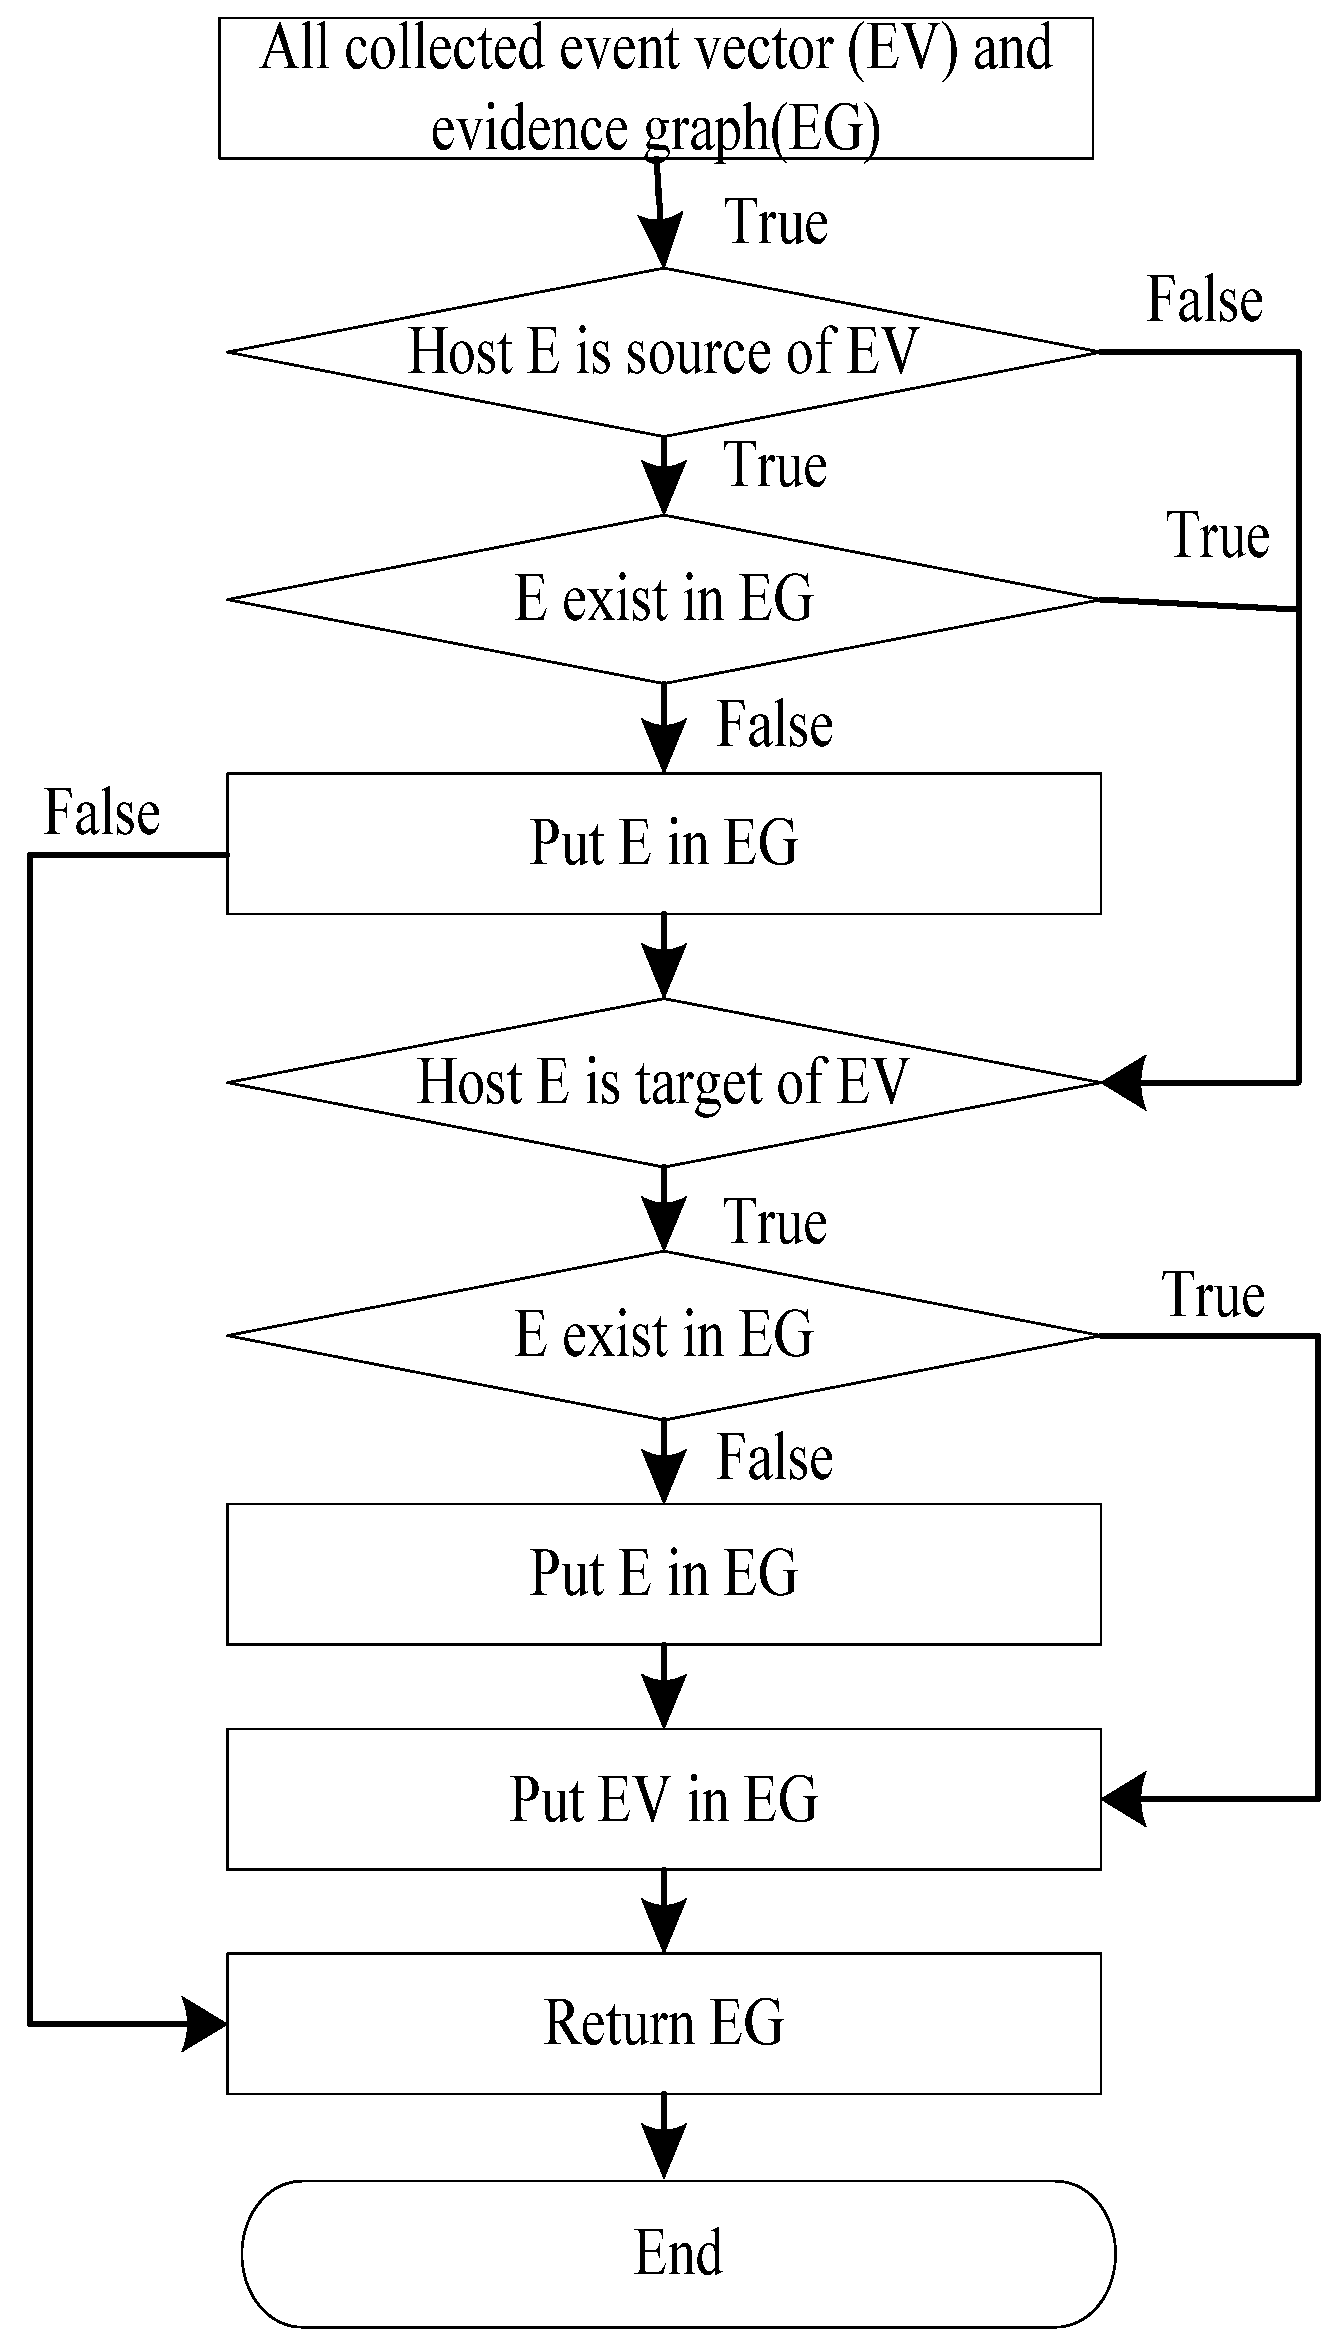
The evidence graph is the foundation of our forensic analysis since it provides an intuitive representation of collected forensic evidences. Therefore, constructing a complete evidence graph is the most important step in our method. According to the definition of the EV, each of the collected forensic evidences can be expressed by an EV. We can then build an evidence graph based on the EVs.
An evidence graph (EG) is a directed graph EG = <V, E> in which V is the set of vertices that should include all the objects in the event vectors and E is the set of edges {<S, T, Timestamp|S, T∈V & Path(S, T)>} describing the relationships between the vertices of a finite set. Path(S, T) indicates a one-way path from vertex S to vertex T.
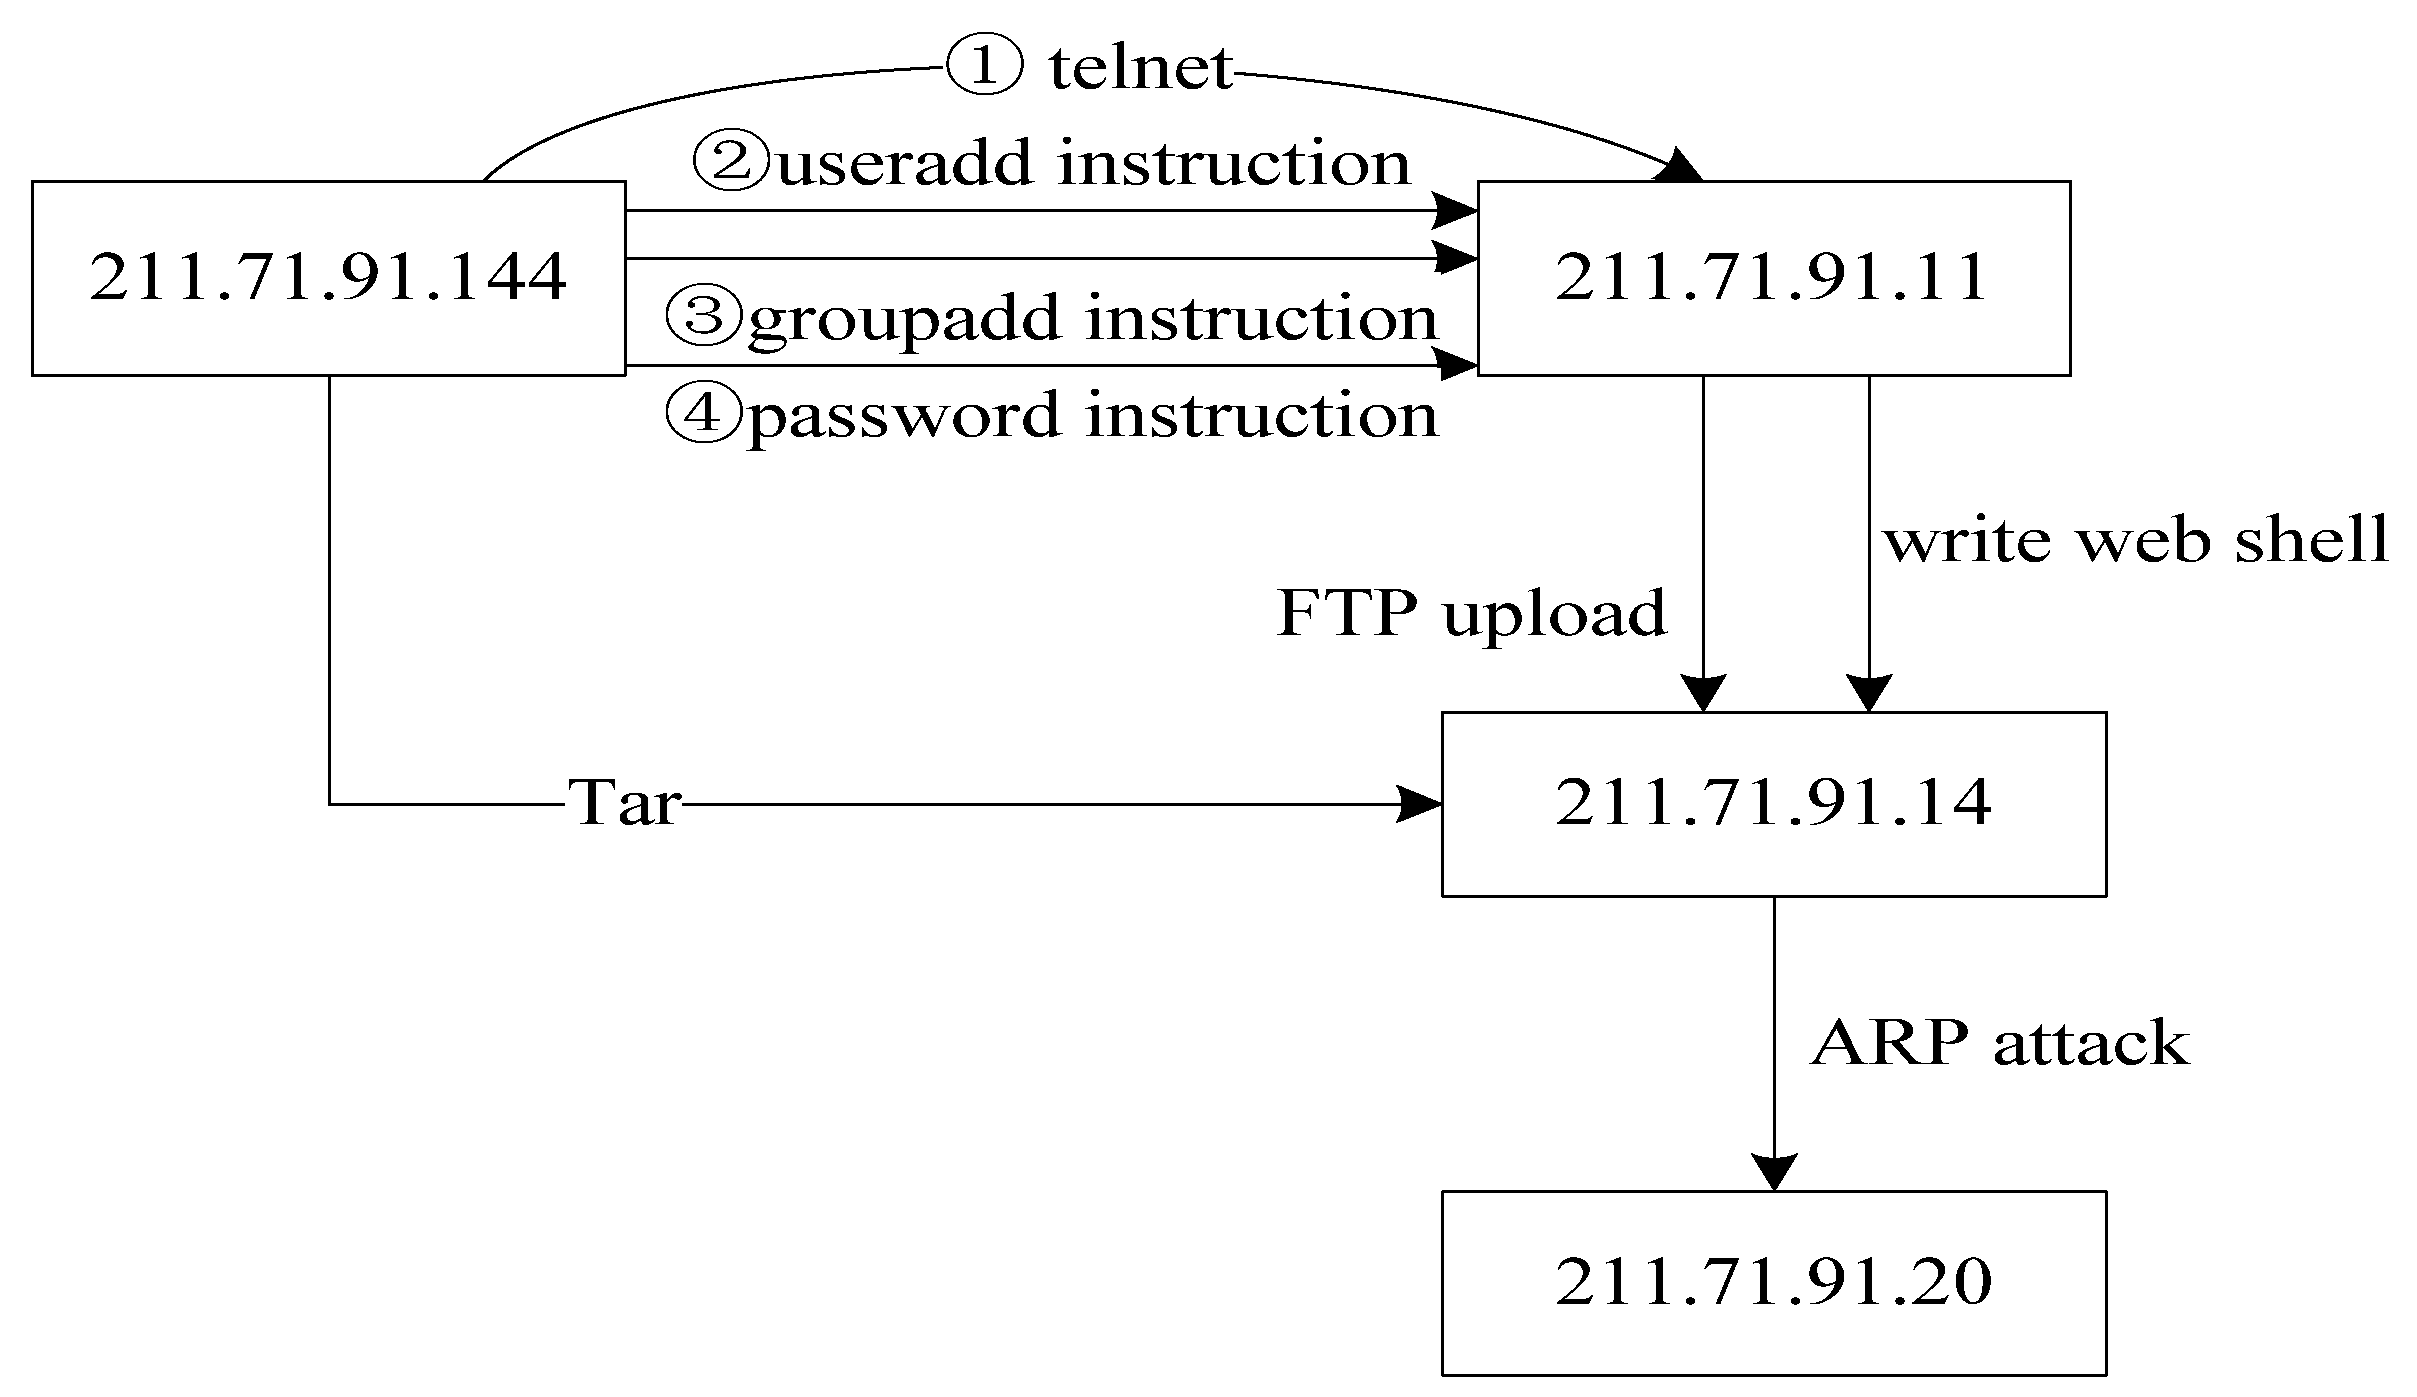
The evidence graph is an effective mechanism that helps to incorporate relevant information into the evidence reasoning process. Each path in the evidence graph has the following attributes: timestamp, operation and data source. In the evidence graph, digital evidences are sorted by time based on the timestamps, starting from the first in the record, moving to the next along the time and ending at the last. The operation between two nodes is very significant. Operations such as the “FTP upload” are very dangerous to the target. In the proposed network forensics method, network packets carry a higher level of importance to prove validity of evidence.
Figure 3 illustrates the proposed algorithmic procedure for constructing an evidence graph.
3.4. Evidence Reasoning
Our method applies evidence reasoning to network forensics based on the evidence graph, taking into consideration of node vulnerabilities as well as connections between nodes. The analysis results should show the details of network forensics evidence and attack scenarios including the identification of key nodes in the evidence graph as well as key steps of attacks.
3.4.1. Vulnerability Relevance Analysis
Analysis of past attacks that exploited network vulnerabilities indicates that attackers usually use multiple hosts and vulnerabilities to attack a network or a host of nodes. Thus, the relevance of vulnerabilities has become increasingly important in network security.
National Vulnerability Database (NVD) [
31] has been widely used in various areas. Based on the regular rules of vulnerabilities, we can establish the relationships between vulnerabilities in NVD. Common Vulnerabilities & Exposures (CVE) [
32] can be used as a data dictionary to unify the names of information security vulnerabilities or weaknesses. Common Vulnerability Scoring System (CVSS) [
33] is a free and open industry standard which can be used to assess and mark security vulnerabilities.
The process of scanning vulnerabilities involves four steps: (1) scan the target network; (2) determine the existence of vulnerabilities through comparing with NVD records; (3) query CVE to determine the names of vulnerabilities; and (4) calculate the vulnerability scores through the CVSS vulnerability scoring system.
Nessus is a popular tool that can be used to scan vulnerabilities to update vulnerability database at any time. Nessus is fully compatible with CVE. To better understand, the following example is used to illustrate the process of constructing vulnerability database.
Scanning target 172.18.4.144 using Nessus would identify a vulnerability named “CVE-2004-2761” which should appear in the vulnerability report by Nessus. In the report, every vulnerability will have “Risk information”. In this case, the risk information for “CVE-2004-2761” is as follows:
As shown above, the influence of vulnerability “CVE-2004-2761” is medium.
Table 2 shows the detail of CVSS base score and
Table 3 shows the detail of CVSS temporal Score.
From the vulnerability report, we can see all the vulnerabilities as well as the scores of the vulnerabilities of target “172.18.4.144”. Such information is then stored in a network vulnerability database as shown in
Table 4.
Through this process, we can obtain the vulnerability scores for network hosts and store them in a network vulnerability database that provides information about vulnerabilities of each host in the network.
3.4.2. Vulnerability Evidence Reasoning Algorithm
We propose a Vulnerability Evidence Reasoning Algorithm (VERA) based on the evidence graph and the network vulnerability database. The algorithmic procedure is illustrated in
Figure 4. Using this algorithm, we can infer attacked nodes as well as attacking routes. In VERA, each network node has two important values: the degree of importance of the node (called Nodeworth) and that of the links (Linkworth). Nodeworth is defined as the value of vulnerabilities that a host has while Linkworth is the sum of the Nodeworth of all the nodes that have outgoing links to the node. In our case, the value of Nodeworth is the summation of the average base score and the average temporal score, as illustrated in
Table 4. If a network host is vulnerable, it can be easily attacked and compromised. The initial value of Nodeworth is the average value of the vulnerability of a node.
Following are the steps of the VERA algorithm to be applied to network forensics:
H is the adjacency matrix for the evidence graph assuming that the set of nodes N = {n1, n2, …, nn}. For any node ni∈N, yi is the Nodeworth of the node, zi is the Linkworth of the node, Ai is the set of nodes that have outgoing links to the node, and Bi is the set of nodes to which this node has outgoing links. Z is the Linkworth of all the nodes.
Initialize Nodeworth vector
y and Linkworth vector:
Then, (Vul1, Vul2, …, Vuln) is the average vulnerability score of a host node.
At the kth iteration, the Nodeworth of node
ni is
which is equal to the sum of
zi, i.e.,
y = H
TZ.
After a new Nodeworth vector
y is obtained in the previous step, the Linkworth of the host is the sum of
yi. i.e.,
Z = H
y.
The sum of each vector is equal to 1. Thus, execute the two steps until they converge.
Y contains the Nodeworth values of all the nodes which are sorted in an ascending order. The more vulnerable a node is, the higher the score of the node. Z contains the Linkworth values of all the nodes in the descending order. If a link connects important nodes, it is easy to be attacked. In addition to the definitions of Nodeworth and Linkworth, we can also consider the relevance of vulnerability. We can thus consider a node with a high Nodeworth value to be a potential candidate of the attack and a node with a high Linkworth value to be a potential victim. Based on network vulnerability and the result of VERA, we can identify the attacker and the victim in the evidence graph and reconstruct the attack scenario.
5. Conclusions and Future Direction
In this paper, we presented a method for network forensics that combines evidence graph with vulnerability evidence reasoning. To ensure that the method follows certain procedures, we first proposed a new network forensics framework that conforms to the general principles of network forensics. Based on the architecture of network forensics, we can use program logs and network packets from multiple sources to provide data for digital evidence. We also suggested adding a digital signature and timestamps to digital evidence to ensure the integrity of data and to convert heterogeneous data to a uniform format to protect the tractability of data. Based on the network forensics method, we introduced the score of vulnerability to network forensics to ensure the relevance of digital evidence and proposed our VERA algorithm to infer attacked nodes as well as attacking routes. For visualization of the final evidence, we used the evidence graph to exhibit attacked nodes and the attacking routes. Experimental results show that our method can realize the reconstruction of attack scenarios more effectively while possessing the capability of analyzing multi-staged attacks.
The proposed method still has some limitations though. First, there are a variety of network program logs, so developing more powerful classification algorithms is the key for web log classification and analysis. Second, SVM can be further improved to filter out benign packets and suspicious packets so as to construct a more accurate evidence graph by using the suspicious packets. Third, the VERA algorithm needs to be further improved to achieve an even higher level of accuracy and efficiency in the identification of attacked nodes as well as the attacking routes. In addition, more experiment is needed in which data collected from a network environment that can more closely reflect the scale of today’s Internet as well as common attack patterns. This is because although we have demonstrated the effectiveness of our proposed method and compared it with some existing work, the experiment was performed based on datasets that may not accurately reflect traffic and attack scenarios in today’s networks. Given the scale and the complexity of today’s networks, it would be more challenging to distinguish between benign packets and malicious ones, making it more difficult to train the SVM classifier. Thus, the small-scale network environment that we set up for the experiment can hardly generate sufficient network traffic to adequately test the effectiveness and the efficiency of the SVM classifier. Consequently, the adaptability and the accuracy of our proposed method needs to be further verified with more experimental data due to the lack of more recent test datasets and the limitations of our lab environment at the current time.
There are a lot of challenges in the field of network forensics research. Beyond the study in this paper, there are many more issues that need to be further studied. In the future, we will focus our research on evidence reasoning and on the distribution of vulnerabilities. We will also implement the proposed method to conduct experiments in real networks. Further optimization of the basic method as well as more comprehensive experiment should always accompany any extensions beyond our current research which should include the use of more recent datasets as soon as they become available and the generation of datasets that can better reflect both traffic situations and attack patterns in today’s networks.


