
User Modelling Validation over the Security Awareness of Digital Natives


1
Department of Information Security and Communication Technology, Norwegian University of Science & Technology, 2802 Gjøvik, Norway
2
Department of Digital Systems, University of Piraeus, 18532 Piraeus, Greece
*
Author to whom correspondence should be addressed.
†
These authors contributed equally to this work.
Future Internet 2017, 9(3), 32; https://doi.org/10.3390/fi9030032
Submission received: 7 June 2017
/
Revised: 3 July 2017
/
Accepted: 5 July 2017
/
Published: 10 July 2017
(This article belongs to the Special Issue Security and Privacy in Wireless and Mobile Networks)
Abstract
:Young generations make extensive use of mobile devices, such as smart-phones, tablets and laptops, for a variety of daily tasks with potentially critical impact, while the number of security breaches via portable devices increases exponentially. A plethora of security risks associated with these devices are induced by design shortcomings and vulnerabilities related to user behavior. Therefore, deploying suitable risk treatments requires the investigation of how security experts perceive the digital natives (young people, born in the digital era), when utilizing their user behavior models in the design and analysis of related systems. In this article, we present the results of a survey performed across a multinational sample of security professionals, in comparison to our earlier study over the security awareness of digital natives. Through this study, we seek to identify divergences between user behavior and the conceptual user-models that security experts utilise in their professional tasks. Our results indicate that the experts understanding over the user behaviour does not follow a solidified user-model, while influences from personal perceptions and randomness are also noticeable.
1. Introduction
Mobile devices tend to become an indispensable part of our everyday life, by fulfilling the increasing user need for access to services and information, without time or location related restrictions. Therefore, the proliferation of such devices and increased user dependency promoted the transmutation of mobile devices to multifunctional equipment, where their increasing computational and storage capacity allow them to provide critical services with significant security implications. Accordingly, mobile devices (i.e., cell phones, tablets, and laptops) store and process critical information, associated with their owners but also people, legal entities and infrastructure related to them.
Furthermore, users tend to seek access to services being unaware or uninterested on the potential associated risks [1,2,3], while they become accustomed to continuous connectivity. Therefore, such practices are common even across networks with unknown configurations, while they are likely to leave users vulnerable to unauthorized access, allowing associated risks to materialize into attacks. Therefore, vulnerabilities arising from user-behavior or design shortcomings can facilitate malicious activity, allowing adversaries to launch attacks that can lead to privacy breaches and identity theft. In light of this actuality, it is important that users are aware of the associated risks, and, more importantly, that the developed systems and services are adjusted to realistic user models.
This article builds on our earlier study on the security awareness of digital natives [4], where we examined the behavior of this group with respect to their educational background and levels of security competence. This initial study allowed us to establish an understanding and extract related findings over the security awareness and behavior of digital natives within four focus areas: (i) Use of Mobile Devices; (ii) Connectivity and Network Access; (iii) Management of Credentials; and (iv) Protection mechanisms. Specifically, this study investigates how well the security experts manage to predict the user behavior of the digital natives within the four areas above.
Nevertheless, due to the intrusive nature of these technologies and increasing dependency for the execution of daily tasks, educating the users over security-related best practices can only take us halfway towards securing this environment. One of the findings of the aforementioned study was that digital natives are willing to compromise access to services in favor of security, when they are provided with usable solutions. Therefore, it is crucial to investigate how users are modeled during the design or analysis phases of such systems since deviations between user-behavior and user-models can promote security analyses and design decisions with opposite results. Consequently, this article seeks to utilize the findings of our initial study, in order to investigate the conceptual understanding of security experts with respect to the user behavior of digital natives.
The remaining of the paper is structured as follows: Section 2 presents related work, while Section 3 sets the scope of this study by identifying the utilized methodologies and sample areas. Consequently, Section 4 presented the results across the aforementioned focus areas, and Section 5 provides a summary of results and discussion. The article continues with a reference to the limitations, suggestions for future work and the conclusions.
2. Related Work
Since 2014, mobile devices are well on their way to becoming the leading digital platform, displacing the desktop PC [5]. Prensky [6] writes that the digital natives have radically changed their way of thinking by being exposed to technology almost since birth, while other scholars [7] have contested such claims. However, there is no denying that the digital natives have a different view of technology than older generations. This section summarizes the related work gathered on user behavior and modeling, user model validation, and, lastly presents the specific studies this paper builds on.
A considerable number of studies have been conducted on user behavior with regards to selecting and installing applications in smartphones: one found that users do not consider security and privacy issues during app selection, by ignoring privacy policies and EULAs (End-user license agreement) [8]. In addition, Android users were found not to be knowledgeable about permission information during installation [1,2]. Furthermore, studies of user security awareness are useful for understanding and modeling the Digital Natives’ behavior. One such study explored the security awareness metrics of smartphone users and found that the security background had a slight effect on the smartphone security awareness of their sample [9]. A second study of security awareness found that users who download applications from official application repositories are complacent in their smart-phone security behaviors and display high levels of trust towards smart-phone application repositories [10]. In addition, they rarely consider privacy and security when installing new applications, and do not install adequate protection mechanisms [3]. Additional research into users and protection mechanisms partially contradicts that smartphone users are not security aware, and finds several correlations between security awareness and smartphone OS, language, and gender [11]. However, the results do not specifically target the digital natives, despite them being the majority of users. Two studies carried targeting the Slovenian digital natives found that the student population had a low awareness of security threats and security measures [12,13].
These studies show that there exist multiple studies of the digital natives’ security awareness and behavior. The contradicting results also suggest that culture and background is a variable that should be considered when researching and modeling the digital natives. Given the value of being able to predict human behavior, there are also multiple studies from information security that attempts to model the adversary [14,15], employee behavior [16], and generic user behavior [17]. Validation studies of mental models show that there is a gap between the mental models of security experts and non-experts [18,19]. However, our literature survey found no research on validating the security expert predictions regarding the behavior of digital natives. This is an important topic as it is the security experts that are designing the mechanisms being implemented into the devices, and if the security mechanisms are misaligned with the user group, it can impede both the security and the user experience [20].
Ariu et al. [21] have worked on filling this gap by studying the level of awareness and perception of IT security among university students, paying particular attention to the world of mobile devices. Their report analyses the answers given by 1012 students from over 15 Italian universities to a multiple-choice questionnaire. This shows that students’ perception of their knowledge is wrong and that they are unaware of the risks arising from their behavior. The current paper builds on the Ariu et al. results and supplements with two additional datasets from a study collected by Gkioulos et al. [4]. The latter study presents a second data set collected from generic computer science students and a third dataset collected specifically from information and cyber security students. The Gkioulos et al. study highlights several differences between the three groups attributed to security education and awareness, but also commonalities across them. These results suggest that users tend to demonstrate negligible behaviour in the daily use of their mobile devices, due to increased confidence in their security related competence. Additionally, digital natives remain unaware of the full extent of countermeasures that are available at their disposal, while they prioritize access to services and usability over the enforcement of security measures. Furthermore, digital natives are willing to accept security related risks despite their concerns, while they feel less constrained when they are using laptops in comparison to smart-phones and tablets. The full extent of these initial results and datasets are applied in the current study for the user modelling validation of the digital natives.
3. Methodology
This article builds on a previous study [21] on the topic of security awareness of the digital natives, which was conducted to investigate the differences in risk perception across three distinct groups categorized by their technical background. This section has the following structure: the first sub-section addresses the choice of data collection method and instrument, followed by the sample description, and a brief overview of the statistical methods used for data analysis.
3.1. Data Collection and Instrument
The initial data collection [4] aimed to explore the security awareness of the digital natives addressed to students of the digital age, i.e., persons who were born in the years of the technological boom in Information Technology and Communications (ICT), between 1987 and 1997. The three data samples of the digital natives groups were collected from European universities as these are ideal since they comprise a diverse population. We found the online questionnaire to be the best option for data gathering as it reaches a broad audience and provides a strong level of anonymity; therefore, the presented datasets were collected using Google Forms.
The original survey was developed by Ariu et al. [21] and initially ran in multiple Italian universities [21]. The survey had 60 questions that investigated security awareness aspects within the five areas outlined in the introduction. As for the level of measurement, the questionnaire had category, ordinal, and continuous type questions. Category type questions are used here mainly for demographics, while the main bulk of the questionnaire was designed using several mandatory scales and ranking questions.
We designed a second questionnaire to identify divergences between user behavior and the conceptual user models that security experts utilize in their professional tasks. This survey had 44 questions designed to see how well the expert could predict the responses of the three initial digital natives group. The issues in the second questionnaire had a similar layout as the original. However, each question was framed such that the expert predicted what each original sample group answered to a question.
3.2. Sample Description
This study utilizes three distinct samples of security competence groups (SCGroups) collected previously [4,21]:
- The data set collected by Ariu et al. targeted to the Italian digital natives is included in this study and corresponds to our general security competence group (GSCG). The sample consists of 1012 respondents from various university departments (including law, engineering, computer science, humanitarian, marketing, and multiple other faculties not directed to IT education), which we map to the general population of digital natives for this study.
- Secondly, we collected data for the medium security competence group (MSCG) by targeting digital natives from Greece with education exclusively in computer science [4]. We expected this group to have a wider knowledge of the use of mobile technologies and increased awareness over security related aspects due to their educational background. The sample consists of 303 responds, categorized on undergraduate (234), postgraduate (54), and doctoral (15) levels.
- Finally, the target population for the high-security competence group (HSCG) was undergraduate, postgraduate and doctoral students of information security from Norway [4]. These were expected to have a higher security awareness regarding the four main areas than the medium and generic groups, due to their specialized education. For this group, we had 35 respondents in total, of which 21 are undergraduate students, ten postgraduate, and four doctoral students.
Furthermore, the data collection for the second questionnaire targeted experts within information and cyber security. An expert in this study has worked within the field for at least five years, together with a specific skill or knowledge set relevant to our target group. The invited participants of the study had internationally recognized expertise demonstrated through either: (i) a record of scientific publications on security issues, preferably in peer-reviewed publications; (ii) experience at a high level in global, regional, or national security assessments; and (iii) experience at a high level in the design and management of security. Based on these criteria, we distributed primarily to European experts known to the researchers. In total, we contacted 166, of which we received 34 answers (20.5% response rate), distributed as follows: industry (10), academia (19), and security developers, programmers, or similar (5).
3.3. Analysis
The difference in the number of respondents for each survey reflects the scarcity of each group in the general population, for example, there are more respondents in GSCG than MSCG and more in MSCG than HSCG. Both the HSCG and the expert groups being large enough for the central limit theorem to apply [22]. The questionnaire primarily asked categorical and ordinal multiple-choice questions, while, as a measurement of central tendency for ordinal questions, we considered the median, variance, and range. For the descriptive data analysis, we primarily consider differences in the frequency distributions, while we used the security competence groups as categorical data for bi-variate analysis in the original dataset.
In order to measure how well the experts managed to predict the digital natives behavior, we compared the original datasets with the expert responses. We used the original percentages to indicate concrete yes/no questions and the median to indicate the expert response. For example, we asked the experts to predict how many out of ten they thought answered yes to a specific question derived from the initial results (1st round results) [4] and then we used the median and skewness of the expert prediction to compare. We have used the right answer ±1 (10%) as a correct expert prediction of the user behavior in the analysis.
To summarize the results and obtain a measure of expert prediction accuracy, we analyzed each prediction included in this study, totaling 27 for the GSCG and MSCG groups, and 29 for the HSCG. Furthermore, we judged a successful prediction of the outcome of the rating questions when the experts predicted a median within ±1 of the first round digital natives results [4]. This result corresponds to a total 20% deviation around the central value from the original results and 10% in the cases where the initial result is 0 or 10. For the multiple choice questions, a successful prediction equaled a majority expert vote on the most frequently chosen alternative from the digital natives study. The sum of all correct and missed predictions equals the total accuracy.
4. Analysis of Results and Discussion
This section presents the results of our study, where security specialists estimated the responses of the digital natives from the first stage [4] in accordance with their conceptual user models. The comparative analysis aims to identify divergences between the responses of the digital natives and the expectations of the security professionals.
4.1. Use of Mobile Devices
4.1.1. Question 1
We asked the security experts to identify how many out of ten digital natives across the three SCG groups restore the factory settings of their mobile device prior to selling or donating it. The results presented in Figure 1 show that the security experts underestimated the responses of the GSCG group (representative of the general digital natives population), with a difference of −3.27 and only 29.4% of them approximating it correctly (8 ± 1). Additionally, the distribution of responses in respect to the GSCG group is not concentrated around a central value, with a skewness of 0.0446 and a median deviation equal to 2. However, the results in respect to the MSCG/HSCG groups are improved in comparison, with 44.1% and 58.8% of the experts approximating the results correctly, while the values of difference and skewness are also improved.
4.1.2. Questions 2 and 3
Focusing on software updates, we asked the digital natives “Do you regularly update the software of your mobile device?”, maintaining two distinct categories for cell-phones/tablets and laptops. The possible answers were: “Applications and operating system”, “Only applications”, “Only operating system” and “No, I do not update”. Subsequently, the security experts were asked to identify which was the most frequent and second most frequent answer across the three SCG groups. The responses of the digital natives are presented in Table 1, and the corresponding responses of the security experts in Figure 2 and Figure 3. The results show that the expectations in respect to the responses of the GSCG and MSCG groups are again underestimated, while the lack of a central value is visible, especially for the case of the GSCG group.
4.1.3. Question 4
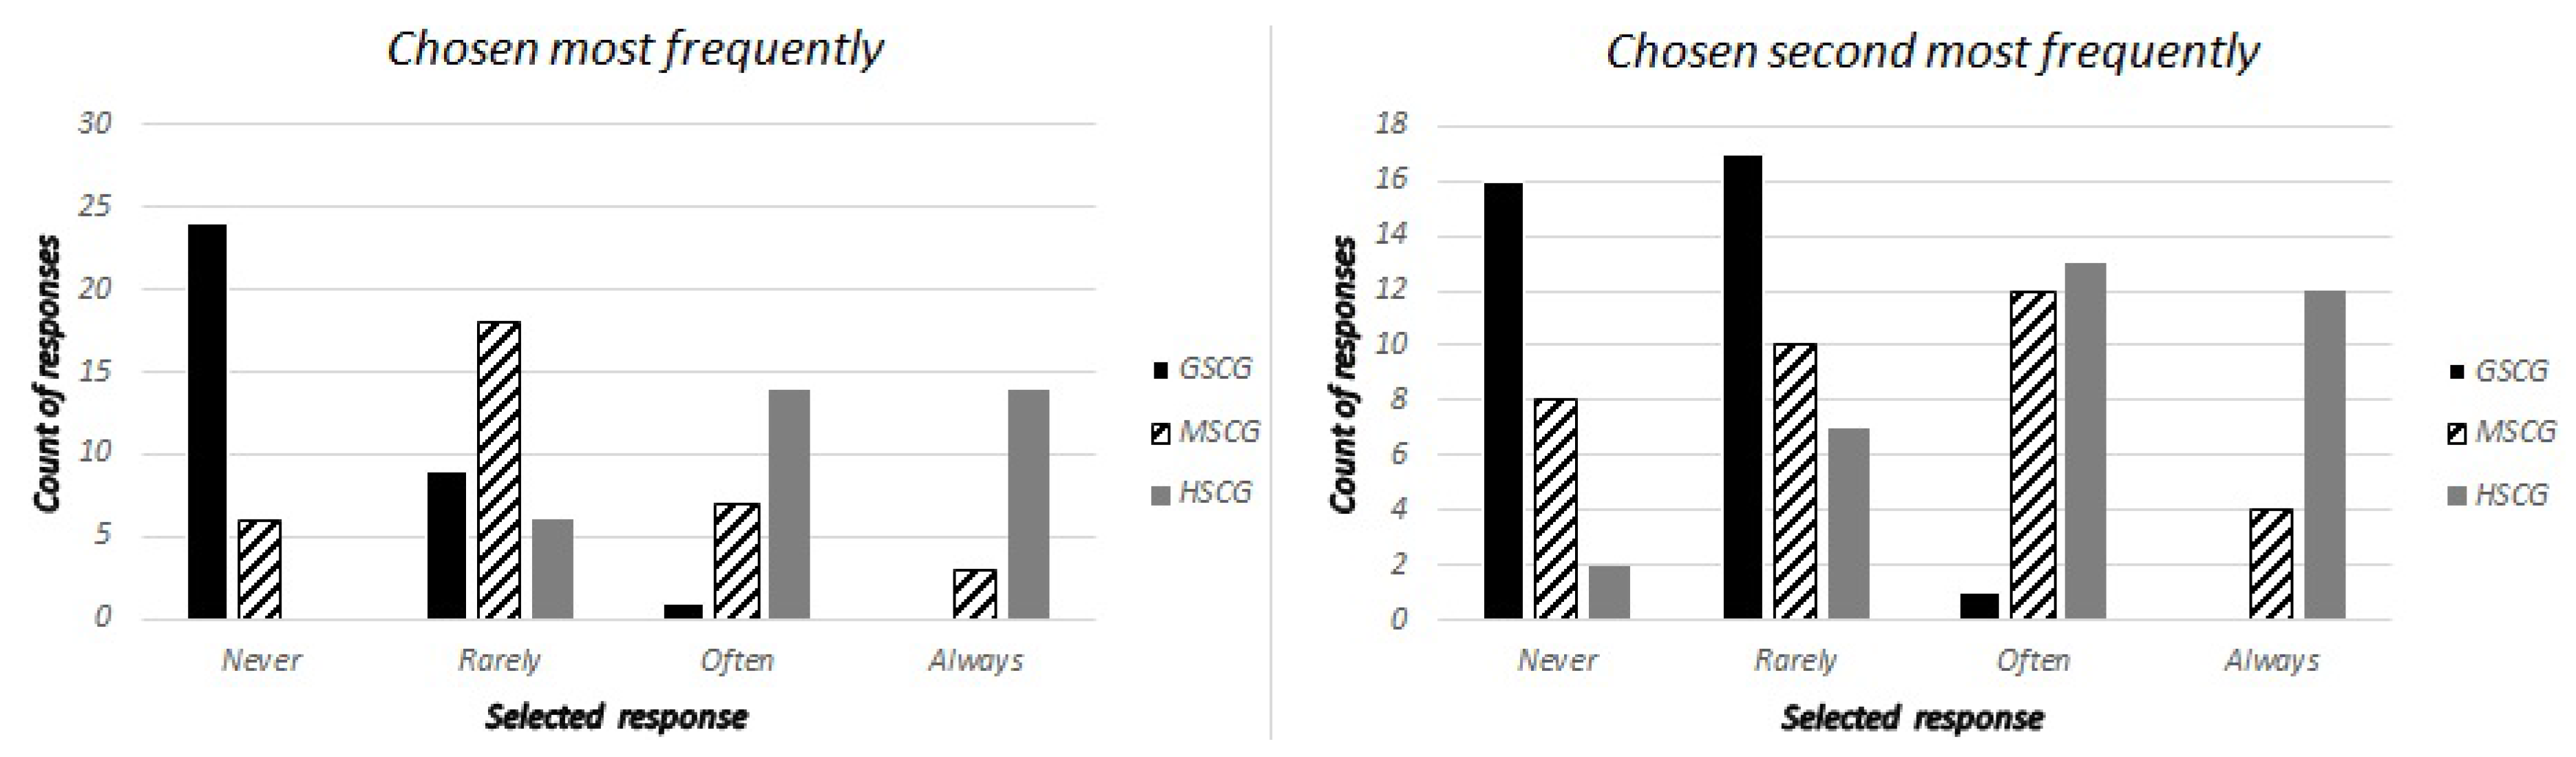
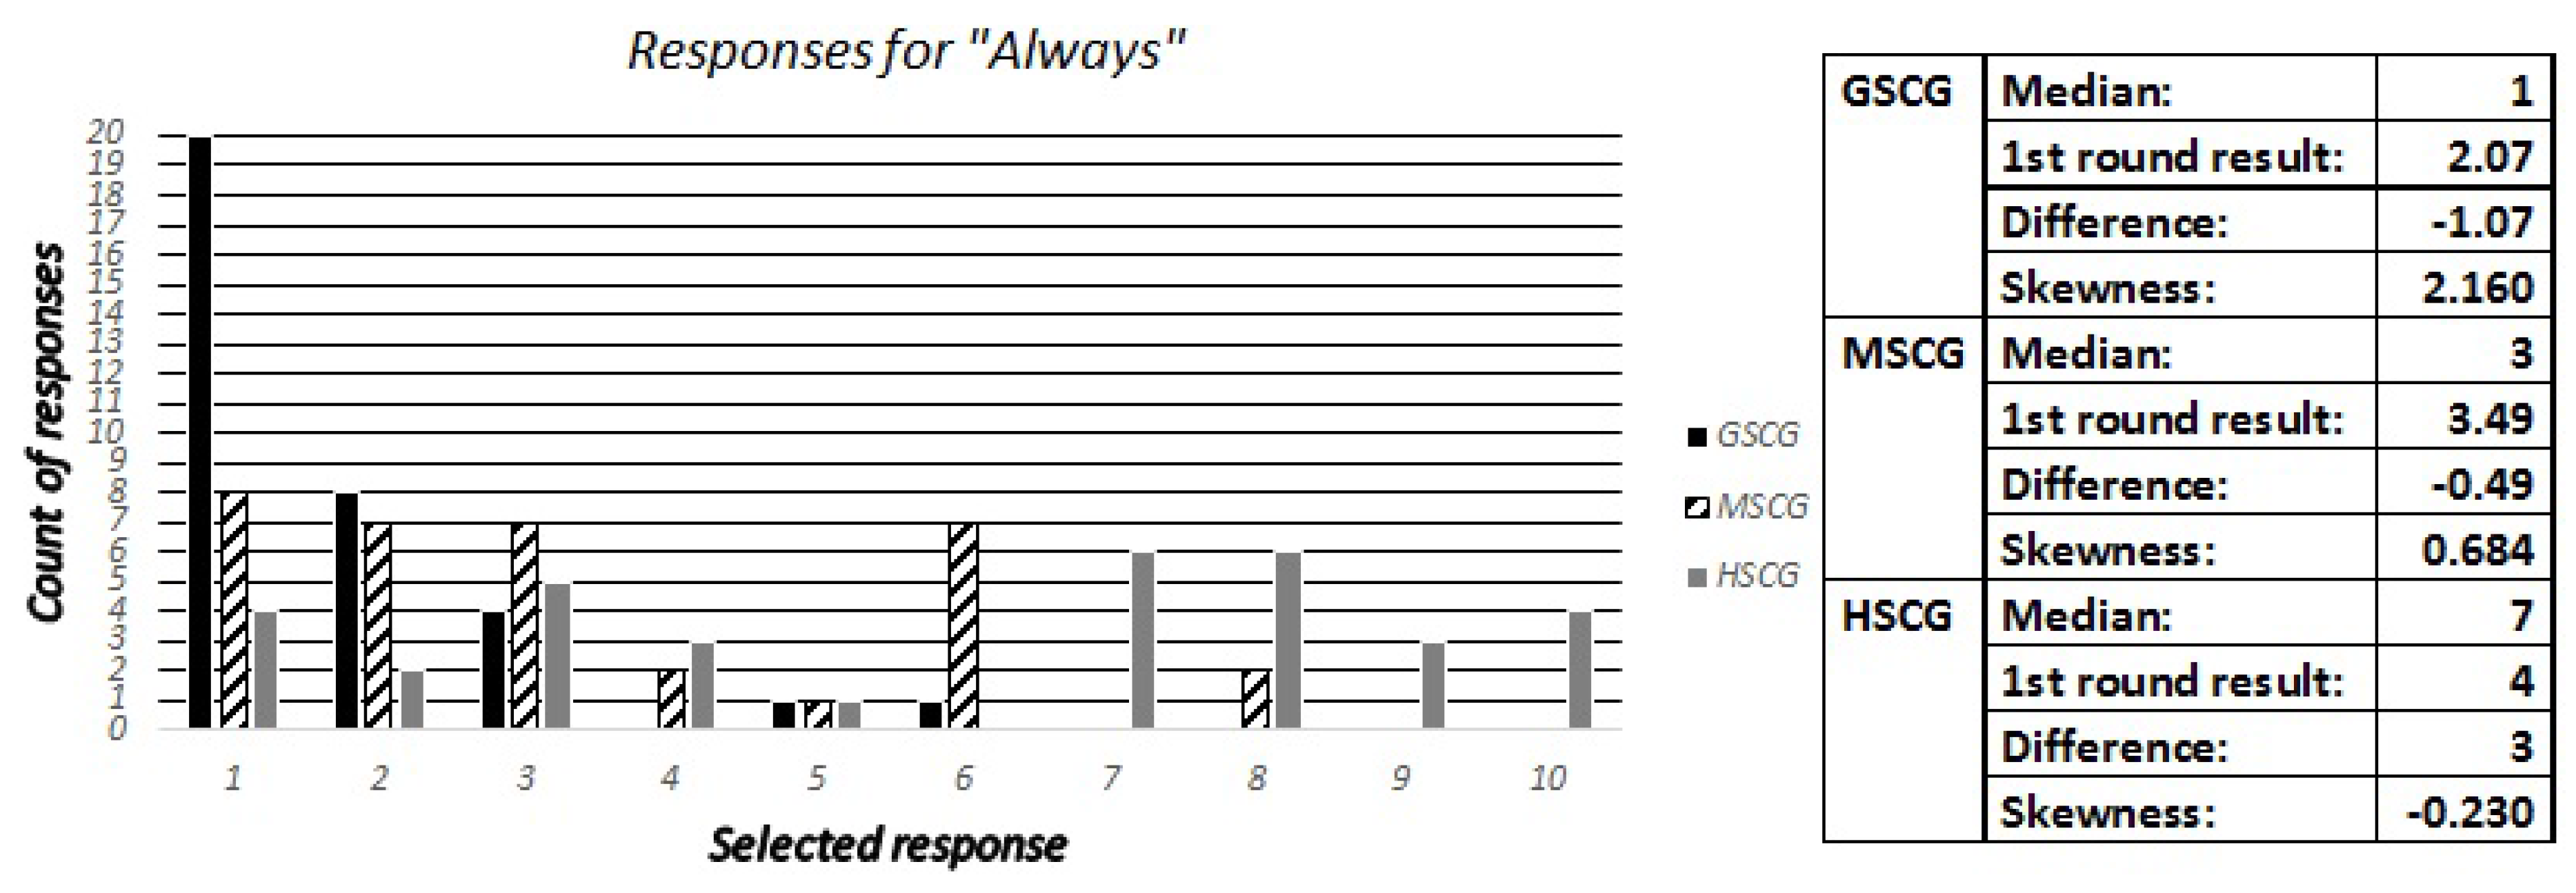
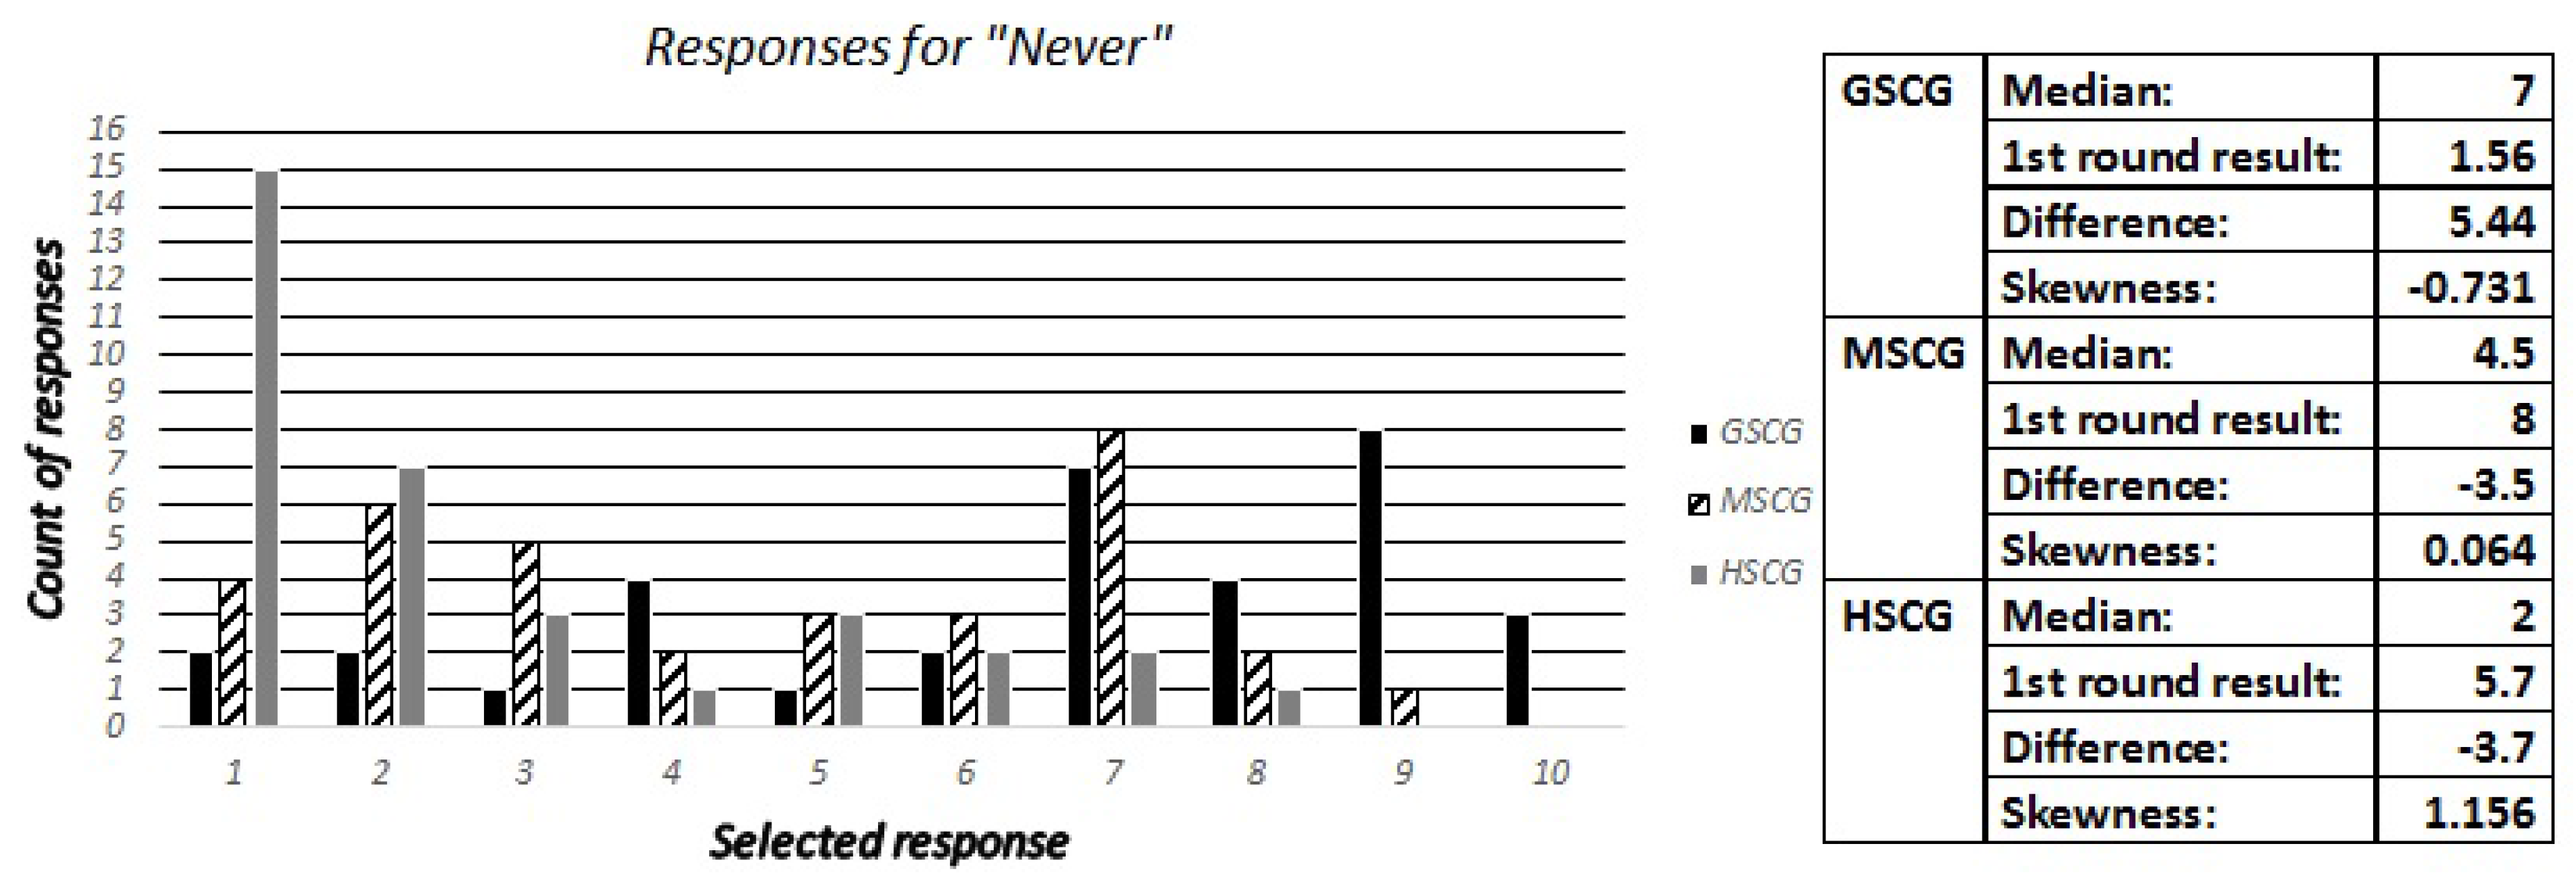
We asked the digital natives “How frequently do you check the permissions (access rights) that an application requires before completing the installation”, with possible responses being “Never”, “Rarely”, “Often” and “Always”. Accordingly, the security experts have been asked to estimate the most frequent and second most frequent responses across all SCG groups, as well as how many out of ten digital natives have selected “Always” and “Never”. The responses are presented in Figure 4, Figure 5 and Figure 6, while the most frequent answers of the digital natives from the first round of results have been: GSCG—(Rarely: 38.2%, Often: 25.5%), MSCG—(Always: 34.9%, Often: 25.5%), HSCG—(Always: 40%, Often: 40%). The results show that the experts missed both options for the GSCG, got the second most frequently right for the MSCG, and both options right for the HSCG.
4.1.4. Question 5
We asked the security professionals to estimate how many out of ten participants across all groups would report to the authorities the loss or theft of their mobile device. Similar to that of previous questions, Figure 7 shows a noticeable difference where the expert groups significantly underestimate the behavior of the GSCG group.
4.1.5. Question 6
Aiming to isolate the results corresponding to the digital natives with security related background, we asked the experts to estimate how many out of ten members of the HSCG group pay attention to the signs of a secure connection, when using their laptop for activities that require a high level of security. Question 6a (Q6a) asked experts to predict how many out the HSCG answered “Always” or “Often”, and Q6b asked how many answered “Sometimes”, “Rarely”, or “Never”. According to the results presented in Figure 8, the differences between the expectations of the security experts predictions and the responses of the digital natives are minimal for this question.
4.2. Connectivity and Network Access
Question 7
We asked the digital natives about their behavior when they discover an open Wi-Fi access point with their cell-phone/tablet or their laptop. The available answers were “I connect and use all applications”, “I connect but only do activities that do not require credential authentication”, and “I do not connect”. Accordingly, the security experts have been asked to estimate the most frequent response, and how many out of ten participants have selected the answer “I connect and use all applications” across the three SCG groups. The security professionals correctly identified the most frequent response in five out of the six scenarios (3 SCG groups * 2 Types of devices), except the response of the HSCG group for cellphones/tablets where “I do not connect” was the most frequent answer by 42.9%, while the estimation promoted the “I connect but only do activities that do not require credential authentication” response. Nevertheless, as presented in Figure 9, the expectations in respect to the security awareness of the digital natives are significantly overestimated especially for the GSCG group.
4.3. Management of Credentials
4.3.1. Question 8
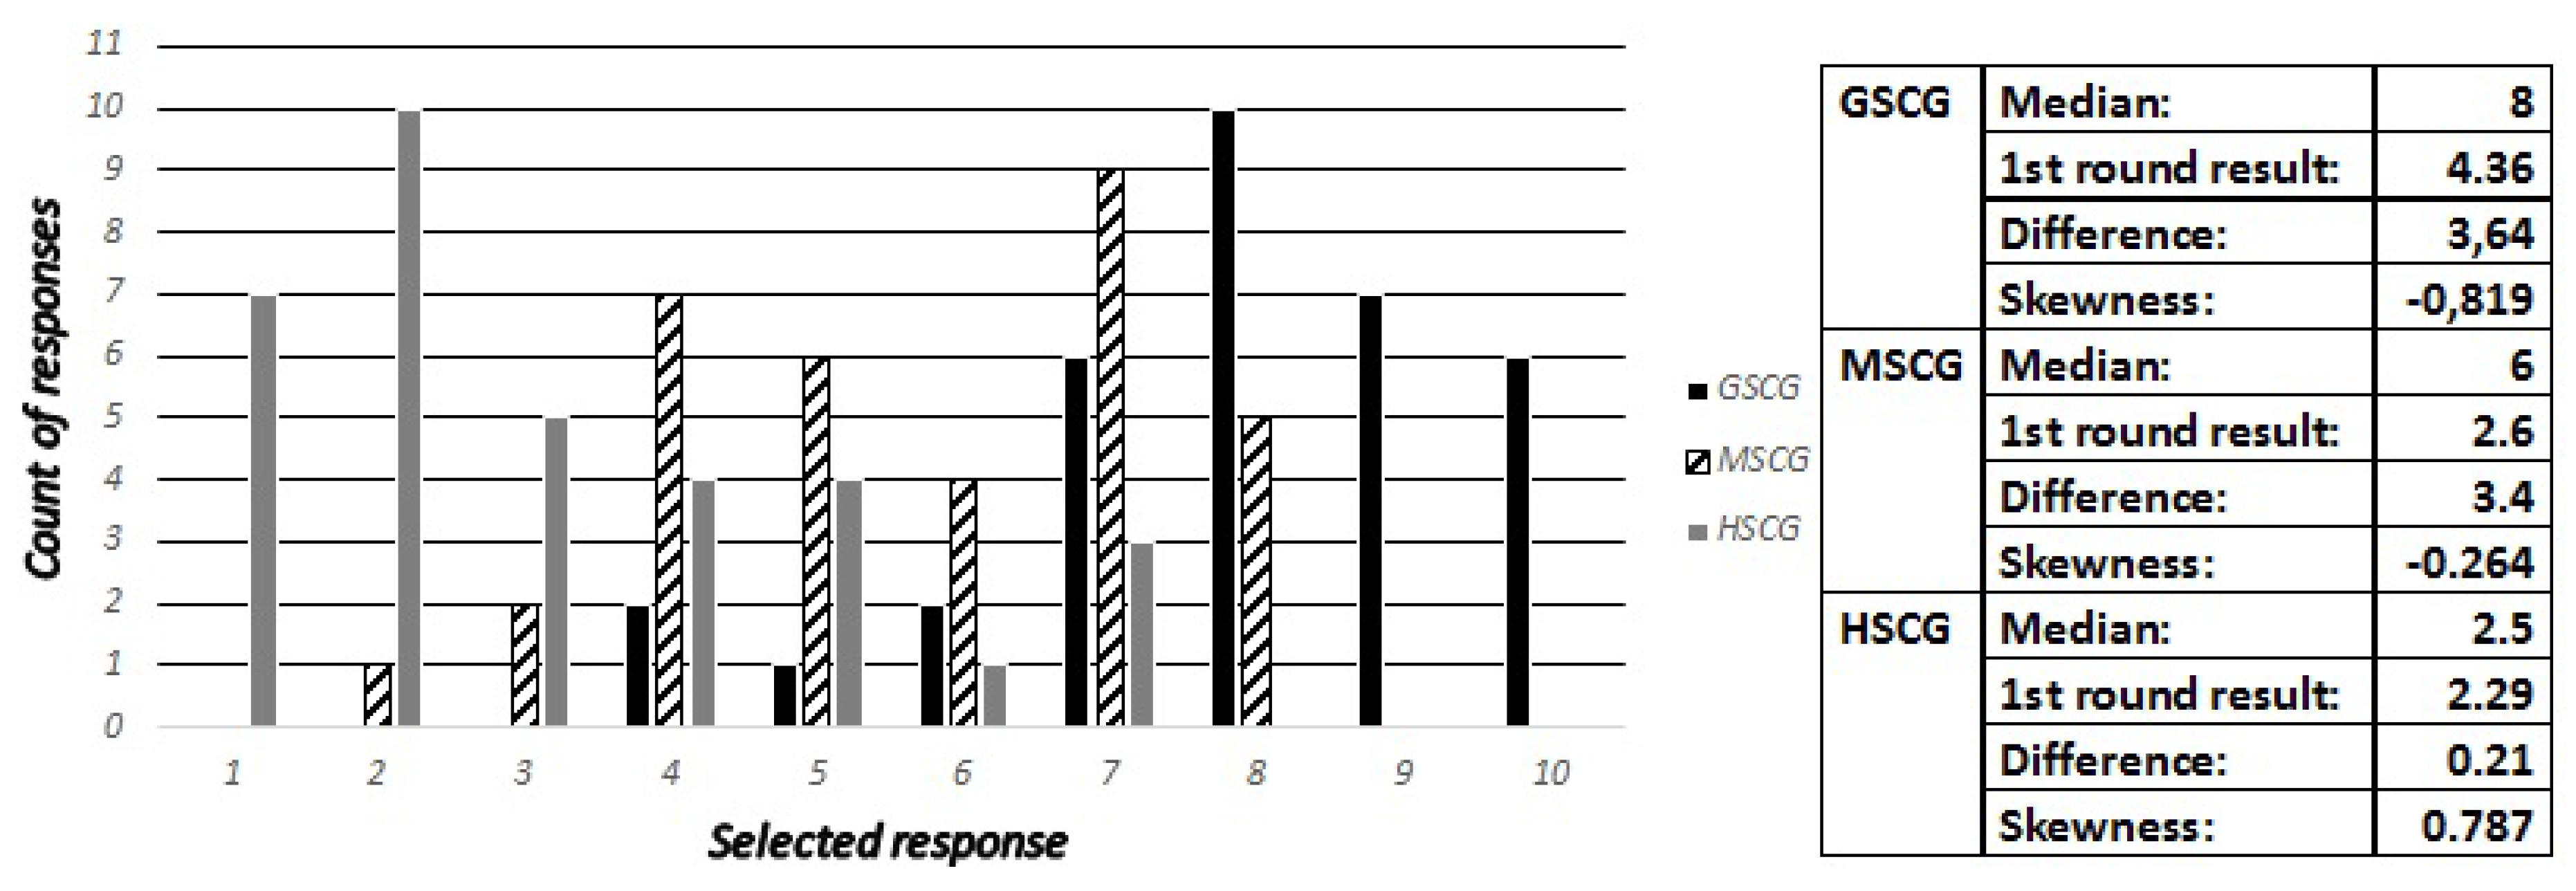
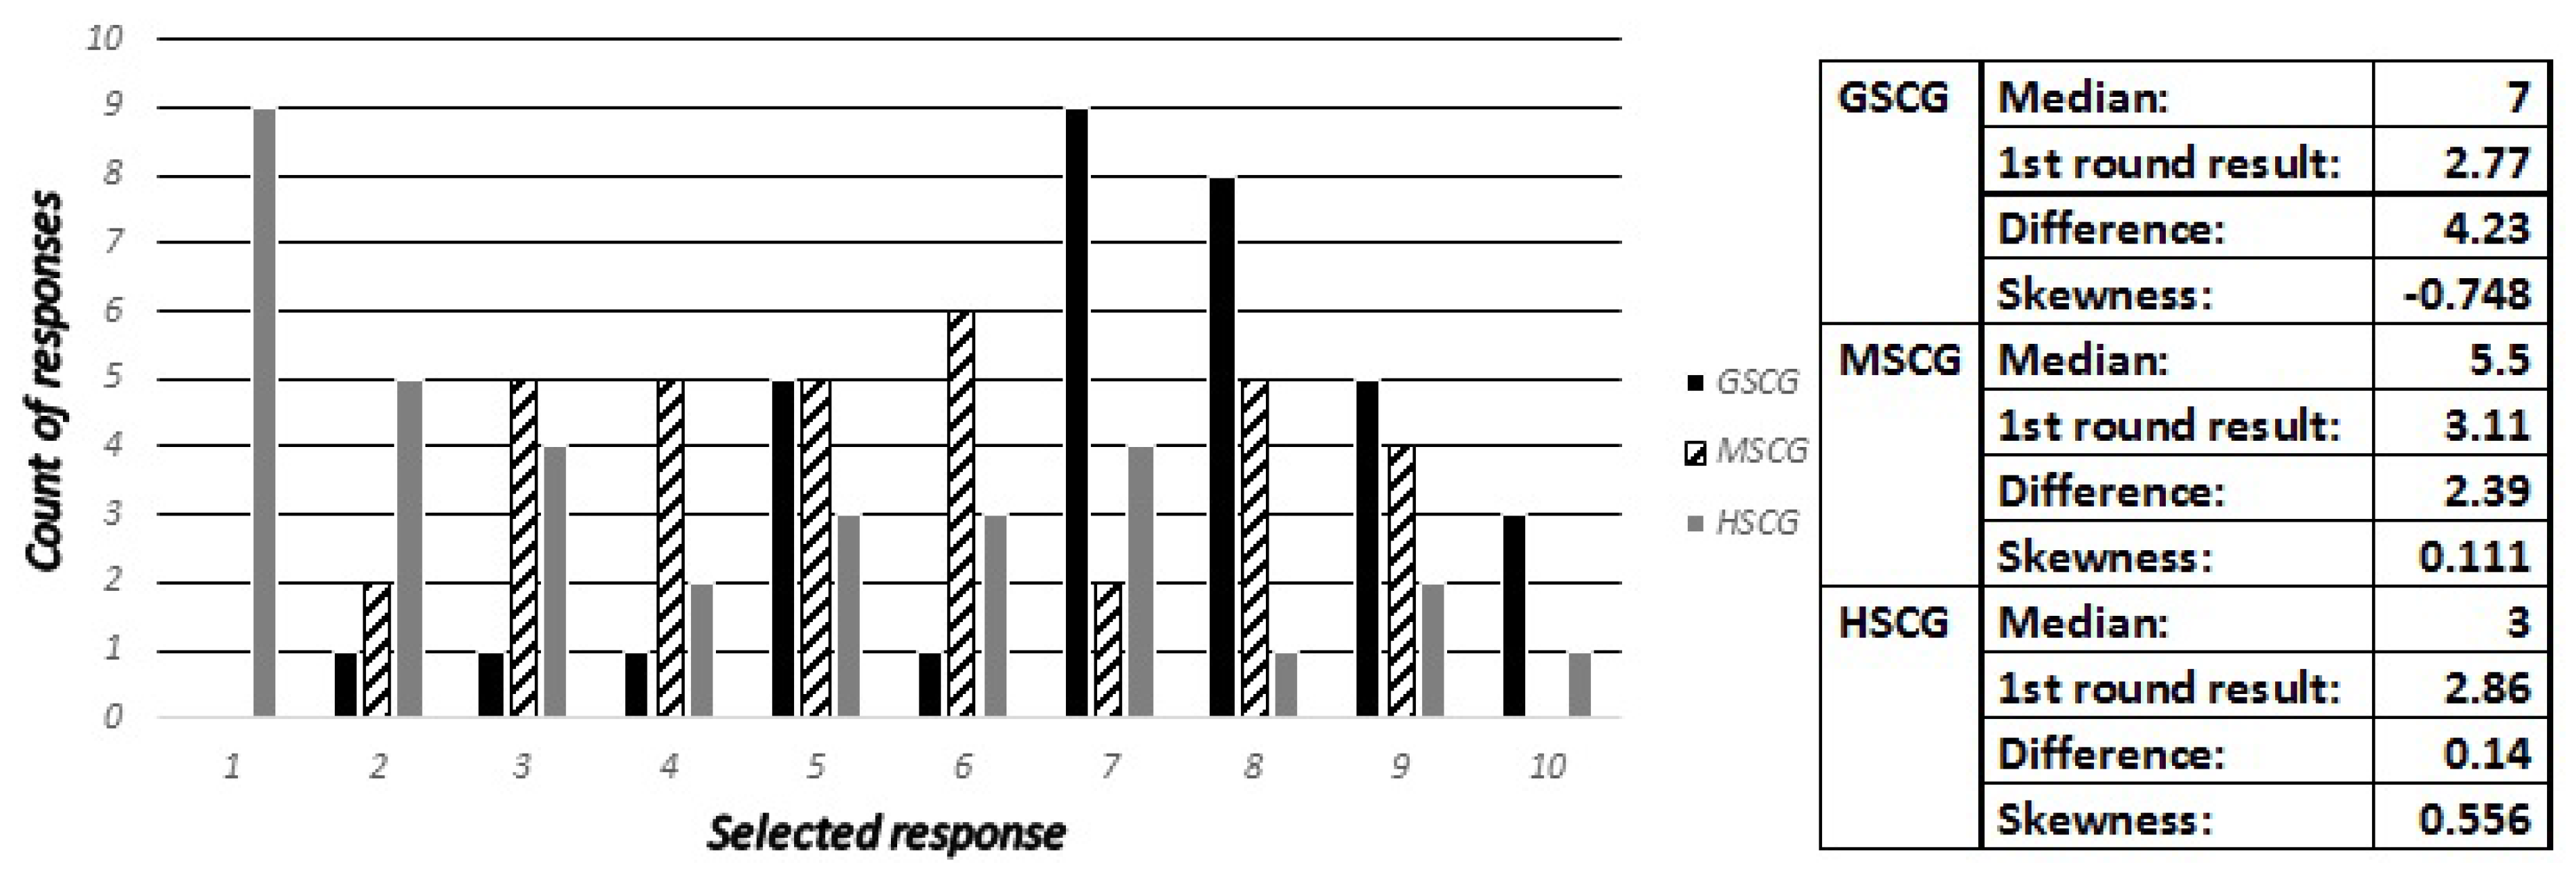
The security professionals have been asked to estimate how many out of ten digital natives across all SCG groups store personal passwords as plaintext in their mobile devices. It is noticeable from the results presented in Figure 10, which shows that an average of approximately 29% of digital natives follow this practice regardless of their security competence or background, while the security experts overestimated the results in respect to the GSCG/MSCG groups.
4.3.2. Question 9
Consequently, we asked the digital natives “As soon as you have finished using an application, you...?”, with available answers being “Save credentials to stay logged in”, “Log out”, “Forget to log out”, “Do not log out because it is not important” and “Do not log out because I do not know how”. Accordingly, the security experts have been asked to estimate how many out of ten participants across the three groups have selected the most critical regarding security out of these responses. Figure 11 shows the expert predictions of option “Save credentials to stay logged in”, which shows that the experts overestimate the frequency of saving the credentials for the GSCG and the MSCG while underestimating the HSCG. Figure 12 indicates that all three competence group have very similar behaviors for logging out of applications, while the experts falsely predicted a higher frequency of logging with increased security competence. Figure 13 shows the results for “Do not log out because it is not important” where all three competence groups have answered within the range of 1.08–2.05, whereas the experts overestimated the GSCG and the MSCG, and correctly predicted the HSCG.
4.4. Protection Mechanisms
4.4.1. Question 10
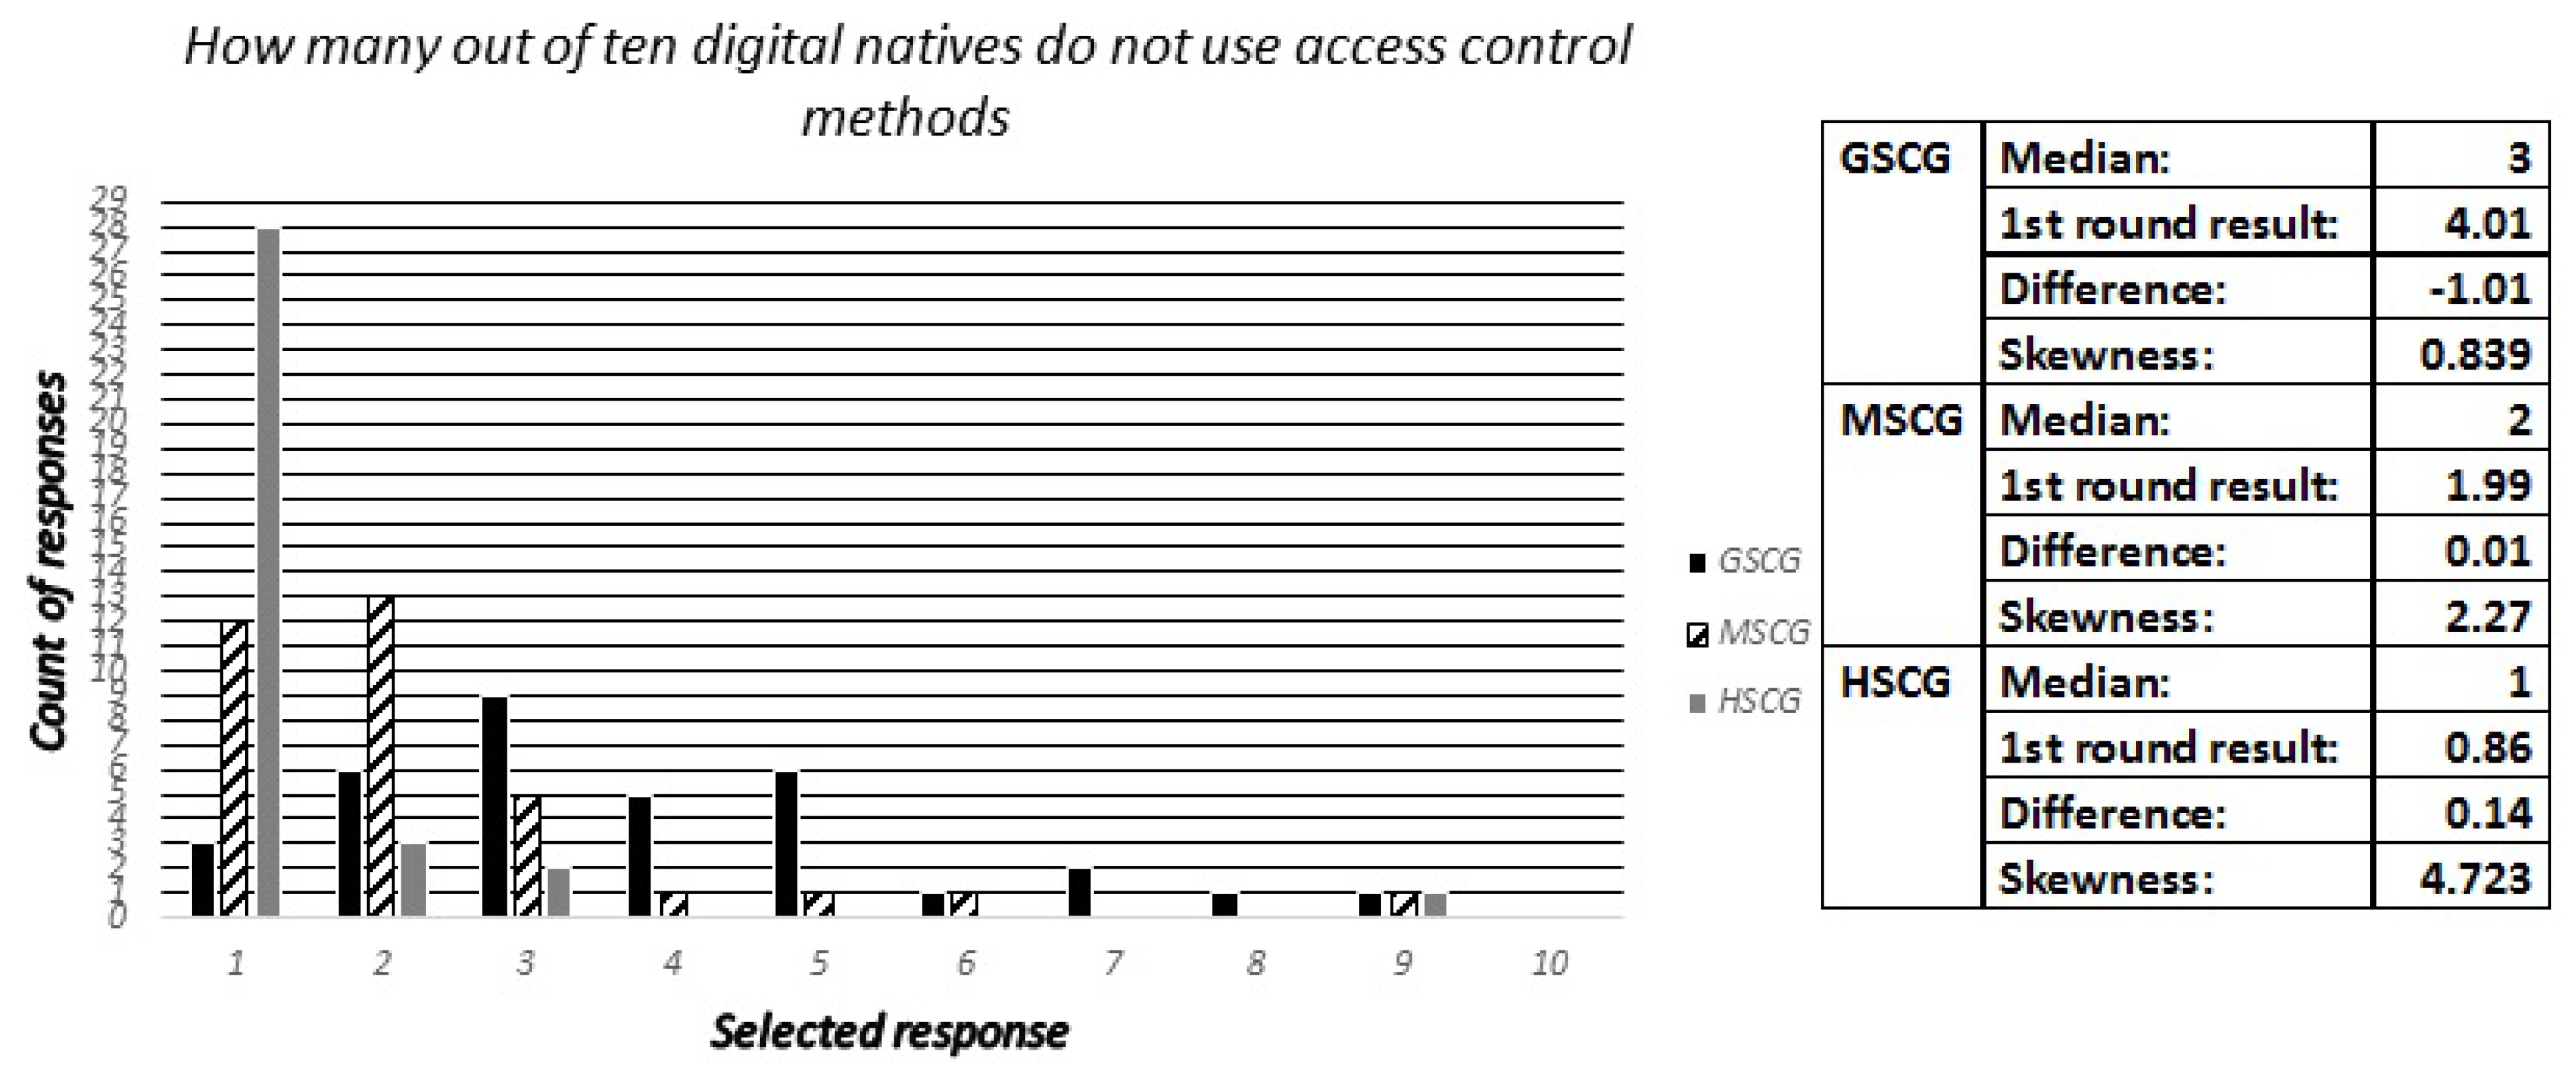
The security professionals have been asked to estimate the two most favorable access control methods across the three digital natives groups. These included “Biometrics”, “Pass-phrases”, “Pattern lock”, “PIN” and “None”. Furthermore, they have been asked to estimate how many out of ten digital natives stated that they do not utilize any access control method for their mobile devices. The results presented in Table 2 and Figure 14 show that the security experts have a sufficient understanding of the technology penetration rates for the available access control methods across the population and the extent of their utilization.
4.4.2. Question 11
Similarly to question 10, we asked the security experts to identify the most favorable protection tools used by the digital natives across all groups. The available responses included “Lock wipe”, “Remote wipe”, “Find my phone”, “Backup”, “Encryption”, “Personal firewall”, “VPN”, “None”, “I do not know these tools” and “Other”. The most favorable and second most favorable tools selected among the digital natives across the three groups are presented in Table 3, along with the estimations of the security experts. The results show that the experts got one out of six possible right (the second most frequent for GSCG). Furthermore, the results with respect to the critical “None” and “I do not know these tools” responses are presented in Figure 15 and Figure 16. The results show that for the “None” response the experts estimated a too high median for the GSCG and correctly predicted the two other groups. Secondly, all the digital natives groups had good knowledge of the tools, but the experts underestimated the GSCG and MSCG groups knowledge by predicting too high values.
4.4.3. Question 12
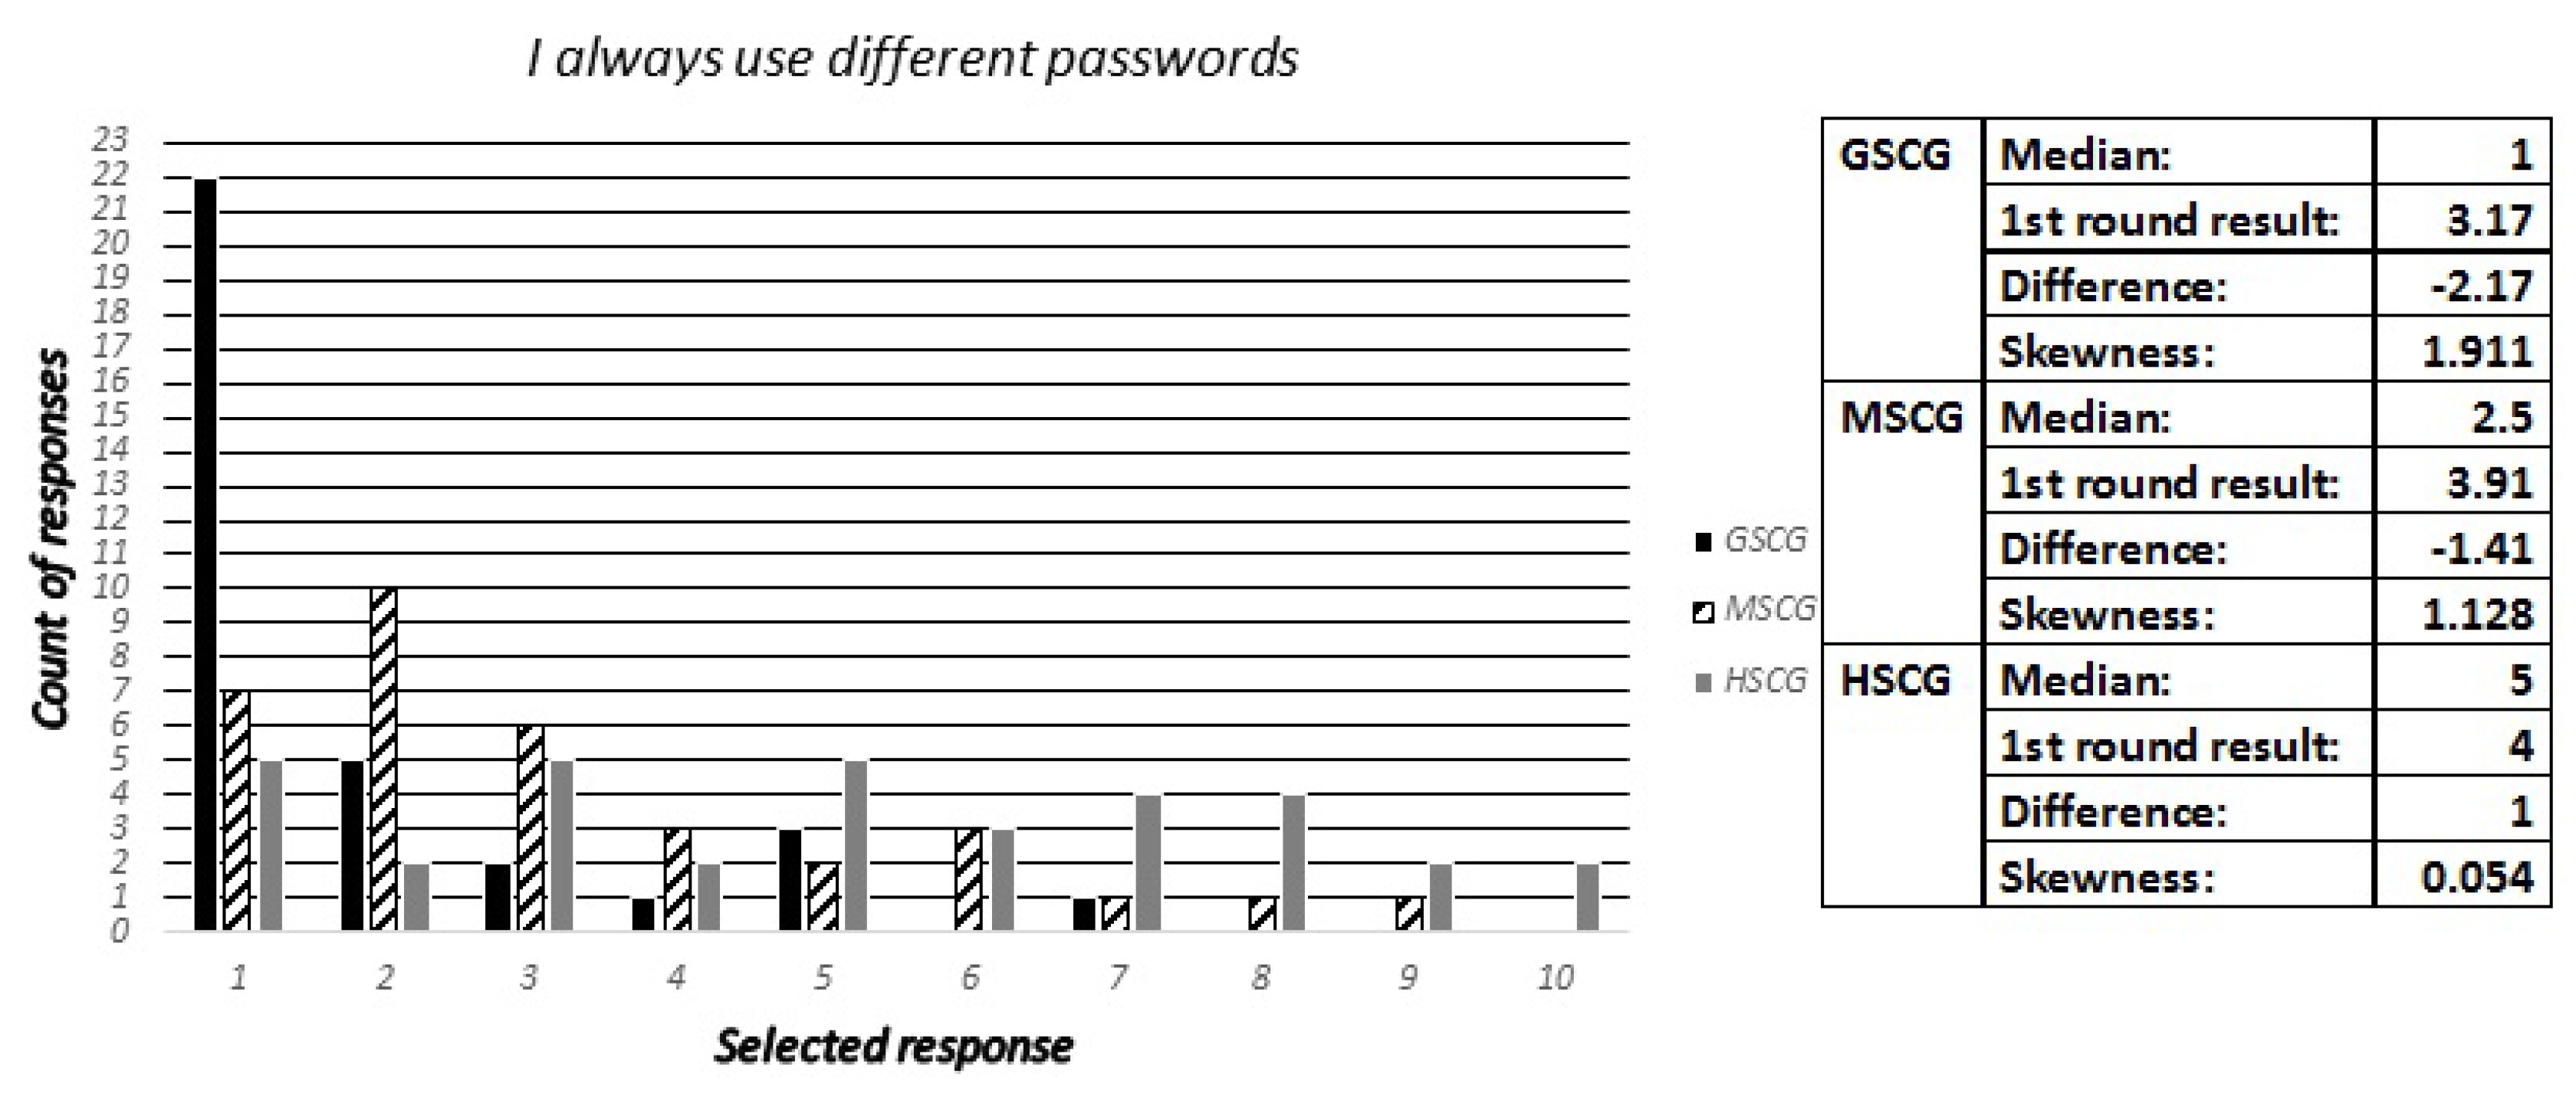
During the first stage of our study, this section concluded with a set of questions towards the digital natives about their choices in respect to the selection and use of passwords. Accordingly, the security experts have been asked to estimate how many out of ten digital natives across all SCGroups have reported to:
- Always use the same password,
- Use small variations of the same password for different applications,
- Always use different passwords.
5. Summary of Results and Discussion
Table 4 summarizes the expert prediction accuracy for each area and the total. Starting with the use of mobile devices, our results show that the Experts only estimate correctly 2 out of 10 possible for GSCG. The low prediction rate for the GSCG continues throughout the results, in which the experts missed all three on the connectivity and network access parts. They got 1 of 4 right on the Management of credentials part, and 4 out of 10 regarding protection mechanisms. The total prediction accuracy of the experts regarding the GSCG was 26%, which indicates a poor understanding of the group for all areas.
The expert predictions regarding the MSCG was 15% better than GSCG. This result was in particular caused by the predictions regarding the use of mobile devices and connectivity where the experts got 50% and 75% of the predictions right. The predictions for the HSCG were 18% better than the MSCG, which brings forth a clear trend: the experts are better calibrated to predict users with better security knowledge. However, the total accuracy of 59% for expert predictions regarding the HSCG is not a very high number. Considering the total average accuracy, the results for three areas, use of mobile devices, connectivity and network access, and protection mechanisms) are within the range 44%–47%. Management of credentials is the outlier with only 25%. The results indicate an increased expert understanding of user behavior with the level of security knowledge. However, the total expert prediction accuracy for all three groups was 42%, which indicates a poor understanding of the digital natives.
The results of this study present some notable findings, with respect to how security experts perceive the digital natives as users of mobile devices. From questions 10 and 11, we see that security professionals have a relatively good understanding of the technology penetration rates for various security related tools such as access control methods.
Furthermore, the results across the survey allow us to identify that security experts consistently underestimate the security awareness of the general population, represented by the GSCGroup. This is noticeable across all the questions, with minor exceptions, such as Question-3, and some sub-categories such as Question-4b (“I always check the required permissions before installing an application”), Question-9b (“I always log-out after finishing using an application”), and Question 12-b (“I use small variations of the same password for different applications”). Moreover, this consistent deviation between the median value of the experts’ responses and the first round of results is noticeably extended, with ten questions providing a difference of more than 3 (30%) and up to 5.5 (55%).
The results are different in respect to the HSCG group, which consists of university students in the field of information security. For this group, the responses for seventeen questions have been estimated correctly by the experts, while, in five cases, the security awareness of this group has been overestimated, and only in one case has been underestimated. Furthermore, it is noticeable that the distribution of the responses for a sub-set of questions does not present a clearly defined tendency or concentration around a central value. From this, we can extract that the user-models of the security professionals include randomness, and may be biased by personal perception. Examples of this are noticeable in Question-1-GSCG, Question-3, Question-5-HSCG, and Question-8-MSCG.
6. Limitations & Future Work
We conducted this study under the limitation that a prior study collected the GSCG dataset. Therefore, access to the raw data was not possible, which restricted the possibility for deeper statistical analysis. The diversities in both national and cultural backgrounds we find at universities make them ideal for this type of study. However, although each data sample (GSCG, MSCG, and HSCG) was collected at universities, and it is likely that the majority of the respondents originate from the country where the university is situated and that there is a culture bias in our samples. Furthermore, the two samples for the HSCG and the experts were both small (34 and 35 respondents), which makes them vulnerable to outliers. However, the results we provide in this study provide a strong incentive for future studies within user modeling of the digital natives. A path for future research is validation studies where the researchers go deeper into each area to determine more precisely where the expert understanding is poor. Based on the proposed studies, researchers can create better training programs to improve the understanding of the digital natives, which will lead to enhanced security solutions for the new generation.
7. Conclusions
Digital natives make extensive use of mobile devices, while such devices are increasingly integrated into complex socio-technical systems with critical security implications. In our study, we sought to identify how user behavior can affect the security of emerging mobile technologies. Therefore, at the initial stage, a survey allowed the extraction of findings with respect to how the digital natives use their mobile devices and perceive associated risks according to their background and level of security awareness. Accordingly, in this article, we approached this topic from the perspective of experts, who are involved in the design, operational support, and analysis of such systems. Our results suggest that the experts understanding over user behavior does not follow a solidified user-model, especially on the general population. Furthermore, in some of the identified topics, influences from personal perceptions and randomness was noticeable. Accordingly, improving security over such systems would require not only the enhancement of the users’ security awareness, but also the improvement of existing user-models and their dissemination within the design and analysis phases.
Author Contributions
The authors contributed equally to this work.
Conflicts of Interest
The authors declare no conflict of interest.
References
- Felt, A.P.; Ha, E.; Egelman, S.; Haney, A.; Chin, E.; Wagner, D. Android permissions: User attention, comprehension, and behavior. In Proceedings of the Eighth Symposium on Usable Privacy and Security, Washington, DC, USA, 11–13 July 2012; p. 3. [Google Scholar]
- Kelley, P.G.; Consolvo, S.; Cranor, L.F.; Jung, J.; Sadeh, N.; Wetherall, D. A conundrum of permissions: Installing applications on an android smartphone. In Proceedings of the International Conference on Financial Cryptography and Data Security, Kralendijk, Bonaire, 27 February–1 March 2012; pp. 68–79. [Google Scholar]
- Ophoff, J.; Robinson, M. Exploring end-user smartphone security awareness within a South African context. In Proceedings of the Information Security for South Africa, Johannesburg, South Africa, 13–14 August 2014; pp. 1–7. [Google Scholar]
- Gkioulos, V.; Wangen, G.; Katsikas, S.K.; Kavallieratos, G.; Kotzanikolaou, P. Security Awareness of the Digital Natives. Information 2017, 8, 42. [Google Scholar] [CrossRef]
- Lella, A.; Lipsman, A. The US Mobile App Report. 2014. Available online: http://www.comscore.com/Insights/Presentationsand-Whitepapers/2014/The-US-Mobile-App-Report (accessed on 8 April 2015).
- Prensky, M. Digital natives, digital immigrants part 1. Horizon 2001, 9, 1–6. [Google Scholar] [CrossRef]
- Bennett, S.; Maton, K.; Kervin, L. The ‘digital natives’ debate: A critical review of the evidence. Br. J. Educ. Technol. 2008, 39, 775–786. [Google Scholar] [CrossRef]
- Chin, E.; Felt, A.P.; Sekar, V.; Wagner, D. Measuring user confidence in smartphone security and privacy. In Proceedings of the Eighth Symposium on Usable Privacy and Security, Washington, DC, USA, 11–13 July 2012; p. 1. [Google Scholar]
- Mylonas, A.; Gritzalis, D.; Tsoumas, B.; Apostolopoulos, T. A qualitative metrics vector for the awareness of smartphone security users. In Proceedings of the 10th International Conference on Trust, Privacy and Security in Digital Business, Prague, Czech, 28–29 August 2013; pp. 173–184. [Google Scholar]
- Mylonas, A.; Kastania, A.; Gritzalis, D. Delegate the smartphone user? Security awareness in smartphone platforms. Comput. Secur. 2013, 34, 47–66. [Google Scholar] [CrossRef]
- Parker, F.; Ophoff, J.; Van Belle, J.P.; Karia, R. Security awareness and adoption of security controls by smartphone users. In Proceedings of the Second International Conference on Information Security and Cyber Forensics (InfoSec), Cape Town, South Africa, 15–17 November 2015; pp. 99–104. [Google Scholar]
- Markelj, B.; Bernik, I. Safe use of mobile devices arises from knowing the threats. J. Inf. Secur. Appl. 2015, 20, 84–89. [Google Scholar] [CrossRef]
- Markelj, B.; Zgaga, S. Comprehension of cyber threats and their consequences in Slovenia. Comput. Law Secur. Rev. 2016, 32, 513–525. [Google Scholar] [CrossRef]
- Kandias, M.; Mylonas, A.; Virvilis, N.; Theoharidou, M.; Gritzalis, D. An insider threat prediction model. In Proceedings of the International Conference on Trust, Privacy and Security in Digital Business, Bilbao, Spain, 30–31 August 2010; pp. 26–37. [Google Scholar]
- Workman, M.; Bommer, W.H.; Straub, D. Security lapses and the omission of information security measures: A threat control model and empirical test. Comput. Hum. Behav. 2008, 24, 2799–2816. [Google Scholar] [CrossRef]
- Bulgurcu, B.; Cavusoglu, H.; Benbasat, I. Information security policy compliance: An empirical study of rationality-based beliefs and information security awareness. MIS Q. 2010, 34, 523–548. [Google Scholar]
- Ng, B.Y.; Kankanhalli, A.; Xu, Y.C. Studying users’ computer security behavior: A health belief perspective. Decis. Support Syst. 2009, 46, 815–825. [Google Scholar] [CrossRef]
- Asgharpour, F.; Liu, D.; Camp, L.J. Mental models of security risks. In Proceedings of the 11th International Conference on Financial Cryptography and Data Security, Scarborough, Trinidad and Tobago, 12–16 February 2007; pp. 367–377. [Google Scholar]
- Camp, L.J. Mental models of privacy and security. IEEE Technol. Soc. Mag. 2009, 28. [Google Scholar] [CrossRef]
- Herley, C. So long, and no thanks for the externalities: The rational rejection of security advice by users. In Proceedings of the Workshop on New Security Paradigms Workshop, Oxford, UK, 8–11 September 2009; pp. 133–144. [Google Scholar]
- Ariu, D.; Bosco, F.; Ferraris, V.; Perri, P.; Spolti, G.; Stirparo, P.; Vaciago, G.; Zanero, S. Security of the Digital Natives. Available SSRN 2014. [Google Scholar]
- Norman, G. Likert scales, levels of measurement and the “laws” of statistics. Adv. Health Sci. Educ. 2010, 15, 625–632. [Google Scholar] [CrossRef] [PubMed]
Figure 1.
Results for question 1. Graph on the left shows distribution of expert predictions and the table to the right shows comparison results.
Figure 1.
Results for question 1. Graph on the left shows distribution of expert predictions and the table to the right shows comparison results.
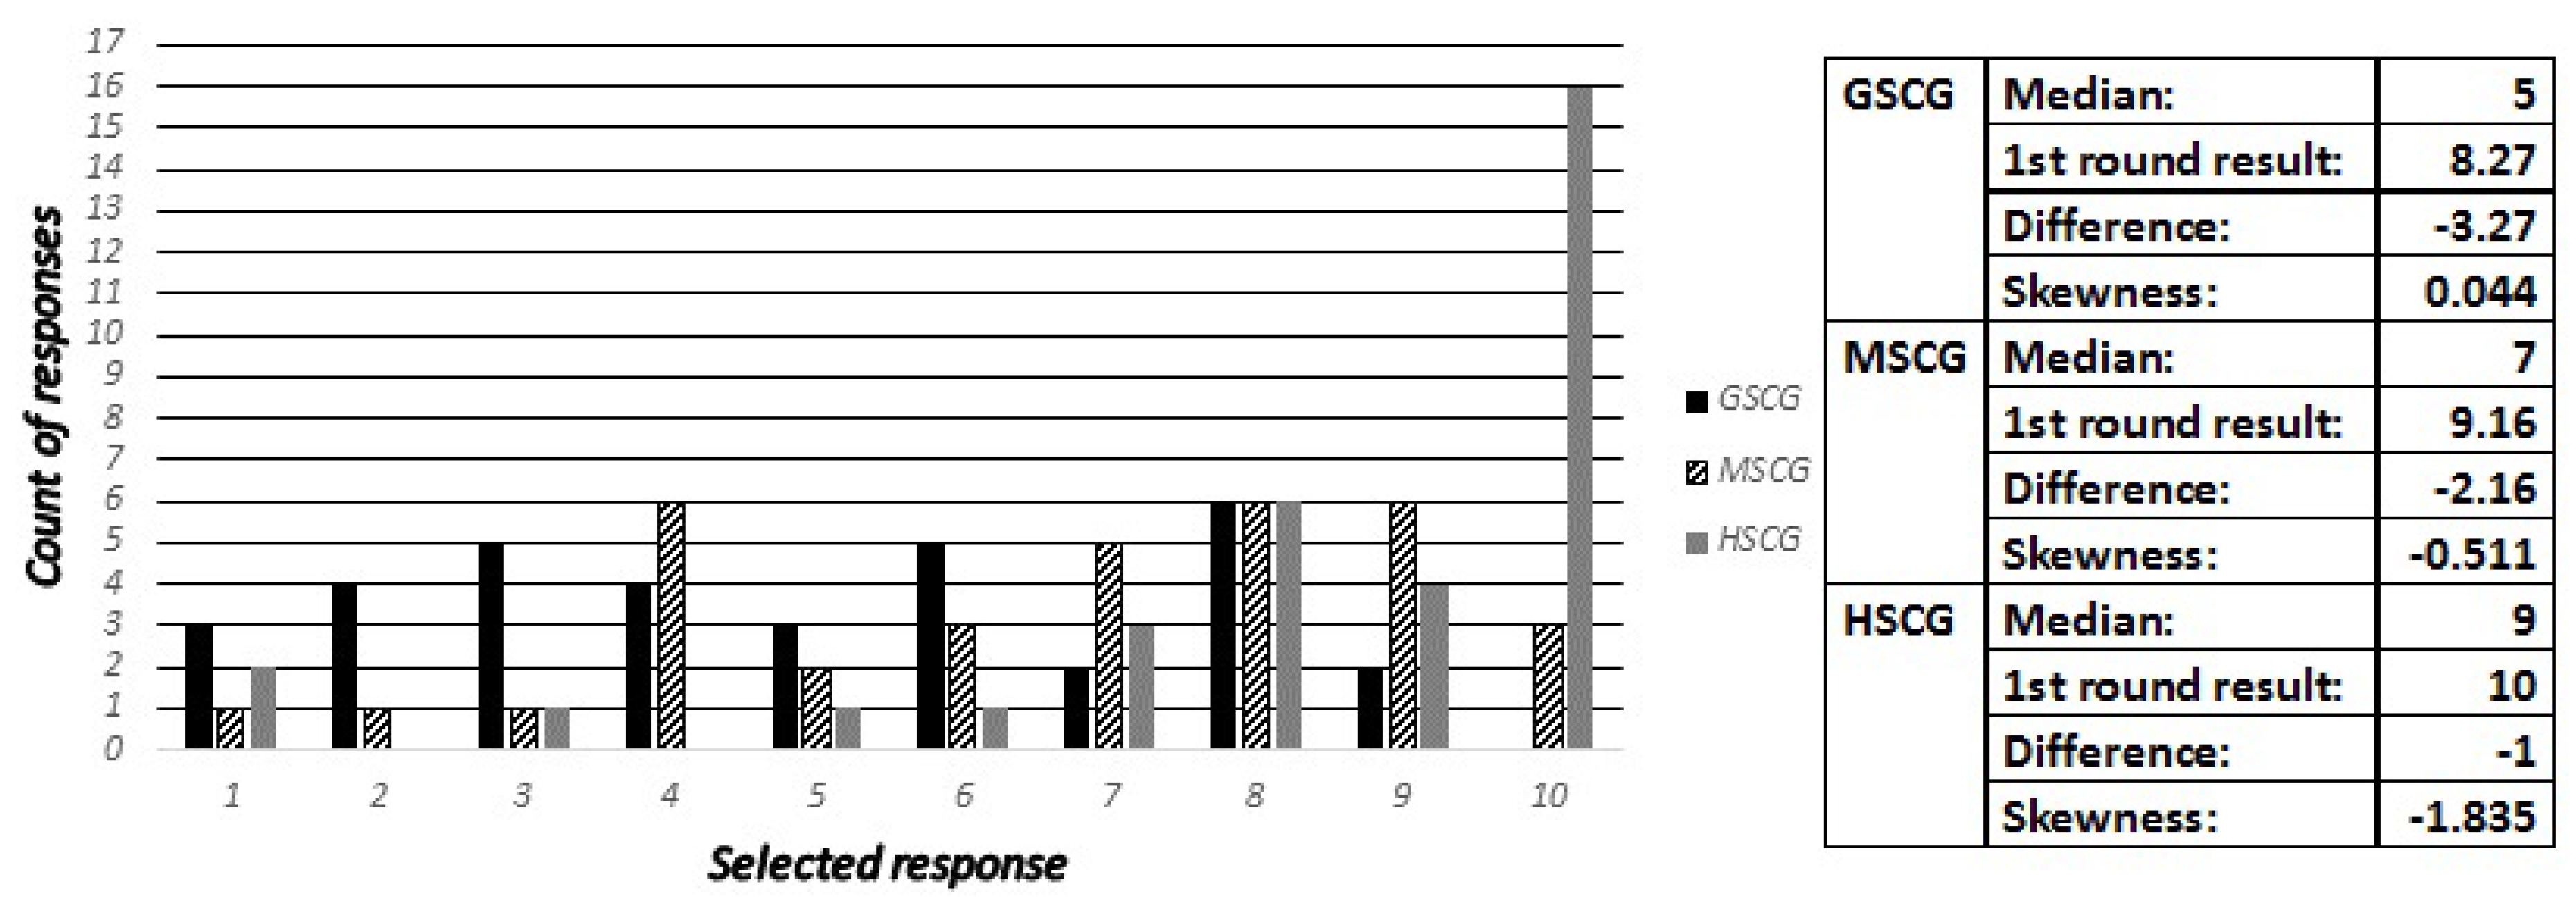
Figure 2.
Expert predictions for question 2—cell-phone/tablets.
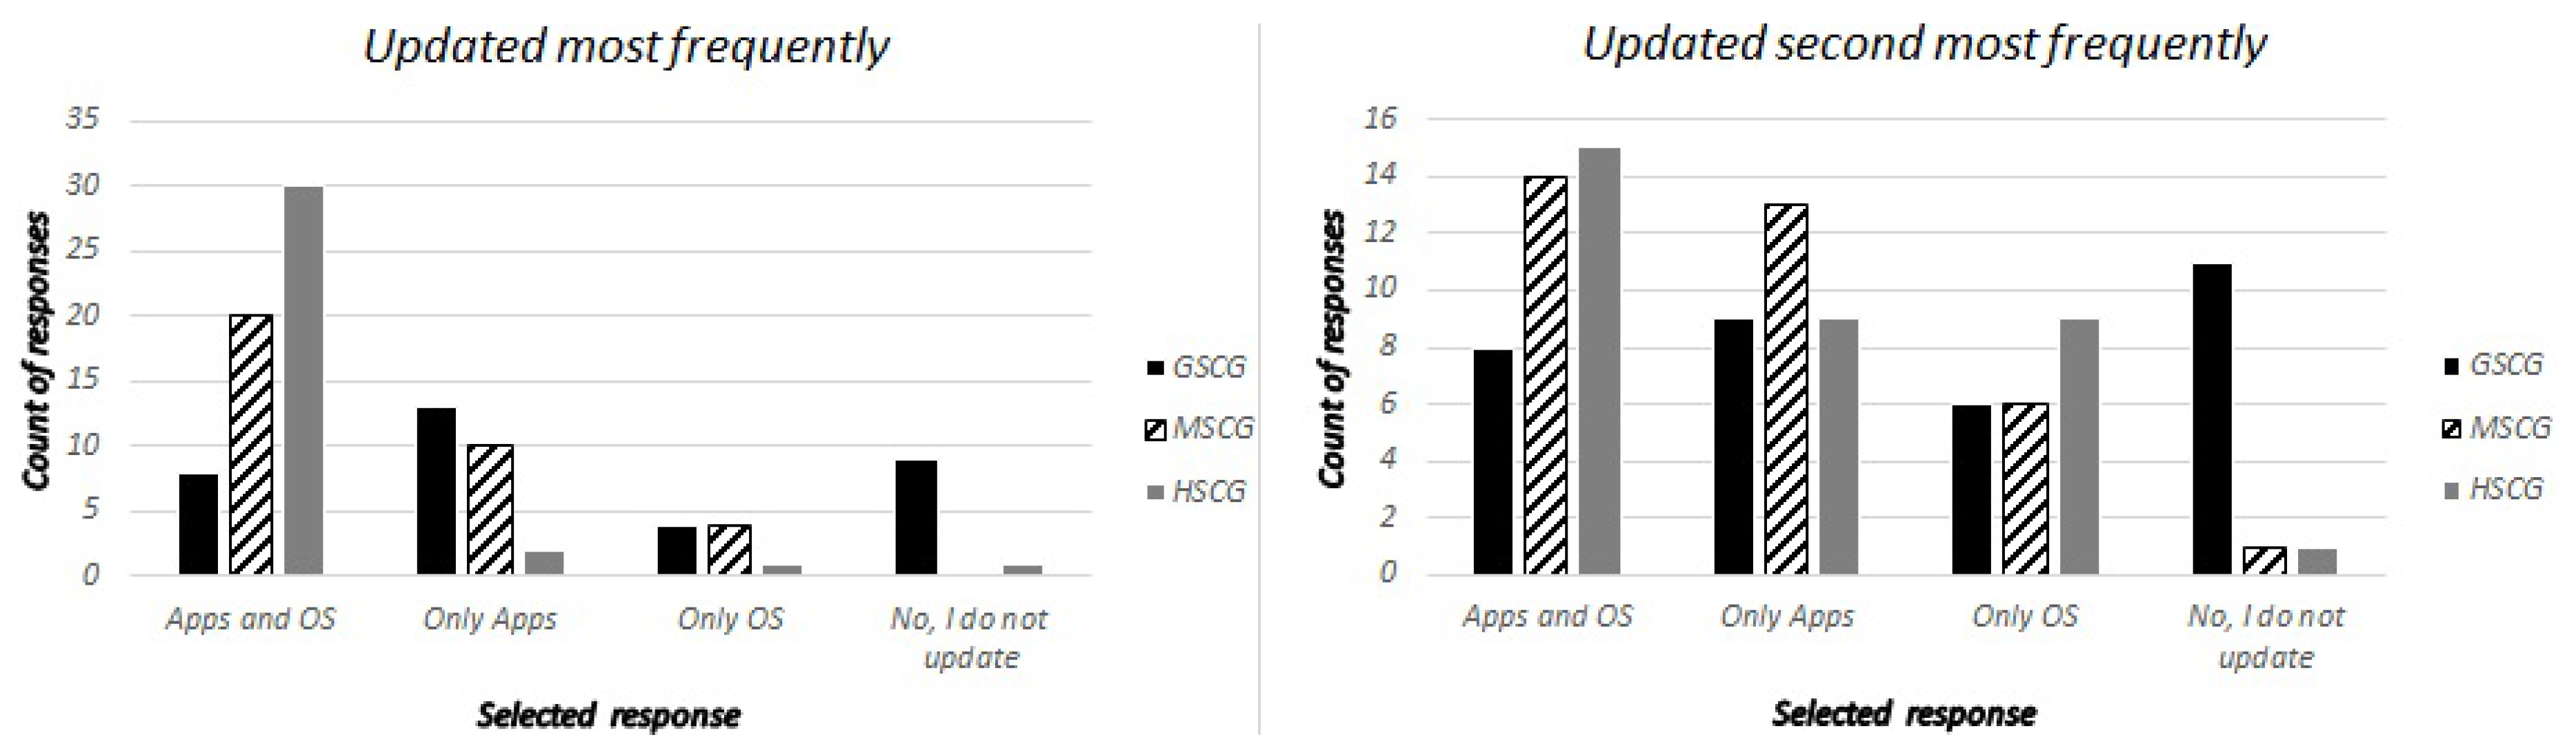
Figure 3.
Expert predictions for question 3—laptops.
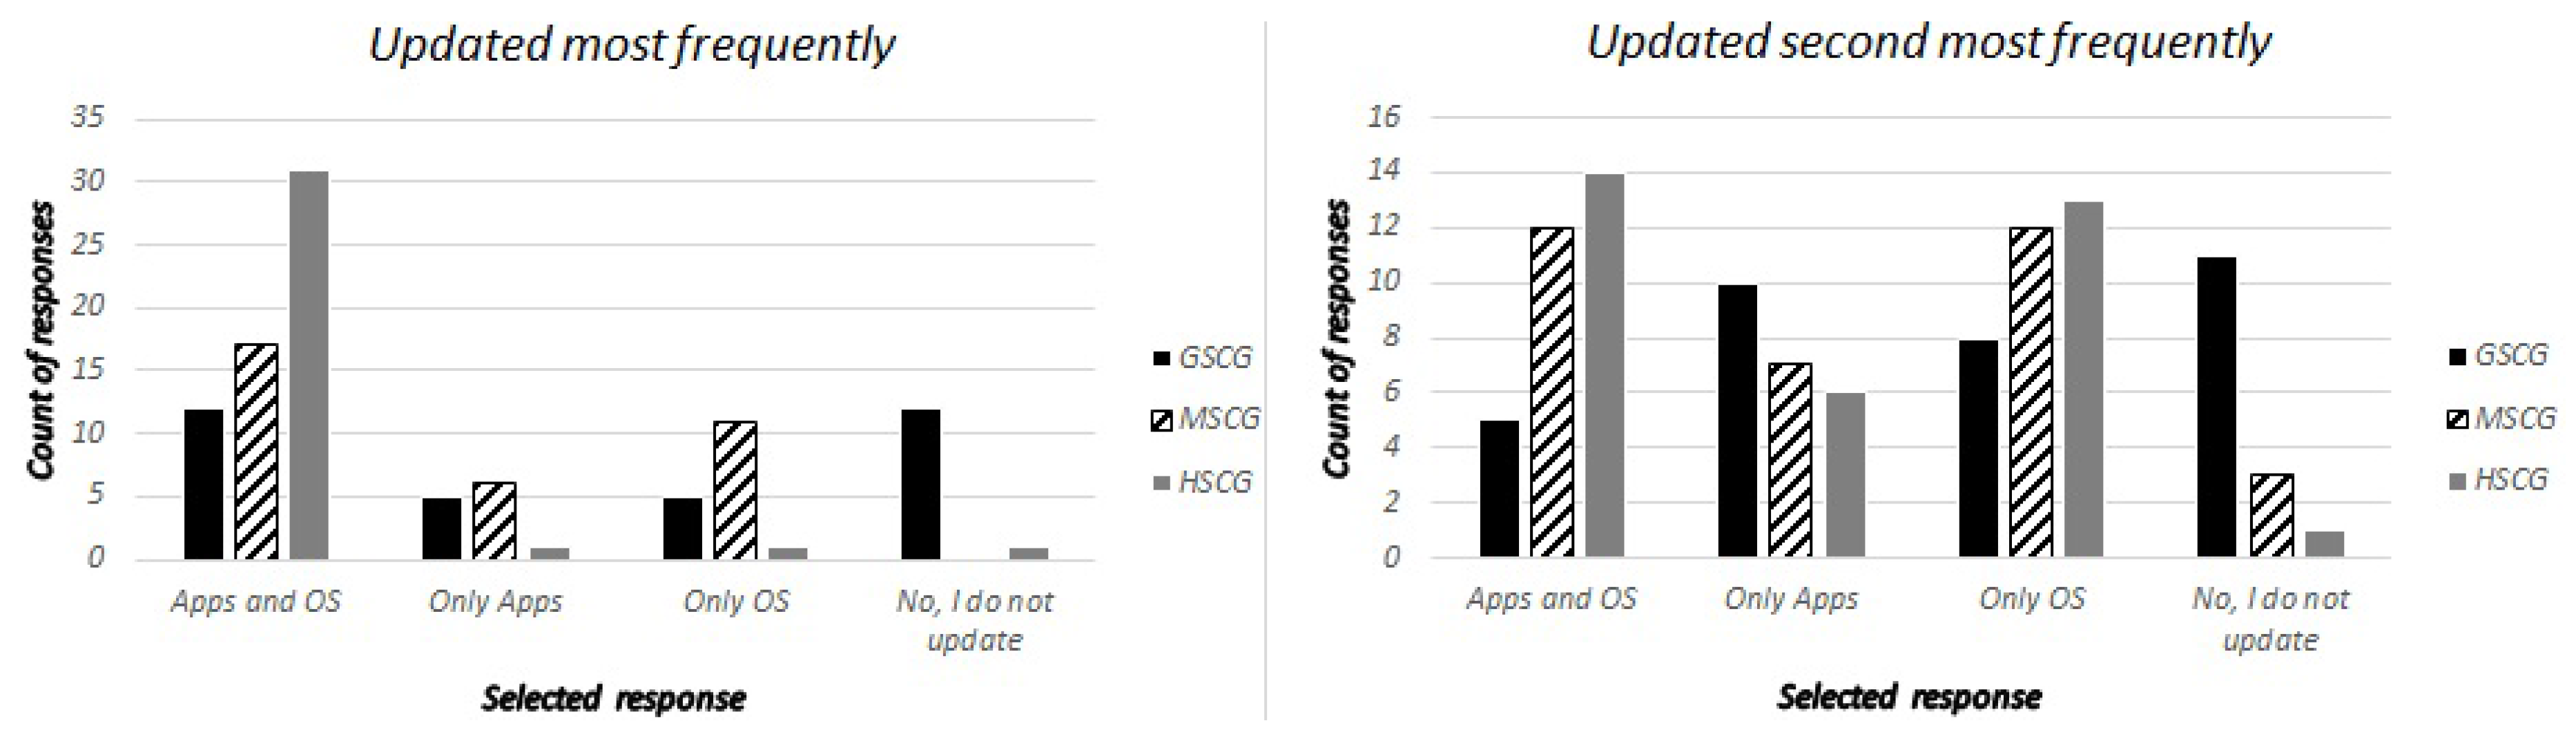
Figure 4.
Expert predictions for question 4: "Chosen most" and "Chosen second most" frequently.

Figure 5.
Expert predictions for question 4: Distribution of “Always”-response and comparison results.
Figure 5.
Expert predictions for question 4: Distribution of “Always”-response and comparison results.

Figure 6.
Expert predictions for question 4, Distribution of “Never”-response and comparison results.
Figure 6.
Expert predictions for question 4, Distribution of “Never”-response and comparison results.

Figure 7.
Expert predictions for question 5.
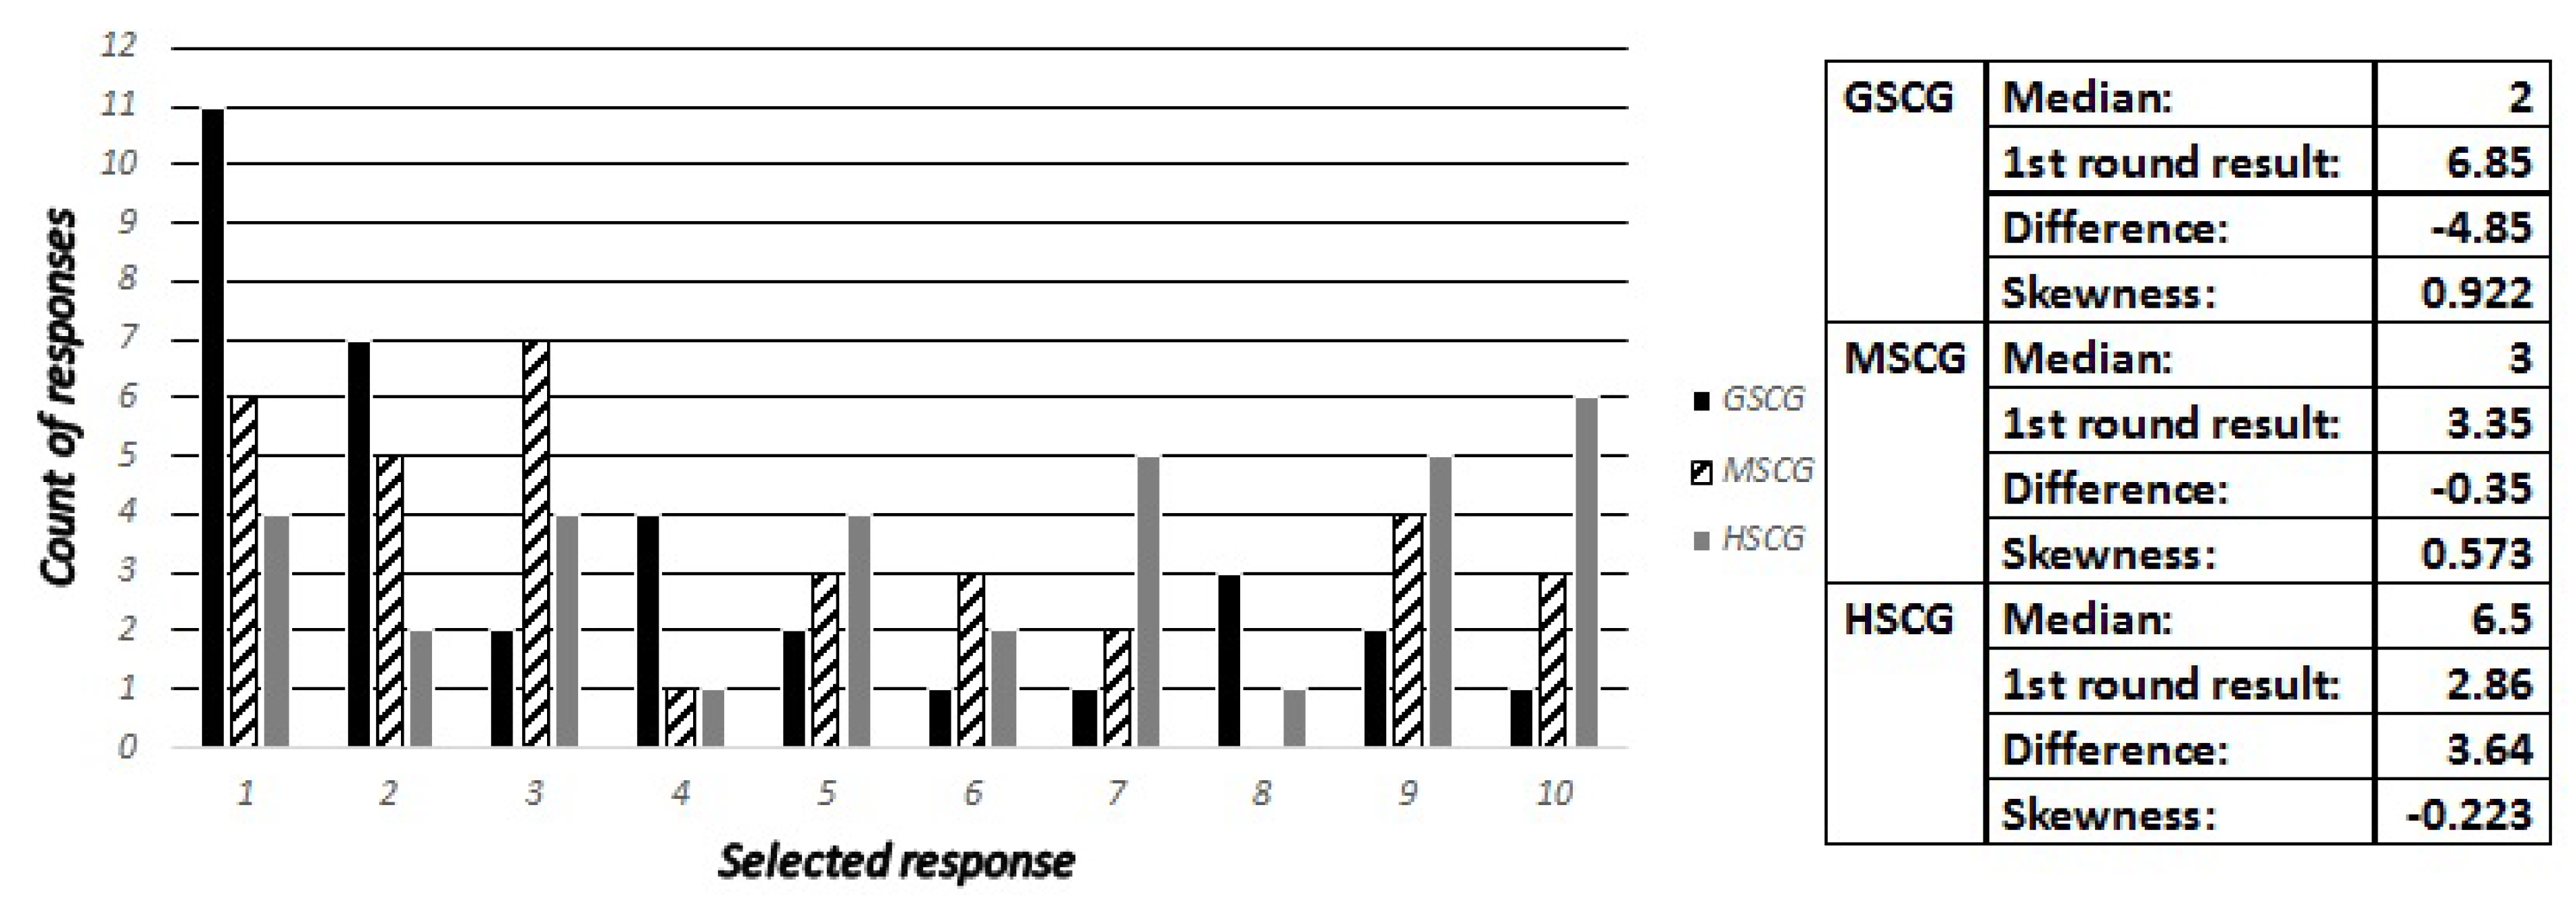
Figure 8.
Expert predictions for question 6, only for HSCG (high-security competence group)
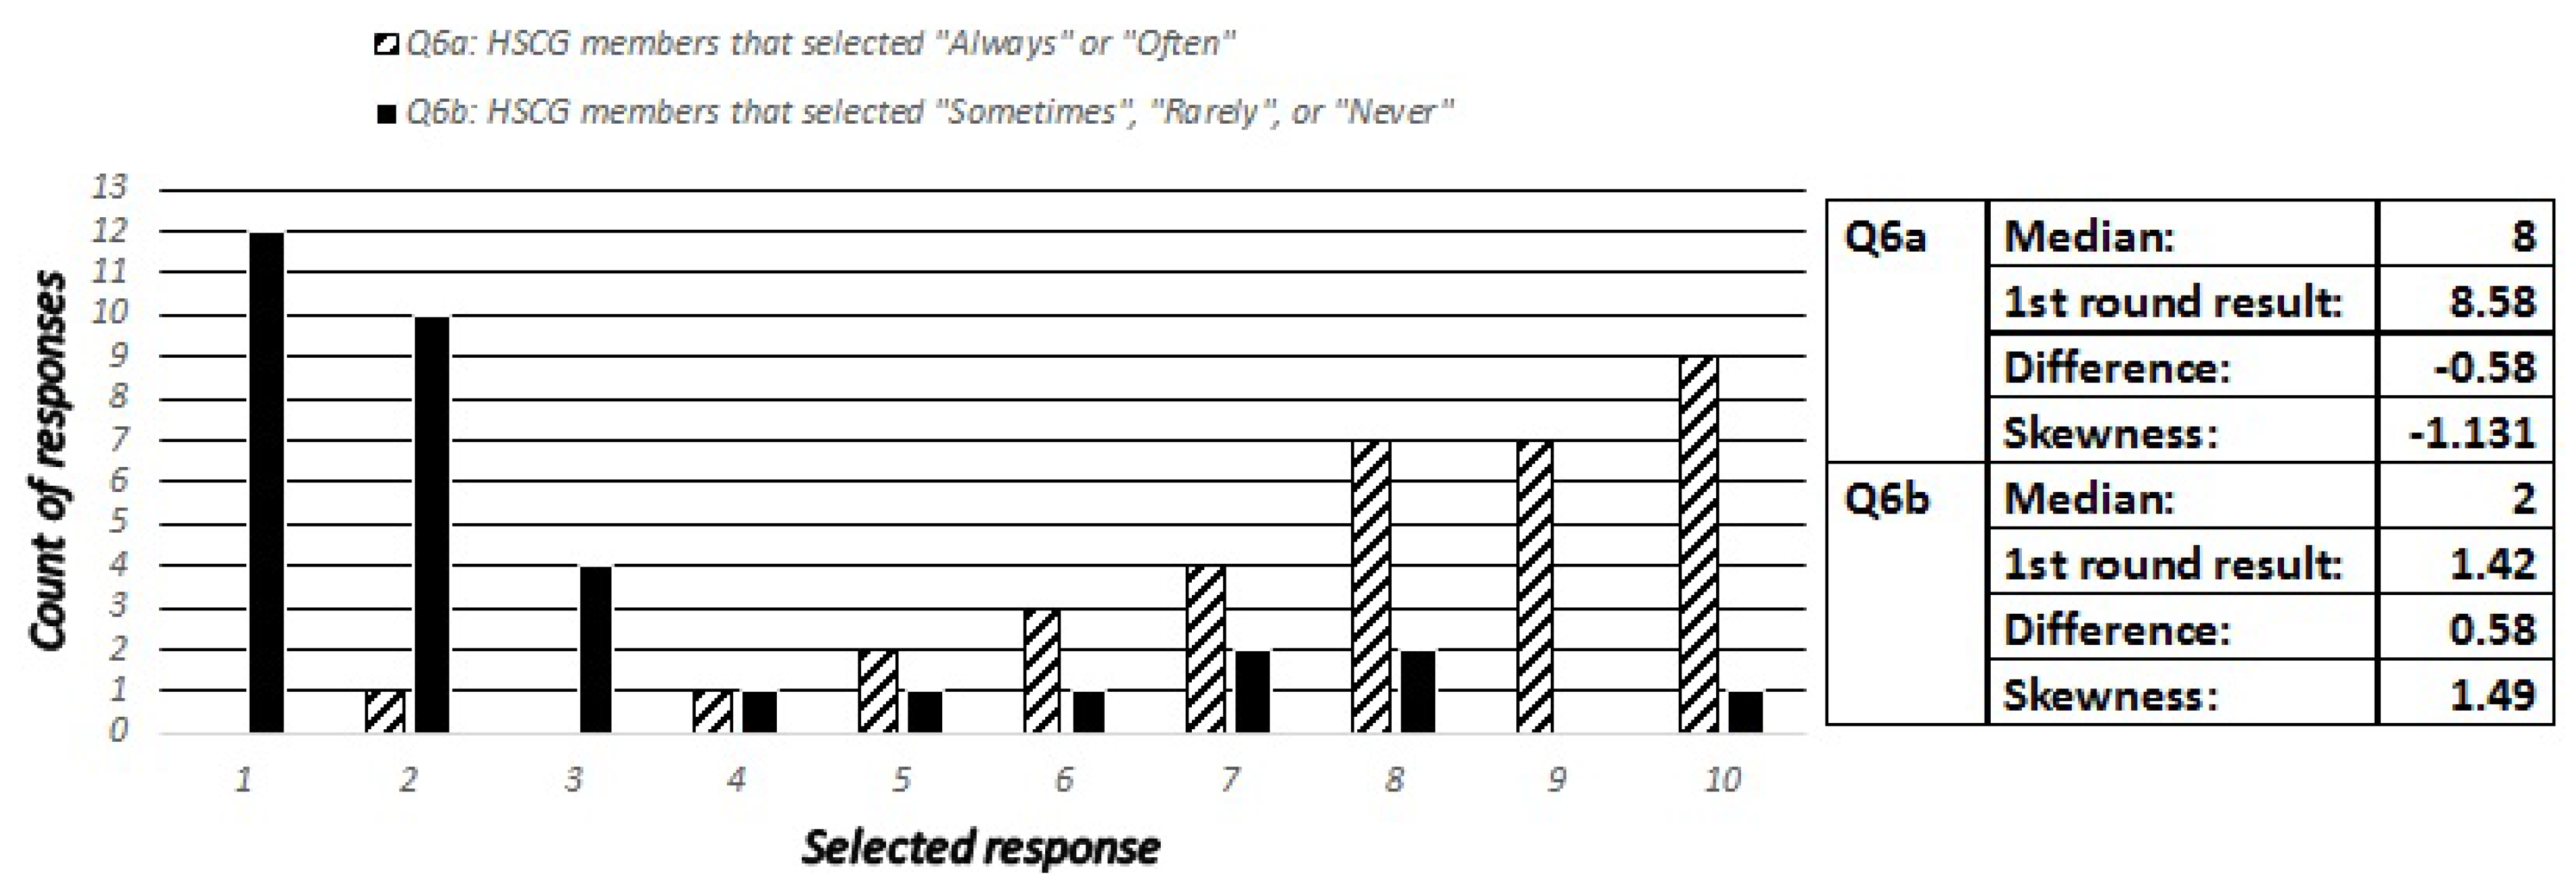
Figure 9.
Expert predictions for question 7.

Figure 10.
Expert predictions for question 8.

Figure 11.
Expert predictions for question 9, “Save credentials to stay logged in”.

Figure 12.
Expert predictions for question 9, “Log out”.
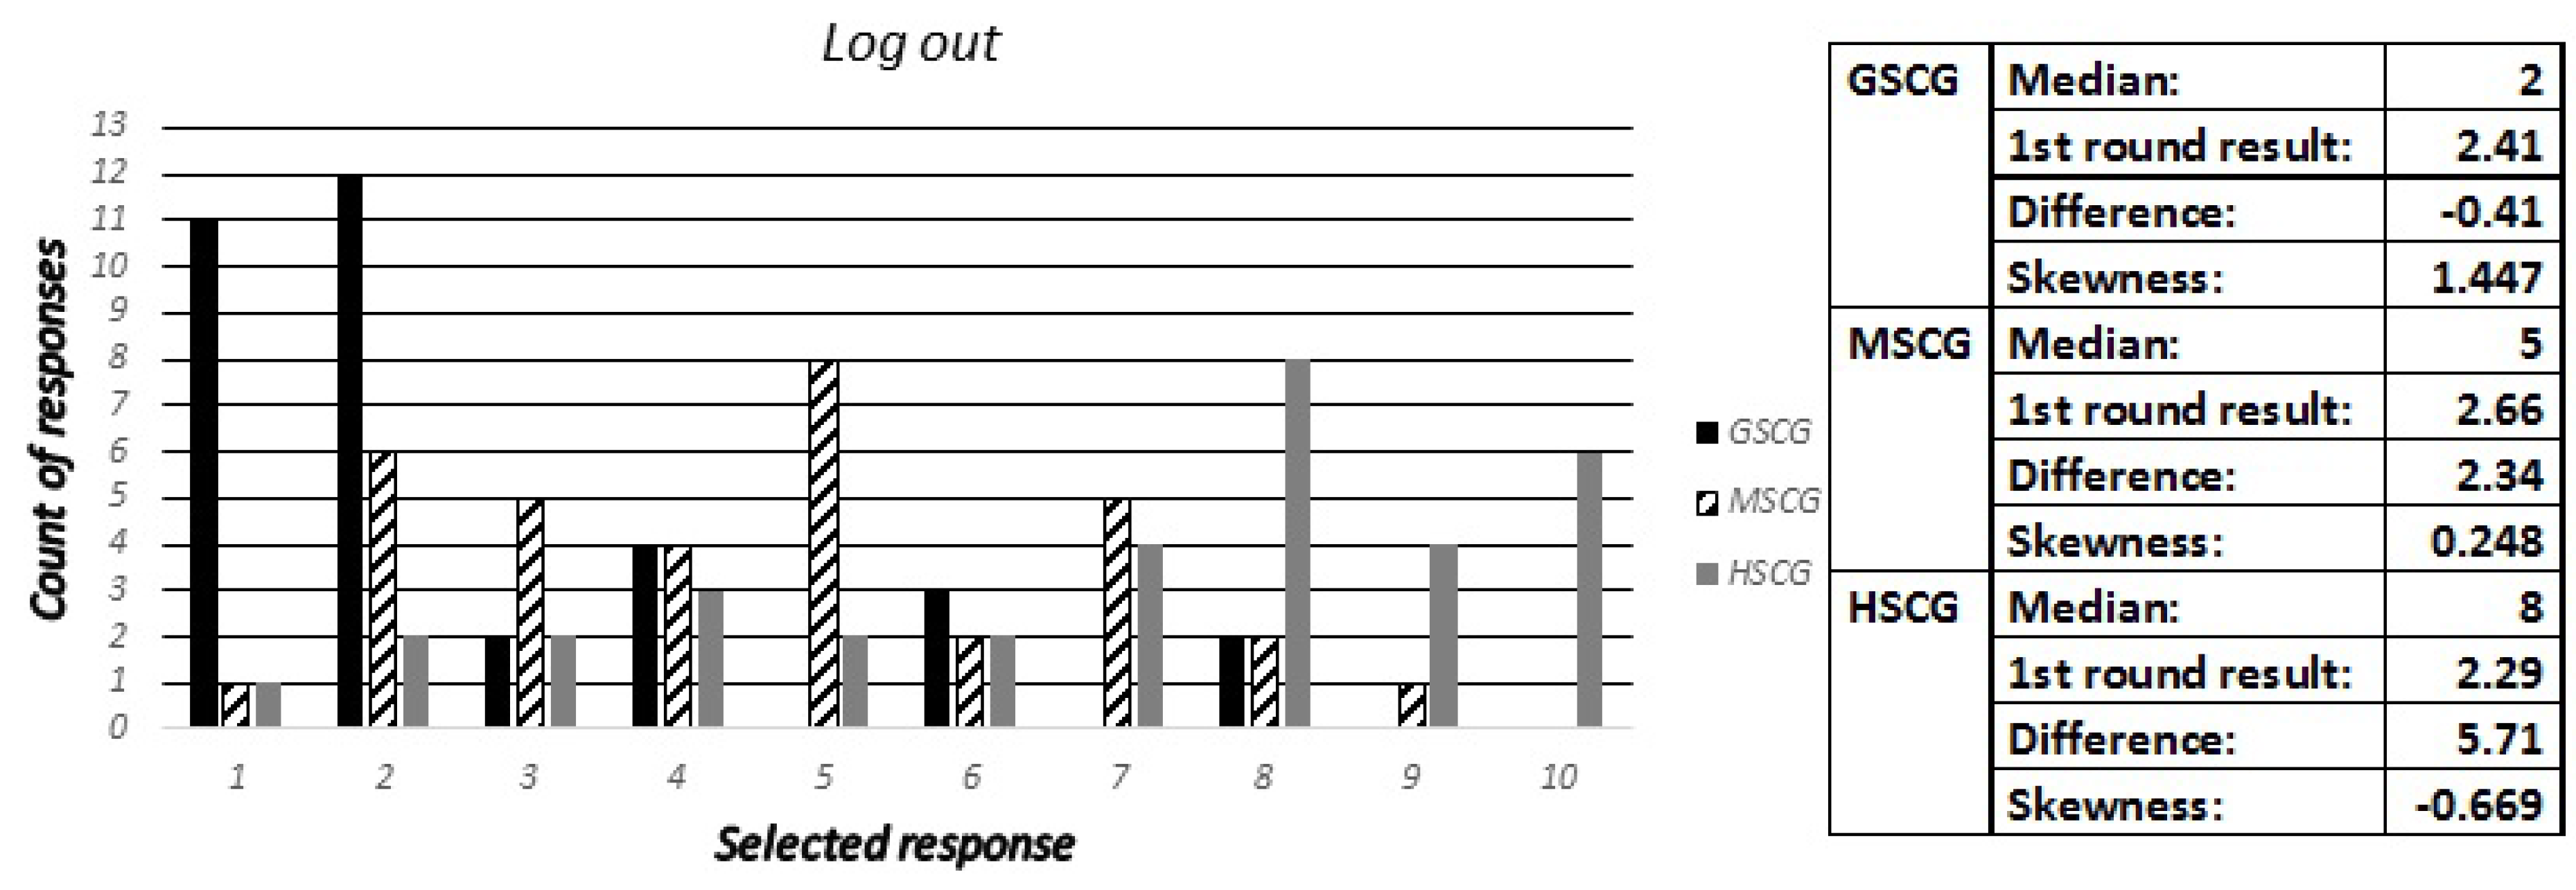
Figure 13.
Expert predictions for question 9, “Do not log out because it is not important”.
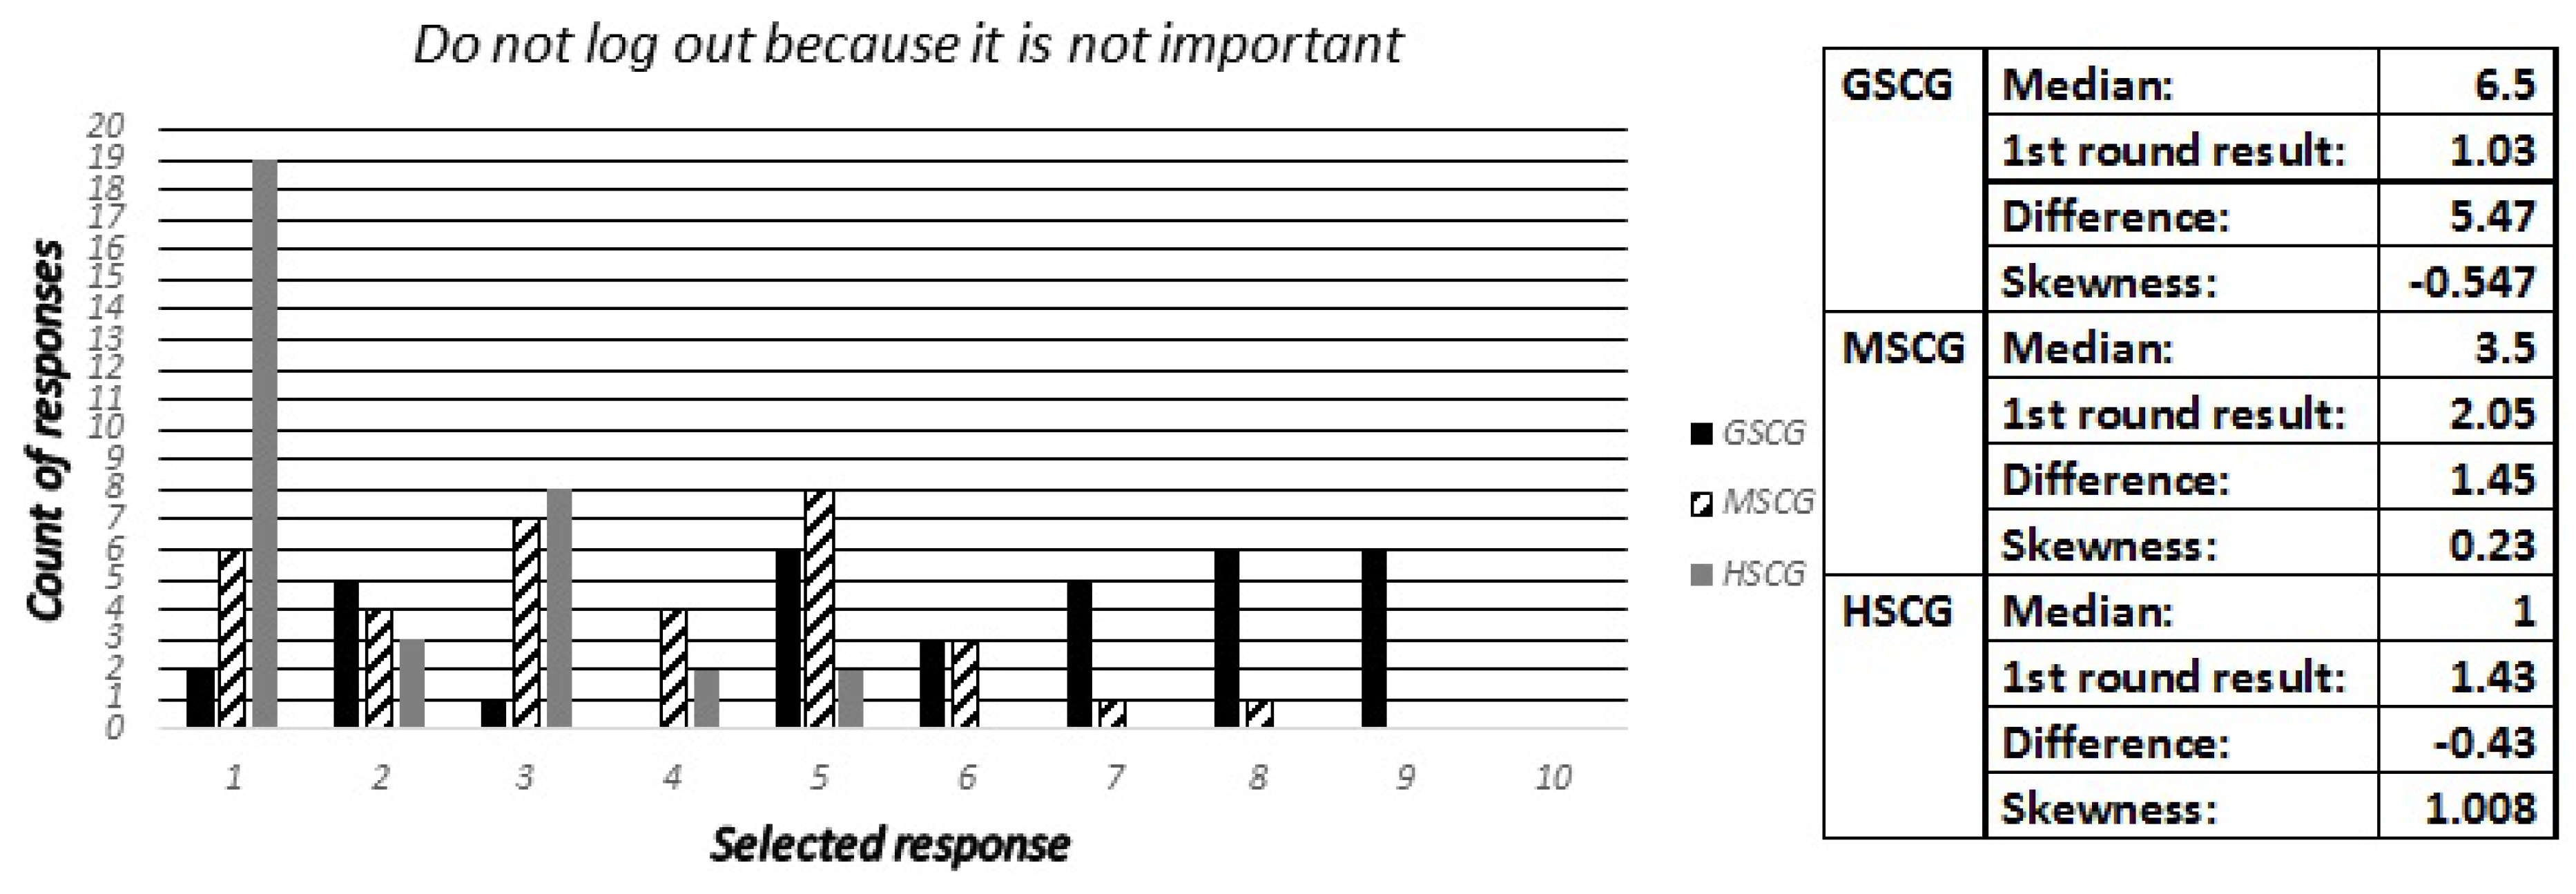
Figure 14.
Expert predictions for question 10.

Figure 15.
Expert predictions for question 11.
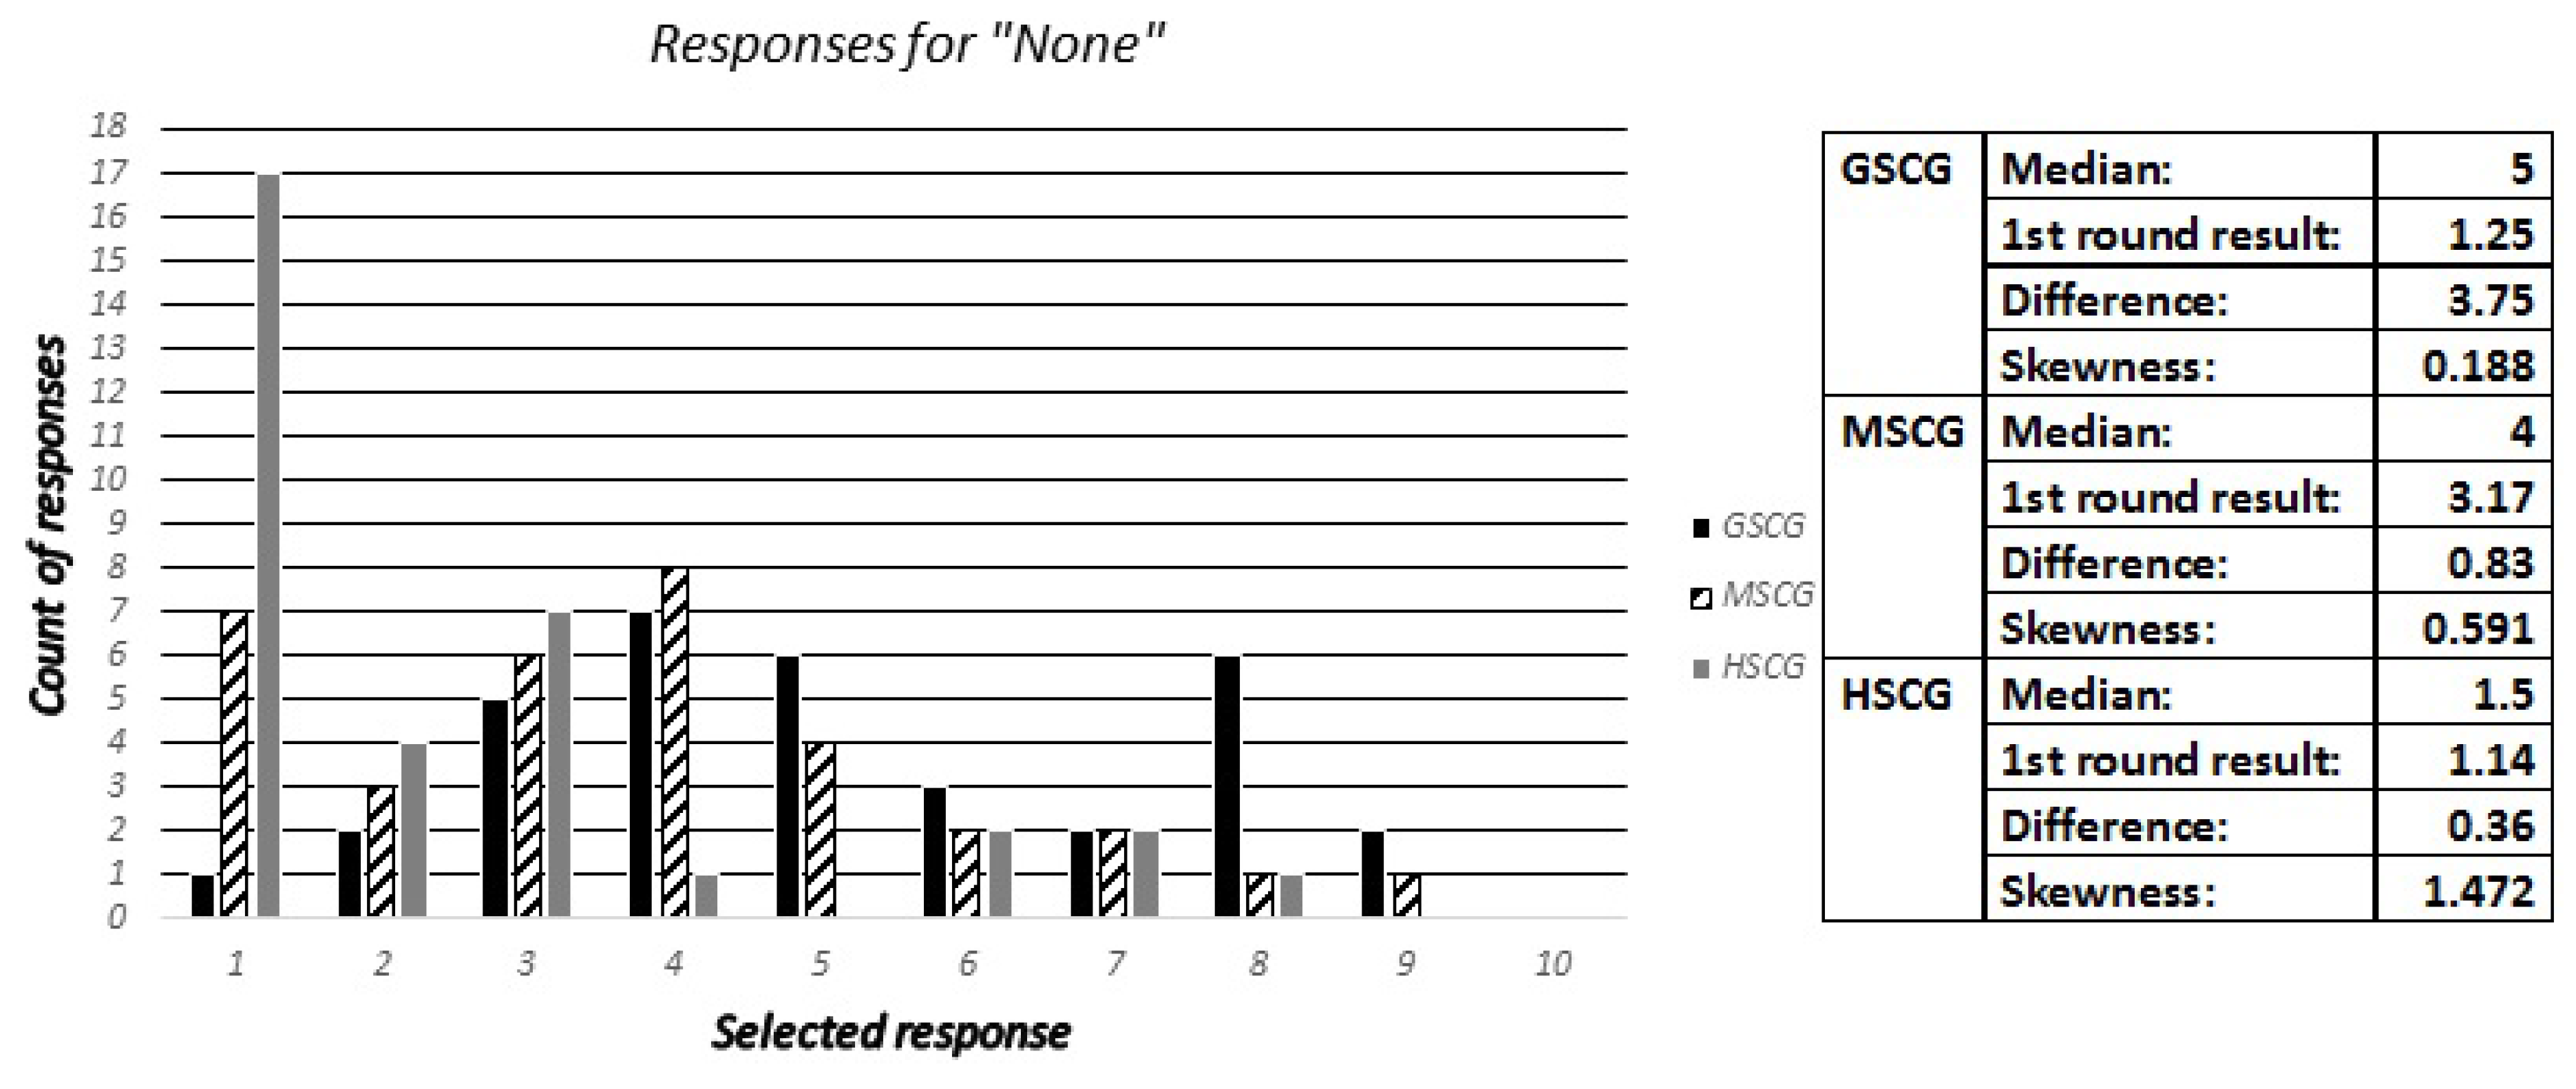
Figure 16.
Expert predictions for question 11, “None”.
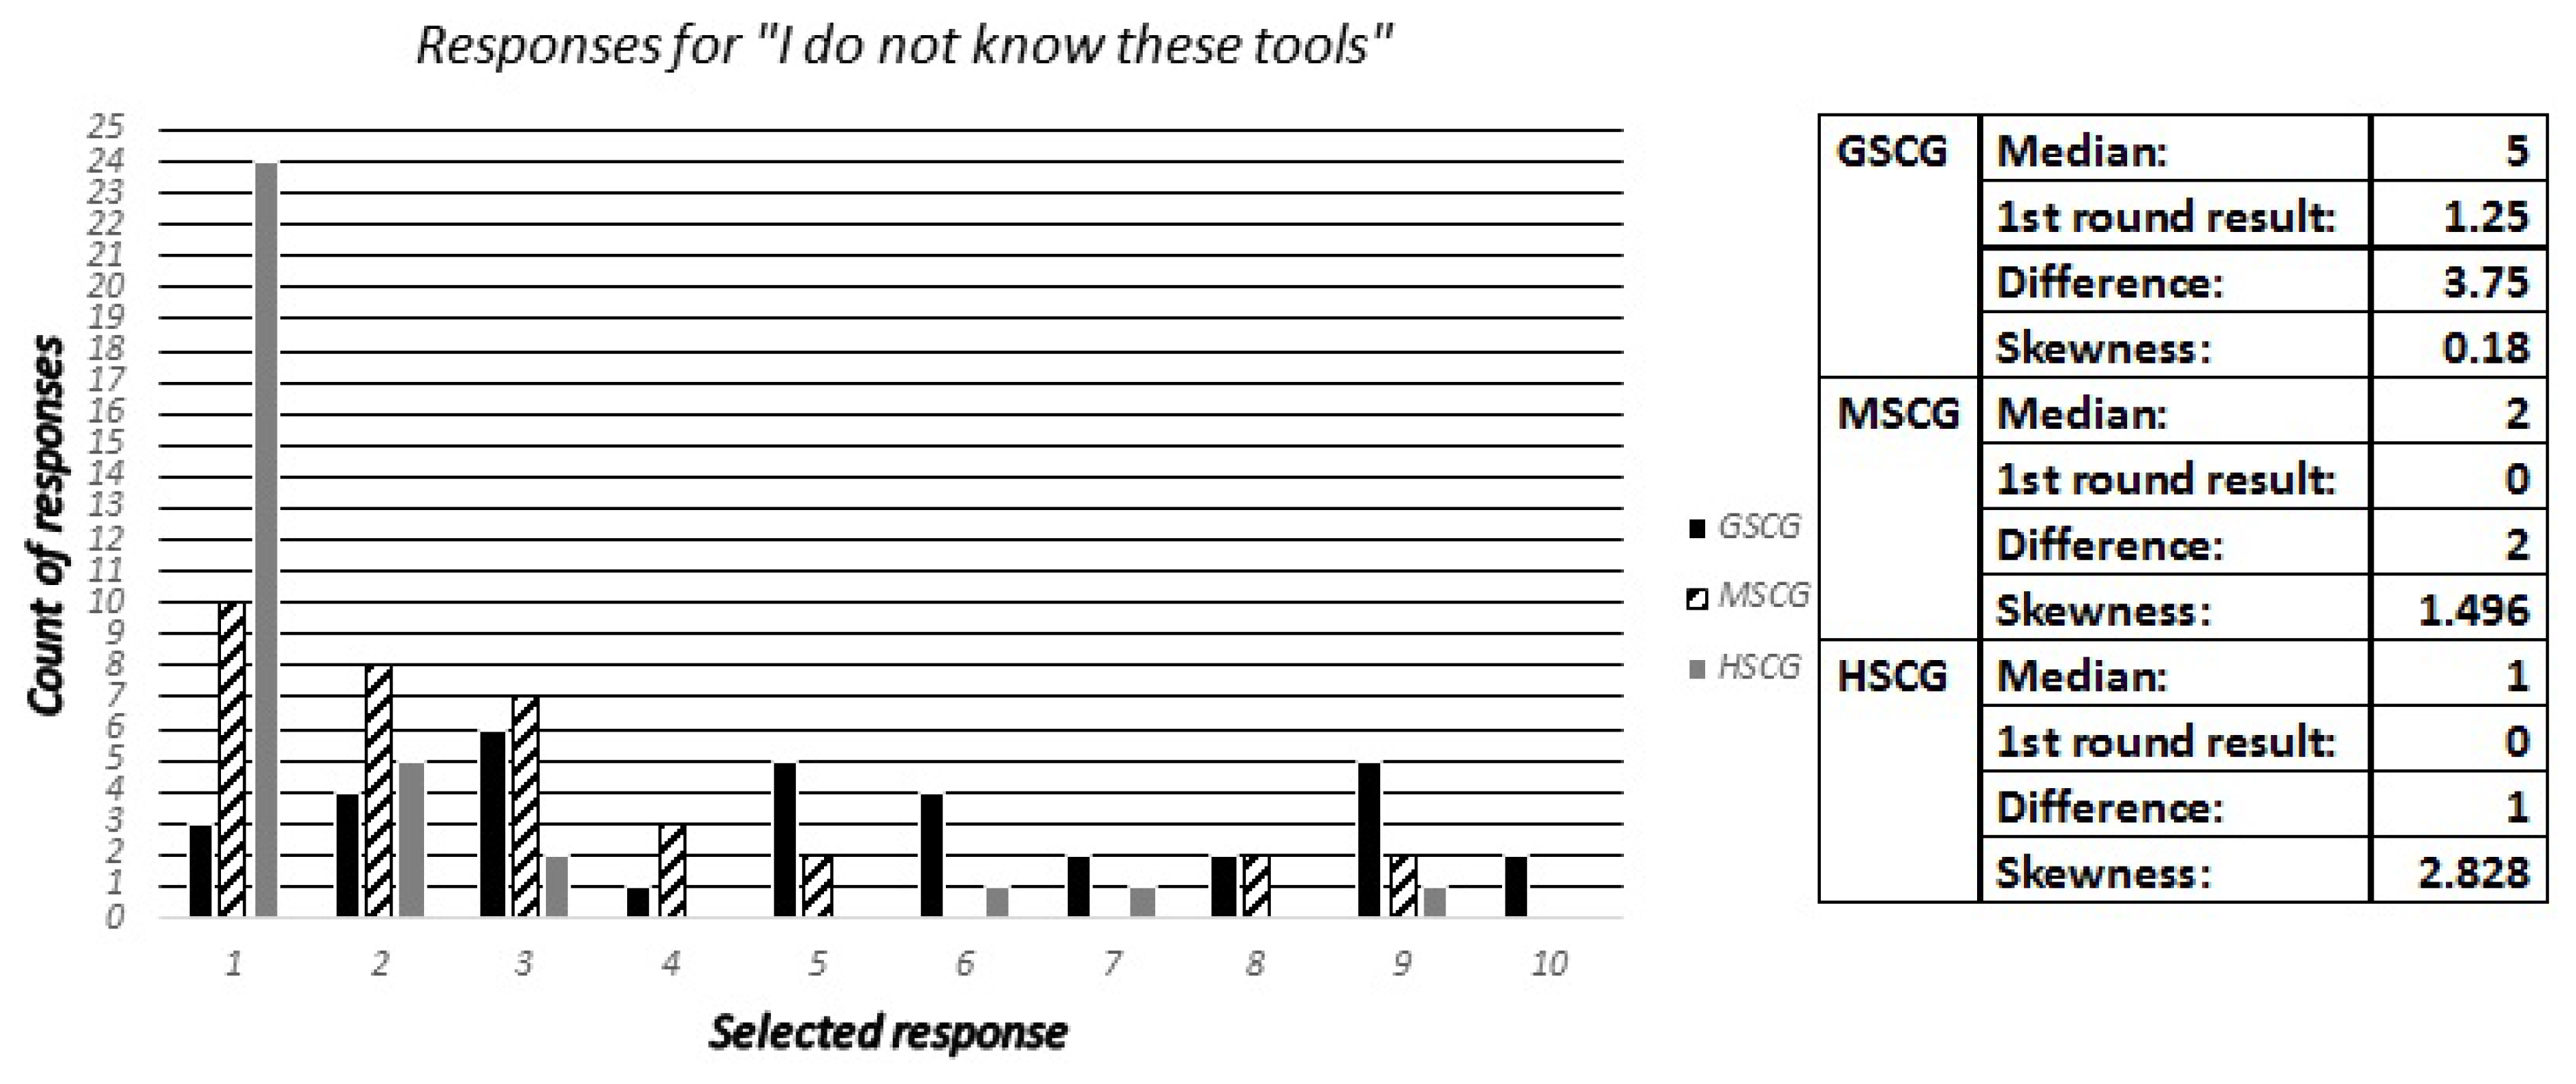
Figure 17.
Expert predictions for question 12.
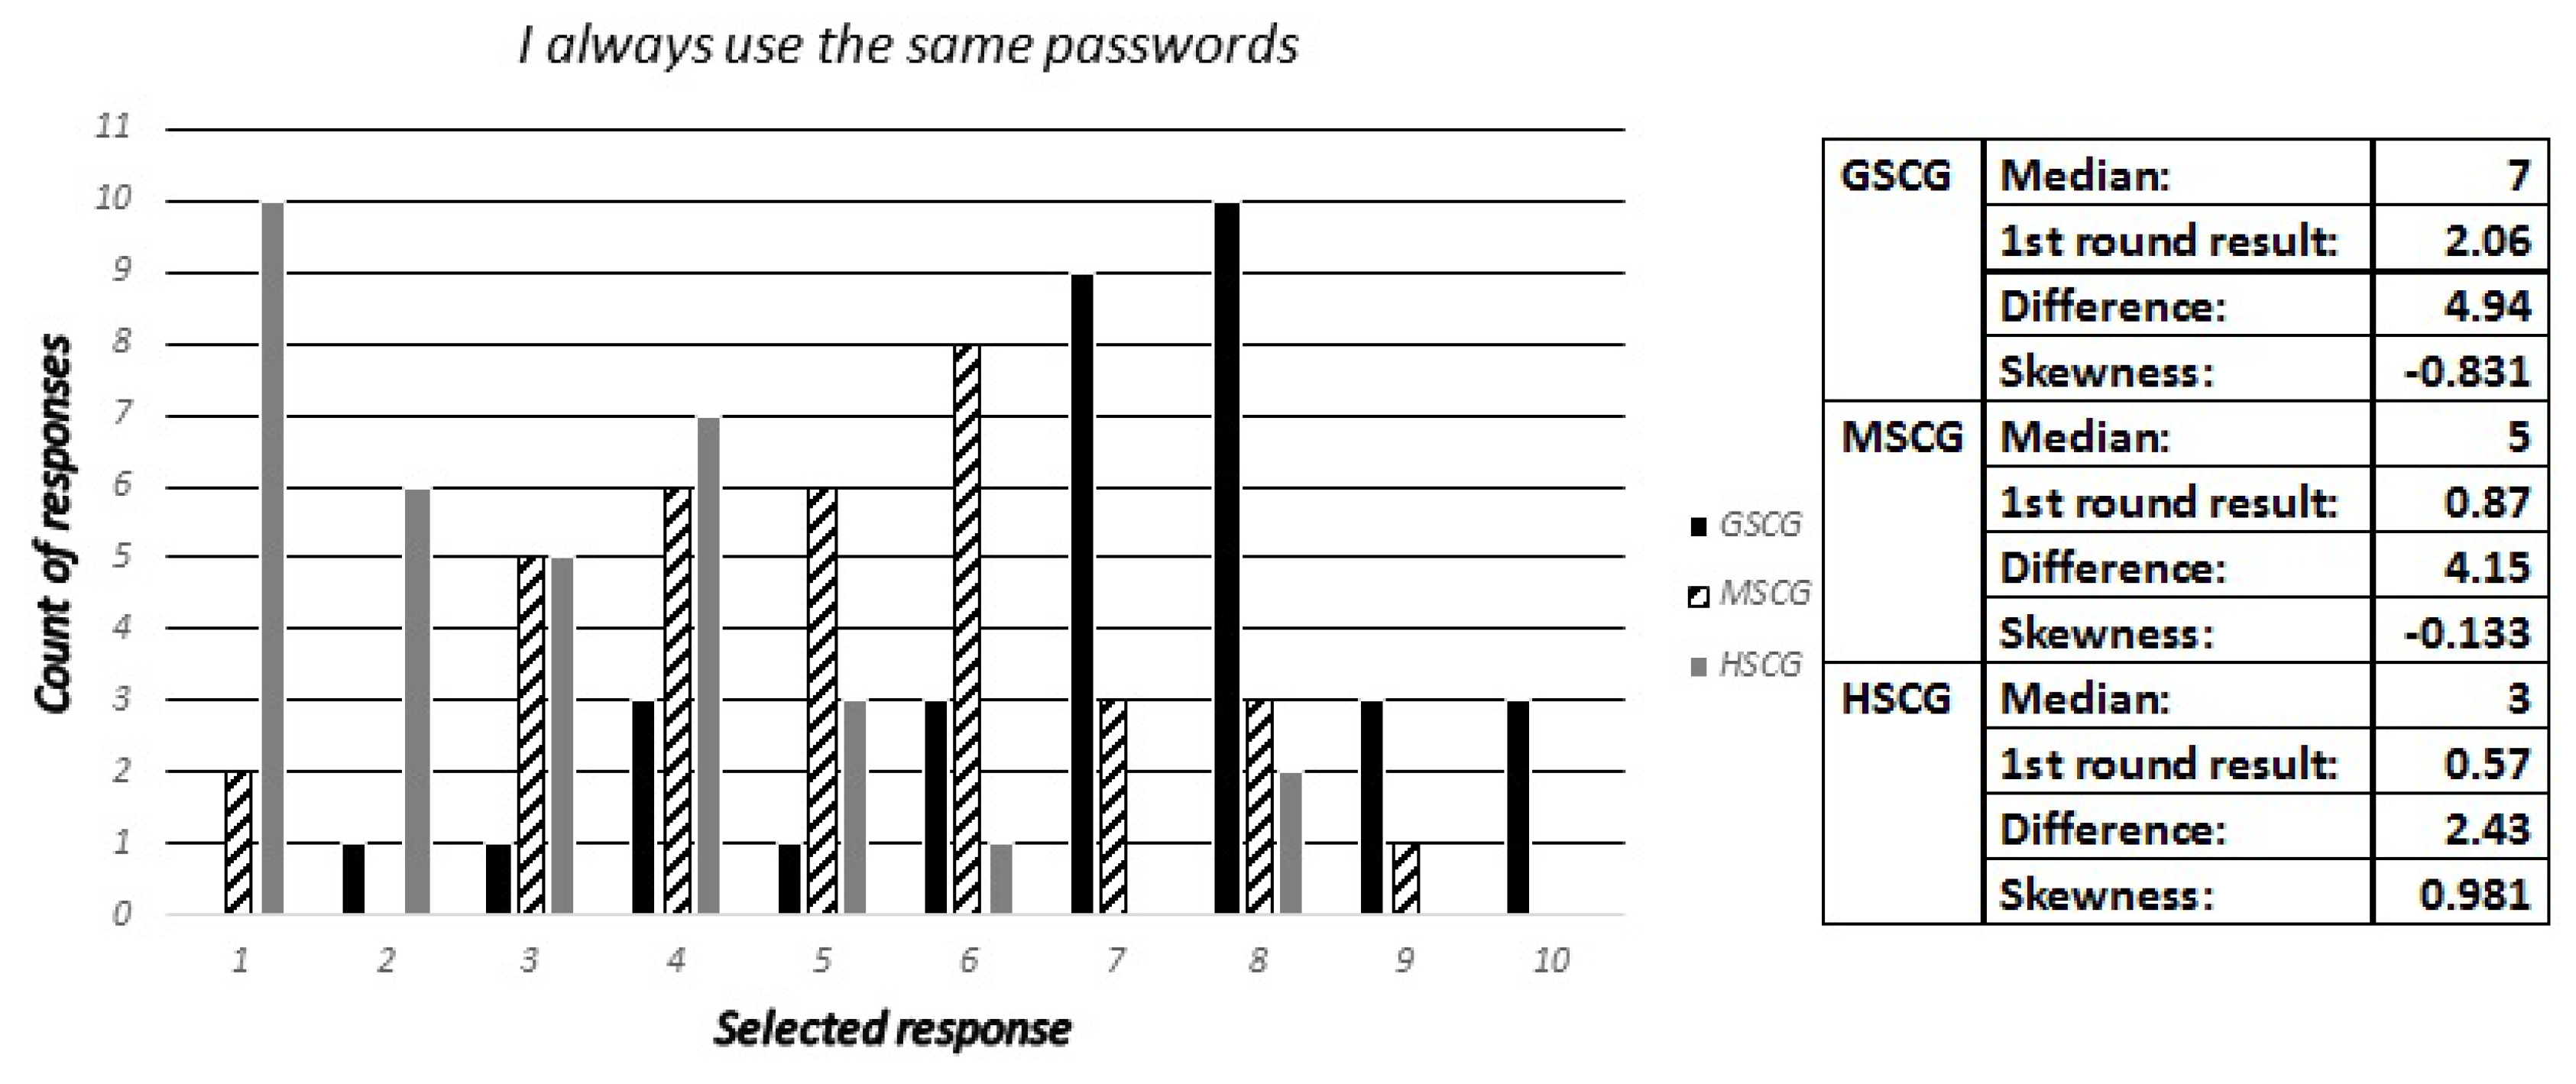
Figure 18.
Expert predictions for question 12.
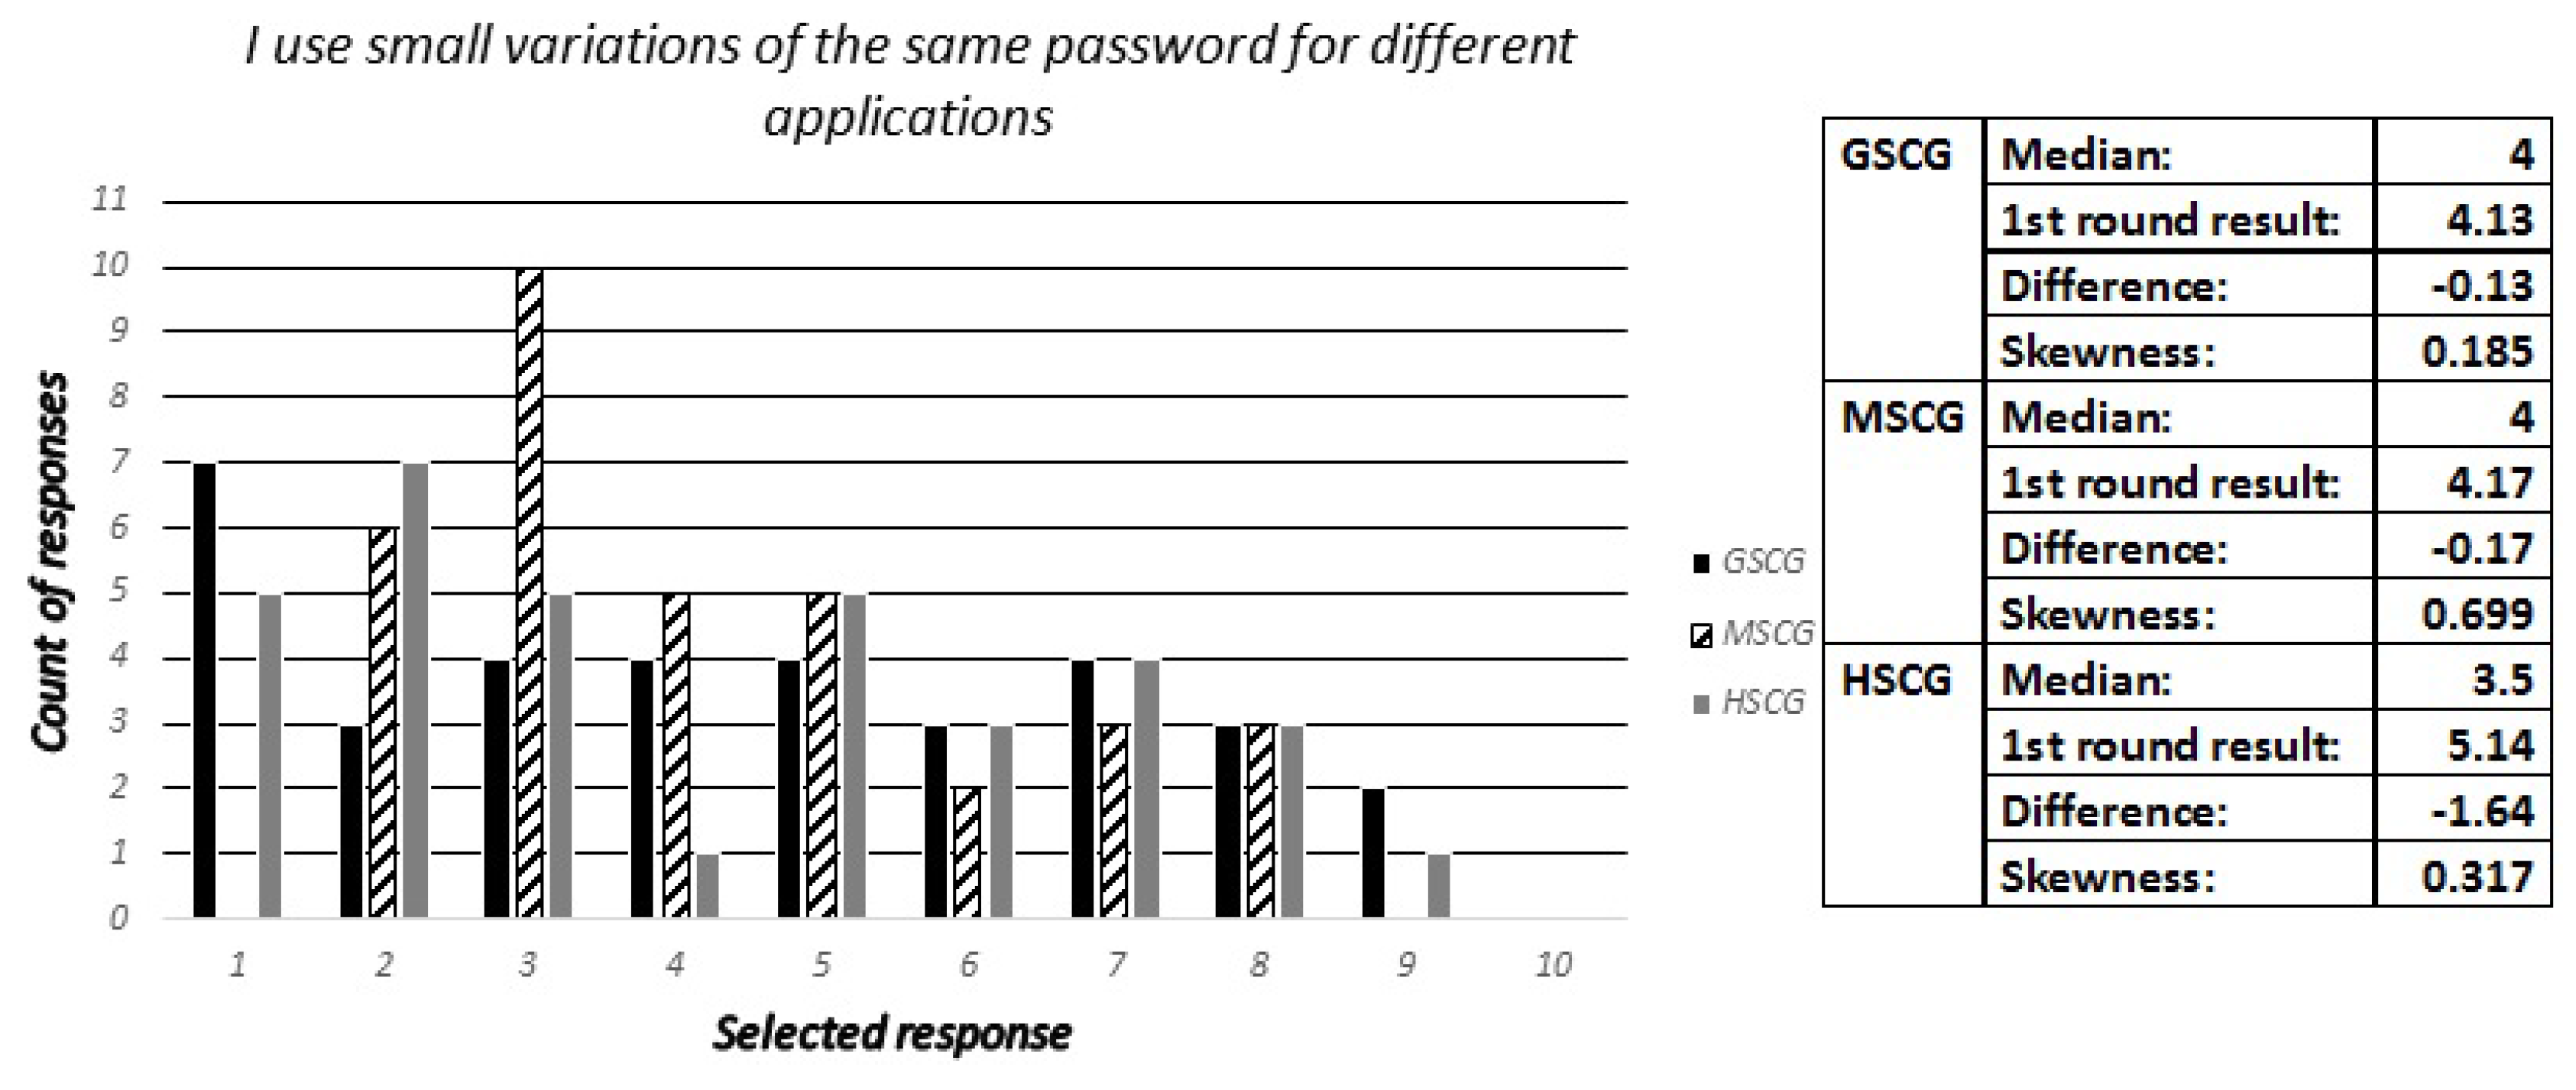
Figure 19.
Expert predictions for question 12.


Table 1.
First round results for questions 2 and 3; GSCG: general security competence group; MSCG: medium security competence group; HSCG: high-security competence group.
Table 1.
First round results for questions 2 and 3; GSCG: general security competence group; MSCG: medium security competence group; HSCG: high-security competence group.
| Software Updates for Cell-Phones/Tablets | ||
| Most Frequently | Second Most Frequently | |
| GSCG | Apps and OS, 81.3% | Apps, 8.8% |
| MSCG | Apps and OS, 79.5% | Apps, 8.3% |
| HSCG | Apps and OS, 88.6% | Apps, 8.6% |
| Software Updates for Laptops | ||
| GSCG | Apps and OS, 75.3% | I do not update, 14.5% |
| MSCG | Apps and OS, 73.1% | I do not update, 8.0% |
| HSCG | Apps and OS, 94.1% | Apps, 5.9% |
Table 2.
Expert predictions for question 10.
| Digital Natives Responses | ||
| Most Frequent | Second Most Frequent | |
| GSCG | None, 40.1% | PIN, 28.8% |
| MSCG | Pattern lock, 34.9% | PIN, 31.4% |
| HSCG | Biometrics, 54.3% | Pass-phrase, 48.6% |
| Security Experts Estimation | ||
| GSCG | Pattern lock, 38.2% | PIN, 32.3% |
| MSCG | Pattern lock, 35.3% | Biometrics/Pass-phrase, 23.5% |
| HSCG | Biometrics, 52.9% | Pass-phrase, 20.5% |
Table 3.
Expert predictions for question 11.
| Digital Natives Responses | ||
| Most Frequent | Second Most Frequent | |
| GSCG | Backup, 27.7% | Find my phone, 20.3% |
| MSCG | None, 31.7% | Backup, 29.5% |
| HSCG | Backup, 57.1% | Find my phone, 57.1% |
| Security Experts Estimation | ||
| GSCG | I do not know these tools, 50.0% | Find my phone, 29.4% |
| MSCG | Backup, 29.4% | Find my phone, 29.4% |
| HSCG | Find my phone, 26.5% | Remote wipe, 23.5% |
Table 4.
Summary of prediction accuracy for the included findings.
| Area | Amount | GSCG Correct | Missed | MSCG Correct | Missed | HSCG Correct | Missed | Total Accuracy |
|---|---|---|---|---|---|---|---|---|
| Use of Mobile Device | 10 (HSCG 12) | 2 | 8 | 5 | 5 | 7 | 5 | 43.75% |
| Connectivity and Network Access | 3 | 0 | 3 | 2 | 1 | 2 | 1 | 44.44% |
| Management of credentials | 4 | 1 | 3 | 0 | 4 | 2 | 2 | 25% |
| Protection Mechanisms | 10 | 4 | 6 | 4 | 6 | 6 | 4 | 46.67% |
| Total for all | 27 (HSC27G 29) | 7 | 20 | 11 | 16 | 17 | 12 | 42.16% |
| Total Accuracy | 25.92% | 40.70% | 58.62% |
© 2017 by the authors. Licensee MDPI, Basel, Switzerland. This article is an open access article distributed under the terms and conditions of the Creative Commons Attribution (CC BY) license (http://creativecommons.org/licenses/by/4.0/).
Share and Cite
MDPI and ACS Style
Gkioulos, V.; Wangen, G.; Katsikas, S.K. User Modelling Validation over the Security Awareness of Digital Natives. Future Internet 2017, 9, 32. https://doi.org/10.3390/fi9030032
AMA Style
Gkioulos V, Wangen G, Katsikas SK. User Modelling Validation over the Security Awareness of Digital Natives. Future Internet. 2017; 9(3):32. https://doi.org/10.3390/fi9030032
Chicago/Turabian StyleGkioulos, Vasileios, Gaute Wangen, and Sokratis K. Katsikas. 2017. "User Modelling Validation over the Security Awareness of Digital Natives" Future Internet 9, no. 3: 32. https://doi.org/10.3390/fi9030032
Note that from the first issue of 2016, this journal uses article numbers instead of page numbers. See further details here.