Azure-Based Smart Monitoring System for Anemia-Like Pallor

Department of Electrical and Computer Engineering,University of Washington, Bothell, WA 98011, USA
*
Author to whom correspondence should be addressed.
Future Internet 2017, 9(3), 39; https://doi.org/10.3390/fi9030039
Submission received: 26 June 2017
/
Revised: 20 July 2017
/
Accepted: 23 July 2017
/
Published: 26 July 2017
Abstract
:Increasing costs of diagnostic healthcare have necessitated the development of hardware independent non-invasive Point of Care (POC) systems. Although anemia prevalence rates in global populations vary between 10% and 60% in various demographic groups, smart monitoring systems have not yet been developed for screening and tracking anemia-like pallor. In this work, we present two cloud platform-hosted POC applications that are directed towards smart monitoring of anemia-like pallor through eye and tongue pallor site images. The applications consist of a front-end graphical user interface (GUI) module and two different back-end image processing and machine learning modules. Both applications are hosted on a browser accessible tomcat server ported to an Azure Virtual Machine (VM). We observe that the first application spatially segments regions of interest from pallor site images with higher pallor classification accuracy and relatively longer processing times when compared to the lesser accurate yet faster second application. Also, both applications achieve 65–98% accuracy in separating normal images from images with pallor or abnormalities. The optimized front-end module is significantly light-weight with a run-through time ratio of with respect to the back-end modules. Thus, the proposed applications are portable and hardware independent, allowing for their use in pallor monitoring and screening tasks.
1. Introduction
Point of Care (POC) testing applications enable medical diagnostic applications to be provided at the patient end for resourceful treatment and follow-up care. Additionally, m-health applications supported by mobile devices have become increasingly popular over the past decade to promote “telemedicine” systems, where the patient and medical care provider are not collocated in the same geographical location [1]. With the 4–6% annually increasing costs of healthcare in USA [2], the need for POC and m-health technologies for faster diagnostic purposes have become necessary. In this work two different approaches towards providing patient-end POC diagnostic screening functionality through cloud-hosted applications are presented. Also, the time complexity analysis and diagnostic accuracy of a MATLAB based back-end versus a Java based back-end are compared, and an optimal approach towards the design of a lightweight front-end is highlighted. The design of POC testing applications is limited by constraints such as: ease of use, speed, data integrity, reliability and repeatability. Here, the reliability and repeatability of the applications are dependent on the back-end processing system specifications that in turn are dictated by user preferences between speed versus accuracy of screening. Thus, Microsoft Azure cloud based services can be used as viable resources to provide device independent web-service calls while maintaining data security and privacy [3]; all the necessary components for successful hosting of a medical based diagnostics system.
In our prior pilot study [4], we analyzed color-planes and gradient-based features for their discriminating capabilities towards facial pallor site images. We had observed that hierarchical classification for pallor severity, using boosted decision trees and decision forest, was the most successful strategy for regional-feature-based automated pallor detection. In this work, we perform additional analysis of pallor specific features in dedicated pallor site images by assessing the activated feature maps (AFMs) from trained convolutional neural network (CNN) models [5,6]. Our analysis of AFMs indicate that pallor specific regions of interest are inline with domain knowledge that blood vessel densities in the conjunctiva region of eyes and inner tongue regions are most indicative of anemia-like pallor. Additionally, in this work, we combine the image-processing/classification modules with front-end image collection and processing modules that are hosted on the Microsoft Azure cloud-based platform for designing complete web-based smart health monitoring applications.
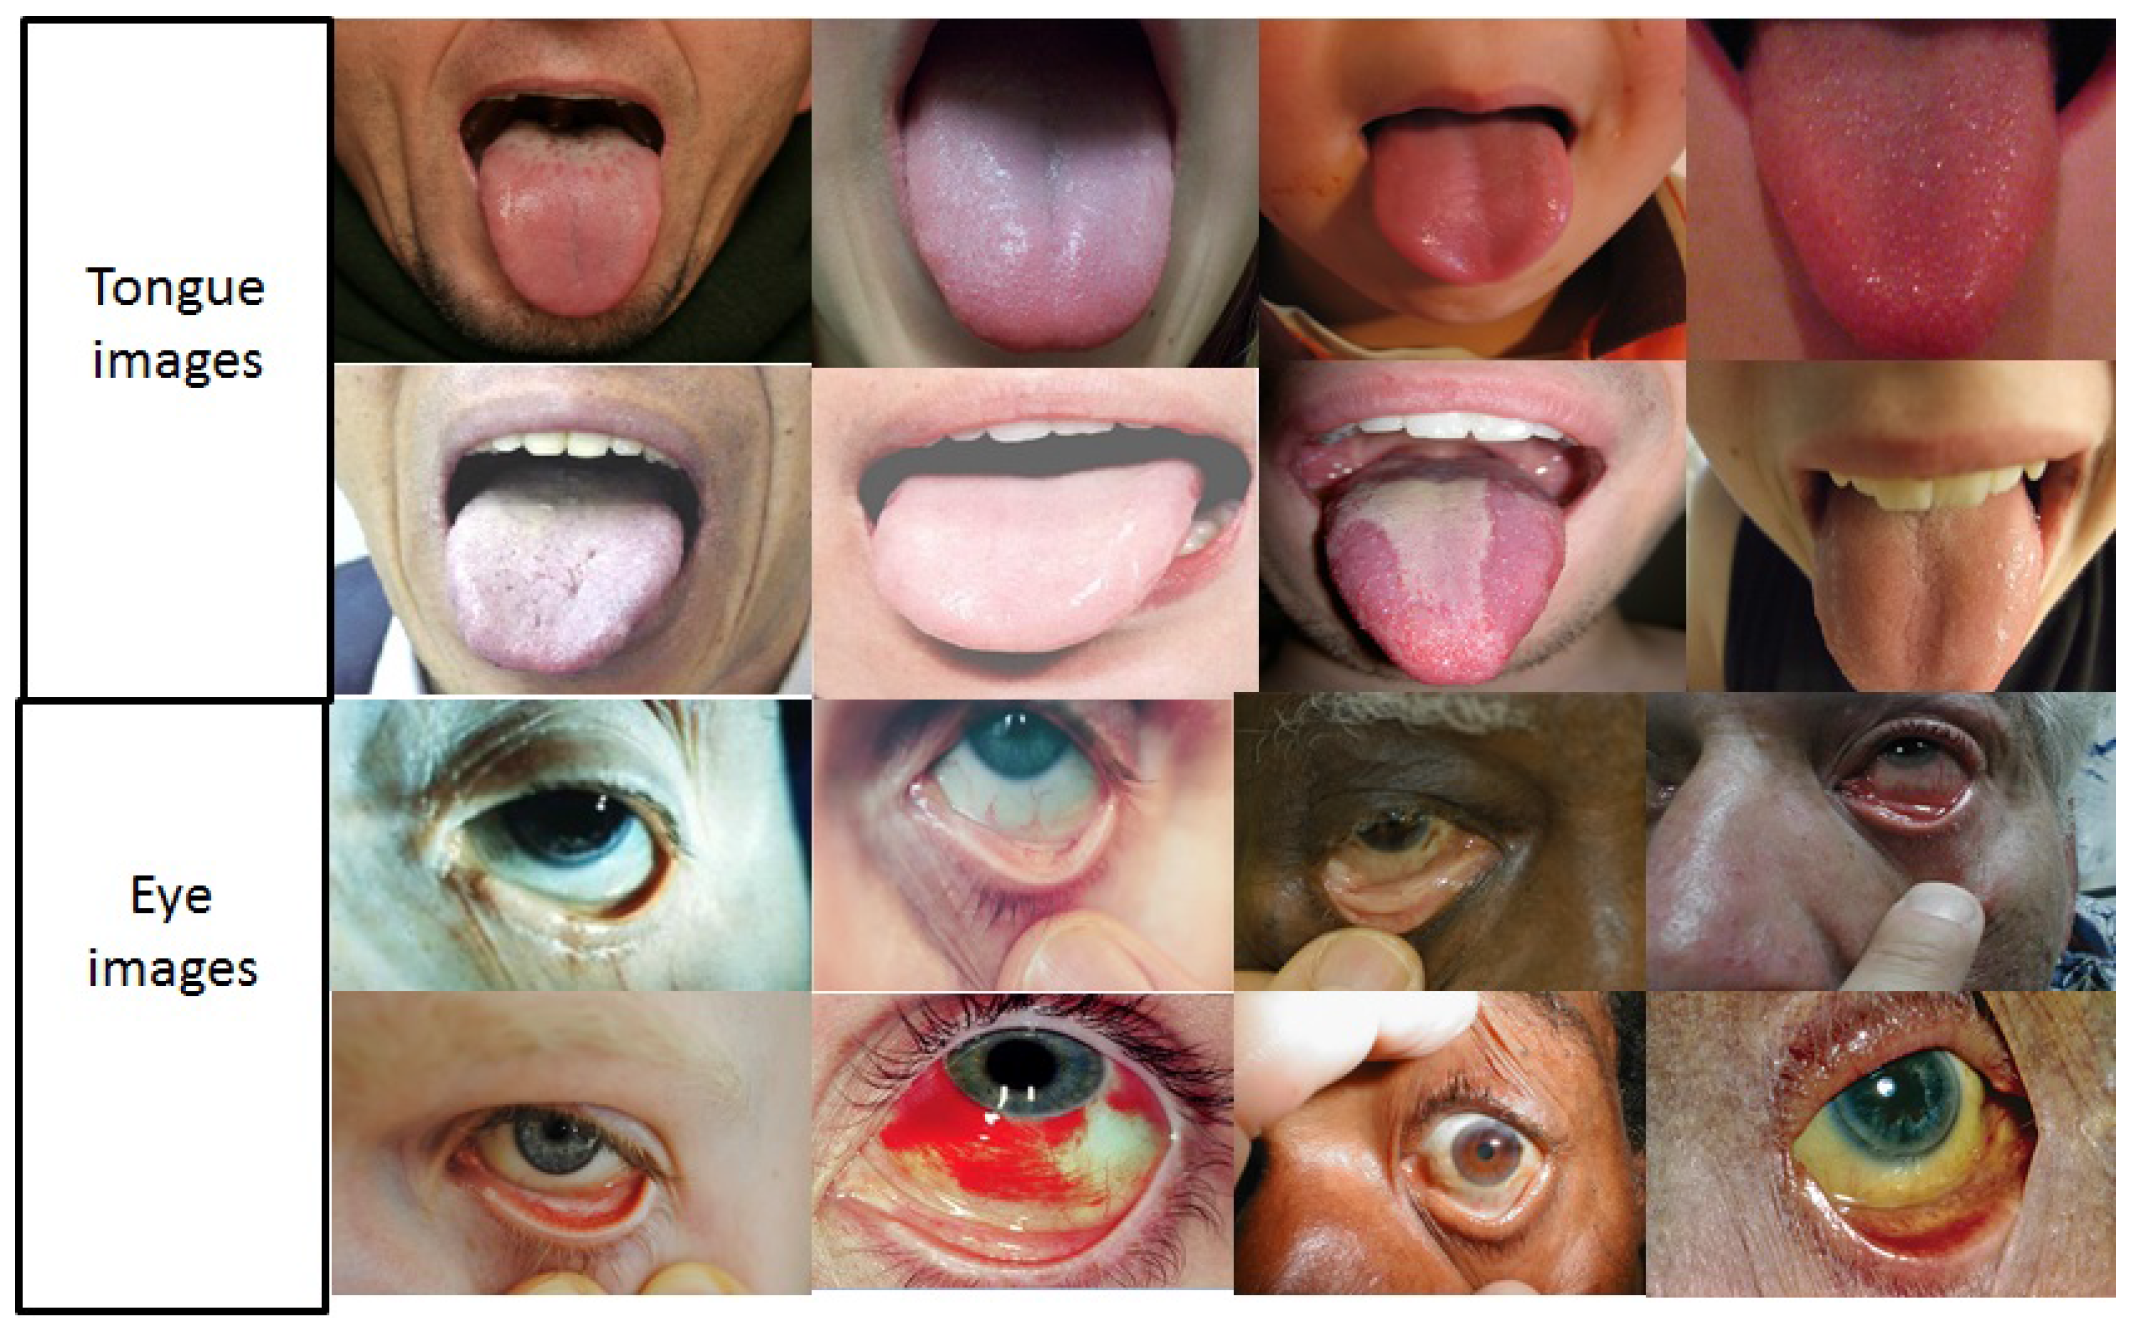
At present, computer aided diagnostics (CAD) and POC applications are aimed at providing quick “expert” diagnostics for screening and resourcefulness of treatment and care-delivery protocols. Some well-known CAD systems include screening systems for diabetic retinopathy [7], hypertensive risk [8] and pathology detected using digital chest radiographs [9]. However, no screening system has been developed for anemia-related risk assessment till date. This work is aimed at utilizing facial pallor site images with varying severities, such as close-up images from eyes and tongue for anemia-like medical screening applications as shown in Figure 1. It is noteworthy that the pallor-specific features under analysis in this work are patient demographics independent, motivated by domain knowledge and focused on regions signifying the flushed appearance of underlying blood vessels as opposed to skin-based pallor detections.
This paper makes three key contributions. First, it presents the flow for front-end and back-end communications towards the design of non-invasive medical POC testing applications. The proposed applications are ideal for uploading patient images, such as facial pallor site images, and storing them in the cloud while invoking a back-end system that processes the uploaded images and detects the presence of anemia-like pallor. The novel front-end design is optimized for developmental environment and deployment capabilities while ensuring fast and back-end independent end-to-end-communication system using hardware-independent resources. Such pallor-screening applications have not yet been designed. Second, region and color-plane specific features that are motivated and evaluated with domain knowledge are analyzed for pallor site images corresponding to the eyes and tongue. We observe that region-specific features to the conjunctiva and inner tongue are crucial for screening normal from abnormal images, irrespective of the variations in imaging conditions and patient demographics as shown in Figure 2. For the images under analysis, as shown in Figure 2, the images are pre-processed for normalization of image lighting conditions using histogram equalization and contrast enhancement modules followed by image padding for normalized eye/tongue region sizes. Additionally, the region-based features identified as most relevant for the pallor detection task are: blood vessel density in gradient images from conjunctiva of the eye, and color/gradient-based texture from inner and outer tongue regions, respectively. Third, two back-end models and hosting architectures have been presented for the processing and classification of medical images for anemia-like pallor directly using user-submitted images. Both models achieve accuracies in the range of 65–98% for separating normal from abnormal pallor site images with high classification recall rates in the range 80–100%. Thus, the proposed cloud-based application has low false negative rates and is favorable for fast automated pallor screening tasks.
The organization of this paper is as follows. In Section 2, existing studies on anemia and related prior works on facial and image segmentation, classification and cloud-based applications are presented. In Section 3, the overall system architectures, front end and back-end methods are presented. In Section 4, the experimental results of the proposed methods are presented. Conclusions and discussions regarding the performances of the proposed image-based pallor classification methods are presented in Section 5.
2. Related Work
Anemia-like pallor is a manifestation of the insufficient capacity of oxygen-carrying red blood cells in the body [10]. Although iron deficiency is the primary cause for anemia, other nutritional deficiencies for folate, vitamin B12 and vitamin A, chronic inflammations, parasitic infections and genetic disorders have been found to impact hemoglobin contents in humans [10]. While the onset of anemia can be sudden or chronic, hemoglobin concentrations in individuals have been found to fall below the 95th percentile of healthy reference populations due to several reasons such as: blood loss, excessive blood cell destruction, or reduced production of hemoglobin [11]. Prolonged and uncontrolled anemia have been observed to lead to manifestations of fatigue, low immunity, insomnia and dementia [12]. Given such situations, the primary objective for diagnosing and monitoring severity of anemia is aimed at preventive treatment and protocol guidance for specialists.
Present-day protocols for diagnosis and treatment of anemia include invasive blood draws at pathology labs followed by a complete blood count (CBC) test. This method of invasive diagnostic testing deteriorates the quality-of-life for patients, especially those who need regular monitoring, such as pregnant women and home-bound patients. Several studies evaluating the accuracy of the diagnosis of anemia in physical examinations performed by physicians, medical students and residents, showed no significant difference among examiners, but also showed that the exam was not accurate when anemia is mild to moderate [13]. At present, several anatomical sites are evaluated and the observations are combined in a physical examination to estimate pallor and to maximize the accuracy of the test [13]. Pallor of the conjunctiva (under eye vessels) has been found to be most accurate in the case of beta thalassemia detection with good sensitivity and specificity, regardless of age and gender [14]. This work is aimed to detecting patient pallor caused by anemia-like pathologies from certain focused facial pallor sites, to identify discriminating features for pallor classification tasks without relying on invasive blood draws altogether.
One of the primary challenges regarding automated assessment of facial pallor site images involves automated segmentation for facial regions of interest (ROIs) and feature learning for classification tasks. Although facial detection and recognition tasks have been well researched since 1960s [15], automated facial recognition tasks continue to face challenges related to the lack of generalizability owing to gender, ethnicity, age and facial occlusions. Among recent noteworthy efforts, the work in [16] demonstrates the usefulness of luminance and hue-based color planes over red-green-blue (RGB) color planes for skin color identification tasks under non-uniform illumination conditions. Another work in [17] uses fuzzy entropy-based approach for representation of skin-tone colors towards facial detection tasks. Although anemia-like pallor may manifest as pallor of skin color, the primary indicator for pallor is pale/less-flushed blood vessel surfaces. In this work, we analyze skin-independent bio-marker regions for anemia-like pallor using gradient and color-plane based features to indicate the density of flushed blood vessel surfaces. Here, the choice of features for pallor classification is motivated by methods with low time-complexity for feature extraction, which are useful for the development of a fast pallor screening applications. Thus, texture-based features for skin-related segmentation tasks with high computational time complexities such as histogram of oriented gradients (HOG), co-occurrence matrix and Gabor wavelet-based features [18] are not analyzed here.
Recent years have witnessed a significant increase in the development of bio-medical image classification algorithms for medical screening applications [7,19,20]. Most existing algorithms are driven by the ease of implementation and end-to-end speed while ensuring low false negative rates for screening applications. The goals of such bio-medical image classification algorithms are: separation of normal patients from abnormal ones [7], and patient prioritization for follow-up treatment. One such method in [7] applies 2-step hierarchical classification to classify images with varying severities of diabetic retinopathy using region-based features extracted from retinal fundus images. Other methods in [19,20] utilize color and region-based features from fundus images to detect retinal blood vessels. Novelty of this work lies in the utilization of directed facial site image containing blood vessel surfaces for medical image classification, and for identification of features that are most relevant towards detection of anemia-like pallor.
Over the past few years, m-health and POC technologies have been the focal point of clinical and medical research technologies. In one of the prominent works [21], the importance and significance of low-time complexity web based application development was analyzed. This survey indicated that high time complexities of web-based applications negatively affected the functionalities of business models, thereby leading to 53–84% reduction in project efficiencies and up to 63% increase in project budgets. Thus, low-complexity and hardware independent web applications were found to be key for sustainable business and research project models. In this work, we implement web-based applications that are hosted using the hardware independent cloud-computing platform of Microsoft Azure that promotes medical content delivery, ease of implementation and low-time complexity for high resourcefulness of the POC testing applications.
The work in [22] highlighted the general benefits of cloud-hosted applications. Users were able to access applications globally with a simple browser and internet connection, reducing costs significantly, as infrastructure was provided by a third party and did need not be physically invoked for occasional intensive computing tasks. Here, benefits were observed in application maintenance, system updation and overall performance speed. Also, since cloud platforms offer performance diagnostics, automated functionality scaling, depending on network traffic, was available [23]. However, the work in [22] failed to provide experimental data collected from performance testing of different application infrastructures using the cloud, as is the case in our work.
Another work in [24] described the scalability of cloud-based applications. This work presented a survey consisting of a front-end load balances to route and balance user requests to web applications deployed on web servers in virtual machine instances in the cloud. Our work furthers the cloud-based application hosting state-of-the-art described in [24] by utilizing the cloud-based Microsoft Azure resources. Thus, with growing volumes of could-based service calls, more resources can be allocated by the Microsoft Azure platforms, thereby reducing costs of resource allocation to match the necessity.
3. System Architecture Overview
The overall system architecture and the design of the front-end and back-end models () are described as follows.
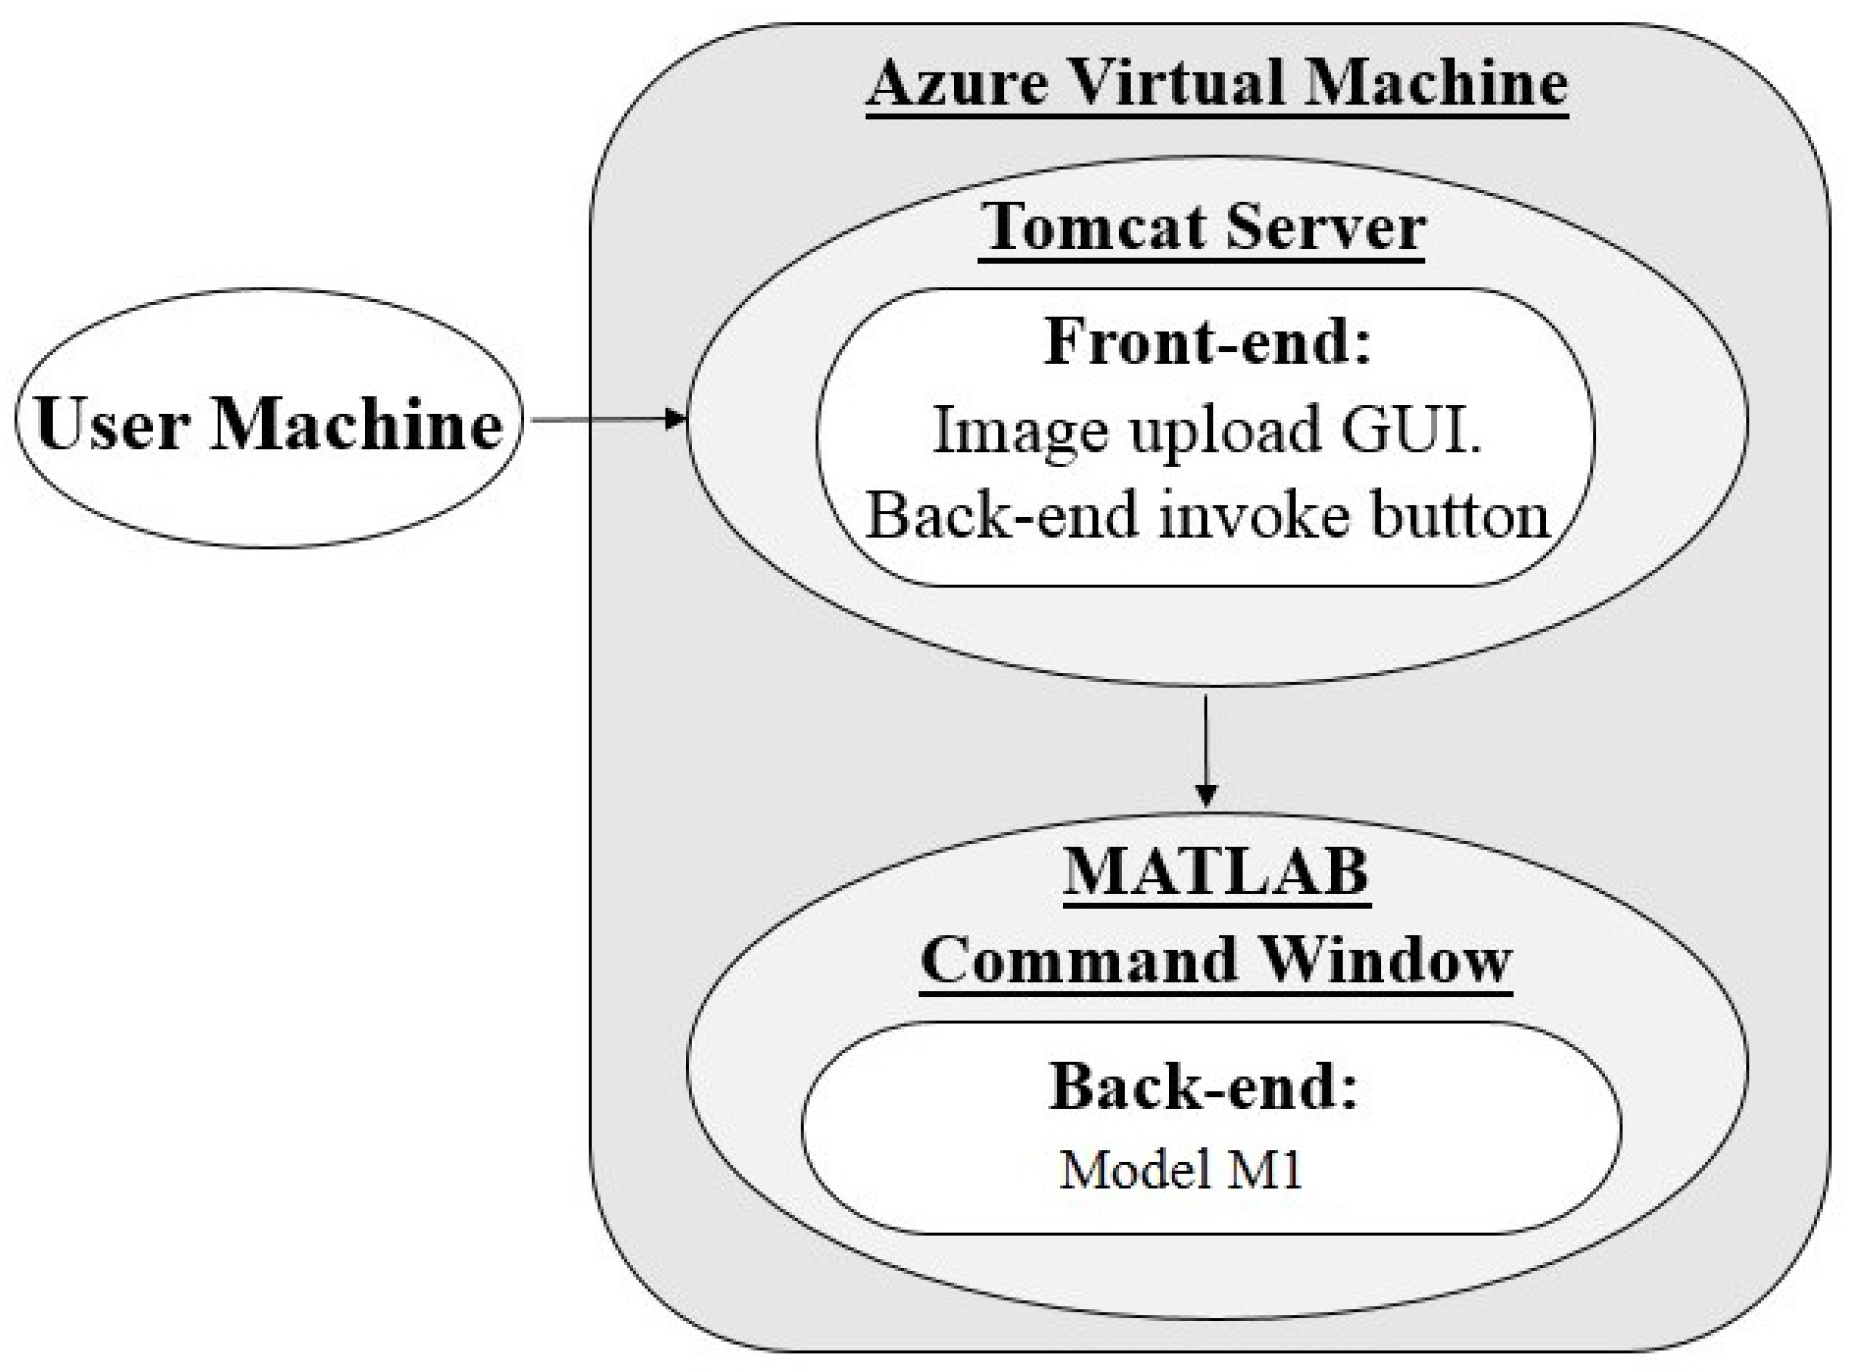
3.1. Architecture 1: Virtual Machine (VM) Hosting With MATLAB Back-End
The POC application hosted using architecture 1 consists of a Java front-end and a MATLAB back-end (model ). Its use relies on user access to an instance of MATLAB to run the application back-end for pallor screening results. When the application URL is accessed from a browser, as seen in Figure 3, the front-end is launched on a tomcat server which is ported to the Azure VM being accessed and includes an existing installation of MATLAB and all back-end algorithm components pre-loaded to the workspace. This allows for user-hardware independent processing since local user machines do not need a MATLAB installation. Users are able to use the front-end interface to upload their images to the VM and begin image processing by running MATLAB scripts with PowerShell. Upon completion, results are collected by the front-end to be displayed on the graphical user interface (GUI).All materials related to the uploading, processing, and results produced are saved on the VM disk, providing us with a temporary location in the cloud for data handling.
3.2. Architecture 2: Virtual Machine (VM) Hosting with Java Back-end
The POC application hosted using architecture 2 consists of a Java front and back-end (model ) located within one package, and requires no external processing environment outside of the tomcat server and Java runtime environment. The application is hosted in an Azure VM, as described in Section 3.1. When the URL is accessed from a browser, as seen in Figure 4, the web application is launched and run using a tomcat server framework. From here, users can use the front-end GUI to upload their images and then run a Java servlet to begin processing.
3.3. Application Front-End Design
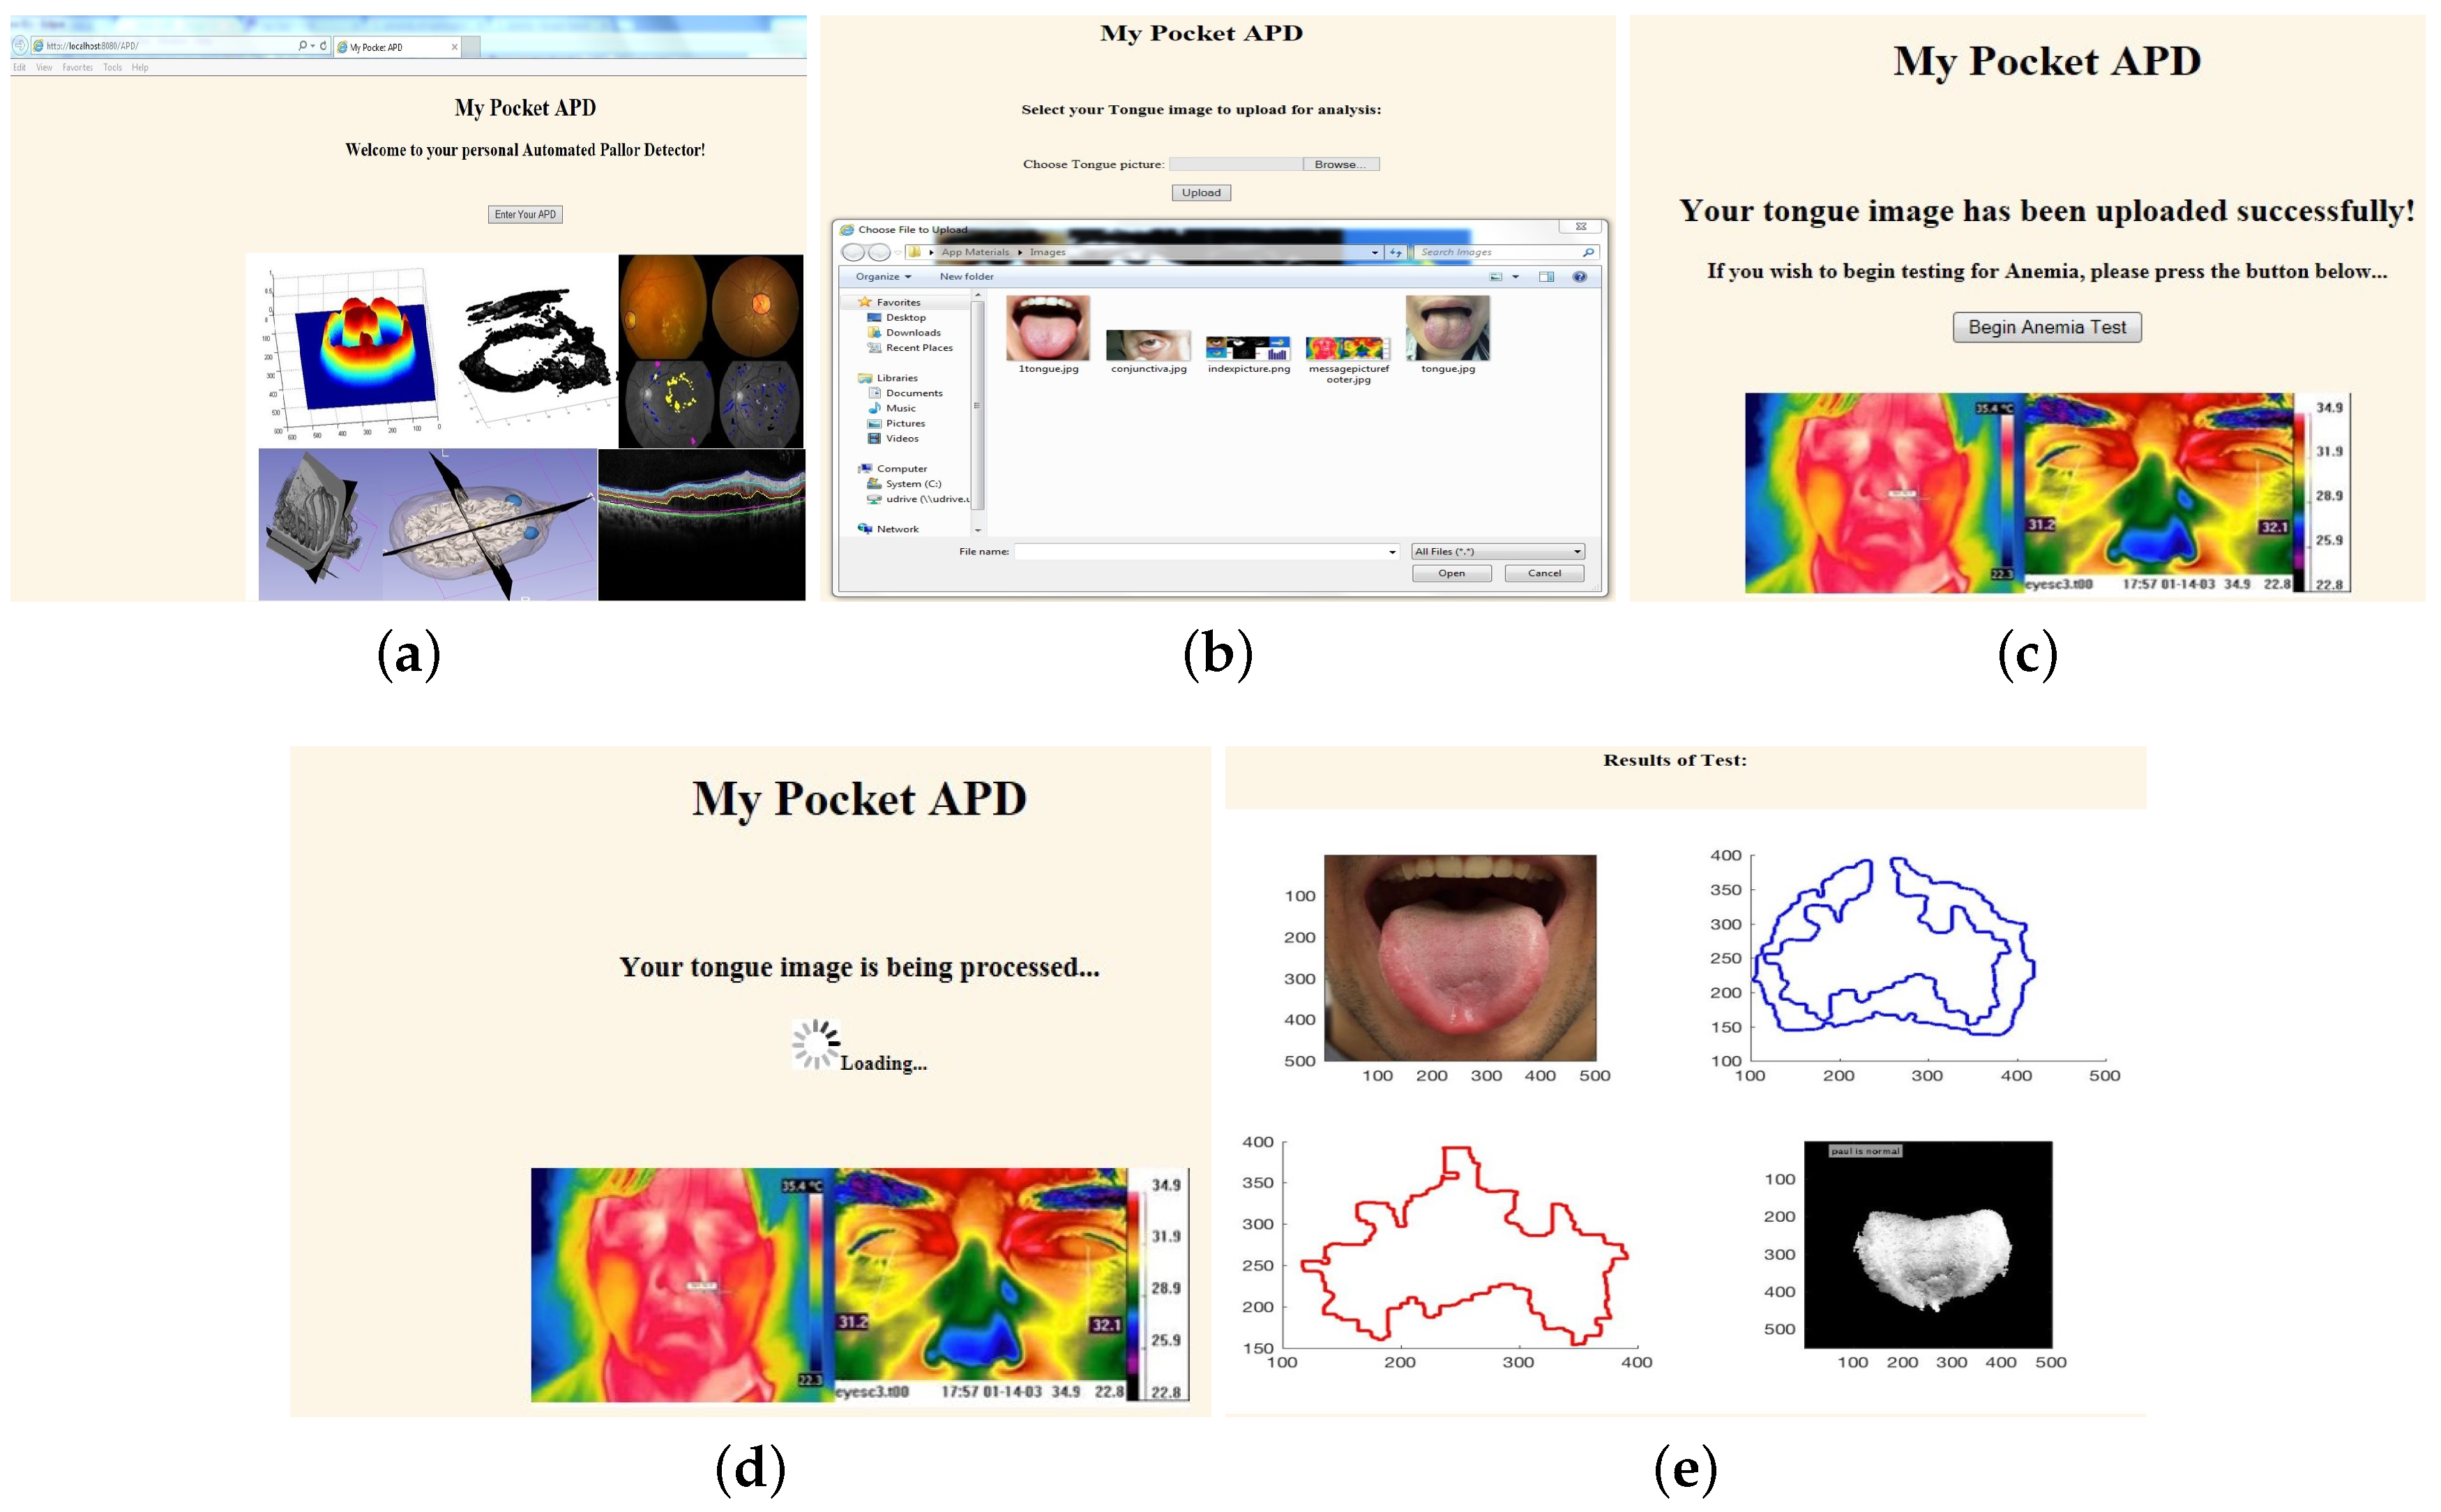
The two platforms presented in this work use the same front-end system. When the application URL is accessed, as shown in Figure 5, the front-end is launched and a GUI appears, shown in Figure 6a. It offers users the ability to navigate through the application in selecting the pallor site they wish to screen, as well as uploading an image to be stored in a back-end directory to then be processed for pallor classification.
The image upload is executed through the front-end’s processor, a Java servlet, which is invoked through a series of HTML style buttons located on the GUI. The GUI itself is made up of Java servlet pages (JSP), which allow users to control the servlet and execute all front-end commands. Once an image is selected and uploaded, users are notified and a JSP page requesting action to launch the back-end appears, as seen in Figure 6c. When the “begin anemia test” button is selected, it runs the back-end specific to the POC application on the user-uploaded image/images while a loading spinner appears, as seen in Figure 6d. The back-end prepares the processing and classification results as a text embedded filtered image, as seen in Figure 6e, which is then pulled onto a final results JSP page displayed back to GUI.
3.3.1. Integrated Development Environment (IDE): Eclipse
The front-end is developed within the Eclipse IDE’s Mars edition as a dynamic web project (DWP). Additionally, the Java enterprise edition (JEE) extension, a web development based plug-in, is integrated into Eclipse as it offers the tools and framework needed to support and supplement the design of this front-end project. JEE allows for the use of HTML, JavaScript, and CSS programing languages which went into the construction of the GUI, as well as the use of servlets for processing requests and responses.
3.3.2. Java Libraries
A major component of the front-end’s Java servlet, is the set of APIs offered by the Apache Commons File Upload Java library. The file upload import allows for the parsing of web form HTTP requests through form-based file uploading in HTML, the primary language of the GUI’s Java server pages (JSPs). When an HTTP request is submitted using a POST method with a content type of “multipart/form-data”, the servlet is called and begins parsing the request. It locates the image selected by the user and creates an arbitrary storing directory relative to the back-ends location. This process is invoked by the user. Finally, the use of jPowerShell, a simple Java application interface (API) to interact with the PowerShell console on the VM, allows for one-click remote processing with the application back-end.
3.3.3. Web Application Archive (WAR) Deployment
A web application archive file, or WAR file, is a type of JAR file used to distribute a collection of JavaServer Pages, Java servlets, Java classes, XML files, tag libraries, static web pages (HTML and related files) and other resources that together constitute a web application. In architecture 1, the front-end is exported as an Eclipse Java DWP to a WAR file, which is then deployed to the tomcat server that is configured and ported to the same VM that hosts an installation of MATLAB. In architecture 2, however, since both front and back-end components exist within the same Java package, the entire project is deployed within a single WAR file to the tomcat server located on the Azure VM.
3.3.4. End-to-End Communication
In architecture 1, communication between the front-end and back-end components occurs through the use of PowerShell on the VM. A command is run, executing a batch file that opens an instance of MATLAB and runs a script containing the appropriate back-end algorithm. In architecture 2, communicating the front and back-end components is more direct. An HTML button located on the GUI calls the appropriate tongue or eye class in Java, through the use of a servlet, and immediately begins processing the uploaded image.
3.4. Back-End Methodology
Studies till date with patients having iron-deficiency anemia have demonstrated that anemia-like pallor requires manual assessment of the following pallor-sites [25]: the conjunctiva, tongue, nail-bed, palm and skin-color. In our prior work [4], a preliminary assessment of pallor site images for automated severity classification was presented. Each input pallor site image (I) is in ‘jpg’ format, with the three color planes, red, green and blue , respectively. For evaluation purposes, a set of 27 eye images and 56 tongue images are collected from public domain sources and manually annotated for subjective pallor indices. These images are representative of variable patient demographics and variable imaging conditions, fields of view. Each pallor site image has dimensions ranging from [155 × 240] to [960 × 1280] pixels per color plane, and the subjective severity grades are as follows: grade 0: normal patients, grade 1: patients with anemia-like pathologies, grade 2: patients with pathologies/abnormalities that are not manifestations of anemia. The eye and tongue data sets are analyzed separately using 5-fold and 3-fold cross-validation [26], respectively.
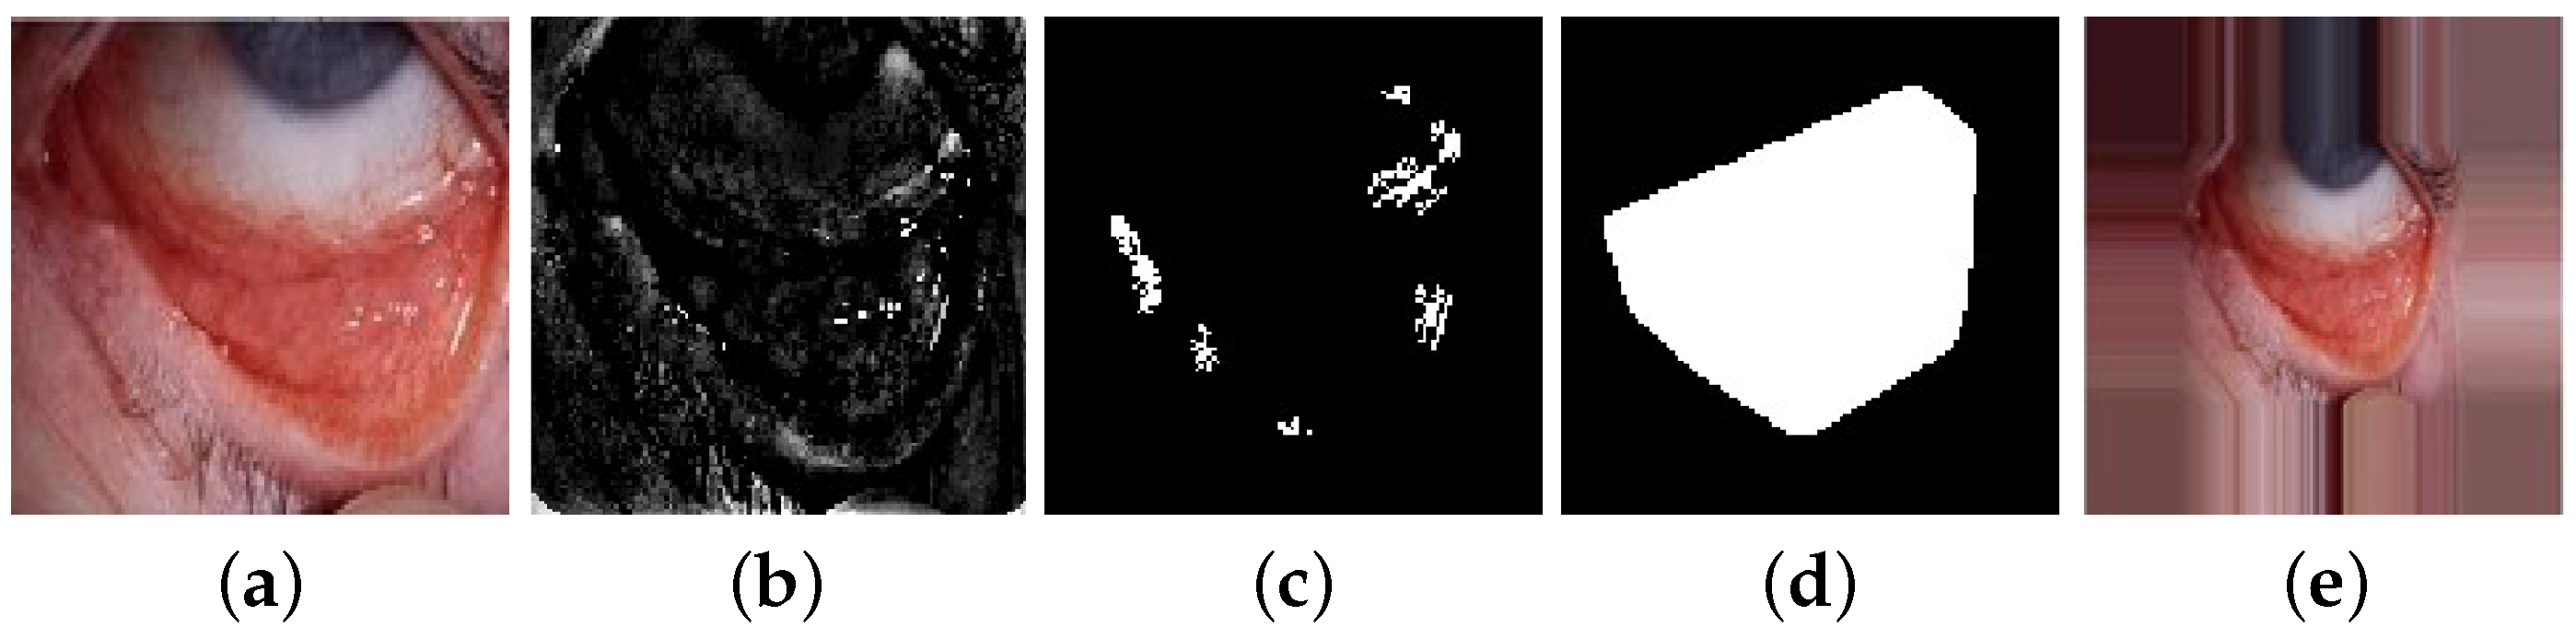
Since the pallor site images are obtained from uncontrolled imaging conditions, it is imperative to ensure intensity equalization and similar sizes of the ROIs. Each image is resized to [250 × 250 × 3] RGB color planes followed by histogram equalization of each color plane in range (0, 255), pixel normalization in range [0, 1] and color plane contrast normalization [27]. Next, for model , the green plane image is low-pass filtered using an averaging filter, thereby resulting in image , in Equation (1). The size of 2-D averaging filter is empirically determined from training data sets as [3 × 3] for eye images and [5 × 5] for tongue images, respectively. Then, the high-pass filtered image () is thresholded to detect a binary image () containing significant edge regions with area greater than 20 pixels. A convex hull can then be fitted around the regions in , resulting in a mask (g) for the pallor sites. To ensure similarly sized pallor masks, the fraction of the total number of pixels in the mask ‘g’ are utilized. If this fraction exceeds a certain threshold, as in Equation (2), it would imply that the pallor region of interest is not well centered, thereby the image would need to be padded around the edges, as in Equation (3). The thresholds are empirically determined as [0.2, 0.3], respectively, from the training data sets. An example of eye pallor site image that is padded for pre-processing is shown in Figure 7.
Based on the variabilities introduced by the data sets, two data models (, ) are analyzed for pallor severity index classification tasks. These 3-step data models are shown in Figure 8 and described as follows. The first model () detects specific spatial ROIs, indicative of patient pallor, followed by extraction of pixel intensity features corresponding to color plane and gradient images within the ROIs. Next, the features extracted from test images are utilized for pallor grade classification.
The second model () is designed to detect the most significant color plane and gradient image for pallor classification purposes. Color plane transformations are applied to each pallor-site image, generating 12 image color planes: red, green, blue, hue, saturation, intensity (from RGB to HSV transformation), lightness, a-plane, b-plane (from RGB to Lab transformation), luminance, 2 chrominance planes (from RGB to Ycbcr transformation). Next, the first order gradient filtered image in horizontal and vertical directions extracted from each color image plane () is superimposed on the color image plane itself, thereby resulting in 12 additional images. Finally, each color image plane is Frangi-filtered [20] to extract the second order edges () and superimposed on the image itself, generating 12 additional images per pallor site image. Using this process, 36 color and edge enhanced images are extrapolated per pallor site image. Further explanation for the back-end model steps are as follows.
3.4.1. Image Segmentation
The first step for model involves spatial segmentation of the pallor site image into various ROIs that demonstrate the skin-independent flushed appearance of blood vessel surfaces. For the tongue images, the inner and outer tongue ROIs are separated first using the pre-processed green plane image with mask ‘g’ [4] followed by watershed transformation, resulting in image W with sub-regions R. Next, the outer edge of the tongue is detected in image E using ‘Sobel’ filter in Equation (4). Here, the ‘∘’ operation denotes pixel-level multiplication for masking purposes. The sub-regions in R that intersect with the outer tongue edge regions represent the outer regions in the tongue ( in Equation (5)). The remaining regions in R, after removing the regions, represent the inner tongue regions () in Equation (6). The masked images corresponding to the segmented inner and outer tongue regions are , respectively. Similarly, the sclera and conjunctiva regions are segmented into masks , respectively, for the eye pallor site images.
3.4.2. Color Planes and Gradient Feature Extraction
For model , 54 features are extracted per image using pixel intensity-features from color and gradient transformed images from the various segmented sub-regions in each image. These features are defined in Table 1. For model , all pixels in each of the 36 color and edge-enhanced image planes are used for classification. Thus, in , each image sample plane is represented by [250 × 250 = 62,500] pixels.The 54 region-based features in Table 1 are motivated by bio-medical screening applications [7,19,20] with the following properties: low time-complexity using region-based features, and the capability of first and second order gradient filters for detecting underlying blood vessel densities [20] required for pallor classification.
3.4.3. Classification
The final step in data the models and is classification. For analytical purposes two categories of classifiers are analyzed that vary in their computational and parametrization complexities. The first category represents non-linear multi-class classifiers with low computational complexity, such as, k-nearest neighbors (kNN) [26]. Compared to our prior work in [4], the kNN classifiers are preferred due to their ease in implementation and generalizability across pallor site images when compared to decision trees data models [26]. The second classifier category involves involves parametrization of several hidden layers in a CNN model using the training data set. These classification data models are described below.
- kNN : The training data set is used to populate the feature space, followed by identification of ‘k’ nearest neighbors to each test sample, and identification of the majority class label [26]. In the training phase, the optimal value of ‘k’ that minimizes validation error is searched in the range [3:25], in steps of 2. For model , corresponding to each image I, 54 region-based features are extracted, which represent the feature space, followed by determination of pallor class label for each test image. Due to low computational complexity of this classifier, the final models are deployed for pallor classification using the kNN classifier.
- CNN: This category of classifiers, with high computational complexity, is motivated by the prior works in [5,6]. Here, each input image is subjected to several hidden layers of feature learning to generate an output vector of probability scores, for each image to belong to an output class label. For this analysis, we implement CNN architecture with the following 7 hidden layers: convolutional (C)-subsampling (S)-activation (A)-convolutional (C)-subsampling (S)-activation (A)-neural network (NN). Each C-layer convolves the input image with a set of kernels/filters, the S-layer performs pixel pooling, A-layer performs pixel scaling in the range [−1, 1] and the final NN-layer implements classification using 200 hidden neurons. Dropout was performed with probability of 0.5. Kernels for the low-dimensional model were selected as [3 × 3 × 3], while for the model they were [7 × 7 × 10], per convolutional layer. Pooling was performed with [2 × 2] and stride 2. The kernels/filters per hidden layer were randomly initialized, followed by error back-propagation from the training samples, finally resulting in trained activated feature maps (AFMs). For each test image, the CNN output corresponds to the output class with maximum probability score assigned by the NN-layer. Due to lack of data samples for CNN parameter tuning, the trained AFMs from the hidden layers are analyzed for qualitative feature learning, and to assess the significance of color planes and ROIs towards pallor classification.
4. Experiments and Results
4.1. Processing Speed Analysis
The processing times of the front-end and back-end components, including both eye and tongue pallor site algorithms, are tested on a scale of 10,000 runs. The testing took place on an Azure hosted Windows VM with 7 GB RAM and a 2.20 GHz processor. The training/test images include tongue and eye pallor site images of sizes 5.21 KB and 159 KB, respectively.
4.1.1. Front-End Upload Time
This test is designed by placing the entire Java upload servlet into a loop, which runs 10,000 times upon one call. To determine the upload processing times, a nano second based Java timer command is placed at the beginning and end of algorithm, providing time stamps in the console indicative of a start and finish times. The difference of these stamps represents the total run-through time of the front-end image upload process.
4.1.2. Back-end Model Processing Time
This analysis is designed by placing time-stamps at the beginning and end of the model with kNN classifier. The processing takes place within a MATLAB silent command window, which runs both the eye and tongue algorithms. This test includes the full opening and closing of MATLAB in singular instances to most accurately mimic the users’ experience.
4.1.3. Back-end Model Processing Time
This analysis is designed similarly to the front-end experiment. The same nano second based Java timer command is placed at the beginning and end of the model with kNN classifier, providing time stamps in the console indicative of a start and finish times. The difference of these stamps, represents the total run-through time of the back-end process.
Our goal with this experiment is to observe the impact of the front-end processing time on the overall and back-end processing times. If t represents the overall application runtime, represents the front-end run time and represents the back-end run-times, respectively in Equations (7) and (8). Thus, for a lightweight front-end, must hold.
The statistical analysis of the front and back-end processing times and their dependencies are shown in Table 2. We observe that the front-end processing time has median and standard deviations in milliseconds of and , respectively. For the back-end processing times, model and exhibit variations due to the pre-processing and software-related time-dependencies. Both models () are implemented using the kNN classifier for hierarchical classification of normal, anemic and abnormal images.
Further assessment of back-end model () time-complexities demonstrates that the kNN classifier has run-time complexity of O() [28], where ‘k’ is the optimal nearest neighbor parameter, ‘d’ is the data dimensionality and ‘n’ is the number of images, respectively. Thus, for model , the time complexity is O(), since pixels, and . However, for model , the methodological step for separable averaging filter incurs complexity of O(2) [29] per image, where ‘m’ is the length of averaging filter. Thus, for the low-pass filtering step, the time complexity incurred is O(6 ) for eye images, and O(10 × 62,500n) for tongue images, respectively. The next steps in model involve subtraction of low-pass filtered image from original image, image thresholding and regional intensity-based feature extraction, which incur approximately linear time complexity per image, or O(). Finally, the classification step for model incurs complexity of O(). Here, we observe that time-complexity of is greater than 6 and 10 times of for eye and tongue image data sets, respectively. Also, for eye images, ‘’ and for tongue images, ‘’ are found optimal and these variations in time complexities can be observed in Table 2. Further, Table 2 demonstrates that both of our conditions, Equations (7) and (8), hold, with front-end run times significantly smaller than that of both back-end, indicating that our front-end is light-weight as well as independent of back-end performances.
4.2. Color and Gradient-Based Feature Learning
For our analysis, the 36 color and gradient planes estimated using model are analyzed for multi-class classification performances using the kNN and CNN classification models, respectively. Thus, for the eye data set with 27 images, [ images] and for the tongue data set with 56 images, [ images] are subjected to classification. Next, the rate of correct classification for each color and gradient plane image is analyzed to identify the most discriminating planes. We observe that for the eye data set, the 12 color and gradient plane images extracted after Frangi-filtering are optimal and result in consistently high classification accuracies in the range [50–56%]. Also, Frangi-superimposed hue () and saturation () color planes result in the maximum classification accuracy. It is noteworthy that covariance/correlation analysis of the 54 features, extracted using model , with the output class labels, also demonstrate that Frangi-filtered features [20] and hue, saturation, intensity planes [16,17] have the highest correlation indices.
Next, the trained CNN kernels/AFMs for and color plane images can be analyzed for qualitative assessment of pallor site separability. For the eye pallor site images corresponding to class 0, 1 and 2 shown in Figure 1a, with the top 20 significant AFMs corresponding to the and color planes are shown in Figure 9. We observe that deeper layers of the CNN model do not demonstrate significant spatial differences when compared to the initial layers in the data model. Hence the top 20 significant AFMs are selected from the initial CNN layers that demonstrate qualitative variations. We observe that normal images (class 0) have a highly flushed and distinct conjunctiva due to significant blood flow in the vessels. Anemic images (class 1) have less flushed conjunctiva and sclera while abnormal images (class 2) have the most flushed sclera regions. Thus, the AFMs demonstrate distinct separability between the eye pallor site images.
For the tongue data set, 8 color planes extrapolated by gradient filtering and superposition on the red, green, blue, lightness and a,b planes (from Lab transformation), luminance and chrominance planes (Ycb transformation) are found to have the maximum classification accuracies in the range [62–65%]. Here, the lightness () and a-plane () are found to have the highest classification accuracies. Further, the top 20 significant AFMs from the trained CNN models for the color planes are qualitatively analyzed for data separability. For the tongue images in Figure 1b, the corresponding AFMs for the are shown Figure 10, respectively. Here, we observe that for normal images (class 0), the inner tongue region is more flushed than the outer tongue regions. Images with anemia (class 1) have homogeneously flushed full tongue regions, while abnormal images (class 2) have structural variabilities in the inner segments of the tongue. Besides, covariance/correlation analysis of the model features with the output class labels demonstrate that gradient-filtered features have the highest correlation indices. Thus, the importance of skin-independent ROIs for pallor classification tasks is qualitatively demonstrated by the CNN model AFMs with unmasked images.
4.3. Classification Performance Analysis
Once the optimal intensity-based features and color-plane images are learned from model and , respectively, the next step is classification of the pallor site images. Motivated by prior works [7], we perform 2-step hierarchical classification, such as separation of class 0 vs. 1,2, followed by separation of class 1 vs. 2 images. Thus, for screening purposes, hierarchical classification effectively separates normal from abnormal patients. The 2-steps of binary hierarchical classification performances are analyzed in terms of the precision (), recall (), accuracy () and area under the receiver operating characteristic curves (). The classification performance of models and on the eye images are shown in Table 3. Here, we observe that the model implemented with the kNN classifier has the best image classification performances (high ).
The classification performance of models and on the tongue images are shown in Table 4. Here, we observe that the model with kNN has best separability of class 0/1,2 while model with kNN has best separability of class 1 vs. 2.
The optimal partitioning for hierarchical classification is selected based on the highest average classification performance. We observe that hierarchical classification partitioning presented in Table 3 and Table 4 have lesser false negative rates (higher average ) than other comparable partitions and multi-class class classifications. A version of the trained Azure-hosted model is at available for testing and public usage. (https://sites.google.com/a/uw.edu/src/automated-pallor-detection-project).
5. Conclusions and Discussion
The proposed work presents a novel hardware independent application that is optimized in design for fast end-to-end-communication using computationally less-intensive region-based features and generalizable data models for image-based pallor classification. We perform quantitative and qualitative assessment of eye and tongue pallor site images with varying pallor severities to design two application models with a shared front-end that can be incorporated for personalized pallor detection and pallor screening tasks, respectively. We perform three categories of experiments on the pallor site images that are acquired from the public domain. The first experiment demonstrates that proposed application font-end has significantly lesser computational time complexity (order of ) when compared to the back-end processing times. The second experiment detects the most discriminating color and gradient plane-transformed images that are significant for classification of image-based pallor. This experiment qualitatively demonstrates that Frangi-filtered hue and saturation color planes and first-order gradient filtered luminance channel planes are most significant for pallor classification using eye and tongue images, respectively. In the third quantitative experiment, we observe that pallor classification, using the two proposed data models, results in 86% screening accuracy for eye images while color-transformations and gradient filtering leads to 98% screening accuracy for tongue images. Thus, the proposed applications are capable of severity screening for anemia using facial pallor site images in under 20 seconds of computation time per image.
Three significant conclusions can be drawn from our analysis. First, for the eye pallor site images, model that involves spatial segmentation of each image followed by intensity-based feature extraction and classification is the best model for separating normal images from abnormal ones (class 0 vs. 1,2). For the tongue data set, however, model that involves color and gradient transformations followed by classification is better for overall anemia screening tasks. Second, the CNN model over-fits to predict the class label with maximum number of class labels. For instance, in the eye data set with model , classification of class 0 vs. 1,2 achieves due to the class samples = for the binary classification task. Thus, all test samples are classified as class 1 or 2 by the CNN data model, or over-prediction. Also, for the tongue data set with model , all test samples are classified to the majority class labels, thereby resulting in . On the other hand, kNN is more resilient to sample class imbalance. Third, the eye pallor site images are better for anemia-like pallor screening when compared to the tongue pallor site images since the combined AUC under the hierarchical classification tasks is greater for the eye pallor site classification tasks. This observation is in line with the clinical analysis for beta thalassemia in [14].
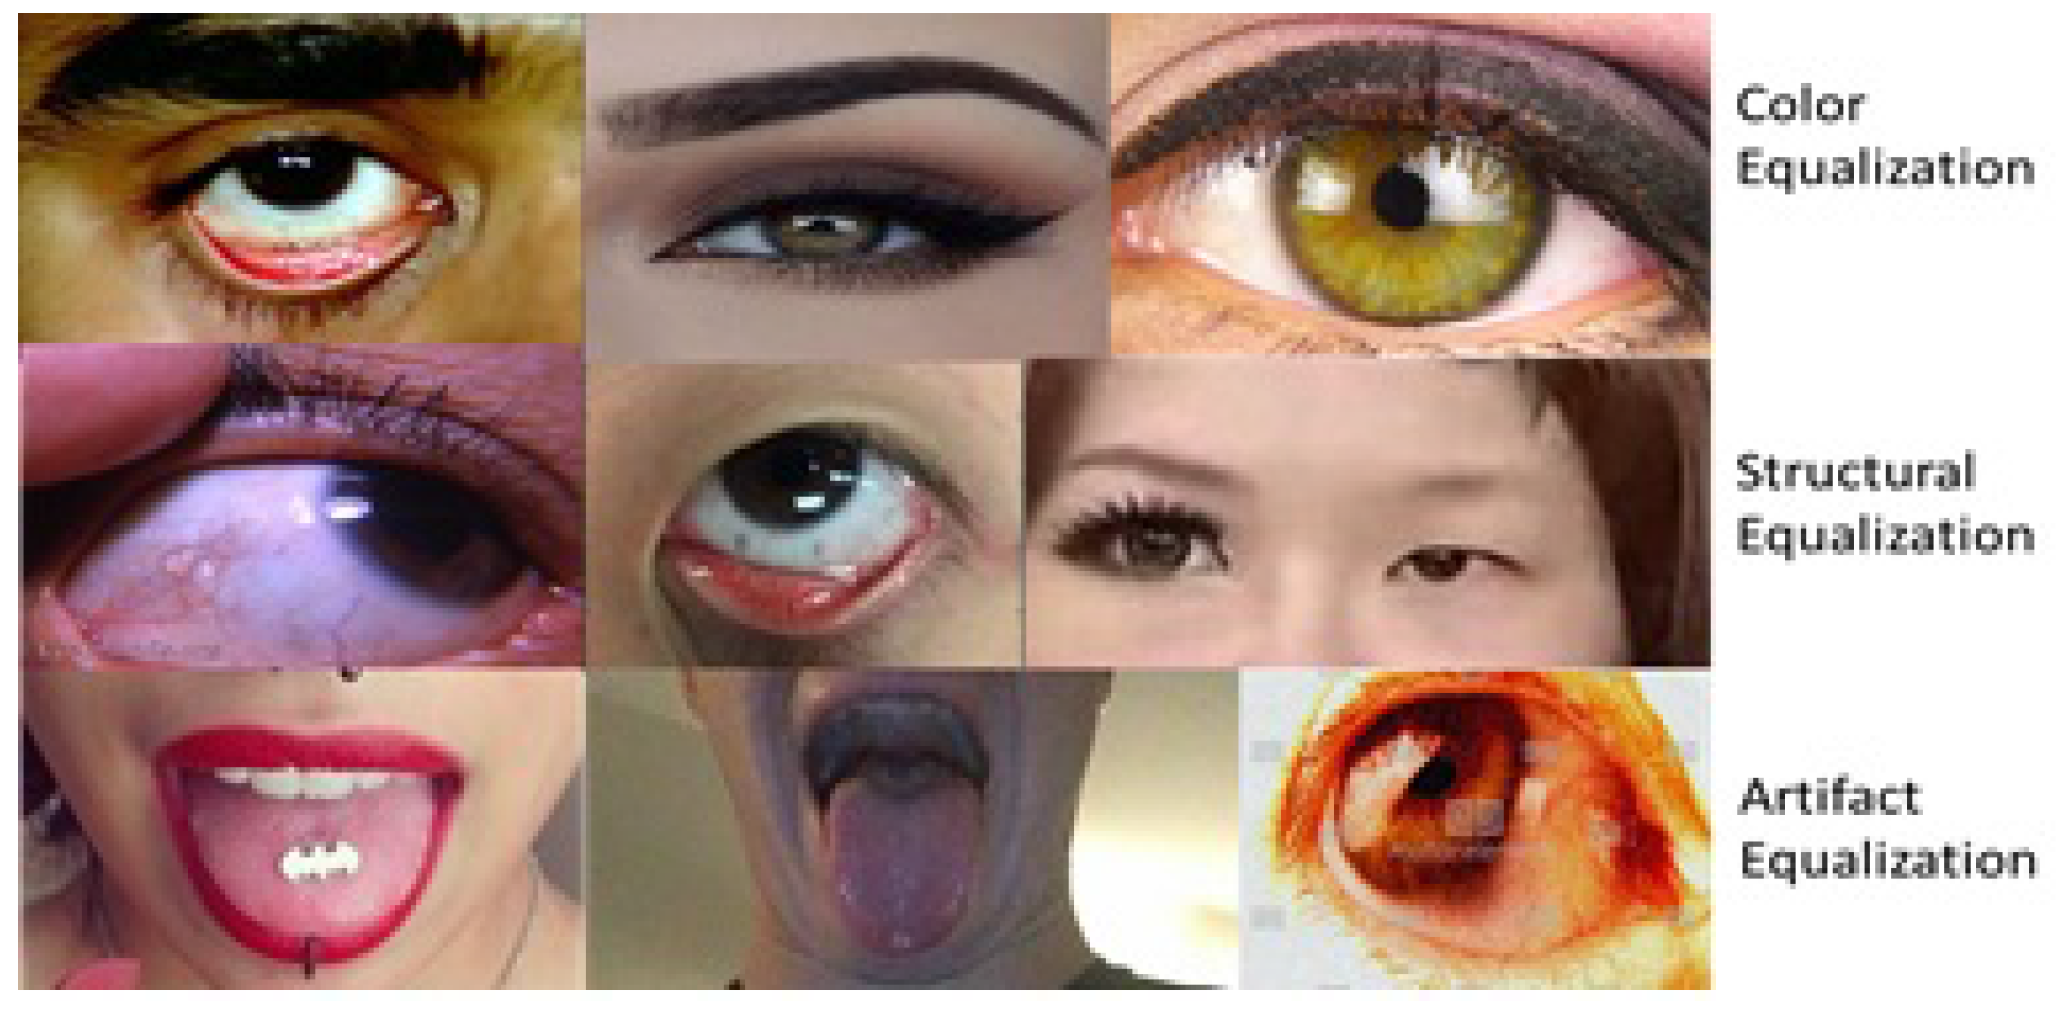
With the two proposed hardware-independent non-invasive medical diagnostics screening platforms, users will be able to dictate their use based on preferences for speed versus accuracy in screening results. The application with back-end, which provides more accurate pallor screening at slower processing speeds due to ROI segmentation requirements, is optimal for longitudinal assessment of personalized pallor. However, the application with the back-end, which provides slightly less accurate results at faster processing speeds, becomes preferable for large-scale screening applications. Future works can be directed towards extracting pallor-specific bio-markers from patient skin-color based features. To counteract the variations in patient demographics, the image processing modules that need to be developed include normalized feature extractors with color, structural and artifact equalization modules as shown in Figure 11. The functionalities of these modules may be directed towards spatial transformations against variations in image illumination, camera pixel resolutions, and facial piercings. Such skin-based pallor classification will necessitate texture-based feature detection modules with higher time complexities followed by combination of pallor-specific bio-markers that are independent of patient ethnicity, gender and age-based variations.
Acknowledgments
The authors would like to thank Humairat H. Rahman for providing the subjective quality annotations.
Author Contributions
Sohini Roychowdhury conceived and designed the experiments; Paul Hage and Joseph Vasquez performed the experiments; Sohini Roychowdhury and Paul Hage analyzed the data; Joseph Vasquez contributed software modules and analysis tools; Sohini Roychowdhury and Paul Hage wrote the paper.
Conflicts of Interest
The authors declare no conflict of interest.
References
- Lewis, G.G.; Phillips, S.T. Quantitative Point-of-Care (POC) Assays Using Measurements of Time as the Readout: A New Type of Readout for mHealth. Method. Mol. Biol. 2015, 1256, 213–229. [Google Scholar]
- Centers for Medicare and Medicaid Services. National Health Expenditures 2014 Highlights. Available online: https://ccf.georgetown.edu/wp-content/uploads/2017/03/highlights.pdf (accessed on 15 May 2017).
- Diogenes, Y. Azure Data Security and Encryption Best Practices. Available online: https://docs.microsoft.com/en-us/azure/security/azure-security-data-encryption-best-practices (accessed on 28 April 2017).
- Roychowdhury, S.; Sun, D.; Bihis, M.; Ren, J.; Hage, P.; Rahman, H.H. Computer aided detection of anemia-like pallor. In Proceedings of the 2017 IEEE EMBS International Conference on Biomedical Health Informatics (BHI), Orlando, FL, USA, 16–19 February 2017; pp. 461–464. [Google Scholar]
- LeCun, Y.; Bottou, L.; Bengio, Y.; Haffner, P. Gradient-based learning applied to document recognition. Proc. IEEE 1998, 86, 2278–2324. [Google Scholar] [CrossRef]
- Roychowdhury, S.; Ren, J. Non-deep CNN for multi-modal image classification and feature learning: An Azure-based model. Proceesings of the 2016 IEEE International Conference on Big Data (IEEE BigData), Washington, DC, USA, 5–8 December 2016. [Google Scholar]
- Roychowdhury, S.; Koozekanani, D.; Parhi, K. Dream: Diabetic retinopathy analysis using machine learning. IEEE J. Biomed. Health Inf. 2014, 18, 1717–1728. [Google Scholar] [CrossRef] [PubMed]
- Morales, S.; Naranjo, V.; Navea, A.; Alcaniz, M. Computer-Aided Diagnosis Software for Hypertensive Risk Determination Through Fundus Image Processing. IEEE J. Biomed. Health Inf. 2014, 18, 1757–1763. [Google Scholar] [CrossRef] [PubMed]
- Carrillo-de Gea, J.M.; García-Mateos, G.; Fernández-Alemán, J.L.; Hernández-Hernández, J.L. A Computer-Aided Detection System for Digital Chest Radiographs. J. Healthc. Eng. 2016, 2016. [Google Scholar] [CrossRef] [PubMed]
- McLean, E.; Cogswell, M.; Egli, I.; Wojdyla, D.; De Benoist, B. Worldwide prevalence of anaemia, WHO vitamin and mineral nutrition information system, 1993–2005. Public Health Nutr. 2009, 12, 444–454. [Google Scholar] [CrossRef] [PubMed]
- Silva, R.M.d.; Machado, C.A. Clinical evaluation of the paleness: Agreement between observers and comparison with hemoglobin levels. Rev. Bras. Hematol. Hemoter. 2010, 32, 444–448. [Google Scholar] [CrossRef]
- Stevens, G.A.; Finucane, M.M.; De-Regil, L.M.; Paciorek, C.J.; Flaxman, S.R.; Branca, F.; Peña-Rosas, J.P.; Bhutta, Z.A.; Ezzati, M.; Group, N.I.M.S.; et al. Global, regional, and national trends in haemoglobin concentration and prevalence of total and severe anaemia in children and pregnant and non-pregnant women for 1995–2011: A systematic analysis of population-representative data. Lancet Glob. Health 2013, 1, e16–e25. [Google Scholar] [CrossRef]
- Benseñor, I.M.; Calich, A.L.G.; Brunoni, A.R.; Espírito-Santo, F.F.d.; Mancini, R.L.; Drager, L.F.; Lotufo, P.A. Accuracy of anemia diagnosis by physical examination. Sao Paulo Med. J. 2007, 125, 170–173. [Google Scholar] [CrossRef] [PubMed]
- Yalçin, S.S.; Ünal, S.; Gümrük, F.; Yurdakök, K. The validity of pallor as a clinical sign of anemia in cases with beta-thalassemia. Turk. J. Pediatr. 2007, 49, 408–412. [Google Scholar] [PubMed]
- Roychowdhury, S.; Emmons, M. A Survey of the Trends in Facial and Expression Recognition Databases and Methods. arXiv, 2015; arXiv:1511.02407. [Google Scholar]
- Shaik, K.B.; Ganesan, P.; Kalist, V.; Sathish, B.; Jenitha, J.M.M. Comparative study of skin color detection and segmentation in HSV and YCbCr color space. Procedia Comput. Sci. 2015, 57, 41–48. [Google Scholar] [CrossRef]
- Pujol, F.A.; Pujol, M.; Jimeno-Morenilla, A.; Pujol, M.J. Face detection based on skin color segmentation using fuzzy entropy. Entropy 2017, 19, 26. [Google Scholar] [CrossRef]
- Minaee, S.; Abdolrashidi, A.; Wang, Y. Iris recognition using scattering transform and textural features. In Proceedings of the 2015 IEEE Signal Processing and Signal Processing Education Workshop (SP/SPE), Salt Lake City, UT, USA, 9–12 Auguest 2015; pp. 37–42. [Google Scholar]
- Roychowdhury, S.; Koozekanani, D.D.; Parhi, K.K. Blood vessel segmentation of fundus images by major vessel extraction and subimage classification. IEEE J. Biomed. Health Inf. 2015, 19, 1118–1128. [Google Scholar]
- Roychowdhury, S.; Koozekanani, D.D.; Parhi, K.K. Automated detection of neovascularization for proliferative diabetic retinopathy screening. In Proceedings of the 2016 38th Annual International Conference of the IEEE Engineering in Medicine and Biology Society (EMBC), Orlando, FL, USA, 17–20 August 2016; pp. 1300–1303. [Google Scholar]
- Ginige, A.; Murugesan, S. Web engineering: A methodology for developing scalable, maintainable Web applications. Cut. IT J. 2001, 14, 24–35. [Google Scholar]
- Jadeja, Y.; Modi, K. Cloud computing-concepts, architecture and challenges. In Proceedings of the IEEE 2012 International Conference on Computing, Electronics and Electrical Technologies (ICCEET), Nagercoil, India, 21–22 March 2012; pp. 877–880. [Google Scholar]
- Roychowdhury, S.; Bihis, M. AG-MIC: Azure-Based Generalized Flow for Medical Image Classification. IEEE Access 2016, 4, 5243–5257. [Google Scholar] [CrossRef]
- Chieu, T.C.; Mohindra, A.; Karve, A.A.; Segal, A. Dynamic scaling of web applications in a virtualized cloud computing environment. In Proceedings of the IEEE International Conference on E-Business Engineering (ICEBE’09), Hangzhou, China, 9–11 September 2009; pp. 281–286. [Google Scholar]
- Kalantri, A.; Karambelkar, M.; Joshi, R.; Kalantri, S.; Jajoo, U. Accuracy and reliability of pallor for detecting anaemia: A hospital-based diagnostic accuracy study. PLoS ONE 2010, 5, e8545. [Google Scholar] [CrossRef] [PubMed]
- Cherkassky, V.; Mullier, F. Learning from Data; John Wiley and Sons: New York, NY, USA, 1998. [Google Scholar]
- Gonzalez, R.C.; Woods, R.E. Digital Image Processing, 2nd ed.; Addison-Wesley Longman Publishing Co., Inc.: Boston, MA, USA, 1992. [Google Scholar]
- Veksler, O. Machine Learning in Computer Vision. Available online: http://www.csd.uwo.ca/courses/CS9840a/Lecture2knn.pdf (accessed on 24 May 2017).
- The University of Utah. Spatial Filtering. Available online: http://www.coe.utah.edu/~cs4640/slides/Lecture5.pdf (accessed on 30 April 2017).
Figure 1.
Examples of (a) eye (b) tongue pallor site images with varying severities.
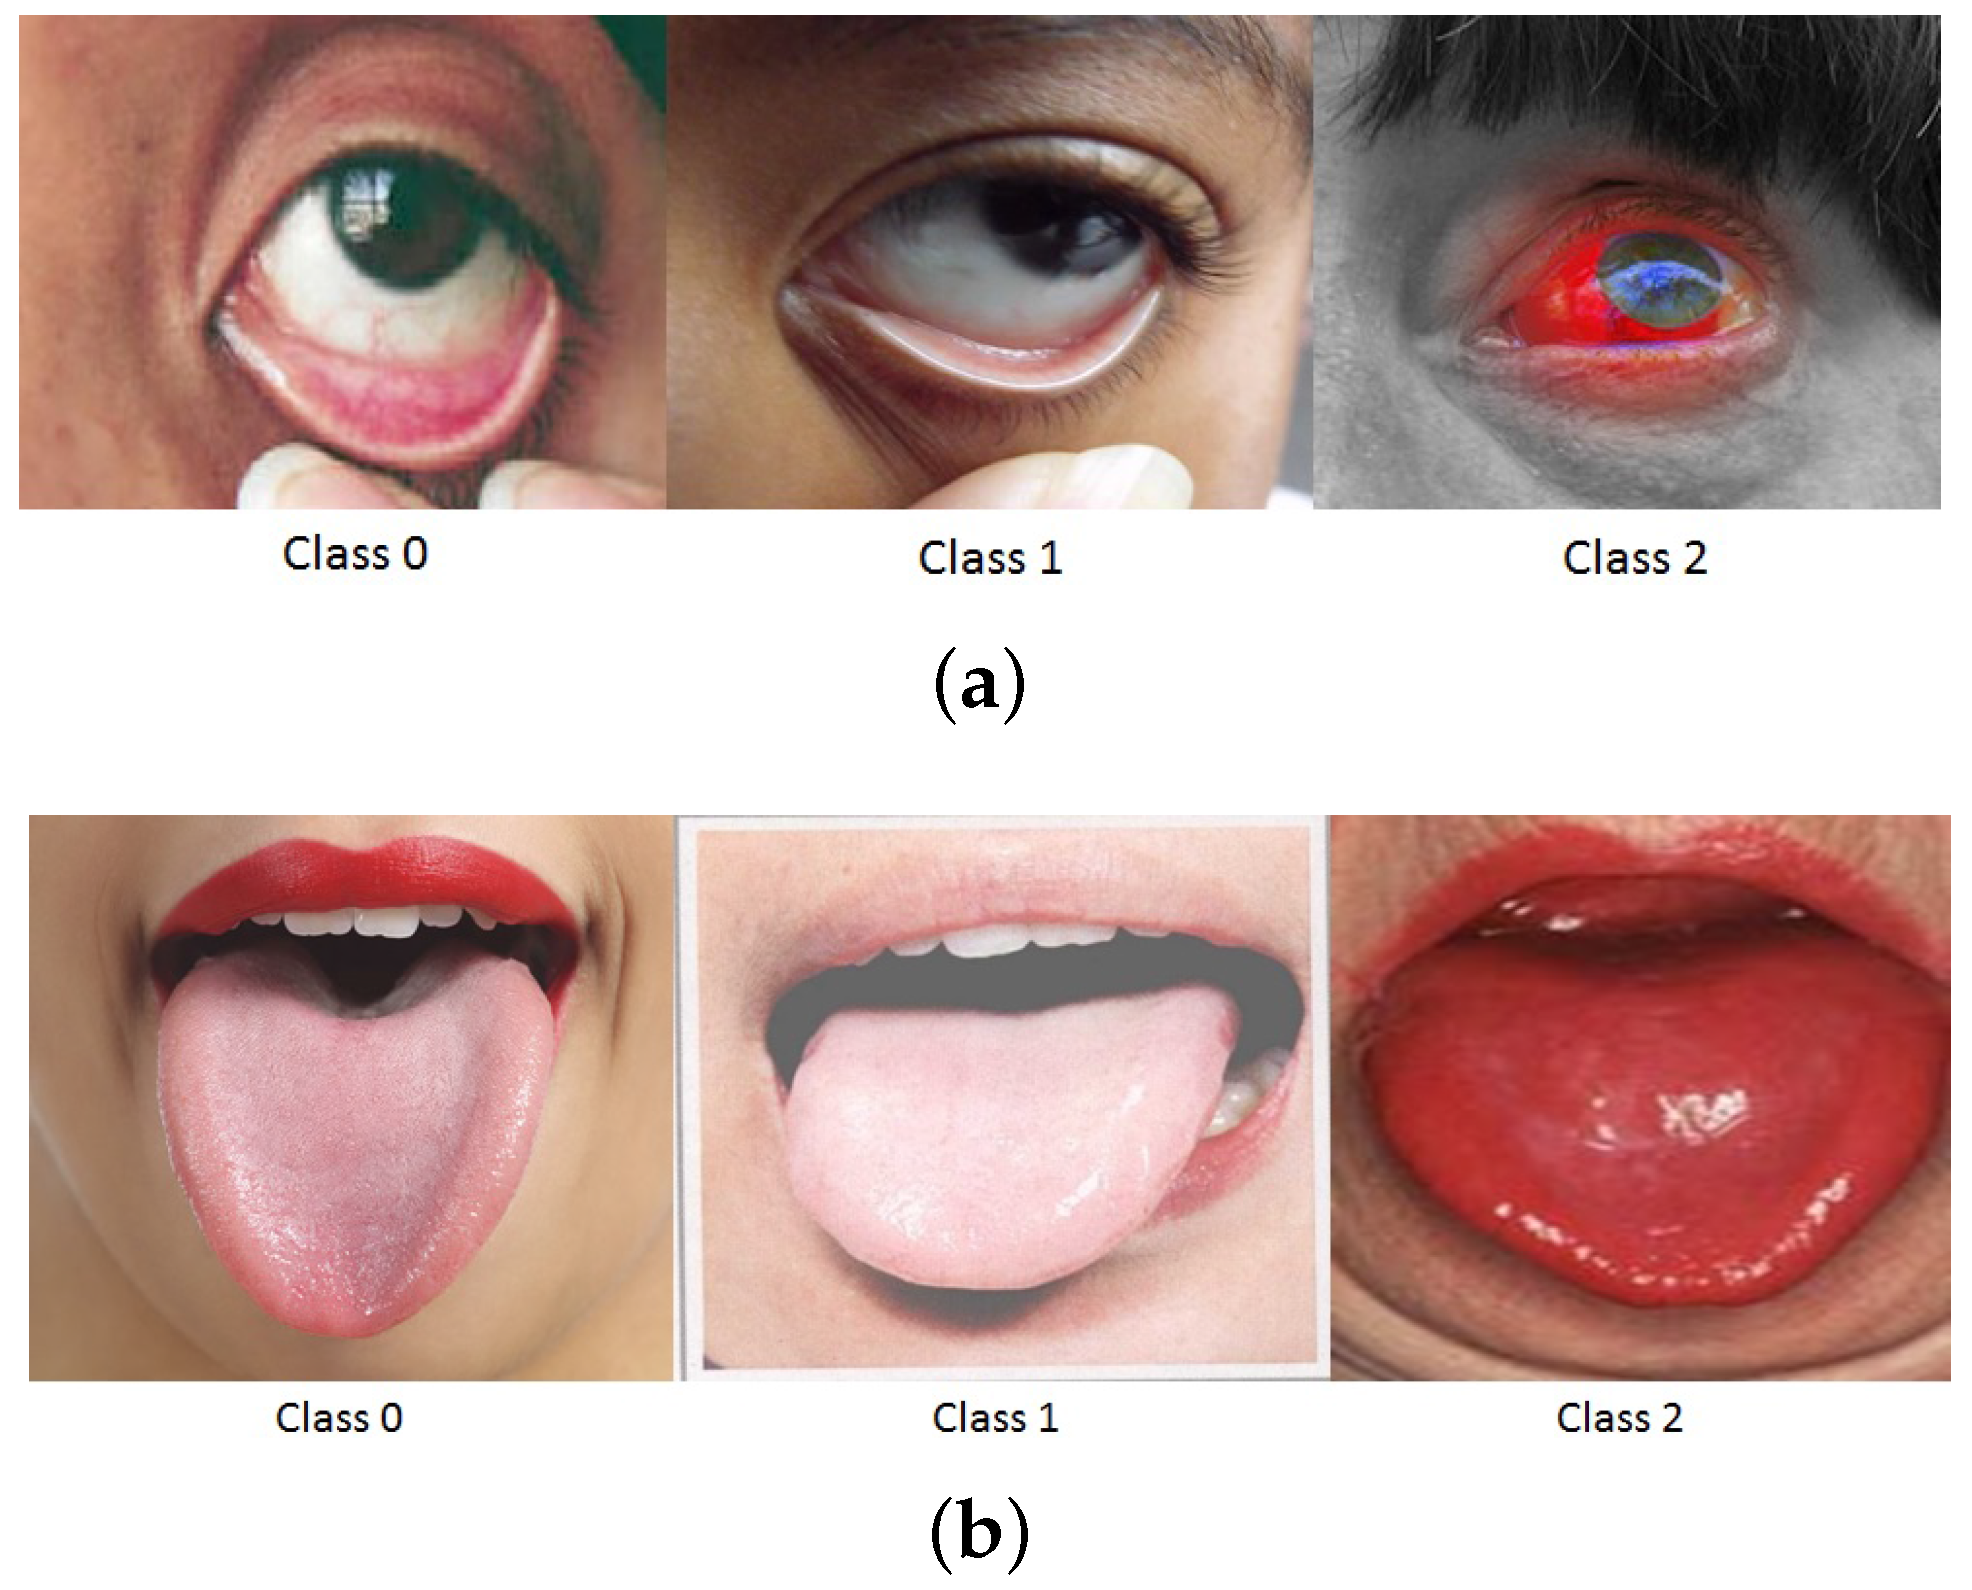
Figure 2.
Examples of variations in patient demographics and imaging conditions across pallor site data in the data set under analysis.
Figure 2.
Examples of variations in patient demographics and imaging conditions across pallor site data in the data set under analysis.

Figure 3.
Architecture 1 flow diagram; GUI: graphical user interface.

Figure 4.
Architecture 2 flow diagram.
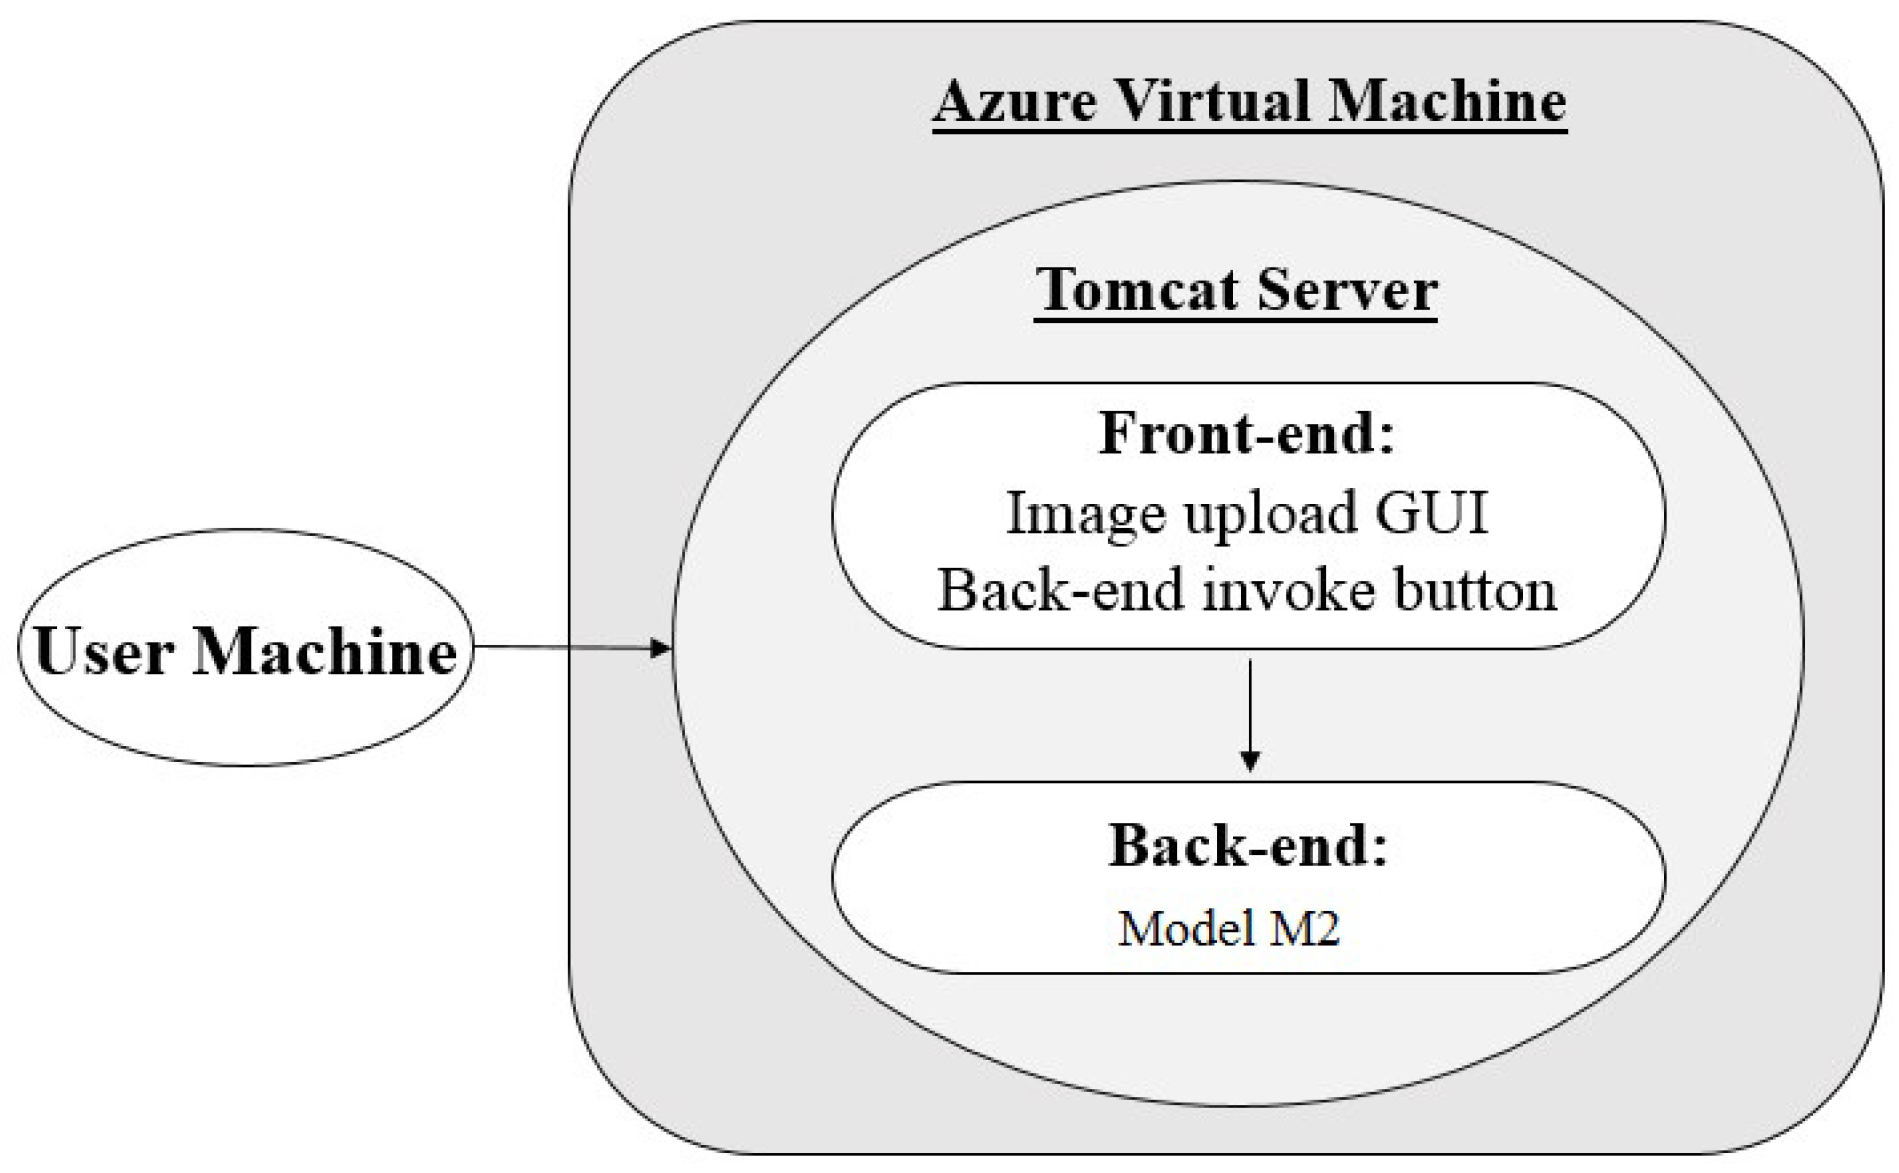
Figure 5.
The proposed functionality flows between the application front and back-ends.
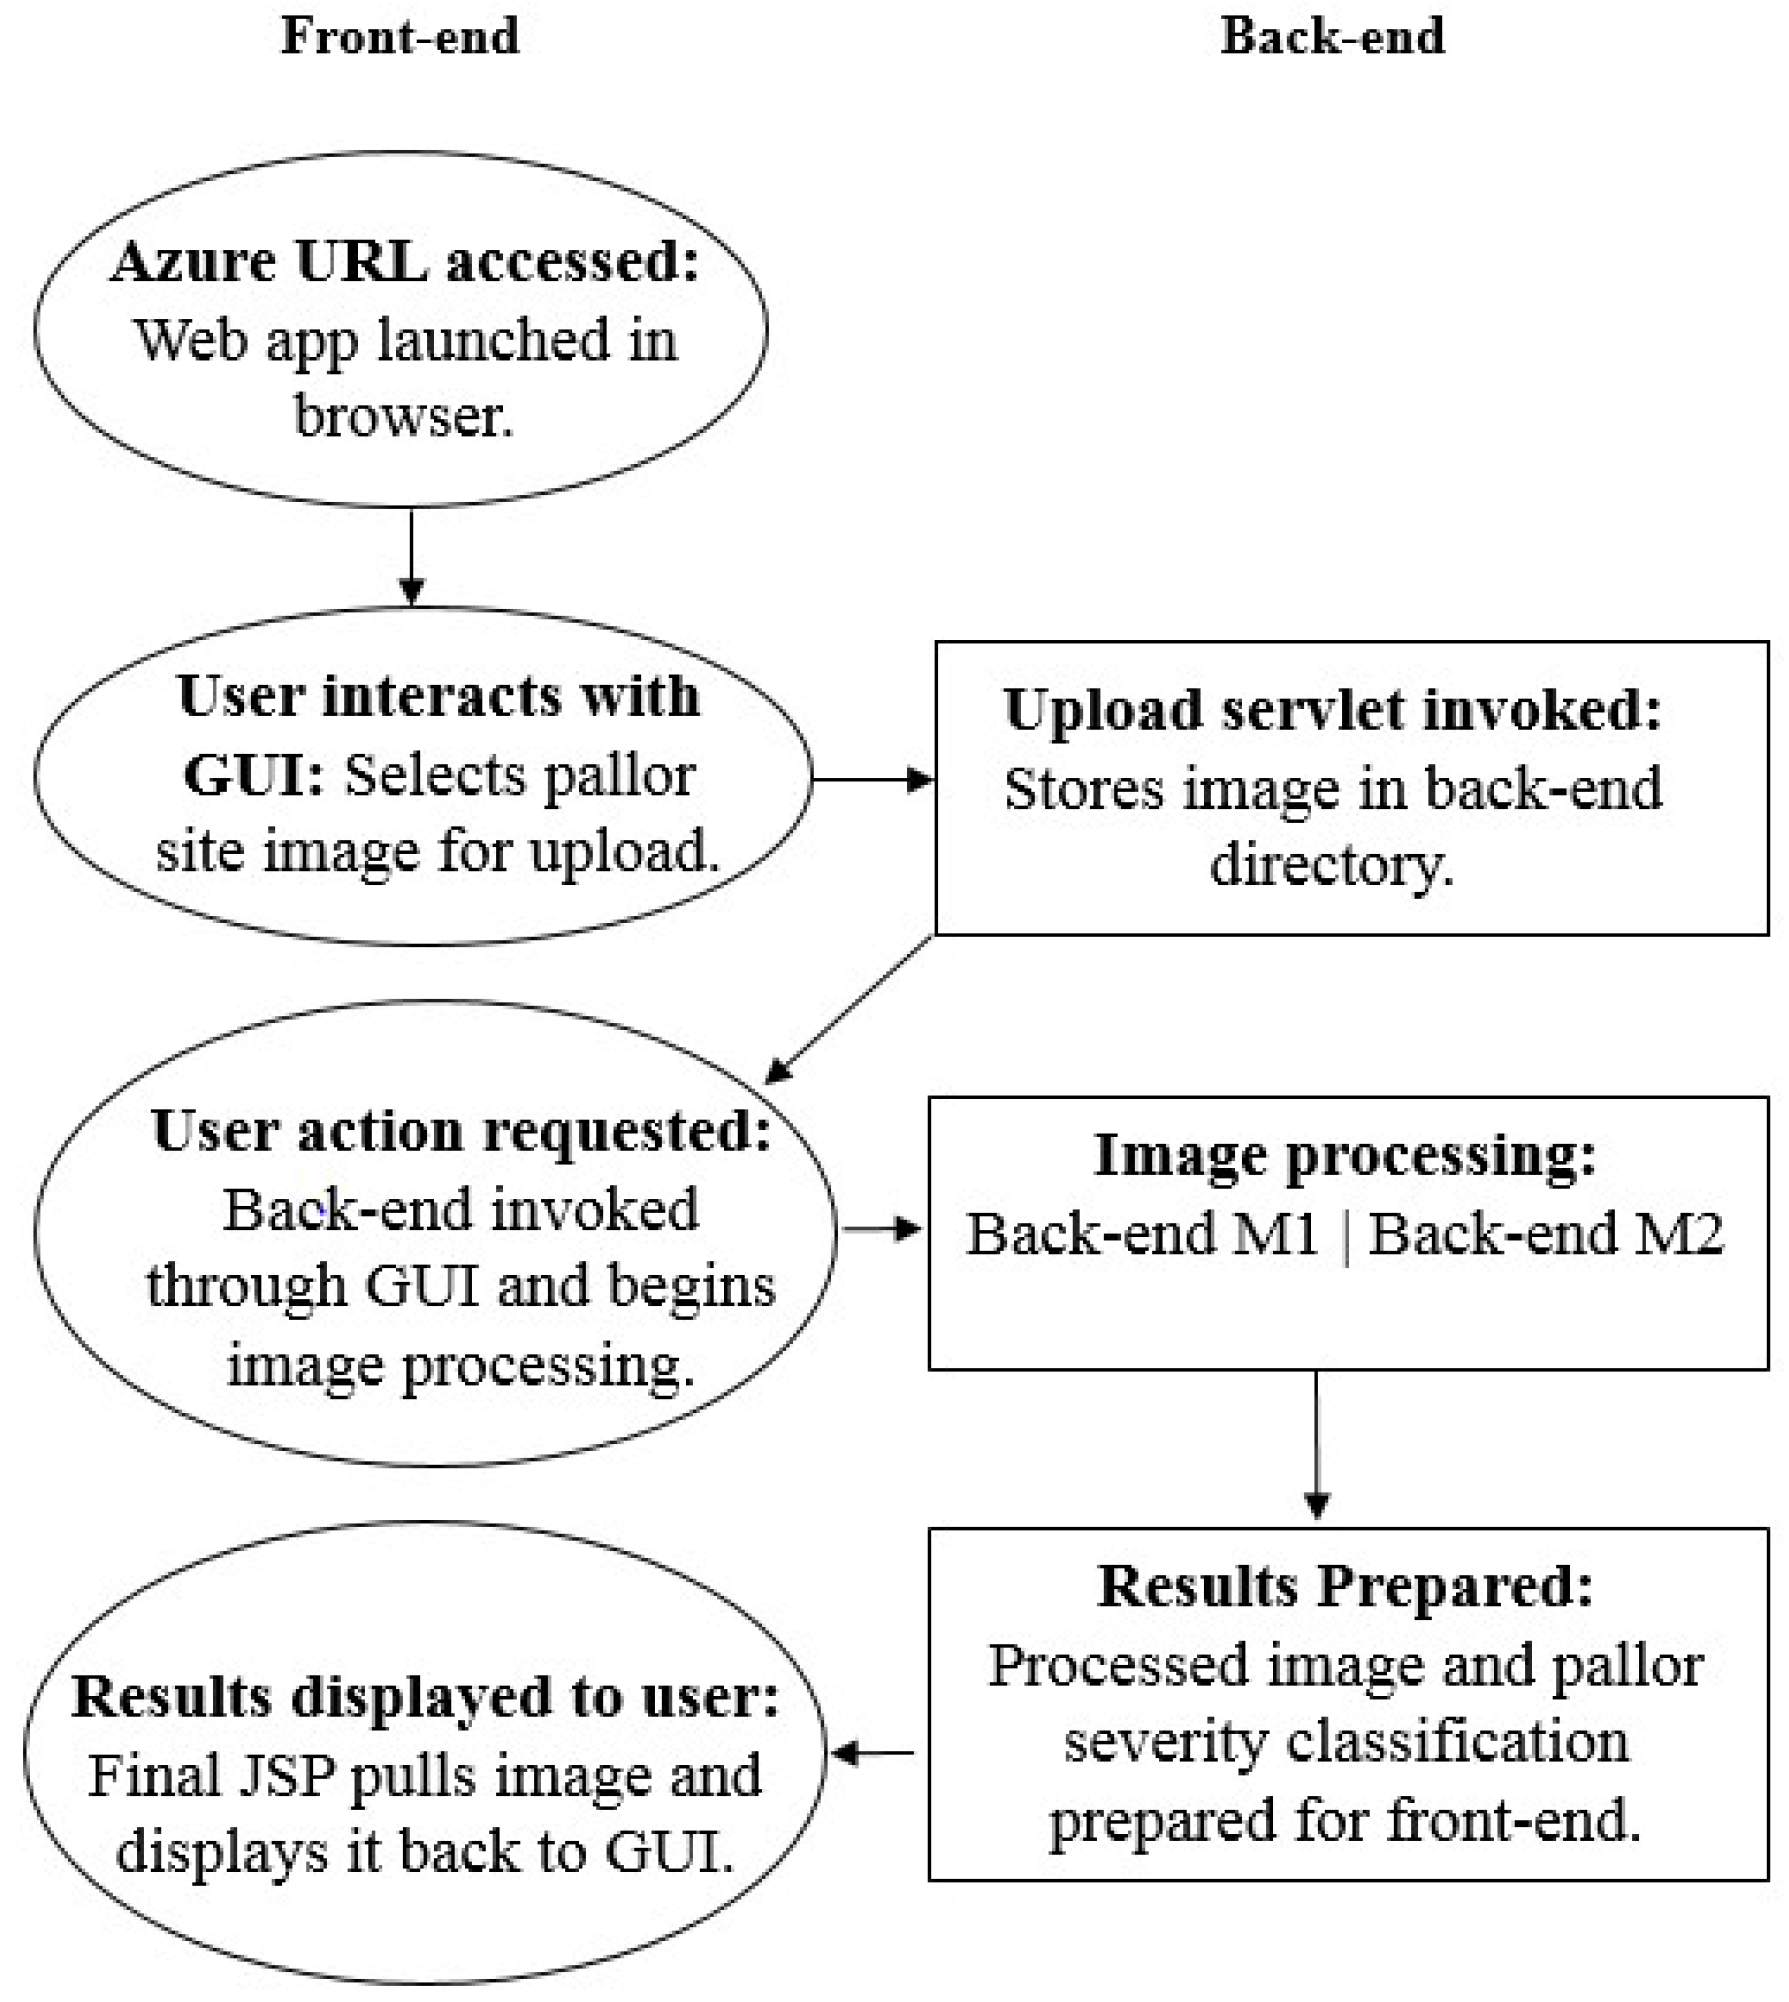
Figure 6.
Sample webpages.(a) GUI welcome page; (b) User uploading tongue image; (c) User invoking back-end from webpage button; (d) Web page displaying spinner as back-end runs silently; (e) Final results displayed back to GUI.
Figure 6.
Sample webpages.(a) GUI welcome page; (b) User uploading tongue image; (c) User invoking back-end from webpage button; (d) Web page displaying spinner as back-end runs silently; (e) Final results displayed back to GUI.

Figure 7.
Steps for pallor-site image pre-processing; (a) original image; (b) ; (c) ; (d) mask g; (e) padded image.
Figure 7.
Steps for pallor-site image pre-processing; (a) original image; (b) ; (c) ; (d) mask g; (e) padded image.

Figure 8.
The proposed models for pallor severity classification.
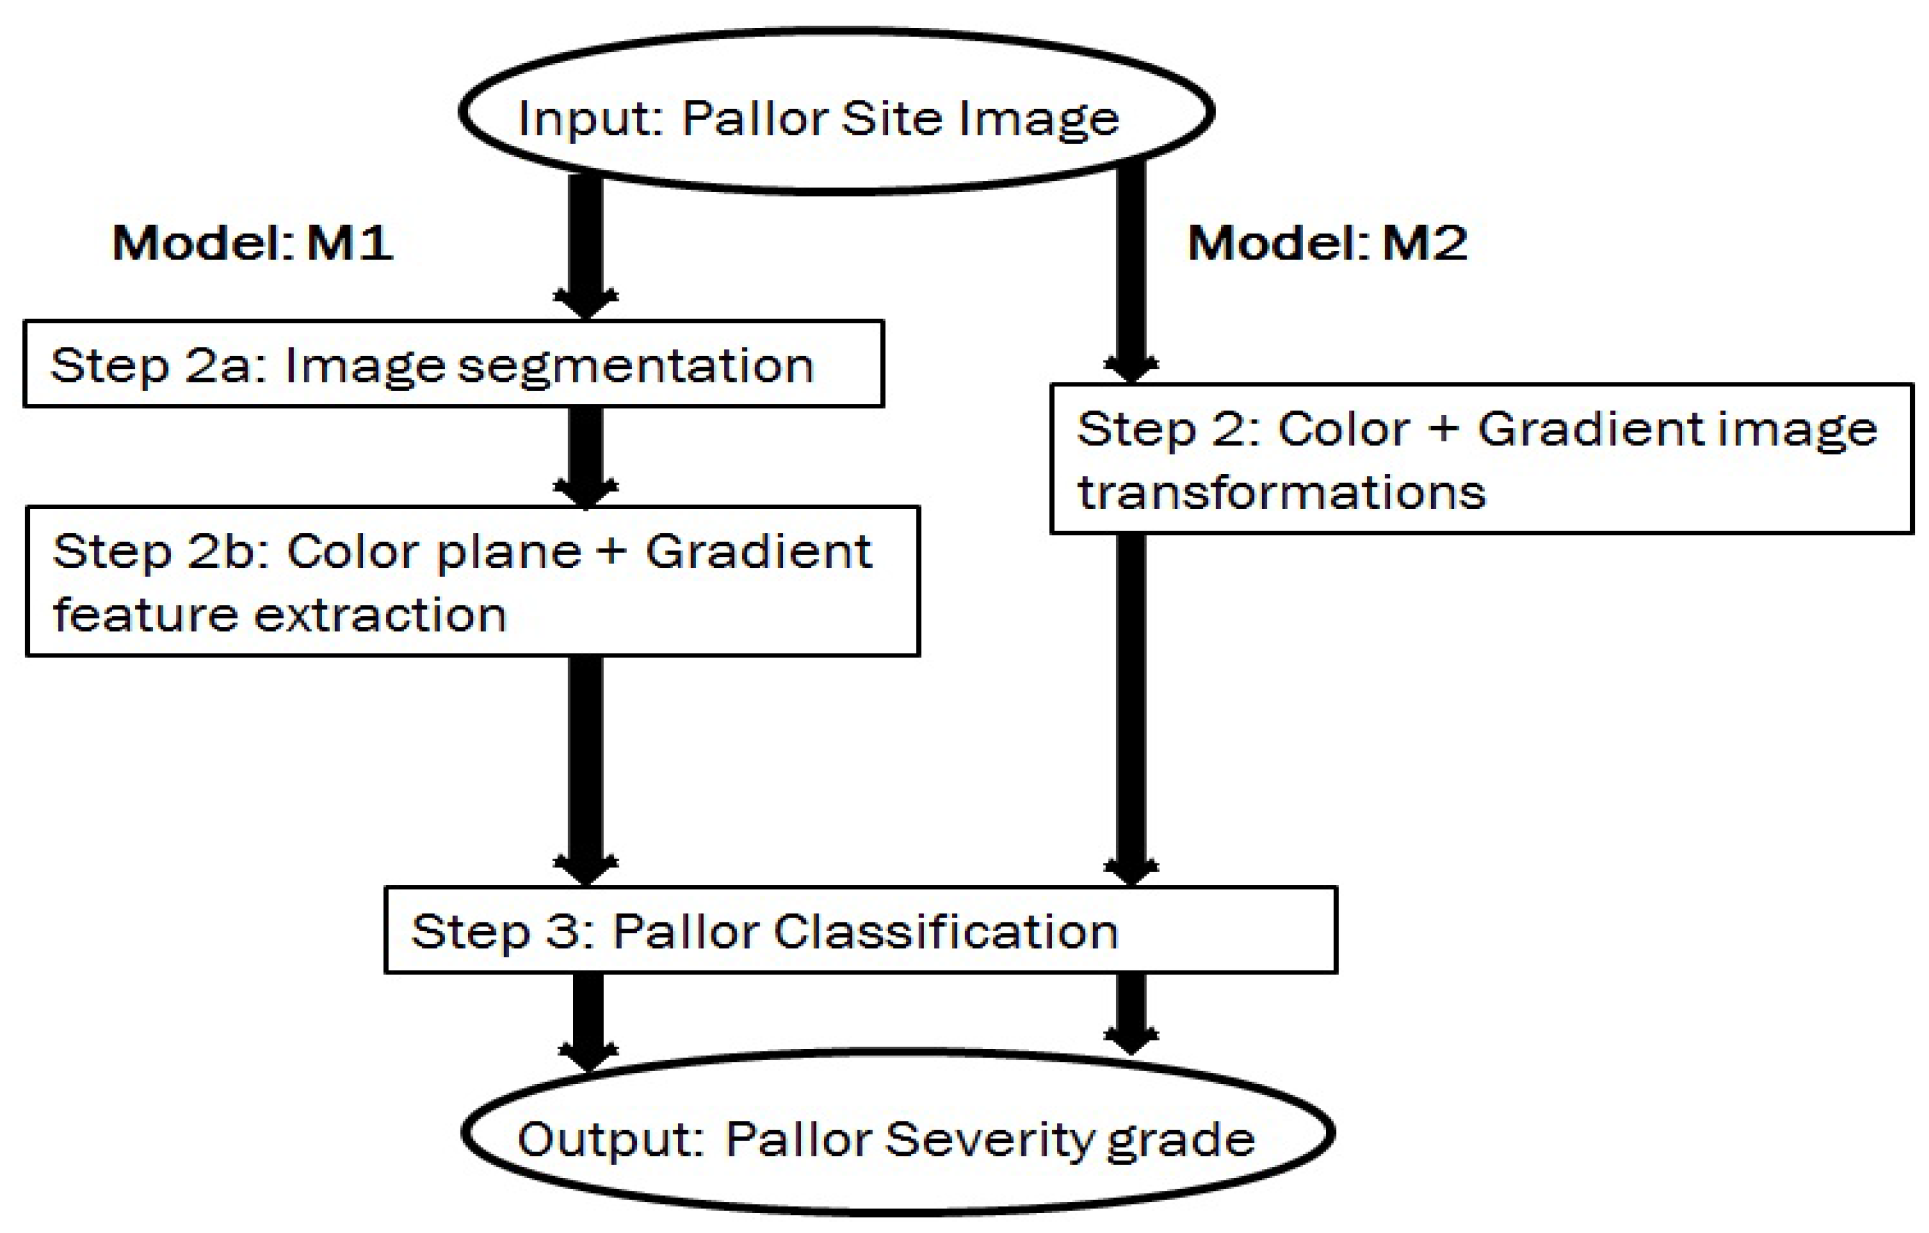
Figure 9.
AFMs corresponding to eye pallor site images; (a) First 10 AFMs corresponding to ; (b) 11th to 20th AFM corresponding to ; (c) First 10 AFMs corresponding to ; (d) 11th to 20th AFM corresponding to .
Figure 9.
AFMs corresponding to eye pallor site images; (a) First 10 AFMs corresponding to ; (b) 11th to 20th AFM corresponding to ; (c) First 10 AFMs corresponding to ; (d) 11th to 20th AFM corresponding to .
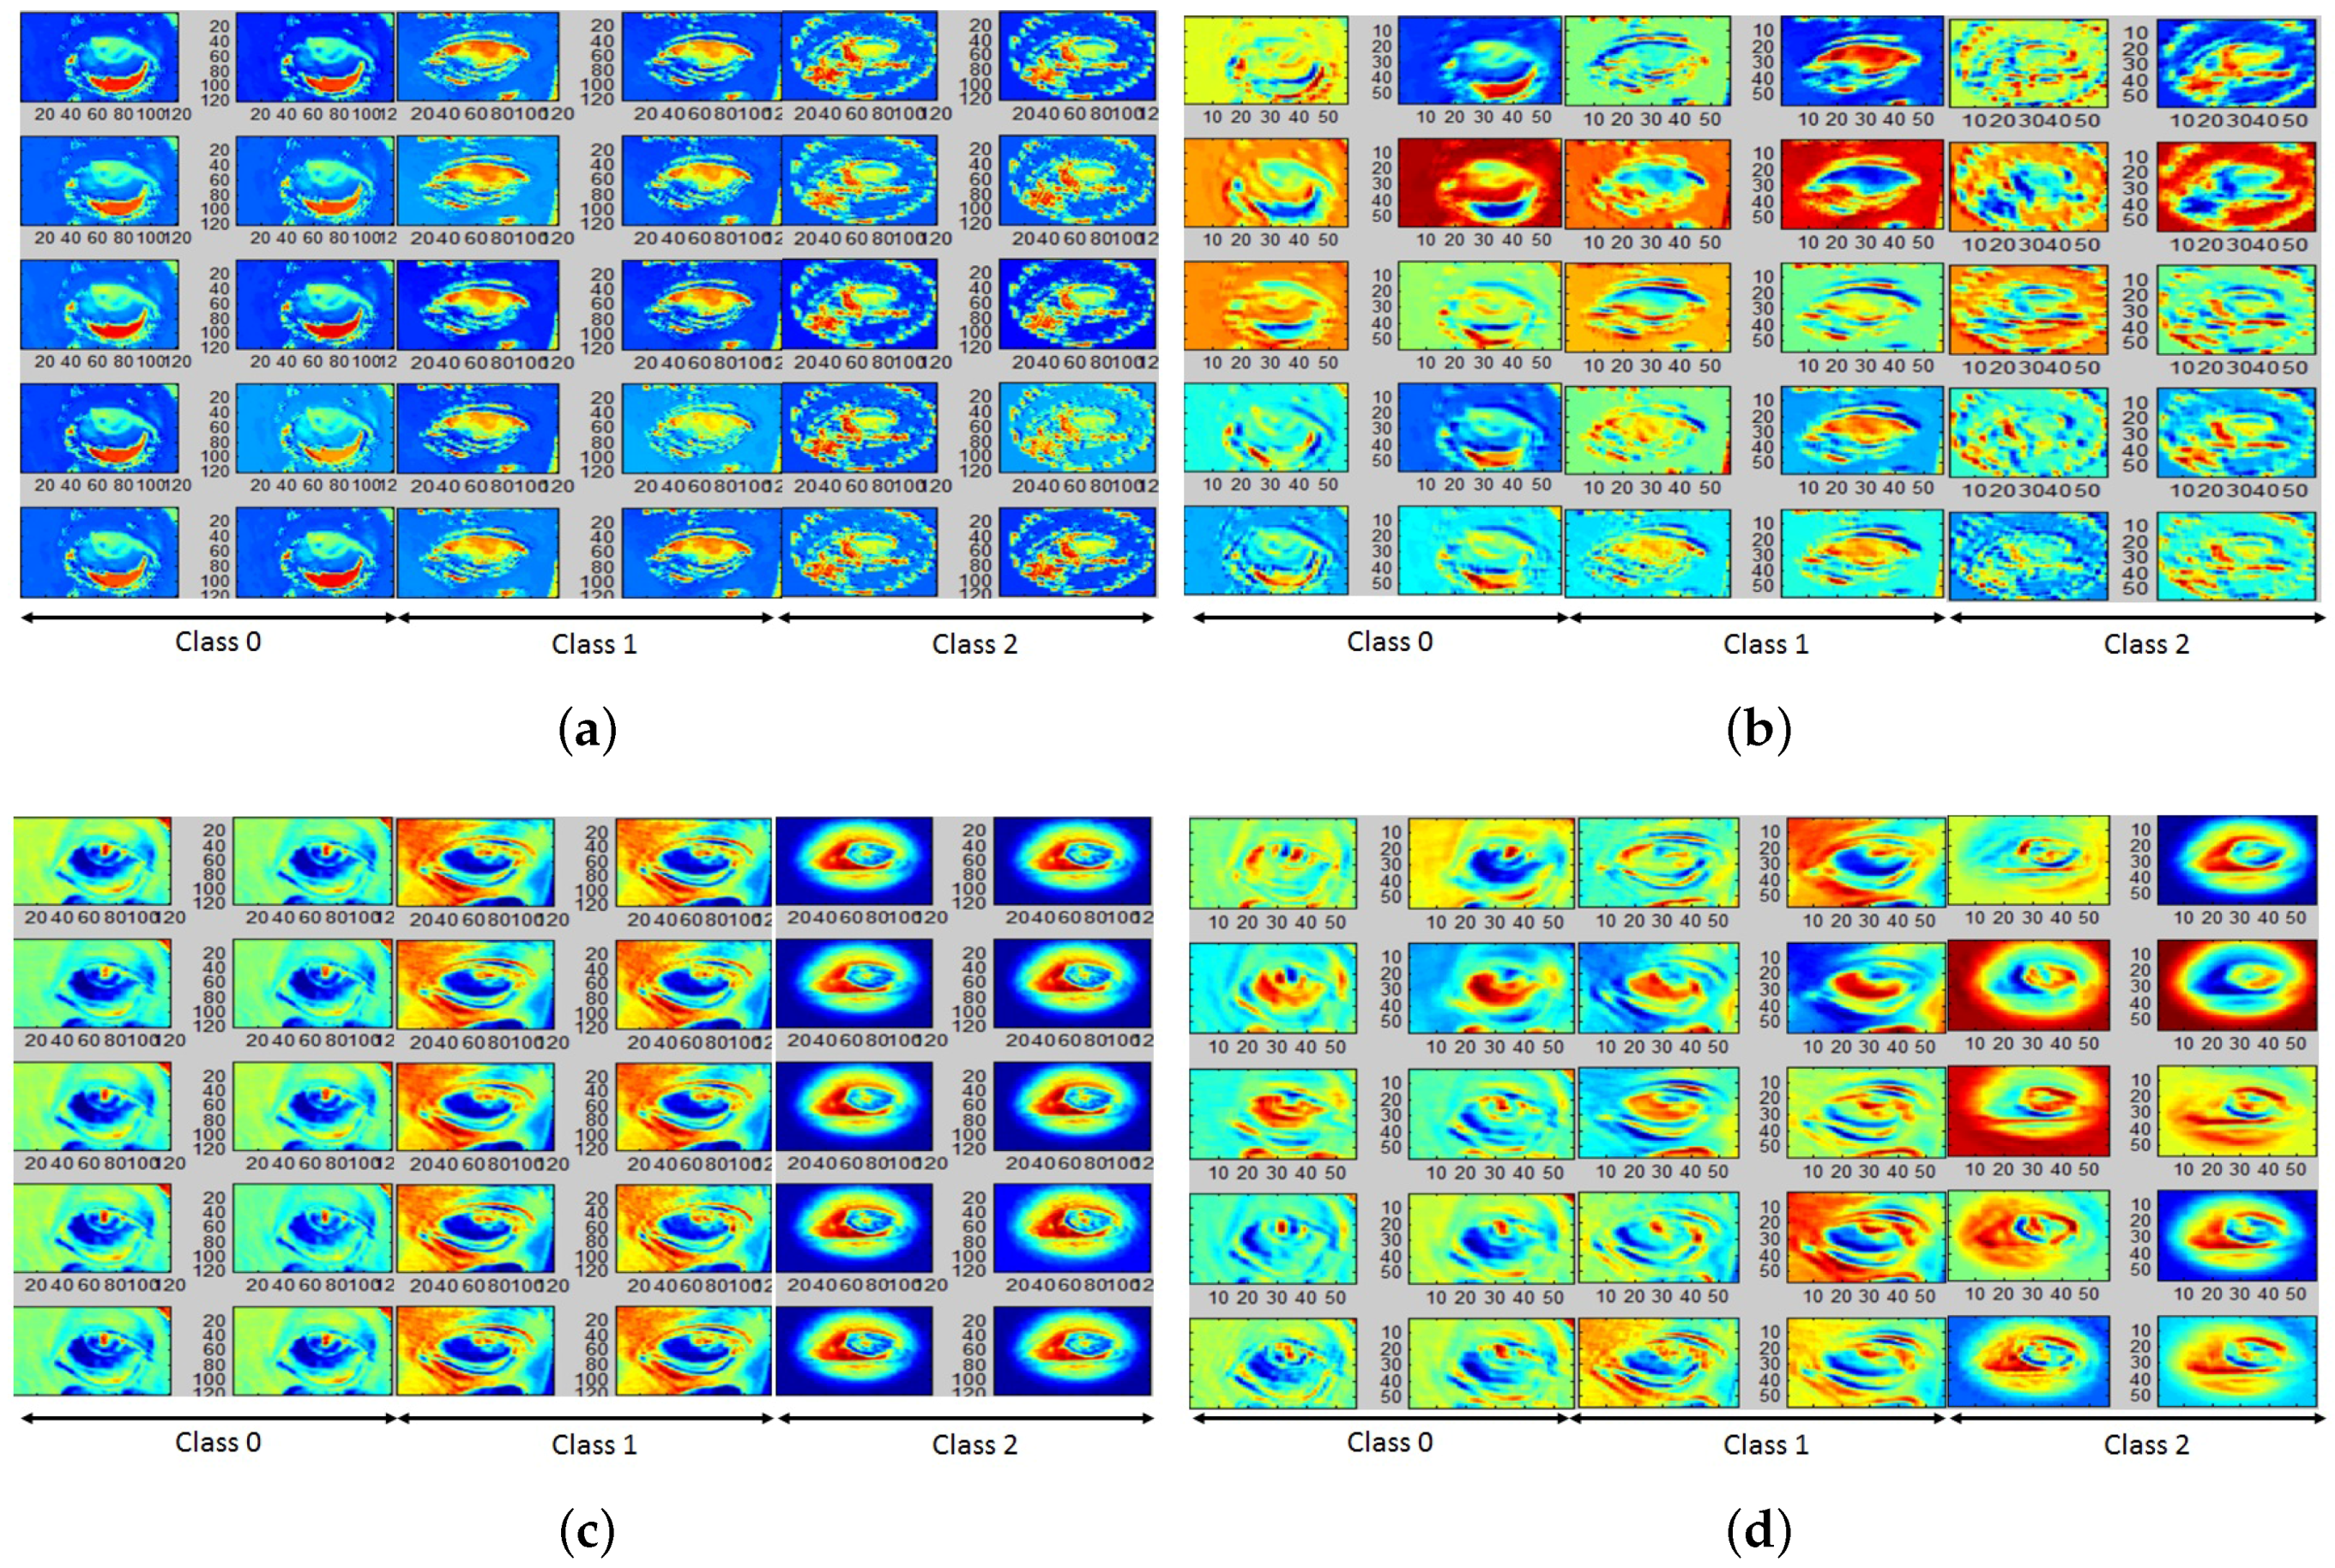
Figure 10.
AFMs corresponding to tongue pallor site images; (a) First 10 AFMs corresponding to ; (b) 11th to 20th AFM corresponding to .
Figure 10.
AFMs corresponding to tongue pallor site images; (a) First 10 AFMs corresponding to ; (b) 11th to 20th AFM corresponding to .
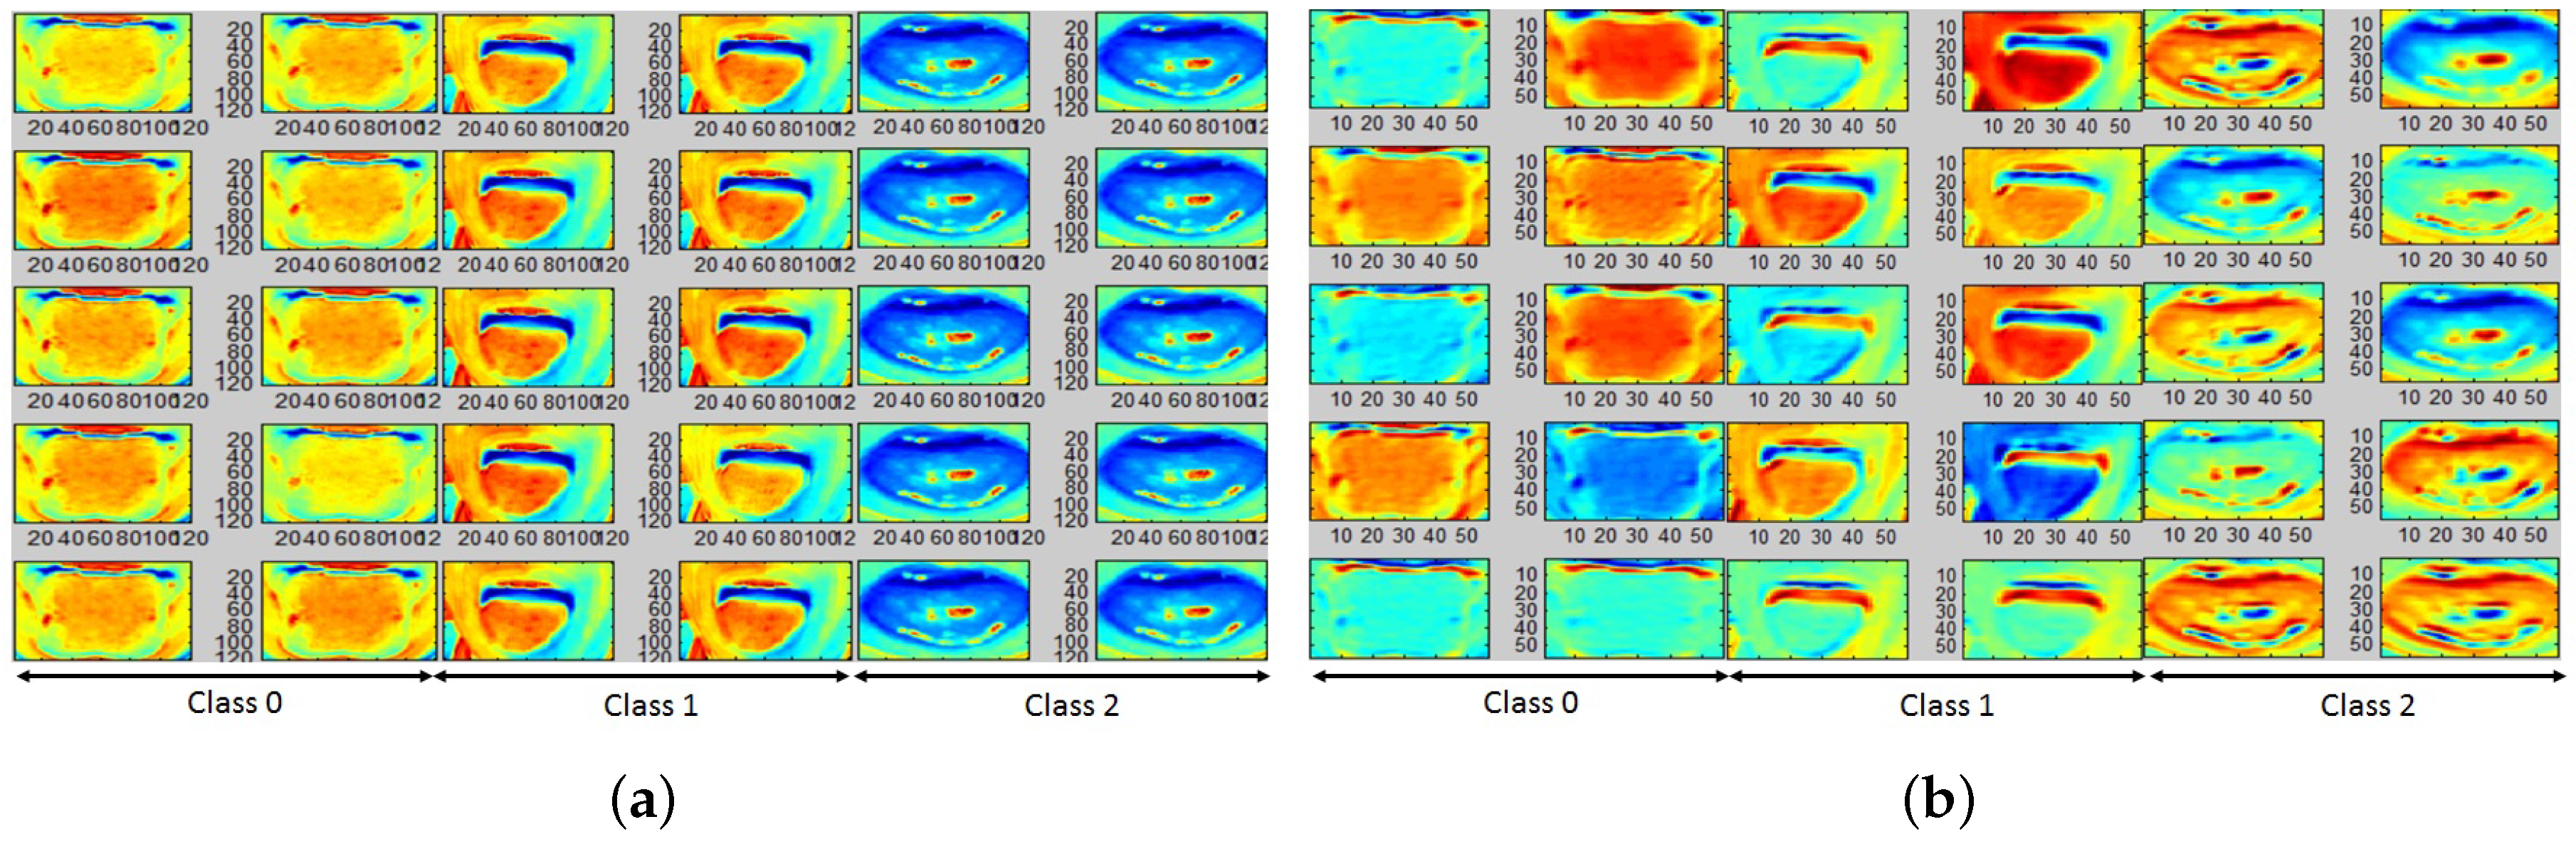
Figure 11.
Examples of challenges in automated patient skin-color based image segmentation and analysis algorithms that can be analyzed in future works.
Figure 11.
Examples of challenges in automated patient skin-color based image segmentation and analysis algorithms that can be analyzed in future works.


Table 1.
Pixel-intensity Feature Extraction for model .
| Feature | # Features | Meaning |
|---|---|---|
| Pallor Site: | Eye | |
| Color Planes in | (6 × 3) = 18 | Max, mean, variance of pixels in red, green, blue, hue, saturation, intensity color planes. |
| Gradient intensity in | ||
| for | 5 | Max, min, mean, variance and intensity of pixels. |
| Frangi-filtered intensity in for | 4 | Max, mean, variance and intensity of pixels. |
| Pallor Site: | Tongue | |
| Color Planes in | (6 × 3) = 18 | Max, mean, variance of pixels in red, green, blue, hue, saturation, intensity color planes. |
| Gradient intensity in | ||
| for | 5 | Max, min, mean, variance and intensity of pixels. |
| Frangi-filtered intensity in | ||
| for | 4 | Max, mean, variance and intensity of pixels. |
| Color Planes in | (6 × 3) = 18 | Max, mean, variance of pixels in red, green, blue, hue, saturation, intensity color planes. |
| Gradient intensity in | ||
| for | 5 | Max, min, mean, variance and intensity of pixels. |
| Frangi-filtered intensity in for | 4 | Max, mean, variance and intensity of pixels. |
Table 2.
Statistical Analysis of Front-end and Back-end Time Complexities. Mean (Std. dev.) of run-through times are represented in seconds, respectively.
Table 2.
Statistical Analysis of Front-end and Back-end Time Complexities. Mean (Std. dev.) of run-through times are represented in seconds, respectively.
| Time | Eye, | Eye, | Tongue, | Tongue, |
|---|---|---|---|---|
| (s) | 8.72 (7.6 × ) | 1.26 (0.33) | 31.49 (0.44) | 2.71 (0.57) |
| Time Complexity | O(6 × 62,500n) + O() + O() | O() | O(10 × 62,500n) + O() + O() | O() |
| t (s) | 8.74 (7.6 × ) | 1.30 (0.33) | 31.51 (0.04) | 3.94 (0.52) |
| 1.002 (5.9 × ) | 1.02 (0.003) | 1.00 (1.7 × ) | 1.08 (0.0014) | |
| 0.002 (5.9 × ) | 0.017 (0.003) | 0.006 (1.7 × ) | 0.01 (0.0014) |
Table 3.
Pallor classification Models on Eye Images. Best classification performances are in bold.
| Model | , kNN | , kNN | , CNN | , CNN | ||||
|---|---|---|---|---|---|---|---|---|
| Task | 0/1,2 | 1/2 | 0/1,2 | 1/2 | 0/1,2 | 1/2 | 1/0,2 | 0/2 |
| PR | 0.85 | 0.57 | 0.87 | 0.61 | 0.74 | 0.50 | 0.51 | 0.94 |
| RE | 0.99 | 0.84 | 0.97 | 0.80 | 1.00 | 0.80 | 0.03 | 0.19 |
| Acc | 0.86 | 0.67 | 0.87 | 0.53 | 0.74 | 0.5 | 0.41 | 0.56 |
| AUC | 0.75 | 0.675 | 0.5 | 0.5 | 0.68 | 0.4 | 0.57 | 0.57 |
Table 4.
Pallor classification Models on Tongue Images. Best classification performances are in bold.
Table 4.
Pallor classification Models on Tongue Images. Best classification performances are in bold.
| Model | , kNN | , kNN | , CNN | , CNN | ||||
|---|---|---|---|---|---|---|---|---|
| Task | 0/1,2 | 1/2 | 0/1,2 | 1/2 | 1/0,2 | 0/2 | 2/0,1 | 0/1 |
| PR | 0.982 | 0.51 | 0.69 | 0.9 | 0.95 | 0.66 | 0.71 | 0.68 |
| RE | 1.00 | 0.53 | 0.9 | 0.98 | 1.00 | 1.00 | 0.55 | 0.69 |
| Acc | 0.982 | 0.61 | 0.65 | 0.88 | 0.95 | 0.66 | 0.54 | 0.57 |
| AUC | 0.83 | 0.574 | 0.57 | 0.51 | 0.83 | 0.5 | 0.65 | 0.5 |
© 2017 by the authors. Licensee MDPI, Basel, Switzerland. This article is an open access article distributed under the terms and conditions of the Creative Commons Attribution (CC BY) license (http://creativecommons.org/licenses/by/4.0/).
Share and Cite
MDPI and ACS Style
Roychowdhury, S.; Hage, P.; Vasquez, J. Azure-Based Smart Monitoring System for Anemia-Like Pallor. Future Internet 2017, 9, 39. https://doi.org/10.3390/fi9030039
AMA Style
Roychowdhury S, Hage P, Vasquez J. Azure-Based Smart Monitoring System for Anemia-Like Pallor. Future Internet. 2017; 9(3):39. https://doi.org/10.3390/fi9030039
Chicago/Turabian StyleRoychowdhury, Sohini, Paul Hage, and Joseph Vasquez. 2017. "Azure-Based Smart Monitoring System for Anemia-Like Pallor" Future Internet 9, no. 3: 39. https://doi.org/10.3390/fi9030039
Note that from the first issue of 2016, this journal uses article numbers instead of page numbers. See further details here.