Visualizing Consolidation in the Global Seed Industry: 1996–2008


Department of Community, Agriculture, Recreation and Resource Studies, Michigan State University, 316 Natural Resources, East Lansing, MI 48824, USA
Sustainability 2009, 1(4), 1266-1287; https://doi.org/10.3390/su1041266
Submission received: 28 October 2009
/
Accepted: 4 December 2009
/
Published: 8 December 2009
(This article belongs to the Special Issue Renewable Agriculture)
Abstract
:The commercial seed industry has undergone tremendous consolidation in the last 40 years as transnational corporations entered this agricultural sector, and acquired or merged with competing firms. This trend is associated with impacts that constrain the opportunities for renewable agriculture, such as reductions in seed lines and a declining prevalence of seed saving. To better characterize the current structure of the industry, ownership changes from 1996 to 2008 are represented visually with information graphics. Since the commercialization of transgenic crops in the mid-1990s, the sale of seeds has become dominated globally by Monsanto, DuPont and Syngenta. In addition, the largest firms are increasingly networked through agreements to cross-license transgenic seed traits.
1. Introduction
In the last 40 years, the commercial seed industry has transformed dramatically. It has shifted from a competitive sector of agribusiness, composed primarily of small, family-owned firms, to an industry dominated by a small number of transnational pharmaceutical/chemical corporations [1]. These corporations entered the industry by acquiring numerous smaller seed companies, and merging with large competitors. This consolidation is associated with a number of impacts that constrain the opportunities for renewable agriculture. Some of these include declining rates of saving and replanting seeds, as firms successfully convince a growing percentage of farmers to purchase their products year after year [2]; a shift in both public and private research toward the most profitable proprietary crops and varieties, but away from the improvement of varieties that farmers can easily replant [3]; and a reduction in seed diversity, as remaining firms eliminate less profitable lines from newly acquired subsidiaries [4].
A number of studies of consolidation in the seed industry have examined trends up until the turn of the 21st century [5,6,7,8,9,10,11,12], but the most recent, accelerating changes are not as well-characterized [13,14]. In addition, the hundreds of transactions that have reshaped the industry in recent years challenge human cognitive capacities, making the full extent of this process difficult to comprehend. One promising way to improve understanding of the current structure of the global seed industry is by representing patterns of ownership visually, using information graphics. This approach communicates large amounts of information more quickly, and with fewer burdens on our short-term memories, when compared to text alone [15]. Visualization is particularly useful for analyzing consolidation because it can simultaneously represent the specific events that have contributed to these changes, as well as their overall scope. In addition, it can facilitate the dissemination of such research findings to much wider audiences, which is critical for encouraging sustainability efforts [16].
In this article I first discuss several theoretical perspectives that help clarify recent seed industry changes. I then describe the methods used to visualize the mergers, acquisitions and joint ventures that have occurred among key firms since the mid-1990s. These information graphics are presented with profiles of key firms involved in recent structural changes, and analysis of the strategies they have employed to achieve greater control over the seed sector. The potential trajectories of current trends, and their implications for renewable agriculture are briefly discussed.
2. Theoretical Perspectives
Three theoretical perspectives are useful for understanding recent structural changes in the food system in general, as well as the seed industry more specifically. One is the recognition of agriculture as a sector of the economy that was historically resistant to the involvement of large agglomerations of capital, although recent technological advances and legal protections are eroding previous obstacles. Another is the concept of the treadmill, which helps explain why farmers have been relatively willing participants in processes that decrease both their independence and the prospects for practicing renewable agriculture. A third perspective encompasses the tendency of large capitalist firms to consolidate their control of markets and reduce competition, a trend that is increasingly global in scope due to the ascendance of transnational corporations.
2.1. Barriers to Accumulation
Agriculture is a sector of the economy that has been more resistant to the capitalist logic of accumulation than most others [17,18,19]. Accumulation involves transforming capital-as-money into capital-as-commodities, and subsequently transforming this into larger amounts of capital-as-money [20]. Agriculture poses a number of challenges to this process because production typically requires extensive amounts of land, involves long periods of time, and is highly unpredictable, due to natural forces such as weather, pests and the perishable nature of food. This makes agricultural production a risky place to seek a profit, particularly when compared to producing durable goods in a factory. Because the accumulation process requires expansion into new economic frontiers, however, large-scale capitalists have had a strong interest in reducing these risks and refashioning agriculture toward a factory model [18,19]. Post-World War II technologies and research have succeeded in increasing the potential to extract profits from agriculture, particularly indirectly [21]. The sale of agricultural inputs (e.g., seeds, chemicals, equipment), and the transformation or distribution of outputs, have been the most amenable to the process of accumulation, even if the farm itself remains fairly resistant [3].
Seeds have the potential to short circuit possibilities for accumulation because once purchased they may be self-reproduced, thus bypassing the profits that could be realized if farmers continued to buy these inputs year after year [3,22]. This obstacle has been surmounted in some crops using two different strategies, biological and legal [3]. The development of hybrid crops is an example of the biological strategy, as subsequent generations do not exhibit the same characteristics as parents, thus eliminating incentives to replant saved seeds. Higher-yielding, hybrid varieties of corn introduced in the 1930s encouraged the growth of a private corn seed industry, in place of the previously dominant on-farm and public sources. Legal strategies involved first granting patent-like protections to certain seeds (e.g., International Union for the Protection of New Varieties of Plants), and eventually full patent protections for the transgenic seeds commercialized in the 1990s. Although earlier, patent-like protections allow farmers to save seeds, full patents prohibit this practice—violators may even receive prison sentences [23]. Because the legal strategy is expensive, constrained to a limited length of time (e.g., 17–20 years), and largely ineffective in the Global South due to lack of government enforcement [24,25], technologies are in development that will further enhance the biological strategy. One such effort involves creating transgenic seeds incapable of self-reproducing (genetic use restriction technologies); this has been dubbed ‘Terminator’ technology by non-governmental organizations [24].
2.2. Agricultural Treadmillls
Why have farmers participated in this process of eroding barriers to accumulation? Why not resist purchasing off-farm inputs? The concept of the technological treadmill, introduced by Willard Cochrane in 1958 [26] provides an explanation. Cochrane suggested that because demand for food is relatively inelastic, any increase in production is likely to reduce the prices farmers receive for their crops. This is due to the economic principle that when supply exceeds demand, prices will fall. Practices that increase production (which are tied to off-farm inputs) may initially accrue financial benefits for a small number of early adopters who are able to stay slightly ahead in this process. For the majority of farmers, however, the result is that they must constantly increase yields in order to simply maintain the same revenue. Those that are unable to keep up with this treadmill will ‘fall off,’ or exit farming altogether. Their land ends up being ‘cannibalized’ by remaining farmers who seek to increase scale of production as another means of keeping up with the treadmill, leading to the increasing centralization of agriculture [27]. Farmers who have managed to stay in business have adapted to this process, and are typically on the leading edge of the adoption of new technologies. As a result, they have a high degree of confidence in science and technological innovations [28].
Figure 1 is a graphic representation of this treadmill. It also shows that the adoption of new agricultural technologies may result in additional treadmills. The most well-known is the pesticide treadmill. As the use of synthetic pesticides increases, populations of natural predators are reduced, and selection pressures lead to pest populations with resistance to these compounds. This encourages applications of larger amounts of current pesticides, or the substitution of more toxic pesticides. Selection pressures are therefore increased, and are only temporarily effective in reducing crop pests [29]. A second treadmill involves the use of synthetic fertilizers, which may reduce soil organic matter, particularly when combined with other industrial agricultural practices. This, in turn, leads to the need to maintain or even increase applications of synthetic fertilizer in order to achieve original yields on increasingly depleted soils [17,30,31].
Figure 1.
Agricultural treadmills.
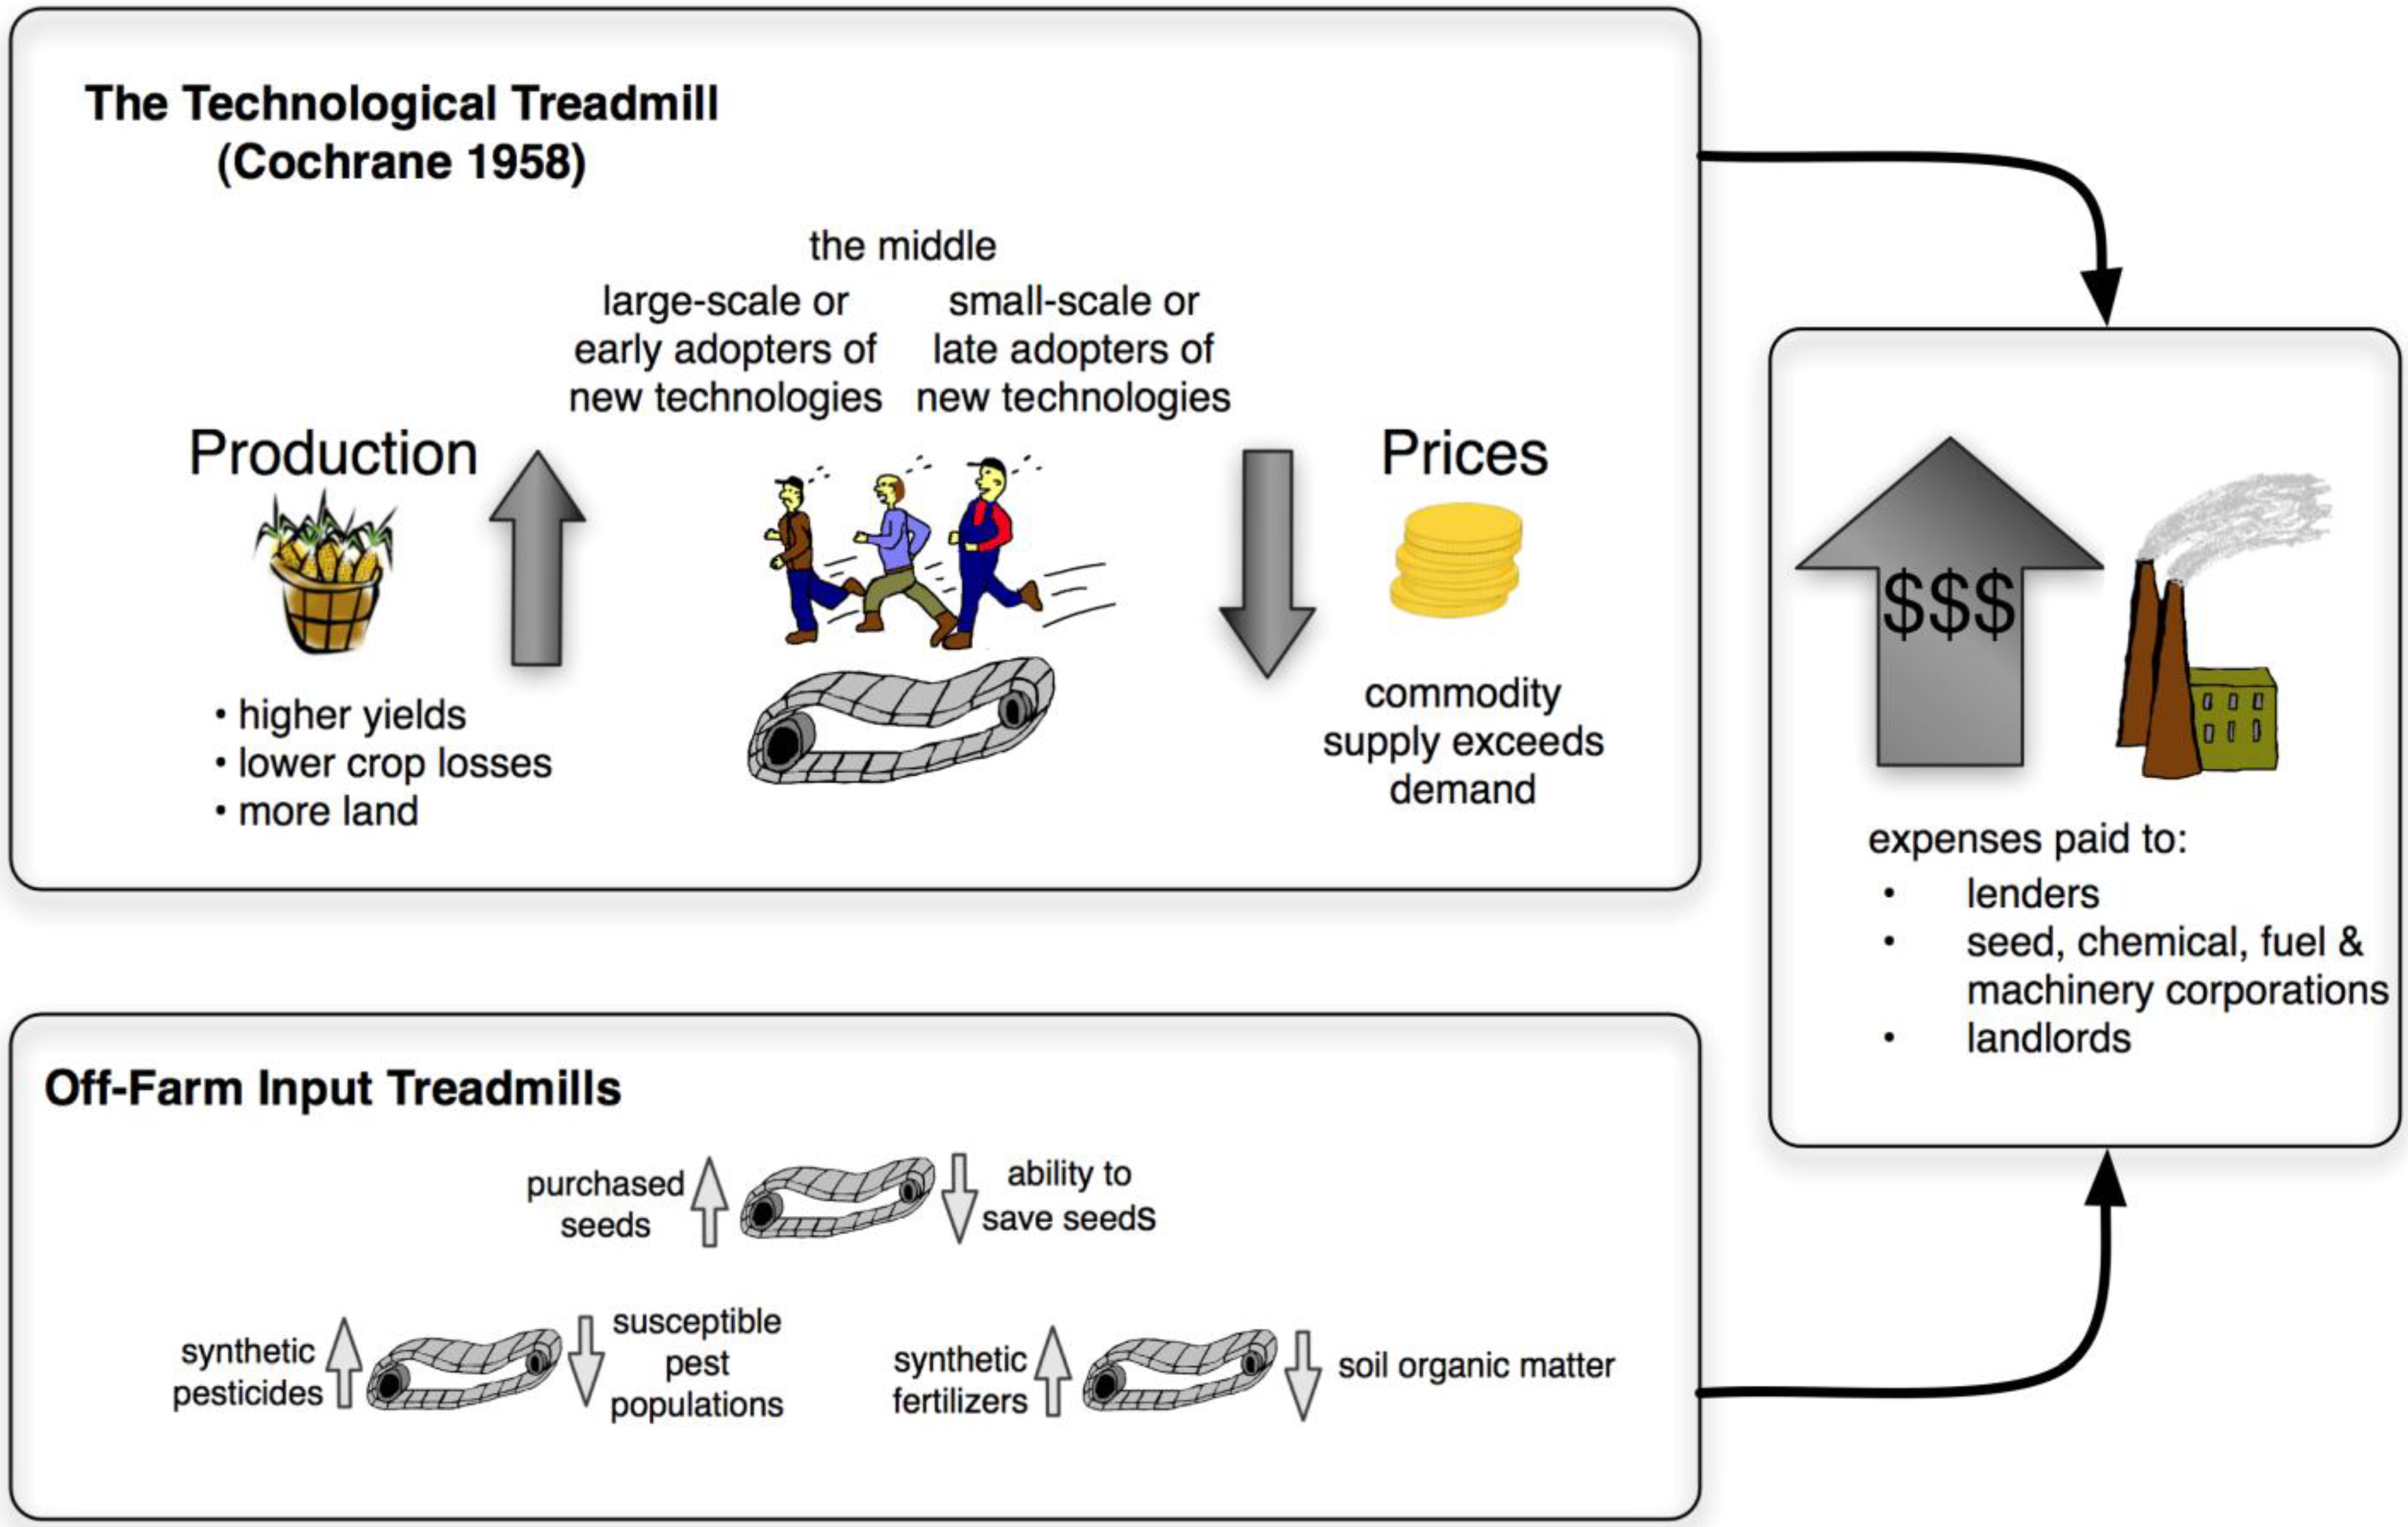
The third treadmill involves purchasing seeds from commercial sources. The legal and biological protections employed by the seed industry, as discussed above, may discourage or prevent farmers from replanting the seeds they buy. In addition, the cultural knowledge of how to save and replant seeds may be lost if farmers do not maintain these practices [2]. As a result, farmers may be increasingly locked in to purchasing these inputs from off the farm, rather than producing them on the farm. While the majority of farmers worldwide still engage in seed saving, the prevalence of this practice is declining rapidly, particularly in industrialized nations [14]. In the United States, for example, the rate of saving corn seed fell to less than 5% by 1960 [10]. Rates of saving soybeans decreased from 63% in 1960, to 10% in 2001 [2]. Although seed saving and replanting is currently more common among wheat growers, just one-third of those recently surveyed in Washington State stated that they engaged in this practice [32].
The net effect of this suite of treadmills is a tendency to spend constantly increasing amounts of money to operate a farm, even if net revenues decline. These rising expenses are paid to upstream participants in the commodity chain, as well as ‘passed through’ to downstream participants (such as grain collectors and retailers) [3,21]. Key upstream beneficiaries include purveyors of off-farm inputs, such as seed, chemical, machinery and fuel industries, as well as lenders. While farm incomes have stagnated, profits in these industries have increased dramatically in recent decades [33].
2.3. Consolidation
With obstacles to accumulation in agriculture eroding, and farmers enrolled in this process via treadmills, agricultural industries tend to consolidate. In other words, industries that begin with a large number of competing firms eventually become dominated by one firm (a monopoly), or more commonly, a small number of large firms (an oligopoly). This is not an inevitable process, but occurs when differential market success accrues additional advantages to leading firms (such as economies of scale) that snowball into even greater market success (often at the expense of their competitors). The process may also be assisted by government policies, particularly when economic power translates into political power: larger firms are more successful in lobbying for government actions that result in an uneven playing field, to the benefit of the big [34]. The result of these positive feedback loops is that circuits of accumulation become even more concentrated, or controlled by fewer and fewer players [35].
An important consequence is that when concentration reaches a certain threshold, the largest firms are able to ensure stable profits by ceasing to compete on the basis of price. This does not require gathering secretly together to fix prices (though this does occur [36]), because firms of this size are able to simply signal their intention to raise prices or restrict output, with others following suit. A rough guideline developed by economists is that when four firms control 40% of a market, it is no longer competitive [35]. In a number of agricultural input industries this threshold has been exceeded in recent decades. It is estimated, for example, that the top four pesticide firms currently control 59% of the global market, and the top four seed firms control 56% of the global proprietary (e.g., brand-name) seed market [14]. The potential for highly concentrated markets to be non-competitive refers primarily to price and/or output, because competition may remain fierce in other arenas, such as expenditures on advertising, and research and development [37,38]. One motivation for continuing competition in these arenas is that they serve as barriers to entry to other firms, thus protecting an oligopoly’s high rate of profit [22,39].
While consolidation has occurred in the past for key commodity crop seeds, the erosion of obstacles to accumulation are allowing this process to expand horizontally, into all seed crops, as well as across multiple agricultural input sectors. The hybrid seed corn industry, which emerged in the 1930s with the advent of high-yielding hybrid varieties as mentioned above, was the first to consolidate. This process accelerated in the 1970s due to enforcement of patent-like protections, which attracted the entrance of chemical and oil companies to add to their portfolio of agricultural inputs [9]. The commercialization of full patent-protected transgenic seeds in the 1990s has triggered greater consolidation in other commodity seeds, such as soybeans and cotton. At first, patented seeds were bundled with other inputs to protect profits in agrochemical divisions—Monsanto’s agreement to purchase their herbicide-tolerant transgenic seeds required farmers to use their proprietary glyphosate herbicide, rather than a generic [5]. Transgenic seeds are increasingly becoming a profit center in their own right, however. In addition, the patent protections of these seeds are being extended to non-transgenic seeds; filing claims on traits identified through genomic sequencing (marker assisted breeding) has encouraged consolidation among non-commodity focused seed companies, such as those specializing in fruits and vegetables. Acquiring firms have paid significant premiums for seed companies in recent years, sometimes exceeding three times annual sales [40]. Although rates of profit in the seed industry are already very high compared to other industries [22], these premiums suggest an expectation of recouping such investments with even higher rates of profit in the future [6].
In addition to horizontal integration (at the same stage of the food chain), acquisition strategies are increasingly extending vertically (through multiple stages) and globally (into new national markets). The goal of vertical integration is to own both the biotechnology research & development companies that hold the patent protections for key traits, as well as the seed companies that sell the actual delivery vehicle for these technologies. Global expansion has been facilitated by international trade agreements that broke down previous national barriers to intellectual property protections, and helped privatize seed markets in countries including China, Brazil and India [9,41]. Transnational corporations have recently acquired, or formed joint ventures with, a number of seed companies in these emerging markets. The broad patent claims allowed by agreements such as the World Trade Organization’s Agreement on Trade-Related Intellectual Property Rights agreement, along with high research, development and legal costs for products that are eligible for such patents, serve as very strong barriers to entry to smaller firms [42]. The top three seed firms currently control 85% of transgenic corn patents, and 70% of non-corn transgenic plant patents in the US, for example [43]. Although the Global South is the locus of the majority of the world’s agricultural biodiversity, the seed industry is dominated by firms from North America and Europe that utilize intellectual property protections to exploit this wealth [25,44].
3. Methods
3.1. Approach
I examine consolidation in the global seed industry with the use of information graphics. By representing the process visually, information graphics facilitate enhanced cognition. The principle underlying this method is 'pre-attentive processing,' or the capacity of our sense of vision to take in large amounts of information faster than could occur through paying conscious attention. For example, it is far easier to distinguish differences highlighted by color, size, position or other pre-attentive cues than when they are simply numeric, as in a text-based table [45]. Burdens on our short-term memories are also reduced by showing both the whole and the part, or showing overall trends with more specific details [15]. By denoting key patterns within complex data sets in such a compact space, visualization facilitates communication with much wider audiences, particularly those outside academia [46]. Visualizations of data are increasingly (re)produced by newspapers, blogs and other forms of mass communication, for example [16].
3.2. Time Period
The time period for this study was selected to begin in 1996, the year that patent-protected, transgenic seeds were successfully commercialized on a large scale. This development triggered increasing rates of consolidation, as noted above. The study ends in the most recent calendar year, 2008. A small number of subsidiaries that were acquired by the largest firms before this time period, and were involved in recent acquisitions, are also represented in the information graphics.
3.3. Data Sources
A key source of data was a chart produced by the Pioneer Hi-Bred Competitive Intelligence Group in 2000 [47]. This information graphic depicts acquisitions and joint ventures of seed companies involving the largest corporations, primarily in the late-1990s. While it is not publicly accessible, the Pioneer chart was briefly circulated in the sustainable agriculture community in early 2000. To reflect the numerous changes that have occurred since, it was significantly revised and updated.
Additional data were obtained from company press releases, annual reports and websites, as well as trade publications, such as SeedQuest [48]. They were verified by a corroborating source if not announced directly by the companies involved. The data collection strategy involved reading relevant documents produced by the largest global seed companies, and conducting keyword searches in search engines using company names (e.g., ‘Syngenta seed acquisition’, ‘Syngenta seed joint venture’) to identify additional documents. This information is therefore quite comprehensive with respect to the largest firms, which are most active in mergers and acquisitions, as well as joint ventures and other types of strategic alliances. It is likely to omit changes involving many smaller, regional seed companies, however. While there are hundreds of such companies in the US, they make up a very small and rapidly decreasing percentage of total seed sales, and most are developing closer relationships with the dominant firms to secure access to transgenic traits [49].
3.4. Data Analysis and Display
To represent the pattern of consolidation over time, an animation of ownership changes during the study period was produced with Social Network Image Animator software [50]. The data were coded in Pajek’s NET format [51] by formatting all firms as a numbered list of nodes (or vertices), and ownership changes involving these firms in each year as a numbered list of arcs. The layout was optimized using the MultiComponent Kamada-Kawai algorithm after initially placing the nodes in a randomly distributed, circular formation [52,53], in order to show ownership relations with form and spatial position. Additional refinements were also made, including encoding categories of firms by color, and market share by size.
A more detailed, static view of ownership changes during this period was produced with Omnigraffle 5.1, a diagramming and charting software [54]. Each firm in this information graphic was labeled, which was not possible in the animation due to the large number of moving entities relative to the display area. The animation data were imported into OmniGraffle after recoding it in DOT language [55]. Ownership relations were encoded in more detail to distinguish full and partial equity. Due to the dense amount of information displayed, separate graphics that focus on more specific aspects of the global seed industry structure were created. OmniGraffle was also used to create a network diagram representing cross-licensing agreements for transgenic seed traits.
4. Results and Discussion
4.1. Overview
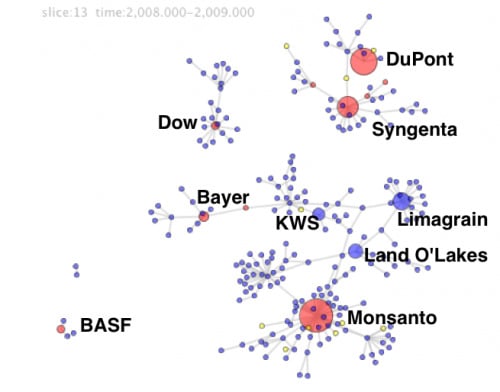
Supplement 1 is an animation of industry changes from 1996 to 2008. Each firm or subsidiary is represented as a circle, and ownership connections, whether full or partial, are represented as gray lines. Pharmaceutical/chemical companies are colored red, seed companies are colored blue, and other companies, such as biotechnology firms, are colored yellow. The upper left shows the year in gray text. During the study period the firms that eventually became the largest acquired or created joint ventures with more than two hundred firms. The entire animation shows that the pace of the acquisitions was fairly rapid in the late 1990s, slowed in the early 2000s (including a brief pause in 2003), but accelerated again in the last five years.
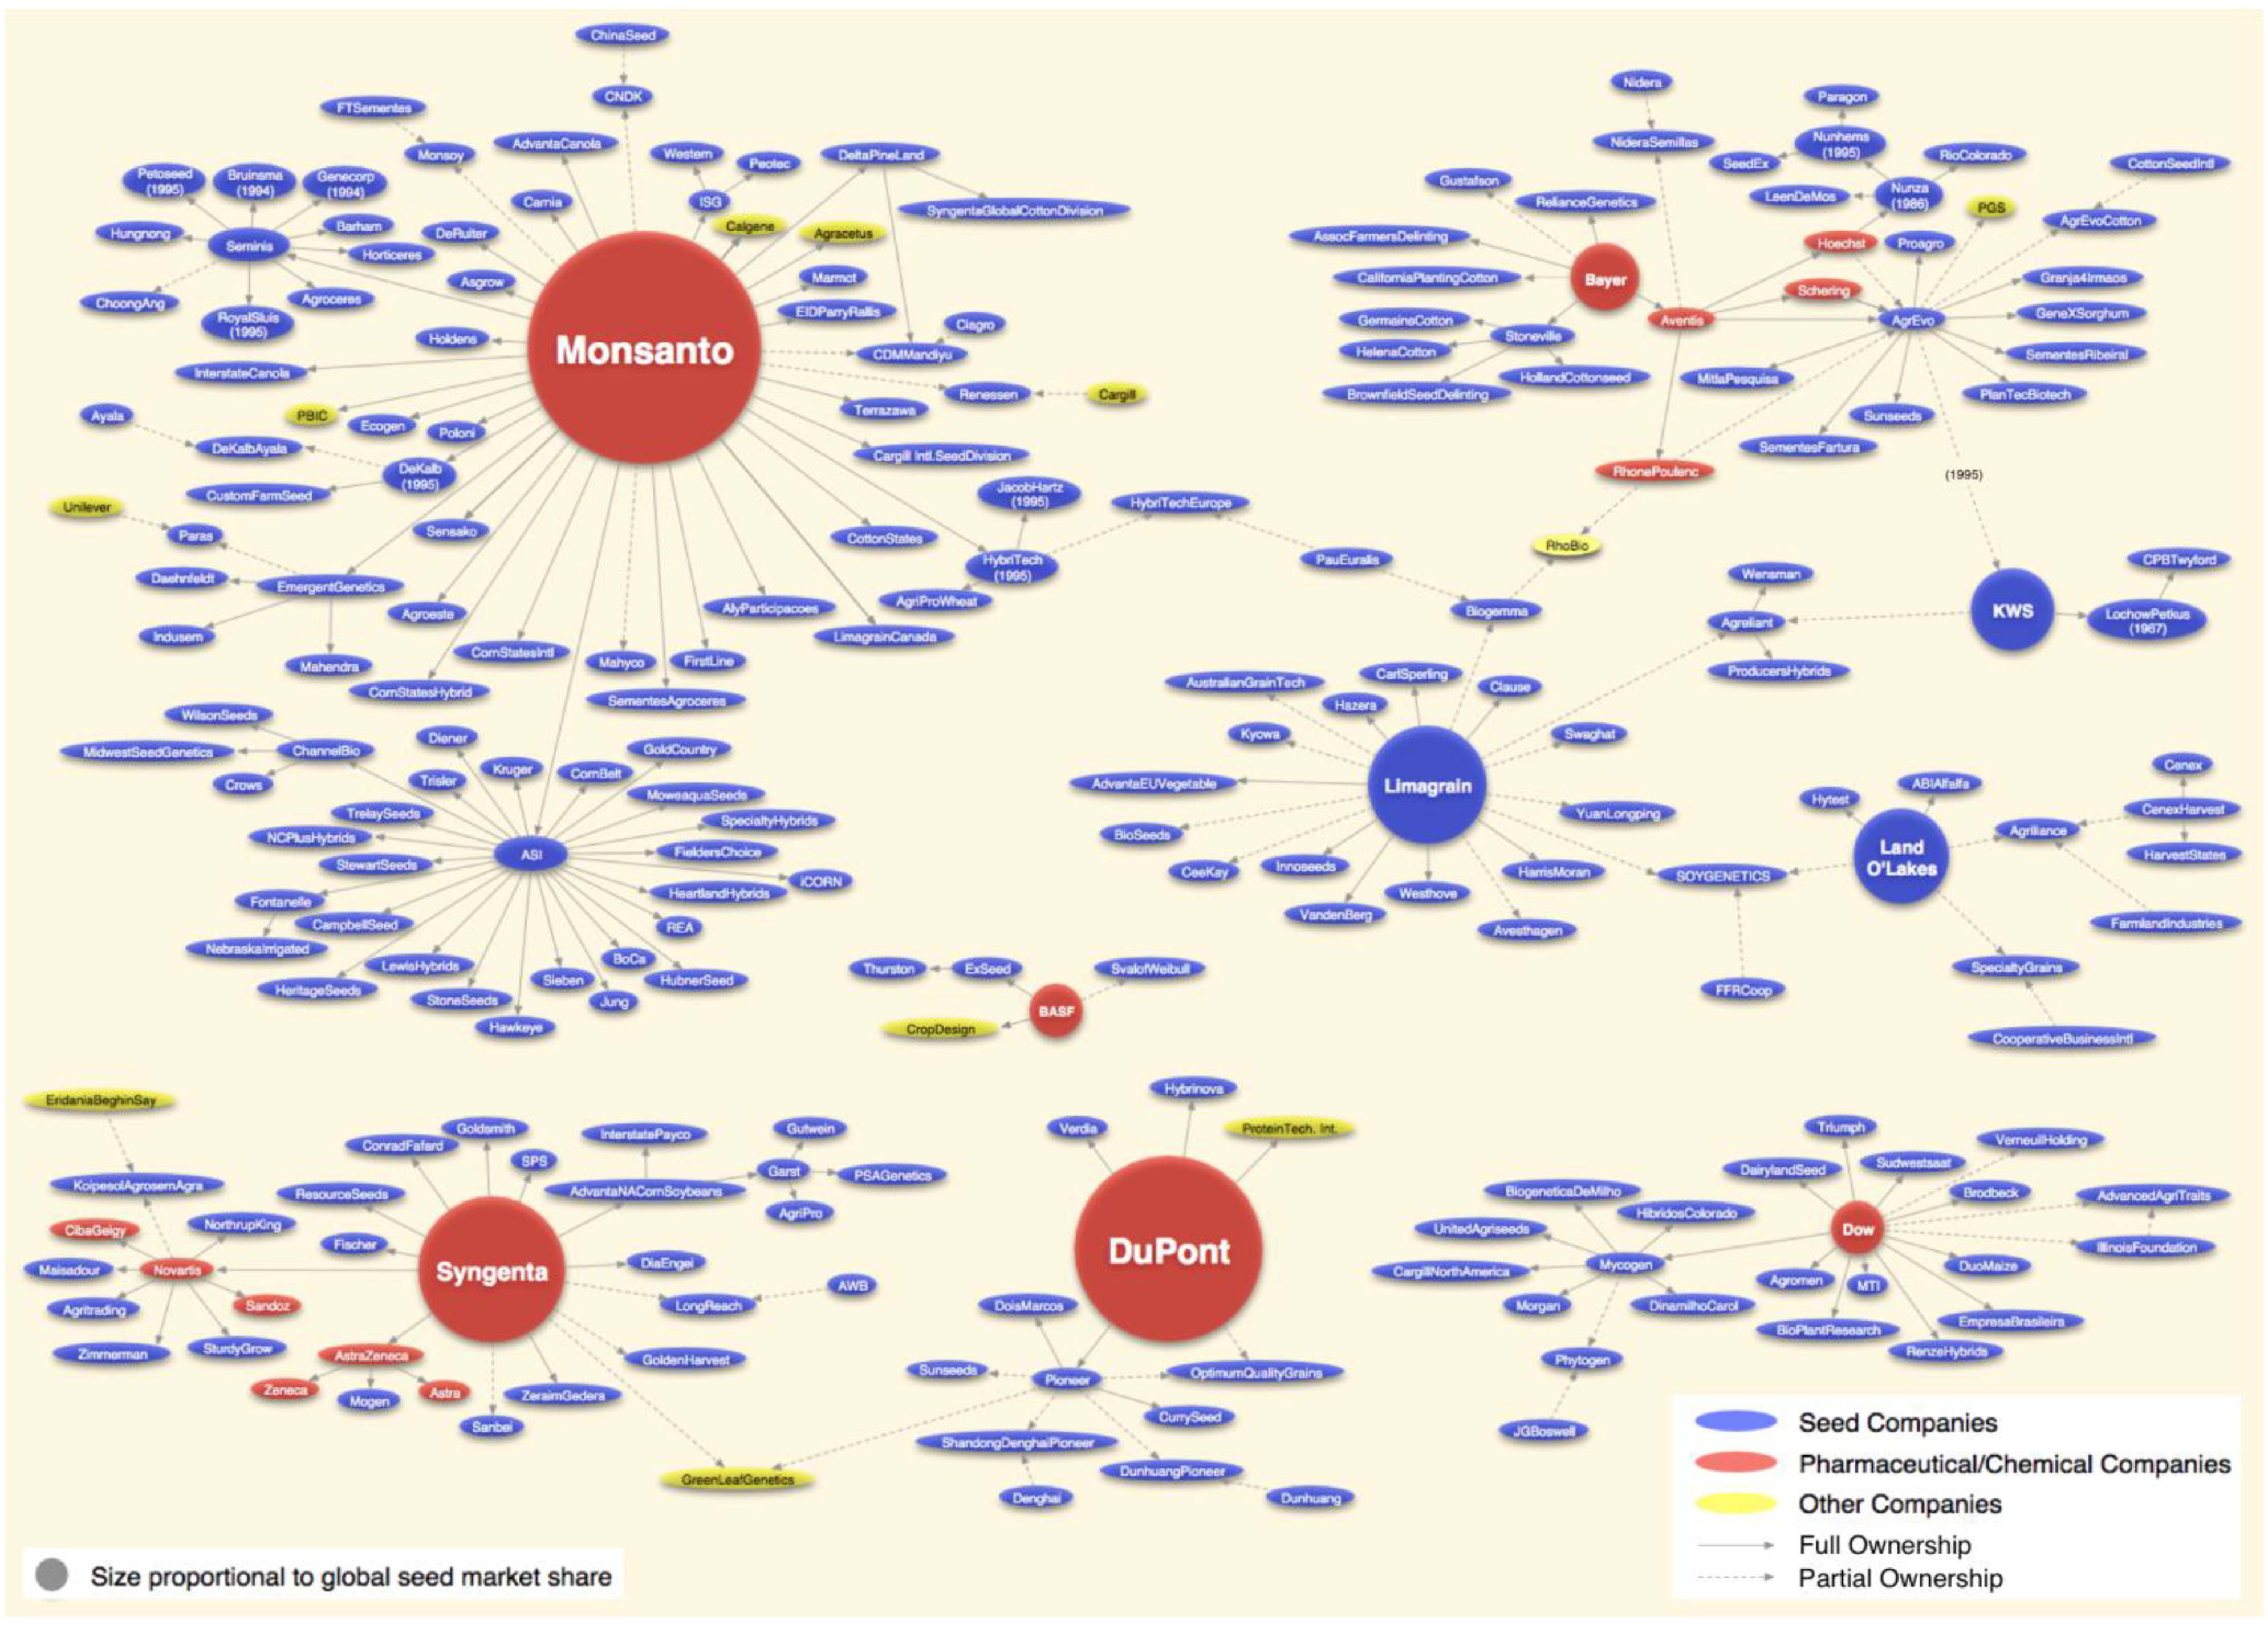
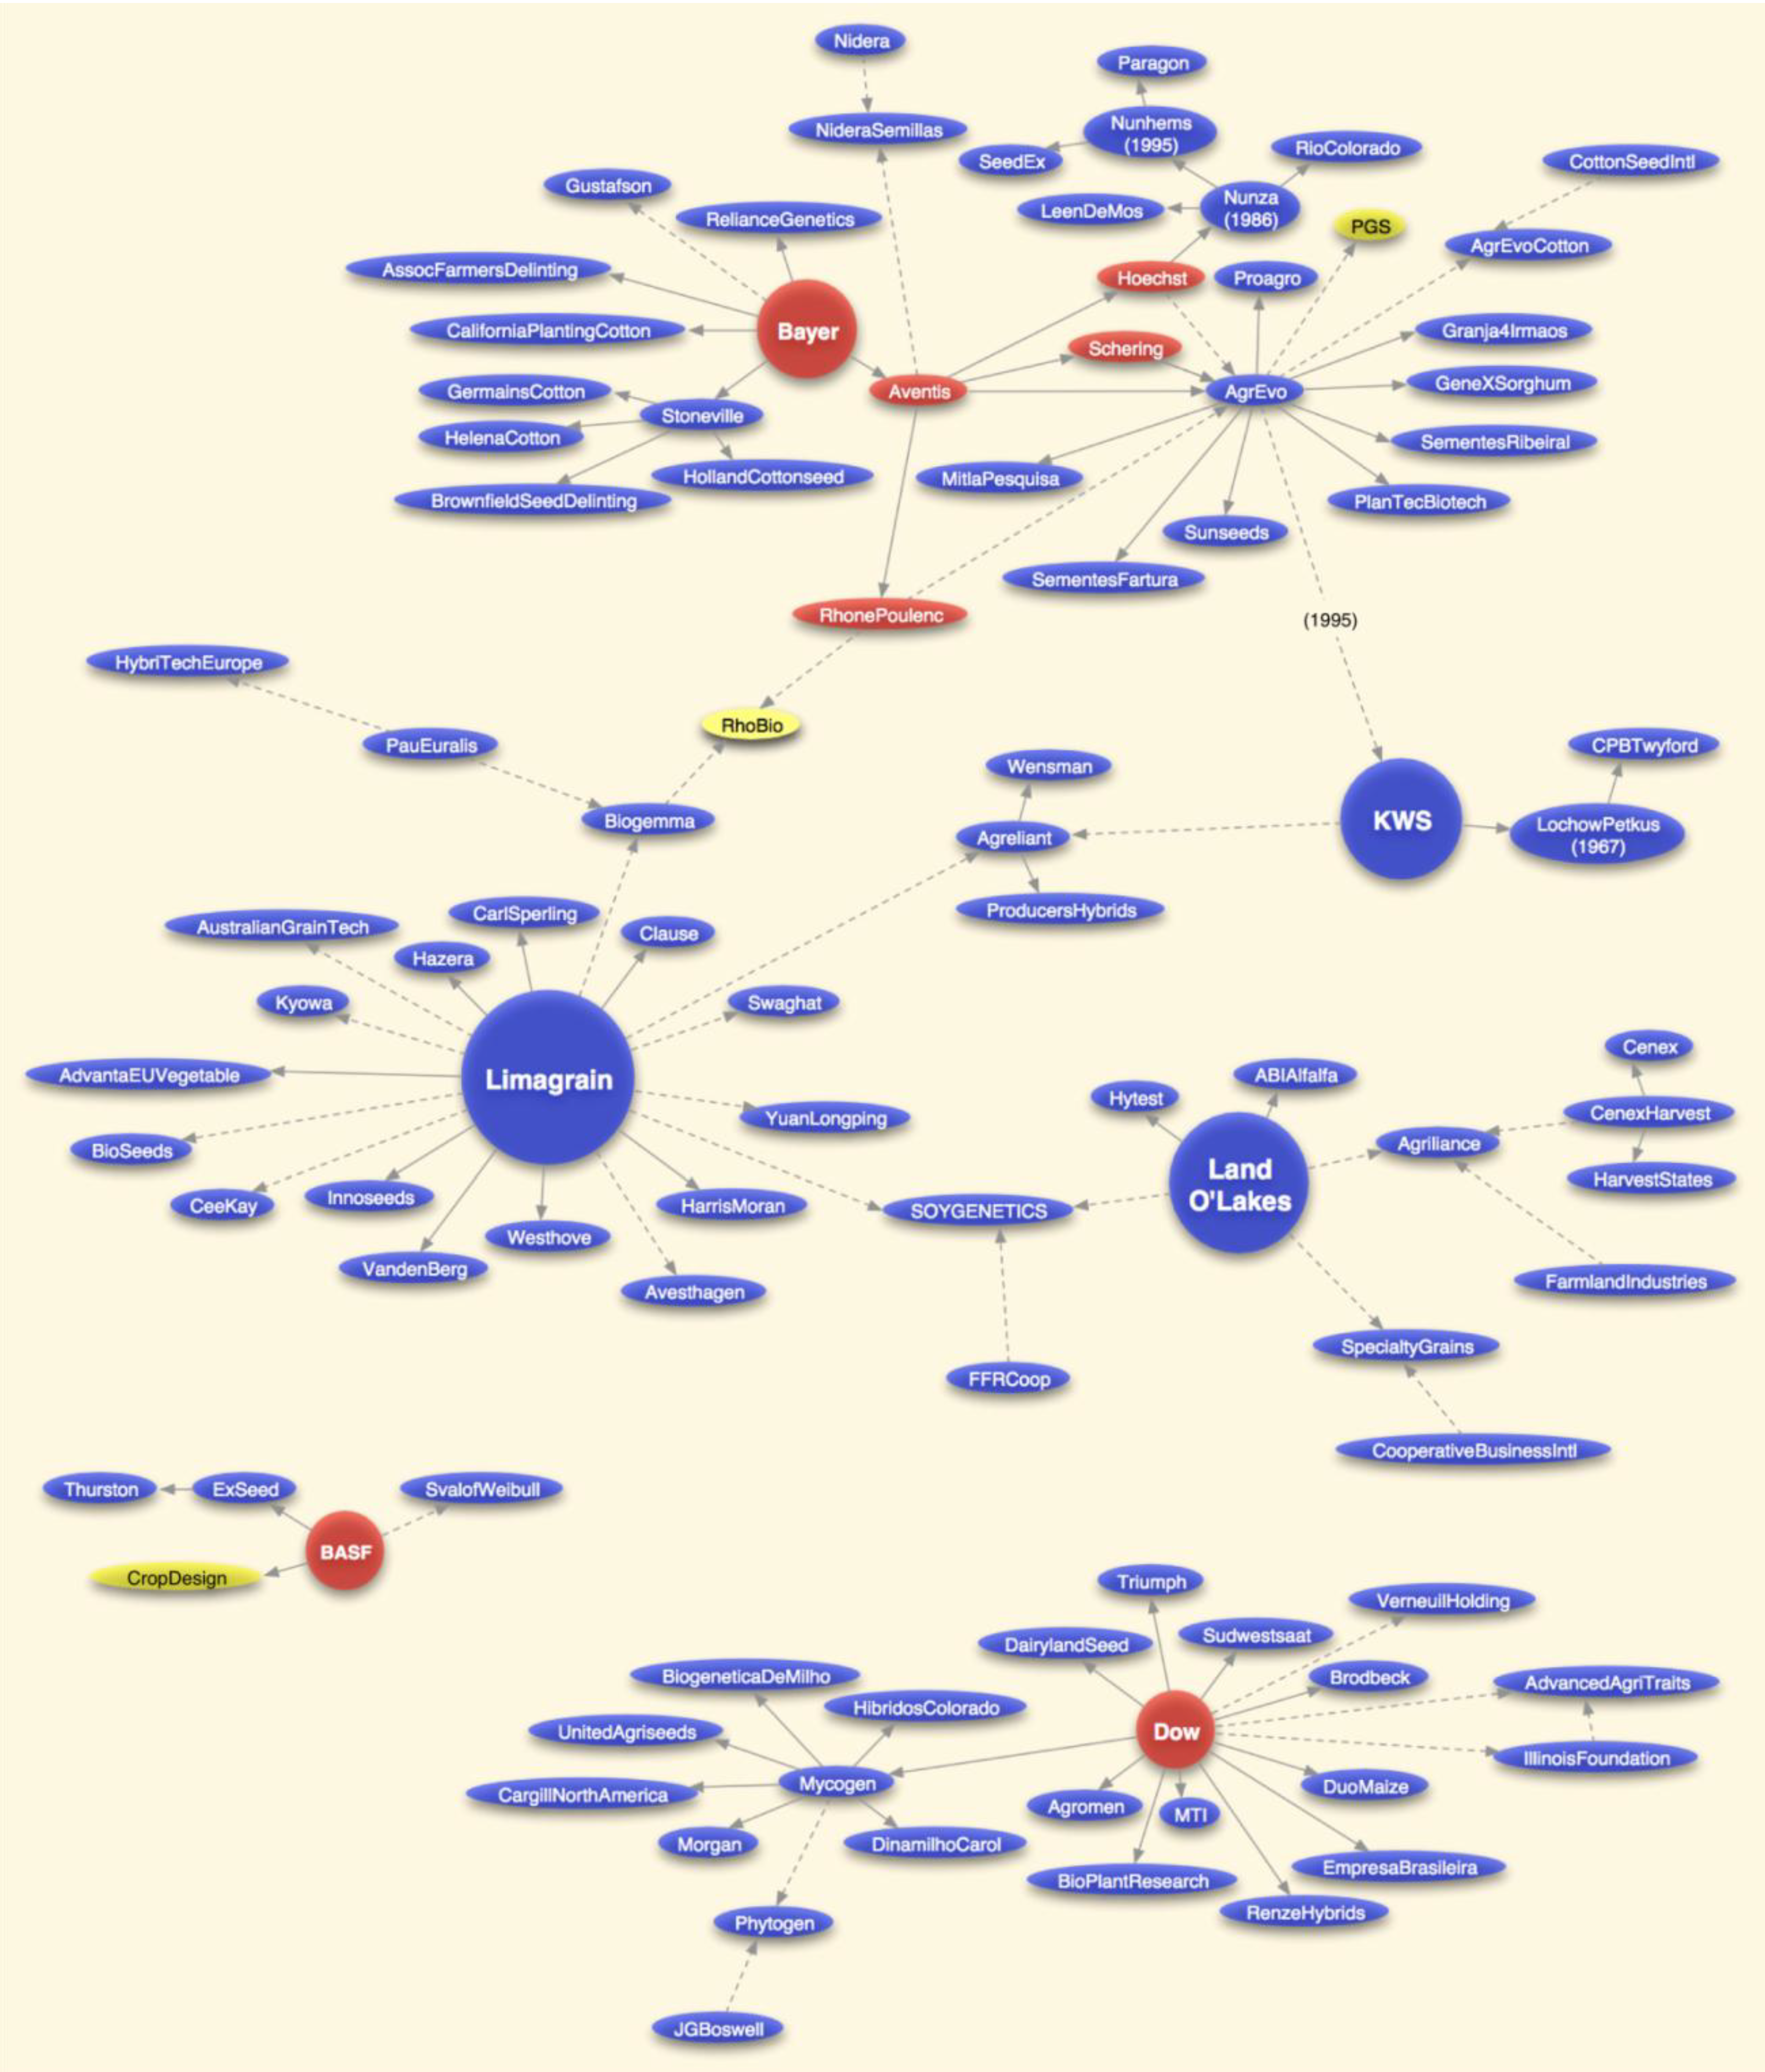
Figure 2.
Seed industry structure, 1996–2008.

Figure 2 provides more detail on changes occurring in the study period, with each firm labeled by name. Parentheses are used to indicate nine transactions occurring before 1996. In addition, full ownership is represented with a solid line, while partial ownership is represented with a dashed line. Figure 2 indicates that while Monsanto has clearly been the most active in making acquisitions, all of the largest firms have contributed to seed industry consolidation. This figure also shows some connections between these key firms through joint ventures. I depict and discuss these patterns in more specific detail below. I first describe the activities of each of the “Big Six” pharmaceutical/chemical corporations during the study period. I then illustrate a web of agreements to cross-license transgenic seeds that link these firms. I follow this with profiles of two cooperatively owned, global seed companies, as well as their ties to the Big Six. Finally, I discuss potential future trends and their implications for renewable agriculture.
4.2. The Big Six ‘Life Science’ Corporations
The decade of the 1990s saw numerous mergers between pharmaceutical and chemical companies, in order to take advantages of potential synergies—these new conglomerations were described as ‘life science’ companies due to their focus on biotechnologies. Eventually these were seen as ‘unwieldy,’ and pharmaceutical and agricultural divisions were re-divided in a number of these corporations [12]. Monsanto, for example, merged with Pharmacia and Upjohn before a new Monsanto division focusing on agriculture was completely spun-off. Syngenta resulted from a merger of the agribusiness divisions of Novartis and Zeneca, but AstraZeneca, which focuses on pharmaceuticals, remains a separate company. Bayer acquired the agribusiness operations of Aventis (itself of merger of Hoechst, Schering and Rhone Poulenc), but Sonofi-Aventis is a financially distinct pharmaceutical company. By 2009, six companies with chemical and/or pharmaceutical company roots remained dominant in the seed industry.
4.2.1. Monsanto
Monsanto was not heavily involved in the seed industry before the mid-1980s, but is now the world’s largest seed company [9]. Patented technologies played a key role in this rapid takeover. US-based Monsanto developed a leading position in transgenic traits through both research & development, and acquisitions of biotechnology companies. In order to deliver these technologies to farmers, as well as increase their access to germplasm, the company made additional acquisitions focused on seed companies, including more than 50 during the study period (Figure 3). Monsanto executive Robert Fraley was quoted in Farm Journal at the beginning of this period, saying, “What you’re seeing is not just a consolidation of seed companies, it’s really a consolidation of the entire food chain” [56]. Monsanto’s near monopoly on commercial transgenic traits gave the corporation leverage to vertically integrate industries both upstream and downstream of farmers, through acquisitions, joint ventures and strategic alliances. One interesting example involves Cargill, a major seed company with few transgenic technologies. Cargill sold its international seed division to Monsanto and its North American seed division to AgrEvo (later acquired by Bayer) in 1998. Cargill and Monsanto then formed a $50 million joint venture in 1999 called Renessen. This allowed Cargill to obtain access to Monsanto’s transgenic seeds and other inputs indirectly, through the downstream grain collection and processing aspects of food and animal feed production. The alliance is one of several emerging ‘food chain clusters’ that increasingly control markets from the gene/seed to the supermarket shelf [39].
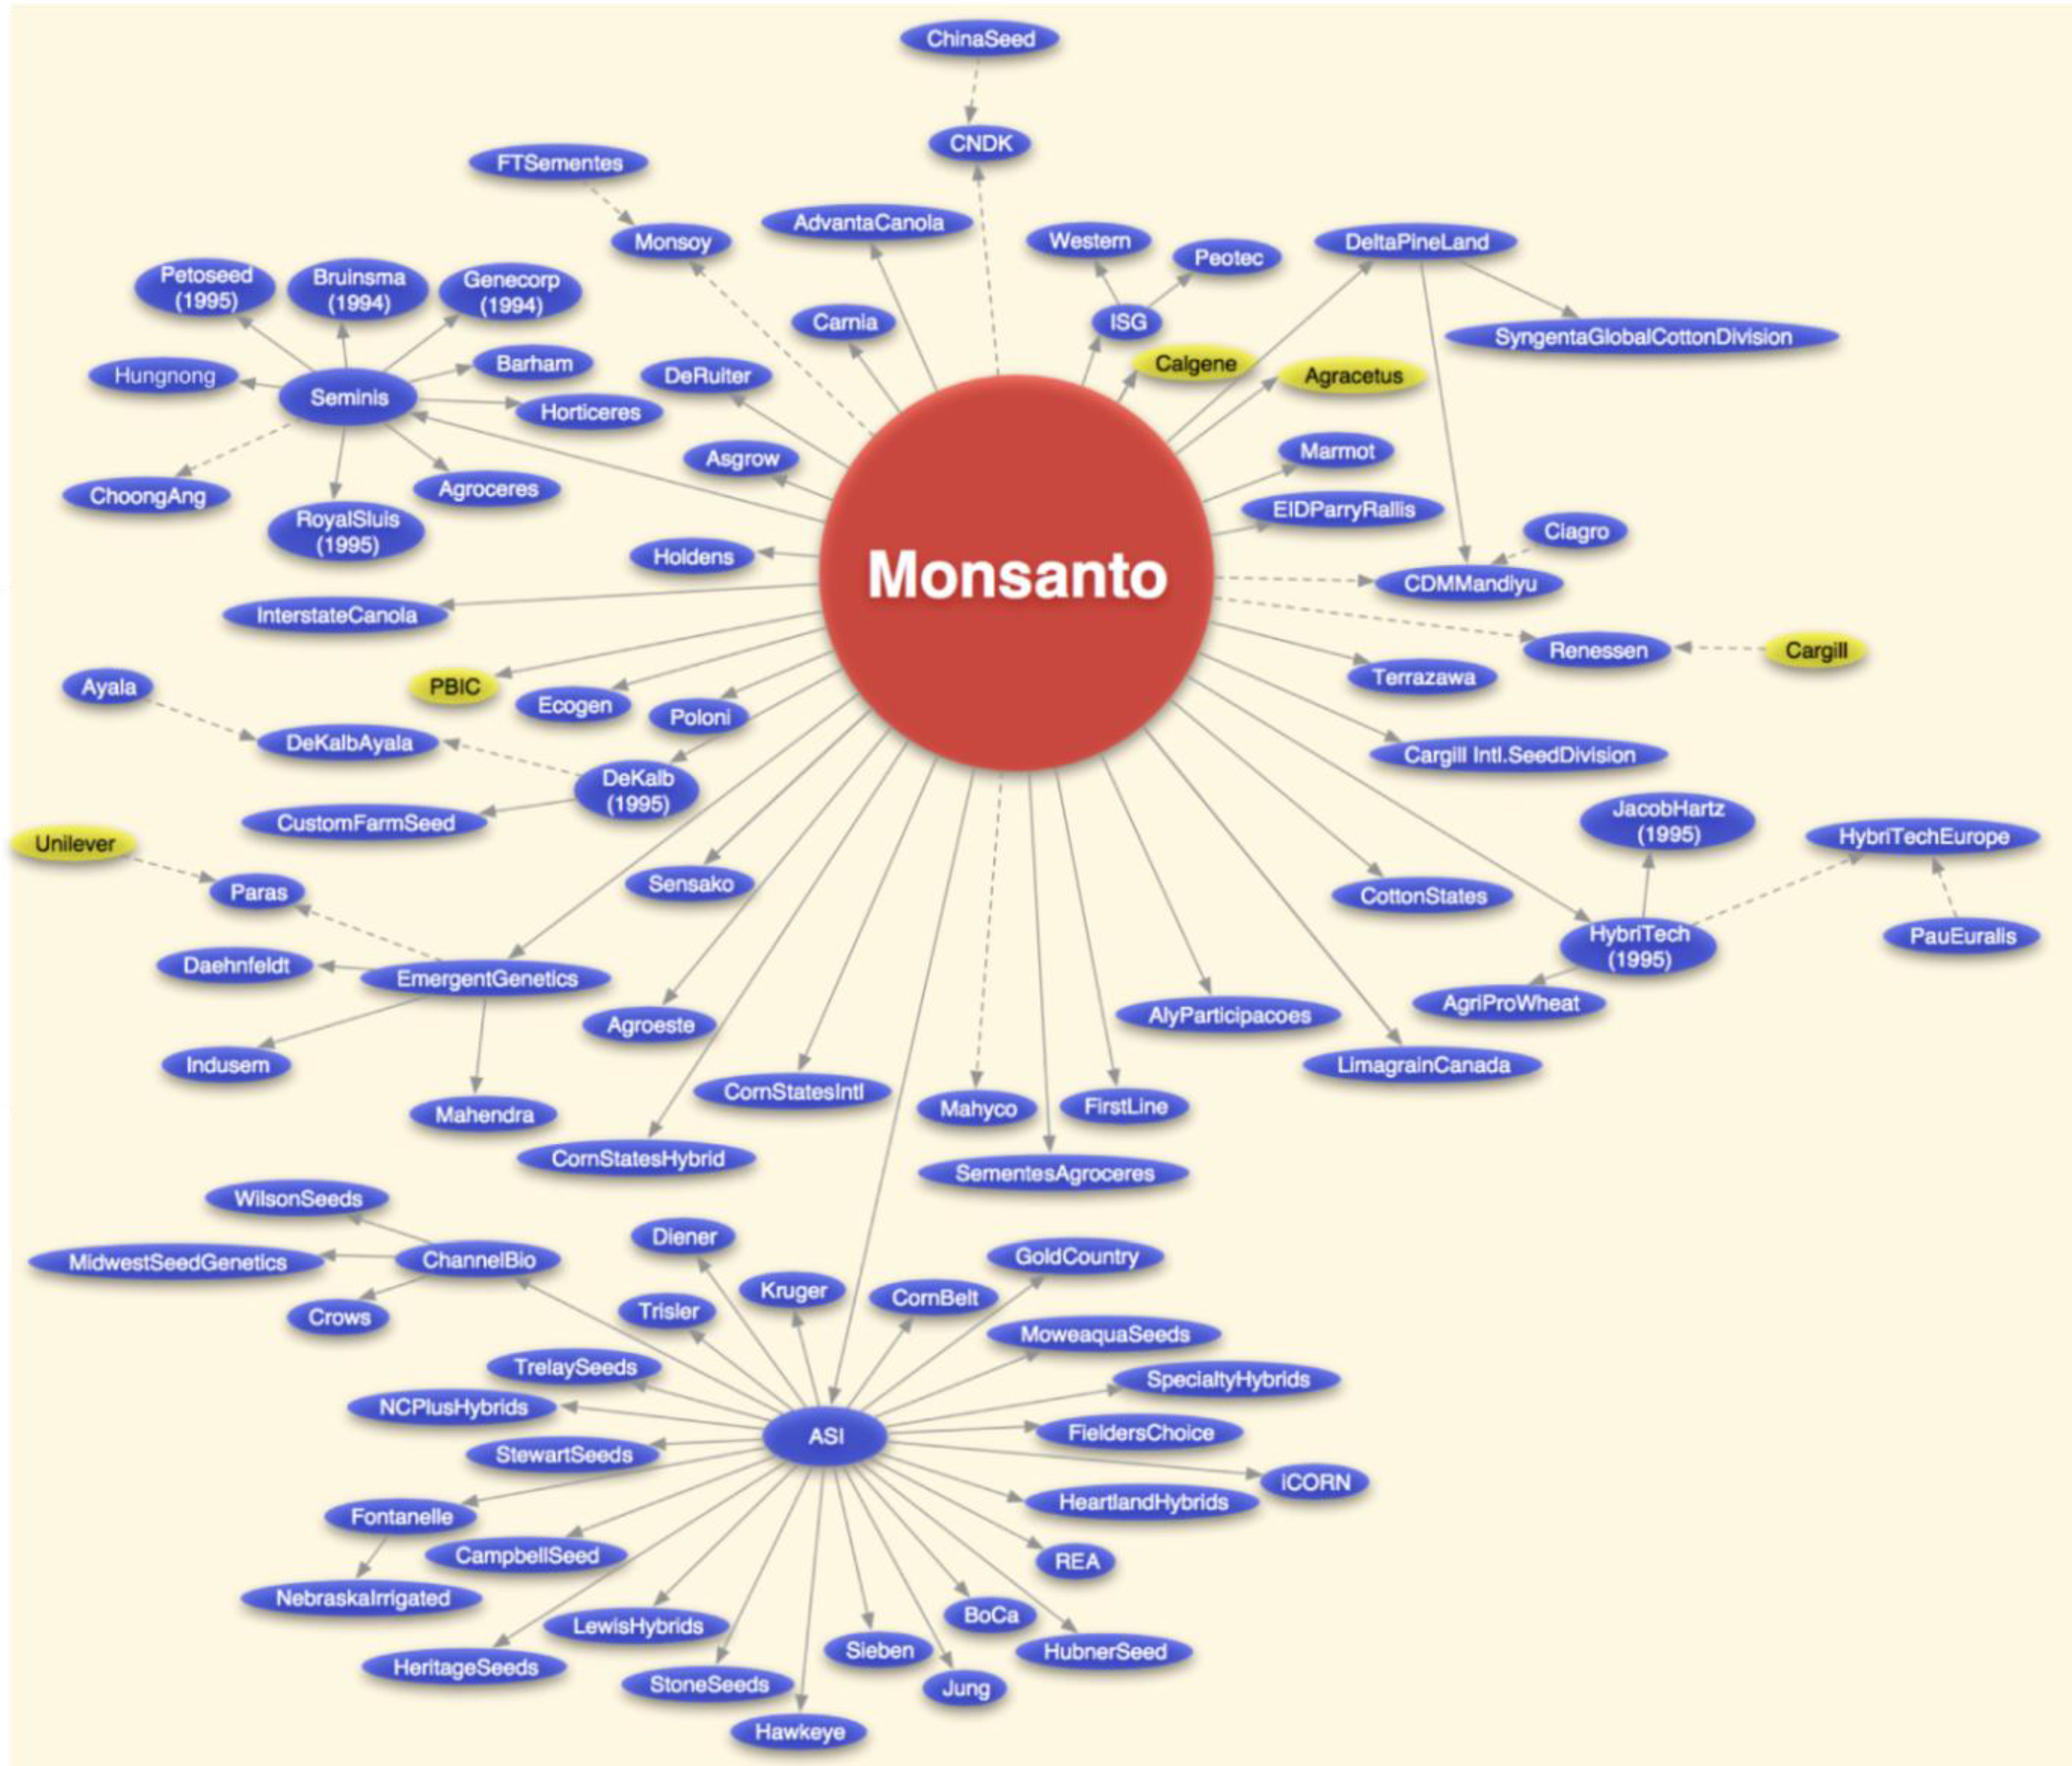
Figure 3.
Monsanto seed company ownership ties.

Monsanto has spent billions of dollars to secure its place at the top of the seed industry, a critical position due to the fact that it is the first link in the food chain. Some of their most expensive acquisitions represented in Figure 3 have included Delta & Pine Land ($1.5B), Cargill’s International Seed Division ($1.4B), Seminis ($1.4B), and Holden’s Foundation Seeds ($1.02B). In addition, DeKalb Genetics Corporation was acquired for $2.5 billion in 1995, just before the beginning of the study period. Monsanto licenses its seed traits to approximately 200 independent seed companies in the US that sell corn or soybeans. The company expects seeds and licensed traits will provide 85% of gross profits by 2012 [57].
Acquisitions by Monsanto are expanding to new types of firms, such as small commodity seed companies, vegetable seed companies, and an increasing number of foreign seed companies. In 2004, Monsanto formed American Seeds Inc. (ASI), a holding company focused primarily on acquiring small, regional corn and soybean seed firms. This strategy gives Monsanto access to more germplasm, while also providing farmers an illusion of choice via the large number of seed brands included in this portfolio. Major vegetable seed company acquisitions include Seminis, which was formed in the mid-1990s by a Mexican billionaire through a series of mergers and acquisitions, as well as De Ruiter Seeds, purchased for $850 million in 2008. The Seminis acquisition alone gave the company an estimated 39% market share for vegetable seeds in the US, 24% in the EU, and 26% globally [58]. Although fruit and vegetable seeds currently comprise 7% of total revenue, Monsanto aims to increase this through alliances with companies like Dole, for branded, increased antioxidant varieties [59]. Some of Monsanto’s recent foreign investments include seed companies in India, Brazil, and China, with many of these taking the form of joint ventures.
Monsanto employs both legal and biological strategies to increase its market power in the seed industry to ensure stable, but increasing rates of accumulation. One example is their aggressive legal enforcement of seed technology agreements, including hiring Pinkerton detectives to identify violators [60]. The acquisition of Delta & Pine Land resulted in ownership of a biological ‘terminator’ technology, although due to public pressure the company has promised not to commercialize it without first consulting “experts and stakeholders, including NGOs” [61]. Monsanto has also been very effective in translating their economic power into political power through methods such as lobbying and the ‘revolving door’ between governments and industry [62]. In 1999, the company was described as a “virtual retirement home” for members of the Clinton administration, for example [63].
4.2.2. DuPont
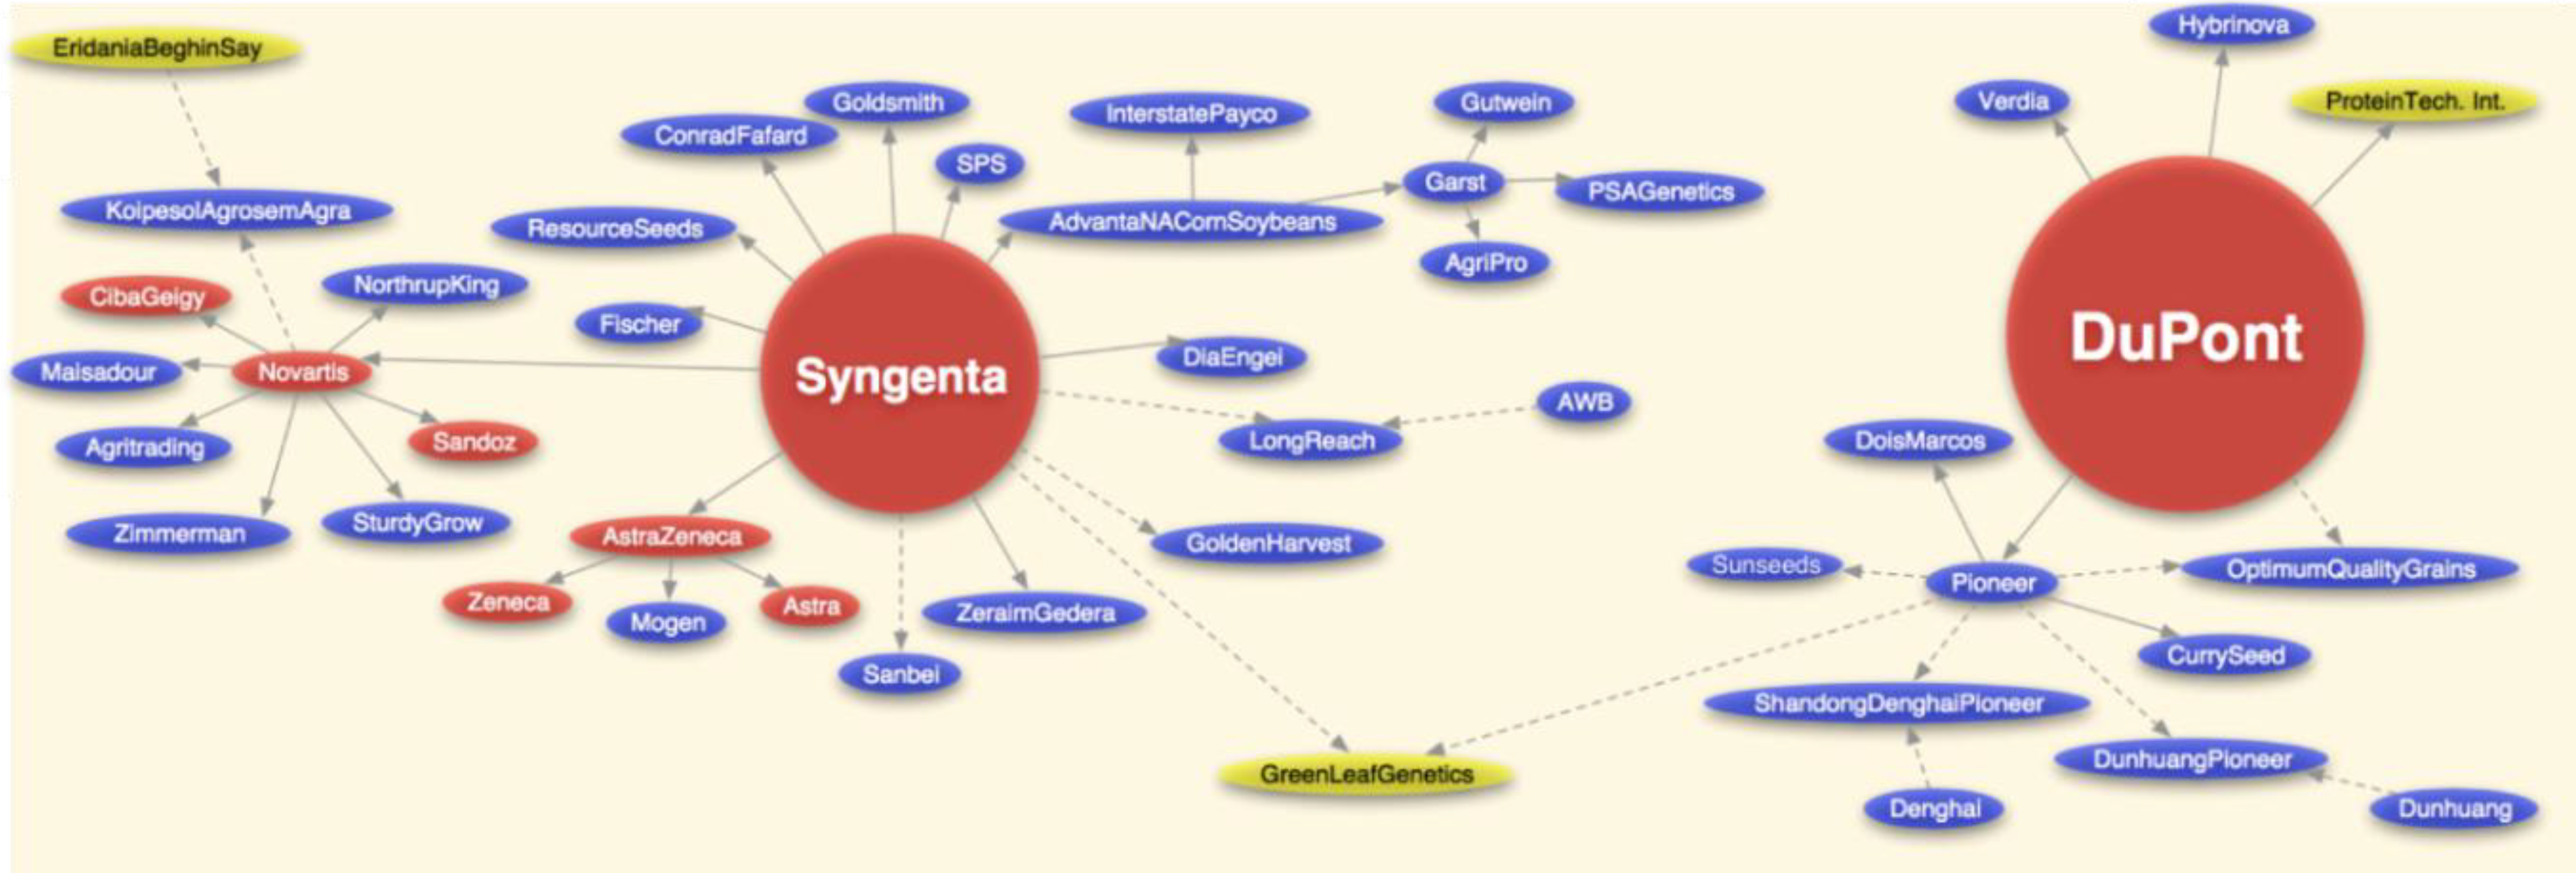
Figure 4 shows changes in ownership involving US-headquartered DuPont, the most significant of which was the acquisition of Pioneer Hi-Bred, the world’s largest seed company at the time. DuPont obtained 20% equity for $1.7 billion in August 1997, and the remaining 80% for 7.7 billion in October 1999. DuPont/Pioneer’s US market share of seed corn has since declined from more than 40% to approximately 30% during the study period, while Monsanto’s share increased from less than 12% to approximately 35% [64]. As the two firms have battled for the top position in the global seed industry, DuPont attempted to block Monsanto’s 2007 acquisition of Delta & Pine Land, and more interestingly, provided funding to the non-profit Organization for Competitive Markets to foment more US government anti-trust action [65].
Figure 4.
DuPont and Syngenta seed company ownership ties.

DuPont has not been as active as Monsanto in making acquisitions in the last decade, and instead has used a different strategy to gain access to seed varieties that it does not currently own. The corporation has entered into customized agreements with some of the largest remaining independent seed companies to share germplasm. These companies, which have a combined US corn seed market share of approximately 5%, include AgVenture, Doebler’s Pennsylvania Hybrids, Hoegemeyer Hybrids, NuTech Seed, and Seed Consultants. The agreements involve co-branding and distribution separate from the Pioneer brand. Dubbed “PROaccess,” this strategy is also being extended to other crops like soybeans, as well as other countries, including Brazil, Mexico and South Africa [66].
4.2.3. Syngenta
Syngenta’s acquisitions and joint ventures are also shown in Figure 4. Swiss-based Syngenta has a 50/50 joint venture with DuPont called GreenLeaf Genetics to sell foundation seed, which is derived directly from the breeder or parent seed, to other seed companies. GreenLeaf Genetics currently has a 3% US market share for hybrid corn, versus a more than 30% share for Monsanto’s Holden’s Foundation Seeds [64].
Oligopoly maneuvers have been compared to the game of gin rummy, with the major players constantly picking up and discarding smaller companies [34]. An example involving Syngenta is Wilson Seeds, which is now owned by Monsanto’s ASI holding company. In 1998 Novartis (which later merged with Zeneca to form Syngenta) obtained 50% equity in Wilson Seeds from Land O’Lakes. Syngenta kept Zimmerman Hybrids, which was previously acquired by Wilson Seeds, however.
In 2003 Syngenta began to extend the strategy of bundling transgenic seeds and proprietary chemicals to its non-transgenic seeds. UK farmers that purchased a new hybrid barley seed were required to also buy a package of plant growth regulators and fungicides [67]. This heightened concerns first raised by transgenic seed agreements, that seed/chemical companies would use their oligopoly power to increasingly dictate production decisions to farmers through contracts [68]. This could eventually result in grain production and other forms of agriculture following the poultry model, which makes farmers essentially low-paid, hired laborers on their own land [69].
4.2.4. Bayer
Figure 5 shows the activities of German-headquartered Bayer, which has recently been very active in acquiring cottonseed companies. One of these acquisitions, Stoneville, was purchased from Monsanto for $310 million in 2007. Monsanto was forced to divest Stoneville by the US Department of Justice as a condition for acquiring Delta & Pine Land. Monsanto had already divested this firm once before, during its first failed attempt to acquire Delta & Pine Land in the late 1990s, only to purchase it again in 2005. Bayer’s previous seed company holdings were largely due to its purchase of Aventis, particularly its AgrEvo subsidiary. This division has a 15% stake in KWS SAAT, a German seed company that is also among the top 10 globally.
Figure 5.
Other key seed company ownership ties.

4.2.5. Dow
While Dow has a relatively small share of the global seed market, Figure 5 indicates the US-based firm has also been very active in making acquisitions and developing joint ventures, especially in the last several years. A Dow spokesperson, Ted McKinney, said in 2007, “In our view you do not have to fully own each segment of the value chain so long as you have access to it. We lead with the idea of partnering, alliances and joint ventures.” By increasing access to germplasm in this manner the goal is to shift corporate revenues from 95% chemicals and 5% transgenic seeds in 2004, to 50/50 by 2015 [70].
4.2.6. BASF
BASF, a German-headquartered corporation is another Big Six firm represented in Figure 5. While it is among the smallest of these pharmaceutical/chemical corporations in terms of global seed market share and number of acquisitions, it holds patents on a number of transgenic traits oriented toward climate change. BASF has an agreement with Monsanto to spend up to $1.5 billion on engineering stress-tolerant corn, soybeans, cotton and canola, for which the two companies currently control almost half the patents [71].
4.2.7. Cross-licensing
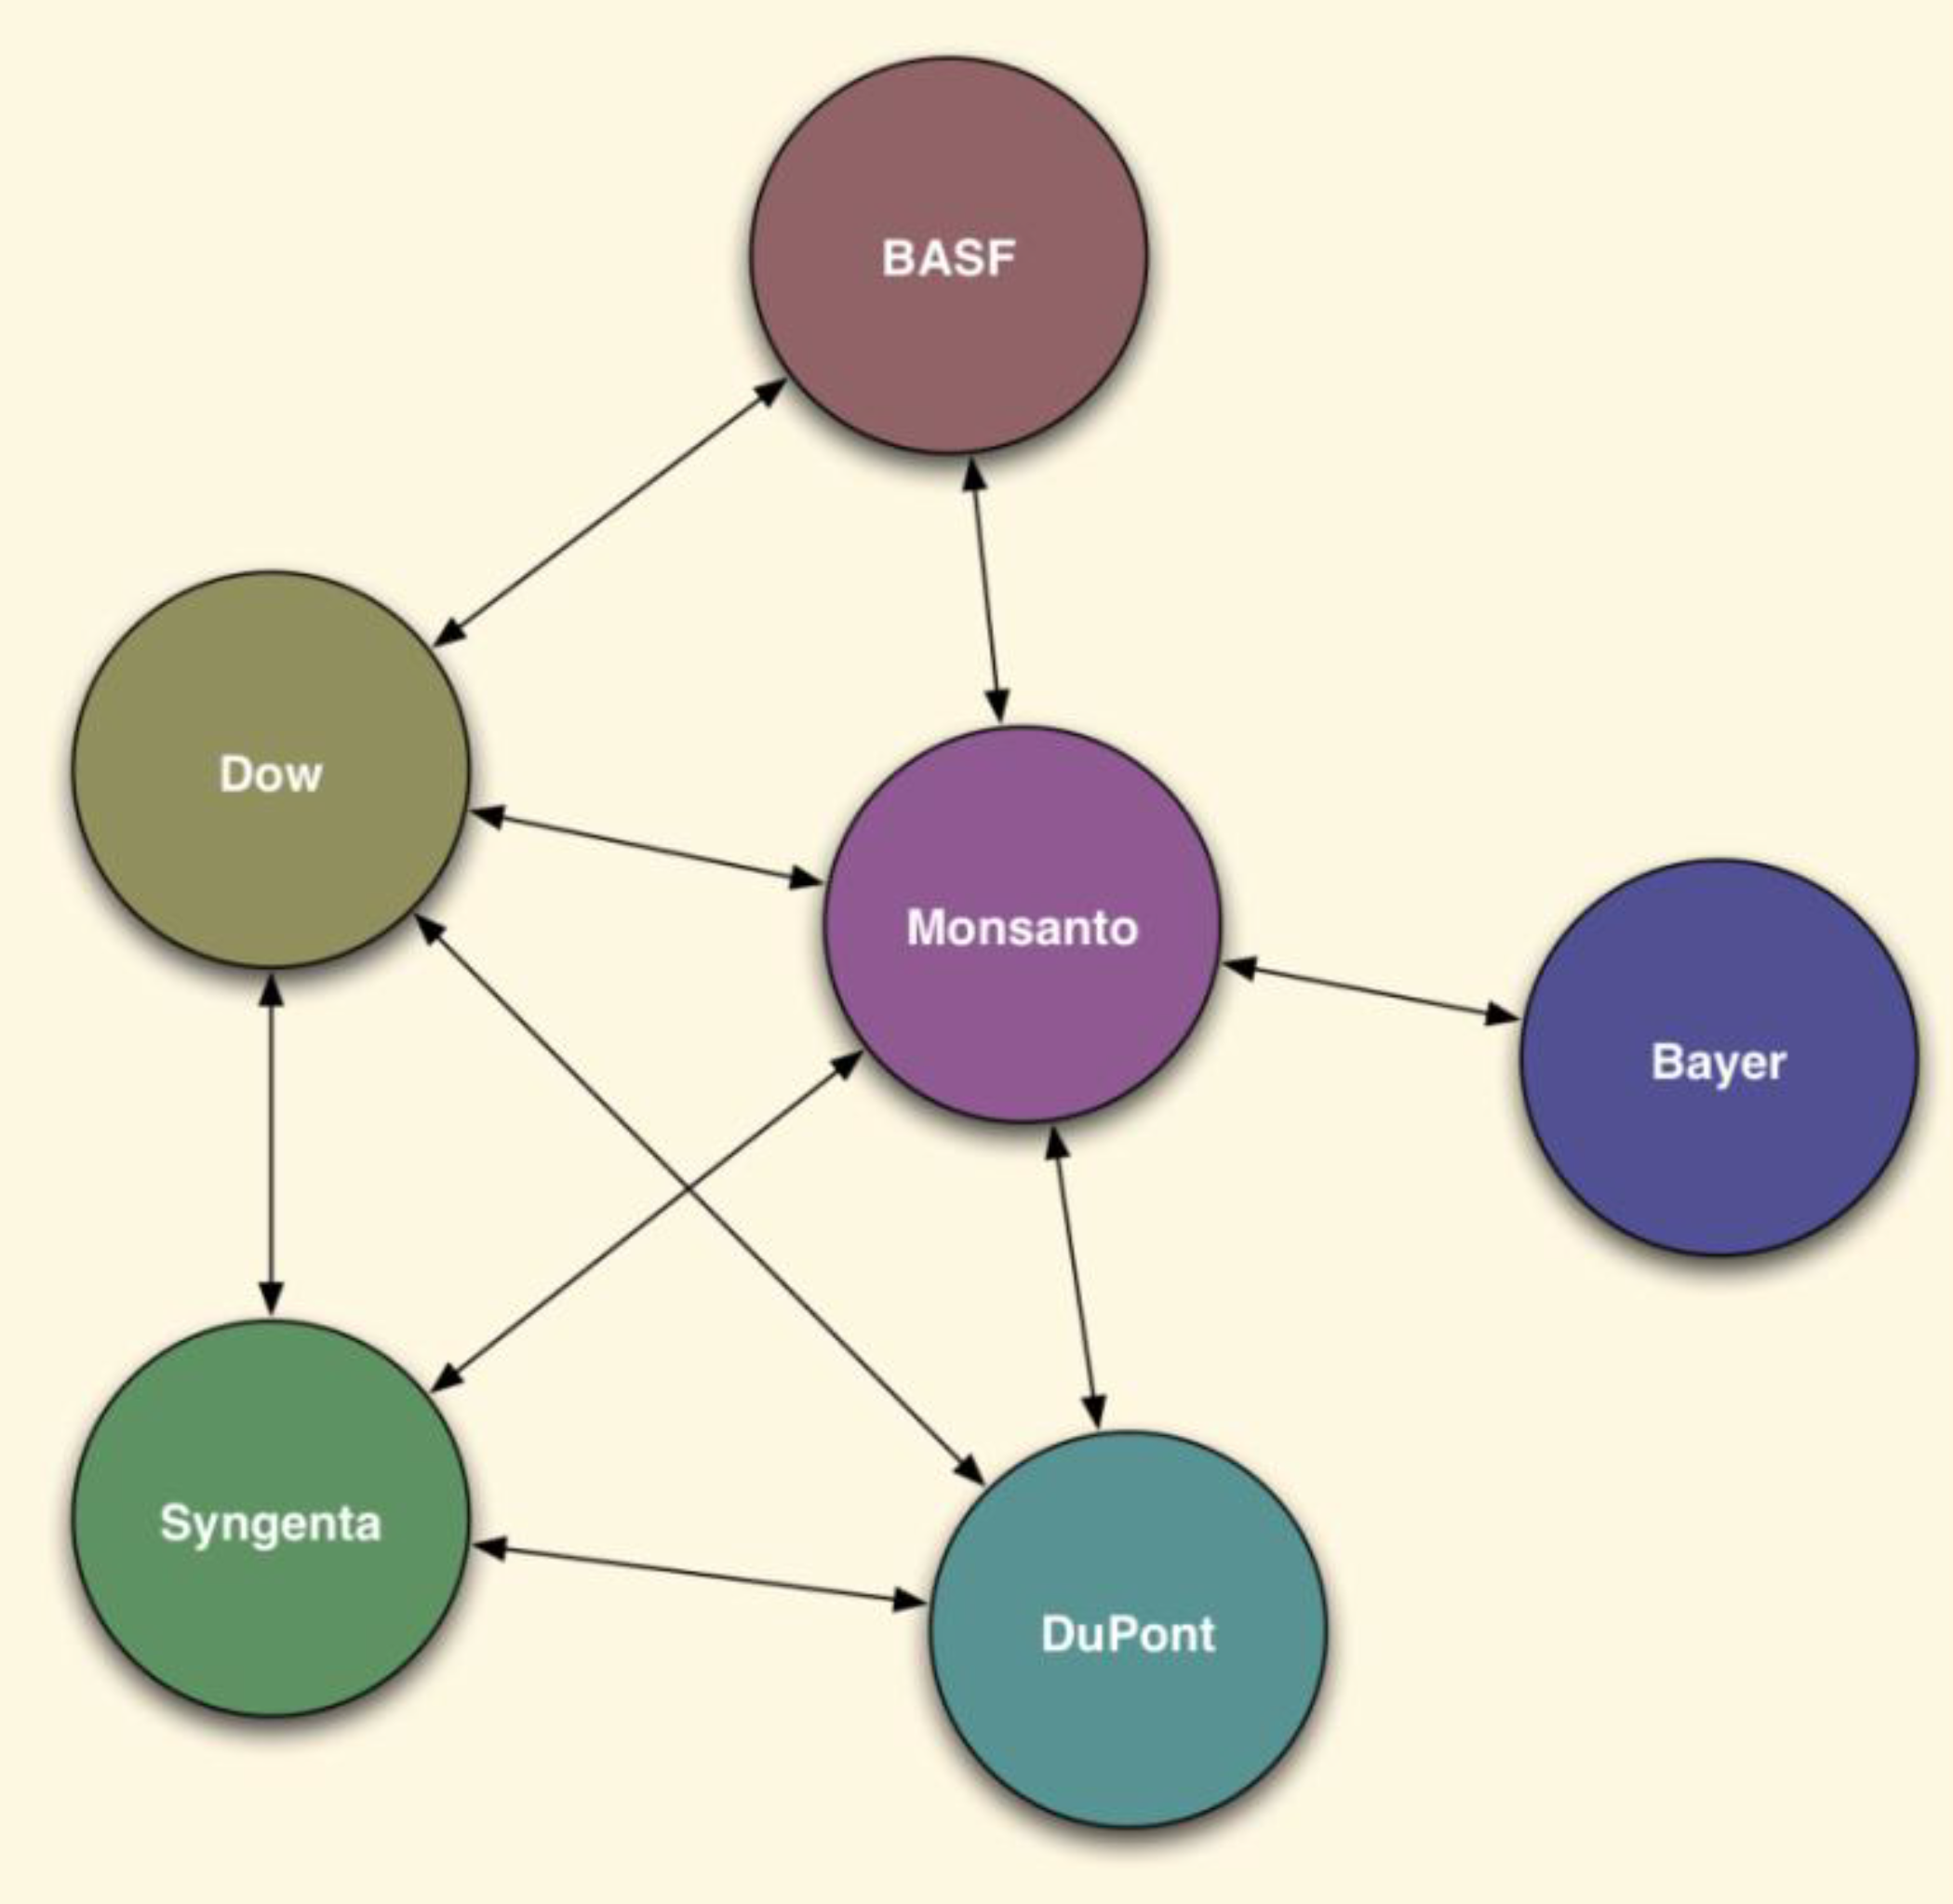
The figures discussed above, which focus on ownership, may understate the amount of consolidation that has occurred in the seed industry when cooperative agreements between these firms are taken into account. Figure 6 shows cross-licensing agreements involving pharmaceutical/chemical companies for transgenic seed traits. These have been described as “non-merger mergers” by the ETC Group, because they do not involve change in ownership, but raise questions about cartel behavior [14,25]. Monsanto has a central position in this network, as it is the only firm to have agreements with each of the other 5 firms. This is due to its near monopoly on transgenic traits, as mentioned previously. One estimate suggests that more than 80% of the land planted with major field crops in the US contained transgenic traits owned or licensed by Monsanto [72], although the company downplays this market power. Cross-licensing agreements have increased recently with the advent of stacking multiple transgenic traits within a single seed. Monsanto and Dow (the latter has agreements with every firm except Bayer) for example, plan to commercialize a corn seed that has eight different transgenic traits in 2010 (combinations of three traits are already in widespread use).
Figure 6.
Big Six cross-licensing agreements for transgenic traits.

This cooperation has occurred even as many of the Big Six firms have periodically engaged in expensive litigation against each other [13]. One current patent dispute involves Monsanto’s attempts to prevent DuPont from employing its Roundup Ready traits stacked with DuPont’s own technologies, without paying extra licensing fees. Monsanto allegedly tried to take cooperation beyond the legal limits in the mid- and late-1990s, when the company pressured Pioneer, Novartis and Mycogen to increase retail prices for licensed seed [73]. This potentially anti-competitive behavior might not have come to light without the motivating factor of strong disagreements in other areas. Acquisitions are one way to resolve these problems, however: Monsanto’s opposition to a broad patent on transgenic soybeans was immediately dropped after it purchased the company that held it (Agracetus) in 1996.
4.3. Cooperatively-Owned Global Seed Companies
Figure 5 shows changes in ownership involving Limagrain and Land O’Lakes, both of which have origins as farmer-owned input supply cooperatives, and are now global seed companies. Limagrain is based in France, while Land O’ Lakes is based in the US.
4.3.1. Land O’Lakes
Land O’Lakes joint ventures include 50% equity in Agriliance, which with Cenex Harvest States (CHS), markets agricultural inputs through a network of cooperative and independent dealers. In 2007 Land O’Lakes took responsibility for the distribution of seeds and fertilizers, while CHS focused on pesticides. Another cooperative, Farmland Industries, had a 25% stake in the venture but sold it to CHS upon bankruptcy in 2004. Land O’Lakes currently operates more than 50 countries. One major challenge they face is keeping pace with developments in patent-protected seeds, which has necessitated increasingly strong ties to Big Six firms. Company president John Crabtree explained the motivations behind a joint venture with Syngenta when he stated, "With Land O'Lakes we had a tremendous livestock production and marketing resource, but we lacked that same expertise in research, particularly biotechnology. While a lot of big players currently make their technologies available to regional seed companies at a price, the future is less certain for use in specialty crops. We needed a more significant connection than that" [74]. Through their Croplan Genetics brand, Land O’Lakes currently sells both Syngenta and Monsanto seeds. Land O’Lakes and DuPont/Pioneer are the only major seed companies that provide agronomic services to farmers [75].
4.3.2. Limagrain
Limagrain’s subsidiary Vilmorin, is the fourth largest seed company in the world, with numerous seed brands targeted at home gardeners (vegetables, fruit, flowers). Limagrain is rapidly expanding geographically, in part through acquisitions and joint ventures involving seed companies from the Netherlands, UK, Germany, US, Canada, Japan, India and China. The cooperative has joint ventures with Land O’Lakes and KWS, as well as indirect ties to Monsanto and Bayer through a majority stake in Biogemma, a company that focuses on transgenic traits.
4.4. Future Trends?
In the absence of significant changes in the forces affecting the global seed industry, I expect consolidation to continue at a rapid pace. Industry analysts note that for remaining independent seed companies “many of them may have to consider strategic alliances or exit strategies [76].” Based on trends in other industries, this will eventually result in a stable oligopoly, with perhaps as few as 2 to 4 firms or clusters of firms [34,35]. Monsanto is most likely to remain as one of these, due to its dominance in traits with intellectual property protections, and willingness to aggressively and strategically exert their economic and political power to increase profits. The pharmaceutical/chemical/seed oligopoly has already achieved high market shares for major crops in industrialized countries, as well as in countries with large, emerging markets. Strategies of accumulation will continue to extend the commodification process to all seeds, and an increasing number of countries, however [3]. In addition, oligopolies will become even more dominant across multiple farm input and output sectors through the further coalescence of food chain clusters [35].
4.5. Implications for Renewable Agriculture
Long-term sustainability requires that farmers and gardeners have the ability and means to produce food free from heavy reliance upon off-farm inputs. Seeds are especially important inputs, as they are the very foundation for reproducing the majority of plants consumed by humans and livestock. Renewable agricultural practices of seed saving and replanting are nevertheless at direct odds with increasing profits in the global seed industry. Agricultural treadmills have been very effective at discouraging renewable practices and bringing farmers into circuits of capital accumulation. From 1910 to 1975, for instance, the ratio of purchased to self-generated inputs increased 500% in the US [21].
Continued consolidation will further entrench these agricultural treadmills, making this situation much more difficult to change. The increasing market power of the most profitable firms can be exercised in multiple arenas, such as changing national and international regulations, in ways that diminish the prospects for renewable agriculture [25]. This occurs primarily by reducing choices for farmers interested in obtaining seeds that are compatible with self-reproduction and other sustainability goals. Some of these reduced choices include decreasing access to non-patented (and non-transgenic) seed varieties, genetically diverse germplasm, and innovative varieties [11]. To the extent that stronger intellectual property protections are tied to contracts that remove management decisions from farmers, options are likely to be reduced even further. Seeds are increasingly bound to agricultural practices that promote unsustainable topsoil depletion, monocultures, contamination of ecosystems, and high fossil fuel and water consumption. Furthermore, if increasing oligopoly power is exerted to raise seed prices [49], those with strong commitments to sustainability, rather than narrow economic goals, may be most economically vulnerable to falling off the farming treadmill.
5. Conclusions
This article employed information graphics to visualize the broad scope of mergers, acquisitions and joint ventures occurring since the mid-1990s. It also illustrated the cross-licensing agreements between the Big Six corporations for sharing transgenic traits. Recent trends were interpreted in light of theories of eroding obstacles to accumulation in the agriculture sector, dynamic treadmills that enroll farmers in this process, and consolidation to reduce competitive threats to accumulation. These theories help to explain why seed industry consolidation is rapidly expanding in new directions—horizontally, vertically and globally. The result is increasing monopoly/oligopoly power for a decreasing number of transnational corporations. This concentration of power is fundamentally incompatible with renewable agricultural practices that are barriers to large-scale capital accumulation, such as saving and replanting seed. Increasing the opportunities for renewable agriculture requires reversing these trends, but such a reversal is unlikely unless major political and economic changes are enacted.
One change that would slow consolidation would be greater antitrust enforcement [6]. The USDA recently announced its intention to hold joint hearings/public workshops in 2010 to consider antitrust issues in agriculture, first examining the seed industry, followed by beef and dairy [77]. It remains to be seen if actual enforcement will be more stringent than in recent decades, however. Another possibility would be to erect much stronger obstacles to accumulation by ending the practice of granting patents on living organisms [78]. A third possibility would be an increase in efforts by farmers and non-farmer allies to resist agricultural treadmills, and to create alternatives to oligopoly seed production. Examples include: choosing to farm with practices that attempt to minimize external inputs (e.g., agroecological, Biodynamic, organic) and increasing consumer demand for these products; independent seed company decisions to cease the distribution of Monsanto’s proprietary seed varieties [79]; and grassroots efforts to conserve seed biodiversity [80]. All of these efforts would benefit from greater public awareness of recent trends in the global seed industry, and their importance. Communicating this information to broader audiences through visualization may therefore make an important contribution to their success.
Acknowledgements
The author would like to thank Corie Peterson and Daniel Herriges for research assistance, and helpful suggestions from the anonymous reviewers.
Supplement 1. Animation of Consolidation in the Global Seed Industry
Link to QuickTime animation:
This animation shows consolidation occurring in the global seed industry from 1996 to 2008 in QuickTime format. Each firm or subsidiary is represented as a circle, and ownership connections, whether full or partial, are represented as gray lines. Pharmaceutical/chemical companies are colored red, seed companies are colored blue, and other companies, such as biotechnology firms, are colored yellow. The upper left shows the year in gray text. Throughout the animation, the size of the nine currently largest firms is represented as proportional to their global seed market share in 2007, according to data from the ETC Group (2008). During the study period the firms that eventually became the largest acquired or created joint ventures with more than two hundred firms. The entire animation shows that the pace of the acquisitions was fairly rapid in the late 1990s, slowed in the early 2000s (including a brief pause in 2003), but accelerated again in the last five years.
References and Notes
- Fernandez-Cornejo, J.; Just, R.E. Researchability of modern agricultural input markets and growing concentration. Am. J. Agric. Econ. 2007, 89, 1269–1275. [Google Scholar] [CrossRef]
- Mascarenhas, M.; Busch, L. Seeds of change: intellectual property rights, genetically modified soybeans and seed saving in the United States. Sociol. Ruralis. 2006, 46, 122–138. [Google Scholar] [CrossRef]
- Kloppenburg, J.R. First the Seed: The Political Economy of Plant Biotechnology, 2nd ed.; University of Wisconsin Press: Madison, WI, USA, 2005. [Google Scholar]
- Volkening, T. Seed savers exchange. J. Agric. Food Inf. 2006, 7, 3–15. [Google Scholar] [CrossRef]
- Hayenga, M. Structural change in the biotech seed and chemical industrial complex. AgBioForum. 1998, 1, 43–55. [Google Scholar]
- Harl, N.E. The age of contract agriculture: consequences of concentration in input supply. J. Agrib. 2000, 18, 115–128. [Google Scholar]
- Fulton, M.; Giannakas, K. Agricultural biotechnology and industry structure. AgBioForum 2002, 4, 137–151. [Google Scholar]
- Oehmke, J.F.; Wolf, C.A. Measuring concentration in the biotechnology R&D industry: adjusting for interfirm transfer of genetic materials. AgBioForum 2003, 6, 134–140. [Google Scholar]
- Srinivasan, C.S. Concentration in ownership of plant variety rights: some implications for developing countries. Food Policy 2003, 28, 519–546. [Google Scholar] [CrossRef]
- Fernandez-Cornejo, J. The Seed Industry in U.S. Agriculture: An Exploration of Data and Information on Crop Seed Markets, Regulation, Industry Structure, and Research and Development; US Department of Agriculture, Economic Research Service, Agriculture Information Bulletin 786: Washington, DC, USA, 2004. [Google Scholar]
- Schimmelpfennig, D.; Pray, C.E.; Brennan, M. The impact of seed industry concentration on innovation: a study of U.S. biotech market leaders. Agric. Econ. 2004, 30, 157–167. [Google Scholar] [CrossRef]
- Pray, C.; Oehmke, J.; Naseem, A. Innovation and dynamic efficiency in plant biotechnology: an introduction to the researchable issues. AgBioForum 2005, 8, 52–63. [Google Scholar]
- Moretti, I.M. Tracking the Trend Towards Market Concentration: The Case of the Agricultural Input Industry; United Nations Conference on Trade and Development: Geneva, Switzerland, 2006. [Google Scholar]
- Who Owns Nature? Corporate Power and the Final Frontier in the Commodification of Life; ETC Group: Ottawa, CA, USA, 2008.
- Ware, C. Information Visualization: Perception for Design, 2nd Ed. ed; Morgan Kaufmann: San Francisco, CA, USA, 2004. [Google Scholar]
- Howard, P.H. Visualizing food system concentration and consolidation. Southern Rural Sociology 2009, 24, 87–110. [Google Scholar]
- Kautsky, K. The Agrarian Question; Zwan: Winchester, MA, USA, 1988; Vol. 1-2. [Google Scholar]
- Mann, S.A.; Dickinson, J.M. Obstacles to the development of a capitalist agriculture. J. Peasant Stud. 1978, 5, 466–481. [Google Scholar] [CrossRef]
- Goodman, D.; Sorj, B.; Wilkinson, J. From Farming to Biotechnology: A Theory of Agro-Industrial Development; Basil Blackwell: New York, NY, USA, 1987. [Google Scholar]
- Heilbroner, R.L. The Nature and Logic of Capitalism; W.W. Norton & Co.: New York, NY, USA, 1985. [Google Scholar]
- Lewontin, R.C.; Berlan, J.P. Technology, research and the penetration of capital: the case of U.S. agriculture. Mon. Rev. 1986, 38, 21–34. [Google Scholar] [CrossRef]
- Berlan, J.P.; Lewontin, R.C. The political economy of hybrid corn. Mon. Rev. 1986, 38, 35–47. [Google Scholar] [CrossRef]
- Shinkle, P. Farmer who lied in dispute with Monsanto will go to prison. St. Louis Post-Dispatch 2003, B1. [Google Scholar]
- Shand, H. New enclosures: why civil society and governments need to look beyond life patenting. Centennial Rev. 2003, 3, 187–204. [Google Scholar] [CrossRef]
- Eaton, D.; Louwaars, N. Intellectual Property Rights in the International Seed Sector and Options for Resource-Poor Farmers; Report 09-019; LEI, Wageningen UR: Hague, The Netherlands, 2009. [Google Scholar]
- Cochrane, W.W. Farm Prices: Myth and Reality; University of Minnesota Press: Minneapolis, MN, USA, 1958. [Google Scholar]
- Cochrane, W.W. The Development of American Agriculture: A Historical Analysis; University of Minnesota Press: Minneapolis, MN, USA, 1993. [Google Scholar]
- Schurman, R.; Munro, W. Targeting capital: a cultural economy approach to understanding the efficacy of two anti-genetic engineering movements. Am. J. Sociol. 2009, 115, 155–202. [Google Scholar] [CrossRef] [PubMed]
- Murray, D.L. Cultivating Crisis: The Human Cost of Pesticides in Latin America; University of Texas Press: Austin, TX, USA, 1994. [Google Scholar]
- Clark, B.; York, R. Rifts and shifts: getting to the root of environmental crises. Mon. Rev. 2008, 60, 13–24. [Google Scholar] [CrossRef]
- Drinkwater, L.; Snapp, S. Understanding and managing the rhizosphere in agroecosystems. In The Rhizosphere: An Ecological Perspective; Cardon, Z.G., Whitbeck, J.L., Eds.; Elsevier: Burlington, MA, USA, 2007. [Google Scholar]
- Jussaume, R.A.; Glenna, L. Considering structural, individual and social network explanations for ecologically sustainable agriculture: an example drawn from Washington State wheat growers. Sustainability 2009, 1, 120–132. [Google Scholar] [CrossRef]
- Weis, T. The Global Food Economy: The Battle for the Future of Farming; Zed Books: New York, NY, USA, 2007. [Google Scholar]
- Hannaford, S.G. Market Domination! The Impact of Industry Consolidation on Competition, Innovation, and Consumer Choice; Praeger: Westport, CT, USA, 2007. [Google Scholar]
- Heffernan, W.; Hendrickson, M.; Gronski, R. Consolidation in the Food and Agriculture System; National Farmers Union: Washington, DC, USA, 1999. [Google Scholar]
- Lieber, J.B. Rats in the Grain: The Dirty Tricks of Supermarket to the World, Archer Daniels Midland; Basic Books: New York, NY, USA, 2000. [Google Scholar]
- Karier, T.M. Beyond Competition: The Economics of Mergers and Monopoly Power; M.E. Sharpe: Armonk, NY, USA, 1993. [Google Scholar]
- Gordon, M.J. Monopoly power in the United States manufacturing sector, 1899 to 1994. J Post Keynesian Econ. 1998, 20, 323–335. [Google Scholar]
- Consolidation could also be viewed as a treadmill from the perspective of firms within an industry. Publicly traded corporations are legally required to generate maximal returns for shareholders. If their competitors are engaging in mergers and acquisitions that result in increased political and economic power, which in turn translates to increased profits, firms may have little choice but to follow suit. Hendrickson, M.; Wilkinson, J.; Heffernan, W.; Gronski, R. (Eds.) In The Global Food System and Nodes of Power; Oxfam America: Boston, MA, USA, 2008.
- Sieker, B. Focus: Seed; The Context Network: West Des Moines, IA, USA, 2009. [Google Scholar]
- Morris, M.; Singh, R.; Pal, S. India's maize seed industry in transition: changing roles for the public and private sectors. Food Policy 1998, 23, 55–71. [Google Scholar] [CrossRef]
- Lesser, W. Intellectual property rights and concentration in agricultural biotechnology. AgBioForum. 1999, 1, 56–61. [Google Scholar]
- Glenna, L.; Cahoy, D.R. Agribusiness concentration, intellectual property, and the prospects for rural economic benefits from the emerging biofuel economy. Southern Rural Sociology 2009, 24, 111–129. [Google Scholar]
- Paul, H.; Steinbrecher, R.; Michaels, L.; Kuyek, D. Hungry Corporations: Transnational Biotech Companies Colonise the Food Chain; Zed Books: London, UK, 2004. [Google Scholar]
- Tidwell, J. Designing Interfaces: Patterns for Effective Interaction Design; O'Reilly Media: Sebastopol, CA, USA, 2005. [Google Scholar]
- Card, S.K.; Mackinlay, J.D.; Shneiderman, B. Readings in Information Visualization: Using Vision to Think; Morgan Kaufmann: San Francisco, CA, USA, 1999. [Google Scholar]
- Pioneer Hi-Bred International. In Seed Industry Structure; Pioneer Competitive Intelligence Group, Marketing Department: Johnston, IA, USA, 2000.
- SeedQuest. http://www.seedquest.com (accessed 14 September 2009).
- Moore, M. What's up with seed? Farm Industry News. 15 February 2009. Available online: http://farmindustrynews.com/seed/0215-highpriced-acreage-driving-costs/ (accessed on 16 July 2009).
- McFarland, D.; Bender-deMoll, S. Sonia V1.2.0 (Social Network Image Animator); Stanford University: Palo Alto, CA, USA, 2007. [Google Scholar]
- Batagelj, V.; Mrvar, A. Analysis and visualization of large networks. In Graph Drawing Software; Jünger, M., Mutzel, P., Eds.; Springer: Berlin, Germany, 2003. [Google Scholar]
- Kamada, T.; Kawai, S. An algorithm for drawing general undirected graphs. Inf. Process. Lett. 1989, 31, 7–15. [Google Scholar] [CrossRef]
- Moody, J.; McFarland, D.; Bender-DeMoll, S. Dynamic network visualization. Am. J. Sociol. 2005, 110, 1206–1241. [Google Scholar] [CrossRef]
- Omnigraffle 5.2; The Omni Group: Seattle, WA, USA, 2009.
- Graphviz 1.0. 2005. Available online: http://www.graphviz.org (accessed on 9 March 2009).
- Horstmeier, G. Strategic bedfellows. Farm Journal 1996. [Google Scholar]
- Orelli, B. Monsanto plowed down. The Motley Fool. 11 September 2009. Available online: http://www.fool.com/investing/value/2009/09/11/monsanto-plowed-down.aspx (accessed on 16 September 2009).
- Dillon, M. Another big horticultural seed company bought by Monsanto. Grist. 4 April 2008. Available online: http://www.grist.org/article/who-owns-your-tomato (accessed 23 March 2009).
- Tomich, J. Seeds grow Monsanto's business. St. Louis Post-Dispatch 2009, A1. [Google Scholar]
- Monsanto vs. U.S. Farmers; Center for Food Safety: Washington, DC, USA, 2005.
- Is Monsanto going to develop or sell 'Terminator' seeds? Monsanto. 16 July 2009. Available online: http://www.monsanto.com/monsanto_today/for_the_record/monsanto_terminator_seeds.asp (accessed on 11 August 2009).
- Dal Bó, E. Regulatory capture: a review. Oxford Rev. Econ. Pol. 2006, 22, 203–225. [Google Scholar] [CrossRef]
- Dyer, G. Frankenstein foods. The Globe and Mail 1999, D1. [Google Scholar]
- Dupont's new corn seed distribution strategy: will it enable meaningful market share recovery? Reuters 2008.
- Tomich, J. Behind group's anti-Monsanto campaign? Dupont. St. Louis Post-Dispatch 2009, A1. [Google Scholar]
- DuPont Unveils New Strategy To Expand Its Seed Business. DuPont: Wilmington, DE, USA, 2008. Available online: http://www2.dupont.com/Production_Agriculture/en_US/news_events/cp_releases/2008-12-11.html (accessed on 2 May 2009).
- Blake, A. Syngenta ties seed sales to spray. Farmers Weekly 2003. [Google Scholar]
- Freedom to farm—or freedom to follow suppliers' orders? Farmers Weekly 2003.
- Watts, M.J. Life under contract: contract farming, agrarian restructuring, and flexible accumulation. In Living under Contract: Contract Farming and Agrarian Transformation in Sub-Saharan Africa; Little, P.D., Watts, M.J., Eds.; The University of Wisconsin Press: Madison, WI, USA, 1994. [Google Scholar]
- Fatka, J. Dow increasing seed market share. Feedstuffs 2007, 6. [Google Scholar]
- Shand, H. Corporations grab climate genes. Foreign Policy in Focus. 13 May 2008. Available online: http://www.fpif.org/fpiftxt/5223 (accessed 10 July 2009).
- Monsanto Transgenic Trait Dominance in U.S. Market 1996–2007; Organization for Competitive Markets: Lincoln, NE, USA, 2008.
- Barboza, D. Questions seen on seed prices set in the 90's. The New York Times 2004, A1. [Google Scholar]
- Olson, J. Accessing seed technologies: will your local seed supplier have the seeds you want? Farm Industry News. 1 December 1998. Available online: http://farmindustrynews.com/mag/farming_accessing_seed_technologies/ (accessed 7 August 2009).
- Boland, M.; Amanor-Boadu, V.; Barton, D. Land O'Lakes. Int. Food Agrib. Manage. Rev. 2004, 7, 63–75. [Google Scholar]
- Overwater, T. Giant views of the industry. Germination. February 2009. Available online: http://www.seedquest.com/hosting/germination/giantviews/o/OverwaterTony/default.htm (accessed 25 June 2009).
- USDA and Justice Department to Hold Public Workshops To Explore Competition Issues In The Agriculture Industry; USDA Release No. 0368.09; USDA: Washington, DC, USA, 2009.
- Then, C.; Tippe, R. The Future of Seeds and Food Under the Growing Threat of Patents and Market Concentration; No Patents on Seeds Coalition: Hamburg, Germany, 2009. [Google Scholar]
- Dillon, M. 'And We Have the Seeds:' Monsanto Purchases World's Largest Vegetable Seed Company; Organic Seed Alliance: Port Townsend, WA, USA, 2005. [Google Scholar]
- Gepts, P.; Hancock, J. The future of plant breeding. Crop Sci. 2006, 46, 1630–1634. [Google Scholar] [CrossRef]
© 2009 by the authors; licensee Molecular Diversity Preservation International, Basel, Switzerland. This article is an open access article distributed under the terms and conditions of the Creative Commons Attribution license (http://creativecommons.org/licenses/by/3.0/).
Share and Cite
MDPI and ACS Style
Howard, P.H. Visualizing Consolidation in the Global Seed Industry: 1996–2008. Sustainability 2009, 1, 1266-1287. https://doi.org/10.3390/su1041266
AMA Style
Howard PH. Visualizing Consolidation in the Global Seed Industry: 1996–2008. Sustainability. 2009; 1(4):1266-1287. https://doi.org/10.3390/su1041266
Chicago/Turabian StyleHoward, Philip H. 2009. "Visualizing Consolidation in the Global Seed Industry: 1996–2008" Sustainability 1, no. 4: 1266-1287. https://doi.org/10.3390/su1041266