1. Introduction
In the global market, getting the right goods at the right time and place is as important as reducing costs, but to achieve it there must exist an efficient supply chain (SC). A SC can be defined as a network of suppliers, producers, warehouses, distribution centres, and retailers [
1] where integration between the different participants is sought through efficient levels of exchange of information, materials, and resources. When the complexity of the SC is increased, a set of activities is required to ensure coordination among partners, thus generating the concept of SC management. This aims to effectively integrate suppliers, manufacturers, warehouses, and retailers in such a way that the appropriate amount of the product is produced and then distributed at the correct time [
2].
The SC of products and services tends to be complex and difficult to manage, especially when they involve perishable goods [
3], and these are focused on rational planning, better communication between the participants, and the speed and coordination of distribution systems [
4,
5]. A SC for perishables can be defined as a group of commercial entities (suppliers, manufacturers, distributors, and retailers) that work together in the production and delivery of perishable goods, from the source of supply to the point of consumption, with the aim of minimising losses due to product deterioration [
6]. Consequently, real-time management is essential for the safety and quality of perishable foods, then the SC flexibility is crucial [
7]. Obviously, the better performance of the supply chain, the better results that will be obtained, from both the economic and environmental points of view; thus, this paper contributes to the sustainable development of the sector (Rioja wine) by providing the knowledge that allows obtaining better effectiveness and efficiency in its supply chain, therefore, obtaining better results by optimizing the resources used and, consequently, the environmental impact. A good performance of the supply chain in the wine sector implies good economic and environmental behaviour [
8] and, nowadays, in a globalized and customized environment, the real competence between companies is in supply chain efficiency and its impact on the environment [
9] and in this way, the partner’s integration is required.
1.1. The Wine SC
Wine is one of the most differentiated products in the food market. Its quality is associated with its region of origin and there are differences that depend on vintages and producers. In this sector, consumers make sure to acquire the best wines by checking the quality assurance indicators that appear on the labels [
10]. At the same time, the wine industry has recently undergone significant changes in line with increased consumption in countries that are not traditional consumer markets [
11], creating an increasingly complex SC.
According to Expósito et al. [
12], there are four stages in the wine SC, as described below:
- Stage 1:
Farm: monitoring the health of the vines and grapes, and application of treatments to ensure quality.
- Stage 2:
Processing: starting with the delivery of the grapes at the winery and ending with the bottled wine.
- Stage 3:
Storage: placement of the product, and control of environmental temperature and humidity conditions in the warehouse.
- Stage 4:
Delivery: distribution and sale of bottles of wine (final consumers or retailers).
In that sense Saglietto et al. [
13] identify 14 participants in the wine SC: supplier of raw materials, grape grower, wine producer, bulk wine distributor, cellar door sales, transit cellar, packer/bottler, freight forwarder, freight transport operator, importer, product distributor, retailer, wholesaler, and final consumer.
1.2. Wine in La Rioja
Spain is one of the most important global wine producers, with the largest area of vineyards, and the autonomous community of La Rioja is representative of the sector. This industry drives the region’s economic development [
14], boosting its development and its transition in 1993 from an impoverished rural region to one with European living standards. Currently, wine is viewed as an integral part of the Mediterranean diet and health benefits are associated with moderate consumption [
15]. Rioja wine has its own designation of origin, the oldest in Spain, created on 6 June 1925, and has an environmental compromise.
In 2016, La Rioja reported a cultivated area of 62,620 hectares, producing 317.83 million litres of wine, of which 178.77 million litres were sold in the Spanish market and 103.77 million were sold in the external market, to countries such as the United Kingdom, Germany, USA, Switzerland, The Netherlands, China, Sweden, Canada, Ireland, and Belgium.
1.3. Critical Success Factors in the Rioja Wine SC
Several critical success factors have been studied within the Rioja wine SC. These include studies on the impact of human resources on the agility, flexibility, and performance of the Rioja wine SC [
16], the impact of human resources skills on the quality obtained from production processes, and the associated economic performance [
17], analysis of demand, suppliers, quality, and delivery times with regard to financial benefits [
18], and the development of human resources within the sector [
19].
The analysis of critical success factors in the SC involves an extensive range of factors, including [
20]: top management commitment, development of an effective SC management strategy, devoted resources for the SC, logistics synchronization, use of modern technologies, information sharing between SC members, forecasting of demand on point of sale (POS), trust development in SC partners, development of just-in-time (JIT) capabilities in the system, development of reliable suppliers, and higher flexibility in the production system. As can be seen, almost all the critical success factors relate to the levels of integration of the SC members and only the last factor relates to the production process and its flexibility, since this is where quality assurance occurs [
21]. At the same time, neither local, regional, nor national infrastructures are included as critical success factors.
1.4. Research Problem and Objective
For the purposes of study, the wine SC can be divided into four stages, and within each the participants are identified. These include the Infrastructure required in Stage 1—Farm and Stage 4—Delivery, and, critically, the production and transformation process in Stage 2. For example, the SC requires roads, railway systems, ports and communication services, Internet and telephone services [
22], and those include a great deal of engineering management to reduce risk and uncertainty [
23] and eliminate contingencies [
24]. This Infrastructure is regulated by the government, and it becomes the more critical factor since it cannot be controlled by the company. Currently, authors, such as Wang and Yue [
25], declare that Infrastructure is the most important factor for security in transport and to avoid delays in deliveries in the supply chain.
Better quality Infrastructure contributes to improved SC performance, but companies must reduce risks associated with transportation because this allows ensuring quality and avoids losses during the supply of raw materials and the distribution of the finished products, which helps to carry out fast transport with less energy expenditure and with less environmental impact [
26,
27], and information and communication technologies must be used for traceability, such as RFID [
28,
29]. Once the raw materials are in a company’s warehouse, the production process begins: at this point, the combination between capacities and human factor's skills, and technology, represent the basis for reducing the risk [
30]. As a conclusion, if a company is located in a zone with a proper infrastructure, surely it may have benefits associated with the transport and its impact on the environment (with respect to the supply of raw material or finished products) and if the company has a reliable production process where lean techniques have been applied with technology friendly to the environment, then, as a consequence, it might have economic and financial benefits [
31], in addition to a better corporative image, appearing as a socially responsible company [
32].
Nevertheless, while the critical success factors associated with Infrastructure and production processes have been studied in other industrial sectors, the same does not hold for the wine sector, and the impact that these have on wine SC performance is unknown. The aim of this article is, therefore, to quantify this impact using a structural equation model to facilitate the decision-making process for the government and wine producers at La Rioja (Spain). The model incorporates four variables: Infrastructure, Production Processes, Transport Benefits, and Economic Benefits whose purpose is to find a quantitative value regarding the relationship between them. Then, the main contribution of this paper is to identify a value as a dependence measure between variables, for facilitating to managers and decision-makers the differentiation of the essential activities from trivial activities required for economic success, and reduce losses in the production process and transportation.
After this brief introduction, in
Section 2 a literature review appears regarding the main concepts, latent variables, and the observed variables used in the model, as well as the hypotheses to be tested statistically;
Section 3 describes the materials and methods used for data collection and analysis; in
Section 4 the results from data analysis are presented, and, finally,
Section 5 relates the conclusions and industrial implications for the wine sector.
2. Literature Review and Hypotheses
While there is extensive literature on the critical success factors in the SC related to the manufacturing sector, in this concrete case, given the problem and the research line, the literature review focuses on studies associated with Infrastructure and Production Processes, as well as Transport Benefits and Economic Performance in the wine sector.
2.1. Infrastructure
SC Infrastructure enables a mutual exchange of materials, information and cash flow [
12]. For example, the producer-provider relationship requires investments in information and communication technologies (ICT), and these are associated with company profitability because they create value and facilitate integration, increasing the flexibility, speed, and reliability of operations due to information sharing [
33]. Additionally, ICT and infrastructure allow agility in the production process, giving a fast response to customers [
34] and, currently, ICT is a critical success factor for SC and an important component in managerial strategies [
35]. However, recently, the most sounded concept is Industry 4.0, where all ICT are completely integrated into the production process.
Regarding wine, the product needs to be transported from warehouses to retail stores and consumers, and delivered in perfect condition in order to avoid a negative impact on the environment. This means that airports and roads must also be in good condition to ensure that economic losses do not occur during transport due to deterioration or breakage of bottles, keeping safe its chemical and aromatic properties [
36], and saving energy for transport. It is important to say that Infrastructure availability is an important parameter for the location decision for a company in any region [
37] and this is considered as a regional competitive advantage for economic sustainability [
38]. This latent variable is assessed using the following items:
Quality of telecommunications (telephone services, television, and radio) and regional transport infrastructure;
Availability and quality of internet service;
Services offered in regional industrial estates;
Availability of air, land, sea, financial, legal, and ICT services; and
Quality of air, land, sea, financial, legal, and ICT services.
2.2. Production Processes
Despite the success of lean manufacturing (LM) in other industrial sectors, it is not commonly applied in the wine sector due to difficulties of implementation [
39]; however, the wine sector also has a procurement process, a production process, and a distribution process, and there are a large number of opportunities to apply LM tools that can be supported by ICT [
40], since those enable planning and quality assurance during the Production Process, defining a better job schedule in plants to facilitate the flow of raw materials along the supply chain [
41], guaranteeing a minor negative impact to the environment, and energy consumption and waste (recycled or not) [
42]. In this research, the Production Process is measured using two observed variables:
According to those two items, it is possible to have efficient Production Processes in the wine sector. However, this can be affected by the lack of communication with suppliers, delays in the receipt of raw materials or in the delivery of finished products due to Infrastructure problems (roads, airports) [
8], and, consequently, it is necessary to study the relationship between these variables. Therefore, the following hypothesis is proposed:
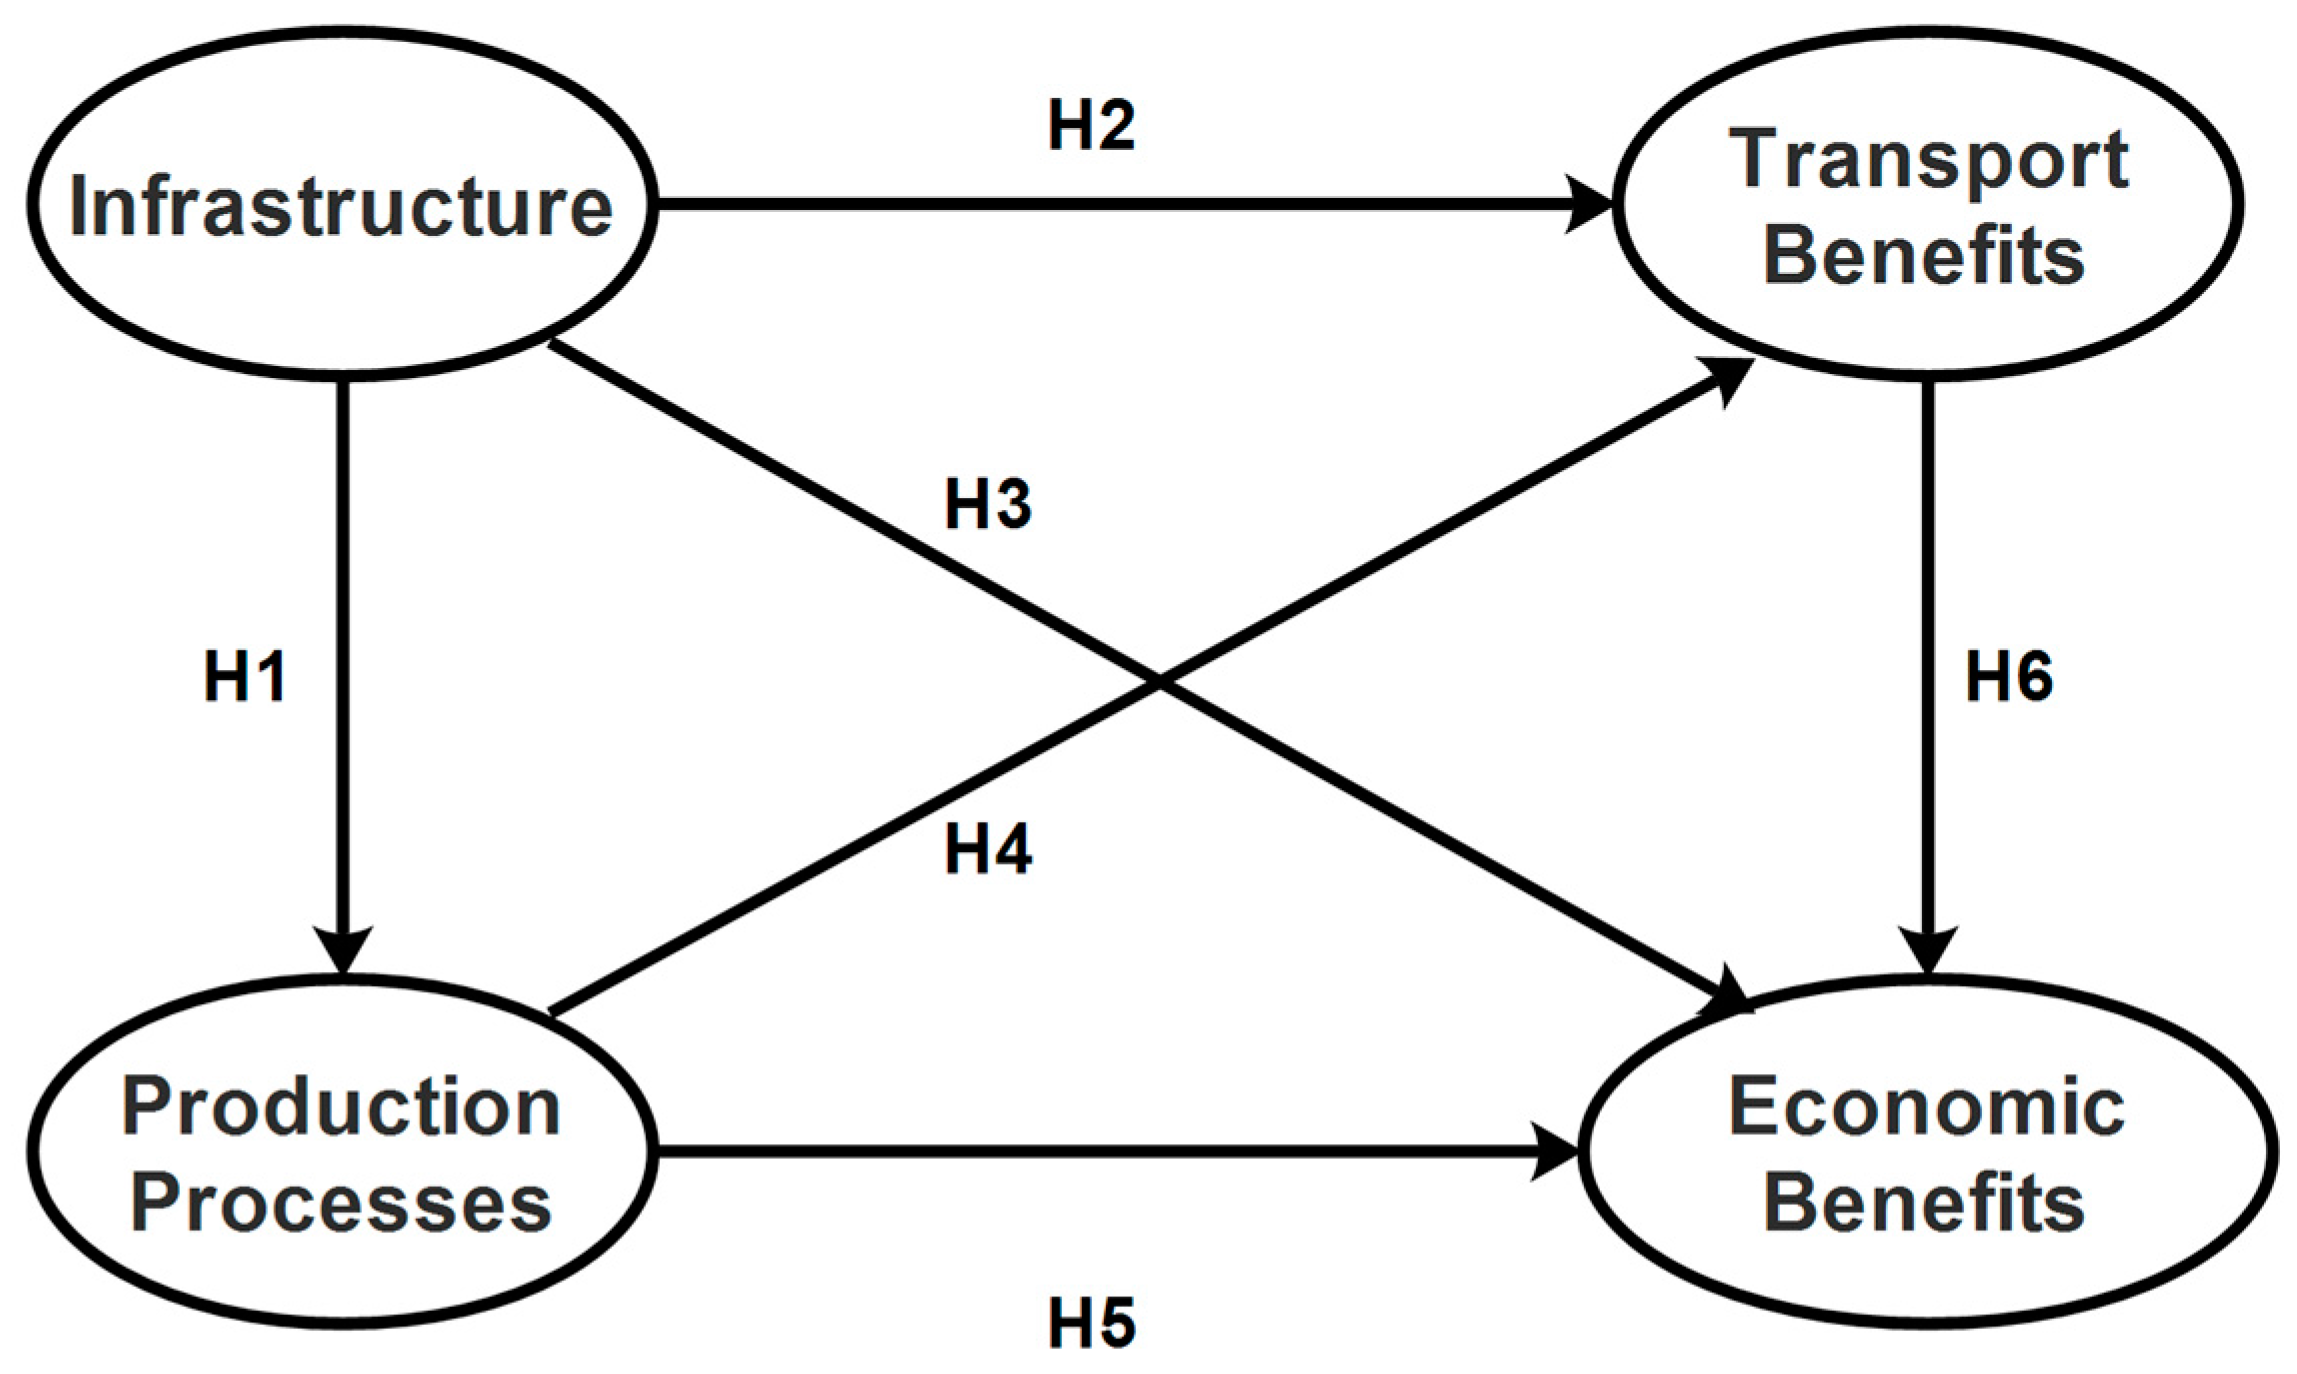
Hypothesis 1 (H1). Infrastructure has a direct and positive impact on the production process efficiency.
2.3. Transport Benefits
The introduction of the steam engine brought faster ships and railways [
43], reducing transit costs and times, and changing the horizon for supply chains, including those for wine, since wine producers could now send their products to other regions. To assess Transport Benefits in the supply chain for the wine sector, the following items are assessed:
Reduction of transport costs for raw materials and the final product;
Improved satellite tracking with on-time delivery of raw materials and the final product; and
Better quality transport using distribution centres, outsourcing, and traceability.
The Transport Benefits that can be obtained depend on the cost of fuel, labour, fees and taxes, and the quality of the available Infrastructure [
1]. In order to reduce costs, however, it is also desirable to move higher volumes [
11], implement a traceability system for collecting information in real-time [
12], and use ICT [
44].
Given that Transport Benefits are affected by regional Infrastructure, the following hypothesis is proposed:
Hypothesis 2 (H2). Regional Infrastructure has a direct and positive effect on the Transport Benefits of the wine supply.
At the same time, these Transport Benefits also depend on efficient flows of materials in the Production Process, since delays at this stage can entail delays in deliveries or in the packaging systems for transporting the bottles of wine [
45]. Some LM tools support the efficiency flow in production process, such as total productive maintenance (TPM) to keep machinery working and add value to products [
46], single-minute exchange of die (SMED) [
47], and total quality management (TQM) [
9]. Given the above, the following hypothesis is proposed:
Hypothesis 3 (H3). Production Process efficiency has a direct and positive effect on Transport Benefits.
2.4. Economic Benefits
All improvements and implementation of technologies introduced by wine companies are focused on obtaining greater Economic Benefits; and in this research, for assessing that latent variable, two items are used:
Improved cash flow; and
Increased sales.
These Economic Benefits can be obtained through the use of an appropriate Infrastructure that enables low-cost, fast transport of raw materials and finished products, or as a result of optimal communication between SC members due to the integration of ICT and real-time joint decision-making, to improve resilience and reduce uncertainty [
27,
48]. Given this, the following hypothesis is proposed:
Hypothesis 4 (H4). Regional Infrastructure has a direct and positive effect on the Economic Benefits of the wine SC.
The quality of the wine depends not only on the grapes that are used as a raw material, but also on the Production Processes used in their transformation. Due to this, LM techniques allow ensuring an adequate flow of materials and quality assurance, which enhance the company’s brand reputation and increase revenues [
49], and, nowadays, a large number of LM tools used in the Production Process have been reported as predecessors of high performance in Hartini and Ciptomulyono [
50]. Given this, the following hypothesis is proposed:
Hypothesis 5 (H5). Production Processes have a direct and positive effect on the Economic Benefits of the wine SC.
These Economic Benefits may arise as the result of other benefits, such as those obtained from transport, since a large volume of Rioja wine production is for export, requiring minimisation of transport costs, satellite tracking, and adequate traceability of the bottles in the distribution centres [
51]. Additionally, currently, some wine tours appear in some geographic regions, depending on transport infrastructure and government support [
52]. Based on the above, the following hypothesis is proposed:
Hypothesis 6 (H6). Transport Benefits have a direct and positive effect on the Economic Benefits of the wine SC.
Figure 1 shows a graphical representation of the hypotheses outlined above.
3. Materials and Methods
To achieve the objective and test the proposed hypotheses, the methodological stages discussed below were followed.
3.1. Stage 1: Survey Design
In order to gather information from the companies, the questionnaire proposed by García-Alcaraz et al. [
18] was used, which consists of 64 items or questions, divided into 15 categories that are called latent variables. For this research, only 12 items and four latent variables were used: Production Processes (two items), Infrastructure (five items), Economic Benefits (two items), and Transport Benefits (three items). The questionnaire used a Likert-type scale for responses with values from 1 to 5, where 1 signified strong disagreement with the activity set out or benefits obtained and 5 signified strong agreement with the activity set out or benefits obtained.
3.2. Stage 2: Data Collection, Information Capture, and Database Cleaning
The questionnaire was completed by managers of wineries in La Rioja (Spain), sent in advance by e-mail to enable familiarisation. The information was captured in a database using SPSS v. 24® software (IBM, Armonk, NY, USA) and the data was cleaned, identifying extreme values and missing values, which were replaced by the median for the item. In addition, standard deviation was obtained by case to identify noncommittal respondents, and surveys with missing values amounting to more than 10% were excluded.
3.3. Stage 3: Validation of the Questionnaire
Prior to analysing the information, various indices were calculated to determine the reliability of the latent variables, which are illustrated in
Table 1 with their ranges of accepted values in accordance with Kock [
53].
3.4. Stage 4: Descriptive Analysis of the Items
The median was estimated as a measure of the central tendency for each item, with higher values indicating that the activity is always performed, or benefits are always obtained and lower values indicating that the activity is not performed or that benefits are never obtained. The interquartile range (IR) was also used as a measure of dispersion, with a high value indicating no consensus among respondents and a low value indicating the opposite [
54].
3.5. Stage 5: Structural Equation Model
The structural equation modelling technique integrated into WarpPLS v.5 software was used for the statistical testing of the hypotheses set out in
Figure 1, with five efficiency indices measured before interpreting the results, shown in
Table 2, as proposed by Kock [
55].
Additionally, the structural equation model was used to analyse the direct effects, which represent each of the hypotheses in
Figure 1, as well as the indirect effects that occur from one variable to another through mediating variables and, finally, the total effects, which are the sum of the direct and indirect effects. The sizes of the effects were also analysed, which indicate the percentage of variance (R
2) explaining the impact of an independent variable on a dependent variable [
56].
4. Results
The results section is divided into subsections to facilitate understanding.
4.1. Descriptive Analysis of the Sample
A total of 64 valid questionnaires were collected, of which 46 were completed by men and 18 by women. These comprised 56 people from wineries with a staff of less than 50 workers, five from wineries with between 50 and 100 workers, two from wineries with between 100 and 500, and just one with more than 501 workers, suggesting that many of the wineries in La Rioja are family businesses.
Another aspect analysed was respondents’ years of experience. While only two people had less than two years of experience, nine had between two and five years, 17 had between five and 10 years, and, finally, 32 people had more than 10 years of experience, indicating that all respondents had extensive knowledge of the wine sector and, therefore, contributed to the validity of the information.
4.2. Descriptive Analysis of the Items
Table 3 presents a descriptive analysis of the activities and benefits incorporated into the model, showing the descriptor, its median, and its interquartile range. It can be seen that the items with higher median values are those related to Economic Benefits and the availability of internet services, which indicates that, on average, wine companies have increased their income and that communications are efficient in La Rioja region. In contrast, low median values are found for items associated with Transport Benefits, specifically satellite tracking and cost reduction, which indicates that, while these benefits exist, they are expensive.
Additionally, in line with the IR, some of the items with higher median values also have greater dispersion, such as in the case of satellite tracking and increased sales, suggesting that there is no consensus regarding these benefits. In the same way, there is no consensus in relation to the quality of Internet services. Nevertheless, there is greater consensus regarding the efficiency of Production Processes due to LM, better services in industrial estates, and quality in transport due to outsourcing, distribution warehouses, and traceability.
4.3. Validation of Latent Variables
Table 4 shows the validation indices for the model’s latent variables. According to the values for the R-squared, adjusted R-squared and Q-squared indices, the latent variables have sufficient predictive validity from both a parametric and non-parametric perspective. Additionally, based on the values for the Cronbach’s alpha and reliability composite indices, it can be concluded that they have internal validity. Furthermore, AVE values greater than 0.5 indicate that there is convergent validity and, finally, according to the VIF values, which are less than 3.3, there are no collinearity problems.
4.4. Structural Equation Model
To be able to interpret the results of the model, its efficiency ratios were first analysed, which are listed below.
For the APC, ARS, and AARS indices, the
p-value is lower than 0.05, which indicates that the average β indices are acceptable and that the model has sufficient predictive validity. Likewise, the AVIF is lower than 3.3, indicating the absence of collinearity between the variables, and the GoF index is higher than 0.36, indicating correct adjustment of the model, as shown in
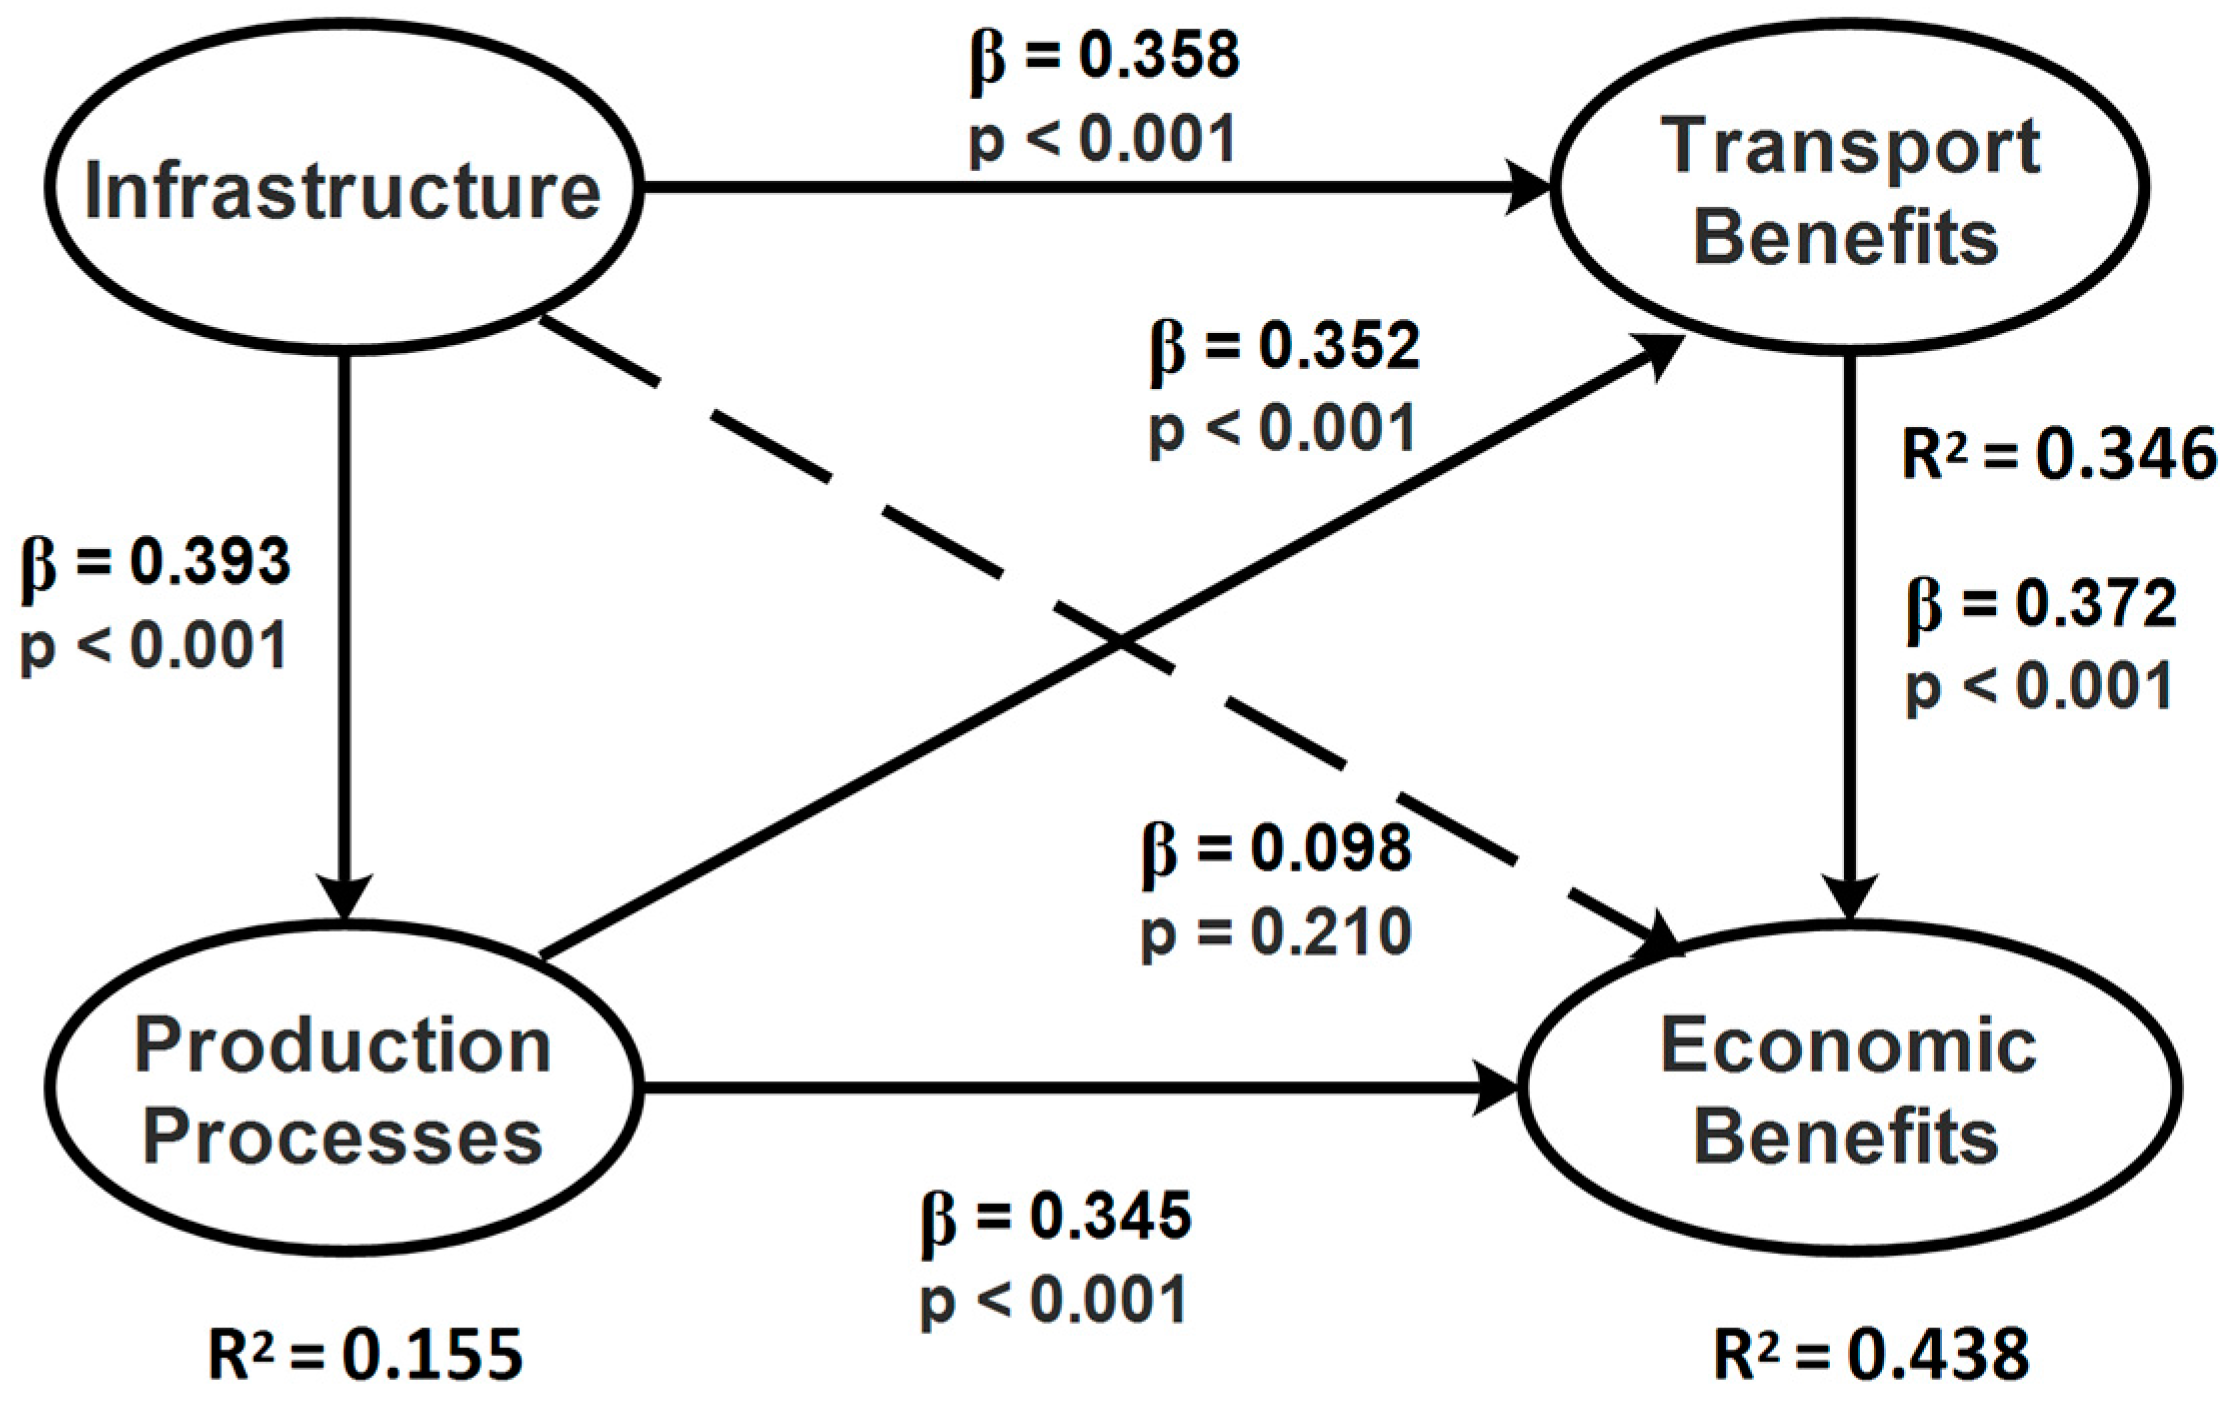
Figure 2.
4.4.1. Direct Effects
Figure 2 shows the results of the direct effects between latent variables. These are represented by arrows showing the value of β and p to measure the impact of the independent variable on the dependent variable and its statistical significance, which allows conclusions to be drawn in relation to the hypotheses set out. A summary is shown in
Table 5.
4.4.2. Size of the Direct Effects
Table 6 shows that there are dependent variables that are explained by two or more independent variables, which are measured by the value of R
2. For example, 34.6% of the dependent variable Transport Benefits can be explained (R
2 = 0.346) by the variables Production Processes and Infrastructure, which give 17.1% and 17.5%, respectively, and a similar interpretation can be made about the other relationships.
Table 6 shows a breakdown of R
2 for each of the latent variables in the model.
4.4.3. Indirect Effects
Table 7 shows the sum of the model’s indirect effects, the
p-value for statistical significance, and the size of the effect. In this case, two of the effects are not statistically significant with a 95% confidence interval, since the associated
p-value is greater than 0.05; however, they may be significant with a 90% confidence interval.
Of interest is the indirect effect between Infrastructure and Economic Benefits, which occurs by means of Transport Benefits and Production Processes. This is statistically significant and may explain up to 10.1% of the variance (ES = 0.101). Similar interpretations can be made for the other variables.
4.4.4. Total Effects
The sum of the direct and indirect effects is called the total effect, and this is shown in
Table 8. All effects are statistically significant and, due to their size, the effects of Infrastructure on Transport Benefits and Economic Benefits are of importance, as are the effects of Production Processes on Economic Benefits.
5. Conclusions and Discussion
Six hypotheses were proposed to analyse the relationship between Production Processes, Infrastructure, Transport Benefits and Economic Benefits. Based on the direct effect (0.393) of Infrastructure on Production Processes, it can be stated that in the wine SC, Production Processes depend on a level of 15.5% on the ICT in each SC.
In the same way Transport Benefits are positively affected by the SC’s Infrastructure, since the effect (0.358) explains 17.5% of the total variance, suggesting that the correct use and application of ICT for the tracking of raw materials and the finished product during transportation will yield reduced costs and help to increase the quality of transportation. However, better infrastructure means savings in energy for transport and a minor negative impact in environment.
Based on the effect of Infrastructure on Economic Benefits (0.098) and a p-value of 0.210, it can be concluded that the direct effect is not significant and, therefore, will not lead to Economic Benefits. However, improved cash flow and increased sales can be indirectly obtained through Transport Benefits and Production Processes, since this variable has an effect size of 10.1% and this shows the importance of these moderating variables in economic sustainability.
Regarding the effect of Production Processes on Transport Benefits (0.352), 17.1% of Transport Benefits can be explained through Production Processes based on the lean manufacturing methodology, which reduces losses during the transport stage and, therefore, decreases its energy costs in raw material transformation and, possibly, to better designs that facilitates transport activities.
Production Processes have a direct effect on Economic Benefits, with a value of 0.345, which explains 19% of the variance, and it is widely accepted that Production Processes based on LM will reduce wastage (transport, delay, overproduction, surplus inventory) and, thus, yield this type of benefit.
Finally, the Transport Benefits explains 21.1% of the variance in the Economic Benefits and, consequently, a reduction in transport costs will automatically lead to Economic Benefits within the wine SC.
Based on the direct effect of Infrastructure on Production Processes, it can be stated that, in the wine’s SC, Production Processes depend on a level of 15.5% from Infrastructure installed along the SC, and this is the higher effect. According to this finding, managers must focus on regional and local Infrastructure in their production plans because the Production Process depends on it, mainly for raw material supply and finished products. A company can stop the Production Process if SC is delayed due to risk factors in Infrastructure [
57].
Transport Benefits are positively affected by the SC’s Infrastructure, suggesting that the correct use and application of ICT for tracking raw materials and finished product during transportation will yield on reduced costs and help to increase the quality of transportation, but also the companies gain flexibility with adequate airways and roadways. Managers must focus attention on transport using local Infrastructure, because wine is a perishable product requiring special transport conditions; for example, broken bottles represent an economic loss for wineries during transport due to the poor road conditions.
Based on the effect of Infrastructure on Economic Benefits (0.098) and a p-value of 0.210, it can be concluded that the direct effect is not statistically significant and, therefore, will not lead to Economic Benefits (the line joining these latent variables are dashed). However, improved cash flow and increased sales can be indirectly obtained through Transport Benefits and Production Processes as mediator variables. Indirect indicators show that when Infrastructure increases its standard deviation in one unit, the Economic Benefits increases by 0.418 units; but, first, companies need to ensure an efficient Production Process and obtain Transport Benefits.
The Production Processes based on LM will reduce wastage (transport, delay, overproduction, surplus inventory) and, thus, yield these types of Economic Benefits, because when the first latent variable increases its standard deviation in one unit, the second one increases by 0.345 units in a direct way, explaining 19% of the variability. However, if companies gain some Transport Benefits, then the Production Process has an indirect effect on Economics Benefits by 0.131 units, given a total effect of 0.472 units, one of the higher levels.
The Transport Benefits explain 21.1% of the Economic Benefits and, consequently, a reduction in transport costs will automatically lead to SC performance. Here, it is important to note that this relationship is the largest in the model. In addition, these Transport Benefits are important for the variable Infrastructure to have an indirect effect on the Economic Benefits and contribute to increasing the total effects of the Production Processes. This leads to the conclusion that, to obtain Economic Benefits, managers must focus on obtaining Transport Benefits first.
According to direct effects Transport Benefits, it is important for managers to have an efficient and safe Infrastructure and reliable Production Process, because the direct effect is 0.358 and 0.352 (six thousandths of a difference), two similar values. In addition, managers must focus on Transport Benefits and Production Processes to gain more Economic Benefits in the SC. However, to obtain Transport Benefits, managers must focus on the reduction of transport costs for raw materials and finished products, improved satellite tracking with on-time data sharing, and better-quality transport using distribution centres, outsourcing, and traceability. Those benefits in transportation help to obtain Economic Benefits, improved cash flow, and increased sales.


 ,
, 

