The Great Scottish Housing Disaster: The Impacts of Feudalism, Modernism, Energy Efficiency and Vapour Barriers on Indoor Air Quality, Asthma and Public Health

Department of Architecture, University of Strathclyde, Glasgow G1 1XQ, UK
Sustainability 2018, 10(1), 18; https://doi.org/10.3390/su10010018
Submission received: 8 November 2017
/
Revised: 16 December 2017
/
Accepted: 18 December 2017
/
Published: 22 December 2017
Abstract
:This paper represents 30 years of research into the arena of housing and health. It brings together the conclusions of three books and the findings of multiple research papers undertaken by the author and published by medical, engineering and social policy journals. This work aims to highlight the links and connections between the diverse arenas of urban form, building design, energy efficiency, indoor air quality, respiratory medicine and immunology, all within the socio-economic framework of a small damp country on the fringe of northern Europe.
1. Introduction
Life expectancy in many Scottish cities and regions has lagged behind the rest of the UK. The average life expectancy of a male living in the Calton area of Glasgow is 53.8 years [1]. Although mortality remains an excellent measure of poverty, “big data” statistics on morbidity may be a better measure of overall quality of life in any particular country or region. Scotland has for instance, the highest rate of cancer, heart attacks and respiratory disease of all countries in the EU [2]. In addition to genetics, there are 16 major determinants of public health in any given society organised on the basis of neo-liberal economics. These can be categorised under four generic headings (see Table 1).
Although “lifestyle” is seen as being the dominant factor under individual control when public health is being discussed, we should not underestimate the role of the environment. The additive, synergistic and antagonistic combinations produced by the quality of our homes, workplaces and cities, and the access they provide to a range of services (cultural/medical/educational), are crucial components, and can influence both life expectancy and any given population’s overall wellbeing.
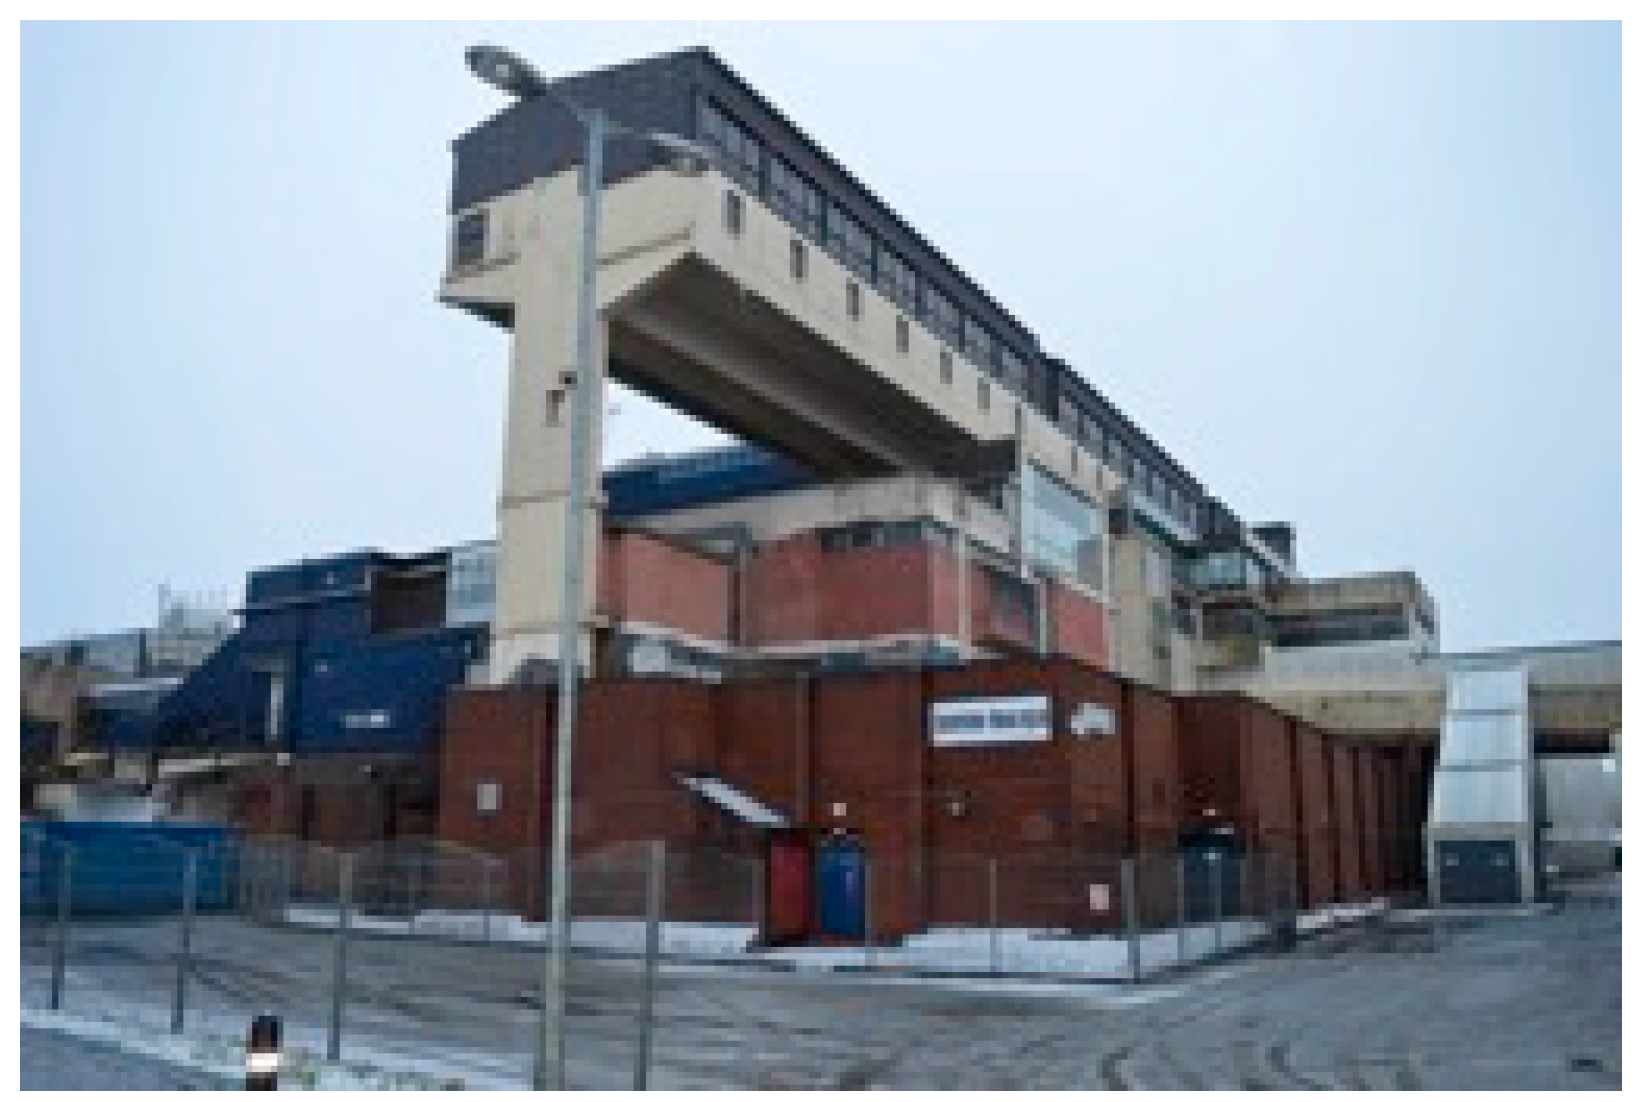
The post-war history of Scotland provides many valuable lessons on the deleterious effect on public health that can occur when policy makers, in concert with architects and planners (even when operating with good intentions and noble motives) adopt “Corbusien” modernism as the optimum replacement strategy for slum clearance. Coleman [3] convincingly demonstrated the unequivocal negative impacts modernist urban form and dwelling typologies have had on the incidence of social malaise, such as crime rates, vandalism, graffiti, litter dropping, dog fouling and socio-psychological effects (particularly associated with tower block and deck access living) such as social isolation and fear of crime. Urban form can also directly affect external air quality, with “urban canyons” at the foot of steep hills, known to concentrate oxides of sulphur and nitrogen, as well as benzene and PM10 particulates [4]. A lack of safe recreational space in city centre communities may also be contributing to the obesity epidemic affecting Scottish school children. Glasgow’s traditional urban form was one of tenements close to the workplace, with social amenities such as shops and bars integrated on the ground floor (Figure 1). Modernism eschewed this complexity in favour of zoning by function. The down side to this is that the good citizens of the modernist idyll have to spend much of their time travelling between the various mono-cultural and ring-fenced zones (civic/commercial/industrial/entertainment/educational/health; see Figure 2) invariably burning carbon as they go.
This paper reviews the major planning and design decisions taken in Scotland since 1945 to date, and (with the benefit of hindsight) demonstrates the associations and causal links between the environment they created (both internal and external) and public health. If we are to address the categorical imperatives presented by climate change and sustainability, these mistakes must not be repeated. To keep doing the same thing and expect different outcomes is, according to Einstein, idiotic.
2. Exodus: How to Increase a Nation’s Carbon Footprint
Between 1971 and 2001, the population of the City of Glasgow fell by 362,814. This represented a net population outflow of 37%. Unlike New Orleans, the “evacuation” of Glasgow, was not forced by natural disaster; it was planned. The Clyde Valley Regional Plan of 1946 [5] proposed the dispersal of 550,000 of the city centre inhabitants to peripheral estates and new towns. Concurrent with the closure of thousands of miles of railway line, a decision was taken to redistribute the population to what was, to all intents and purposes, the countryside. The Scottish new towns were conceived when modernist planners, obsessed with visions of “towers in the park”, ignored the deleterious impacts of the bio-accumulative carcinogens such as benzene, and considered the internal combustion engine to represent progress. This strategy had two major deleterious effects. Firstly, it systematically extracted from Glasgow the skilled and semi-skilled aspirational working class. In the space of a decade, Glasgow lost its tax base and a cohort of productive families that had played a crucial stabilising role at the centre of most working class communities. Secondly, moving from a dense city (of 200 persons per hectare in tenemental areas, (Figure 3) with good public transport networks) to semi-rural locations with densities of 10 persons per hectare (common in the New Towns (and now also colonising metropolitan areas, see Figure 4), has dramatically increased Scotland’s carbon footprint.
In Glasgow 26% of the working population are still employed within two kilometers of their home [6]. In Cumbernauld (10 miles to the north east of the city and typical of the five Scottish new towns) it is less than 5%. In Glasgow 1.5% of the employed population work more than 20 km from their home. The equivalent figure for Cumbernauld is 28%. In Cumbernauld less than 18% use public transport for their daily commute, compared with 36% in Glasgow. The 26% of commuters in Glasgow traveling under two kilometers per day by public transport, have an individual carbon footprint of less than 0.5 kg. The Cumbernauld commuter traveling up to 80 km round trip by car, will have a footprint of more than 20 kg. This results in Cumbernauld, a town with a population of circa 35,000 having a larger carbon footprint for the daily commute than the entire City of Glasgow with its 650,000 inhabitants (Figure 5 and Figure 6). Such satellite communities are also at the mercy of future oil price hikes, and the population of these new towns is already starting to fall, more likely than not, due to such crude economic drivers. Urban form and location can directly affect the socio-economic base, which invariably has a direct and immediate impact on public health and wellbeing. The family budget may not stretch to the “luxury” of fresh fruit and veg if it has been exhausted on travel.
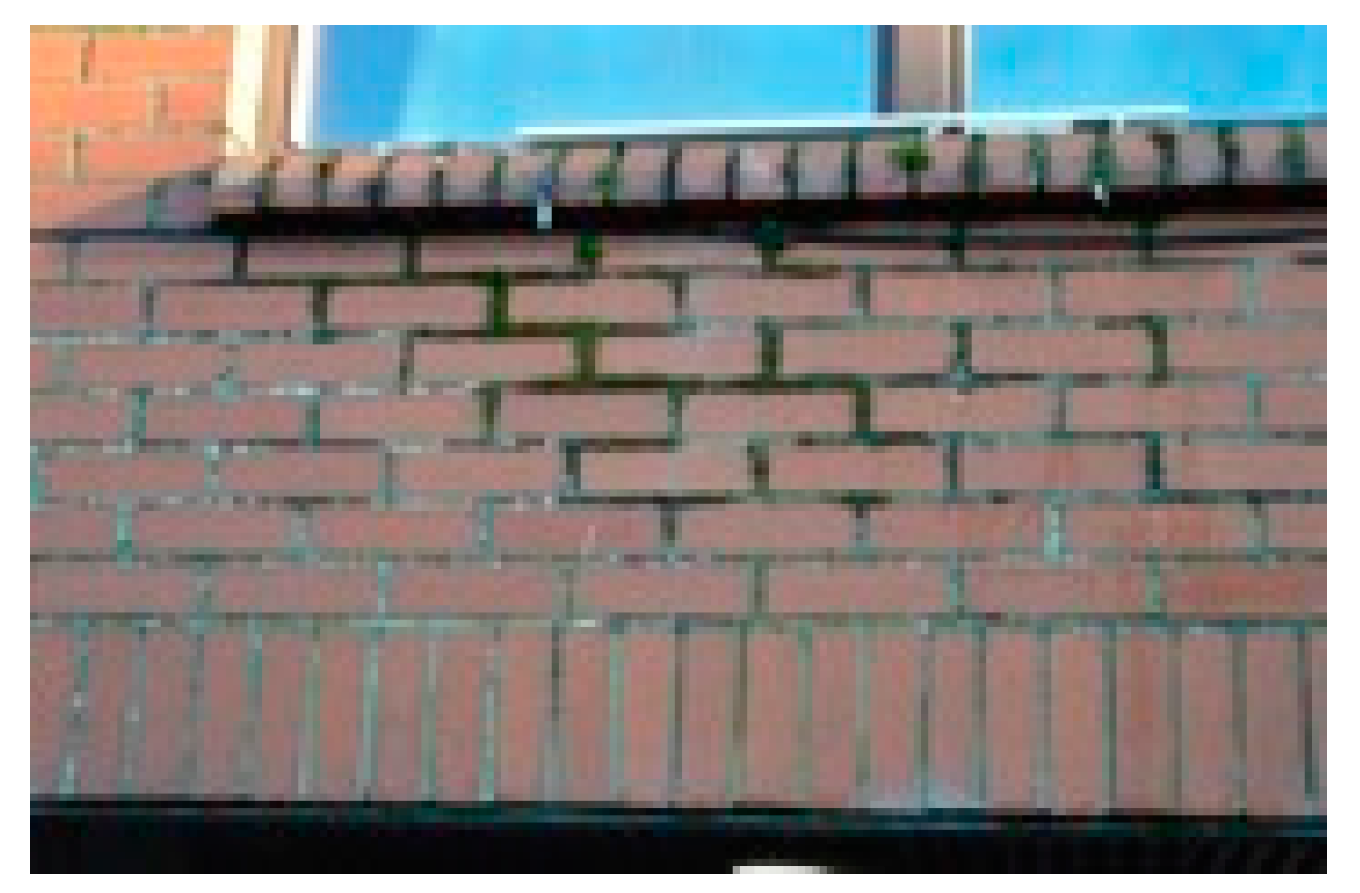
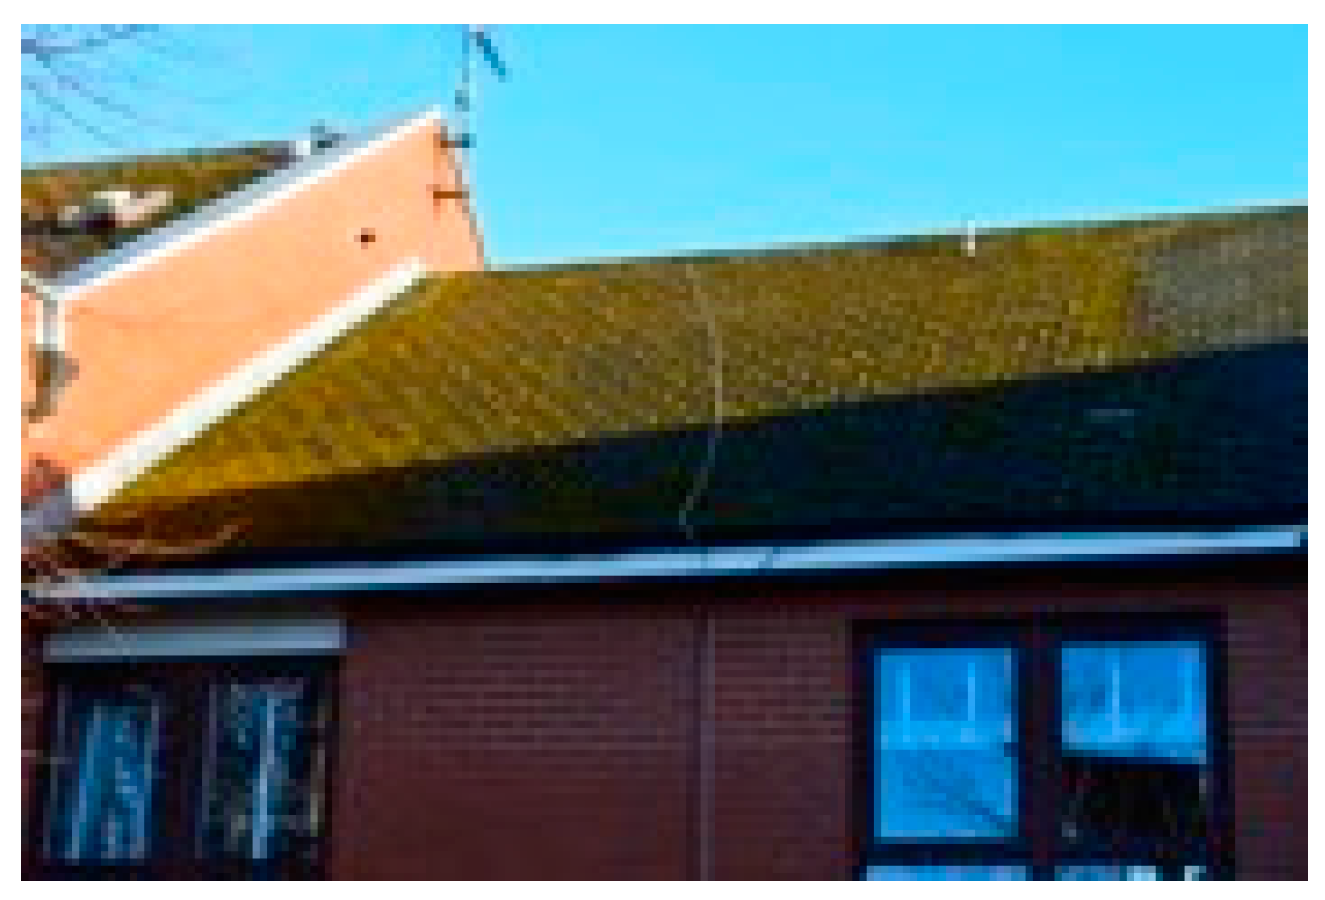
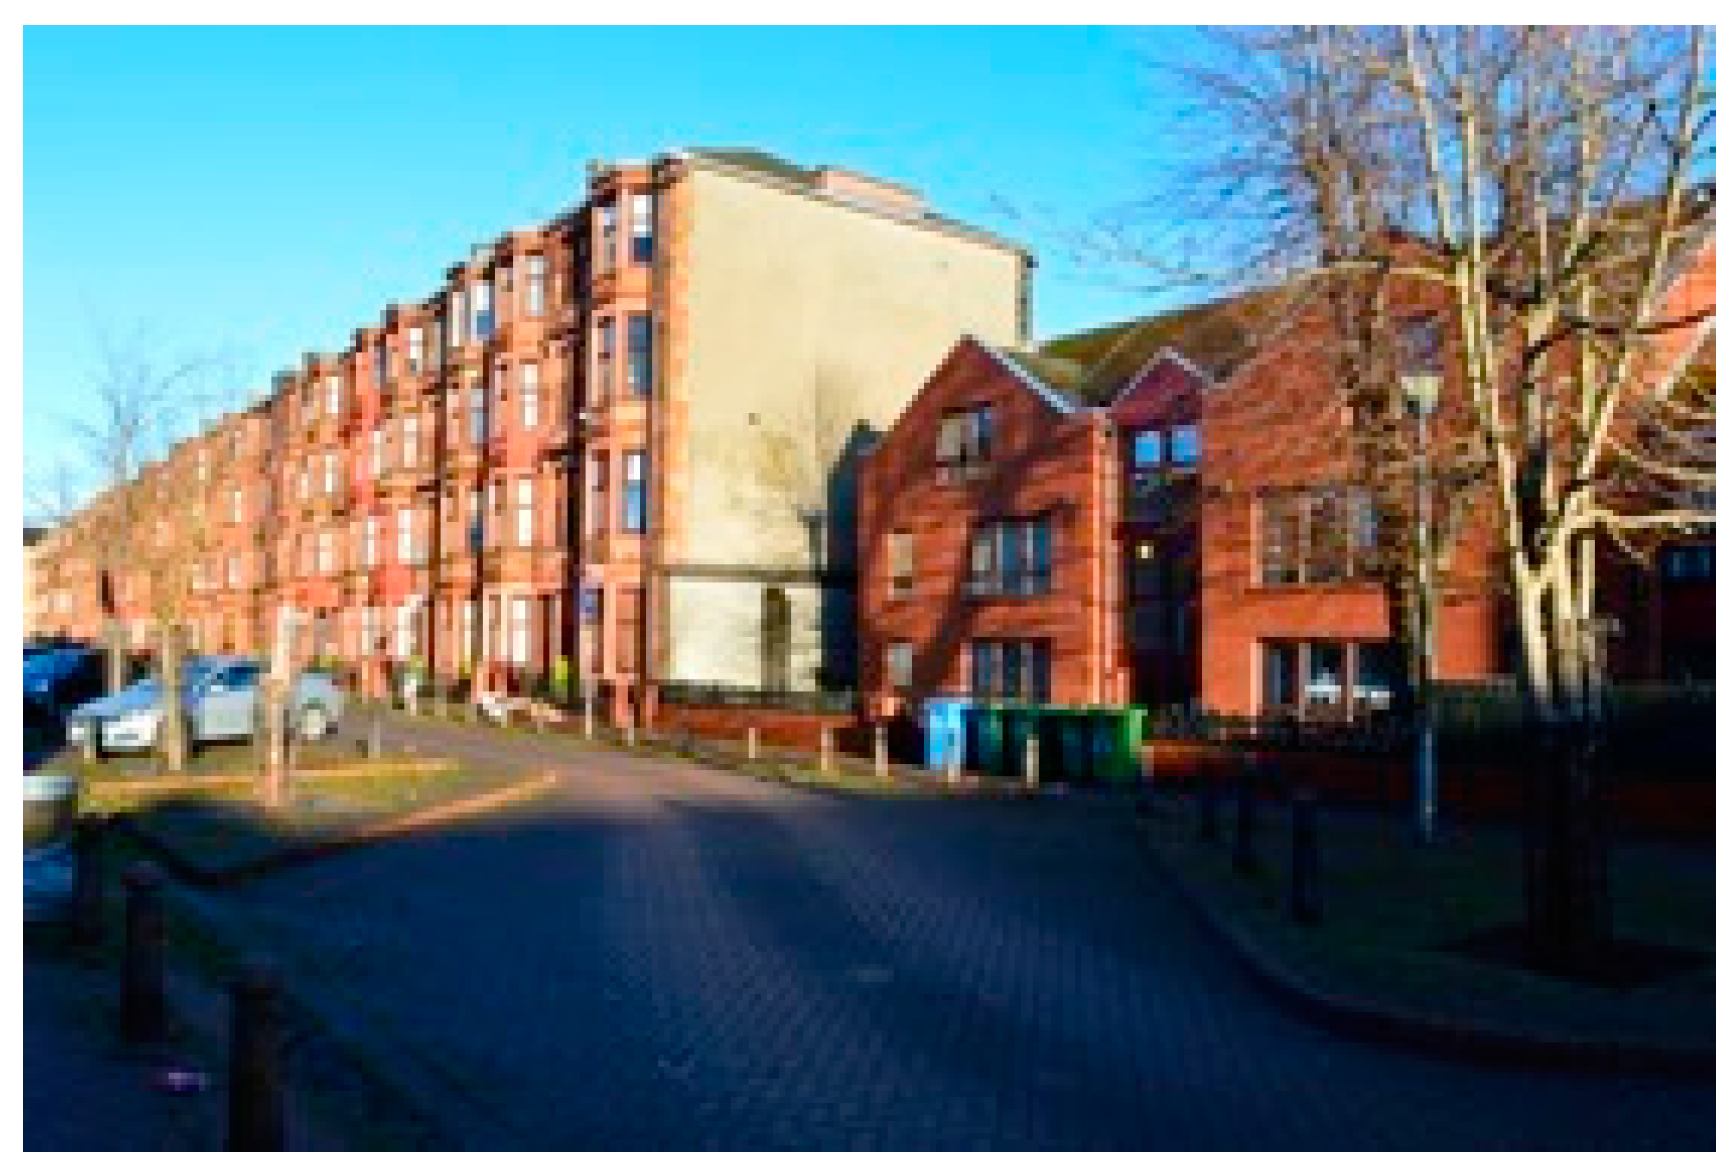
Population drift continues to date, with migration from the dense urban areas to rural and semi-rural locations. Between 1991 and 2002, Glasgow and Dundee lost a further 10% of their population [7] to semi-rural locations with poor transport links such as local rail networks, but much favoured by private builders seeking green field sites. The populations of rural areas (East Lothian and Perth and Kinross) are predicted to increase by over 30% in the next few years as this trend continues. House buyers are being systematically tempted into the “countryside” by the lure of lower house prices. They are also, in the main, moving to house types that are entirely alien to the Scottish landscape (Figure 7) and constructed of materials unsuited to a climate that has high rainfall levels and many freeze/thaw cycles; environmental conditions that have acute deleterious effects clay bricks (Figure 8) and concrete roof tiles (Figure 9) with much higher embodied energy for both manufacture and transport. This will eventually result in the eradication of Scotland’s architectural tradition and identity; a country with a distinct building tradition using local sandstone and slate (materials with low embodied energy and excellent longevity) having the bland appearance of an English suburb.
3. Less Is More
30 years ago the average house price in Scotland was less than three times the average salary. It is now over six times the average salary (£25,490:£157,174) [8]; so what factors have contributed to the real cost of housing doubling over this period? Are these new dwellings significantly larger or are they simply twice as good? In a study [9] comparing useful floor-space in dwellings across the developed world, the UK was ranked the lowest; 76 m2 compared to 113 m2 in France, 115 m2 in Holland, 137 m2 in Denmark, 206 m2 in Australia and 214 m2 in the USA. This reduction in internal area has been compounded by reducing volumes as ceiling heights have dropped from over 3.5 m, common in Victorian tenements, to as low as 2.3 m (Figure 10 and Figure 11). This has resulted in significantly less air mass in which to dilute internal pollutants (volatile organic compounds such as formaldehyde now ubiquitous in the indoor environment) off-gassing from fittings, fixtures and processes.
4. The Not So “Green” Belt
Over the last six decades, local authority planning departments have been complicit in restricting the supply of land for housing due to delays in processing applications and the adoption of a policy that had as its focus the protection of the so called, “green belt”; a requirement that all cities must be encircled with a ring of grass and trees. This policy decision—although nominally entitled as “green”—invariably increases the carbon footprint for commuters, as those traveling to work in the city now have to cross this green “doughnut”. This is in direct contrast to enlightened urban planning evident in many European cities where a metropolitan area can reduce its carbon footprint for commuting, by adopting the “starfish” configuration as a planning metaphor, with housing and amenities spreading outwards along its public transport “tentacles” encouraging commuters to live within walking distance of the local station or hub.
5. Land Banking
When land is eventually zoned for housing by the planning authorities, these large lots are immediately bought up by the volume house developers at premium rates. They who own the land control the market and it is not in their interests to “flood” the market with new housing. Increasing supply invariably results in a drop in price per unit. The private sector has historically kept its annual contribution to housing completions within fairly precise boundaries. It appears to be either incapable or unwilling to increase production to meet the current demand. House building in Scotland peaked in 1970 with the completion of 43,906 units, only 8220 of which were built by the private sector. By 2016 house completions were down to 17,018 of which 13,187 were private sector [10]. Relying on the private sector (half regulated by arcane planning procedures) has resulted in a dramatic reduction in the number of dwellings being built. This artificial shortage has produced a price bubble based on scarcity value, and planning restrictions and delays have driven hyper inflation in land values. Between 1986 and 2006, house prices in the UK rose by 469%. Over the same period, residential land values increased by 764% [11]. The cost per square metre of a city centre apartment in the UK is now €15,187. This compares with €7213 in Italy, €6991 in Sweden, €4271 in The Netherlands, €3704 in Germany and €2853 in Belgium [12]. These high costs are independent of population density. The Netherlands has a population density of 403/km2, compared with 255/km2 in the UK [13]. In 2010 residential land in Glasgow was valued at £1.7 million per hectare. This compares with £4.4 million per hectare in Edinburgh. Those buying a dwelling in the respective cities (even where flats can be built at target densities of 200 persons/hectare) will have to pick up this additional cost, adding £8500–22,000 per person, per new housing unit [14]. This is symptomatic of the dilemma at the heart of neo-liberalism. Although the UK government is prepared to rely almost exclusively on “the market” to deliver new dwellings, they also know that the market—if left to its own devices—will produce relatively modest numbers of poor quality dwellings, as most builders make their margins from the increase in land value brought about by land banking, restricting supply, cartel price fixing and monopoly. This economic model also represents a remarkable windfall for those who own the land.
6. Who Owns Scotland?
19.4 million acres (83%) of Scotland’s land mass are in the hands of 2519 landowners (0.05% of the population) with the Public Sector owning 12.1%, the Community Sector 2.2% and Heritage Sector 2.5% [15] (p. 106). Such an unequal distribution is a hangover from Feudalism and Scotland’s failure to deliver a bourgeois revolution, with feu duties still being collected by aristocratic superiors as late as 2003. This is why Scottish cities have historically been dominated by four storey tenements; the annual ground rental in Glasgow and Edinburgh being twice as high as central London, requiring higher densities to defray this annual tax. The Scottish countryside is peppered with many grand “castles” in the baronial style (Figure 12), built by the UK aristocracy, with funds extracted from the urban working class. Unlike our Celtic neighbours in Ireland who chose during the civil war in the early 1920s, to burn down the “big houses”, the Scottish unionist working class remain in awe of the house of Saxe Coburg Gotha (Figure 13) and appear content to contribute to annual running costs and private funds invested in off-shore tax havens [16].
These historic ownership patterns, many dating back to the 1066, 1314 and 1745 re-organisation of the Scottish feudal hierarchy (depending on which side they had backed in the war), continue to play a significant role in what is built, where, for whom and at what cost. Apologists for such an anachronistic social hierarchy (sometimes in ironic combination with a robust defense of modernism) will point to the unanticipated technical failures and unintended consequences of attempting slum clearance and replacement at such breakneck speed, being the root cause of the problems we now face and to some extent they have a point. The major policy position for all post-war governments was the promise to build large numbers of new homes. In an economy where both materials and skilled labour were in critical shortage, improvisation and innovation were the order of the day. Untried and untested materials and techniques were deployed. The legacy of this approach will be with us for decades to come.
7. Asbestos, Energy Efficiency and Asthma
In the first century AD, the Greeks and Romans are claimed [17] to have observed that slaves involved in the weaving of asbestos cloth were afflicted with a sickness of the lungs. In 1898 the Chief Inspector of Factories (UK) reported that asbestos had demonstrable health risks [18]. In 1927 Cooke [19] reporting on a post-mortem involving a 33-year-old male worker who was the only survivor out of ten workers in an asbestos carding room, named the condition, “asbestosis”. Circa 3000 deaths in the UK each year are due to historical asbestos exposure, and this is likely—given the incubation period—to rise to 10,000 by 2020 [20]. The World Health Organisation [21] estimates that more than 107,000 people die each year from mesothelioma and asbestosis, resulting from occupational exposure. Applying the same algorithm, deaths worldwide will rise to circa 350,000 per annum by 2020. The total number of deaths from exposure during the 20th century, is thus likely to be in the region of 20 million. In the late 1970s court documents [22] proved that the asbestos industry knew of the health dangers as early as the 1930s and subsequently concealed them from the public. The use of blue and brown asbestos was only banned in the UK in 1985, with white asbestos being banned as late as 1999 [23], almost 100 years after the emergence of the evidence base. When it came to the health risks associated with asbestos, vested commercial interests were remarkably successful in delaying prohibition.
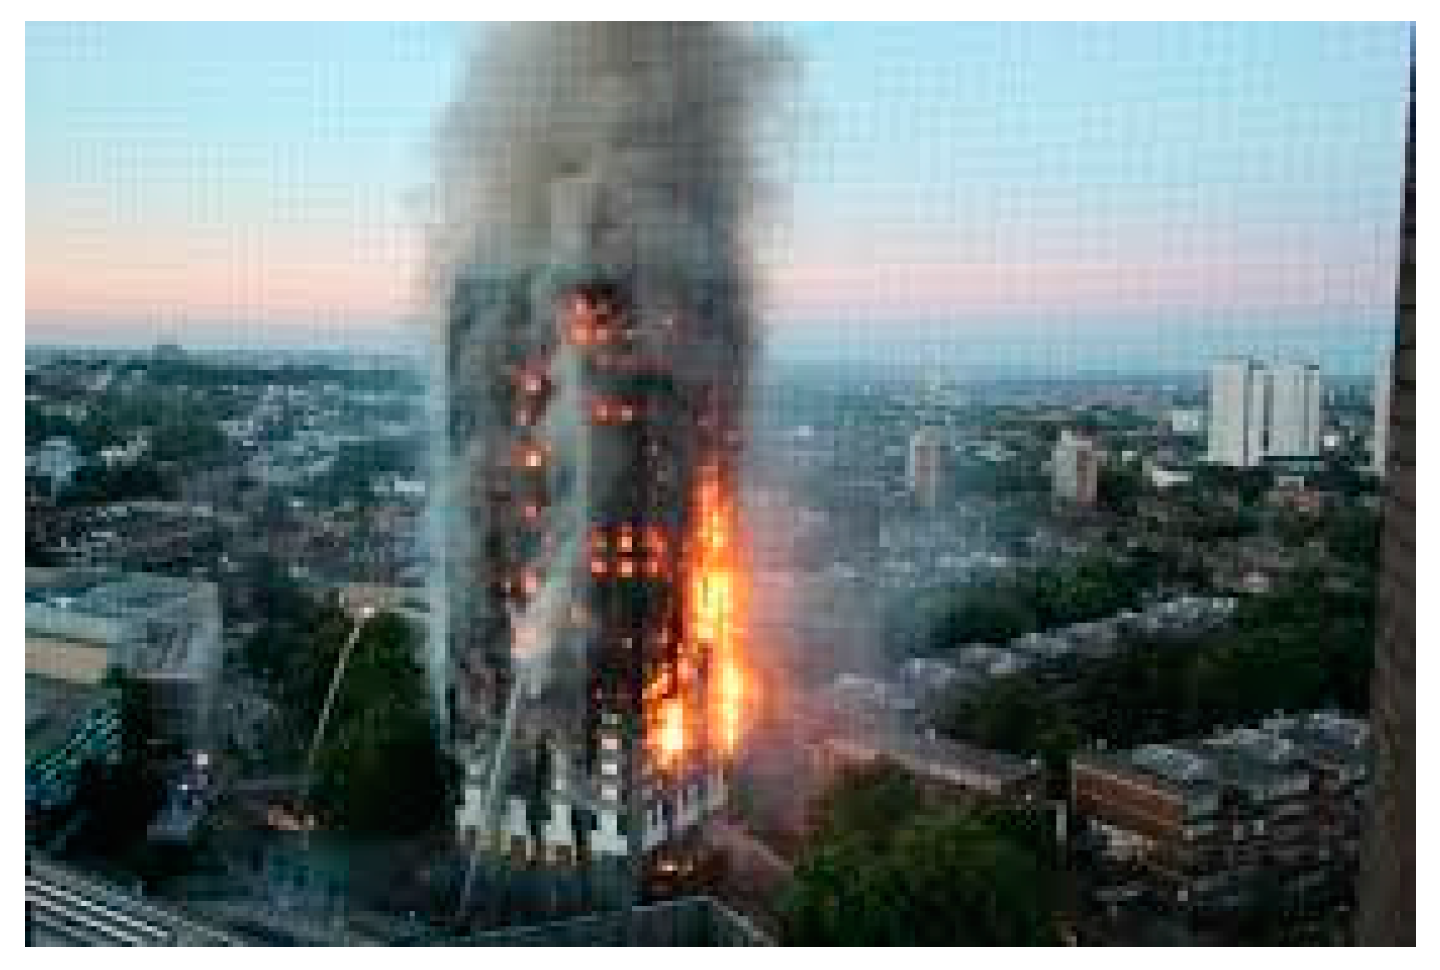
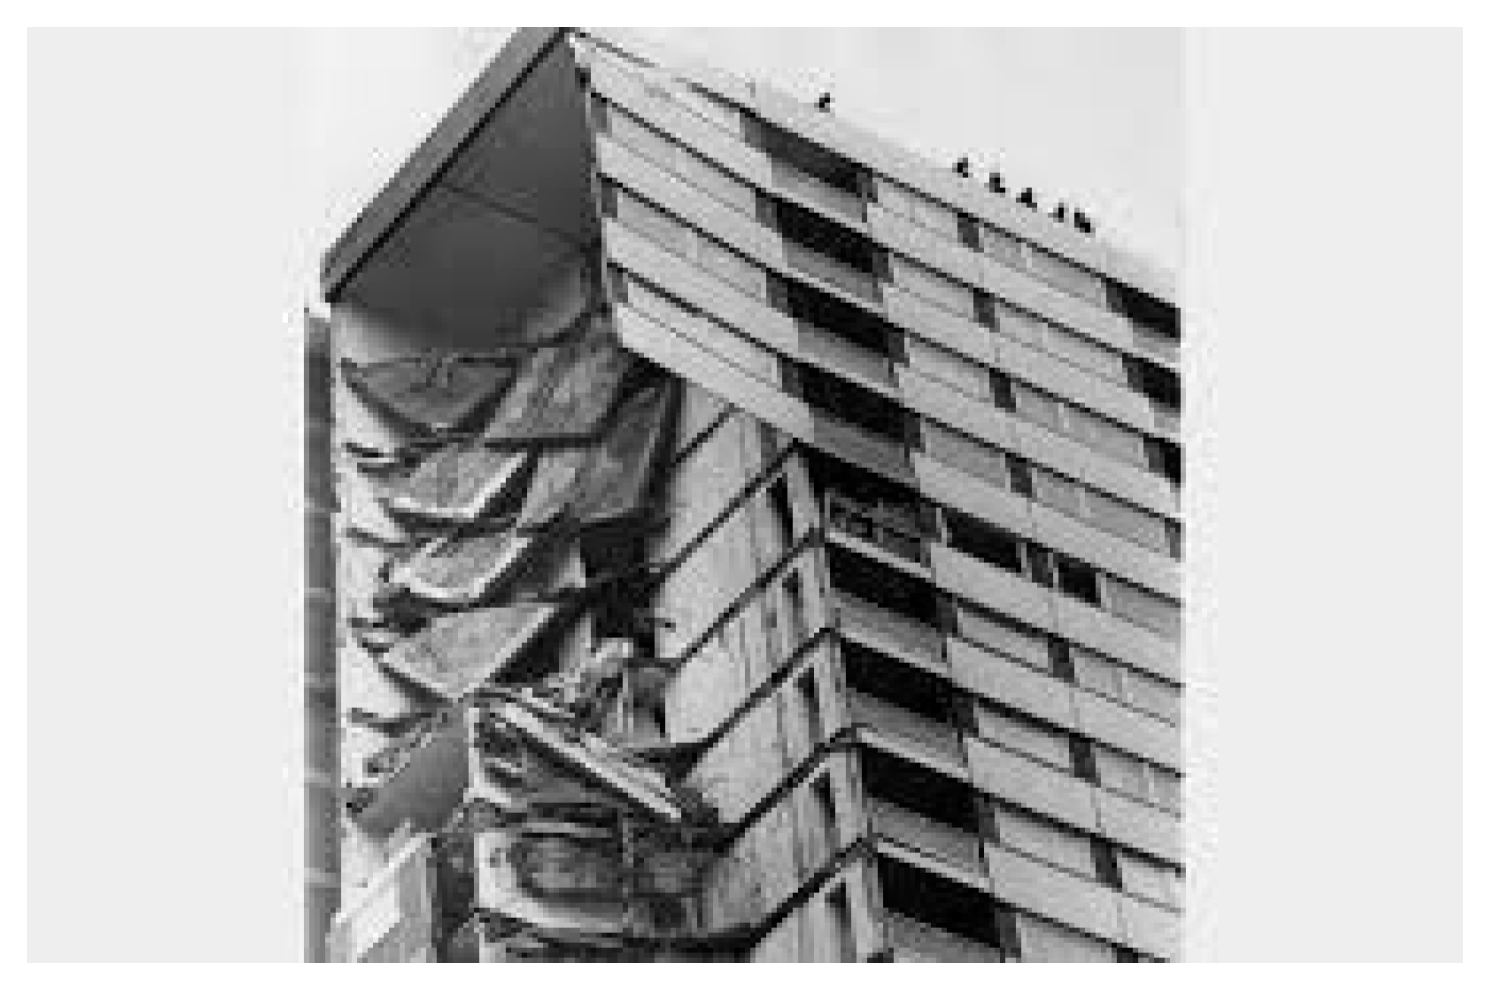
The asbestos narrative provides an excellent analogy to the current crisis in the UK surrounding flammable insulated over-cladding, that allowed the Grenfell Tower fire (Figure 14) to spread with horrifying rapidity and loss of life; the flammable version of the cladding being significantly cheaper than the non-flammable version. This follows the Ronan Point collapse in 1968 (Figure 15) where a system designed to increase the speed of construction by supporting each floor slab on the precast wall panel, resulted in a progressive collapse after a gas bottle exploded. It appears that, at least in the UK, clarion calls warning of such dangers in advance of each entirely predictable catastrophe, rarely precipitate behaviour change. A total of 75 people died in the fire and the previous structural collapse. This number pales into insignificance when compared with those dying every year due to living in cold, damp and energy inefficient “slum” housing.
8. Fuel Poverty and Excess Winter Deaths (EWDs)
The UK has a peculiarly high number of EWDs (deaths occurring in December–March compared to any other four-month period). There were circa 50,000 in 2015, down from over 65,000 in 1975 [24]. This phenomenon is not evident in countries with similar climates. The major causal factor therefore appears to be the inability of many UK subjects to adequately heat their homes to thermally safe [25] temperatures, due to a combination of poverty, inefficient or expensive fuel options/systems and historically poor insulation standards. When the Scottish Index of Multiple Deprivation SIMD [26] was correlated with excess winter deaths per region, a clear pattern emerged demonstrating that those living in “fuel poverty” in regions with a high SIMD were twice as likely to die in the winter months as those living in more affluent areas [27]. These deaths are rarely registered as hypothermic in nature. Drops in body temperature result in physiological changes that thicken the blood and reduce the immune system’s ability to fight infection [28,29]. This results in an increase in heart attacks, strokes and respiratory disorders, many of which prove fatal. The most recent statistics published by the Scottish House Condition Survey [30] (relating to 2014) estimated that 30.7% of the population (748,000 households) remain in “fuel poverty” with 8.3% in extreme fuel poverty; where the household has to spend over 20% of their net income on fuel.
This is a legacy of the initial government response to the OPEC oil crisis in 1975, where fuel costs increased over a short time frame. The UK Government Act and associated campaign [31] to “save it and seal it” was an initiative that focused on reducing energy use by fitting draught stripping measures and blocking chimney flues; a strategy that was already on-going as part of the 1960’s Clean Air acts. Reducing draughts was considered to be the most cost-effective route to energy efficiency. More enlightened contemporary efforts have focused on fitting cavity or external insulation and double glazing, incorporating small slots in the upper window frame to allow what purports to be, an appropriate level of background ventilation. The effect however, has been to dramatically reduce internal air change rates that have now fallen to such a low level that internal water vapour build-ups from bathing, cooking and internal clothes drying [32] have resulted in exceptionally poor indoor air quality (IAQ) where high relative humidity supports the growth of bacterial pathogens and in particular, the growth of mould fungal spores that are particularly prevalent at multiple “cold bridges” in the building fabric.
9. “Open Your Windows and Turn up Your Heating”
In 1984 the Scottish Local Authority Housing Group [33] reported that over 250,000 Scottish public sector dwellings were affected by condensation dampness and mould growth. In 1989 Glasgow District Council published their own survey [34] and reported that of the 287,194 occupied units (all tenures), 84,519 were damp with a remarkable 38% of the public sector dwellings affected. After 10 years of investment to refurbish and improve the energy efficiency of the existing stock, the 2002 Scottish House Condition Survey [35] reported that 131,000 dwellings were still suffering from rising or penetrating dampness, and 233,000 dwellings had visible mould growth due, in the main, to poor energy efficiency leading to condensation dampness. This equates to 11% of the stock. The figures for 2014 [36] confirmed that 304,000 dwellings remained damp, with condensation being observed in 226,000; almost no change over a period of 12 years where the stock has had significant level of retro-fitting with loft, cavity wall or external insulation. These statistics support the hypothesis that, although the stock is significantly more energy efficient than it was 20 years ago, the major portion of this energy saving has been won by reducing ventilation rates, allowing internal relative humidity to remain at elevated “unhealthy” levels and highly likely to result in condensation dampness and its associated growth of mould fungal spores.
10. Mould Fungal Spores and Health: A Society in Denial
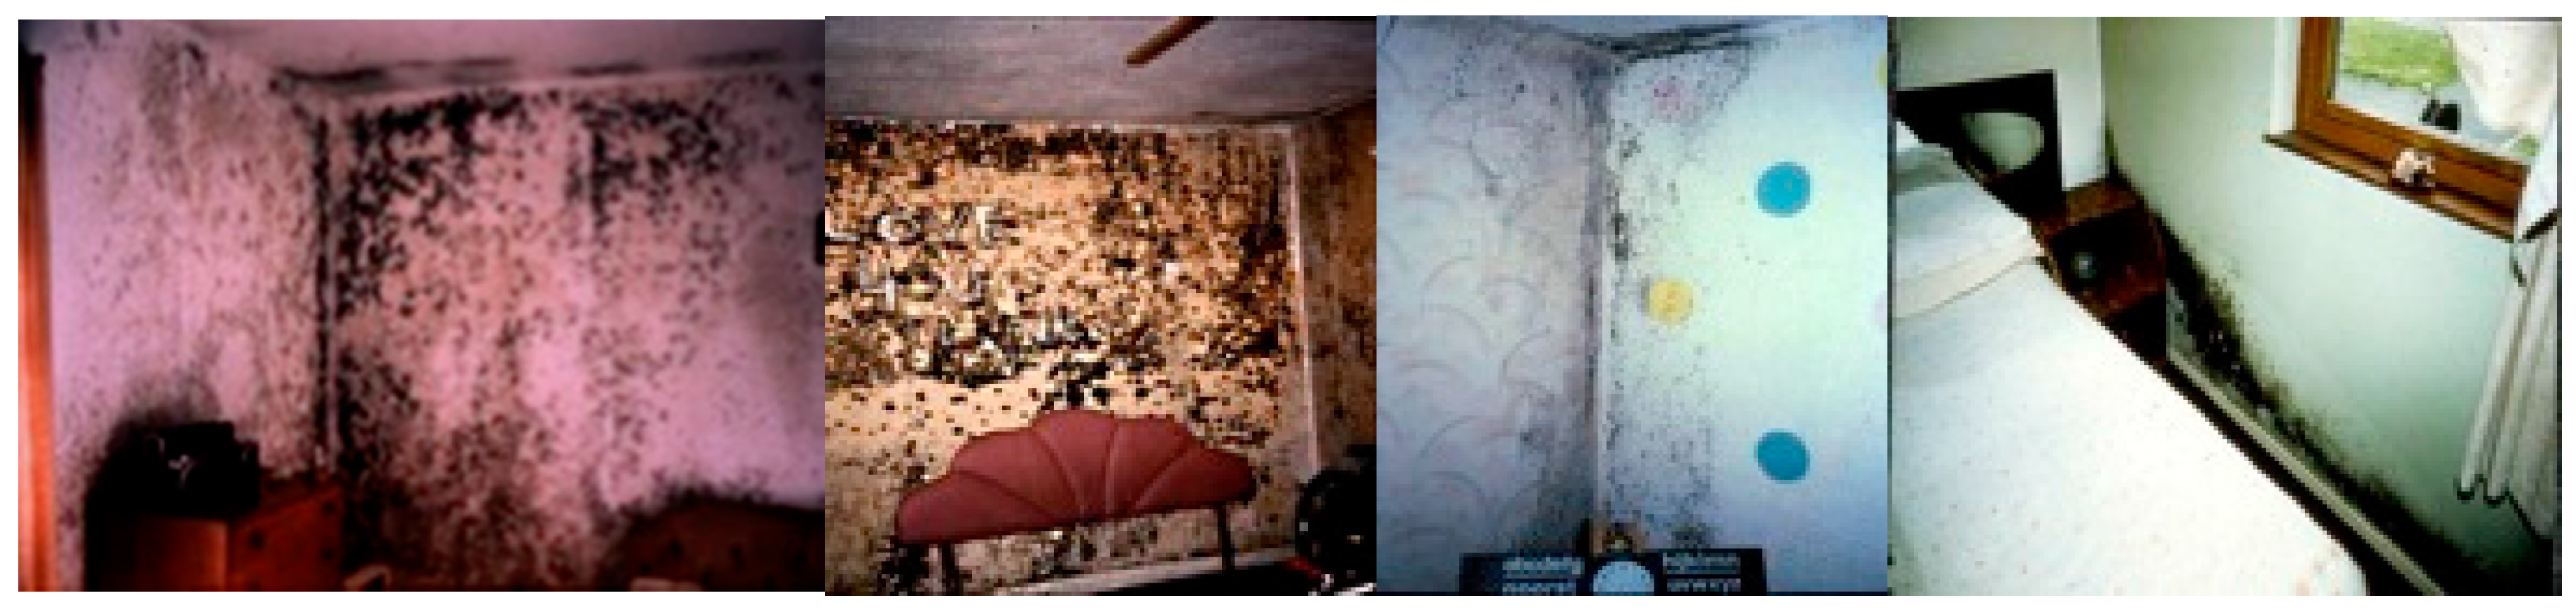
During the late 1980s, the possible links between mould growth and health status were investigated by a team of architects and medical researchers, over a two-year period. The results published in the British Medical Journal [37] demonstrated unequivocal associations between mould growth and a variety of medical conditions. The mould fungal spores, mainly from genera penicillium, cladisporium, aspergillus and alternaria found in the dwellings (Figure 16), have subsequently been associated with diseases such as alveolitis, aspergillosis, bronchitis, toxic pneumonitis, rhino conjunctivitis, cancer, chronic fatigue syndrome, asthma, bronchitis, gastro-instestinal ailments, depression, Crohns disease and multiple sclerosis (MS). Scotland has the highest prevalence of MS [38] and Crohns disease [39] in the world with a 750% increase in the last 45 years; a remarkably similar increase to prevalence as asthma over the same timeframe. The survey collected thousands of mould samples from mainly wall surfaces for laboratory analysis, however, the number of species and types identified, produced an unmanageable number of variables and it was therefore impossible to demonstrate direct causality between a particular species of mould and any specific disease. Although the work was widely quoted in various court proceedings, Scottish Sheriffs refused, in the main, to recognise this association and award damages to those who were condemned to live in such squalid conditions.
A more recent study [40] has managed to resolve this complex problem by correlating respiratory symptoms in people with GP diagnosed asthma with the spores found in hundreds of dust samples taken from domestic carpets and bedding. A new index, known as the “Environmental Relative Mouldiness Index” (ERMI) reported that values taken from a random sample of dwellings (n = 99) in Scotland’s central belt, showed a statistically significant correlation between mould and a reduction in forced expiry lung volume (FEV). This paper may well prove to be the “smoking gun”, demonstrating, at least on the balance of probability, that mould fungal spores have serious and profound detrimental health impacts for those living in damp dwellings.
11. “Building Tight–Ventilating Right”: Health Impacts of Poor Indoor Air Quality
The quality of the air we breathe in our homes is predicated on the quality of the external air and internal ventilation rates. The UK Building Regulations state that, “ventilation should have the capacity to provide outside air to maintain indoor air quality sufficient for human respiration, remove excess water vapour from areas where it is produced in sufficient quantities in order to reduce the likelihood of creating conditions that support the germination and growth of mould, harmful bacteria, pathogens and allergens and remove pollutants that are a hazard to health from areas where they are produced in significant quantities”. The Scottish Building (Standards) Regulation, Technical Standard 3.14 [41] stated, “Every building must be designed and constructed in such a way that the air quality inside the building is not a threat to the health of the occupants or the capability of the building to resist moisture, decay or infestation”.
With the increase in insulation standards in new-build dwellings, combined with major retro-fit programmes, particularly in the public sector stock, average internal temperatures, both air and surface have been rising for 15 years [42]; however reductions in air change rates due to tighter construction techniques are transforming the stock from “cold and damp” to “warm and humid”. This somewhat ironically has presented the occupants with a new set of health problems.
The drive to reduce carbon emissions through domestic energy efficiency has in the last decade driven increasing levels of air tightness in the building envelope, a strategy that has dramatically reduced what could be considered as fortuitously high, historical air infiltration rates. Recent research reporting on post occupancy evaluations [43,44] of new-build homes constructed to the 2010 air tightness standard of 5m3/m2/hr@50Pa, with only trickle vents in the windows as the planned ventilation strategy, measured CO2 levels in occupied bedrooms (n = 24 − 2 × 7-day profiles shown in Figure 17) to be two to four times above the 1000 ppm threshold (originally defined by Pettenkofer [45] in the 19th century) as representing reasonable indoor air quality.
When considered as a discrete volume, an occupied apartment will require a substantially greater ventilation rate than can be provided solely by trickle ventilators with a free vent area of 11,000 mm2. This can also be compounded by occlusion from curtains or blinds and the habitual closing of controllable trickle vents. Such high concentrations of carbon dioxide are invariably found in bad company.
12. Our Toxic Indoor Environment
At the outset of the 20th century there were approximately 50 materials used to construct buildings. By the end of the century Raw [46] claimed that this list had grown to around 55,000, half of them being synthetic. Compounds found in indoor air may have off-gassed from the building materials, furnishings and fittings, internal processes and cleaning products. The most common gases found in the indoor environment are carbon dioxide/monoxide, nitrogen and sulphur dioxide, formaldehyde and other volatile organic compounds, radon and ozone. Some of these compounds are known to be bio-accumulative carcinogens or hormone disrupters. The most common suspended particulate matter are asbestos fibres, fibrous particulates (fibreglass or rockwool), bacteria and fungi, tobacco smoke, house dust mite allergens, pollen and dust [47,48]. Changes in lifestyle such as indoor clothes drying, are in part driven by changes in design, and high levels of indoor humidity can have a major impact in terms of the germination of bacteria, fungi and the colonisation and proliferation of house dust mites [49].
13. Housing and Asthma
In February of 2004 the Global Initiative on Asthma (Gina) [50] reported that 18.4% of Scots suffer from asthma. This compares with 15.3% in England, 10.9% in the US, 6% in Belgium, 4.5% in Italy and 2.3% in Switzerland. The report also claimed that 35% of Scottish 13–14 year-olds, experienced “wheezing” over a 12 month period. Of the 84 countries surveyed, Scotland had the highest prevalence of symptoms in this group. Over the past 30 years the incidence of asthma episodes has increased by a factor of three to four in adults and six in children. In 2014, 5.4 million UK citizens were receiving some form of treatment for asthma [51]. Although allergic disease is on the increase across the developed world, what factors are unique to the Scotland that can be identified as key causal mechanisms driving these differentials? Numerous hypotheses have been postulated to account for the dramatic increase in allergic disease [52] (pp. 6–22); increased exposure to perennial allergens; more time spent indoors, decrease in bacterial and other infections, improved hygiene, immunisation the prophylactic use of antibiotics, changes in gut flora caused by the over use of antibiotics, a decline in physical exercise, high fat/salt diet and the loss of a specific protective effect such as exposure to types of bacteria found in natural environments or the eradication of parasitic intestinal tape worms; however, it is difficult to build an evidence base case that identifies any of these factors being unique to Scotland. Pollution from motor vehicles has been implicated, but the incidence of acute attacks is higher in the Western Isles of Scotland, where external air quality is excellent, than in London [53]. Exhaust fumes may trigger an attack but they do not appear to be important in the aetiology of the disease.
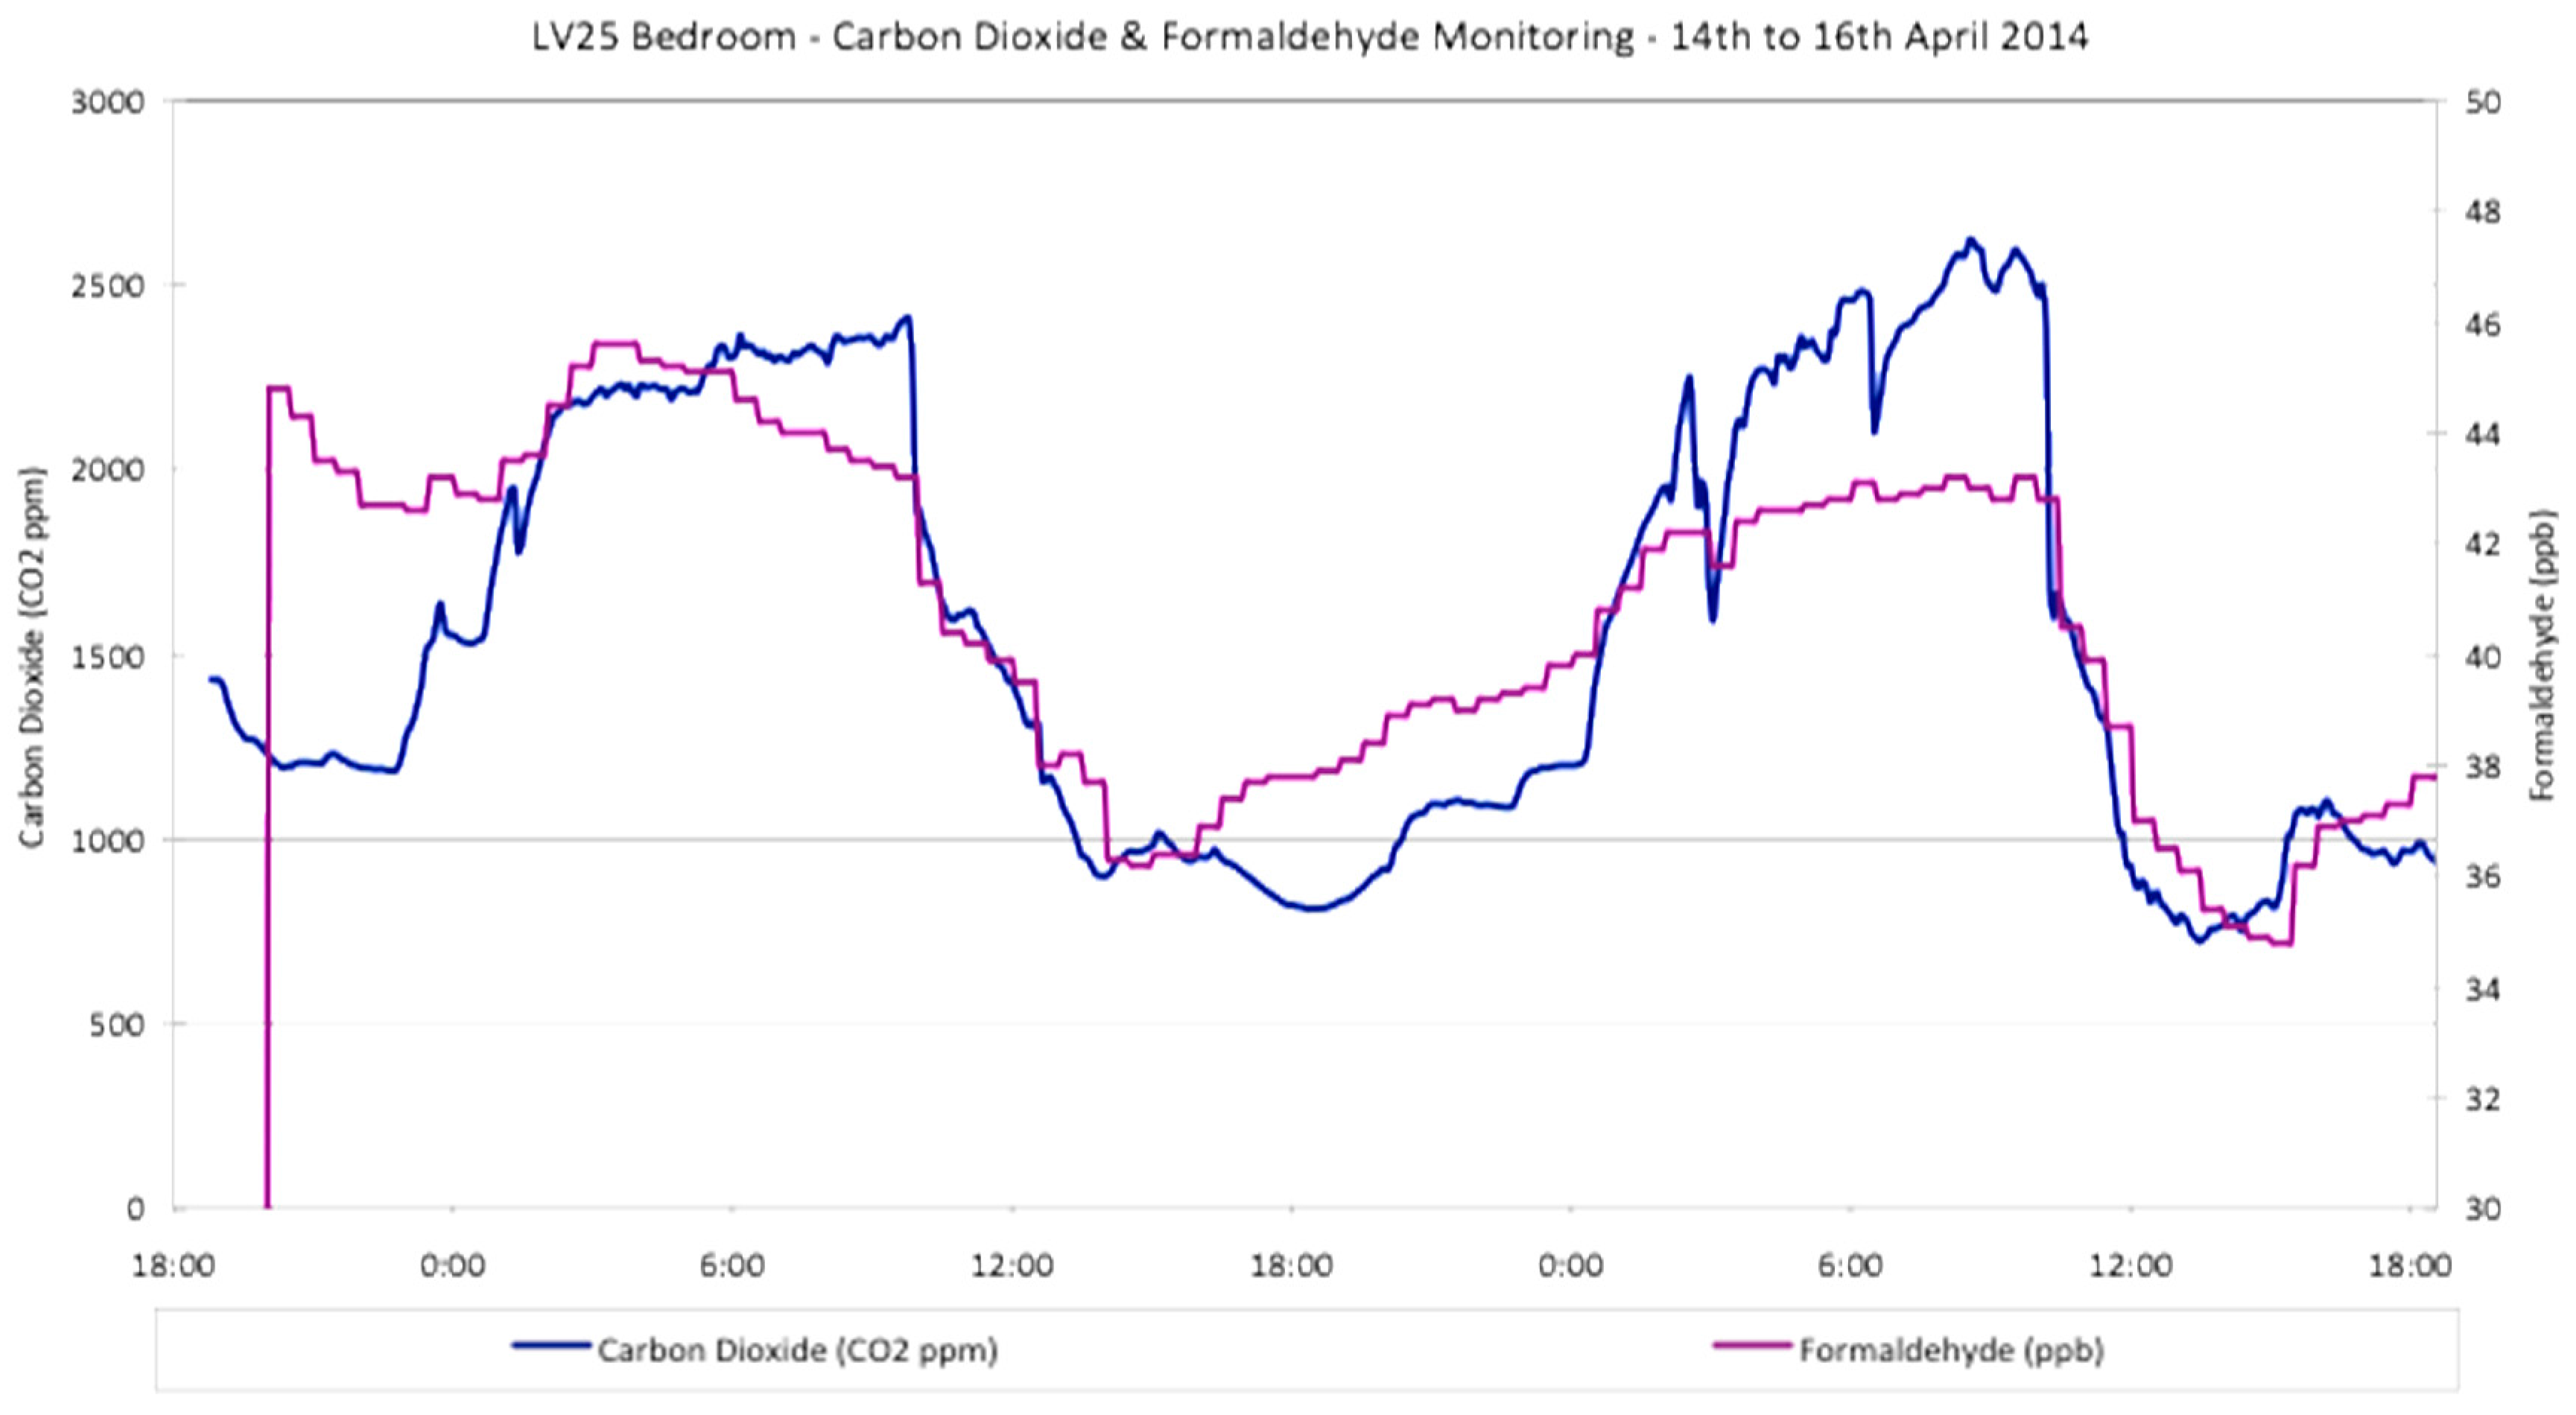
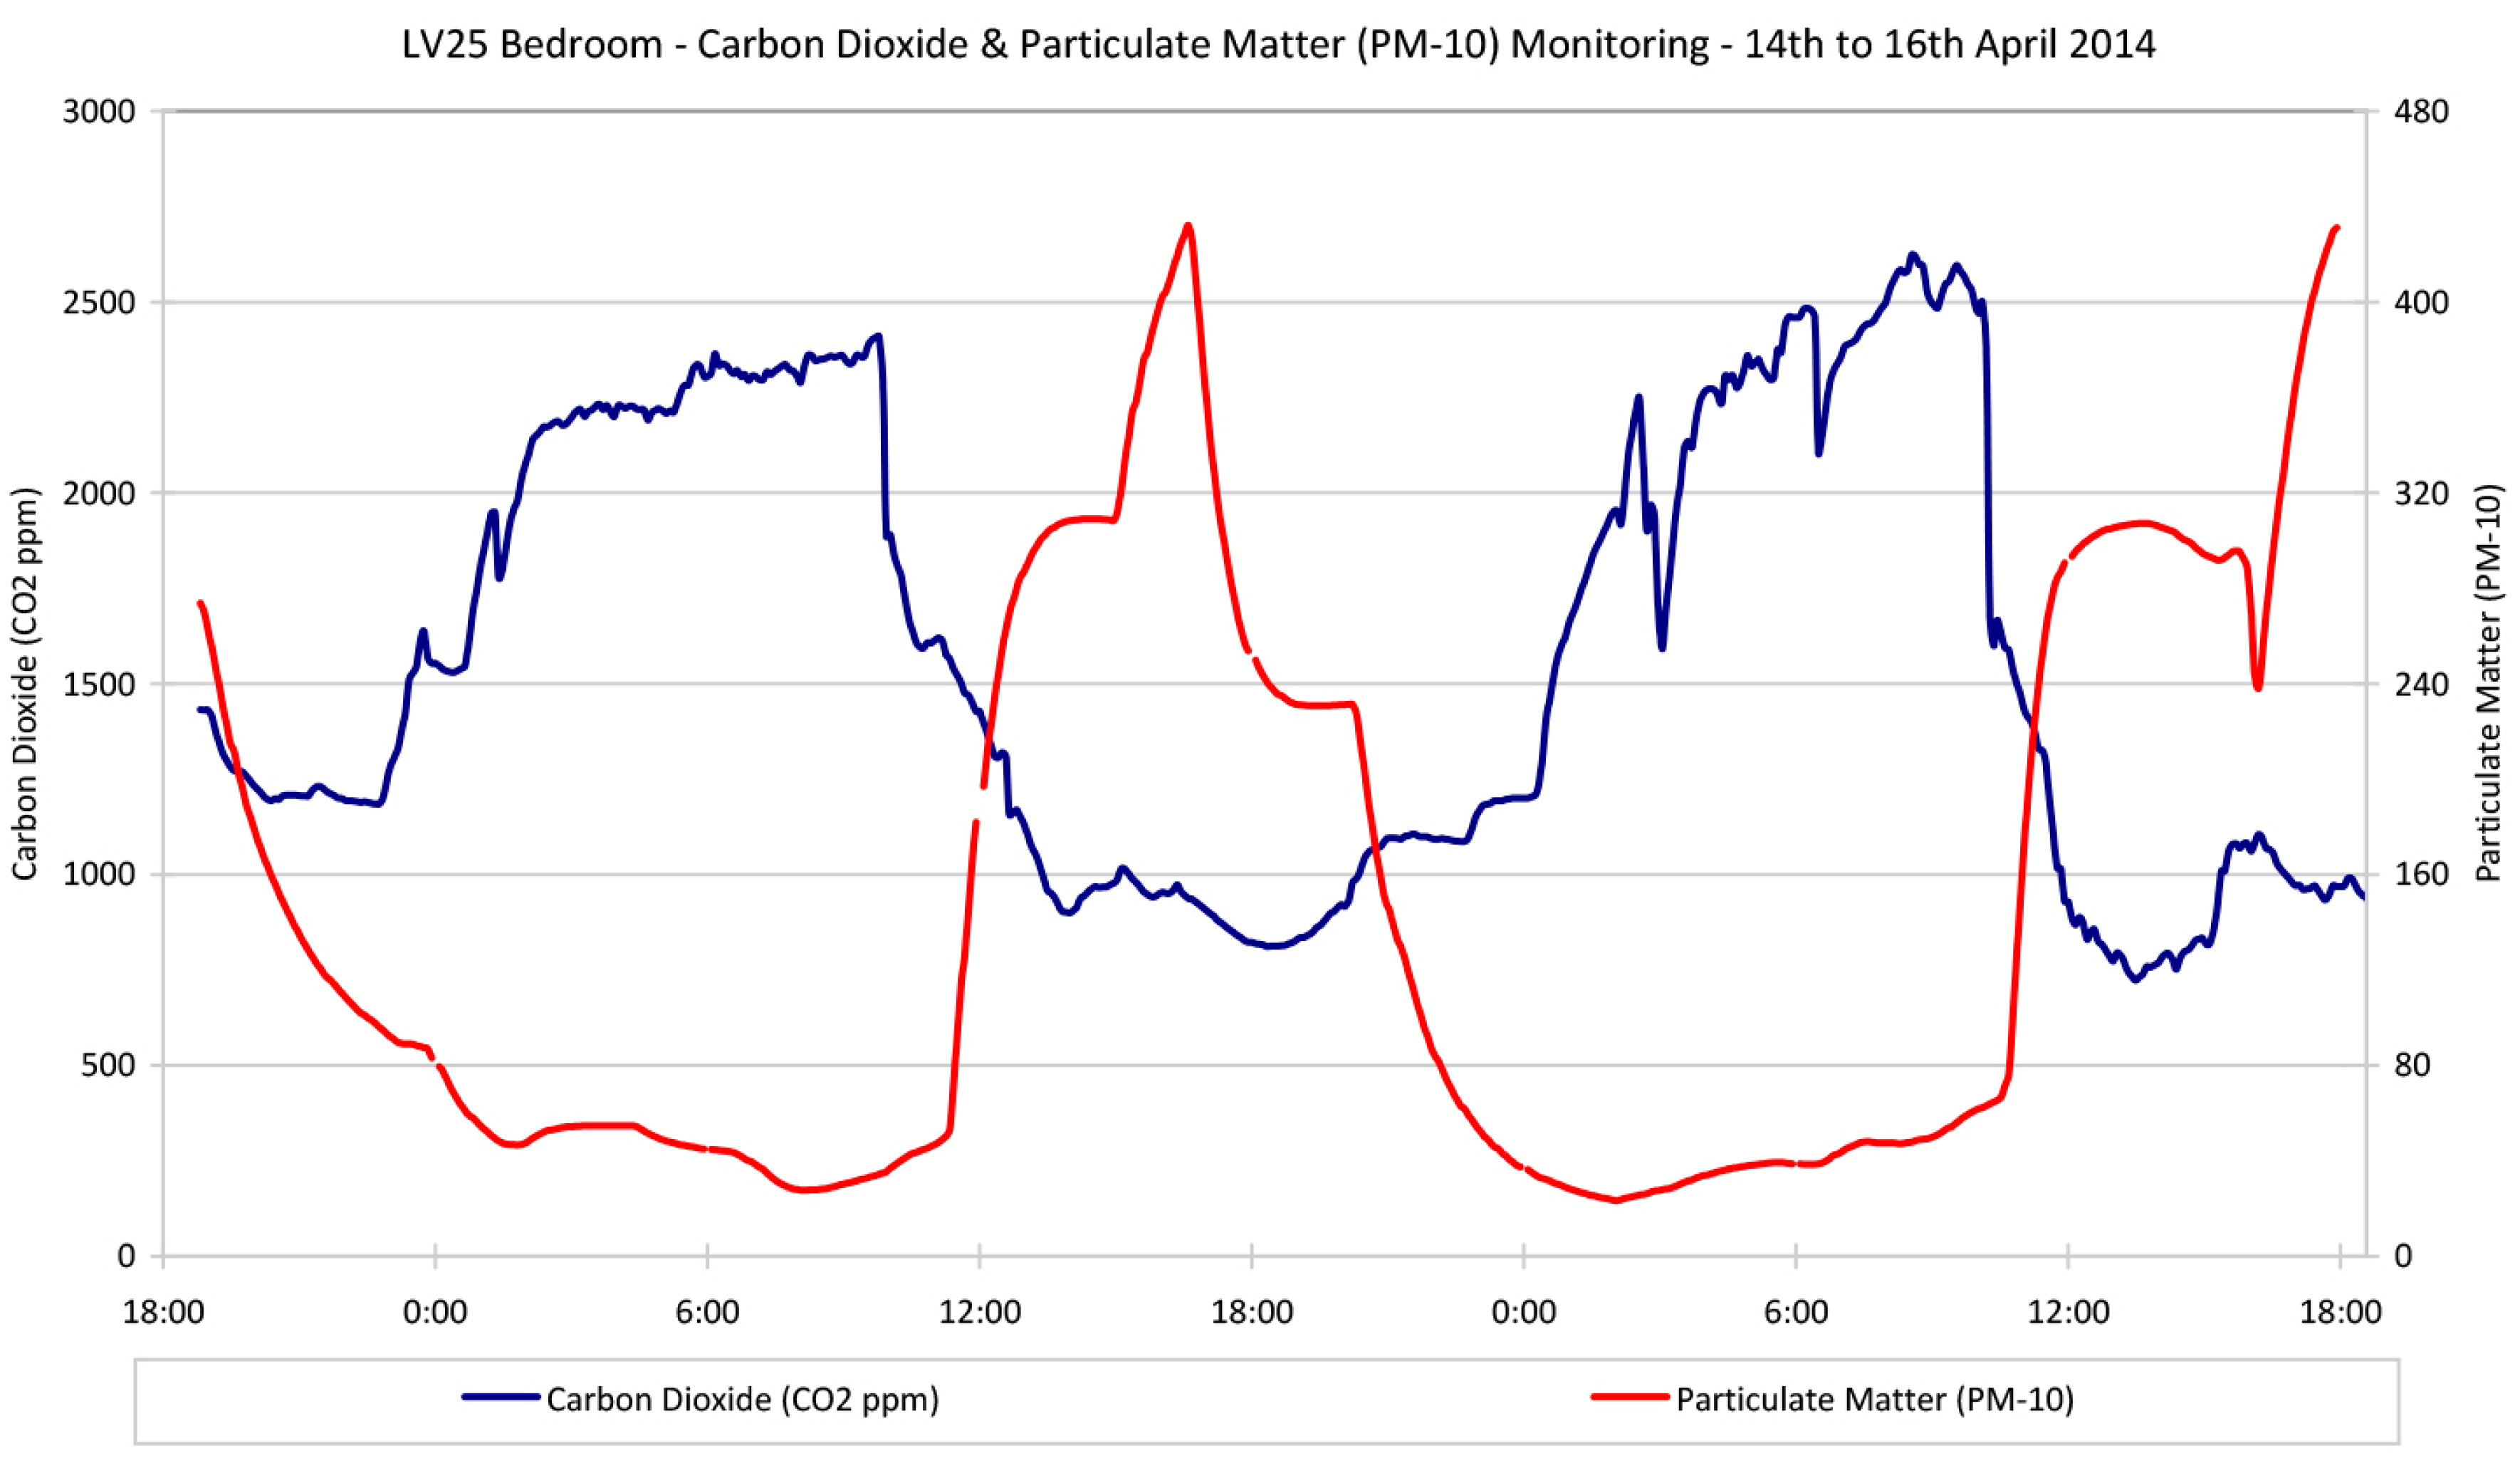
There is an additional major problem in urban areas where external air pollution is invariably high. A recent study [54] investigating ventilation rates in central Glasgow, demonstrated that opening a window will result in CO2 levels falling with ‘fresh’ air infiltration, however, formaldehyde levels were positively correlated and there was a distinct negative correlation with PM10 particulates (see Figure 18 and Figure 19). Opening windows in urban areas clearly allows allows traffic fumes to infiltrate. The UK Government has published data [55] claiming that there is no safe threshold for such particulate matter, with each rise of 10 µg/m3 responsible for a 3% increase in asthmatic attacks, broncho-dilator use and lower respiratory tract problems and a 1.9% increase in hospital admissions. Average background levels across the UK in urban areas in 2016 were measured at 20 µg/m3 [56].
14. Energy Crisis as the Primary Driver
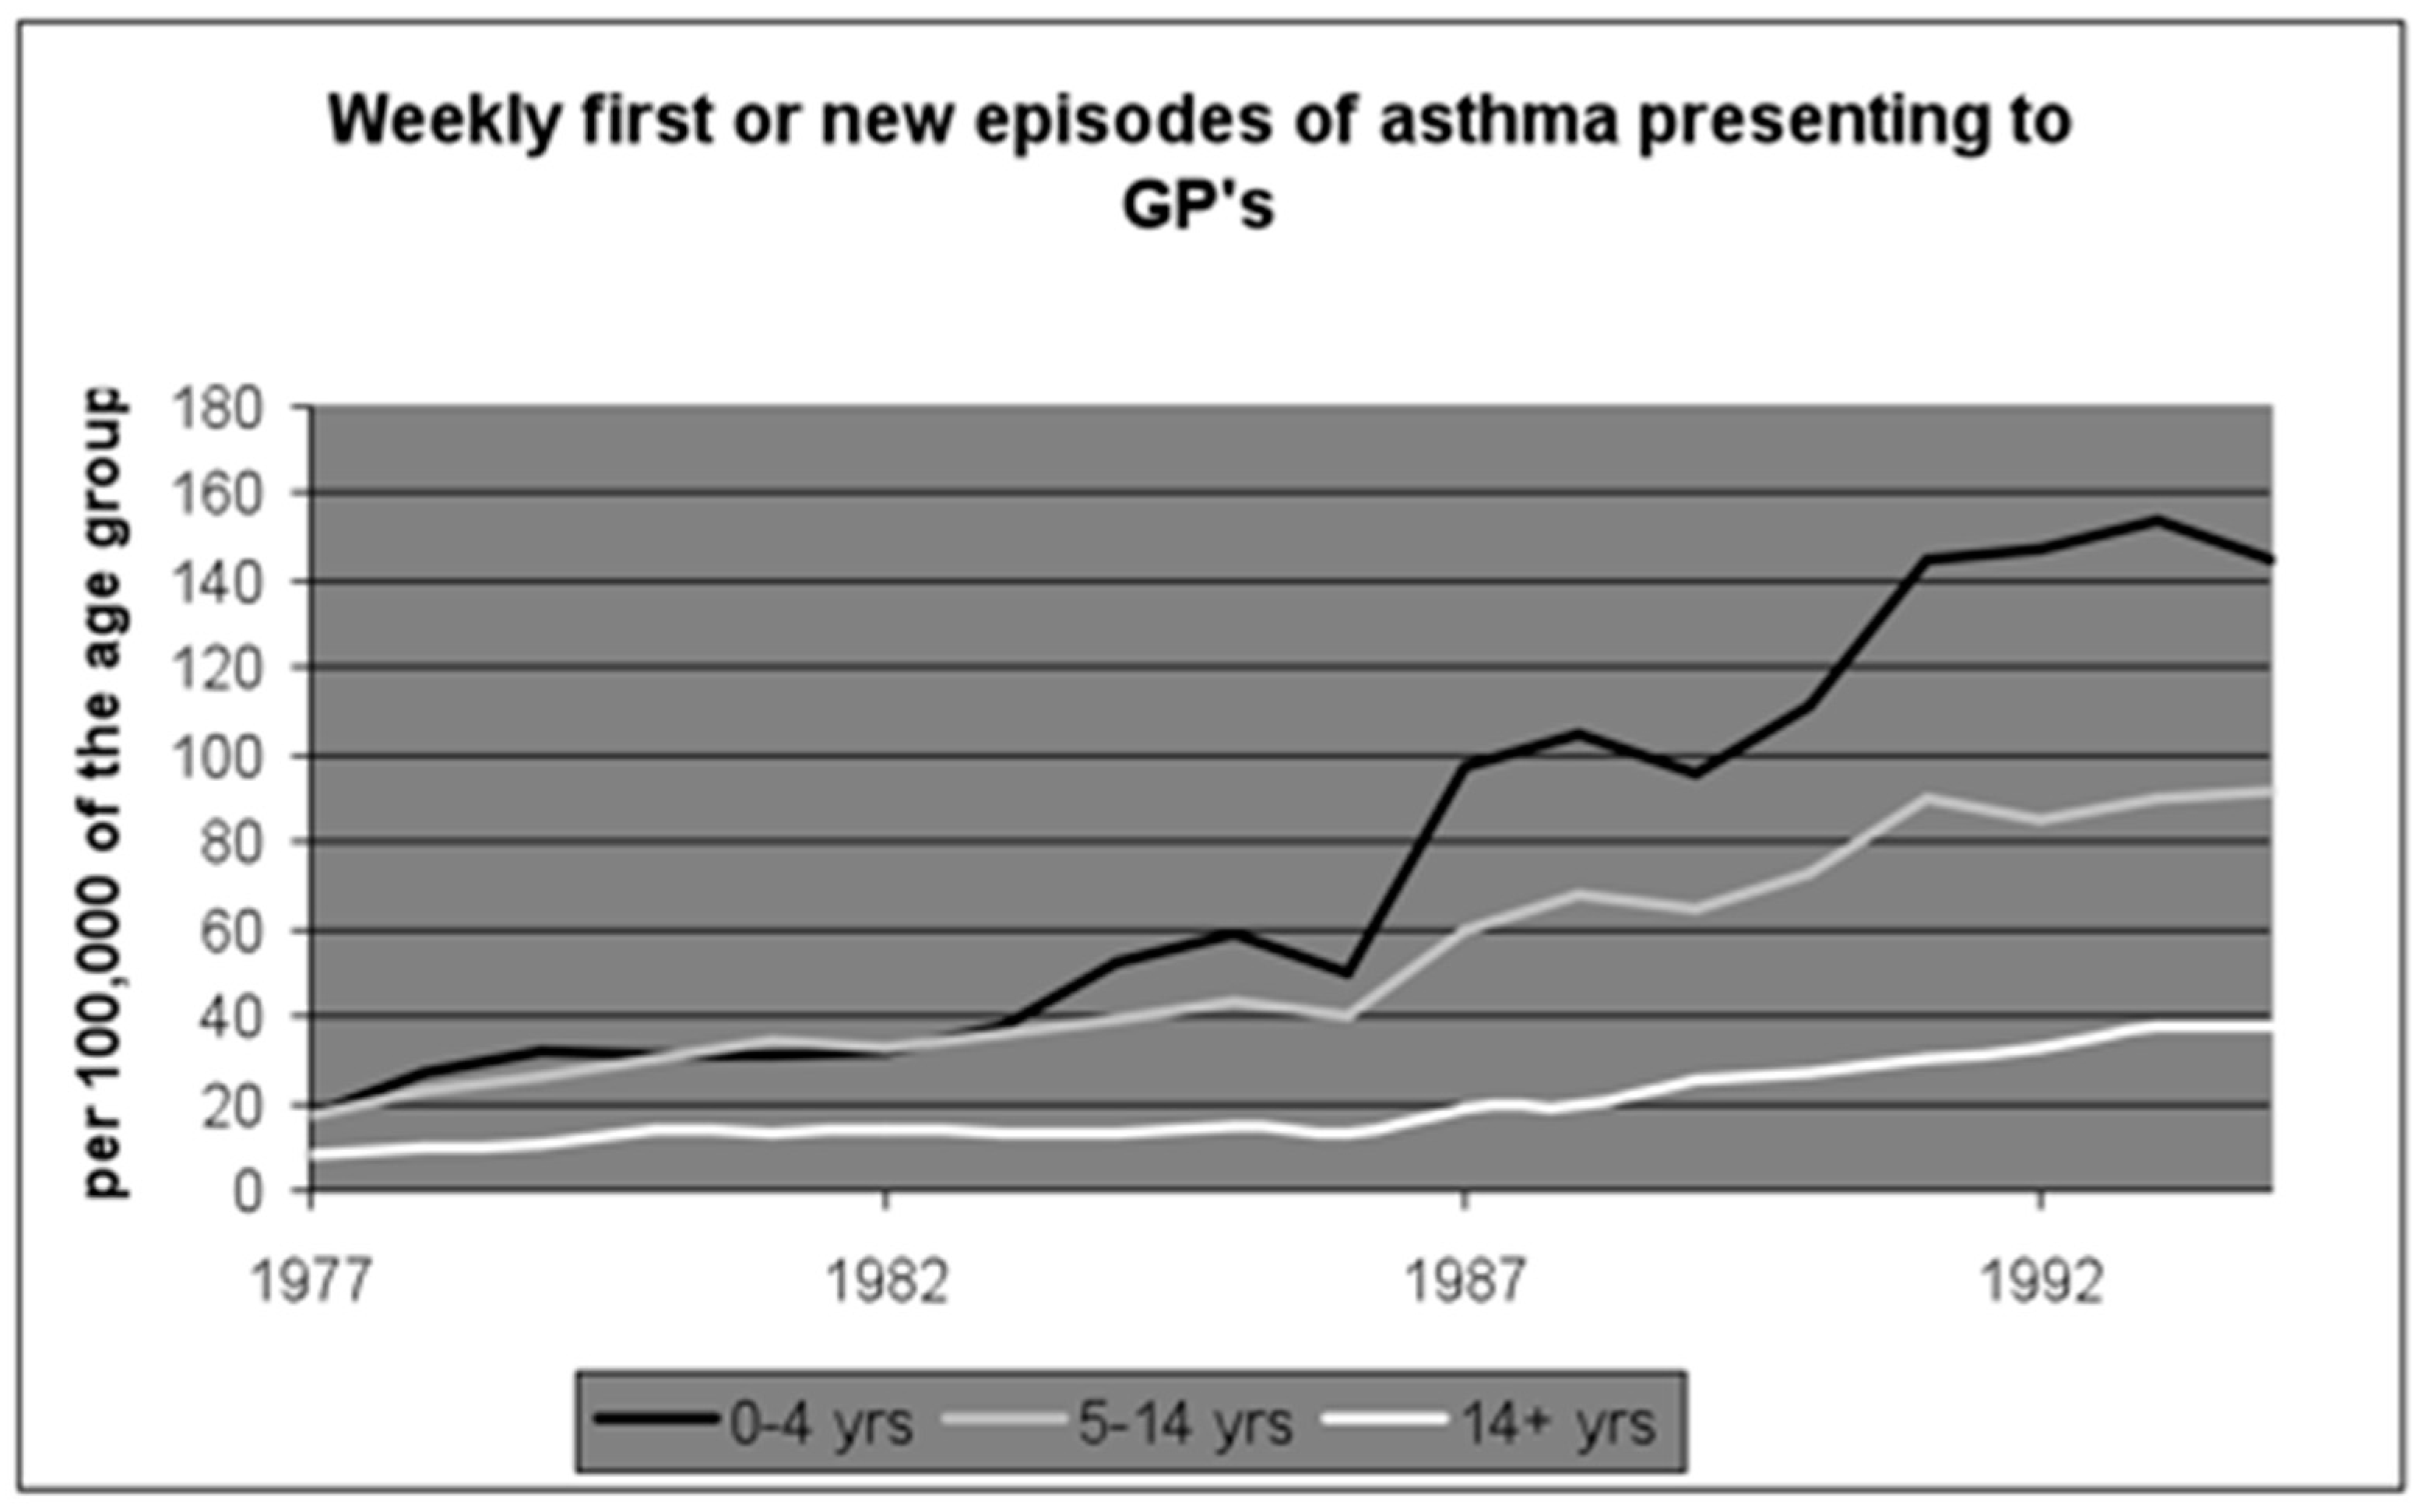
The genesis of the asthma pandemic in Scotland can be traced to the mid-seventies. Draught-stripping, the sealing of chimneys and double-glazing kick started the reduction in domestic ventilation rates [52] (pp. 62–73) which in turn produced a warm and humid indoor environment. Such conditions are ideal for the colonisation and proliferation of the house dust mite (HDM). HDMs thrive in high humidity that moistens their major food source (human skin scales). They excrete a range of highly allergenic proteins that have been identified, both as a causal mechanism in the development of the disease, and as irritants likely to trigger and exacerbate asthmatic symptoms. Eight out of ten asthmatic children have been found to be allergic to these proteins [57]. Figure 20 shows the rise in asthma prevalence mirroring the widespread reduction in ventilation rates.
In 1999, a two year study [58] that focused on one housing scheme undergoing a major capital investment programme on the outskirts of Paisley, reported that childhood asthma rates were significantly higher in the dwellings that had been retrofitted with insulation, new windows and central heating systems. Taking children out of cold, damp homes and re-housing them in warm humid homes, appeared to trigger a significant increase in disease prevalence and symptomatic state. The culprit was quick to emerge. House dust mites do not thrive in cold and mouldy dwellings [59]. They are much more at home in hygro-thermal conditions where relative humidity is maintained above 70%, and average indoor temperatures are close to 25 °C, an environment typical of small, air-tight and well insulated dwellings, where indoor clothes drying keeps RH at ideal levels for colony proliferation. Dust mites excrete 15 highly allergenic proteins in the faecal pellets that can typically be found in high concentrations in dust reservoirs and bedding [52] (pp. 87–105). Such a hypothesis was further supported by two interventionist trials undertaken in North and South Lanarkshire [60,61] that confirmed the majority of dwellings had dust reservoirs containing HDM allergen levels well above the WHO sensitisation threshold of 2 μg/g of fine dust, with 56% of beds found to contain concentrations known to cause an immediate acute reaction (10 μg/g). Steam cleaning the carpets and the replacement of bedding and mattresses, successfully reduced HDM allergen levels by around 95%. Improving indoor air quality by installing mechanical whole house ventilation systems incorporating heat recovery to reduce indoor water vapour pressures below 60% RH, increased lung function by over 20 L per minute in a cohort that had medically diagnosed “severe” asthma; compelling evidence that aggressive allergen avoidance measures (whole house steam cleaning in combination with new bedding) can produce immediate and significant improvements, even in an adult cohort with a well documented history of symptoms over many years.
15. Timber Frame Construction—“Living in a Plastic Bag”
In Scotland the market in private dwellings is almost exclusively based on timber frame construction techniques. The timber frame and integral insulation, fitted between the timber studs, isolate the thermal mass of the brick outer leaf, resulting in a lightweight, fast response thermal environment, suited to intermittent occupation cycles. Such a technique also incorporates a polythene vapour barrier behind the plasterboard, effectively trapping all moisture within the impervious building envelope. When combined with air-tight construction techniques that further reduce background ventilation rates, the result is a warm and humid internal environment. When the heating system is switched off overnight, internal temperatures drop rapidly and result in a diurnal condensation cycle, particularly during the winter months when trickle vents are habitually kept in the closed position, with the excess moisture typically absorbed by hygroscopic soft furnishings, carpets and bedding. The saturation of these micro-climates and the growth of aspergillus mould on the shed human skin scales (reducing their fat content) is the key precursor for HDM colonisation and proliferation [62]. Timber frame construction that encapsulates the occupants in plastic vapour barriers is therefore the key variable that has produced Scotland’s asthma pandemic. Similar to the asbestos debacle, the entire timber frame house construction industry is once again in denial and it is these short-term commercial interests that are inhibiting the necessary corrective action.
16. “Rubble in the Park”: The Demolition of Glasgow’s Red Road Flats
Occupied in 1969, the 32-storey blocks initially housed a total of 4700 occupants. The mid-70s energy crisis saw the flats develop a high incidence of dampness and mould. This is not unusual for high rise towers where Glasgow’s driving rain index combines with poor joint integrity and high specific heat losses, to produce both penetrating and condensation dampness. A series of dust assays taken in an similar block where the tenant was suing the public sector landlord for causing her son’s asthma [63], produced a figure of 1400 μg of HDM allergen per gram of dust; 700 times higher than the WHO sensitisation threshold [48].
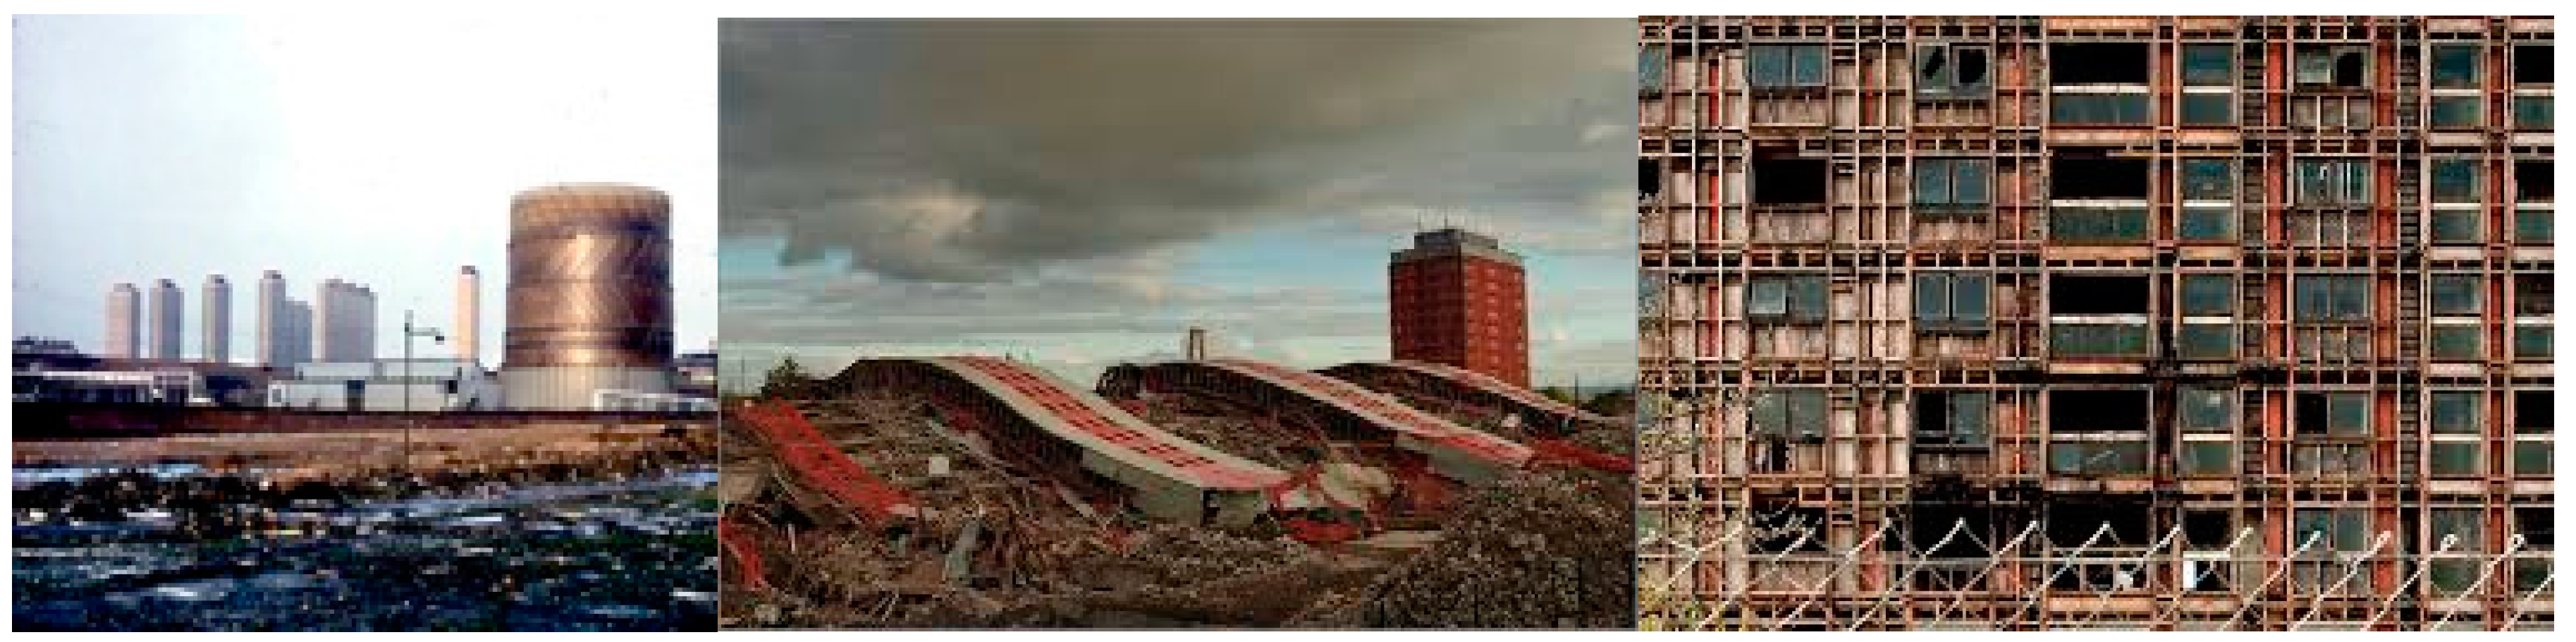
In 2003 Glasgow City Council transferred their remaining housing stock (circa 85,000 units) to Glasgow Housing Association (GHA). The economic rationale for this was compelling. The Scottish Executive agreed to write-off circa one billion pounds of housing debt, allowing GHA to raise new funds for much needed repair, renovation and improvements; a sum estimated at the time to be in the region of £900 million The economics of this transfer were quite remarkable. The 85,000 council dwellings being transferred, had a book value of only £25 million [64]. This equated to just under £300 per dwelling, yet many of these units -previously purchased by the sitting tenants—were now changing hands for over £50,000. Hidden within the figures were the estimated costs for the future demolition of Glasgow’s 330 tower blocks, and none was more expensive than the demolition of the Red Road flats; the volume and position of the asbestos ensuring that explosives could not be utilised until all the fibrous material was stripped out by hand (Figure 21).
Demolition and construction times were remarkably similar. The precise cost of this work is difficult to ascertain but one estimate puts it at circa £60 million. The men who built the blocks paid a much higher price. In 1984, a local action group traced 180 workmen. Of this cohort, 60 were already dead and of these, 50 had died from mesothelioma. The average age of the men when they died was 51.
17. Towards a “Wealthier, Fairer, Smarter, Healthier, Safer, Greener Scotland”?
Scotland’s legacy of feudal land ownership patterns combined with land banking by private builders are driving house price inflation. These companies and individuals are enriching themselves at the expense of the population who, in the main, are paying significantly more for less in terms of space standards and built quality. This is the exact opposite of a “wealthier” and “fairer” society; two of the key stated aims of the current Scottish government [65]. As house price inflation is again starting to rise, it is obvious that national governments remain incapable of intervening in the boom and bust cycles delivered by neo-liberalism. Private sector developers are building dwellings on green field sites using techniques and materials that off-gas pollutants and are particularly prone to HDM infestation. The drive for energy efficiency has dramatically reduced indoor air quality and increased humidity, resulting in dwellings being infested with house dust mites. This is the key variable accounting for the higher disease prevalence in Scotland. This is neither “smarter” nor “safer”.
Reducing ventilation rates to improve energy efficiency and lower carbon emissions, without incorporating a planned and effective ventilation strategy, is likely to result in a more toxic and hazardous indoor environment that will have an insidious and long-term impact on public health. Scotland is rapidly moving from cold damp housing, to warm humid housing. This has changed the nature of the deleterious impacts on respiratory health, with HDM allergens now ubiquitous in Scotland’s indoor environment. Building dwellings that are more prone to HDM infestation will not produce a “healthier” Scotland.
By allowing new housing to be built in the countryside, the drift away from urban locations with good public transport infrastructure will increase Scotland’s carbon footprint. This is neither “smarter” nor “greener”.
18. Tackling Poor Indoor Air Quality: What Is to Be Done?
Technical Standards prescribed by the Building Regulations should be rigorously enforced with designers and house builders required to demonstrate a planned ventilation strategy that maintains “healthy” IAQ (CO2 maintained below 1000 ppm) in all occupied rooms. Post occupancy building performance evaluation is required to establish actual real-life performance, and to provide an epidemiological evidence base for changes in legislation and design for occupant health. This will force the industry to adopt techniques that can optimise energy efficiency while ensuring “healthy” indoor air quality. This in itself may be sufficient to prevent the next generation from developing HDM induced asthma.
Reliance on trickle ventilators to provide background ventilation in airtight buildings should be reconsidered, with a greater emphasis placed on the planning and prediction of overall house ventilation strategies, taking into account (either solely or in combination) cross, stack, permanent, displacement and mechanical ventilation (either positive pressure or balanced systems preferably with heat recovery as standard).
Legislation is required to specify minimum “safe” levels for indoor air pollutants in the domestic environment. Although any study that attempts to incorporate the synergistic, additive or antagonistic chemical and biological reactions that may occur in the indoor environment would have to address an unmanageable number of variables, such complexity should not provide an excuse for doing nothing in terms of research, guidance and the development of legally binding standards in respect to individual compounds. The use of proxy compounds such as CO2 and/or relative humidity can be used indicatively as measures of IAQ, and should be included in performance standards.
Monitoring or control of actual performance for immediate feedback to occupants or mechanical systems could be achieved by using CO2 or humidity sensors. This could include a CO2 monitor installed in the living room (possibly on a standard traffic light warning system) to alert occupants when CO2 levels exceed 1000 ppm (amber) and 2000 ppm (red). Such an alert may stimulate occupants to open a window for even a short period of time and allow CO2 levels to partially equalise with ambient air; a recommendation that has somewhat remarkably been rapidly adopted and enshrined in the latest revision of the Building Standards (Scotland) Regulations [66].
19. Increasing Housing Quality and Reducing Carbon Emissions
Enacting a “land tax” [15] (p. 277) to replace the current Council Tax, will see the vestiges of the feudal aristocracy and “land bankers” divest their holdings. This will result in land values dropping, allowing fixed budgets to be spent on a better quality product, in terms of volume, technique and materials that have longevity and the ability to be re-used, recycled or revert to their original state; the much vaunted “long-life loose fit” and “cradle to cradle” scenarios at the heart of sustainable building design. Reducing urban land values could allow mixed tenure neighbourhoods to be developed at 200 persons per hectare. If architects are given the budgets to produce a high quality, affordable product, increasing the quality and amenity of urban high density house design may arrest the on-going drift away from sustainable transport networks and in turn start to reduce Scotland’s carbon footprint.
20. Epilogue
An estimated 300 million people worldwide suffer from asthma, with 250,000 annual deaths attributed to the disease. It is estimated that the number of people with asthma will grow by more than 100 million by 2025 [67]. In the case of asbestos, it took over 100 years for the evidence base to be recognised. Vested commercial interest played an important role ensuring that profit was prioritised over the “health and safety” of circa 20 million asbestos victims. Similar to asbestos, a significant proportion of the current asthma pandemic and ill-health, being driven by toxic compounds found in ever increasing concentrations in indoor air, is preventable if the Scottish and UK governments are willing to accept the existing evidence base, and take steps to implement the required amendments to the building codes in conjunction with minimum air quality standards.
The laudable improvements in public health that occurred during the 20th century were driven, in the main, by the need to produce healthy workers and soldiers, to protect the economic interests and imperial conquests of UK plc. As robotics and drones are predicted to displace such a “boots on the ground” approach to manufacturing and warfare, this dynamic may not be as important to 21st century elites. The current health gap between the rich and poor may well widen, if governments do not intervene and action radical proposals. If they do nothing, they will, de facto, be complicit and the “Great Scottish Housing Disaster” will be set to continue and afflict the health and wellbeing of future generations.
Conflicts of Interest
The author declares no conflict of interest.
References
- Gonzales, M. Bulletin of the World Health Organization. The Guardian. 2 June 2010. Available online: http://www.who.int/bulletin/volumes/89/10/11-021011/en/ (accessed on 13 December 2017).
- McCartney, G.; Russ, T.; Walsh, D.; Lewsey, T.; Smith, M.; Smith, G.D.; Stamatakis, E.; Batty, D. Explaining the excess mortality in Scotland compared with England: Pooling of 18 cohort studies. J. Epidemiol. Community Health 2015, 69, 20–27. [Google Scholar] [CrossRef] [PubMed]
- Coleman, A. Utopia on Trial, Hilary Shipman; Hilary Shipman Ltd.: London, UK, 1990; ISBN 978094096259. [Google Scholar]
- Scotland’s Most Polluted Streets Revealed—5 New Pollution Zones Declared. Available online: https://foe.scot/press-release/scotland-s-most-polluted-streets-revealed-5-new-pollution-zones-declared/ (accessed on 13 December 2017).
- Abercrombie, P.; Matthew, R.H. The Clyde Valley Regional Plan 1946; H. M. Stationery Office: Edinburgh, UK, 1949. [Google Scholar]
- Transport and Travel in Scotland 2010. Available online: www.scotland.gov.uk/Publications/2011/08/31092528 (accessed on 13 December 2017).
- Review of Scotland’s Cities—The Analysis. Available online: http://www.gov.scot/Publications/2003/01/15950/15136 (accessed on 18 November 2017).
- Annual Survey of Hours and Earnings. Available online: www.scotland.gov.uk/Topics/Statistics/Browse/Labour-Market/TrendEarnings (accessed on 13 December 2017).
- Better Homes and Neighbourhoods; RIBA Policy Paper; RIBA: London, UK, 2007.
- Housing Statistics for Scotland. Available online: www.scotland.gov.uk/Topics/Statistics/Browse/Housing-Regeneration/HSfS (accessed on 13 December 2017).
- Housing Statistics Briefing. Available online: www.ablemesh.co.uk/PDFs/HousingStatsBriefingSep2006.pdf (accessed on 13 December 2017).
- Europe Financial Overview. Available online: www.globalpropertyguide.com/Europe (accessed on 13 December 2017).
- Population Density—Europe. Available online: http://www.indexmundi.com/map/?v=21000&r=eu&l=en (accessed on 19 December 2017).
- District Valuer Services (DVS). Available online: www.voa.gov.uk/dvs/_downloads/pmr_2011.pdf (accessed on 13 December 2017).
- Wightman, A. The Poor Had No Lawyers, Who Owns Scotland and How They Got It; Birlinn Ltd.: Edinburgh, UK, 2010; ISBN 978-1-84158-960-2. [Google Scholar]
- Paradise Papers: Tax Haven Secrets of Super-Rich Including the Queen Exposed. Available online: https://uk.breakingnow.co/news/paradise-papers-tax-haven-secrets-of-super-rich-including-the-queen-exposed/ (accessed on 19 December 2017).
- Brodeur, P. Annals of Law, the Asbestos Industry on Trial, 1-A Failure to Warn. The New Yorker, 10 June 1985; 57. [Google Scholar]
- Chief Inspector of Factories and Workshops. Annual Report of the Chief Inspector of Factories and Workshops for the Year 1898, 1899; Magic Mineral to Killer Dust, Turner & Newall and the Asbestos Hazard; Tweedale, G., Ed.; Oxford University Press: Oxford, UK, 2001; p. 21. ISBN 0-19-924399-9. [Google Scholar]
- Cooke, W.E. Pulmonary Asbestosis. BMJ 1927, 2, 1024–1025. [Google Scholar] [CrossRef] [PubMed]
- Asbestos Related Disease. Available online: http://www.hse.gov.uk/statistics/causdis/asbestos.htm (accessed on 13 December 2017).
- Asbestos: Elimination of Asbestos-Related Diseases. Available online: http://www.who.int/mediacentre/factsheets/fs343/en/index.html (accessed on 13 December 2017).
- Bill, B. Shipyards, a Crucible for Tragedy. Part 1: How the war created a monster. The Virginian-Pilot, May 2001. [Google Scholar]
- Working with Asbestos in Buildings. Available online: http://www.coshh-essentials.org.uk/assets/live/indg289.pdf (accessed on 13 December 2017).
- Boardman, B. Fuel Poverty—From Cold Homes to Affordable Warmth; John Wiley & Sons: Chichester, UK, 1991; ISBN 10-1852931396. [Google Scholar]
- Howieson, S. Housing—Raising the Scottish Standard; Technical Services Agency: Glasgow, UK, 1999. [Google Scholar]
- The Scottish Index of Multiple Deprivation. Available online: http://www.gov.scot/Topics/Statistics/SIMD (accessed on 13 December 2017).
- Howieson, S. Multiple deprivation and excess winter deaths in Scotland. J. R. Soc. Promot. Health 2005, 125, 18–22. [Google Scholar] [CrossRef] [PubMed]
- Keatinge, W.R.; Coleshaw, S.R.K.; Cotter, F.; Mattock, M.; Murphy, M.; Chelliah, R. Increase in platlet and red cell counts, blood viscosity and arterial pressure during mild surface cooling: Factors in mortality from coronary and cerebral thrombosis in winter. BMJ 1984, 289, 1405–1408. [Google Scholar] [CrossRef] [PubMed]
- Collins, K. Cutting the cost of cold: Affordable warmth for healthier homes. In Cold, Cold Housing and Respiratory Illness; Rudge, J., Nicol, F., Eds.; Routledge: London, UK, 2000. [Google Scholar]
- Scottish House Condition Survey. Available online: http://www.gov.scot/Topics/Statistics/SHCS (accessed on 13 December 2017).
- Energy Act 1976. Available online: https://www.legislation.gov.uk/ukpga/1976/76/contents (accessed on 13 December 2017).
- Porteous, C.D.A.; Sharpe, T.R.; Menon, R.A.; Shearer, D.; Musa, H.; Baker, P.H.; Sanders, C.H.; Strachan, P.A.; Kelly, N.J.; Markopoulos, A. Energy and environmental appraisal of domestic laundering appliances. Build. Res. Inf. 2012, 40, 1–21. [Google Scholar] [CrossRef]
- Howieson, S. Housing—Raising the Scottish Standard; Technical Services Agency: Glasgow, UK, 1991. [Google Scholar]
- City of Glasgow District Council Housing. House Condition Survey; HMSO: London, UK, 1989; Volume 5.
- Scottish House Condition Survey—Key Findings for 2003–2004. Available online: www.gov.scot/Topics/Statistics/SHCS/KeyFindings2003-04 (accessed on 13 December 2017).
- Scottish House Condition Survey: Key Findings 2014. Available online: www.gov.scot/Publications/2015/12/8460/322114 (accessed on 13 December 2017).
- Platt, S.D.; Martin, C.J.; Hunt, S.M.; Lewis, C.W. Damp housing, mould growth and symptomatic health state. BMJ 1989, 298, 1673–1678. [Google Scholar] [CrossRef] [PubMed]
- Prevalence and Incidence of Multiple Sclerosis. Available online: www.mstrust.org/a-z/prevalence-and-incidence-multiple-sclerosis (accessed on 13 December 2017).
- Report of the MMR Expert Group. Available online: http://www.gov.scot/Publications/2002/04/14619/3782 (accessed on 19 December 2017).
- McSharry, C.; Vesper, S.; Wymer, L.; Howieson, S.; Chaudhuri, R.; Wright, G.R.; Thomson, N.C. Decreased FEV1% in Asthmatic Adults in Scottish Homes with High Environmental Relative Moldiness Index Values. Clin. Exp. Allergy 2015, 45, 902–907. [Google Scholar] [CrossRef] [PubMed]
- Technical Handbooks & Key Supporting Guidance. Available online: http://www.scotland.gov.uk/Topics/Built-Environment/Building/Building-standards/publications/pubtech/thb2011octdomenviro (accessed on 13 December 2017).
- Scottish House Condition Survey 2015: Key Findings. Available online: www.gov.scot/Publications/2016/12/1539/335999 (accessed on 13 December 2017).
- Howieson, S.; Sharpe, T.; Farren, P. Building tight—Ventilating right? How are new air tightness standards affecting indoor air quality in dwellings? Build. Serv. Eng. Res. Technol. 2014, 35, 475–487. [Google Scholar] [CrossRef]
- Sharpe, T.; McQuillan, J.; Howieson, S.; Touhy, P.; Farren, P. Research Project to Investigate Occupier Influence on Indoor Air Quality in Dwellings; The Scottish Government, Building Standards Division: Livingston, UK, 2014.
- Locher, W.G. Max von Pettenkofer (1818–1901) as a Pioneer of Modern Hygiene and Preventive Medicine. Environ. Health Prevent. Med. 2007, 12, 238–245. [Google Scholar] [CrossRef] [PubMed]
- Raw, G.J. Sick Building Syndrome: A Review of the Evidence on Causes and Solutions; HSE Contract Research Report No. 42; Building Research Establishment: Garston, UK, 1992.
- House of Commons Select Committee. Indoor Pollution, Sixth Report; HMSO: London, UK, 1991.
- WHO (World Health Organization). Global Surveillance, Prevention and Control of Chronic Respiratory Diseases: A Comprehensive Approach; WHO: Geneva, Switzerland, 2007. [Google Scholar]
- Dust mite allergens and asthma—A worldwide problem. J. Allergy Clin. Immunol. 1989, 83, 416–427.
- Beasley, R. Worldwide Variation in Prevalence of Symptoms of Asthma, Allergic Rhinoconjunctivitis, and Atopic Eczema: ISAAC. Available online: http://www.thelancet.com/journals/lancet/issue/vol351no9111/PIIS0140-6736(00)X0085-2 (accessed on 21 December 2017).
- The Asthma UK Data Portal. Available online: www.asthma.org.uk/get-involved/campaigns/data-portal/ (accessed on 13 December 2017).
- Howieson, S. Housing and Asthma; Taylor and Francis: Oxford, UK, 2005; ISBN 90-6814-097-3. [Google Scholar]
- Strachan, D.P.; Anderson, H.R.; Limb, E.S.; O’Neill, A.; Wells, N. A national survey of asthma prevalence, severity and treatment in Great Britain. Arch Dis. Child. 1994, 70, 174–178. [Google Scholar] [CrossRef] [PubMed]
- Sharpe, T.; Farren, P.; Howieson, S.; Tuohy, P.; McQuillan, J.; Howieson, S. Occupant interactions and effectiveness of natural ventilation strategies in contemporary new housing in Scotland, UK. Int. J. Environ. Res. Public Health 2015, 12, 8480–8497. [Google Scholar] [CrossRef] [PubMed] [Green Version]
- Particulate Matter in the United Kingdom. Available online: https://uk-air.defra.gov.uk/assets/documents/reports/aqeg/pm-summary.pdf (accessed on 13 December 2017).
- Air Pollution in the UK 2015. Available online: https://uk-air.defra.gov.uk/assets/documents/annualreport/air_pollution_uk_2015_issue_1.pdf (accessed on 13 December 2017).
- Van Lynden-van Nes, A.M.T. Effective Mite Allergen Avoidance in Households with Asthmatic Children: Clinical, Technical and Behavioral Aspects; Technische Universiteit Eindhoven: Eindhoven, The Netherlands, 1999; ISBN 90-6814-097-3. [Google Scholar]
- Revie, C.; Howieson, S. The results of a research project into the relationships between income, housing and health status, in a Scottish town. In Fuel Poverty and Health in Paisley; Energy Action Scotland: Glasgow, UK, 1999. [Google Scholar]
- House Dust Mites. Available online: https://entomology.ca.uky.edu/ef646 (accessed on 13 December 2017).
- Howieson, S.G.; Lawson, A.; McSharry, C.; Morris, G.; McKenzie, E.; Jackson, J. Domestic ventilation rates, indoor humidity and dust mite allergens—Are our homes causing the asthma pandemic? Build. Serv. Eng. Res. Technol. 2003, 23, 137–147. [Google Scholar] [CrossRef] [Green Version]
- Wright, G.; Howieson, S.; McSharry, C.; McMahon, A.; Chaudhuri, R.; Thompson, J.; Fraser, I.; Brooks, R.; Lawson, A.; Jolly, L.; et al. Effect of improved home ventilation on asthma control and house dust mite allergen levels. Allergy 2009, 64, 1671–1680. [Google Scholar] [CrossRef] [PubMed] [Green Version]
- Collof, M. Dust Mites; Springer: New Your, NY, USA, 2009; ISBN 10-9048122236. [Google Scholar]
- Boys Asthma Case to Make Legal History Mother Sues Claiming Bad Housing Is Cause. Available online: http://www.heraldscotland.com/news/12510660.Boy_apos_s_asthma_case_to_make_legal_history_Mother_sues_claiming_bad_housing_is_cause/ (accessed on 10 December 2017).
- Daly, G.; Mooney, M.; Davis, H.; Poole, L. Whatever happened to Stock Transfer?—A comparative study of Birmingham and Glasgow councils’ attempts to privatise their council housing stock. In Proceedings of the Transforming Social Housing Studies Association Conference, Sheffield, UK, 15–16 April 2004. [Google Scholar]
- Strategic Objectives—Scottish Government. Available online: www.gov.scot/topics/archive/About-Archive/Strategic-Objectives (accessed on 13 December 2017).
- Technical Handbooks 2017. Available online: http://www.gov.scot/Topics/Built-Environment/Building/Building-standards/techbooks/techhandbooks (accessed on 13 December 2017).
- Asthma Statistics. Available online: www.aaaai.org/about-aaaai/newsroom/asthma-statistics (accessed on 13 December 2017).
Figure 1.
19th Century complex streets.
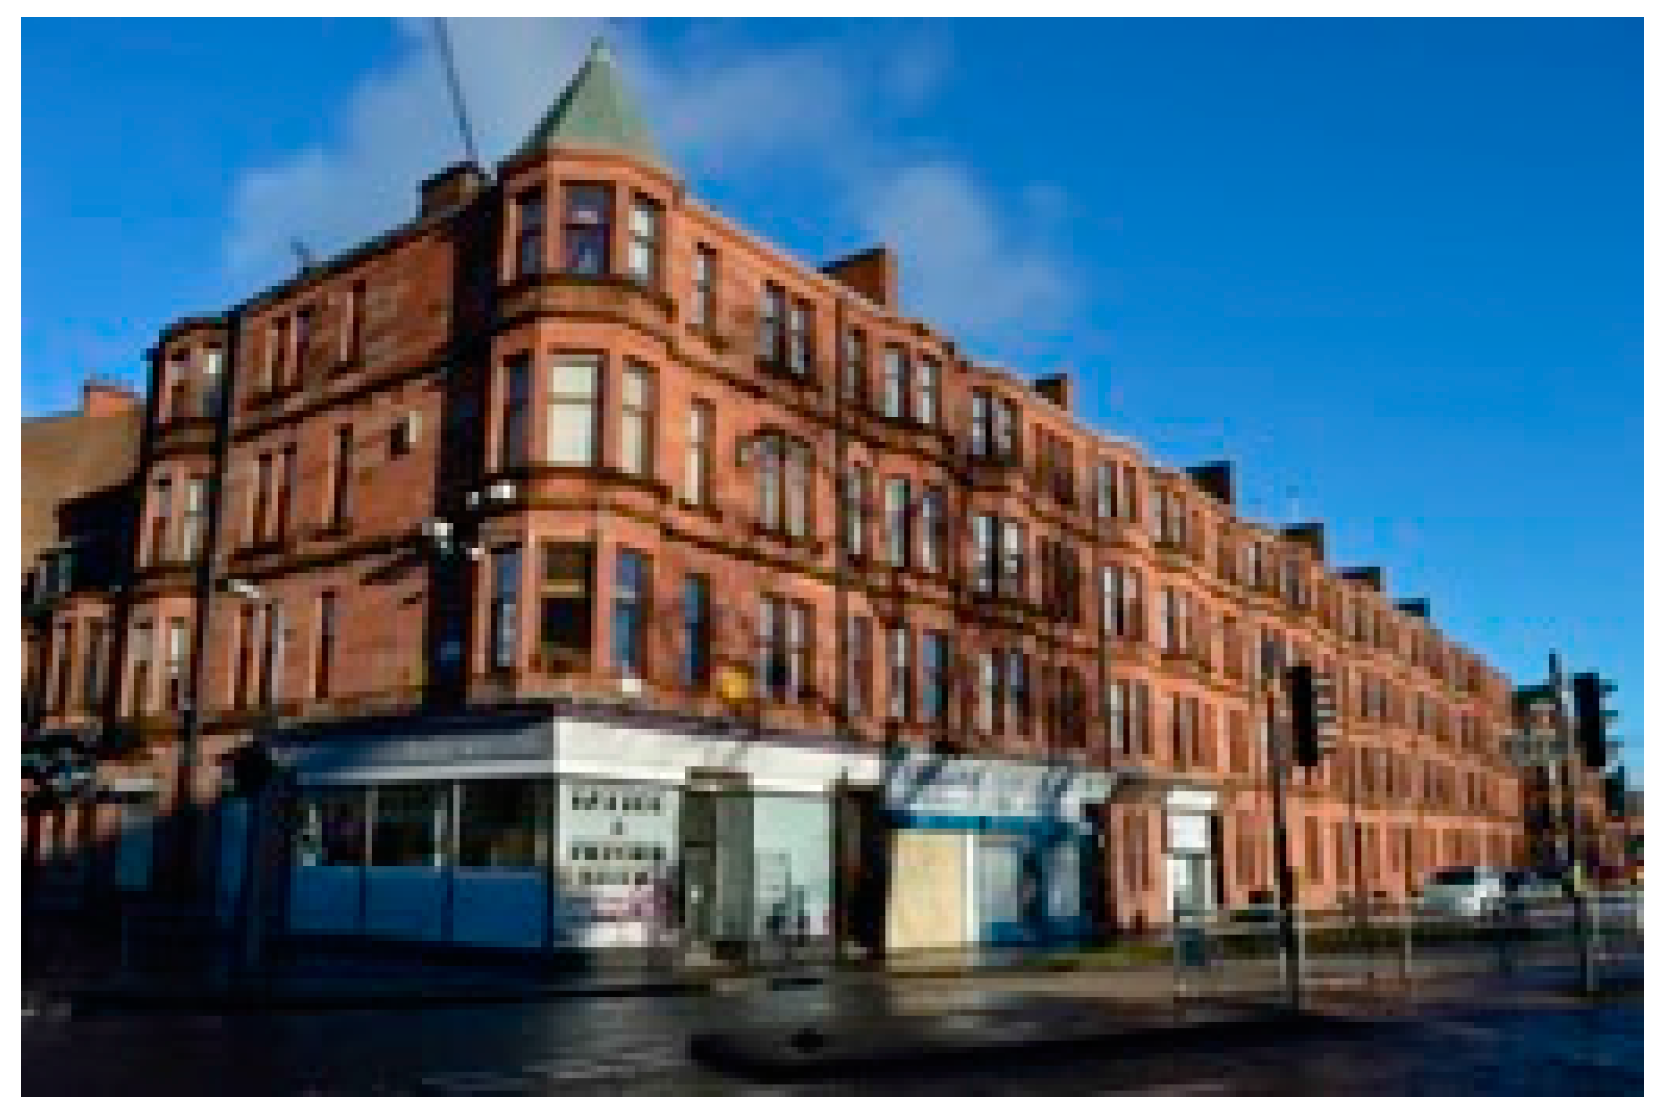
Figure 2.
Ring-fenced modernist shopping zone.

Figure 3.
Glasgow’s historic urban form.

Figure 4.
The new density.

Figure 5.
Glasgow’s bustling city centre.

Figure 6.
Cumbernauld’s isolated town centre.

Figure 7.
Suburbia comes to Glasgow.

Figure 8.
Clay bricks deteriorating.

Figure 9.
Moss growth on concrete tiles.

Figure 10.
Glasgow’s shrinking tenements.
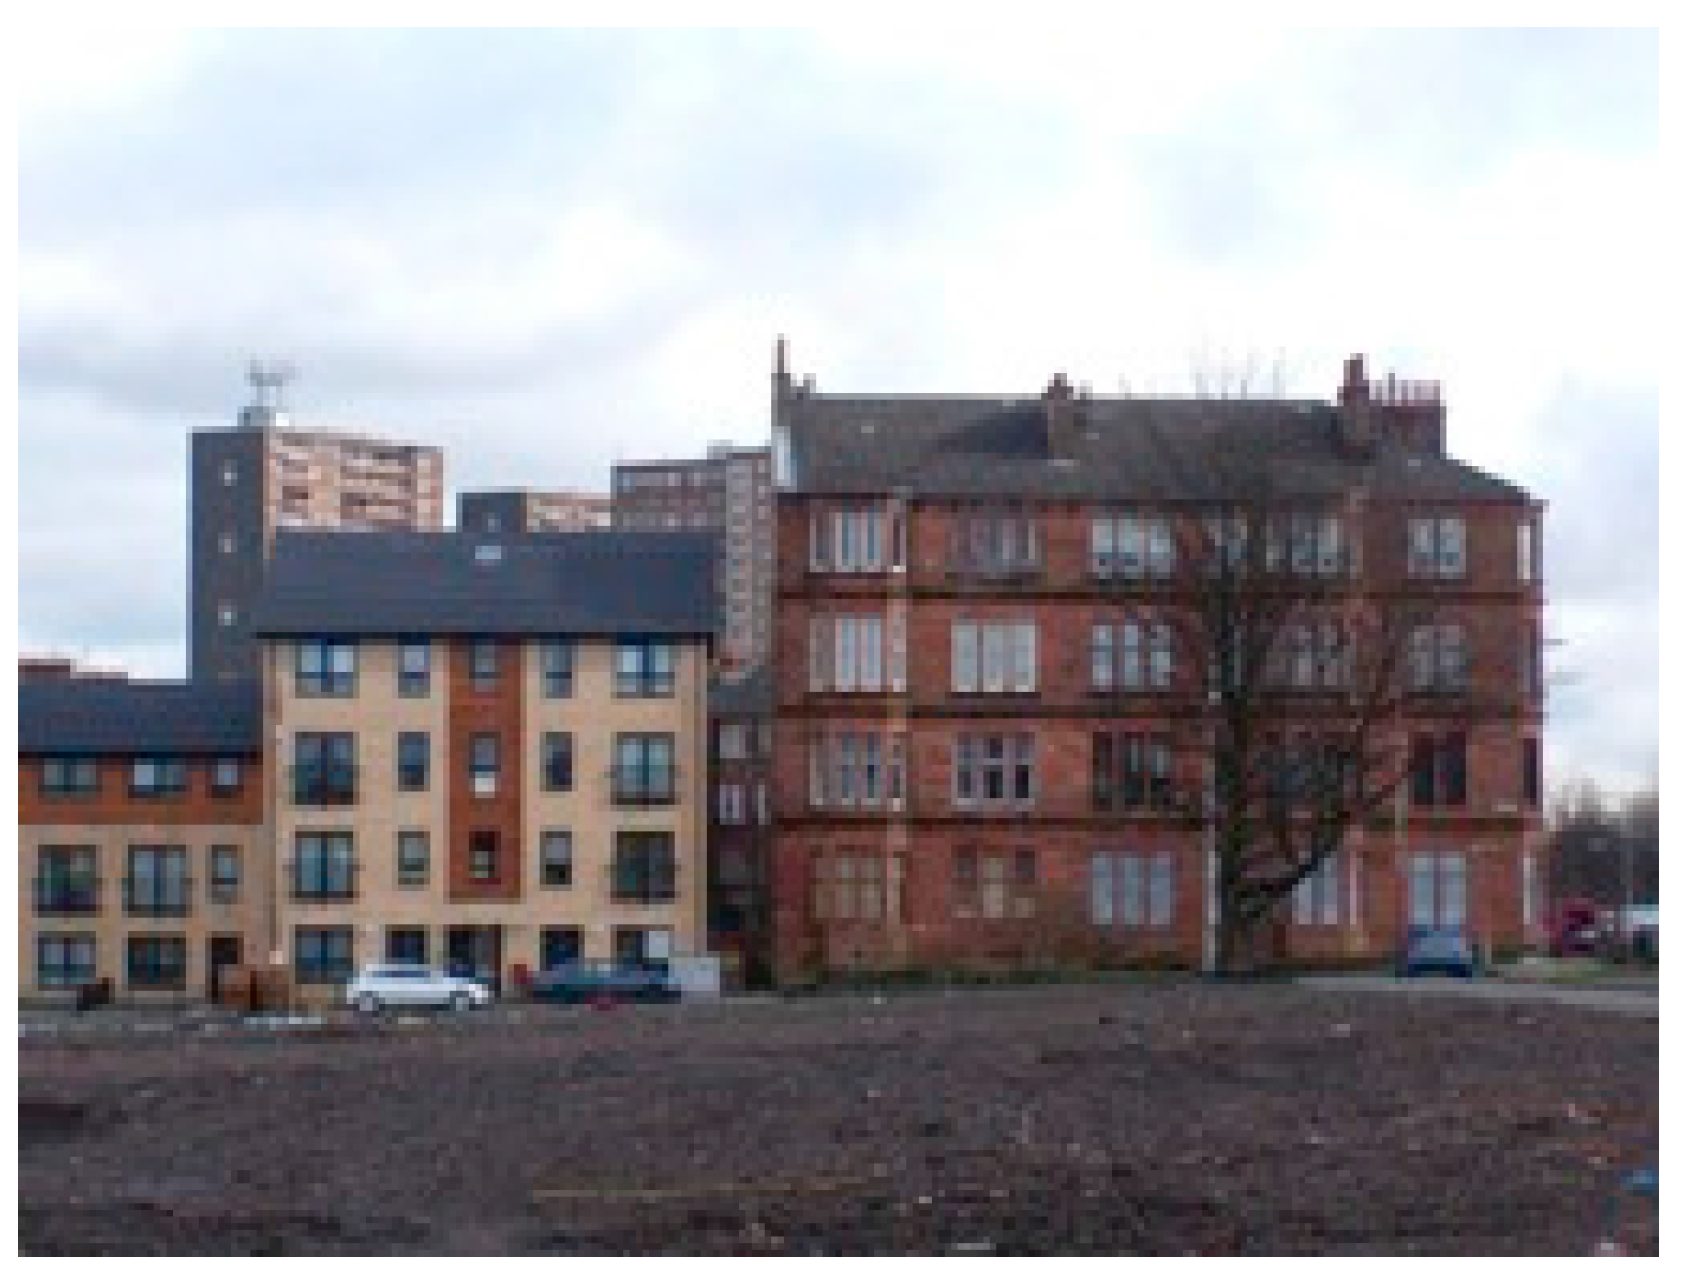
Figure 11.
Sandstone & slate to brick & concrete.

Figure 12.
The Scottish baronial chateau (Source: https://www.pinterest.co.uk/pin/440578776031516185/?lp=true).
Figure 12.
The Scottish baronial chateau (Source: https://www.pinterest.co.uk/pin/440578776031516185/?lp=true).

Figure 13.
The aristocratic “tower in the park” (Source: https://neitshade5.wordpress.com/ category/royalty-politics/page/4/).
Figure 13.
The aristocratic “tower in the park” (Source: https://neitshade5.wordpress.com/ category/royalty-politics/page/4/).

Figure 14.
Grenfell Tower, London (Sources: https://en.wikipedia.org/wiki/Grenfell_Tower_).
Figure 14.
Grenfell Tower, London (Sources: https://en.wikipedia.org/wiki/Grenfell_Tower_).

Figure 15.
Ronan Point, progressive collapse (Sources: https://buildingfailures.wordpress.com/1968/02/06/ronan-point-disaster/).
Figure 15.
Ronan Point, progressive collapse (Sources: https://buildingfailures.wordpress.com/1968/02/06/ronan-point-disaster/).

Figure 16.
Mould fungal spore growth prevalent throughout the public sector housing stock.

Figure 17.
CO2 levels in 12 Scottish new build bedrooms at various locations.
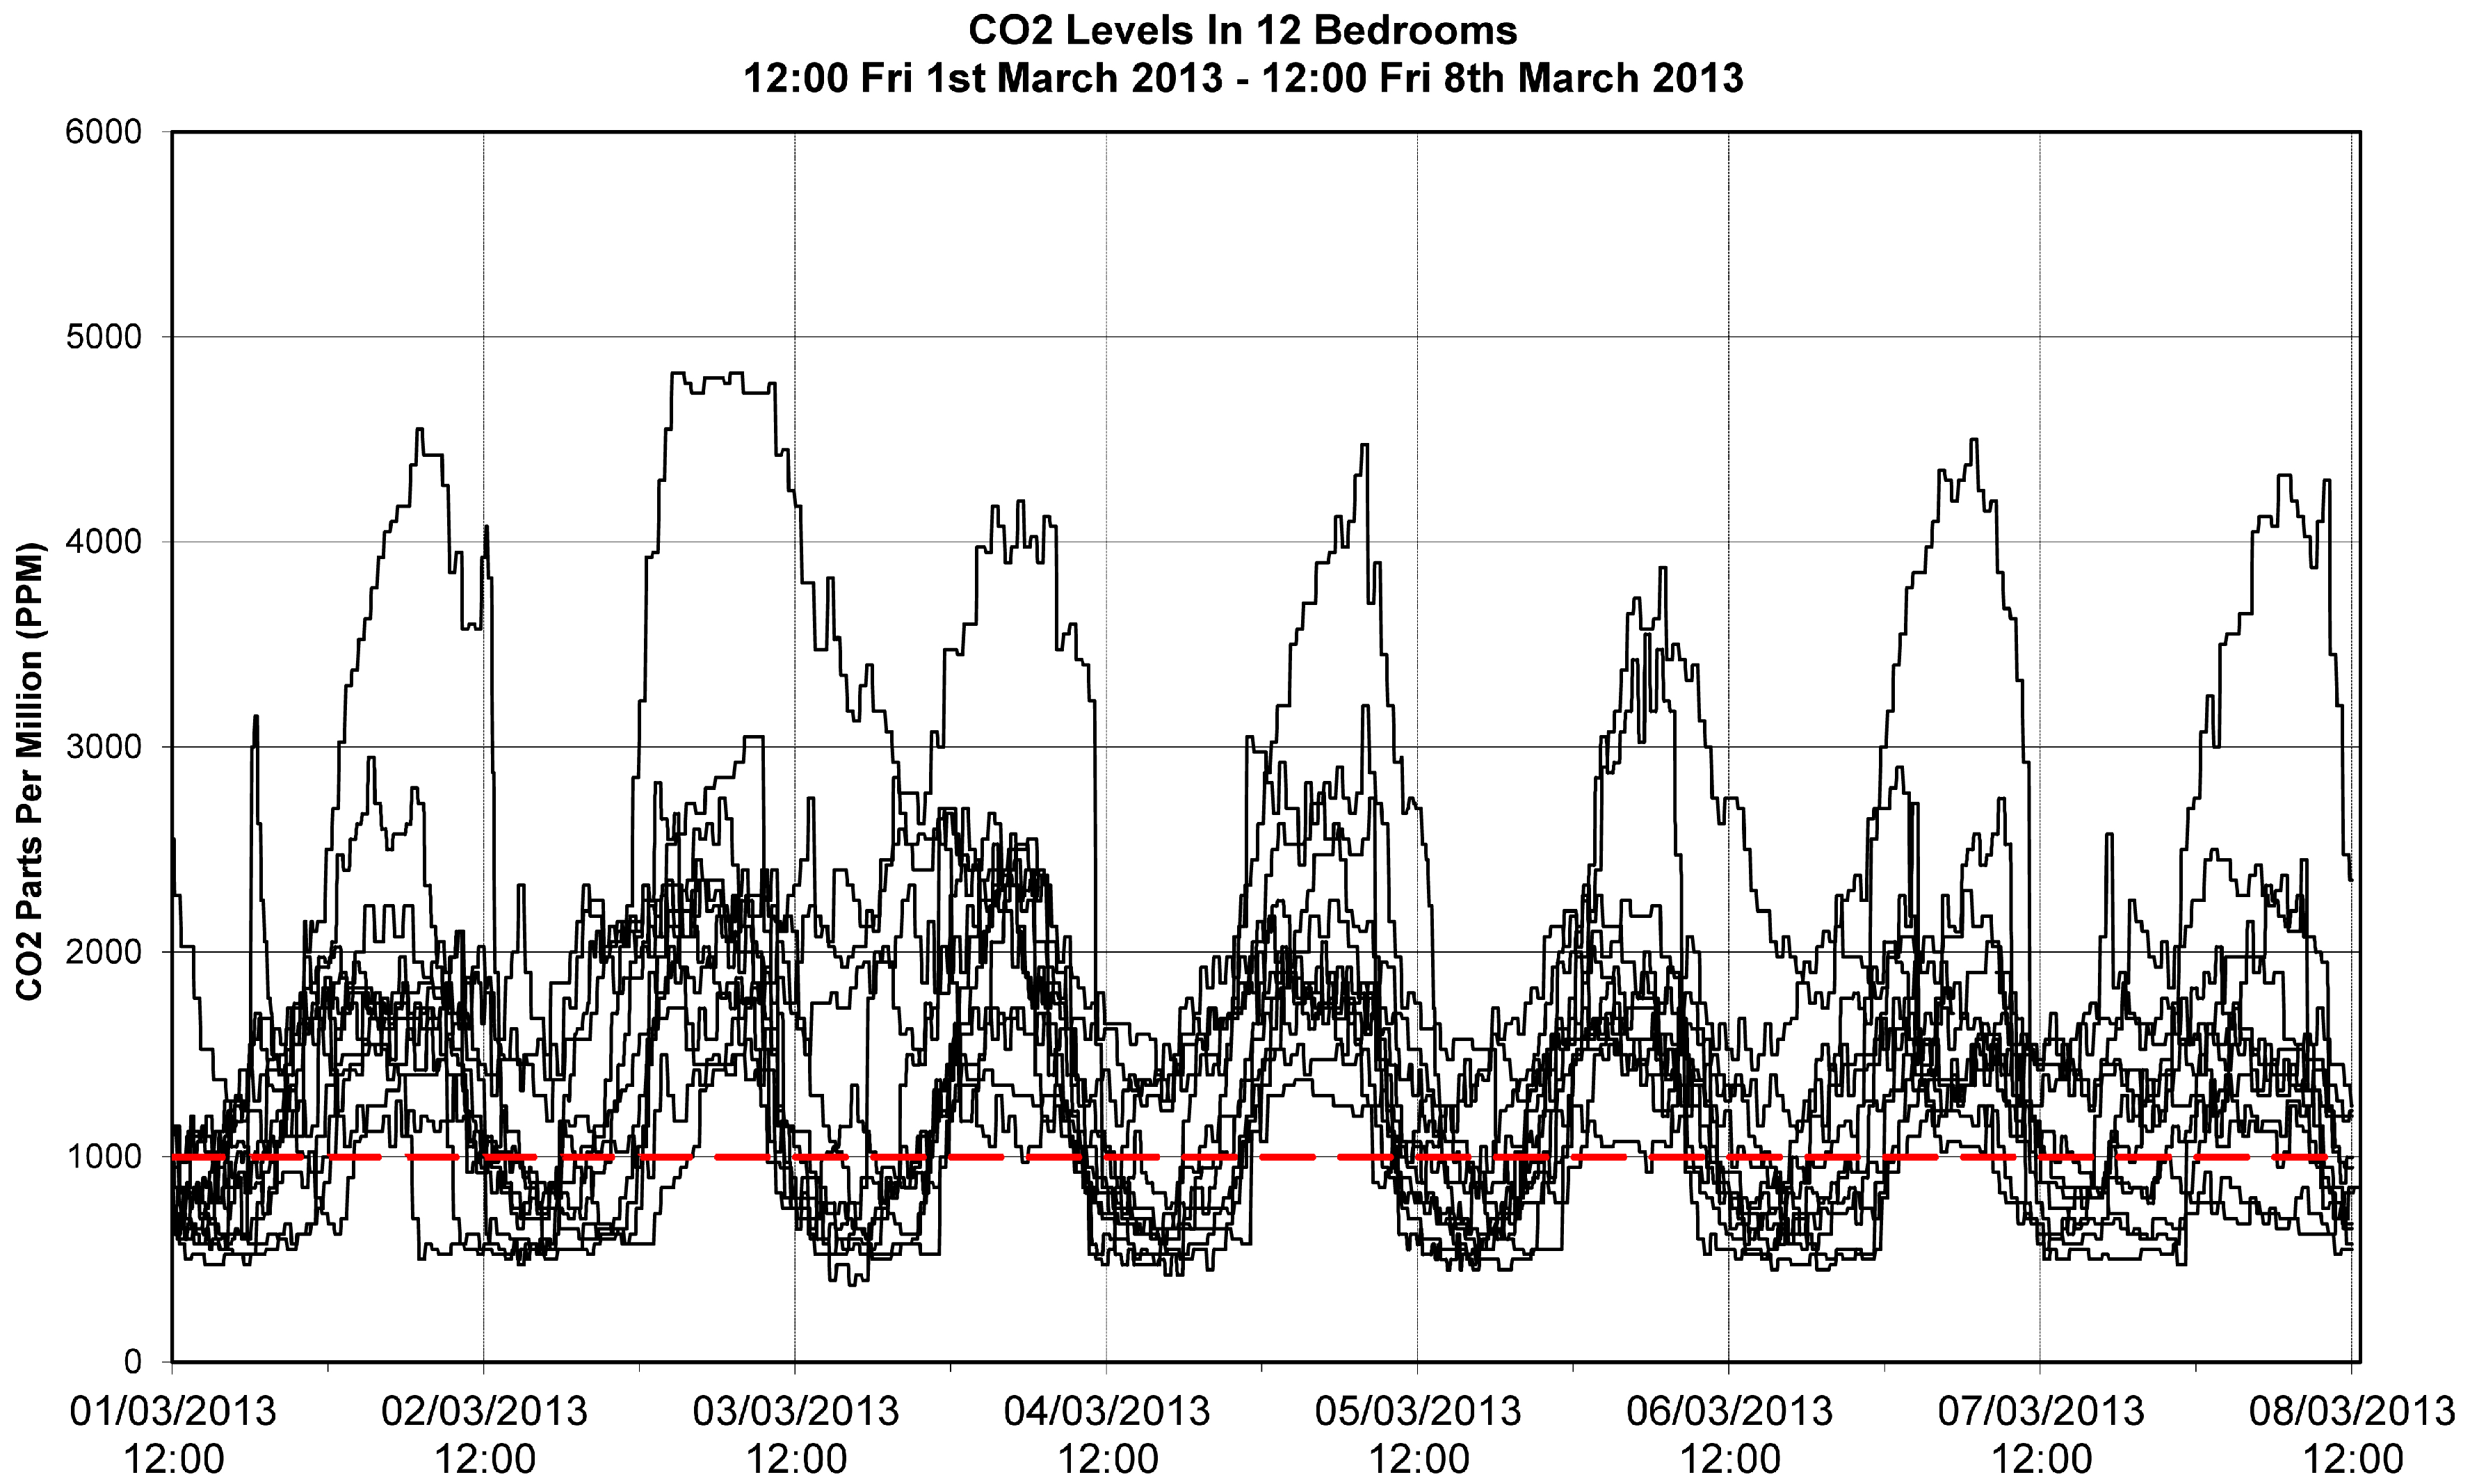
Figure 18.
CO2 mapped against formaldehyde.

Figure 19.
PM2.5 mapped against ventilation rates.

Figure 20.
The sudden rise in asthma prevalence co-incident with the energy crisis [52].
Figure 20.
The sudden rise in asthma prevalence co-incident with the energy crisis [52].

Figure 21.
Red Road flats before and after showing the position of the asbestos sheeting.


Table 1.
16 determinants affecting Public Health.
| Socio-Economic | Environmental | Lifestyle | Access to Services |
|---|---|---|---|
| Employment | Air quality | Exercise | Education |
| Social inclusion | Housing quality | Substance abuse | Health services |
| Social capital | Water and drainage | Diet | Leisure facilities |
| Safety net | Urban form | Risky behaviour | Transport |
© 2017 by the author. Licensee MDPI, Basel, Switzerland. This article is an open access article distributed under the terms and conditions of the Creative Commons Attribution (CC BY) license (http://creativecommons.org/licenses/by/4.0/).
Share and Cite
MDPI and ACS Style
Howieson, S. The Great Scottish Housing Disaster: The Impacts of Feudalism, Modernism, Energy Efficiency and Vapour Barriers on Indoor Air Quality, Asthma and Public Health. Sustainability 2018, 10, 18. https://doi.org/10.3390/su10010018
AMA Style
Howieson S. The Great Scottish Housing Disaster: The Impacts of Feudalism, Modernism, Energy Efficiency and Vapour Barriers on Indoor Air Quality, Asthma and Public Health. Sustainability. 2018; 10(1):18. https://doi.org/10.3390/su10010018
Chicago/Turabian StyleHowieson, Stirling. 2018. "The Great Scottish Housing Disaster: The Impacts of Feudalism, Modernism, Energy Efficiency and Vapour Barriers on Indoor Air Quality, Asthma and Public Health" Sustainability 10, no. 1: 18. https://doi.org/10.3390/su10010018
Note that from the first issue of 2016, this journal uses article numbers instead of page numbers. See further details here.