Regional Variations of Credits Obtained by LEED 2009 Certified Green Buildings—A Country Level Analysis


1
Department of Construction Management, Curtin University, Perth 6102, Australia
2
Australasian Joint Research Centre for Building Information Modelling, Curtin University, Perth 6102, Australia
3
School of Engineering and Technology, Central Queensland University, Sydney, NSW 2000, Australia
4
Department of Construction Management and Real Estate, School of Economics and Management, Tongji University, Shanghai 200092, China
*
Author to whom correspondence should be addressed.
Sustainability 2018, 10(1), 20; https://doi.org/10.3390/su10010020
Submission received: 24 November 2017
/
Revised: 8 December 2017
/
Accepted: 20 December 2017
/
Published: 29 December 2017
(This article belongs to the Special Issue Sustainable Construction, Development and Management in the Built Environment)
Abstract
:Leadership in Energy and Environmental Design (LEED) is one of the most widely recognized green building rating systems. With more than 20% of the projects certified in non-United States (US) countries, LEED’s global impact has been increasing and it is critically important for developers and regulatory authorities to understand LEED’s performance at the country level to facilitate global implementation. This study therefore aims to investigate the credit achievement pattern of LEED 2009, which is one of the well-developed versions of LEED, by using 4021 certified projects in the US, China, Turkey, and Brazil. The results show that significant differences can be identified on most rating categories, including sustainable sites, water efficiency, energy and atmosphere, indoor environmental quality, and innovation in design. Using a post hoc analysis, country-specific credit allocation patterns are also identified to help developers to understand existing country-specific green building practices. In addition, it is also found that there is unbalanced achievement of regional priority credits. The study offers a useful reference and benchmark for international developers and contractors to understand the regional variations of LEED 2009 and for regulatory authorities, such as the U.S. Green Building Council, to improve the rating system, especially on designing regional priority credits.
1. Introduction
Green building, as a way of addressing sustainable development in the construction industry, has been increasing recognized [1,2,3]. It refers to the design and construction of a building that can suit local conditions from culture, community to specific site conditions, in order to achieve reduced energy consumption, water consumption, and environmental impacts [4]. The development of green building is supported by many other sustainable concepts, such as sustainable construction [5], sustainable design [6], and sustainable consumption [7]. As the development of green buildings can help to reduce environment impacts, the concept is now a flagship of sustainable development [8]. According to [9], more than 31,000 projects have been certified by Leadership in Energy and Environmental Design (LEED) new construction by the end of 2017 globally.
The aim of such rating systems is to systematically evaluate the performance of buildings from various aspects. There are six main assessment categories in LEED. Each category is assigned with some credits that will be awarded if the performance level is achieved. Four certification levels, from Certified to Platinum, will be awarded to the project based on the number of credits that are achieved [10]. According to Da Silva and Ruwanpura, LEED has been one of the leading green building rating systems [11]. Many studies have been conducted to improve the rating system by analyzing how credits are allocated [12]. For example, Da Silva and Ruwanpura reviewed the LEED projects in Canada and found that energy and atmosphere (EA) and materials and resources (MR) have relatively lower percentage of achievement when compared with other assessment categories [11]. Ma and Cheng found that two credits, i.e., the reuse of materials and the use of rapidly renewable materials, are rarely targeted [13]. One interesting finding from these studies is that LEED, unlike other green building systems, e.g., the Building Research Establishment Assessment Methodology (BREEAM), does not have national variants for local interpretation [14]. Da Silva and Ruwanpura found that there are differences in achieving some of the credits in LEED between United States (US) projects and Canadian projects [11]. Similarly, Cidell and Beata found that the lack of spatial consideration when designing the green building rating system may impede its implementation [15]. Through a detailed analysis of the LEED credits that are obtained by green buildings in the US, it is confirmed that various regions in the United States perform differently as demonstrated by the LEED scores [15]. As such, a major improvement in LEED 2009 is that regional differences are incorporated into selected LEED credits through either regional priority points or alternative compliance paths.
However, it should be noted that previous studies have limitations. Many studies are conducted before the release of regional priority points and alternative compliance paths by the USGBC. As such, few studies have examined the effectiveness of such strategies, i.e., whether the implementation of regional priority points and alternative compliance paths helps address regional variations. In addition, many studies are conducted based on the LEED certified projects in the US. For example, Cidell and Beata used the ten Environmental Protection Agency (EPA) regions to investigate the regional difference of LEED performance in the US [15]. It should be noted that non-US projects now accounts for almost 20% of all LEED certified projects [16]. Few studies have been conducted on assessing the global performance of LEED, which is a globally recognized rating system. More importantly, as central governments establish government-wide green building standard, it is important for them to understand the performance of LEED certified projects. Therefore, this paper aims to: (1) investigate the regional variations of LEED 2009 certified projects at the country level; (2) examine the effectiveness of regional priority credits in addressing regional priorities; and, (3) provide recommendations for the further improvement of LEED 2009. The results will be useful to assist developers for cross-country LEED implementation and establish appropriate management strategies to achieve desirable certification performance.
This paper has the following structure. Section 2 provides a literature review on the LEED 2009 rating system, including the alternative compliance paths and regional priority credits that can affect regional adoption patterns. Section 3 presents the research method, including the sampling, data collection, and analysis methods. Section 4 discusses the results of the study, following the three research objectives and Section 5 discusses the implications of this study for developers and regulatory authorities and Section 6 concludes the research work.
2. Overview of LEED 2009
LEED is a comprehensive green building assessment system, which systematically evaluates the performance of green building from a few main categories such as sustainable sites and energy and atmosphere [17]. According to [16], LEED is a very popular green building rating systems, along with Green Globes and other rating systems. Earlier versions of LEED, including LEED v2.2 and LEED 2009, have six major assessment categories, including sustainable sites (SS), water efficiency (WE), energy and atmosphere (EA), material and resources (MR), indoor environmental quality (IEQ), and innovation in design (ID). The credit weight is determined by three factors, including the impact category, the activity group, and the association between the credit and its activity group [17,18]. According to [18], impact categories refer to the impacts that buildings have on occupants and environment. The most important impact categories include greenhouse gas emissions, fossil fuel depletion, particulates, and human health-cancer. It should be noted that the impact categories and their relative importance are determined by an Analytical Hierarchy Process (AHP) process and are changing across different versions. For example, in LEED v4, the impact of climate change, i.e., greenhouse gas emissions in LEED 2009, is increased to 35% from 29%. The activity group represents a collection of credits with the same core functions, which include building systems, transportation, water consumption, materials, and indoor environmental quality. The impact will be allocated to the activity group through life cycle assessment and the associate of the specific credit with the activity group will be assessed through a binary association. Once the impact category, activity group, and associate are determined, the weight of the activity group will be distributed proportionally to the specific credit. A total of four certification levels, including Certified, Silver, Gold, and Platinum, will be awarded if sufficient credits have been achieved for each certification level [10].
Since its inception, LEED has been adopted around the world, although the United States remains as the main location where it is implemented. However, through the application, many issues related to the use of LEED are also identified. For example, Wu and Low found that project management, as a critical component to achieve project success, is normally not considered in LEED [10]. As such, LEED relies heavily on the use of technology to achieve green objectives. Zhou and Tan argued that some credits, such as the energy and atmosphere credits in LEED, do not represent the real building performance [19]. As such, redesigning the credits to ensure that the credits are in proportion to their environmental performance is necessary. Zimmberman and Kibert argued that LEED did not separate the assessment of various building types [20]. Consequently, variations to the LEED rating system have been introduced (e.g., LEED Retail, LEED Healthcare). However, according to Zimmberman and Kibert, issues, such as scale of the assessment and bioregional applicability, have not been addressed [20]. In addition, according to [21], for developing countries, it is useful to assess the influence and development of green buildings in the developed countries for benchmarking purposes. However, many studies only provide qualitative analysis [21,22].
The other major critique is that as local factors, such as the availability of green power, may affect the certification performance. They should be included in the rating system. However, before LEED 2009, local factors were not included. According to Cidell and Beata, in the US, projects that are located in different regions perform differently on regionally specific credits, such as brownfield development [15]. Boschmann and Gabriel argued that “light green” strategies, i.e., the direct use of some technologies, are designed as credits in LEED [20]. Consequently, strategies that are developed to adapt to local environment, are not always included [14,21,22]. As such, two major changes have been brought to LEED 2009.
2.1. Alternative Compliance Paths (ACPs)
According to [23], LEED is considered as a globally consistent green building rating tool that may have overlooked the variations among different places in terms of environmental and climate conditions, codes, standards, and laws. As such, alternative compliance paths are developed. There are currently three ACPs that are available for East Asia, Europe, and South America. The USGBC is investigating the ACPs for other regions. Table 1 shows the credits with alternative compliance paths. According to [24], alternative compliance paths are developed to accommodate local variations by a group of international experts on green building. For example, for brownfield redevelopment, local contamination risk protocols may be different, thus leading to ACP for this credit.
2.2. Regional Priority (RP) Credits
According to [24], it is very difficult for a single green building assessment scheme to be suitable for every region around the world. The reason is that each region has its particular individual specifications in terms of geographical and cultural variations. In addition, resources that can be used to meet the green building assessment scheme will be different in each region. As such, making the assessment without considering local variations almost inevitably leads to criticism [25,26]. LEED 2009 introduces regional priority points to ensure that the developers address regional concerns as well. The points are not new, but rather bonus points if regional concerns are addressed [27,28].
Table 2 presents the regional priority points for countries with large number of certified projects by LEED 2009. As can be seen from Table 2, the most commonly used regional priority points include the EA points, including optimize energy performance, on-site renewable energy and enhanced commissioning, as well as the WE credits, including water efficient landscaping, innovative wastewater technologies, and water use reduction. Some SS and MR credits are also available depending on the countries where the LEED projects are located.
After a comprehensive literature review, in addition to the six main LEED assessment categories, Regional variations of different countries on the 21 regionally specific LEED credits, as presented in Table 1, will be investigated. In addition, the RP credits presented in Table 2 will also be selected to examine the effectiveness of these credits in addressing regional priorities. LEED 2009 is selected as the target of the research based on the following two reasons. The registration of LEED 2009 closed on October 2016, meaning that no new projects can be submitted for certification. It is therefore possible to include all of the certified projects to minimize bias. According to the USGBC project directory, there are only 26 projects that are certified by the newest version, i.e., LEED v4. Such a small sample size can provide significantly biased results. Although the analysis of LEED 2009 may not provide guidance for developers to achieve desirable rating in LEED v4, as pointed out by [16], it helps to reveal the evolution pattern of LEED. In addition, LEED 2009 is the first version of LEED that introduces regional priority point. The analysis of this version can help to understand the importance and performance of regional priority points.
3. Research Method
3.1. Population, Samples and Sampling Method
There are 28,390 projects registered by LEED 2009 at the time of the study (August 2016). According to [9], there are 4920 certified projects in the project directory. The certification details, e.g., the allocation of credits and geographical location, are obtained from the USGBC project website. A total of 4658 projects with complete information can be identified, representing 94.70% of the population. Six countries with a project number larger than 40 are identified, including the US (3694), China (172), Turkey (86), Brazil (75), Germany (46), and Chile (43). Silver and Gold are the most commonly achieved certification levels [29,30]. In order to reduce the bias brought about by the sample size, only countries with more than 30 certified projects in Silver and Gold certification levels are selected. The sample size of this study is 4021 certified projects.
3.2. Data Collection
The credits that are achieved in each LEED project are recorded in an Excel spreadsheet. The recorded credits include the six main assessment categories and regional priority points. Other project data, including country, state, city, level of certification, date, and geographical location (street address, address locality, and postal code), is also recorded.
3.3. Data Analysis
3.3.1. Regional Variations—Ranking of the Performance
A ranking procedure is adopted to identify the best performing countries on the six main LEED categories and the 21 regionally specific LEED credits that are obtained from the alternative compliance paths (see Table 1). The ranking procedure is based on average points per LEED category. According to [15], categories with high credit achievement will usually have larger standard deviations. In this study, credit achievement refers to the credit obtained in the assessment area. The coefficient of variation (CV) is also calculated to identify the spread of each assessment credit.
3.3.2. Regional Variations—Country Comparison
In order to decide which data analysis method should be used to assess the regional variations, the normality of the data is firstly investigated. The Shapiro-Wilk test is used to test the normality of the data set. The result of the Shapiro-Wilk test is shown in Table 3. As the p value is lower than 0.05, the distribution is not normal and non-parametric statistical methods should be adopted.
Kruskal-Wallis one-way analysis of variance is used to test whether there are significant difference between different countries. If the p value is less than 0.05, there is a significant difference in the mean credits that are obtained by different countries. Dunn’s test, which is a non-parametric “post hoc” procedure to check where the significance lies, is adopted if the null hypothesis is rejected. In addition, the Mann Whitney U test is used to analyze the mean credits that are obtained in each assessment category of two different countries.
In addition, a generalized additive model (GAM) (a nonparametric regression model) is developed to identify the most important predictors in LEED rating in the four countries. The GAM model is formulated with the Mixed GAM Computation Vehicle (mgcv). To compute the relative contributions of each LEED credit to the total LEED credit , their respective percentages compared with full credits of each contributor are calculated by the following equation:
where: is the percentage of the total LEED credit to the full total credit , and is the percentage of each credit to the full credit . The full credits of EA, SS, IEQ, WE, MR, ID, and RP are 26, 10, 35, 14, 15, 6, and 4, respectively. The equation of GAM is
where is unknown coefficient, is nonparametric smoothing functions between and non-linear variables , and is the random error term with normal distribution. The deviance explained of GAM is
where is the scale parameter calculated by the squared residual standard error, is the maximised likelihood of saturated model, and is the maximised likelihood of the fitted GAM.
The statistical data analysis methods used for country comparison are summarized in Table 4.
3.3.3. Effectiveness of RP Credits
The frequency analysis is used to analyze the effectiveness of RP credits. It is useful to identify the importance of the relevant RP credits to the regional development and whether there is a point chasing problem in specific RP credits.
4. Results
4.1. Geographical Distribution
The geographical distribution of the LEED 2009 certified projects is shown in Table 5. At the country level, the majority of the LEED 2009 certified projects are located in the United States (3690; 79.2%). Other countries with more than 50 certified projects are China (170; 3.7%), Turkey (86; 1.8%), and Brazil (75; 1.6%). One interesting finding is the increasing impact of LEED in countries other than the US. According to Wu et al., 94.3% of all LEED v2.2 certified projects are based in the US. The number has been reduced significantly to 79.2% in LEED 2009 [16]. It seems that with the introduction of alternative compliance paths and regional priority credits in various countries and regions, the global impact of LEED has been increasing.
Table 5 shows the certification levels of all LEED 2009 projects. While Silver and Gold projects dominate the certification levels in all four countries, the certification pattern is different. In the US and Brazil, Silver projects have a large market share, while in China and Turkey, Gold projects tend to have a large market share.
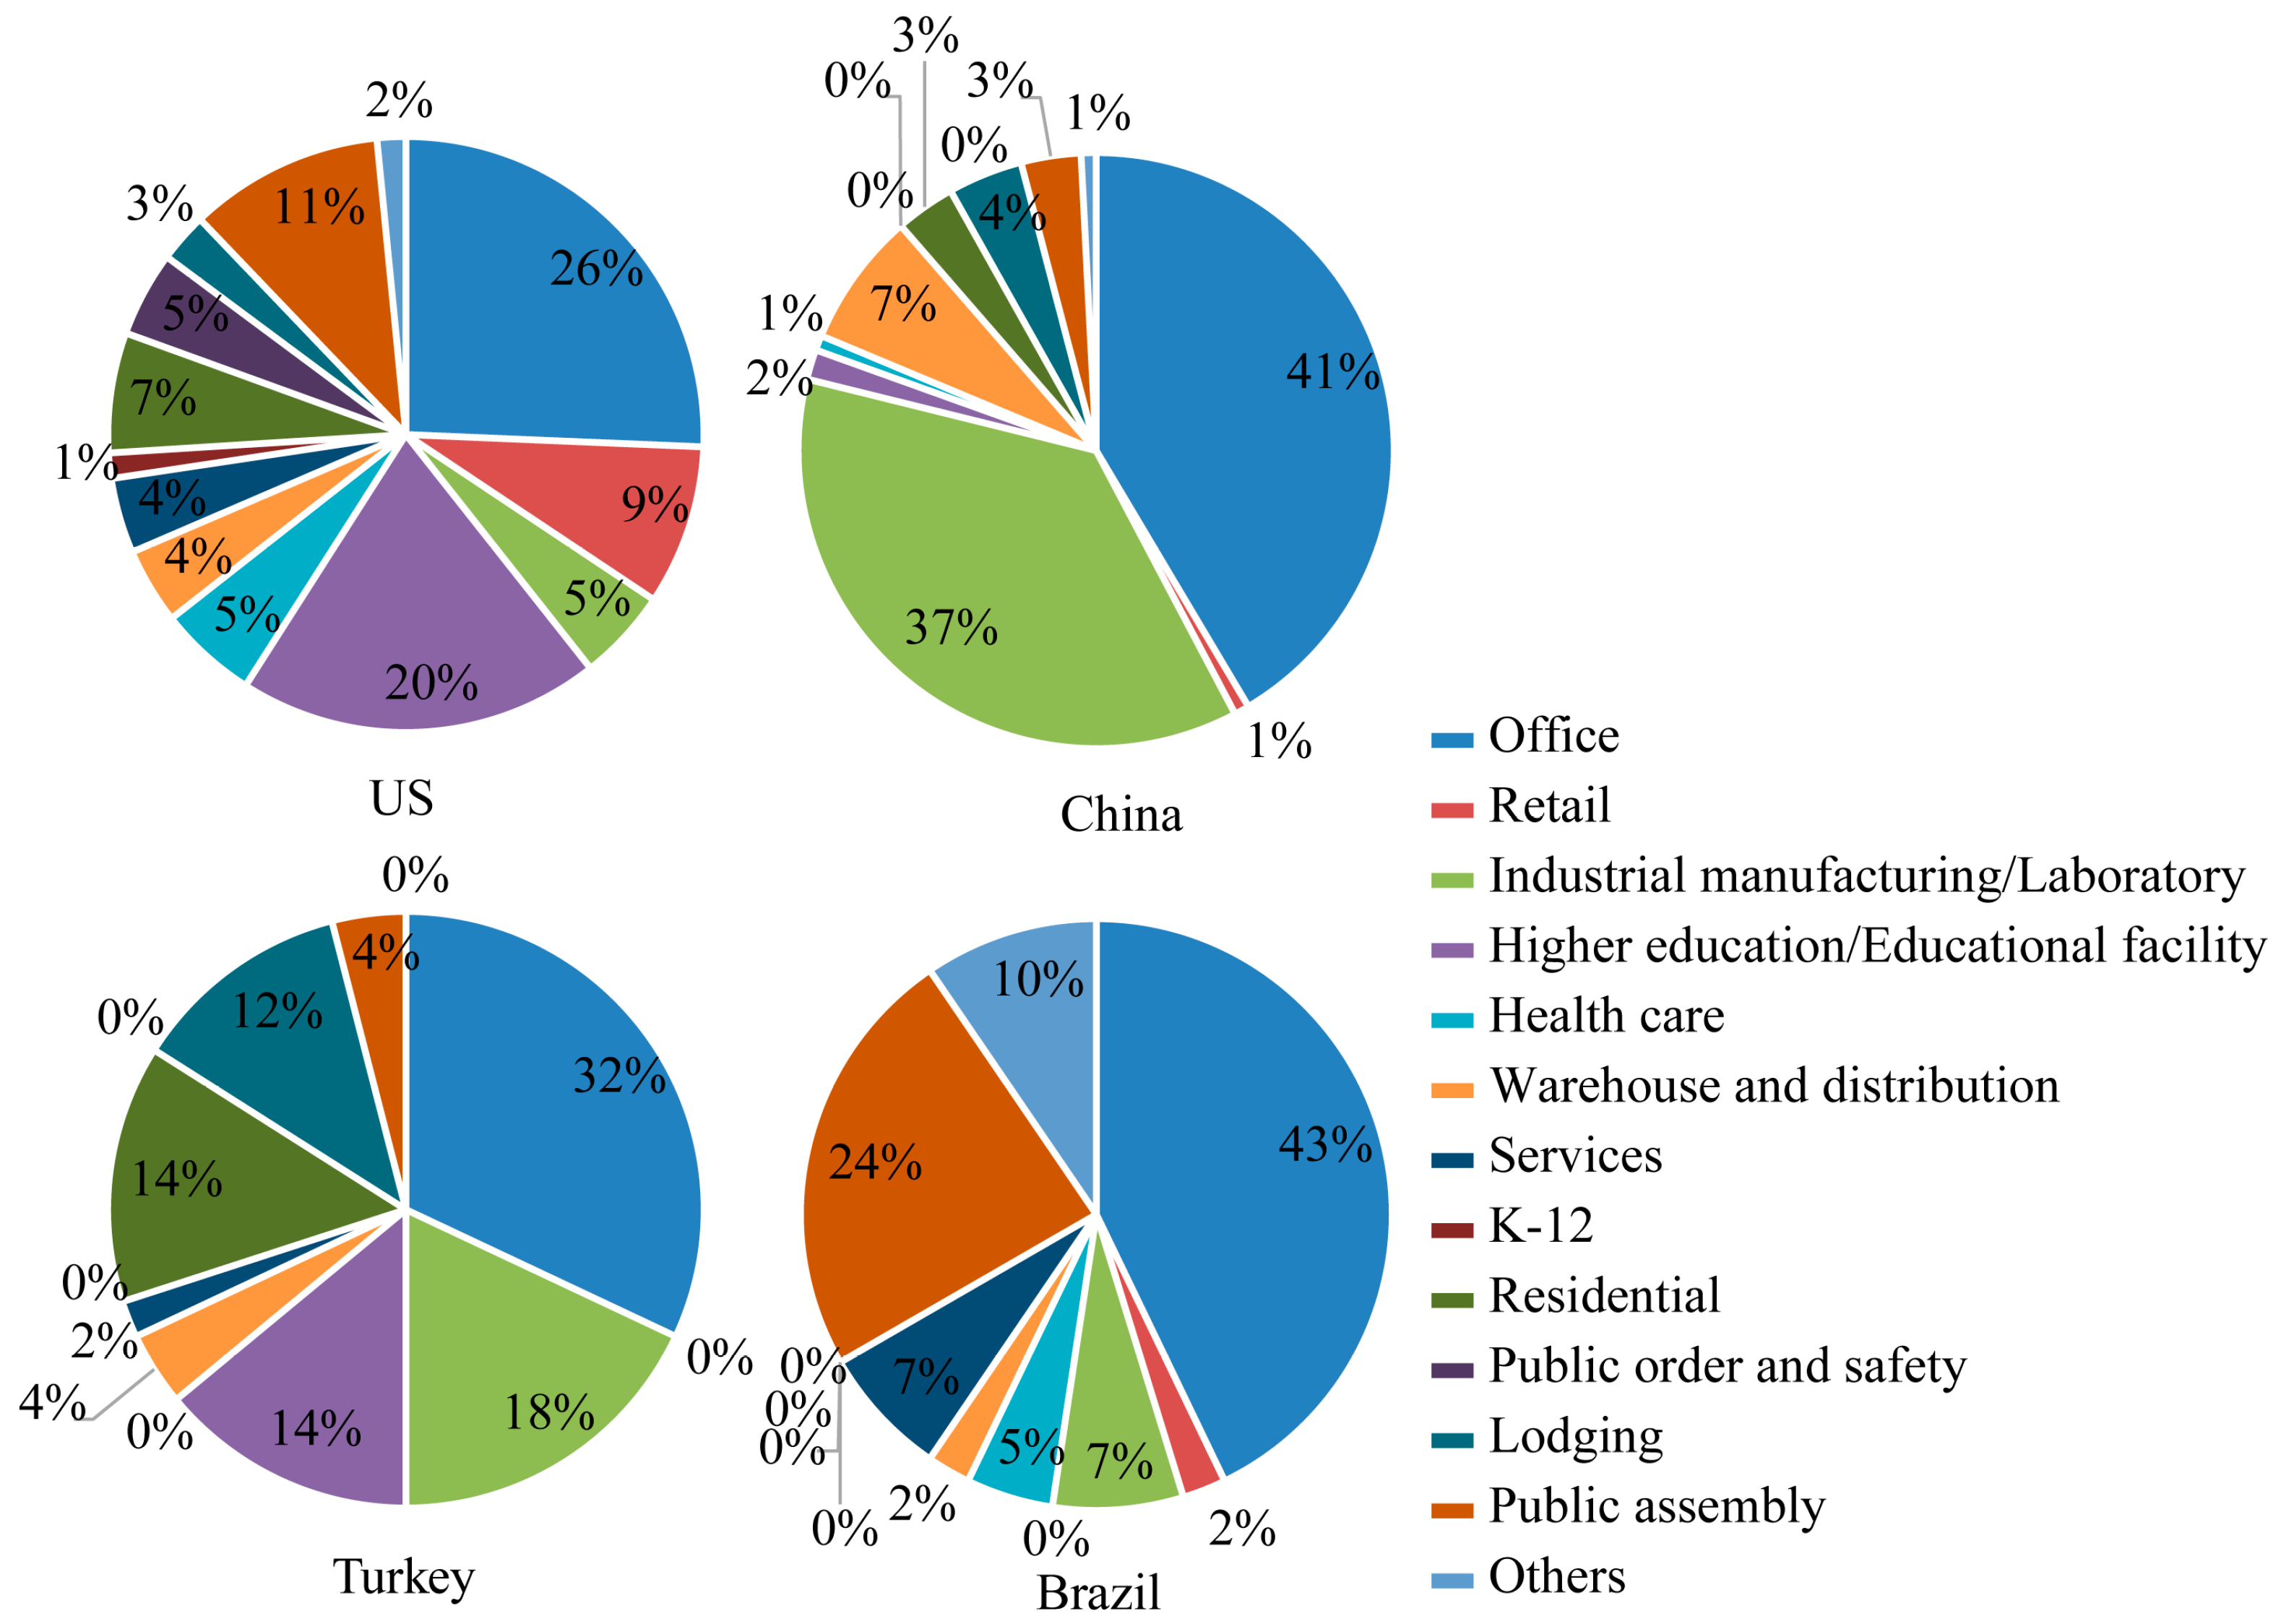
Figure 1 shows the project types of the four countries. In US, office, higher education/educational facility, public assembly and retail have the largest market share of LEED 2009 certified projects (26%, 20%, 11%, and 9%, respectively). Similarly, the top four project types in China are office (41%), industrial manufacturing/laboratory (37%), warehouse and distribution (7%), and lodging (4%). A similar trend is identified in Turkey with office, industrial manufacturing/laboratory, higher education/educational facility, and residential accounting for 32%, 18%, 14%, and 14% respectively. In Brazil, the top three project types are office (43%), public assembly (24%), and others (10%).
4.2. Regional Variations—Rankings
The rankings of the performance of LEED 2009 certified projects on the six main LEED categories at the country level are provided in Table 6, Figure 2 and Figure 3.
As can be seen from Table 6 and Figure 2, in terms of mean overall LEED credits achieved, Turkey has the highest credits (62.23), followed by China (60.42), US (56.02), and Brazil (54.44). Other notable differences can also be identified from Table 5, including:
- Brazil and the US have relatively low overall LEED credits, indicating possible low level of achievements in LEED certified buildings.
- For Brazil, the low level of achievement is caused by low credit achievement in sustainable site (16.12), energy and atmosphere (10.48), and indoor environmental quality (5.16).
- For the US, the low level of achievement is caused by low credit achievement in sustainable site (15.36) and water efficiency (5.67).
- Different countries seem to have advantages in different LEED credits. For example, China has high credit achievement in sustainable sites (18.74) and water efficiency (8.13), but has relatively low credit achievement in energy and atmosphere (11.88). On the other hand, the US has low credit achievement in sustainable sites (15.36) and water efficiency (5.67), but has relatively high credit achievement in energy and atmosphere (14.06).
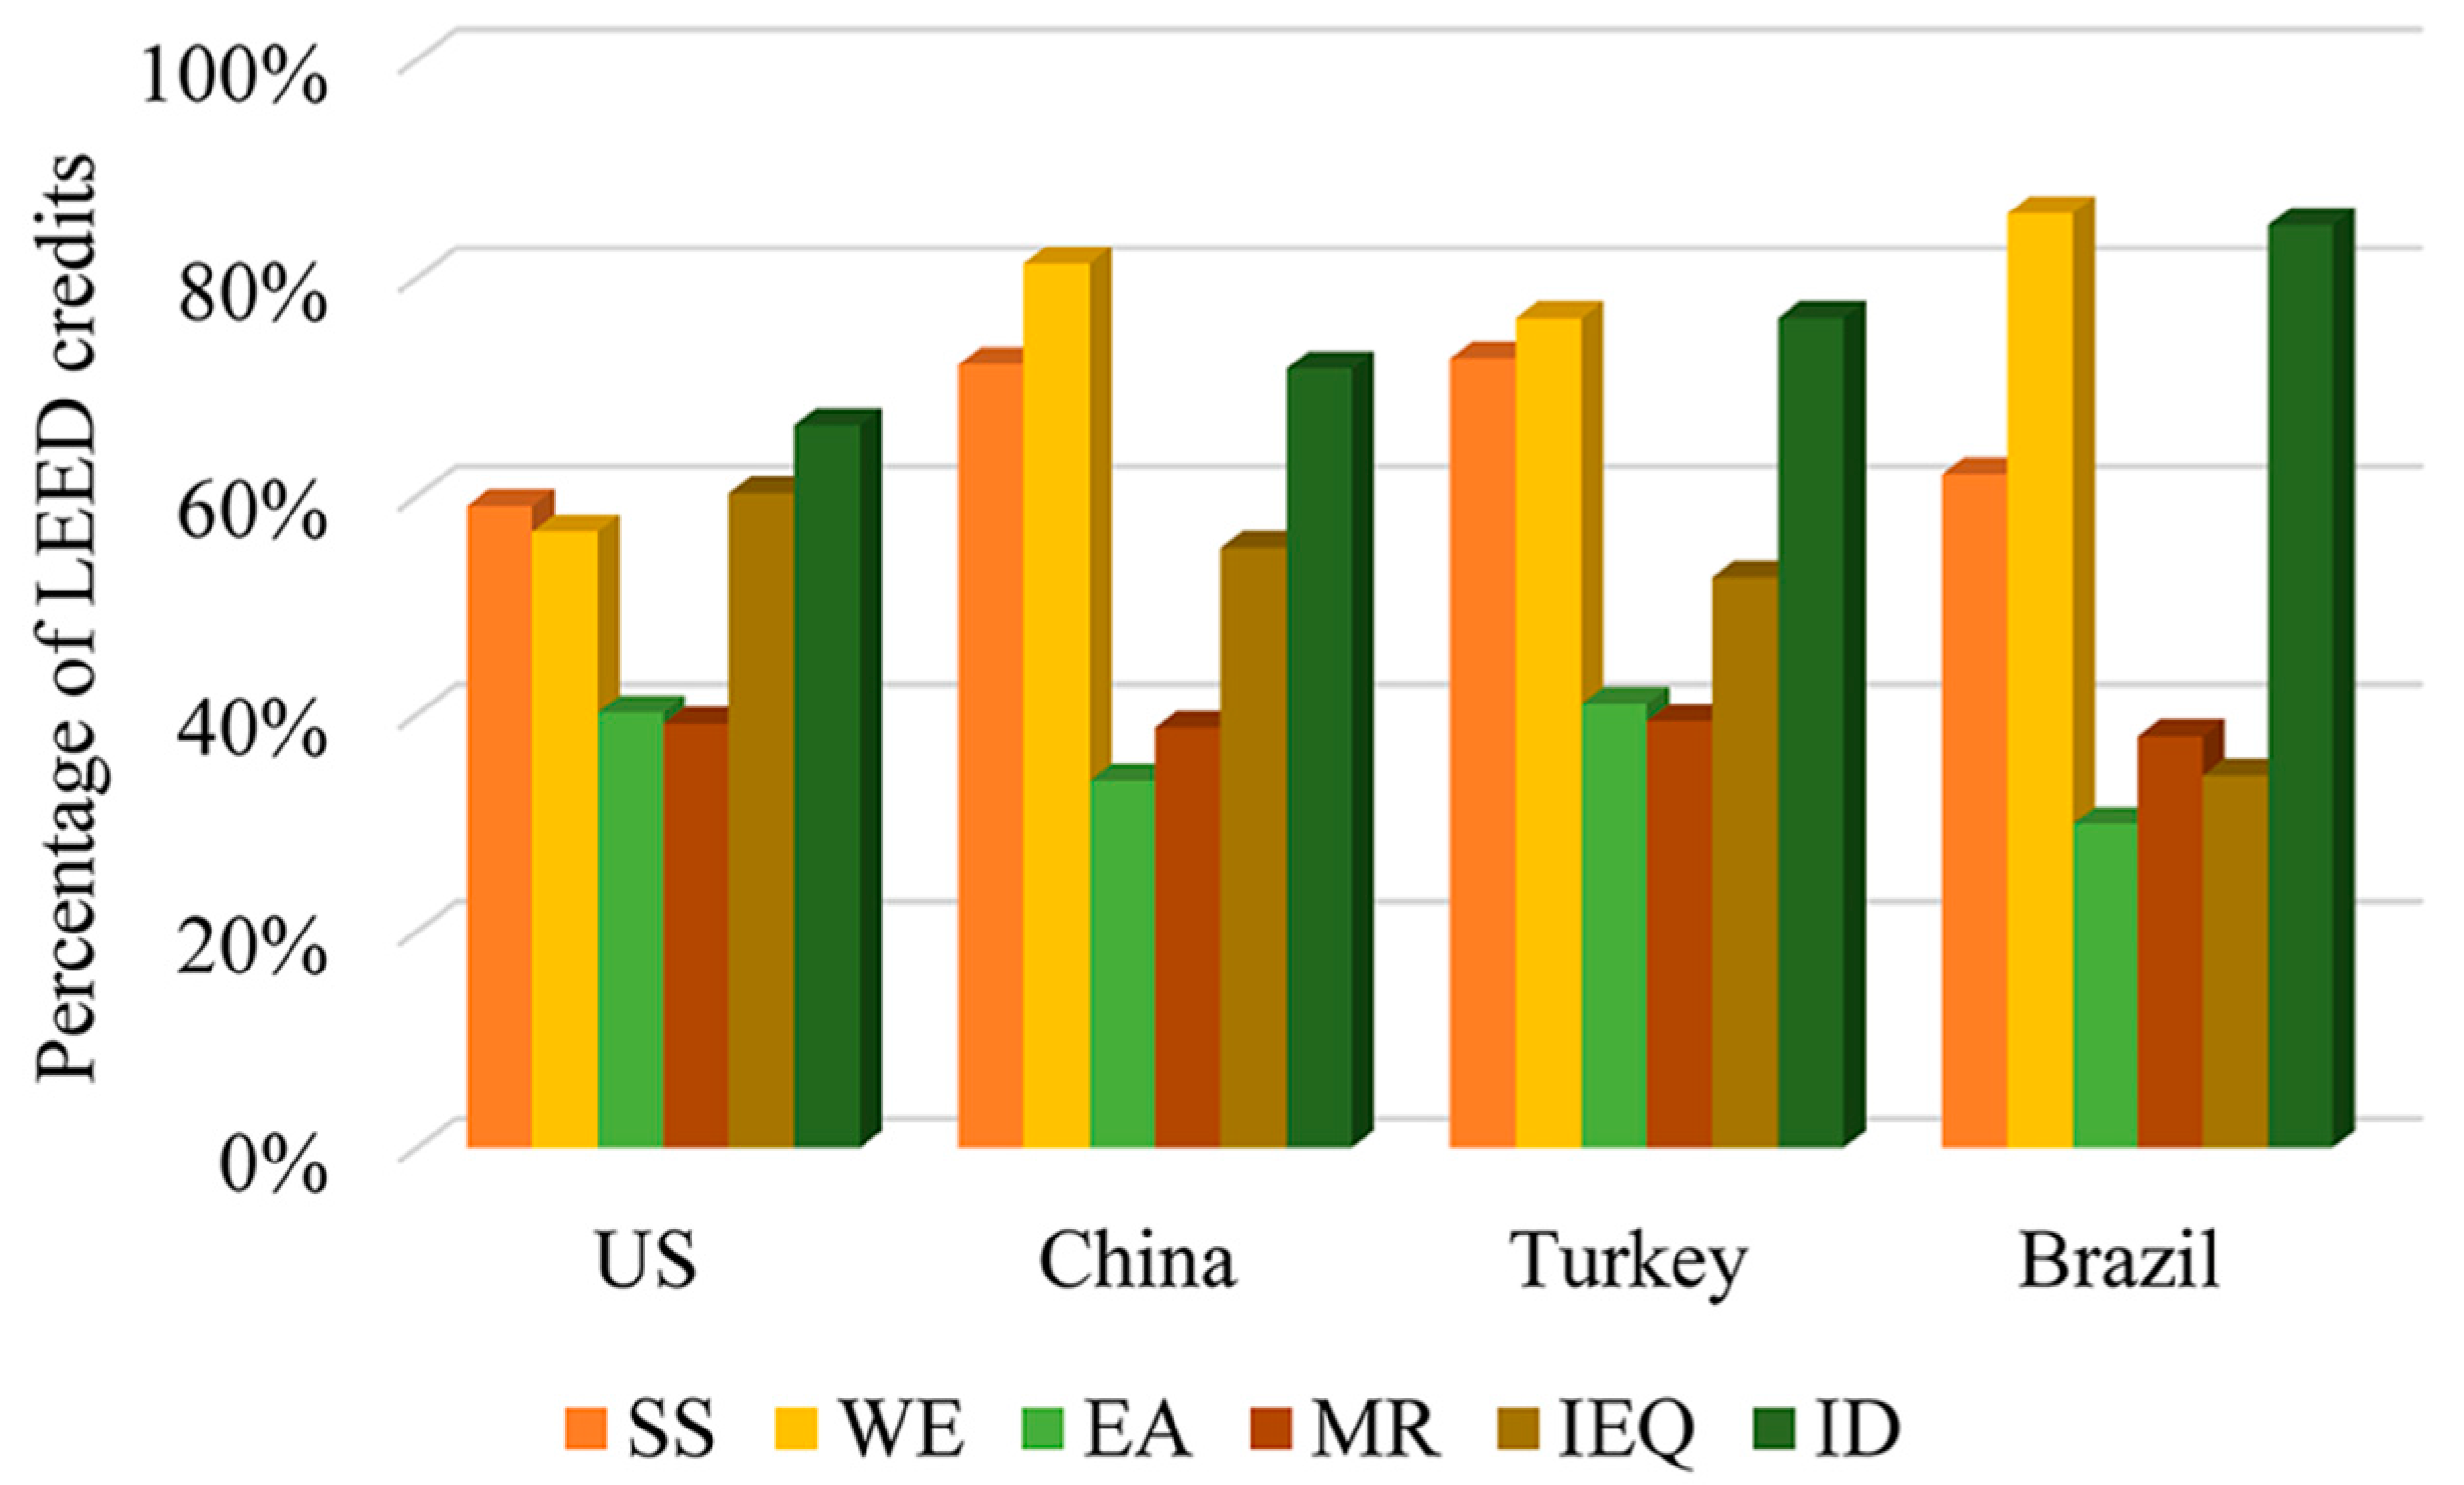
- While there are significant differences in the performance of LEED building across the four countries in sustainable sites, water efficiency, energy and atmosphere, indoor environmental quality, as well as innovation in design, there is no significant difference in material and resources. In accordance with previous studies [13,31,32,33], it is found that MR credits are very difficult to obtain and only 35% of the MR credits are obtained by certified projects. Figure 3 shows the percentage of achievement across the six main assessment categories. The results show that EA and MR credits are extremely difficult to achieve, when only 40% of the allocated credits can be achieved by certified projects. Such a pattern is found to be consistent across the four countries. In addition, it is surprising to see that IEQ is not commonly targeted in Brazil, with only a 30% percentage of achievement. As can be seen from Table 5, Brazil and US have similar certification structures. The difference may be caused by the differences in the types of certified projects, as demonstrated in Figure 1.
For the six main LEED categories, the CV values range from 0.16 to 0.73. This suggests that the general dispersion of all six main LEED categories is very minimal. In the six categories, SS normally has the lowest CV, while EA has the highest CV, indicating that EA-related credits have a large spread.
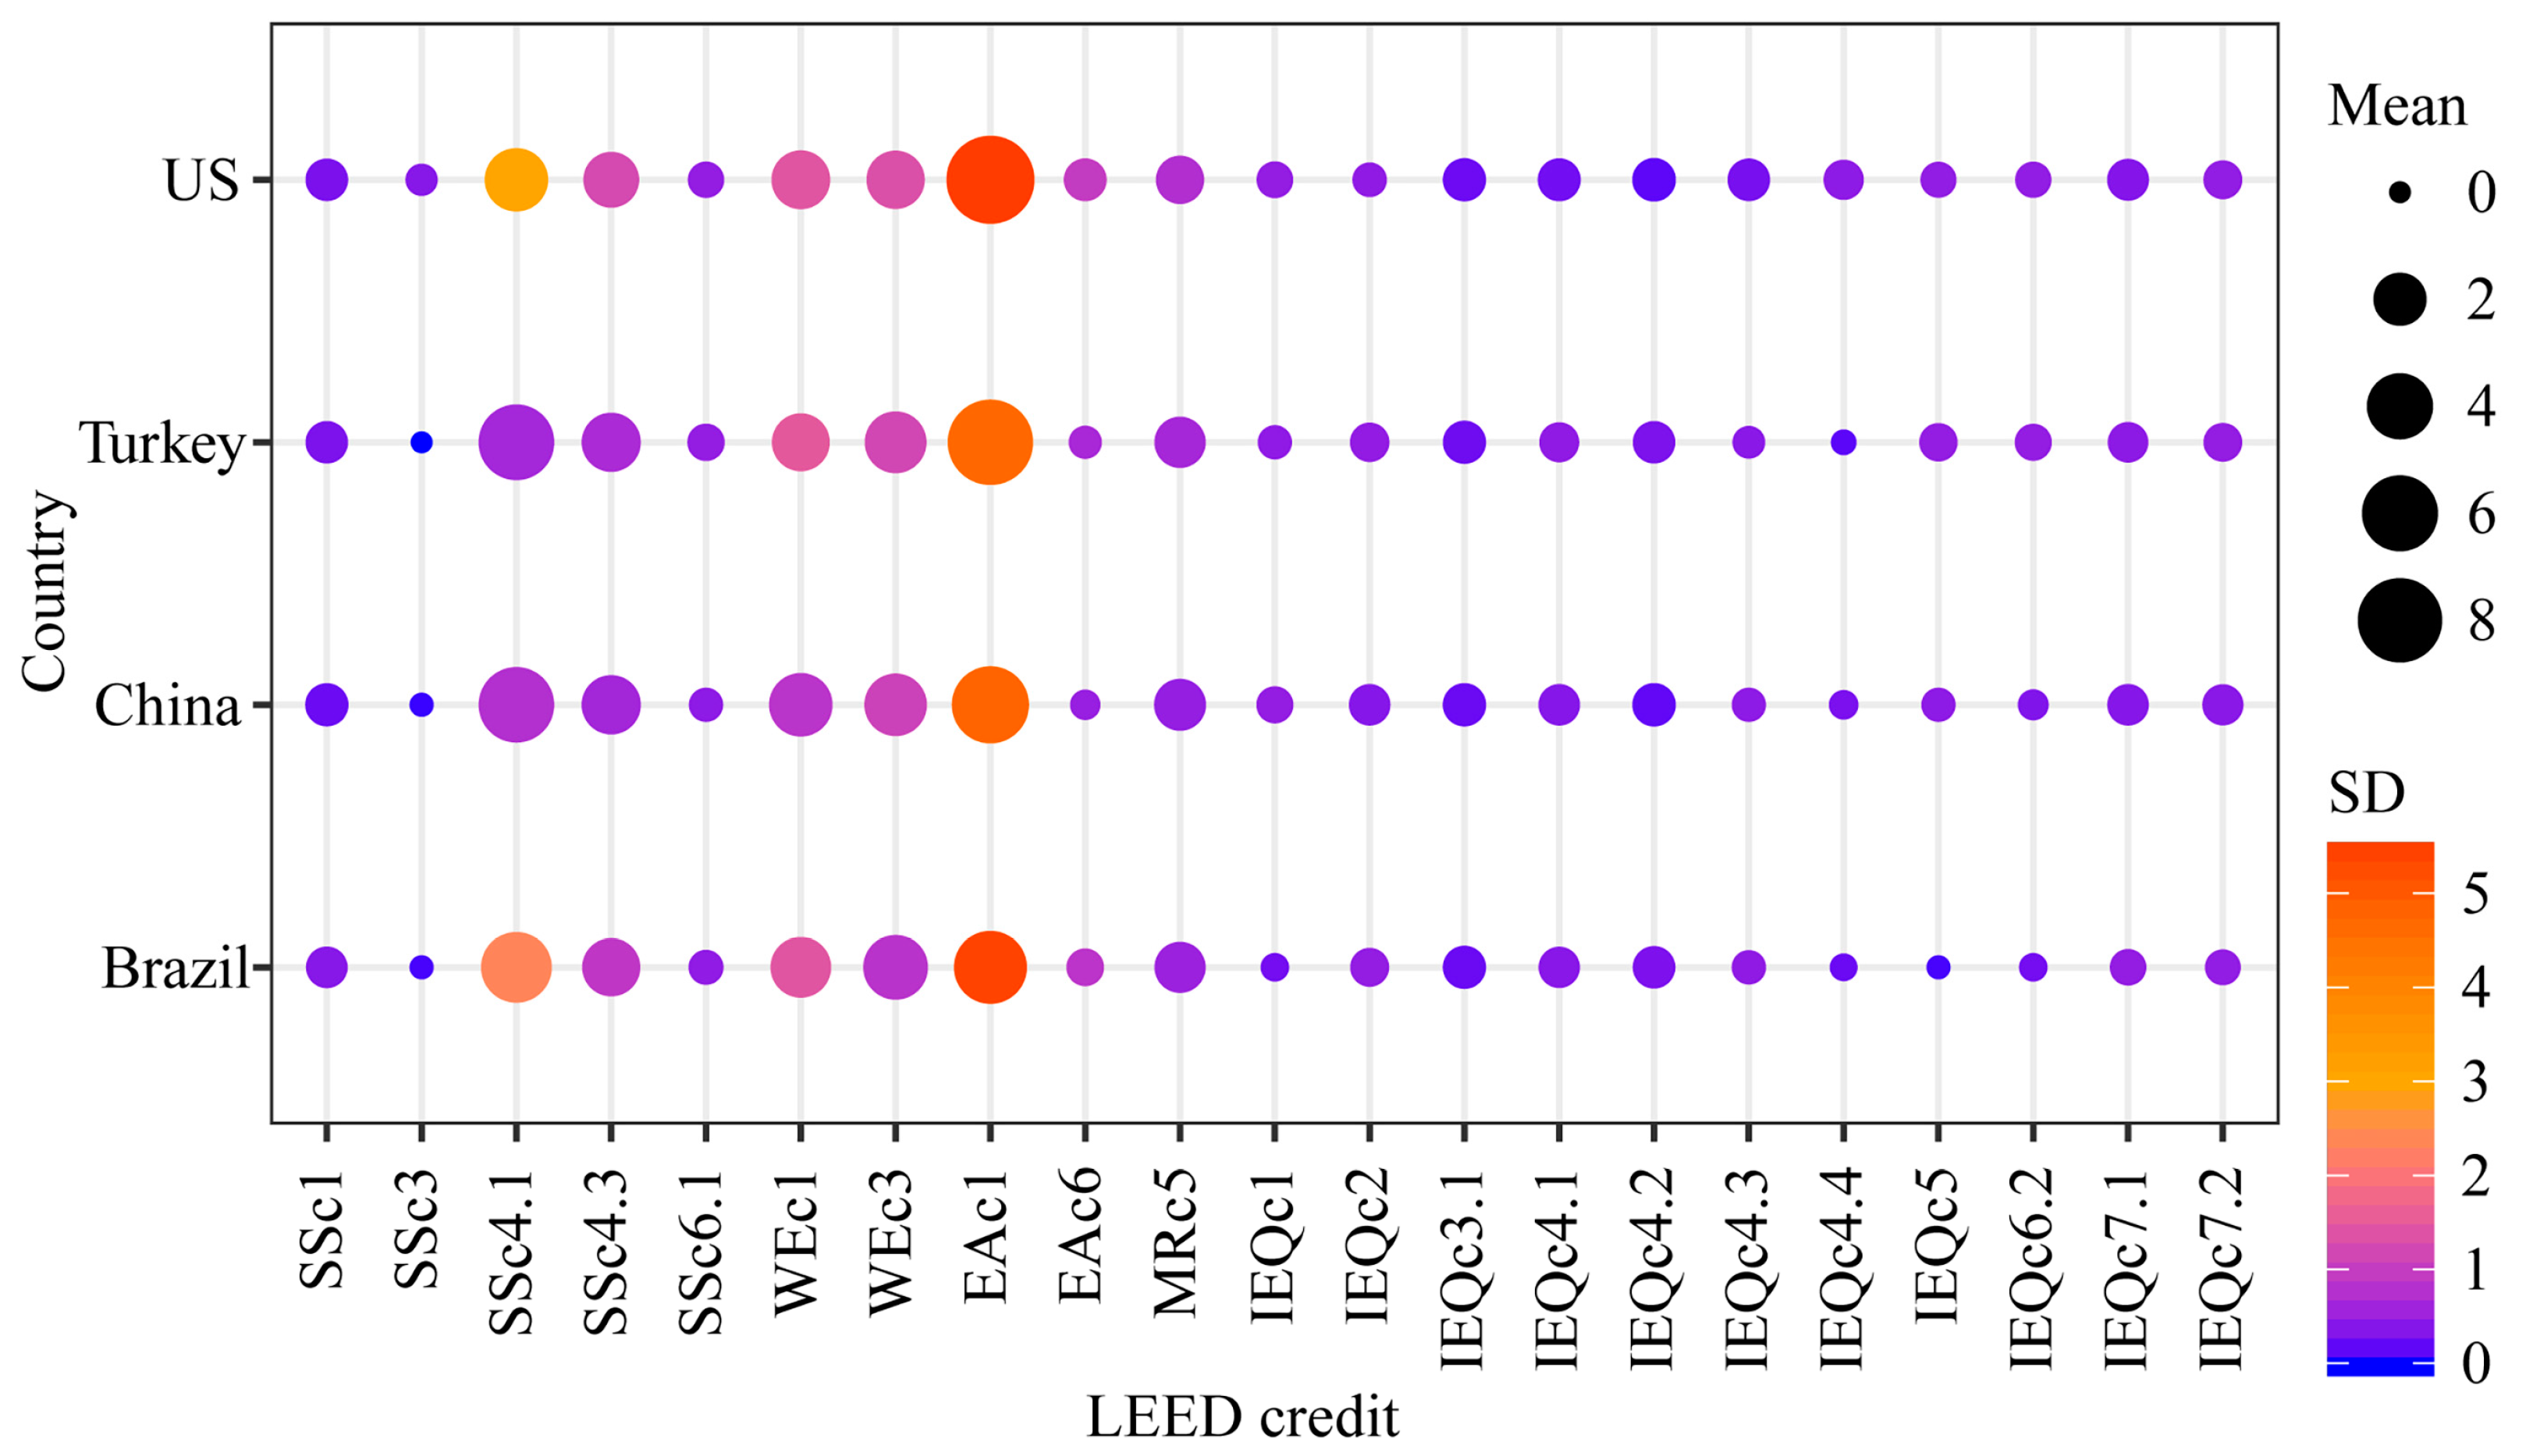
The performance of the LEED certified projects on the 21 regionally specific credits is shown in Table 7 and Figure 4. As can be seen from Table 7, the significance levels of most credits (except IEQc3.1) are lower than 0.05, indicating that there are significant differences between the four countries on these regionally specific LEED credits. In addition, some “point chasing” patterns can be identified from Table 7 and Figure 4. For example, in SS, most projects have achieved appropriate site selection (SSc1), while very limited projects, especially in non-US countries, have achieved brownfield redevelopment (SSc3). In EA, many US projects have started to use green power (EAc6) for LEED 2009 certification when compared to previous LEED v2.2. According to [16], the mean credit achievement for green power is only around 0.44 in LEED v2.2. This may imply that the availability and the affordability of green power have increased significantly over the years, which enables more projects to implement green power. The finding is in accordance with [34], who found that renewable electricity certificate (REC) sales, which is commonly used as a source for EAc6, has increased from 3.9 million MWh in 2005 to 36.0 million MWh in 2014. At the same time, REC prices have declined from 10 $/MWh to less than 1 $/MWh.
4.3. Regional Variations—Country Comparison
The results of the Kruskal-Wallis test (see Table 6) indicate that there are significant differences across the four countries for the mean value of most LEED main assessment categories (except for MR where no significant difference is identified).
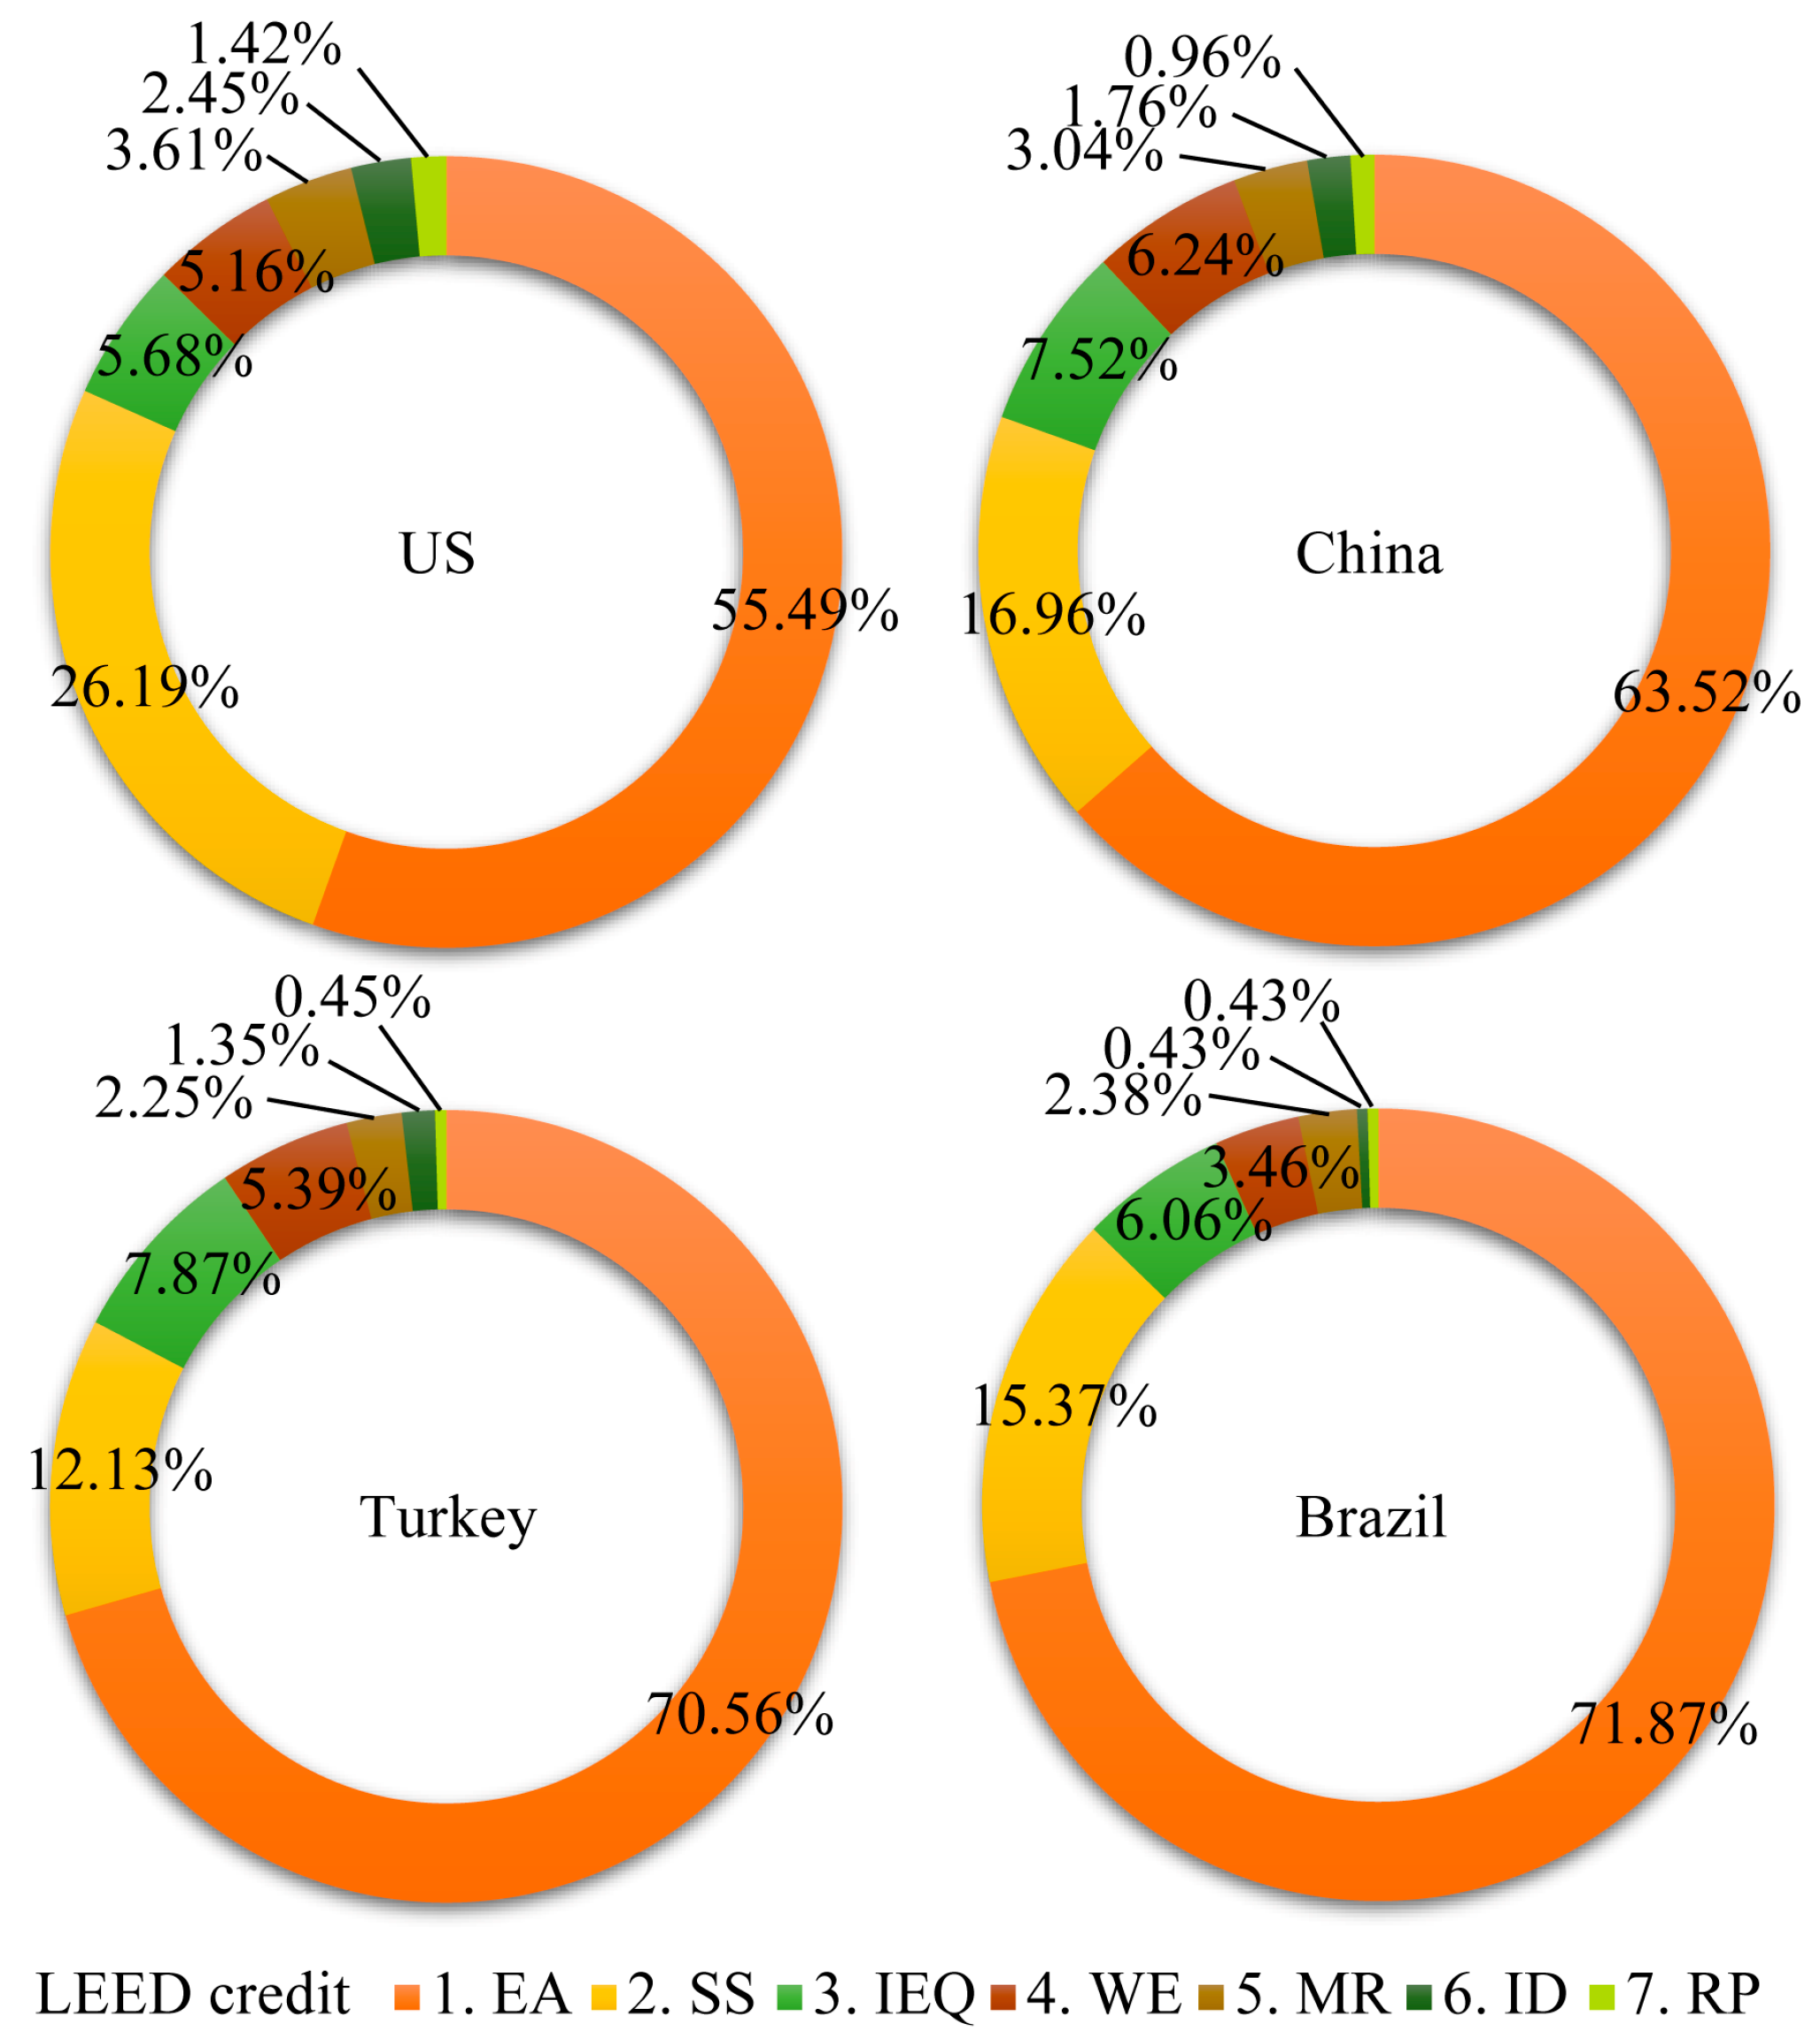
The results of the GAM development are shown in Table 8 and Figure 5. The sequence of the seven credits on the total deviance explained does not vary across the four countries. The most power predictor is EA, which is in consistent with previous studies, such as [35,36]. However, the deviance that is explained by the contributors varies significantly, especially in EA and SS. For example, it is usually correct to predict that a higher EA achievement will lead to higher certification level in Brazil and Turkey. However, in the US, the prediction will be complicated by the fact that EA only accounts for 55.48% of the rating. In addition, it should also be noted that the sequence of the prediction has been changed when compared to LEED v2.2. According to [16], for LEED v2.2 projects, the sequence of the predictors is EA, IEQ, SS, MR, ID, and WE. The sequence has been changed significantly to EA, SS, IEQ, WE, MR, and ID. It suggests that when compared to LEED v2.2, in order to achieve better desirable rating, although much attention should still be focused on energy and atmosphere, more attention is needed on sustainable sites and water efficiency.
In addition to the six main LEED credits, the post hoc analysis is conducted on the 20 regionally specific credits. The results are shown in Table 9. IEQc3.1 (construction indoor air quality management plan during construction) is excluded because no difference is identified from the Kruskal-Wallis test.
As can be seen from Table 9, in site selection (SSc1), no significant difference is spotted in most pairs. Most projects are able to select a suitable building location. However, US projects demonstrate a significant difference in other SS credits, including brownfield redevelopment (SSc3), public transportation access (SSc4.1), and low-emitting and fuel-efficient vehicles (SSc4.3). US projects have significantly better performance in rehabilitating damages sites. However, only 22% of the overall certified projects have achieved the credit, indicating the difficulty to achieve the credit. According to [37], there is evidence that brownfield projects normally reach higher sustainability standards of green building. Brownfields sites tend to be dense and are normally mixed use, which can reduce greenhouse gas emissions by 20–40 percentages [38]. However, the credit is only allocated with 1 point, which calls for further improvement. In addition, US projects have not performed well in providing accessible public transportation and using low-emitting and fuel-efficient vehicles. The results highlight useful improvement areas for US projects.
In WE-related credits, projects in China have significantly better performance in water efficient landscaping (WEc1). In addition, all other three countries perform better on water use reduction (WEc3) when compared to the US. Water scarcity appears to be a common problem for all countries [39,40]. However, it should be noted that the US has a higher water stress indicator when compared to China, Brazil, and Turkey [35]. As such, it is surprising to see that US projects have not performed well on water efficiency when compared to the projects in other countries.
In EA-related credits, US projects have significantly better performance in utilizing green power (EAc6) due to much better availability and affordability. In addition, US projects and Turkey projects have significantly better performance in optimizing energy performance (EAc1). Further analysis is needed to investigate the reasons leading to the significant regional variation in energy performance. However, it should be noted that green buildings in China do not need to pursue maximum energy performance due to the National Green Building Evaluation Standard (GB/T 50378-2006). The system does not use a scoring system, but it focuses on the number of options to achieve and satisfy [41]. As long as the China Design Standard for Energy Efficiency is met, then the building will achieve the score in energy efficiency, regardless of how much improvement is demonstrated.
The practice related to the use of regionally available materials (MRc5) has been changed significantly. According to [42], MRc5 was rarely achieved in LEED certified buildings. However, the mean score of MRc5 is increased to 1.43 to 1.85 (out of 2), depending on the specific country. In addition, projects in China, Turkey, and Brazil perform significantly better in utilizing regional materials, which may imply that resource availability in these countries is much better.
In addition, it seems that countries have their own patterns in pursuing IEQ-related credits. For example, US projects perform significantly better in using low-emitting materials, including adhesive and sealants (IEQc4.1), paints and coatings (IEQc4.2), flooring systems (IEQc4.3), and composite wood and agrifiber products (IEQc4.4). This suggests that the availability and uptake of low-emitting materials in the US may be better than other countries. However, US projects significantly underperform in increased ventilation (IEQc2). In addition, projects in Brazil significantly underperform in outdoor air delivery monitoring (IEQc1), thermal comfort control (IEQc6.2), and thermal comfort design (IEQc7.1). Projects in China significantly underperform in thermal comfort control (IEQc6.2). The results provide useful benchmarks for countries with undesirable performance to improve.
4.4. RP Credits
RP credits are bonus points if the LEED projects address regionally specific issues. A frequency analysis is conducted on each RP credit in each country. This will be useful to identify the importance of the credit to the regional development and whether there is a point chasing problem in specific RP credits.
For US projects, the most commonly achieved RP credits are quantity control in stormwater design (SSc6.1; 20.3%), public transport access (SSc4.1; 18.9%), and construction waste management (MRc2; 18.4%). The achievement highlights their importance in developing green buildings that address regional differences. However, it should be noted that the RP credits in the US are dependent on the zip code of the projects. As such, estimating the frequency of the RP credits in the US has limited guidance on how RP credits should be improved to balance multiple regional priorities.
The performance of the projects in China on its RP credits is shown in Table 10. It seems that water efficient landscaping (WEc1) is a common credit that is targeted by most projects. On the other hand, quantity control in stormwater design (SSc6.1) is rarely achieved.
Similarly, for the RP credits in Turkey (see Table 11), the most commonly achieved RP credit is heat island effect—roof (SSc7.2) and other RP credits, especially construction waste management (MRc2) and building reused related to interior non-structural elements (MRc1.2), are rarely achieved.
For RP credits in Brazil (see Table 12), water use reduction (WEc3) and innovative wastewater technologies (WEc2) are achieved by most projects (88.0% and 84.0% respectively). On the other hand, On-site renewable energy (EAc2) and quantity control in stormwater design (SSc6.1) are rarely achieved.
5. Discussions and Recommendations
This study uses a ranking procedure to identify the best performing countries in green building development in terms of the overall LEED points achieved. It provides a preliminary evaluation of the green building development in specific countries. For example, Brazil and the US have relatively low overall LEED points that are achieved. For Brazil, the low overall achievement seems to be caused by low sustainable sites, energy, and atmosphere, as well as indoor environmental quality. For the US, the low overall achievement seems to be caused by low sustainable sites and water efficiency scores.
This study also uses post hoc analysis to identify the differences in regionally specific credits, such as the use of green power. The results can be considered as useful points of references for countries to benchmark their performance. For example, US projects have significantly better performance in rehabilitating damaged sites. Nearly all of the projects in other countries cannot achieve this specific credit. In addition, US projects perform significantly better in utilizing green power. A detailed investigation into the availability and affordability of the green power in the US may be useful for other countries to accelerate the uptake process. On the other hand, China’s projects perform significantly better in using water efficient landscaping and achieving water use reduction. Given that the US has a relatively high water stress indicator, a further analysis of the reasons leading to the difference will be useful for US projects to improve. Some new trends are also found in the current rating system. For example, using regionally available materials was rarely achieved in LEED v2.2 certified projects. However, it is now a very common practice due to better availability.
The results can also be used by regulatory authorities to continually improve the current rating system. For example, rehabilitating damaged sites is found to be rarely achieved by projects, despite the fact that its environmental impact is found to be significant. This suggests that a point re-allocation process needs to be done for this credit [43,44]. In addition, although multiple RP credits are selected for each country, it is found that many credits are heavily favored, while others are completely ignored. For example, projects in China heavily prefer water efficient landscaping and optimizing energy performance with 91.8% and 72.4% of the certified projects achieving the relevant credits. On the other hand, quantity control in stormwater design is rarely achieved. A similar pattern is also found in Brazil’s projects where quantity control in stormwater design and on-site renewable energy only have a frequency indicator of 1.3%. However, a different pattern is found in Turkey’s projects where projects that adopt quantity control in stormwater design as RP credit are increased to 22.1%. For projects in Turkey, the least adopted RP credits are reusing interior non-structural elements and construction waste management. It should be noted that the RP credits represent significant regional environmental concerns and a balanced achievement of these RP credits are important to address these concerns [41,42]. The unbalanced achievement can indicate that the level of difficulty in securing the RP credit varies significantly and re-designing the credit is needed. However, it can also suggest that the RP credits in LEED 2009 do not represent regional environmental priorities. For example, Suzer argued that the RP credits for countries other than the US are a short-term solution and that there is no scientific data derived from extensive research on each country relating to why these RP credits are selected [31]. Suzer also examined China as a case study and found that credits related to low-emitting transportation vehicles, rehabilitation of damaged sites and limited horizontal development should be significantly important for China [31]. However, these credits are none of the RP credits proposed by the USGBC. It seems that the selection and allocation of RP credits require further investigation.
6. Conclusions and Policy Implications
LEED has been continually improved to meet new challenges, such as adapting local conditions. Understanding the updated LEED performance at the country level is critically important for central governments to establish relevant green building development regulations and guidelines. One of the major contributions of this study is to critically analyze all LEED 2009 certified buildings in the US, China, Turkey, and Brazil, and to provide performance benchmarks for each country to improve. The key findings are:
- Turkey has the highest mean points achieved, followed by China, US, and Brazil.
- US and China, which are the top two countries in terms of the number of certified projects, perform differently. US has high achievement in energy and atmosphere while China has high achievement in sustainable sites and water efficiency.
Another contribution of the study is to identify country-specific LEED certification patterns by analyzing 12 regionally specific LEED credits. The key findings are:
- For sustainable sites management, US projects have significantly better performance in rehabilitating damaged sites and utilizing green power. However, they do not perform well in providing accessible public transportation and using low-emitting vehicles.
- For water efficiency management, China’s projects have significantly better performance in water efficient landscaping and achieving water use reduction.
- For energy and atmosphere management, US projects perform significantly better in utilizing green power due to much better availability and affordability.
- Using regionally manufactured materials is now a common practice for all of the countries, despite its low adoption rate in previous LEED versions.
- The regional priorities credits need to be re-designed because the unbalanced achievement signals a problem of point-chasing.
This study has some limitations. Due to the relatively low number of certified projects, countries with less than 30 Silver and Gold projects are not included. As such, this study offers limited guidance on achieving desirable certification level for projects in countries other than the US, China, Turkey, and Brazil. In addition, the reasons leading to the varied performance on some credits (e.g., water use reduction) need further analysis. The varied performance may be caused by the project characteristics, such as types, sizes, and certification levels in the four countries. The causal connection requires further investigation. It is also proposed that a correlation analysis between the cost and the credit achievement will be useful to understand why certain credits are targeted. In addition, future studies are recommended to consider to investigate a structured method to investigate RP credits in the US.
Acknowledgments
This research was supported by the Australian Government through the Australian Research Council's Discovery Early Career Researcher Award funding scheme (project DE170101502).
Author Contributions
Peng Wu designed and drafted the paper; Qinghua He and Xiangyu Wang provided conceptual inputs when designing the research; Yongze Song and Jun Wang collected and analyzed the data; Xianbo Zhao provided valuable comments about the analysis and policy implications of the research.
Conflicts of Interest
The authors declare no conflict of interest.
References
- Chan, E.H.W.; Qian, Q.K.; Lam, P.T.I. The market for green building in developed Asian cities—The perspectives of building designers. Energy Policy 2009, 37, 3061–3070. [Google Scholar] [CrossRef]
- Hwang, B.G.; Zhao, X.; Tan, L.L.G. Green building projects: Schedule performance, influential factors and solutions. Eng. Constr. Archit. Manag. 2015, 22, 327–346. [Google Scholar] [CrossRef]
- Zhao, X.; Hwang, B.G.; Lee, H.N. Identifying critical leadership styles of project managers for green building projects. Int. J. Constr. Manag. 2016, 16, 150–160. [Google Scholar] [CrossRef]
- Adler, A.; Armstrong, J.E.; Fuller, S.K.; Kalin, M.; Karolides, A.; Macaluso, J.; Walker, H.A. Green Building: Project Planning and Cost Estimating, 2nd ed.; R.S. Means: Kingston, MA, USA, 2006. [Google Scholar]
- Alnaser, N.W.; Flanagan, R. The need of sustainable buildings construction in the Kingdom of Bahrain. Build. Environ. 2007, 42, 495–506. [Google Scholar] [CrossRef]
- Wang, N.; Chang, Y.; Nunn, C. Life cycle assessment for sustainable design options of a commercial building in Shanghai. Build. Environ. 2010, 45, 1415–1421. [Google Scholar] [CrossRef]
- Amini, M.H.; Frye, J.; Ilić, M.D.; Karabasoglu, O. Smart residential energy scheduling utilizing two stage mixed integer linear programming. In Proceedings of the IEEE North American Power Symposium (NAPS), Charlotte, NC, USA, 4–6 October 2015; pp. 1–6. [Google Scholar]
- Ali, H.H.; Nsairat, S.F.A. Developing a green building assessment tool for developing countries—Case of Jordan. Build. Environ. 2009, 44, 1053–1064. [Google Scholar] [CrossRef]
- USGBC. Directory of Projects. 2016. Available online: http://www.usgbc.org/projects/new-construction (accessed on 25 July 2016).
- Wu, P.; Low, S.P. Project management and green buildings: Lessons from the rating systems. J. Prof. Issues Eng. Educ. Pract. 2010, 136, 64–70. [Google Scholar] [CrossRef]
- Da Silva, L.; Ruwanpura, J.Y. A review of the LEED points obtained in Canadian building projects to lower costs and optimize benefits. J. Archit. Eng. 2009, 15, 38–54. [Google Scholar] [CrossRef]
- Newsham, G.R.; Mancini, S.; Birt, B.J. Do LEED-certified buildings save energy? Yes, but…. Energy Build. 2009, 41, 897–905. [Google Scholar] [CrossRef]
- Ma, J.; Cheng, J.C.P. Data-driven study on the achievement of LEED credits using percentage of average score and association rule analysis. Build. Environ. 2016, 98, 121–132. [Google Scholar] [CrossRef]
- Faulconbridge, J. Mobilising sustainable building assessment models: Agents, strategies and local effects. Area 2015, 47, 116–123. [Google Scholar] [CrossRef] [Green Version]
- Cidell, J.; Beata, A. Spatial variation among green building certification categories: Does place matter? Landsc. Urban Plan. 2009, 91, 142–151. [Google Scholar] [CrossRef]
- Wu, P.; Mao, C.; Wang, J.; Song, Y.; Wang, X. A decade review of the credits obtained by LEED v2.2 certified green building projects. Build. Environ. 2016, 102, 167–178. [Google Scholar] [CrossRef]
- Vijayan, A.; Kumar, A. A review of tools to assess the sustainability in building construction. Environ. Prog. 2005, 24, 125–132. [Google Scholar] [CrossRef]
- U.S. Environmental Protection Agency. Introduction to the LEED 2009 Credit Weighting Tool. 2009. Available online: https://clu-in.org/conf/tio/lcia_092309/LEED-2009-Weightings-Tool-Overview.pdf (accessed on 8 December 2017).
- Zhou, T.; Tan, L.F. A study on energy saving of LEED-NC green building rating system from point analysis. Adv. Mater. Res. 2012, 374–377, 122–126. [Google Scholar] [CrossRef]
- Zimmberman, A.; Kibert, C.J. Informing LEED’s next generation with the natural step. Build. Res. Inf. 2007, 35, 681–689. [Google Scholar] [CrossRef]
- Potbhare, V.; Syal, M.; Arif, M.; Khalfan, M.M.; Egbu, C. Emergence of green building guidelines in developed countries and their impact on India. J. Eng. Des. Technol. 2009, 7, 99–121. [Google Scholar] [CrossRef]
- Cole, R.J.; Jose Valdebenito, M. The importation of building environmental certification systems: International usages of BREEAM and LEED. Build. Res. Inf. 2013, 41, 662–676. [Google Scholar] [CrossRef]
- Boschmann, E.E.; Gabriel, J.N. Urban sustainability and the LEED rating system: Case studies on the role of regional characteristics and adaptive reuse in green building in Denver and Boulder, Colorado. Geogr. J. 2013, 179, 221–233. [Google Scholar] [CrossRef]
- USGBC. LEED 2009 for New Construction and Major Renovations Rating System with Alternative Compliance Paths for Projects Outside the U.S. 2009. Available online: https://www.igbc.ie/wp-content/uploads/2017/06/LEED-2009-NC.pdf (accessed on 8 December 2017).
- Hwang, B.G.; Zhao, X.; See, Y.L.; Zhong, Y. Addressing risks in green retrofit projects: The case of Singapore. Proj. Manag. J. 2015, 46, 76–89. [Google Scholar] [CrossRef]
- Hwang, B.G.; Shan, M.; Phua, H.; Chi, S. An Exploratory Analysis of Risks in Green Residential Building Construction Projects: The Case of Singapore. Sustainability 2017, 9, 1116. [Google Scholar] [CrossRef]
- USGBC. Alternative Compliance Paths Continue to Localize LEED. 2016. Available online: http://www.usgbc.org/articles/alternative-compliance-paths-continue-localize-leed (accessed on 5 September 2016).
- Alyami, S.H.; Rezgui, Y. Sustainable building assessment tool development approach. Sustain. Cities Soc. 2012, 5, 52–62. [Google Scholar] [CrossRef]
- Grace, K.C.D. Sustainable construction—The role of environmental assessment tools. J. Environ. Manag. 2008, 86, 451–464. [Google Scholar] [Green Version]
- Wu, P.; Song, Y.; Shou, W.; Chi, H.; Chong, H.Y.; Sutrisna, M. A comprehensive analysis of the credits obtained by LEED 2009 certified green buildings. Renew. Sustain. Energy Rev. 2017, 68, 370–379. [Google Scholar] [CrossRef]
- Suzer, O. A comparative review of environmental concern prioritization: LEED vs other major certification systems. J. Environ. Manag. 2015, 154, 266–283. [Google Scholar] [CrossRef] [PubMed]
- Matisoff, D.C.; Noonan, D.S.; Mazzolini, A.M. Performance or marketing benefits? The case of LEED certification. Environ. Sci. Technol. 2014, 48, 2001–2007. [Google Scholar] [CrossRef] [PubMed] [Green Version]
- Schendler, A. Getting Green Done: Hard Truths from the Front Lines of the Sustainability Revolution; Public Affairs: New York, NY, USA, 2009. [Google Scholar]
- O’Shaughnessy, E.; Heeter, J.; Liu, C.; Nobler, E. Status and Trends in the U.S. Voluntary Green Power Market (2014 Data). 2015. Available online: http://www.nrel.gov/docs/fy16osti/65252.pdf (accessed on 31 August 2016).
- Smakhtin, V.; Revenga, C.; Doll, P. A pilot global assessment of environmental water requirements and scarcity. Water Int. 2004, 29, 307–317. [Google Scholar] [CrossRef]
- Chance, S. Planning for environmental sustainability: Learning from LEED and the USGBC. Plan. High. Educ. 2012, 41, 194–233. [Google Scholar]
- Paull, E. The Environmental and Economic Impacts of Brownfields Redevelopment. 2008. Available online: http://www.nemw.org/wp-content/uploads/2015/06/2008-Environ-Econ-Impacts-Brownfield-Redev.pdf (accessed on 30 August 2016).
- Urban Redevelopment Authority. Showcase Projects: Washington’s Landing. Available online: http://www.ura.org/working_with_us/brownfieldProjects/WashingtonsLanding_BrownfieldBrief.pdf (accessed on 30 August 2016).
- Padowski, J.C.; Jawitz, W. Water availability and vulnerability of 225 large cities in the United States. Water Resour. Res. 2012, 48, 1–16. [Google Scholar] [CrossRef]
- Jiang, Y. China’s water scarcity. J. Environ. Manag. 2009, 90, 3185–3196. [Google Scholar] [CrossRef] [PubMed]
- Hong, T. A close look at the China design standard for energy efficiency of public buildings. Energy Build. 2009, 41, 426–435. [Google Scholar] [CrossRef]
- Humbert, S.; Abeck, H.; Bali, N.; Horvath, A. Leadership in Energy and Environmental Design (LEED): A critical evaluation by LCA and recommendations for improvement. Int. J. Life Cycle Assess. 2007, 12, 46–57. [Google Scholar]
- Komurlu, R.; Arditi, D.; Gurgun, A.P. Energy and atmosphere standards for sustainable design and construction in different countries. Energy Build. 2015, 90, 156–165. [Google Scholar] [CrossRef]
- Donghwa, G.; Yong, K.H.; Hyoungsub, K. LEED, its efficacy in regional context: Finding a relationship between regional measurements and urban temperature. Energy Build. 2015, 86, 687–691. [Google Scholar] [CrossRef]
Figure 1.
The types of all LEED 2009 certified projects in the four countries.

Figure 2.
The mean and SD of points achieved by LEED projects in United States (US), China, Turkey, and Brazil.
Figure 2.
The mean and SD of points achieved by LEED projects in United States (US), China, Turkey, and Brazil.
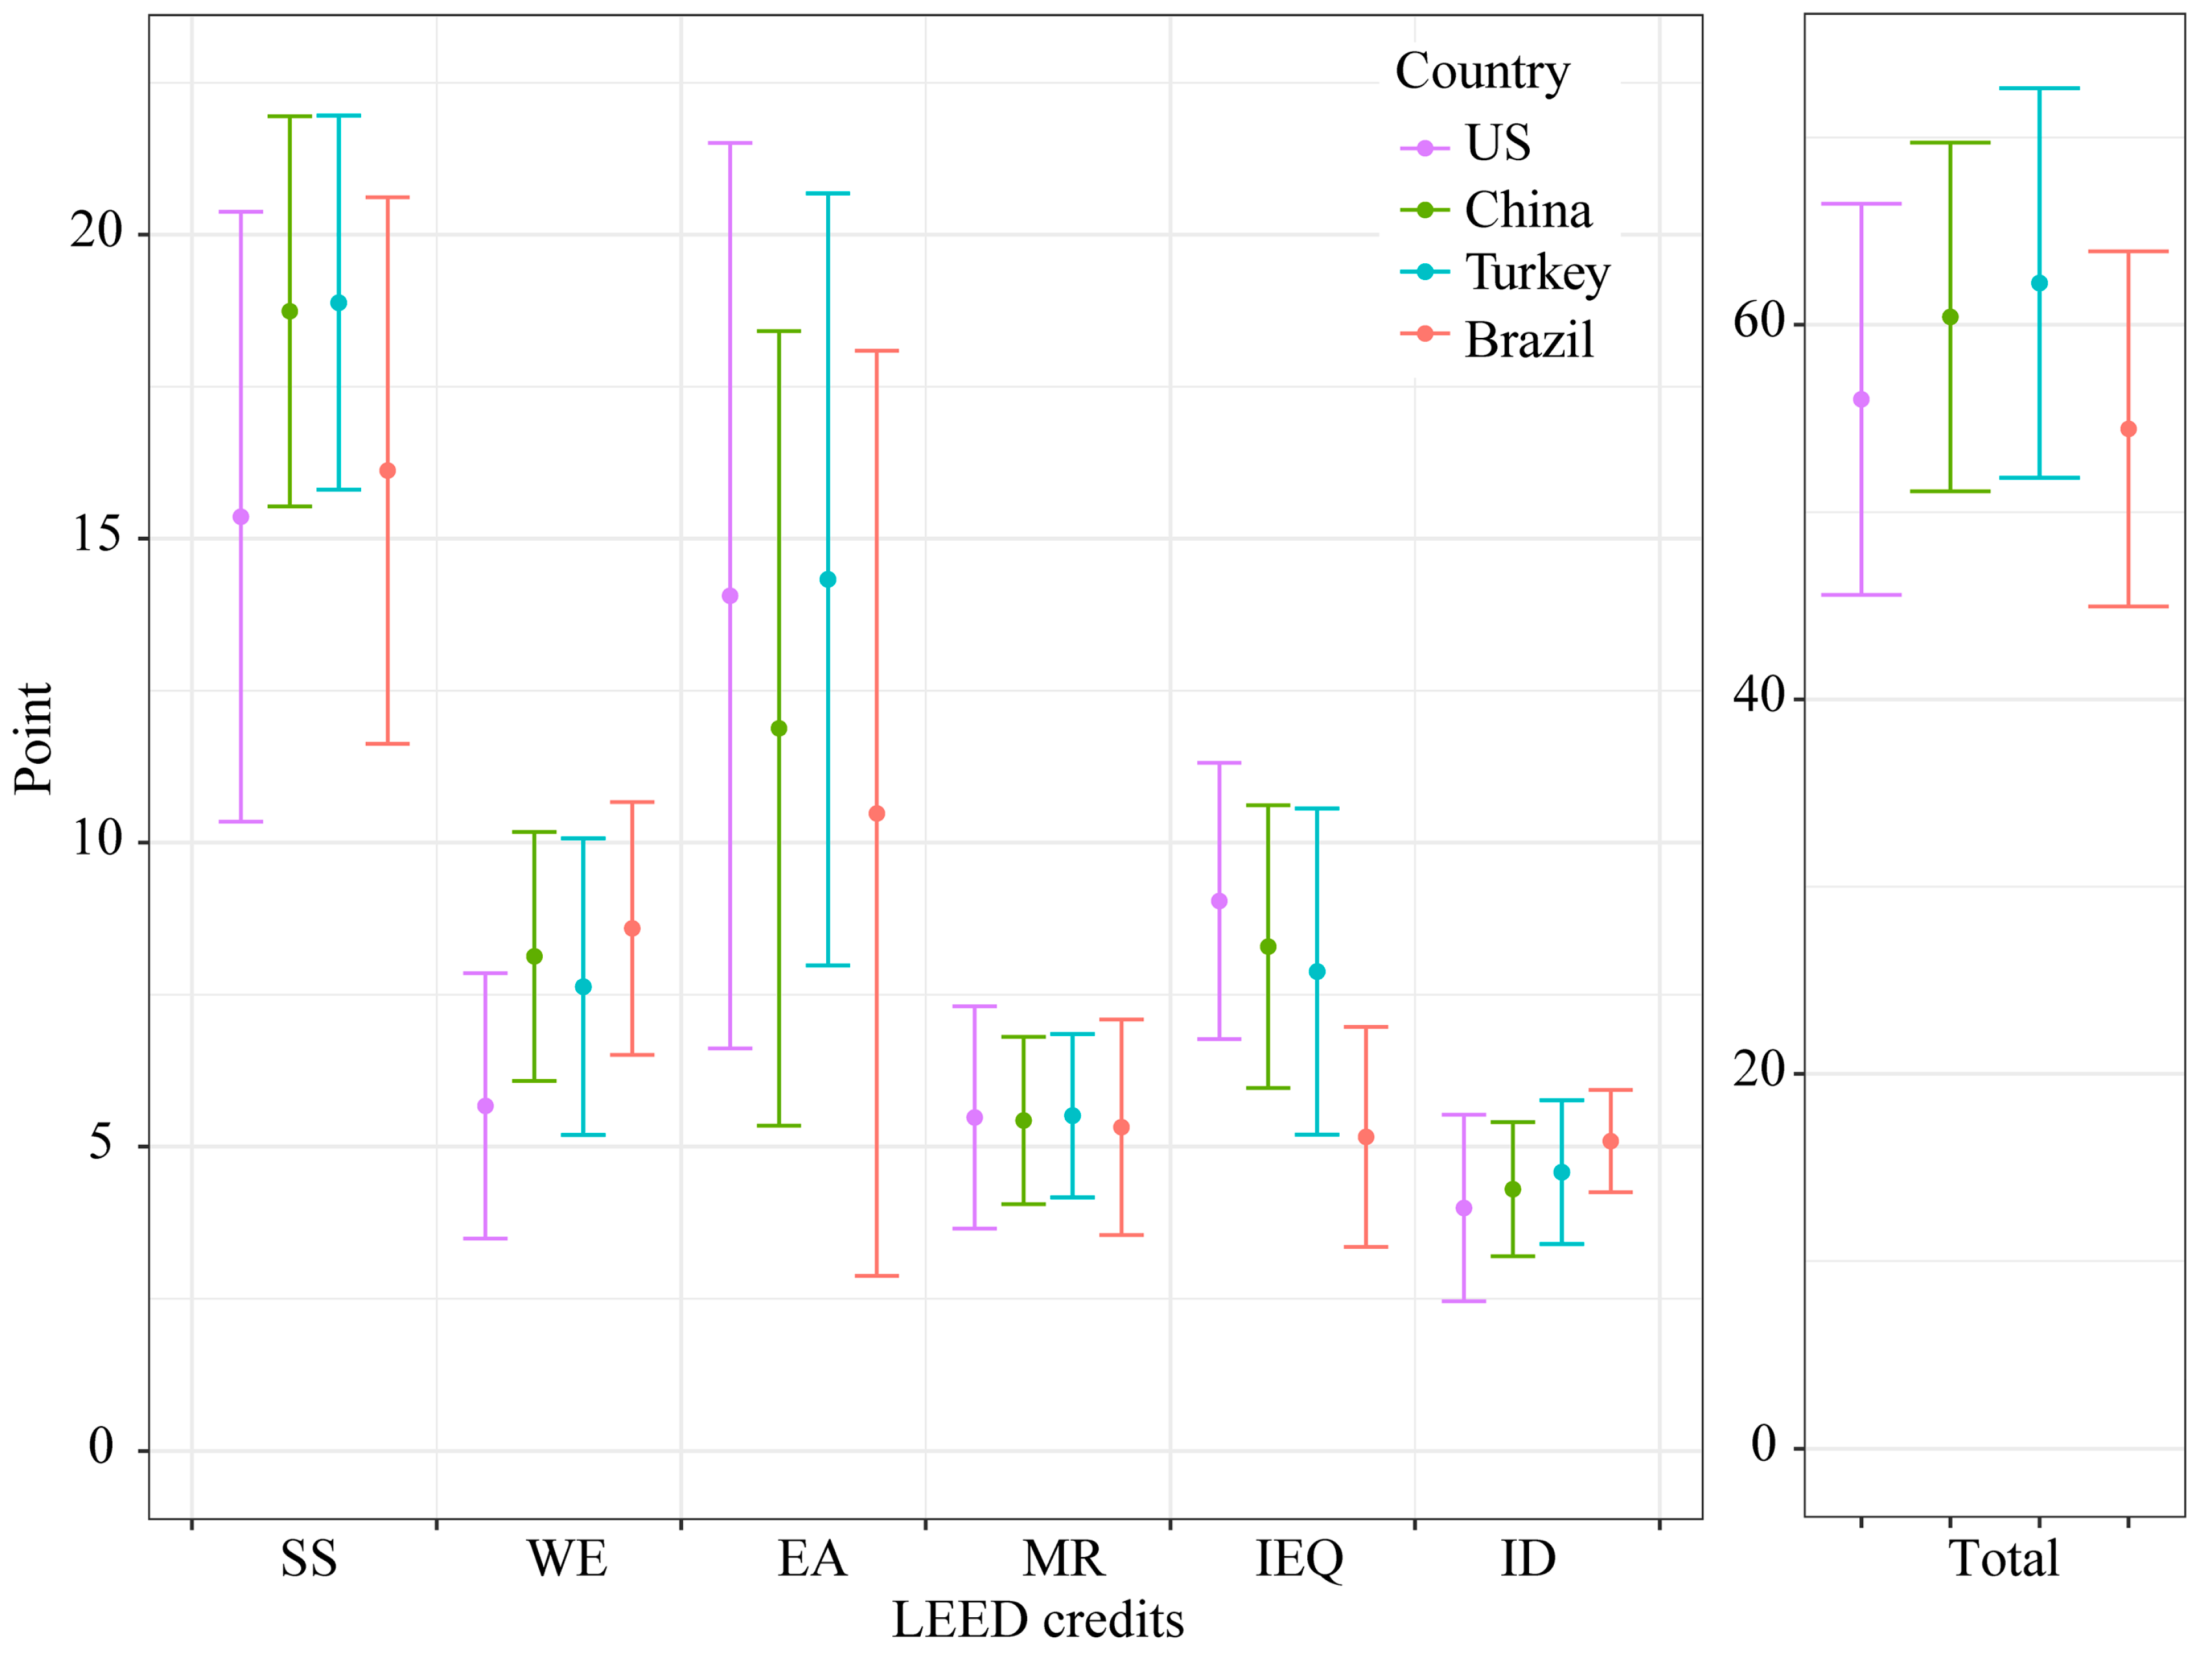
Figure 3.
The percentage of achievement in each main assessment category.

Figure 4.
The mean and SD of points achieved by LEED projects on the 21 regionally specific credits.
Figure 4.
The mean and SD of points achieved by LEED projects on the 21 regionally specific credits.

Figure 5.
The predicting factors of LEED certification level in US, China, Turkey, and Brazil.


Table 1.
The credits with alternative compliance paths in Leadership in Energy and Environmental Design (LEED) 2009.
Table 1.
The credits with alternative compliance paths in Leadership in Energy and Environmental Design (LEED) 2009.
| Credit | Title | Regions | ||
|---|---|---|---|---|
| East Asia | Europe | South America | ||
| SS | Sustainable Sites | |||
| SSc1 | Site Selection | √ | √ | |
| SSc3 | Brownfield Redevelopment | √ | √ | √ |
| SSc4.1 | Alternative Transportation—Public Transport Access | √ | √ | |
| SSc4.3 | Alternative Transportation—Low-Emitting and Fuel-Efficient Vehicles | √ | √ | |
| SSc6.1 | Stormwater Design—Quality Control | √ | √ | √ |
| WE | Water Efficiency | |||
| WEc1 | Water Efficient Landscaping | √ | √ | √ |
| WEc3 | Water Use Reduction | √ | ||
| EA | Energy and Atmosphere | |||
| EAc1 | Optimize Energy Performance | √ | √ | √ |
| EAc6 | Green Power | √ | √ | √ |
| MR | Materials and Resources | |||
| MRc5 | Regional Materials | √ | √ | √ |
| IEQ | Indoor Environmental Quality | |||
| IEQc1 | Outdoor Air Delivery Monitoring | √ | √ | √ |
| IEQc2 | Increased Ventilation | √ | √ | √ |
| IEQc3.1 | Construction Indoor Air Quality Management Plan during Construction | √ | √ | √ |
| IEQc4.1 | Low-Emitting Materials—Adhesives and Sealants | √ | ||
| IEQc4.2 | Low-Emitting Materials—Paints and Coatings | √ | ||
| IEQc4.3 | Low-Emitting Materials—Flooring Systems | √ | √ | √ |
| IEQc4.4 | Low-Emitting Materials—Composite Wood and Agrifiber Products | √ | ||
| IEQc5 | Indoor Chemical and Pollutant Source Control | √ | √ | √ |
| IEQc6.2 | Controllability of Systems—Thermal Comfort | √ | √ | √ |
| IEQc7.1 | Thermal Comfort—Design | √ | √ | √ |
| IEQc7.2 | Thermal Comfort—Verification | √ | √ | √ |
Table 2.
Regional priority points in LEED 2009.
| Countries | Priority Points |
|---|---|
| United States | Depending on the states and zip codes |
| China | EAc1; EAc3; EAc5; SSc6.1; WEc1; WEc2 |
| Turkey | EAc1; EAc2; IEQc7.2; MRc1.2, SSc6.1; SSc7.2 |
| Brazil | EAc2; MRc2; MRc7; SSc6.1; WEc2; WEc3 |
Note: EAc1—Optimize energy performance; EAc2—On-site renewable energy; EAc3—Enhanced commissioning; EAc5—Measurement and verification; IEQc7.2—Thermal comfort-verification; WEc1—Water efficient landscaping; WEc2—Innovative wastewater technologies; WEc3—Water use reduction; MRc1.2—Building reuse—maintain interior non-structural elements; MRc2—Construction waste management; MRc7—Certified wood; SSc6.1—Stormwater design—quantity control; SSc7.2—Heat island effect—roof.
Table 3.
Shapiro-Wilk test result of the data set.
| LEED 2009 Main Assessment Categories | Shapiro-Wilk Test | |
|---|---|---|
| df | Sig. | |
| Sustainable sites | 4021 | 0.000 |
| Water efficiency | 4021 | 0.000 |
| Energy and atmosphere | 4021 | 0.000 |
| Material and resources | 4021 | 0.000 |
| Indoor environmental quality | 4021 | 0.000 |
| Innovation in design | 4021 | 0.000 |
| Regional priority credits | 4021 | 0.000 |
Table 4.
The statistical data analysis methods used for country comparison.
| Data Analysis Method | Software | Objectives in This Study |
|---|---|---|
| Shapiro-Wilk test | SPSS | To test the normality of the data so that appropriate follow-up analysis methods can be selected |
| Kruskal-Wallis one-way analysis of variance | SPSS | To test whether the mean credits of different countries are equal |
| Dunn’s test | SPSS | If there are significant differences found in the Kruskal-Wallis test, Dunn’s test can help identify where the significant differences are |
| Mann Whitney U test | SPSS | To test whether the mean credits of two different countries are equal |
| Generalized additive model (GAM) | R | To identify the most important predictors in LEED rating in the four countries |
Table 5.
Number of LEED 2009 certified project characterised by certification level.
| Certification Level | Countries | |||
|---|---|---|---|---|
| US | China | Turkey | Brazil | |
| Certified | 778 (21.0%) | 22 (11.8%) | 8 (9.3%) | 21 (28.0%) |
| Silver | 1511 (40.9%) | 51 (30.0%) | 15 (17.4%) | 30 (40.0%) |
| Gold | 1184 (32.1%) | 89 (52.4%) | 56 (65.1%) | 21 (28.0%) |
| Platinum | 221 (6.0%) | 10 (5.8%) | 7 (8.2%) | 3 (4.0%) |
| Total | 3694 (100.0%) | 172 (100.0%) | 86 (100.0%) | 75 (100.0%) |
Table 6.
Mean credit achievement of LEED 2009 certified projects characterised by country.
| LEED Credits | Mean, SD and CV | Countries | Asymp. Sig. | |||
|---|---|---|---|---|---|---|
| US | China | Turkey | Brazil | |||
| SS (26 credits) | Mean | 15.36 | 18.74 | 18.88 | 16.12 | 0.000 |
| SD | 5.014 | 3.208 | 3.077 | 4.493 | ||
| CV | 0.33 | 0.17 | 0.16 | 0.28 | ||
| WE (10 credits) | Mean | 5.67 | 8.13 | 7.63 | 8.59 | 0.000 |
| SD | 2.182 | 2.048 | 2.440 | 2.080 | ||
| CV | 0.38 | 0.25 | 0.32 | 0.24 | ||
| EA (35 credits) | Mean | 14.06 | 11.88 | 14.33 | 10.48 | 0.000 |
| SD | 7.446 | 6.535 | 6.348 | 7.608 | ||
| CV | 0.53 | 0.55 | 0.44 | 0.73 | ||
| MR (14 credits) | Mean | 5.48 | 5.43 | 5.51 | 5.32 | 0.899 |
| SD | 1.828 | 1.375 | 1.344 | 1.772 | ||
| CV | 0.33 | 0.25 | 0.24 | 0.33 | ||
| IEQ (15 credits) | Mean | 9.04 | 8.29 | 7.88 | 5.16 | 0.000 |
| SD | 2.271 | 2.325 | 2.681 | 1.809 | ||
| CV | 0.25 | 0.28 | 0.34 | 0.35 | ||
| ID (6 credits) | Mean | 3.99 | 4.30 | 4.58 | 5.09 | 0.000 |
| SD | 1.533 | 1.103 | 1.183 | 0.841 | ||
| CV | 0.38 | 0.26 | 0.26 | 0.17 | ||
| Total (110 credits) | Mean | 56.02 | 60.42 | 62.23 | 54.44 | 0.000 |
| SD | 10.445 | 9.306 | 10.392 | 9.473 | ||
| CV | 0.19 | 0.15 | 0.17 | 0.17 | ||
Table 7.
Mean credit achievement of LEED 2009 certified projects characterised by regionally specific credits.
Table 7.
Mean credit achievement of LEED 2009 certified projects characterised by regionally specific credits.
| LEED Credits | Max Points | Mean and SD | Countries | Asymp. Sig. | |||
|---|---|---|---|---|---|---|---|
| US | China | Turkey | Brazil | ||||
| SSc1 | 1 | Mean | 0.87 | 0.93 | 0.86 | 0.79 | 0.019 |
| SD | 0.336 | 0.257 | 0.349 | 0.412 | |||
| SSc3 | 1 | Mean | 0.22 | 0.01 | 0.00 | 0.01 | 0.000 |
| SD | 0.411 | 0.077 | 0.000 | 0.115 | |||
| SSc4.1 | 6 | Mean | 3.51 | 5.89 | 5.93 | 4.88 | 0.000 |
| SD | 2.957 | 0.792 | 0.647 | 2.354 | |||
| SSc4.3 | 3 | Mean | 2.35 | 2.86 | 2.83 | 2.68 | 0.000 |
| SD | 1.234 | 0.637 | 0.706 | 0.932 | |||
| SSc6.1 | 1 | Mean | 0.43 | 0.31 | 0.49 | 0.35 | 0.005 |
| SD | 0.496 | 0.465 | 0.503 | 0.479 | |||
| WEc1 | 4 | Mean | 2.78 | 3.54 | 2.65 | 3.07 | 0.000 |
| SD | 1.447 | 0.871 | 1.517 | 1.446 | |||
| WEc3 | 4 | Mean | 2.72 | 3.38 | 3.26 | 3.76 | 0.000 |
| SD | 1.355 | 1.114 | 1.200 | 0.852 | |||
| EAc1 | 19 | Mean | 8.94 | 6.23 | 8.24 | 5.33 | 0.000 |
| SD | 5.484 | 4.736 | 4.650 | 5.363 | |||
| EAc6 | 2 | Mean | 0.90 | 0.15 | 0.26 | 0.51 | 0.000 |
| SD | 0.995 | 0.533 | 0.672 | 0.876 | |||
| MRc5 | 2 | Mean | 1.43 | 1.85 | 1.76 | 1.75 | 0.000 |
| SD | 0.773 | 0.506 | 0.650 | 0.572 | |||
| IEQc1 | 1 | Mean | 0.45 | 0.47 | 0.31 | 0.09 | 0.000 |
| SD | 0.498 | 0.501 | 0.467 | 0.293 | |||
| IEQc2 | 1 | Mean | 0.33 | 0.79 | 0.63 | 0.59 | 0.000 |
| SD | 0.471 | 0.406 | 0.486 | 0.496 | |||
| IEQc3.1 | 1 | Mean | 0.93 | 0.94 | 0.92 | 0.93 | 0.966 |
| SD | 0.252 | 0.247 | 0.275 | 0.251 | |||
| IEQc4.1 | 1 | Mean | 0.91 | 0.79 | 0.67 | 0.77 | 0.000 |
| SD | 0.285 | 0.406 | 0.471 | 0.421 | |||
| IEQc4.2 | 1 | Mean | 0.96 | 0.95 | 0.86 | 0.87 | 0.000 |
| SD | 0.191 | 0.212 | 0.349 | 0.342 | |||
| IEQc4.3 | 1 | Mean | 0.88 | 0.31 | 0.24 | 0.32 | 0.000 |
| SD | 0.321 | 0.465 | 0.432 | 0.470 | |||
| IEQc4.4 | 1 | Mean | 0.69 | 0.12 | 0.03 | 0.07 | 0.000 |
| SD | 0.462 | 0.330 | 0.185 | 0.251 | |||
| IEQc5 | 1 | Mean | 0.41 | 0.31 | 0.56 | 0.01 | 0.000 |
| SD | 0.492 | 0.465 | 0.500 | 0.115 | |||
| IEQc6.2 | 1 | Mean | 0.42 | 0.17 | 0.47 | 0.09 | 0.000 |
| SD | 0.493 | 0.377 | 0.502 | 0.293 | |||
| IEQc7.1 | 1 | Mean | 0.82 | 0.79 | 0.71 | 0.44 | 0.000 |
| SD | 0.387 | 0.406 | 0.457 | 0.500 | |||
| IEQc7.2 | 1 | Mean | 0.59 | 0.76 | 0.58 | 0.40 | 0.000 |
| SD | 0.492 | 0.429 | 0.496 | 0.493 | |||
Table 8.
Deviance explained by each predictor in the nonparametric regression model.
| Ranking | Deviance Explained (US) | Deviance Explained (China) | Deviance Explained (Turkey) | Deviance Explained (Brazil) |
|---|---|---|---|---|
| 1. EA | 55.48% | 63.52% | 70.56% | 71.86% |
| 2. SS | 26.19% | 16.96% | 12.13% | 15.37% |
| 3. IEQ | 5.68% | 7.52% | 7.87% | 6.06% |
| 4. WE | 5.16% | 6.24% | 5.39% | 3.46% |
| 5. MR | 3.61% | 3.04% | 2.25% | 2.38% |
| 6. ID | 2.45% | 1.76% | 1.35% | 0.43% |
| 7. RP | 1.42% | 0.96% | 0.45% | 0.43% |
Table 9.
Post hoc analysis results of the LEED 2009 certified projects on regionally specific credits.
Table 9.
Post hoc analysis results of the LEED 2009 certified projects on regionally specific credits.
| LEED Credits | Asymptotic Significances (2-Sided Test) | |||||
|---|---|---|---|---|---|---|
| US-China | US-Turkey | US-Brazil | China-Turkey | China-Brazil | Turkey-Brazil | |
| SSc1 | 0.154 | 1.000 | 0.190 | 0.722 | 0.013 * | 0.982 |
| SSc3 | 0.000 * | 0.000 * | 0.000 * | 1.000 | 1.000 | 1.000 |
| SSc4.1 | 0.000 * | 0.000 * | 0.000 * | 1.000 | 0.074 | 0.137 |
| SSc4.3 | 0.000 * | 0.002 * | 0.121 | 1.000 | 1.000 | 1.000 |
| SSc6.1 | 0.013 * | 1.000 | 0.878 | 0.042 * | 1.000 | 0.419 |
| WEc1 | 0.000 * | 1.000 | 0.279 | 0.000 * | 0.200 | 0.282 |
| WEc3 | 0.000 * | 0.000 * | 0.000 * | 1.000 | 0.046 * | 0.017 * |
| EAc1 | 0.000 * | 1.000 | 0.000 * | 0.008 * | 1.000 | 0.001 * |
| EAc6 | 0.000 * | 0.000 * | 0.004 * | 1.000 | 0.059 | 0.649 |
| MRc5 | 0.000 * | 0.000 * | 0.002 * | 1.000 | 1.000 | 1.000 |
| IEQc1 | 1.000 | 0.069 | 0.000 * | 0.103 | 0.000 * | 0.000 * |
| IEQc2 | 0.000 * | 0.000 * | 0.000 * | 0.054 | 0.011 * | 1.000 |
| IEQc4.1 | 0.000 * | 0.000 * | 0.001 * | 0.017 * | 1.000 | 0.231 |
| IEQc4.2 | 1.000 | 0.000 * | 0.000 * | 0.003 * | 0.012 * | 1.000 |
| IEQc4.3 | 0.000 * | 0.000 * | 0.000 * | 1.000 | 1.000 | 1.000 |
| IEQc4.4 | 0.000 * | 0.000 * | 0.000 * | 0.974 | 1.000 | 1.000 |
| IEQc5 | 0.050 | 0.041 * | 0.000 * | 0.001 * | 0.000 * | 0.000 * |
| IEQc6.2 | 0.000 * | 1.000 | 0.000 * | 0.000 * | 1.000 | 0.000 * |
| IEQc7.1 | 1.000 | 0.076 | 0.000 * | 0.628 | 0.000 * | 0.000 * |
| IEQc7.2 | 0.000 * | 1.000 | 0.006 * | 0.038 * | 0.000 * | 0.117 |
* Indicates there is a significant difference between the pair.
Table 10.
Credit achievement pattern of the Regional Priority (RP) credits in China.
| RP Points | Description | No. of Cases | Frequency |
|---|---|---|---|
| WEc1 | Water efficient landscaping | 156 | 91.8% |
| EAc1 | Optimize energy performance | 123 | 72.4% |
| WEc2 | Innovative wastewater technologies | 95 | 55.9% |
| EAc5 | Measurement and verification | 71 | 41.8% |
| EAc3 | Enhanced commissioning | 50 | 29.4% |
| SSc6.1 | Stormwater design—quantity control | 11 | 6.5% |
Table 11.
Credit achievement pattern of the RP credits in Turkey.
| RP Points | Description | No. of Cases | Frequency |
|---|---|---|---|
| SSc7.2 | Heat island effect—roof | 36 | 41.9% |
| IEQc7.2 | Thermal comfort—verification | 25 | 29.1% |
| SSc6.1 | Stormwater design—quantity control | 19 | 22.1% |
| EAc2 | On-site renewable energy | 16 | 18.6% |
| MRc2 | Construction waste management | 1 | 1.2% |
| MRc1.2 | Building reuse—maintain interior non-structural elements | 0 | 0.0% |
Table 12.
Credit achievement pattern of the RP credits in Brazil.
| RP Points | Description | No. of Cases | Frequency |
|---|---|---|---|
| WEc3 | Water use reduction | 66 | 88.0% |
| WEc2 | Innovative wastewater technologies | 63 | 84.0% |
| MRc2 | Construction waste management | 25 | 33.3% |
| MRc7 | Certified wood | 14 | 18.7% |
| EAc2 | On-site renewable energy | 1 | 1.3% |
| SSc6.1 | Stormwater design—quantity control | 1 | 1.3% |
© 2017 by the authors. Licensee MDPI, Basel, Switzerland. This article is an open access article distributed under the terms and conditions of the Creative Commons Attribution (CC BY) license (http://creativecommons.org/licenses/by/4.0/).
Share and Cite
MDPI and ACS Style
Wu, P.; Song, Y.; Wang, J.; Wang, X.; Zhao, X.; He, Q. Regional Variations of Credits Obtained by LEED 2009 Certified Green Buildings—A Country Level Analysis. Sustainability 2018, 10, 20. https://doi.org/10.3390/su10010020
AMA Style
Wu P, Song Y, Wang J, Wang X, Zhao X, He Q. Regional Variations of Credits Obtained by LEED 2009 Certified Green Buildings—A Country Level Analysis. Sustainability. 2018; 10(1):20. https://doi.org/10.3390/su10010020
Chicago/Turabian StyleWu, Peng, Yongze Song, Jun Wang, Xiangyu Wang, Xianbo Zhao, and Qinghua He. 2018. "Regional Variations of Credits Obtained by LEED 2009 Certified Green Buildings—A Country Level Analysis" Sustainability 10, no. 1: 20. https://doi.org/10.3390/su10010020
Note that from the first issue of 2016, this journal uses article numbers instead of page numbers. See further details here.