Article

Evaluating the Comprehensive Benefit of Group-Affiliated New Energy Power Generation Enterprises for Sustainability: Based on a Combined Technique of STBI and TOPSIS

School of Economics and Management, North China Electric Power University, Beijing 102206, China
*
Author to whom correspondence should be addressed.
Sustainability 2018, 10(1), 24; https://doi.org/10.3390/su10010024
Submission received: 29 November 2017 / Revised: 19 December 2017 / Accepted: 19 December 2017 / Published: 22 December 2017
(This article belongs to the Section Energy Sustainability)

Abstract

:
As an efficient way to deal with the exhaustion of traditional fossil fuels, new energy power generation has obtained much attention from the Chinese Government. In this context, more and more new energy power generation groups that consist of large numbers of regional enterprises have been founded and developed rapidly. However, researches related to comprehensive benefit evaluation of group-affiliated new energy power generation enterprises is still blank in China, which will hinder the benefit growth and sustainable development of such enterprises. A novel hybrid evaluation indicator system is proposed from both perspectives of sustainability and the internal management within the groups. Considering the preference information given on each of the indicators is featured by multi-source and multi-form, an evaluation framework to integrate the blended and complex evaluation information is designed. In addition, different from previous studies, this paper employs a combined technique of Stochastic Transformation for Blended Information (STBI) method and the Technique for Order Preference by Similar to Ideal Solution (TOPSIS) to simulate the evaluation process and rank the comprehensive benefit of evaluation objects. It can efficiently handle the comprehensive evaluation problems with blended and complex evaluation information and preserve the initial evaluation information to the utmost simultaneously. Finally, this paper applied the evaluation model to empirical research and the results show that the model meets the actual situation of the new energy power generation group and can provide a certain reference value.

1. Introduction

Along with the increasing depletion of fossil fuels and deterioration of environmental pollution, the new energy industry has become strategic measures for improving energy structure, alleviating energy supply pressure, ensuring energy supply safety, reducing environmental pollution and achieving sustainable development in China [1]. Therefore, since the 21st century, the Chinese government has introduced a series of plans and policies to stimulate the development of new energy industry. Under the guidance of national policies, new energy power generation industry including wind power, solar power and other new energy power generation, has been developing rapidly, especially during the “Twelfth Five-Year Plan” period (Table 1) [2,3]. By the end of 2015, China’s total installed capacity of wind power and solar power has reached over 170 GW, ranking first in the world. Accompanied by the gradually increasing installed wind capacity, wind power has become the third most dominant form of power—after thermal power and hydropower—with an annual generation of 185,100 GWh [4]. Under such a strategic energy developing situation that new energy being massively exploited, more and more new energy power generation enterprises have made heavy investments in projects construction. With the gradual enlargement of scale, many of them have developed into large groups of new energy power generation enterprises.
Past few years have witnessed a dramatic increase in energy supply. Currently, the pressure of energy supply has overall eased in China, which leads to a shift of emphasis of energy development from supply insurance to benefit growth [2,3]. In 2016, the “Thirteenth Five-Year Plan for Energy Development” and the “Thirteenth Five-Year Plan for Renewable Energy Development” were promulgated to make clear that the barycenter of energy development has been transferred from ensuring the abundant supply of energy to promoting the quality and benefit of energy. In this context, China’s new energy power generation industry is ushering in a maturation developing stage when the quality of sustainable development is more concerned about than it is in the early developing stage when resource preemption, scale expansion and the accumulation of installed capacity were paid close attention to. In order to accommodate to this shift, for new energy power generation groups, it is essential to establish a framework that can comprehensively evaluate the quality and benefit of their affiliated new energy power generation enterprises, which can help the parent company identify the benefit level of each affiliated enterprise and then improve their benefit by taking appropriate measures.
A new energy power generation group is a large corporation composed of a set of distributed new energy power generation enterprises, in which the parent company implements various management strategies to increase the comprehensive benefit of the affiliated enterprises, including their production safety, costs control, technical innovation, market competitiveness, talent management, etc. by means of functional management through its functional departments [5,6]. The common organizational structure of a new energy power generation group is displayed in Figure 1. As shown in the figure, each department performs differentiated functional management on the affiliated enterprises, according to its own duties and specialization of work. For example, the production management department of the parent company works on improving generating capacity of the affiliated enterprises by managing their production plans, supervising the compliance of their manufacturing facilities management and the normalization of their technical documents; the human resource management department aims at improving working skills and all-around abilities of the staff in the affiliated enterprises so that the labor productivity can be raised. Accordingly, from the perspective of the parent-subsidiary management system, how to manage and evaluate the benefit of the affiliated enterprises has become a main issue for new energy power generation groups. Since the functional department from the parent company is the subject of benefit management of the affiliated enterprises, the benefit evaluation subject of the affiliated enterprises should be them as well [7]. However, due to the otherness of management characteristics owned by each functional department according to their duties, for example, the production management department focuses on the quantitative production data of the affiliated enterprises while the human resources care more about the qualitative data of their talent quality, the different forms of evaluation data have to be considered during the benefit evaluation process. Generally, owning to the differences of evaluation indicators’ properties and the diverse sources of evaluation subjects, the evaluation data often appear in diversified forms such as real number (RN) [8,9], linguistic information (LI) [10,11,12], triangular fuzzy number (TFN) [13,14,15], ordinal number (ON) [16], interval number (IN) [17,18] and so on, which means the integration of evaluation information of multi-source and multi-form must be considered.
Considering that the comprehensive benefit evaluation of group-affiliated new energy power generation enterprises includes different aspects, a comprehensive evaluation model is employed to evaluate the comprehensive benefit of all the evaluation objects. Technique for Order Preference by Similarity to Ideal Solution (TOPSIS) is a compensatory aggregation MCDM method that has been used to appraise performance in many fields. This model has a simple and logical computation process and it is able to consider the distance both from positive ideal and negative ideal solutions. Besides, due to the complexity of the blended evaluation data with multi-source and multi-form in practice, the stochastic transformation for blended information (STBI) is introduced to simulate the evaluation process. Therefore, a combined technique of TOPSIS and STBI will be employed to evaluate the comprehensive benefit of group-affiliated new energy power generation enterprises.
The remainder of this paper is organized as follows: a brief review of the literature related to new energy power generation in terms of evaluation methods and the main contributions of this study are found in Section 2. The hybrid indicator system for comprehensive evaluation of group-affiliated new energy power generation enterprises and the integrated framework of evaluation information of group-affiliated new energy power generation enterprises are built in Section 3 and Section 4, respectively. In Section 5, the basic principle and methods of the evaluation model based on TOPSIS and STBI are elaborated. An empirical study of the Huaneng Renewables Group in China is described in Section 6. Results are discussed in Section 7 and Conclusions are drawn in Section 8.

2. Literature Review

Currently, there have been more studies of the evaluation focused on one single perspective of the benefits of new energy power generation, such as economic evaluation [19,20], environment evaluation [21] or social benefit evaluation [22,23] both at home and abroad. With the deepening of the research, many scholars argued that it is necessary to construct the evaluation indicator system from multiple perspectives of economic benefits, social benefits, environmental benefits and so on [24,25]. However, it can be seen that the existing researches are generally conducted from an external perspective and few of them have looked into this issue from the perspective of internal management within a new energy power generation group. How to evaluate the comprehensive benefit of group-affiliated new energy power generation enterprises still remains to be a problem. Besides, evaluation methods have been extensively studied. The most frequently used methods are analytic hierarchy process(AHP), analytic network process(ANP), Delphi method, the entropy method, grey relational analysis, the factor analysis, principal component analysis(PCA) and the technique for order preference by similar to ideal solution (TOPSIS) [26,27,28,29,30,31,32,33], among which, the former three are subjective methods, which determine the weight coefficient of each indicator by comprehensive consulting score and thus reflect the consultancy to the fullest and the rest are objective methods, which determines the weight of each indicator based on internal relationship and variation degree among indicators. However, through reviewing the related literature, it can be seen that these methods have only been employed to deal with comprehensive evaluation (CE) problems with a single type or certain types of evaluation data, such as linguistic information or real numbers. To the best of our knowledge, the studies related to the comprehensive benefit evaluation of group-affiliated new energy power generation enterprises with blended evaluation information of multi-source and multi-form are quite few. Aiming at problems that blended evaluation information exists in a single CE question, Ref. [34,35,36] proposed a processing method named the stochastic transformation for blended information (STBI), based on which, the blended information is transformed into a uniform form by generating random numbers obeying a certain distribution and then a Monte Carlo simulation technology [37] is used to simulate the ranking results of the evaluation objects by employing a CE method for as many replications as possible to obtain a stable result. STBI method can make the CE no longer limited to single or finite data forms and further expand the practical application range of CE. Meanwhile, TOPSIS method has been used in many fields for not only its simple principle and flexible application but also it can make full use of the existing information and can enhance the objectivity of the evaluation result. However, it is very regrettable to find that the two methods have rarely been employed in the fields of new energy power industry. Therefore, this paper attempts to employ a combined technique of STBI and TOPSIS to evaluate the benefit of group-affiliated new energy power generation enterprises.
The main contributions of this paper are as follows:
(1)
From the literature review, it can be found that current studies are mainly conducted from an external perspective. For all we know, this is the first study that performs the benefit evaluation on group-affiliated new energy power generation enterprises from an internal perspective of group management and control.
(2)
As noted above, benefit evaluation of group-affiliated new energy power generation enterprises requires the consideration of blended evaluation information of multi-source and multi-form. Although the technique for order preference by similar to ideal solution (TOPSIS) has been applied to deal with CE problems in many fields, it is still confined to a single or finite evaluation information form(s), while the stochastic transformation for blended information (STBI) has been proved good performance in such problems. To the best of our knowledge, this is a novel hybrid CE technique combining STBI and TOPSIS for benefit evaluation of group-affiliated new energy power generation enterprises. This attempt upgrades the TOPSIS method with STBI, which can cope with the blended information and additionally, extent the application domain of TOPSIS.
(3)
The basic link of STBI is to generate random numbers characterized by a probability among the numerical intervals corresponding to the original evaluation information, which can preserve the original evaluation information to the utmost and avoid information loss during the transformation. At the same time, TOPSIS can also make full use of the existing information [32]. Therefore, the hybrid technique of STBI and TOPSIS can deal with the CE problems with complex and blended evaluation information efficiently and overcome a major shortcoming of existing approaches that lose or distort the original preference information in the calculating process, which can also be applied to many other fields.

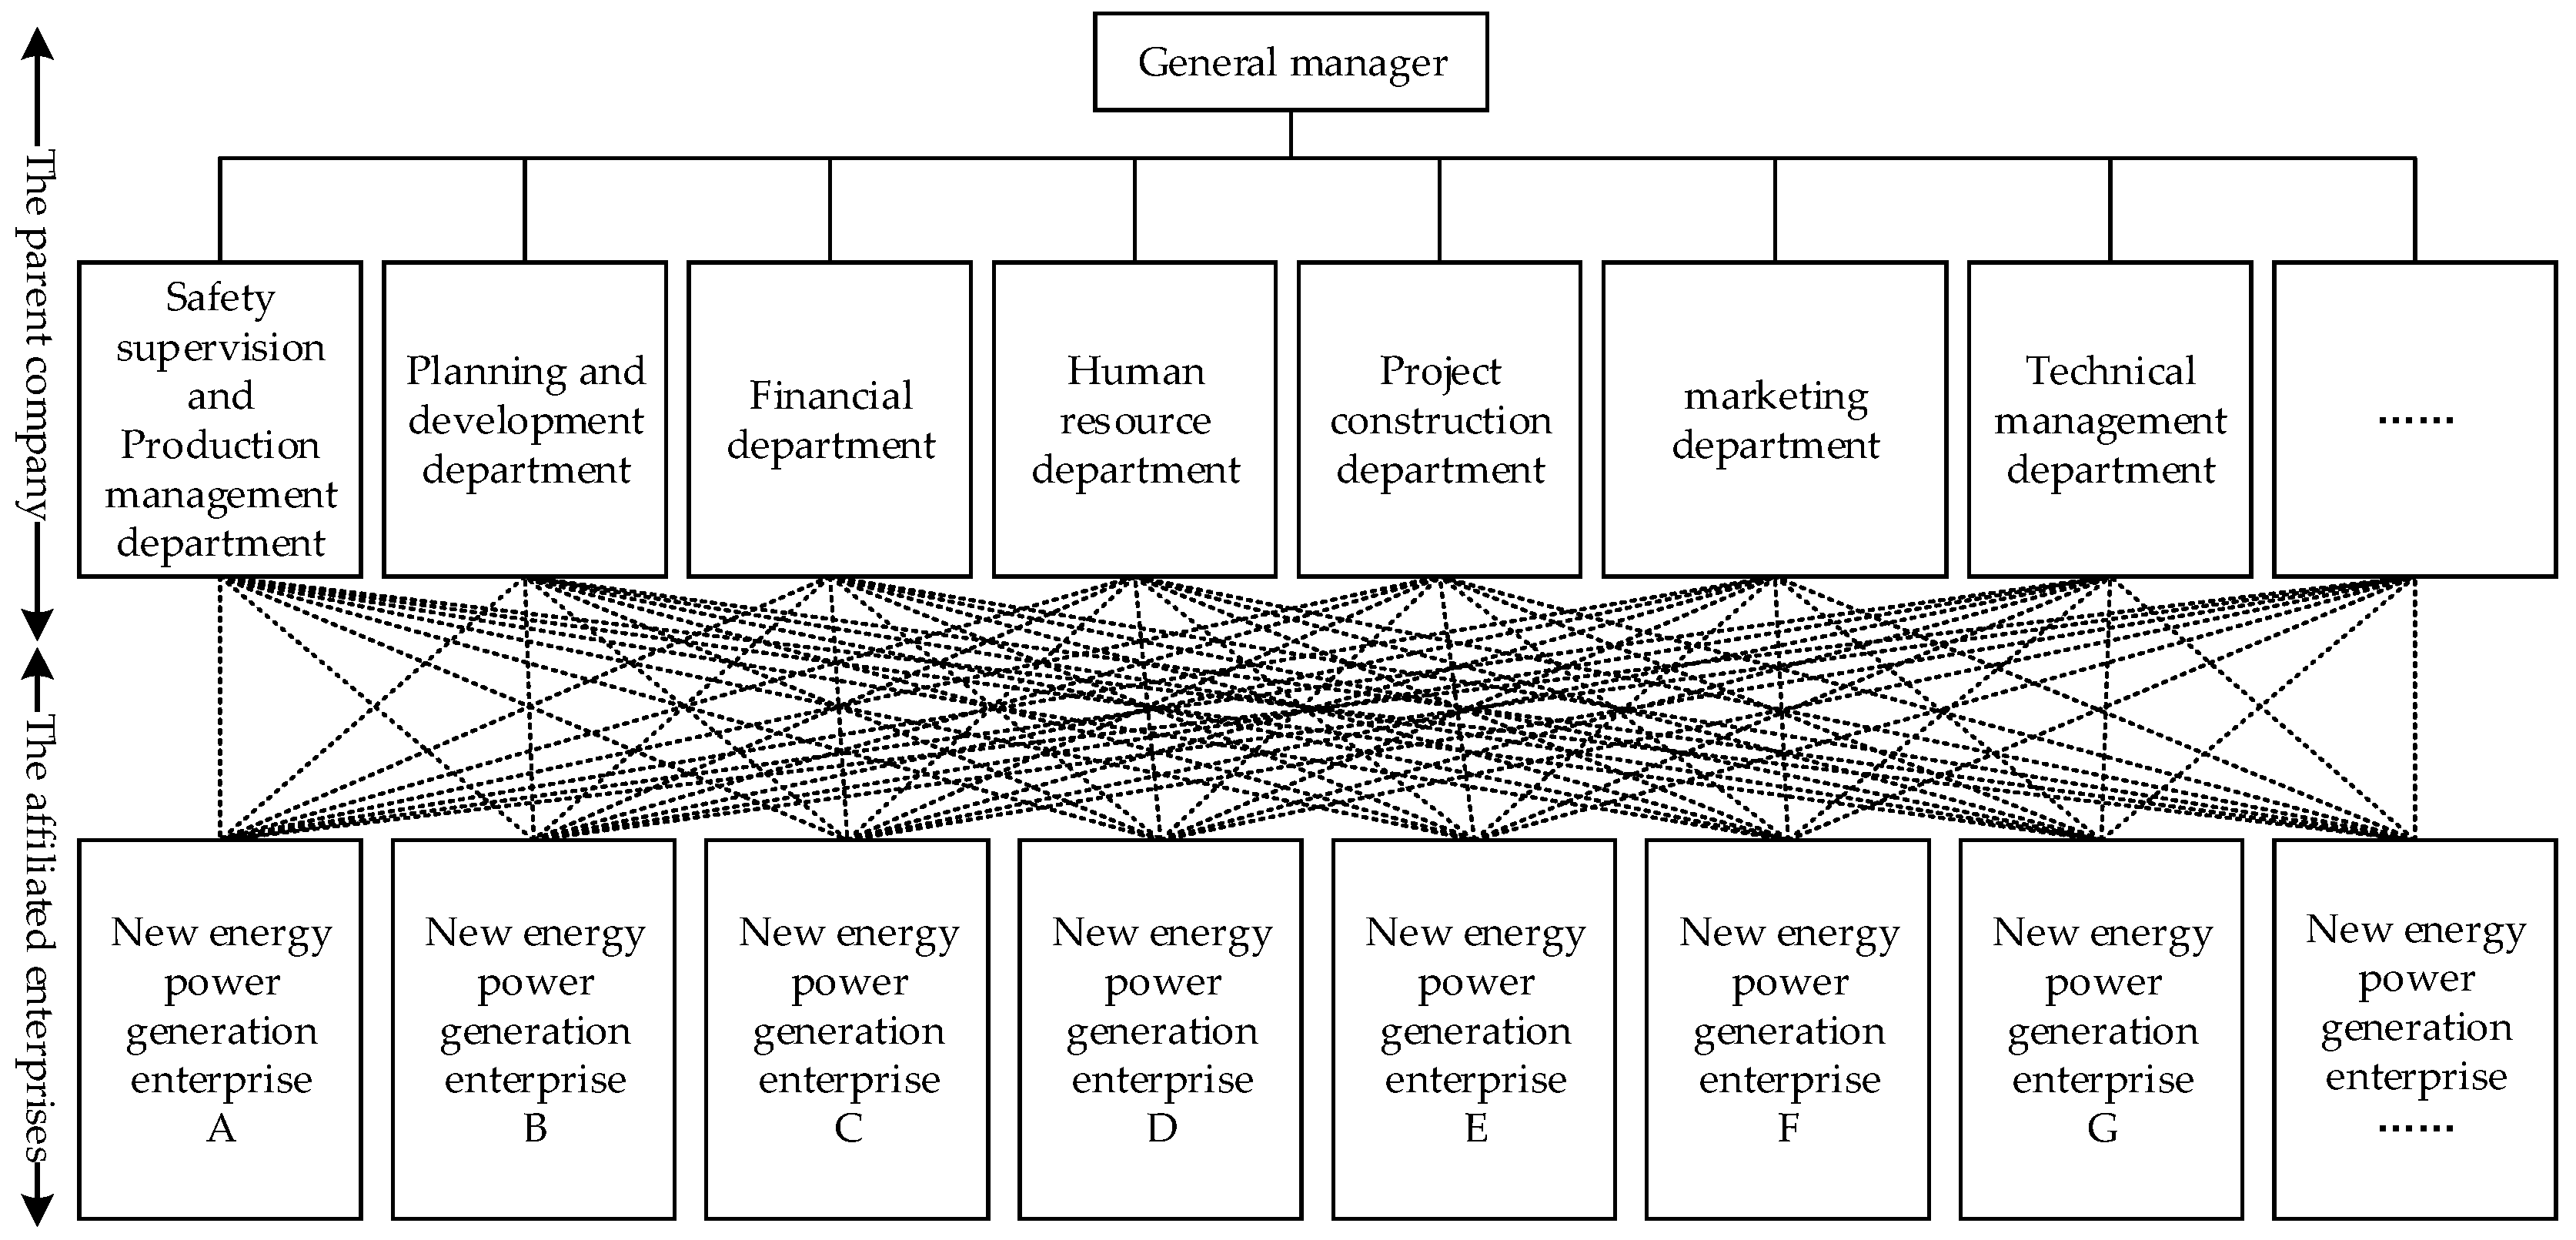
3. Comprehensive Benefit Evaluation Indicator System of Group-Affiliated New Energy Power Generation Enterprises

Evaluation indicators are very important to the comprehensive benefit evaluation of group-affiliated new energy power generation enterprises. It is essential to establish an evaluation indicator system to comprehensively reflect the benefit management characteristics of new energy power generation enterprises owned by a large group. However, current research related to this in China is rare and there is no consistent list of indicators for the benefit evaluation of group-affiliated new energy power generation enterprises. In order to promote the sustainable development of new energy power generation industry, this paper will probe into the evaluation criteria from a sustainable standpoint, which must not only meet the demands of benefit growth of energy during the “Thirteenth Five-Year Plan” period but also satisfy the needs of the corresponding management strategies that new energy power generation groups perform on their affiliated enterprises. Currently, over reliance on the state subsidies has long been holding back the benefit growth of wind power generation and solar power generation enterprises, accordingly, economic benefit should be considered as an essential aspect of the evaluation, as mentioned in the “Thirteenth Five-Year Plan for Energy Development” that “Put more emphasis on economic benefit and enhance the competitiveness of energy and related industries”. As we know, new energy power generation industry is highly technology-intensive and talent-intensive, which requires massive investments in technology innovation, talent training and retaining. Technology innovation and utilization will help to reduce power generation costs and further improve the benefit, which means that technology sustainability should be included in the evaluation. Since the technology sustainability is supported by large numbers of well-trained staff, talent reserve is also taken into account as an important guarantee to the benefit growth. What’s more, curtailment of wind power and solar power and low utilization efficiency of new energy have long been serious problems in China. Therefore, the “Thirteenth Five-Year Plan for Energy Development” has highlighted the developing quality of energy in its main text, indicating that new energy power generation groups must take the operation quality of their affiliated enterprises seriously, such as improving new energy efficiency of these enterprises. As a result, economic benefit, technical sustainability, talent reserve and operation quality are the four key components of the comprehensive benefit evaluation of the group-affiliated new energy power generation enterprises.
Furthermore, in order to meet the actual needs of management and control within new energy power generation groups, the sub-criteria affiliated with above four aspects are determined by an expert group composed of 36 executives and functional departments managers of the parent companies from four new energy power generation groups, according to the following process: First, all experts review the academic literature related to the comprehensive benefit of new energy or new energy power generation including economy, technology, talent and operation [19,20,21,22,23,38,39,40,41,42] that is selected and provided by our research group, the first half of which is the most recent studies while the other half is the most cited studies with each of them being cited for more than 100 times; then an initial indicator system is built. Second, questionnaires are designed to seek the opinions of each expert repeatedly based on the Delphi method [29]. Third, the indicators are identified after analyzing the results of questionnaires and checking the consistency of opinions. Finally, the evaluation subject of each indicator based on the duties of functional departments generally set up in the parent companies of new energy power generation groups and their preferred forms of evaluation data are discussed by the expert group. The comprehensive benefit evaluation indicator system of group-affiliated new energy power generation enterprises is displayed in Figure 2.

3.1. Economic Benefit

For economic benefit, four indicators that can directly reflect the economic benefit of the affiliated new energy power generation enterprises are chosen.
(1)
Power generation capacity (X11): refers to annual total generation capacity of an affiliated enterprise. Owning to different regional governments subsidies, all affiliated enterprises may differ greatly in feed-in tariffs from one to another. Therefore, this indicator can reflect the prime operating revenue of the affiliated enterprises more accurately than the prime operating revenue itself, which is the basis of source of income for the new energy power generation enterprises.
(2)
Growth rate of power generation capacity (X12): refers to the year-on-year growth rate of power generation capacity for each affiliated enterprise, which can not only reflect the progressing speed of their main business (i.e. new energy power generation) but also be a predictor of the sustainable development ability of economic benefit of each affiliated enterprise.
(3)
Total profit (X13): is a comprehensive economic indicator to evaluate the economic benefit of each affiliated enterprise, which can represent the operating result of the affiliated enterprises within an accounting year.
(4)
Growth rate of total profit (X14): refers to the year-on-year growth rate of total profit made by each affiliated enterprise. This indicator is also a measure of development speed and ability of the affiliated enterprise but more in an economic way.

3.2. Operation Quality

The final four indicators affiliated with operation quality for the comprehensive benefit evaluation of group-affiliated new energy power generation enterprises are summarized below.
(1)
Cost control (X21): refers to the ability of an affiliated enterprise to cut down its overall costs including newly-built projects costs, production costs, operational maintenance costs, administrative costs, labor costs and so on, by comprehensive budget management, bidding and tendering management, internal control and risk management, etc. This indicator is a comprehensive indicator of total operation management quality of each affiliated enterprise.
(2)
Growth rate of installed capacity (X22): measures the sustainability of power production capacity of the affiliated enterprises through a series of measures covering production, operation and management that can improve the efficiency for the existing capacity.
(3)
Power utilization hours (X23): measures both energy utilization efficiency and market competitiveness of the affiliated enterprises. This indicator is aimed at encouraging all the affiliated enterprises to optimize their marketing mechanism and strengthening marketing transactions under new circumstances of supply-side structural reform.
(4)
Production safety (X24): refers to the level of safety production and safety production management of the affiliated enterprises. As we know, safety production is the first priority for power generation enterprises and incalculable damage may be done once safety accidents happen.

3.3. Technical Sustainability

The following two indicators affiliated with technical sustainability are summarized below.
(1)
Technology innovation investment (X31): refers to manpower, financial and material resources that the affiliated enterprises spend on technical research and development.
(2)
Application of advanced technology (X32): refers to the applications of advanced new energy generation equipment and technologies, which can help the affiliated enterprises improve the comprehensive utilization efficiency of new energies and lower the generation costs.

3.4. Talent Reserve

The affiliated new energy generation enterprises need to carry out effective talent management to implement production, operation, management and technical innovation, which means a sustainable talent pool should be constructed.
(1)
Talent introduction and training (X41): refers to the work quality of the affiliated enterprises in the introduction of managers and technical experts and the training for vocational skills and management expertise to fully exploit the staff’s talents.
(2)
Talent equivalent density (X42): is a comprehensive indicator that indicates the academic qualifications, professional titles and skill levels of the total staff in each affiliated enterprise.

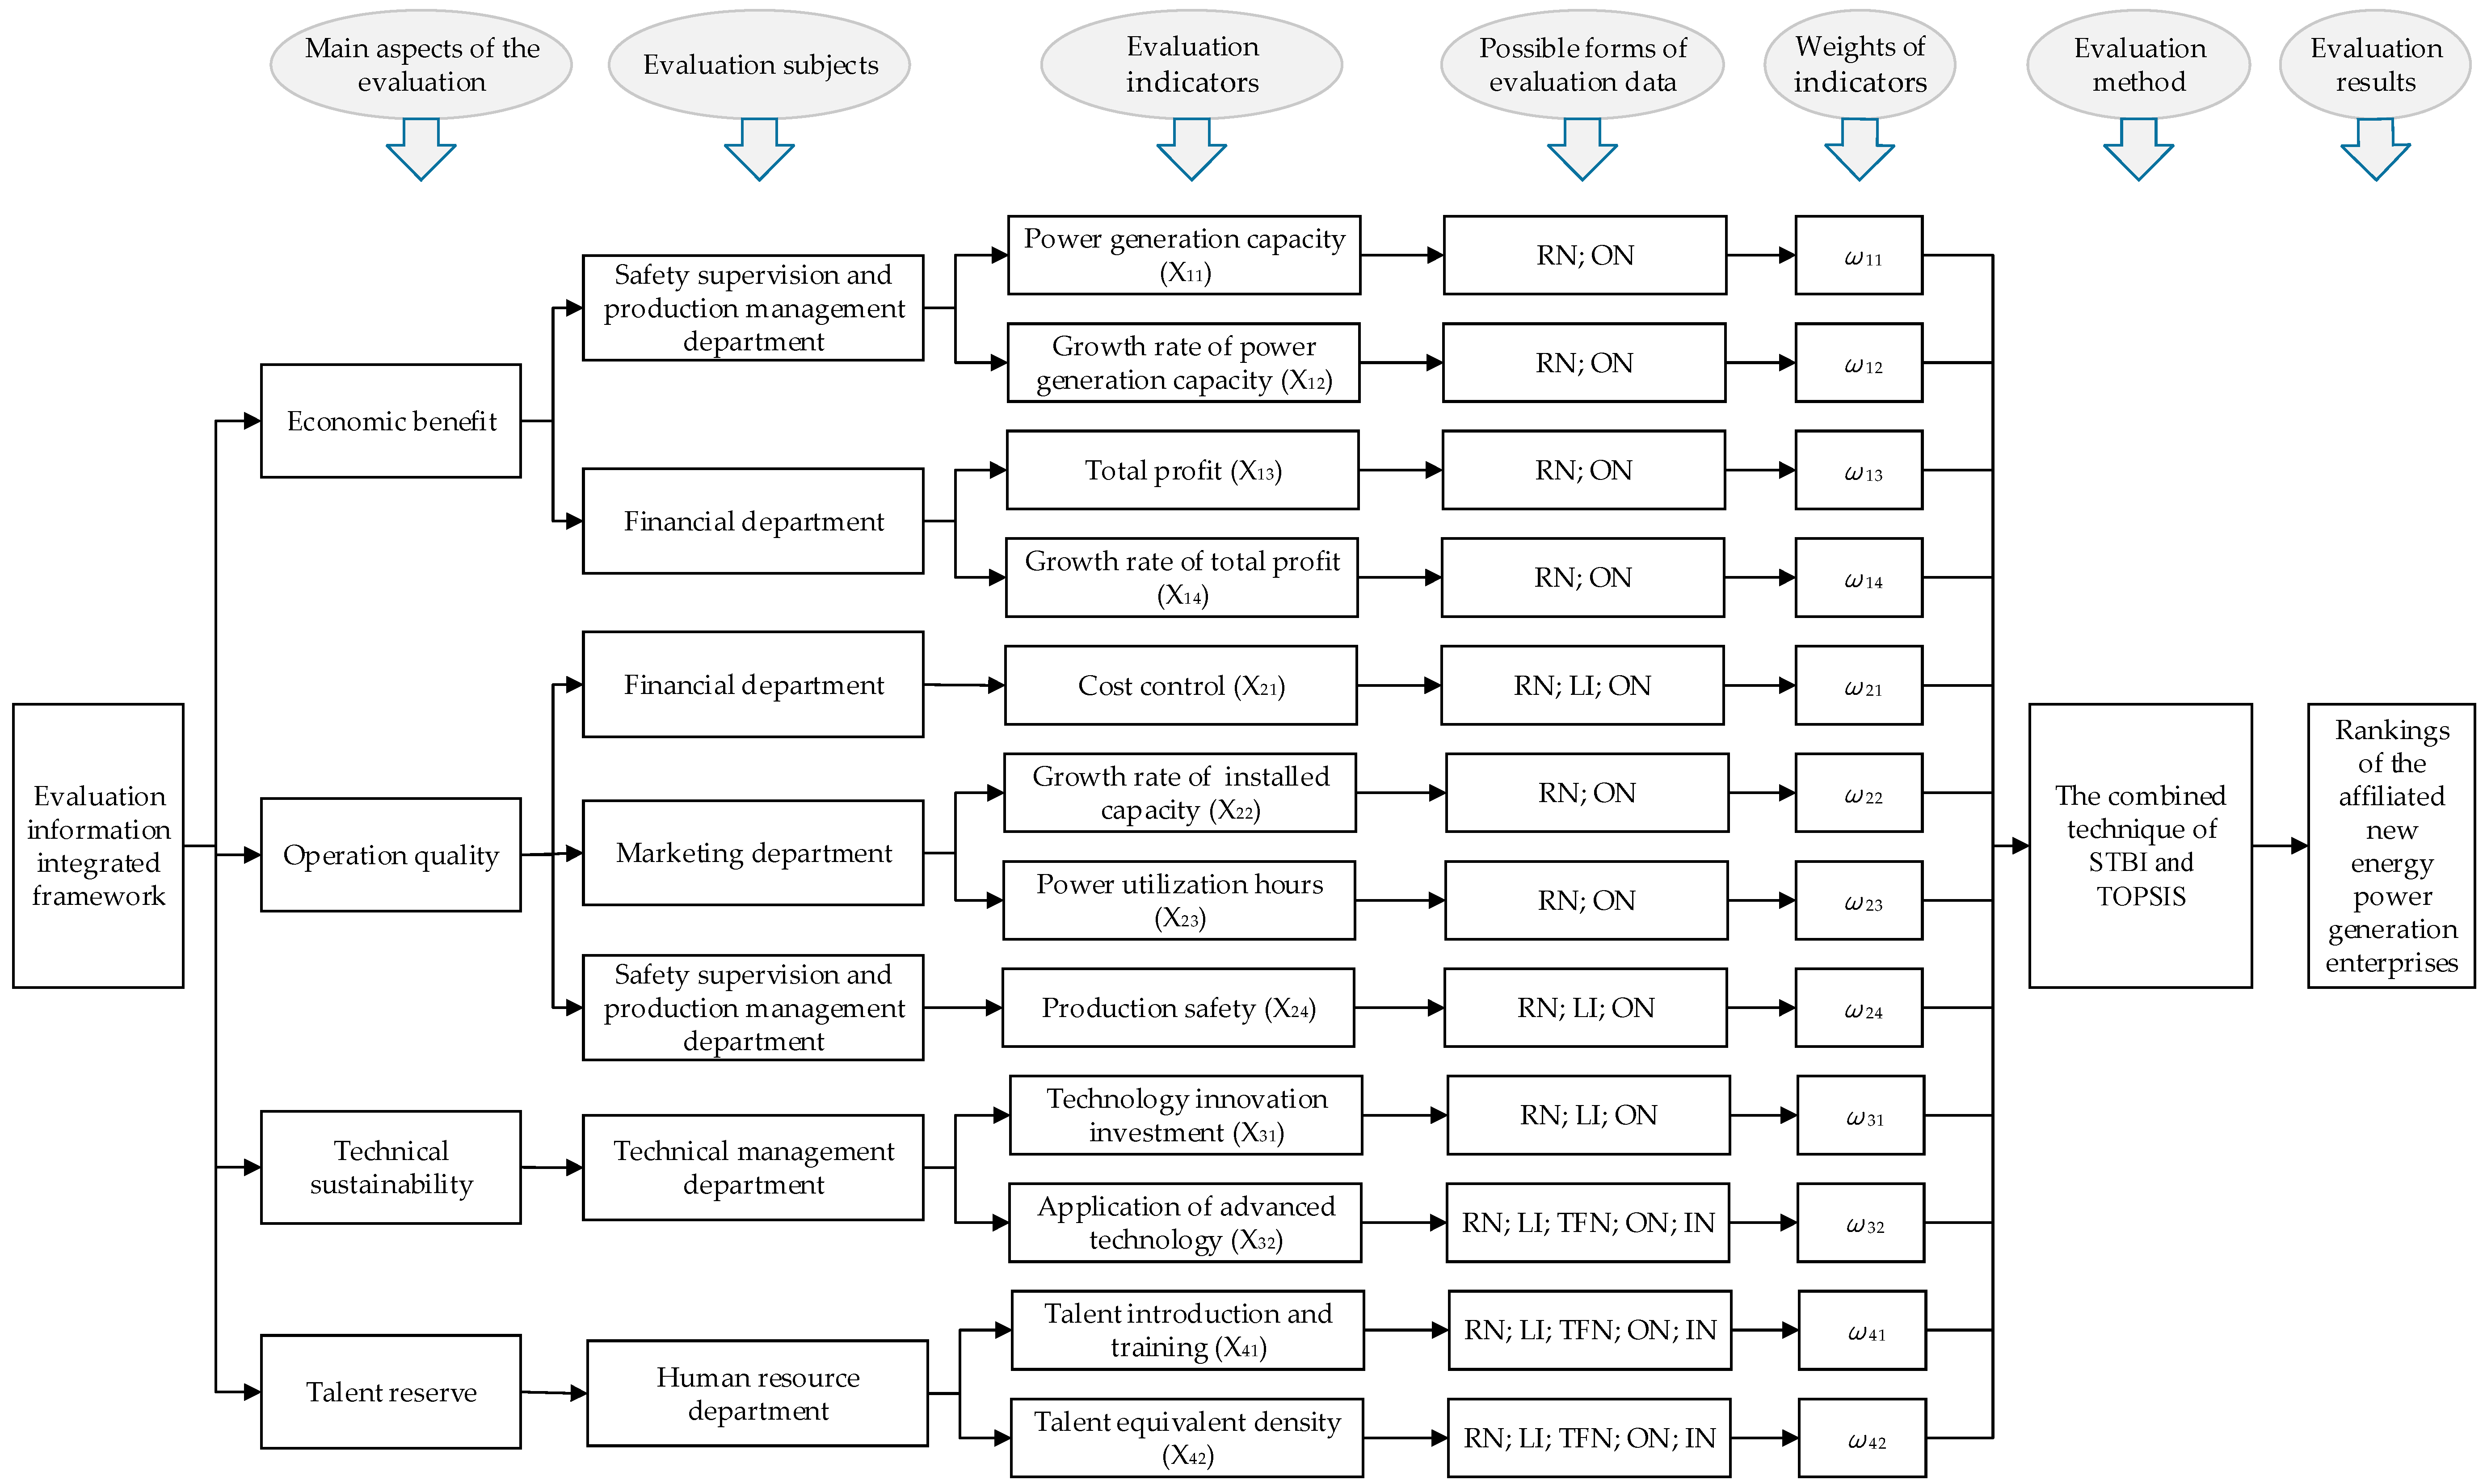
4. Integrated Framework of the Comprehensive Benefit Evaluation Information

To comprehensively evaluate the benefit of new energy power generation enterprises affiliated with a new energy generation group, different functional departments from the parent company are selected as evaluation subjects according to their functions and powers. Meanwhile, each of the evaluation subjects gives their preference information on different indicators among above twelve indicators affiliated with four aspects of the comprehensive benefit of the affiliated enterprises, namely economic benefit, operation quality, technical sustainability and talent reserve, according to the evaluation standards that should be agreed by both the evaluation subjects and the evaluation objects. The evaluation standards are generally made according to the following process (Figure 3). Since the evaluation subjects are no longer confined to a single or specific types of evaluation data, which are generally required by the traditional CE models, they are able to express their preference information in whatever types they need according to their major concerns and management characteristics. It is obvious that the evaluation information of the comprehensive benefit evaluation of group-affiliated new energy power generation enterprises are a blend of multi-source and multi-form. Therefore, it is very important to build an information integrated framework to integrate the blended and complex evaluation information.
The integrated framework of evaluation information of group-affiliated new energy power generation enterprises is the primary means to integrate the complex evaluation information, which is characterized by an encapsulation of a certain number of information flows. The essential elements of each information flow are all kinds of necessary evaluation information including evaluation indicators, preference information, evaluation methods and evaluation results, as shown in Figure 4. Since evaluation subjects enjoy considerable autonomy to express their preference information, it can be seen that blended evaluation information co-exists is at the center of the difficulties when solving the information integrated framework. In order to preserve the original evaluation information to the utmost, the evaluation model combining the stochastic transformation for blended information method (STBI) and the technique for order preference by similar to ideal solution (TOPSIS) will be introduced in the rest of this paper.

5. Evaluation Model Based on STBI and TOPSIS

5.1. Method Principle

5.1.1. Basic Idea of the Stochastic Transformation for Blended Information (STBI) Method

The stochastic transformation for blended information (STBI) method is a new data processing method proposed by Li, et al. in 2014 [34,36], which mainly aims at comprehensive evaluation problems with coexistence of blended evaluation information. According to the principle of STBI, different types of blended evaluation information will firstly be transformed into a RN, an IN or a TFN in the same scope and based on this, random numbers obeying a certain distribution are generated and their membership to the original information is calculated. Then, the stochastic simulation method is adopted to solve the evaluation question and the most probable ranking conclusion of evaluation objects is obtained. Therefore, STBI makes evaluation process no longer limited to single or certain types and can further expand the application range of comprehensive evaluation.

5.1.2. Basic Idea of Technique for Order Preference by Similarity to Ideal Solution (TOPSIS)

Technique for Order Preference by Similarity to Ideal Solution (TOPSIS), which was first proposed by Hwang and Yoon in 1981 [43], is also known as close to the ideal solution sorting method and the idea is derived from the decision problem of multivariate statistical analysis. It is a kind of scientific decision-making technology used in multiple attribute decision making of limited scheme system engineering. The basic idea of TOPSIS method is as follows: First, on the basis of normalization of the original matrix, it needs to find the optimal scheme and the worst scheme in the finite evaluation schemes, which are the positive and negative ideal solution. Second, the relative closeness degree between the evaluation object and the optimal solution is obtained, through calculating the distance between the object and the optimal scheme and the worst scheme, respectively. Third, the schemes are ranked to determine the optimal scheme [44]. The optimal scheme means each attribute value is the best of all the alternatives; contrarily, the worst scheme means the value of each attribute is the worst of all the alternatives. Fourth, the distance between each scheme and the optimal scheme and the worst scheme are measured and, if the scheme is close to the optimal scheme and far from the worst, the scheme will be the best one.

5.2. Evaluation Model

Step 1: Determine the value of the index.
Normally, at the beginning of each year, new energy power generation groups would evaluate the previous year’s benefit performance of their affiliated power generation enterprises. At this time, the related departments of the parent company (evaluation subjects) would determine the indicator value of the affiliated enterprises (evaluation objects) that they take charge of, according to the evaluation rules that have been made earlier.
Evaluating the indicators n of objects m and the original matrix is set up as follows:
X = [ x 11 x 12 x 1 n x 21 x 22 x 2 n x m 1 x m 2 x m n ]
Step 2: Determine the weight of each index.
Employing the appropriate method to obtain the weights of evaluation indicators is very important for benefit evaluation of group-affiliated new energy power generation enterprises. There are many weight determination methods, which can be divided into three types, namely the subjective weighting methods, the objective weighting methods and the comprehensive methods combining subjective weighting method and objective weighting method. The selection of weight determination method should be based on the evaluation objective and accessible indicator data. The sum of criteria weight should be satisfied by:
j = 1 n ω j = 1
Step 3: Preprocess the indicator data
As mentioned above, the preference information of the indicators appears in mainly five types including real number (RN), interval number (IN), triangular fuzzy number (TFN), linguistic information (LI) and ordinal number (ON). Although evaluation subjects give differentiated evaluation data form of the objects on each index, theoretically the initial data can be standardized into a common range of values, which can be set as [0, 1] without loss of generality, so that the indicator consistency can be provided and the dimensionality can be eliminated.
(1) Real number (RN)
Real number (RN) is used to provide precise evaluation information. The extreme value standardization method [33] is used to standardize the indicator data. Equation (3) is for the benefit indicators and Equation (4) is for the cost indicators.
For   the   benefit   indicators   x i j * = x i j x i j a x i j b x i j a   and   x i j a = min i x i j , x i j b = max i x i j
For   the   cost   indicators   x i j * = x i j b x i j x i j b x i j a   and   x i j a = min i x i j , x i j b = max i x i j
(2) Interval number (IN)
Interval number (IN) indicates that the evaluation information provided is a range of values, which is denoted by x i j = [ x i j L , x i j U ] = [ x | x i j L x x i j U , x i j L , x i j U R ] , where x i j L and x i j U are the left endpoint and right endpoint of x i j , respectively. Based on the extreme value standardization method [33], Equations (5) and (6) are used to standardize the benefit indicators and the cost indicators respectively.
For   the   benefit   indicators   { x i j L * = x i j L x i j a x i j b x i j a x i j U * = x i j U x i j L x i j b x i j a + x i j L *   and   x i j a = min i x i j L ,   x i j b = max i x i j U
For   the   cost   indicators   { x i j L * = x i j b x i j U x i j b x i j a x i j U * = x i j U x i j L x i j b x i j a + x i j L *   and   x i j a = min i x i j L ,   x i j b = max i x i j U
(3) Triangular fuzzy number (TFN)
Triangular fuzzy number (TFN) is used to solve the issues in uncertain environments, which is proposed by L. A. Zadeh [45]. A TFN can be represented as a triplet x i j = ( x i j L , x i j M , x i j U ) , where x i j L , x i j M , x i j U are the lower bound, middle value and upper bound of evaluation index, respectively, which are real numbers and < x i j L x i j M x i j U < . Based on the extreme value standardization method [33], the TFN can be transformed into a standardized TFN x i j * = ( x i j L * , x i j M * , x i j U * ) according to Equations (7) and (8).
For   the   benefit   indicators   { x i j L * = x i j L x i j a x i j b x i j a x i j M * = x i j M x i j L x i j b x i j a + x i j L * x i j U * = x i j U x i j M x i j b x i j a + x i j M *   and   x i j a = min i x i j L ,   x i j b = max i x i j U
For   the   cost   indicators   { x i j L * = x i j b x i j U x i j b x i j a x i j M * = x i j U x i j M x i j b x i j a + x i j L * x i j U * = x i j M x i j L x i j b x i j a + x i j M *   and   x i j a = min i x i j L ,   x i j b = max i x i j U
The membership function of the standardized TFN is shown in Equation (9) [12].
μ x i j * ( x ) = { 0 x < x i j L * x x i j L * x i j M * x i j L * x i j L * x < x i j M * x i j U * x x i j U * x i j M * x i j M * x x i j U * 0 x > x i j U *
(4) Linguistic information (LI)
Generally, qualitative indicators are fuzzy and difficult to quantify, so evaluation subjects cannot estimate their preference with exact numerical values. Under such conditions, subjects tend to express their opinions using linguistic information (LI), such as good, fair or bad. When applied to evaluations, LI is normally transformed into linguistic terms. A linguistic term can be expressed as S = { s 0 , s 1 , , s T } , which is an ordered set consisting of an odd number of elements, where T is an even number. During the evaluation process, a linguistic term can be transformed to a TFN denoted as ( α l , μ l , β l ) first, where l = 0, 1, …, T, according to the equation below. Based on this, the normalized linguistic term and its corresponding TFN is defined, as shown in Table 2.
{ α l = max ( 0 , ( l 1 ) / T ) μ l = l / T β l = min ( ( l + 1 ) / T , 1 )
(5) Ordinal number (ON)
In some CE processes, evaluation subjects often prefer to provide a more direct rating data than a complex numerical interval or linguistic value, when ordinal number (ON) becomes a much better choice. An ON provided by evaluation subjects indicates the order of performance of the objects on an index, which can be expressed as 1, 2, … Usually the ON that each of m objects corresponds to on a single indicator belongs to set {1, 2, …, m}, here [0, 1] is divided into m even parts, as shown in Figure 5, which means that each ON corresponds to an IN, denoted by x i j * = [ x i j L * , x i j U * ] and its left endpoint and right endpoint can be calculated through the equation below.
{ x i j L * = ( m l ) / m x i j U * = ( m l + 1 ) / m   and   l = 1 , 2 , , m
However, there may be situations where two or three objects are rated the same order in practice, then the standard interval should be divided into m-1 or m-2 parts and the same ON corresponds to the same interval.
The processing method mentioned above, can not only transform the initial indicator data into a standard range of values but also retain the characteristics of the initial evaluation information [34,35], simultaneously.
Step 4: Evaluate the objects based on the combined technique of STBI and TOPSIS
The Monte Carlo simulation technology is applied to evaluating comprehensive benefit of the objects and the basic steps of the simulation process are as follows.
(1)
Set up monitoring variable count as the number of replications of the simulation (Initial value of count is 0) and the total number of simulation replications is sum (more than 1 million).
(2)
Set up counting variables ϕ α β s , ϕ α β e and ϕ α β f as the numbers of replications, which represent the situations when o α o β , o α o β and o α o β , separately, where o α and o β are any two different evaluation objects.
(3)
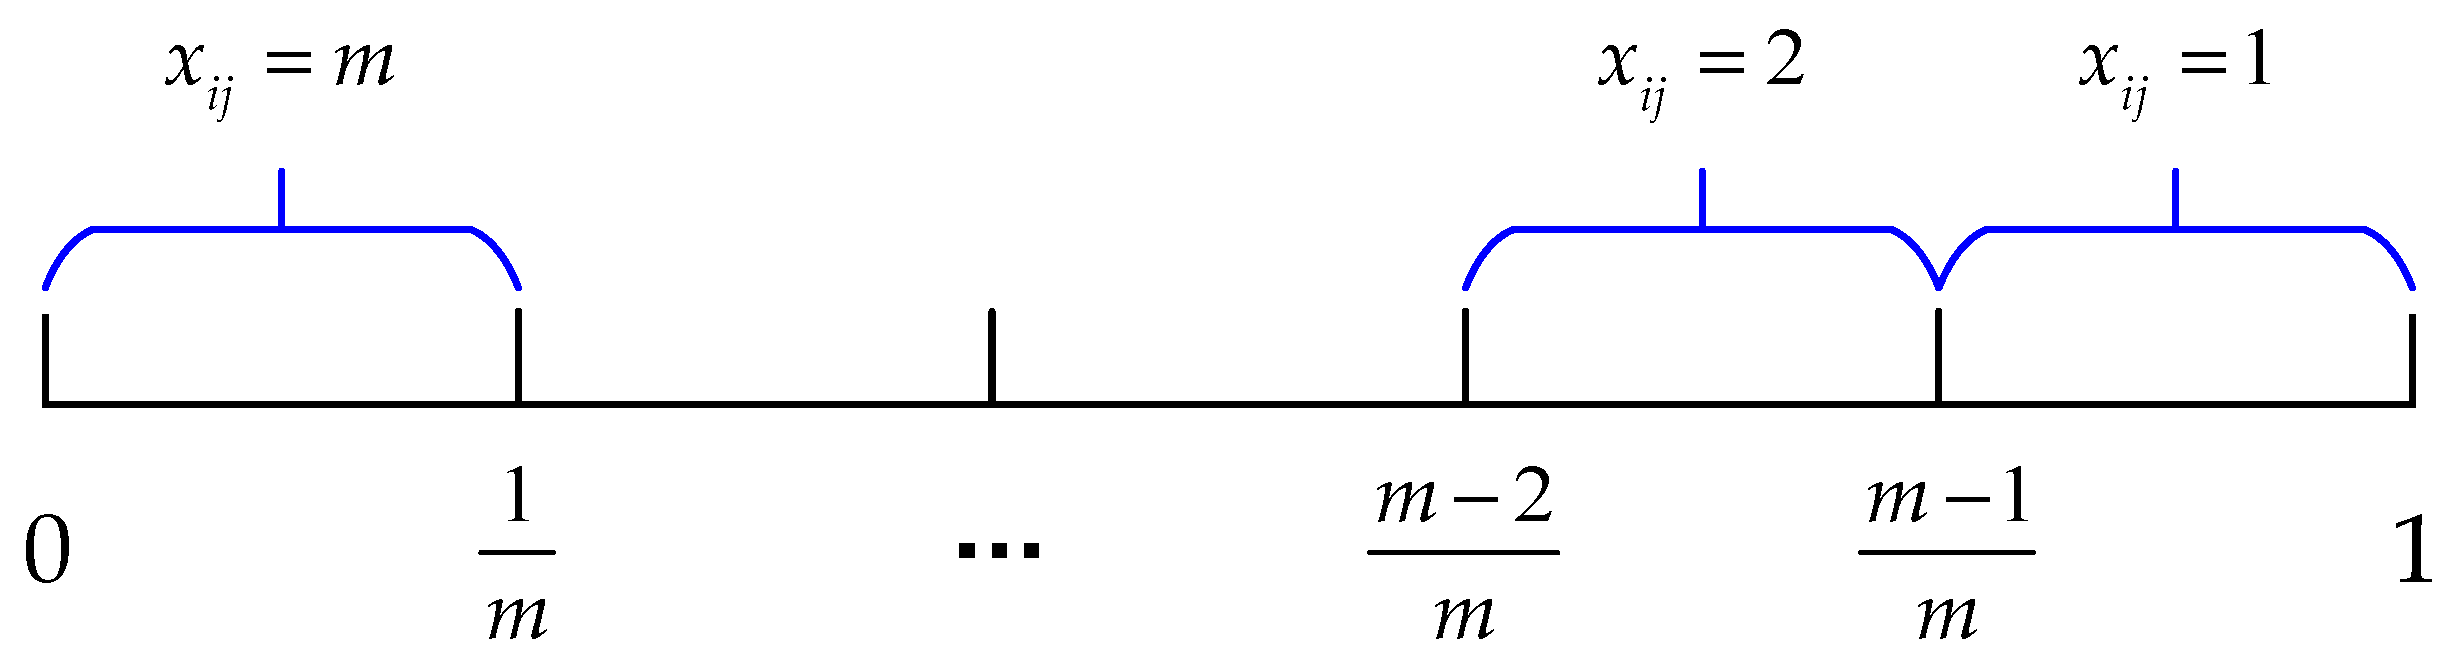
Generate random numbers characterized by a representative degree in each replication of the simulation.
Through Step 2, the original blended evaluation data have been transformed into RNs, INs and TFNs among [0, 1]. A RN can be regarded as an IN, of which the left endpoint is equal to the right endpoint. Based on this, a random number generator is adopted to generate a set of random numbers obeying a uniform distribution among the numerical intervals that xij corresponds to, which can be represented as [rij]m×k. Obviously, any given set of generated numbers in each replication cannot fully reflect the initial evaluation information, so the random numbers’ representative degree to the original evaluation information should be analyzed.
For the random numbers generated in the kth replication of the simulation, let pik be the representative degree with respect to the original evaluation data for object oi, which is defined as follows [34]:
p i k = Π j = 1 n μ i j
where μ i j is the membership degree of rij with respect to xij [34] and Π is the product of the membership degrees of the corresponding random numbers in the current replication. Based on the concepts of fuzzy set theory, when xij is a RN or IN, μ i j = 1 ; when xij is a TFN, μ i j can be calculated by the membership function displayed in Equation (9).
The holistic representative degree with respect to the original evaluation data for all objects, denoted by pk, can be calculated through
p k = Π i = 1 m Π j = 1 n μ i j
(4) Calculate the benefit of each objects through TOPSIS
For any set of random numbers generated in each replication of the simulation, TOPSIS is employed to evaluate the comprehensive benefit of all the objects and the calculating process is as follows [43].
① Set up the decision matrix.
Suppose that Vk is the decision matrix generated by a random number generator in the kth replication of the simulation, which can be expressed as
V k = [ v 11 k v 12 k v 1 n k v 21 k v 22 k v 2 n k v m 1 k v m 2 k v m n k ] = [ ω 1 r 11 k ω 2 r 12 k ω n r 1 n k ω 1 r 21 k ω 2 r 22 k ω n r 2 n k ω 1 r m 1 k ω 2 r m 2 k ω n r m n k ]
② Determine the two type of ideal solutions.
In the decision matrix, the positive ideal solution Z k + is the vector of the maximum element of each column and the negative ideal solution Z k is the vector of the minimum element of each column.
Z k + = ( z 1 k + , z 2 k + , , z n k + )
Z k = ( z 1 k , z 2 k , , z n k )
where z j k + = max ( v 1 j k , v 2 j k , , v m j k ) and z j k = min ( v 1 j k , v 2 j k , , v m j k ) .
③ Calculate the distances between each object and the positive and negative ideal solution, respectively.
D i k + = j = 1 n ( v i j Z j k + ) 2
D i k = j = 1 n ( v i j Z j k ) 2
④ Calculate the closeness coefficients for all objects.
The closeness coefficient CCik can be used to reflect the distance closest to D i k + as well as D i k , which can be obtained by the following equation:
C C i k = D i k + D i k + + D i k
⑤ Obtain the ranking result in the current replication of the simulation.
Since random numbers generated cannot completely represent the original evaluation data, the closeness coefficient CCik should be modified by the represent degree pik to obtain the ranking result in the current replication of simulation, according to the following equation.
C C i k = C C i k × p i k
where C C i k is the modified closeness coefficient for object oi and pik is the representative degree of the random numbers generated with respect to the original evaluation data in the current replication for object oi Obviously, the higher C C i k is, the closer the corresponding object is to the positive ideal solution.
Based on the modified closeness coefficient C C i k , the ranking result of the evaluation objects can be obtained in the current replication of the simulation.
(5)
Base on the ranking result in the current replication, the counting variables ϕ α β s , ϕ α β e and ϕ α β f are modified as follows: If p α C C α > p β C C β , ϕ α β s = ϕ α β s + 1 ; if p α C C α = p β C C β , ϕ α β e = ϕ α β e + 1 ; if p α C C α < p β C C β , ϕ α β f = ϕ α β f + 1 .
(6)
count = count + 1. When count = sum, go on to the next step, otherwise, go back to (2).
(7)
Calculate the simulated value of advantage rate s ( o α o β ) through Equation (21). Save the data and exit the program [34].
s ( o α o β ) = ( ϕ α β s + 0.5 ϕ α β e ) / s u m
Step 5: Construct the advantage rate matrix of all objects derived from the simulation, which can be defined as follows:
S = [ s α β ] m × m = [ s 11 s 12 s 1 m s 21 s 22 s 2 m s m 1 s m 2 s m m ]
where s α β = s ( o α o β ) . It is easy to find that the elements of the diagonal line of S are all equal to 0.5 and s α β + s β α = 1 .
Step 6: Set up g ( o i ) as the superior value of evaluation object o i . The superior value of an evaluation object refers to the frequency of situations when it is superior or equal to the other objects, which can be calculated by Equation (23) based on numbers of the ith row of S [34].
g ( o i ) = c o u n t ( s i χ > 0.5 ) + 0.5 c o u n t ( s i χ = 0.5 ) i , χ = 1 , 2 , , m , i χ
where c o u n t ( ) is the function counting the number of times when criterion is satisfied. Thus, the ranking result of all objects can be obtained according to the sequence of their superior values.

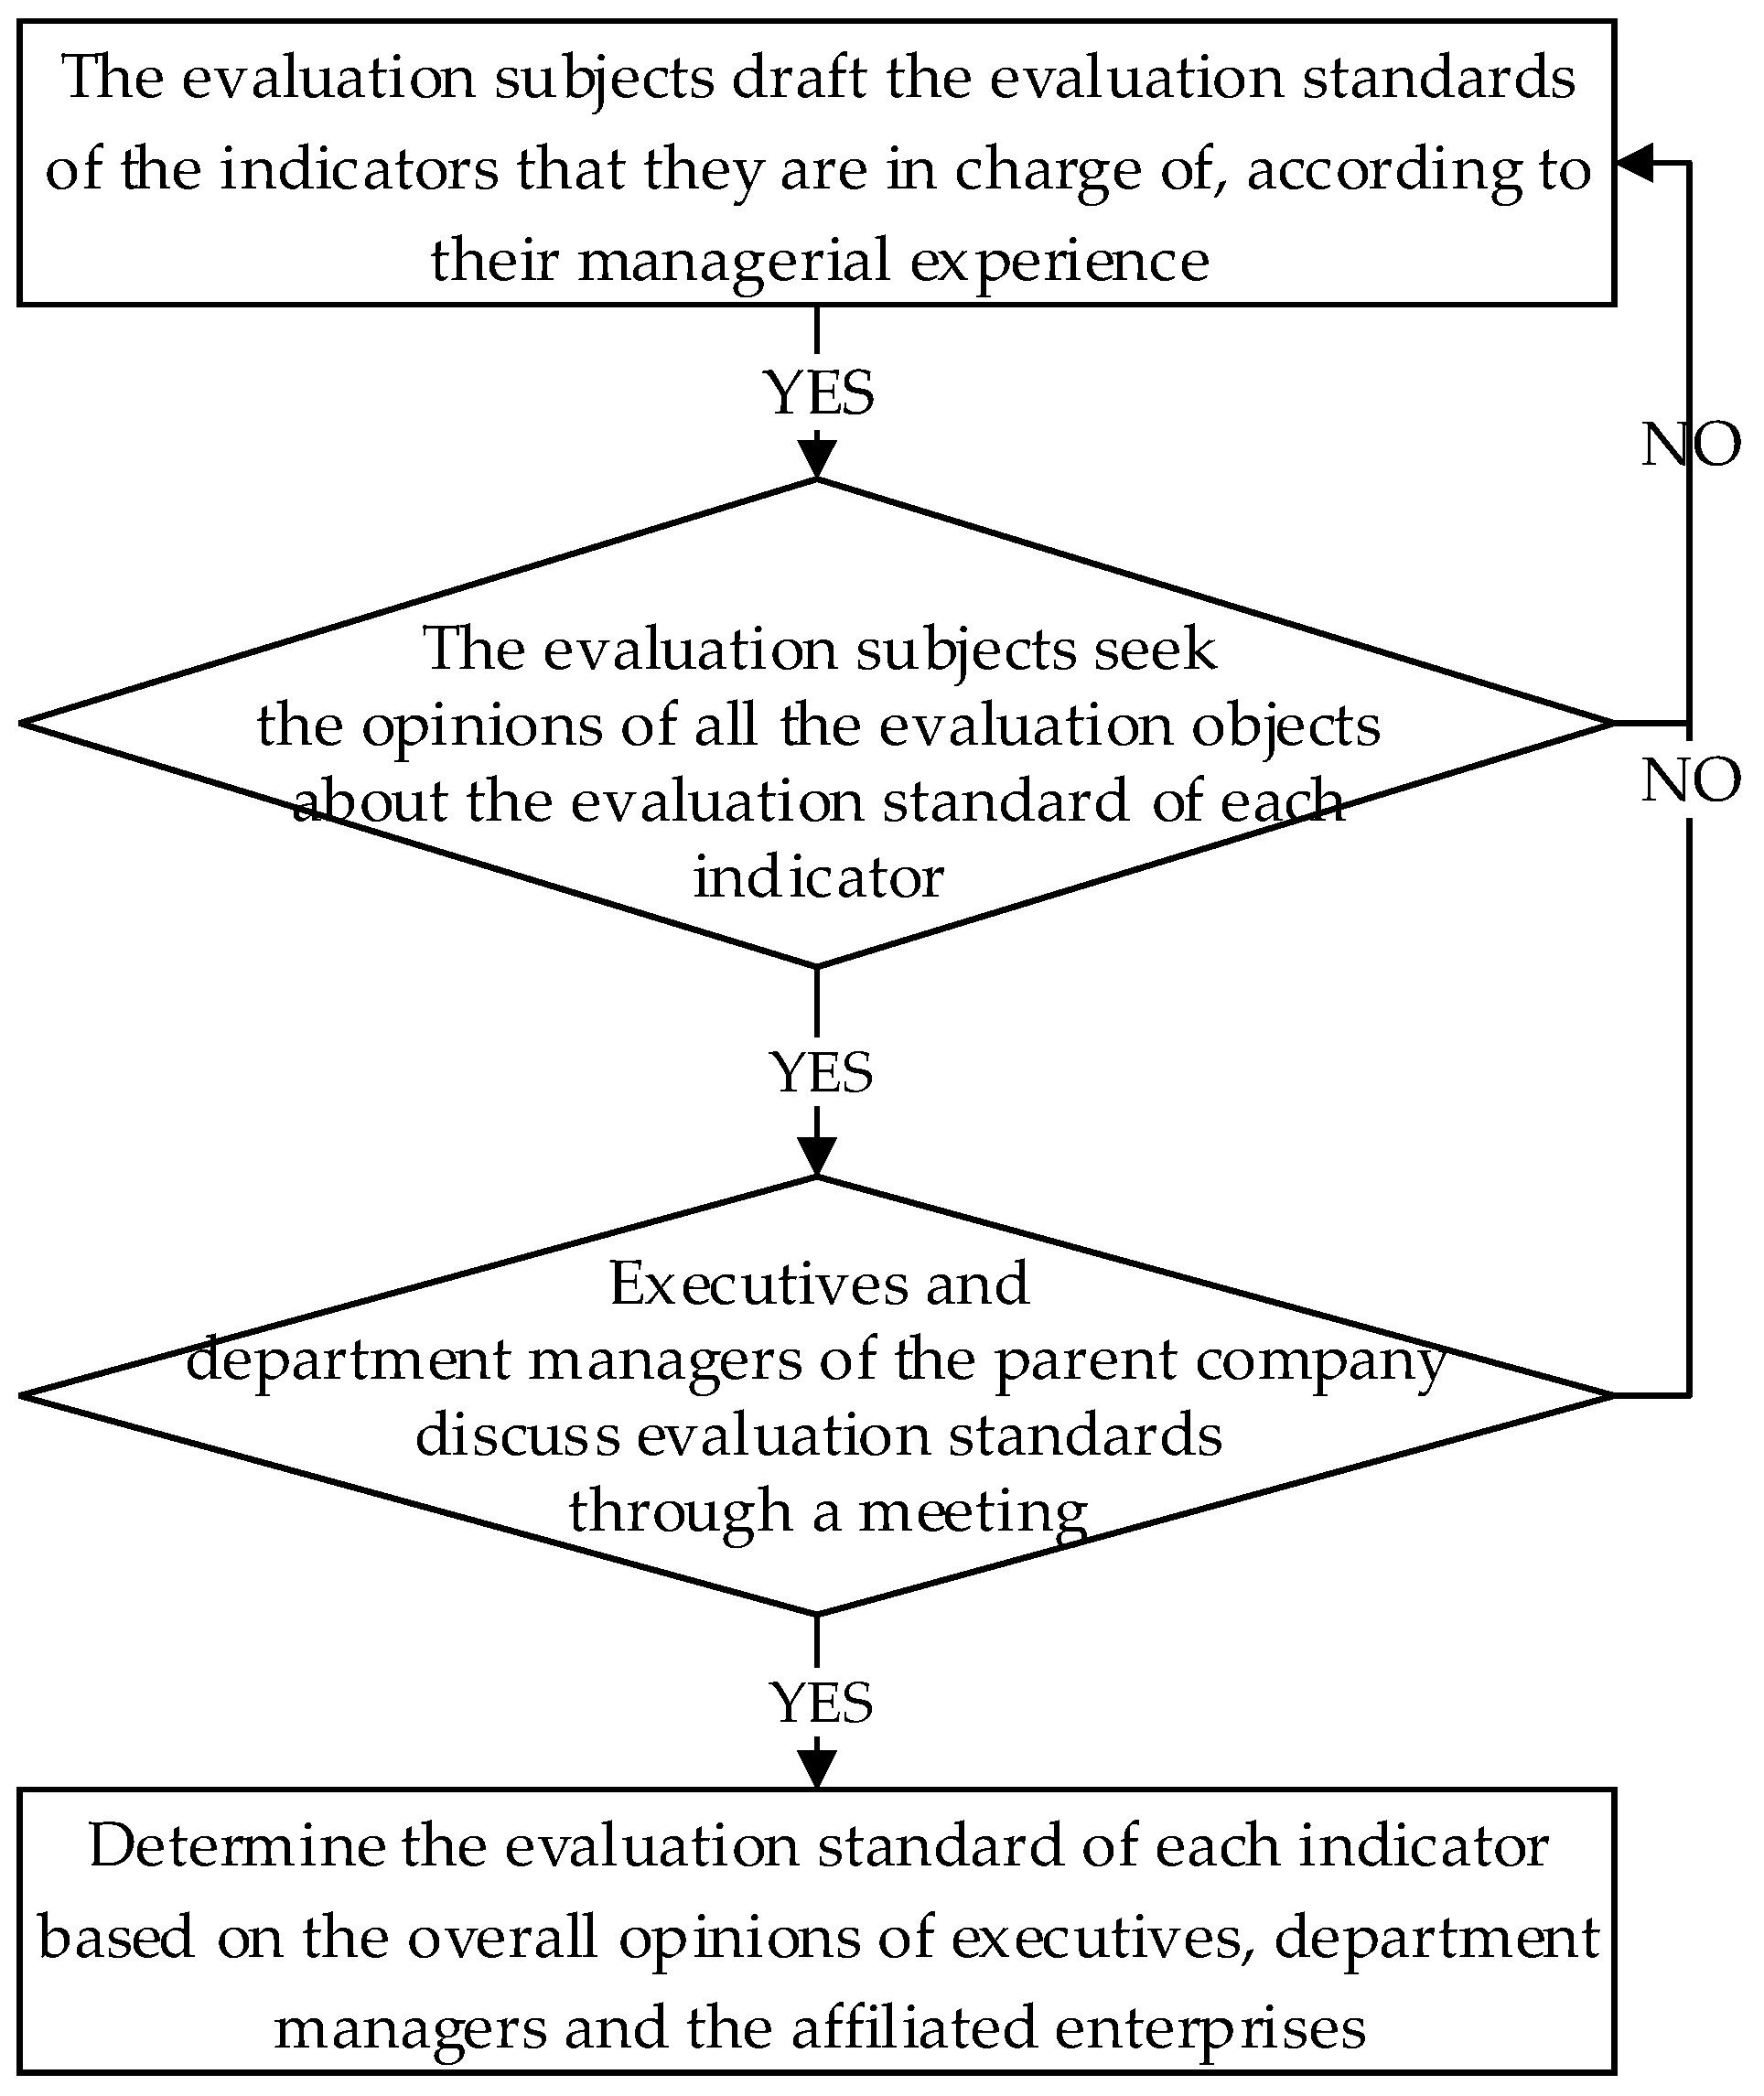
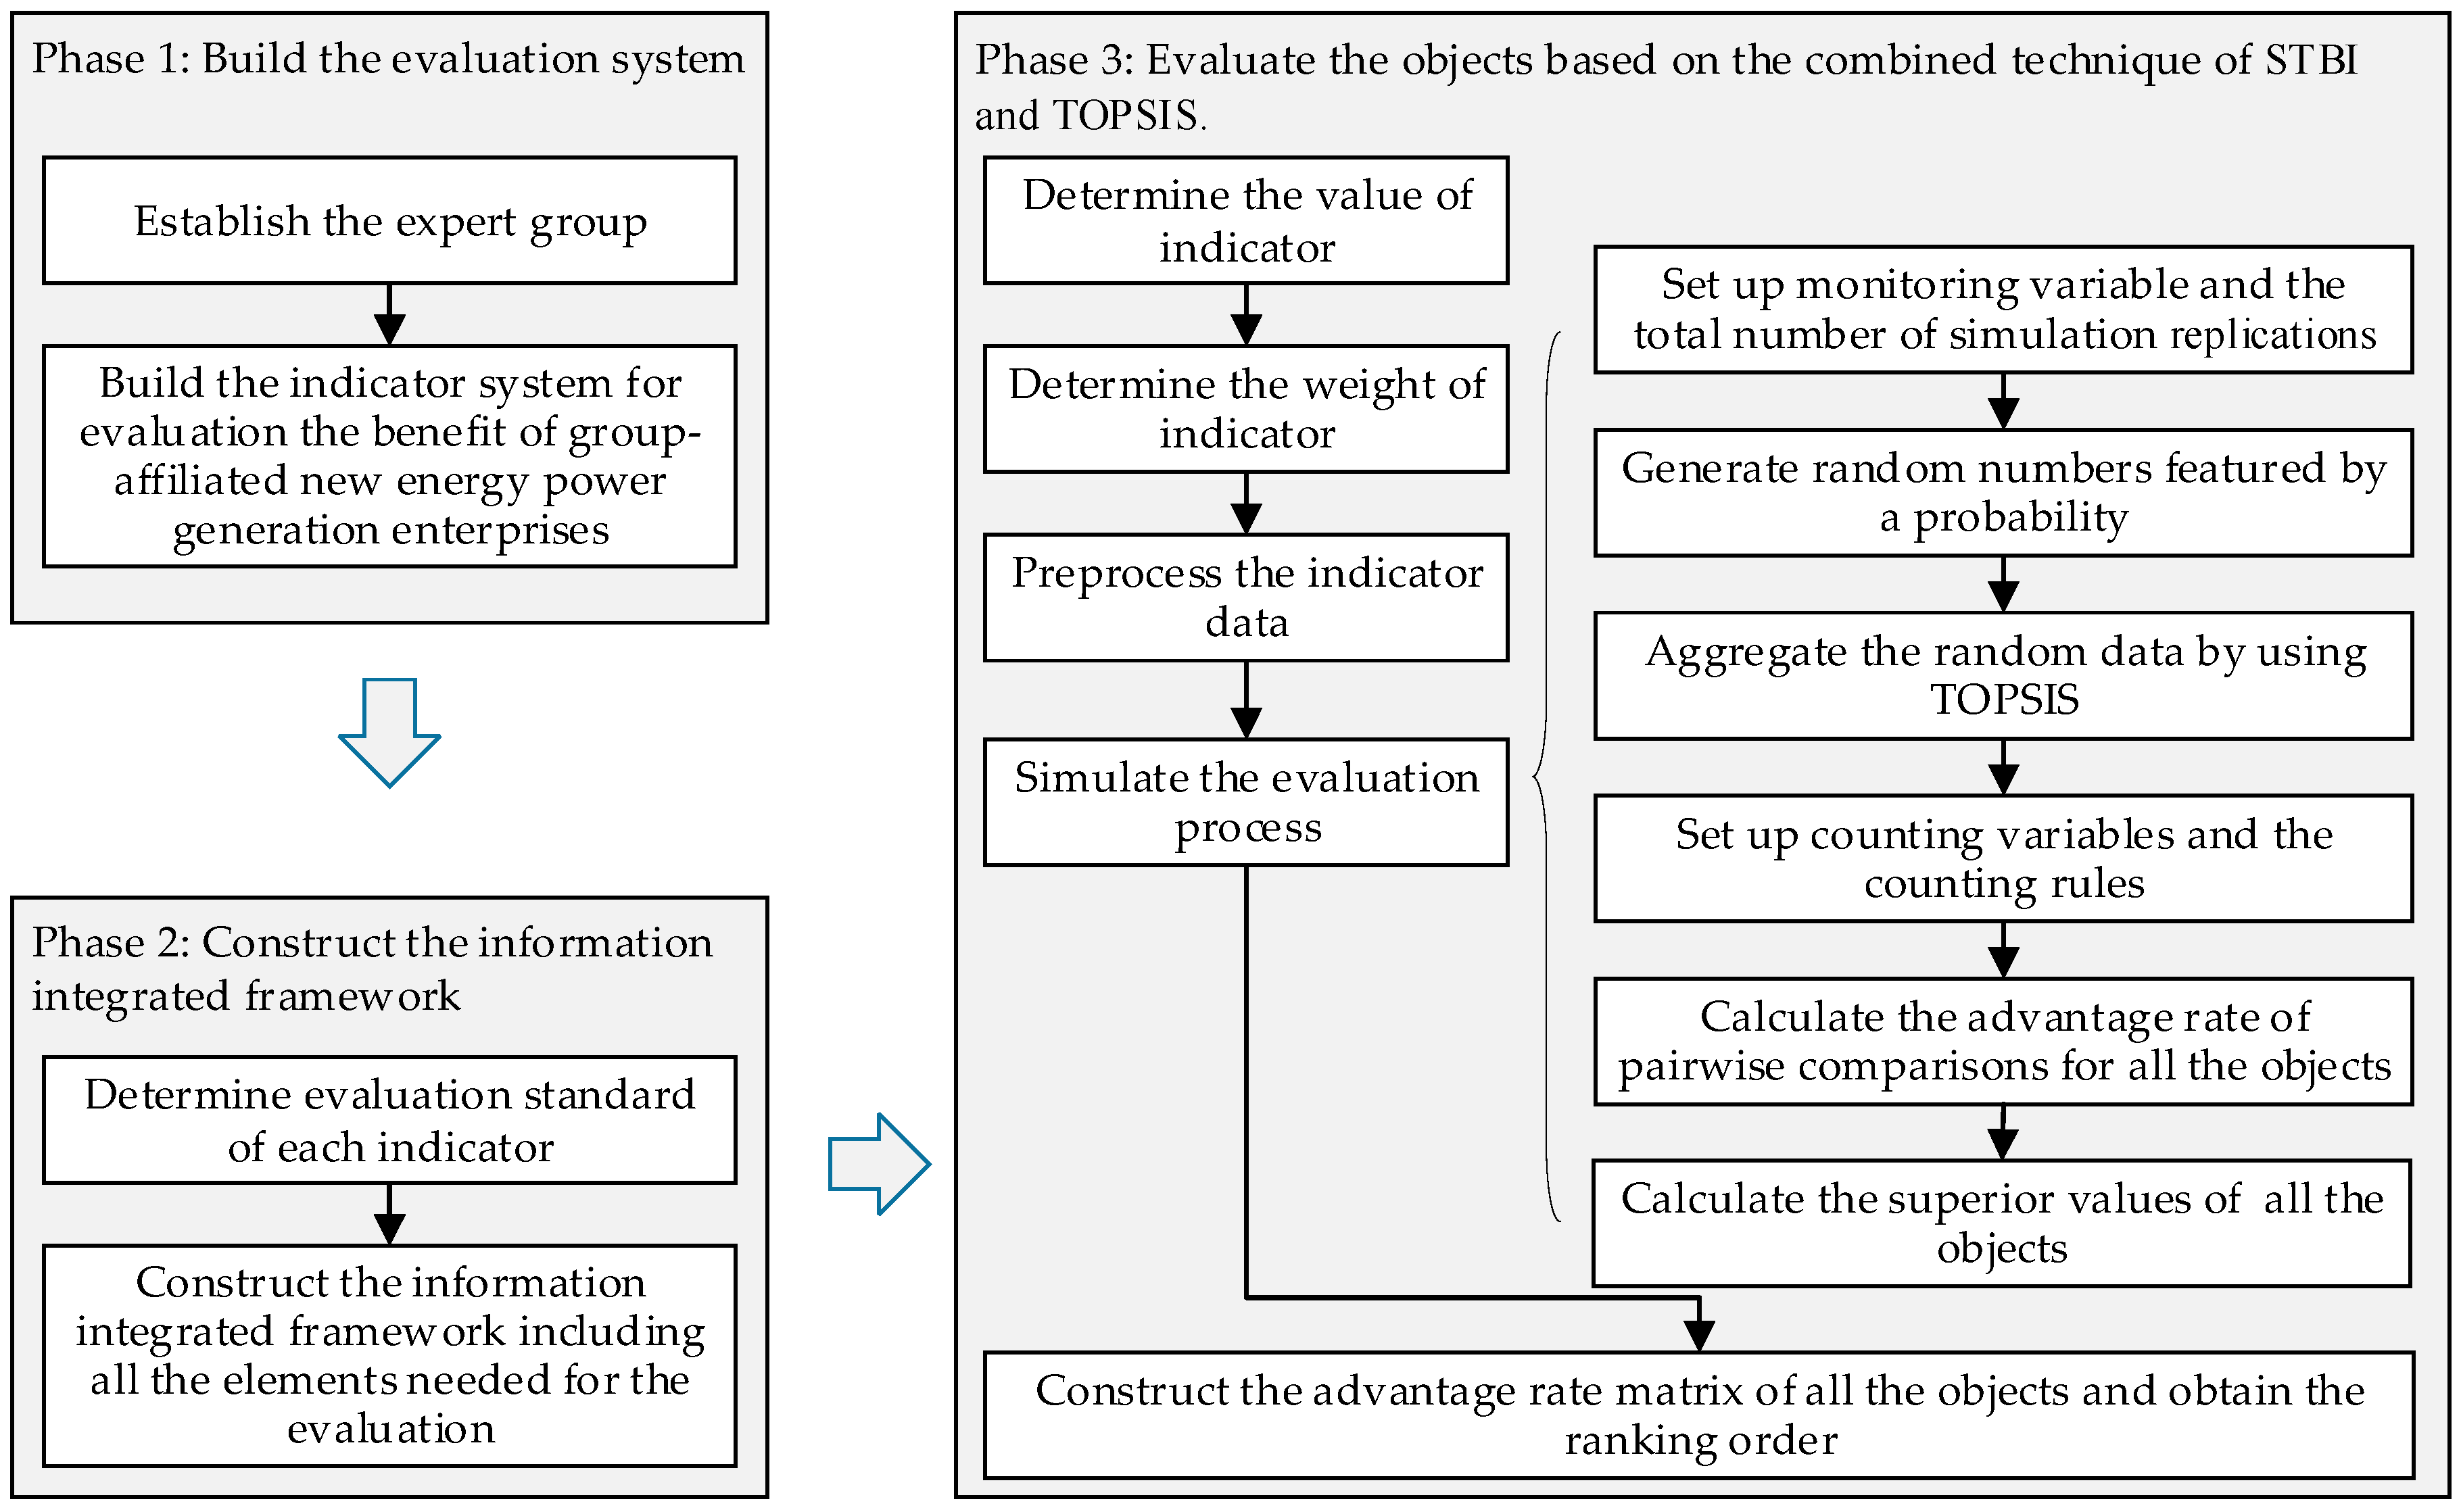
5.3. The Evaluation Procedure Based on STBI and TOPSIS

The proposed model for evaluating the benefit of group-affiliated new energy power generation enterprises based on STBI and TOPSIS involves three phases. First of all, build the evaluation indicator system from both the perspective of sustainable development in the “Thirteenth Five-Year Plan” period” and the needs of management and control within new energy power generation groups. Second, construct the evaluation information integration framework for further calculation. Third, evaluate the benefit of group-affiliated new energy power generation enterprises based on a combined technique of STBI and TOPSIS. The details are shown as Figure 6.

6. Empirical Research

Huaneng Renewables Group is a large new energy power generation group in China. Since its establishment, the company has been focusing on its mission of green power development and clean energy production. It is committed to the investment, construction and operation of new energy projects by focusing on developing and operating wind power projects while promoting synergistic growth of solar power and other renewable energies. Since 2016 was the first year of the thirteenth five-year plan, the company has placed great emphasis on improving the growth quality, benefit and sustainable development capabilities of its affiliated new energy power generation enterprises. Among all these affiliated enterprises, four regional enterprises including Inner Mongolia (o1), Liaoning (o2), Shandong (o3) and Yunnan (o4) are the first batch that have succeeded in regional integration. Therefore, an annual benefit evaluation has been performed on them. Details of the evaluation process are shown as below.

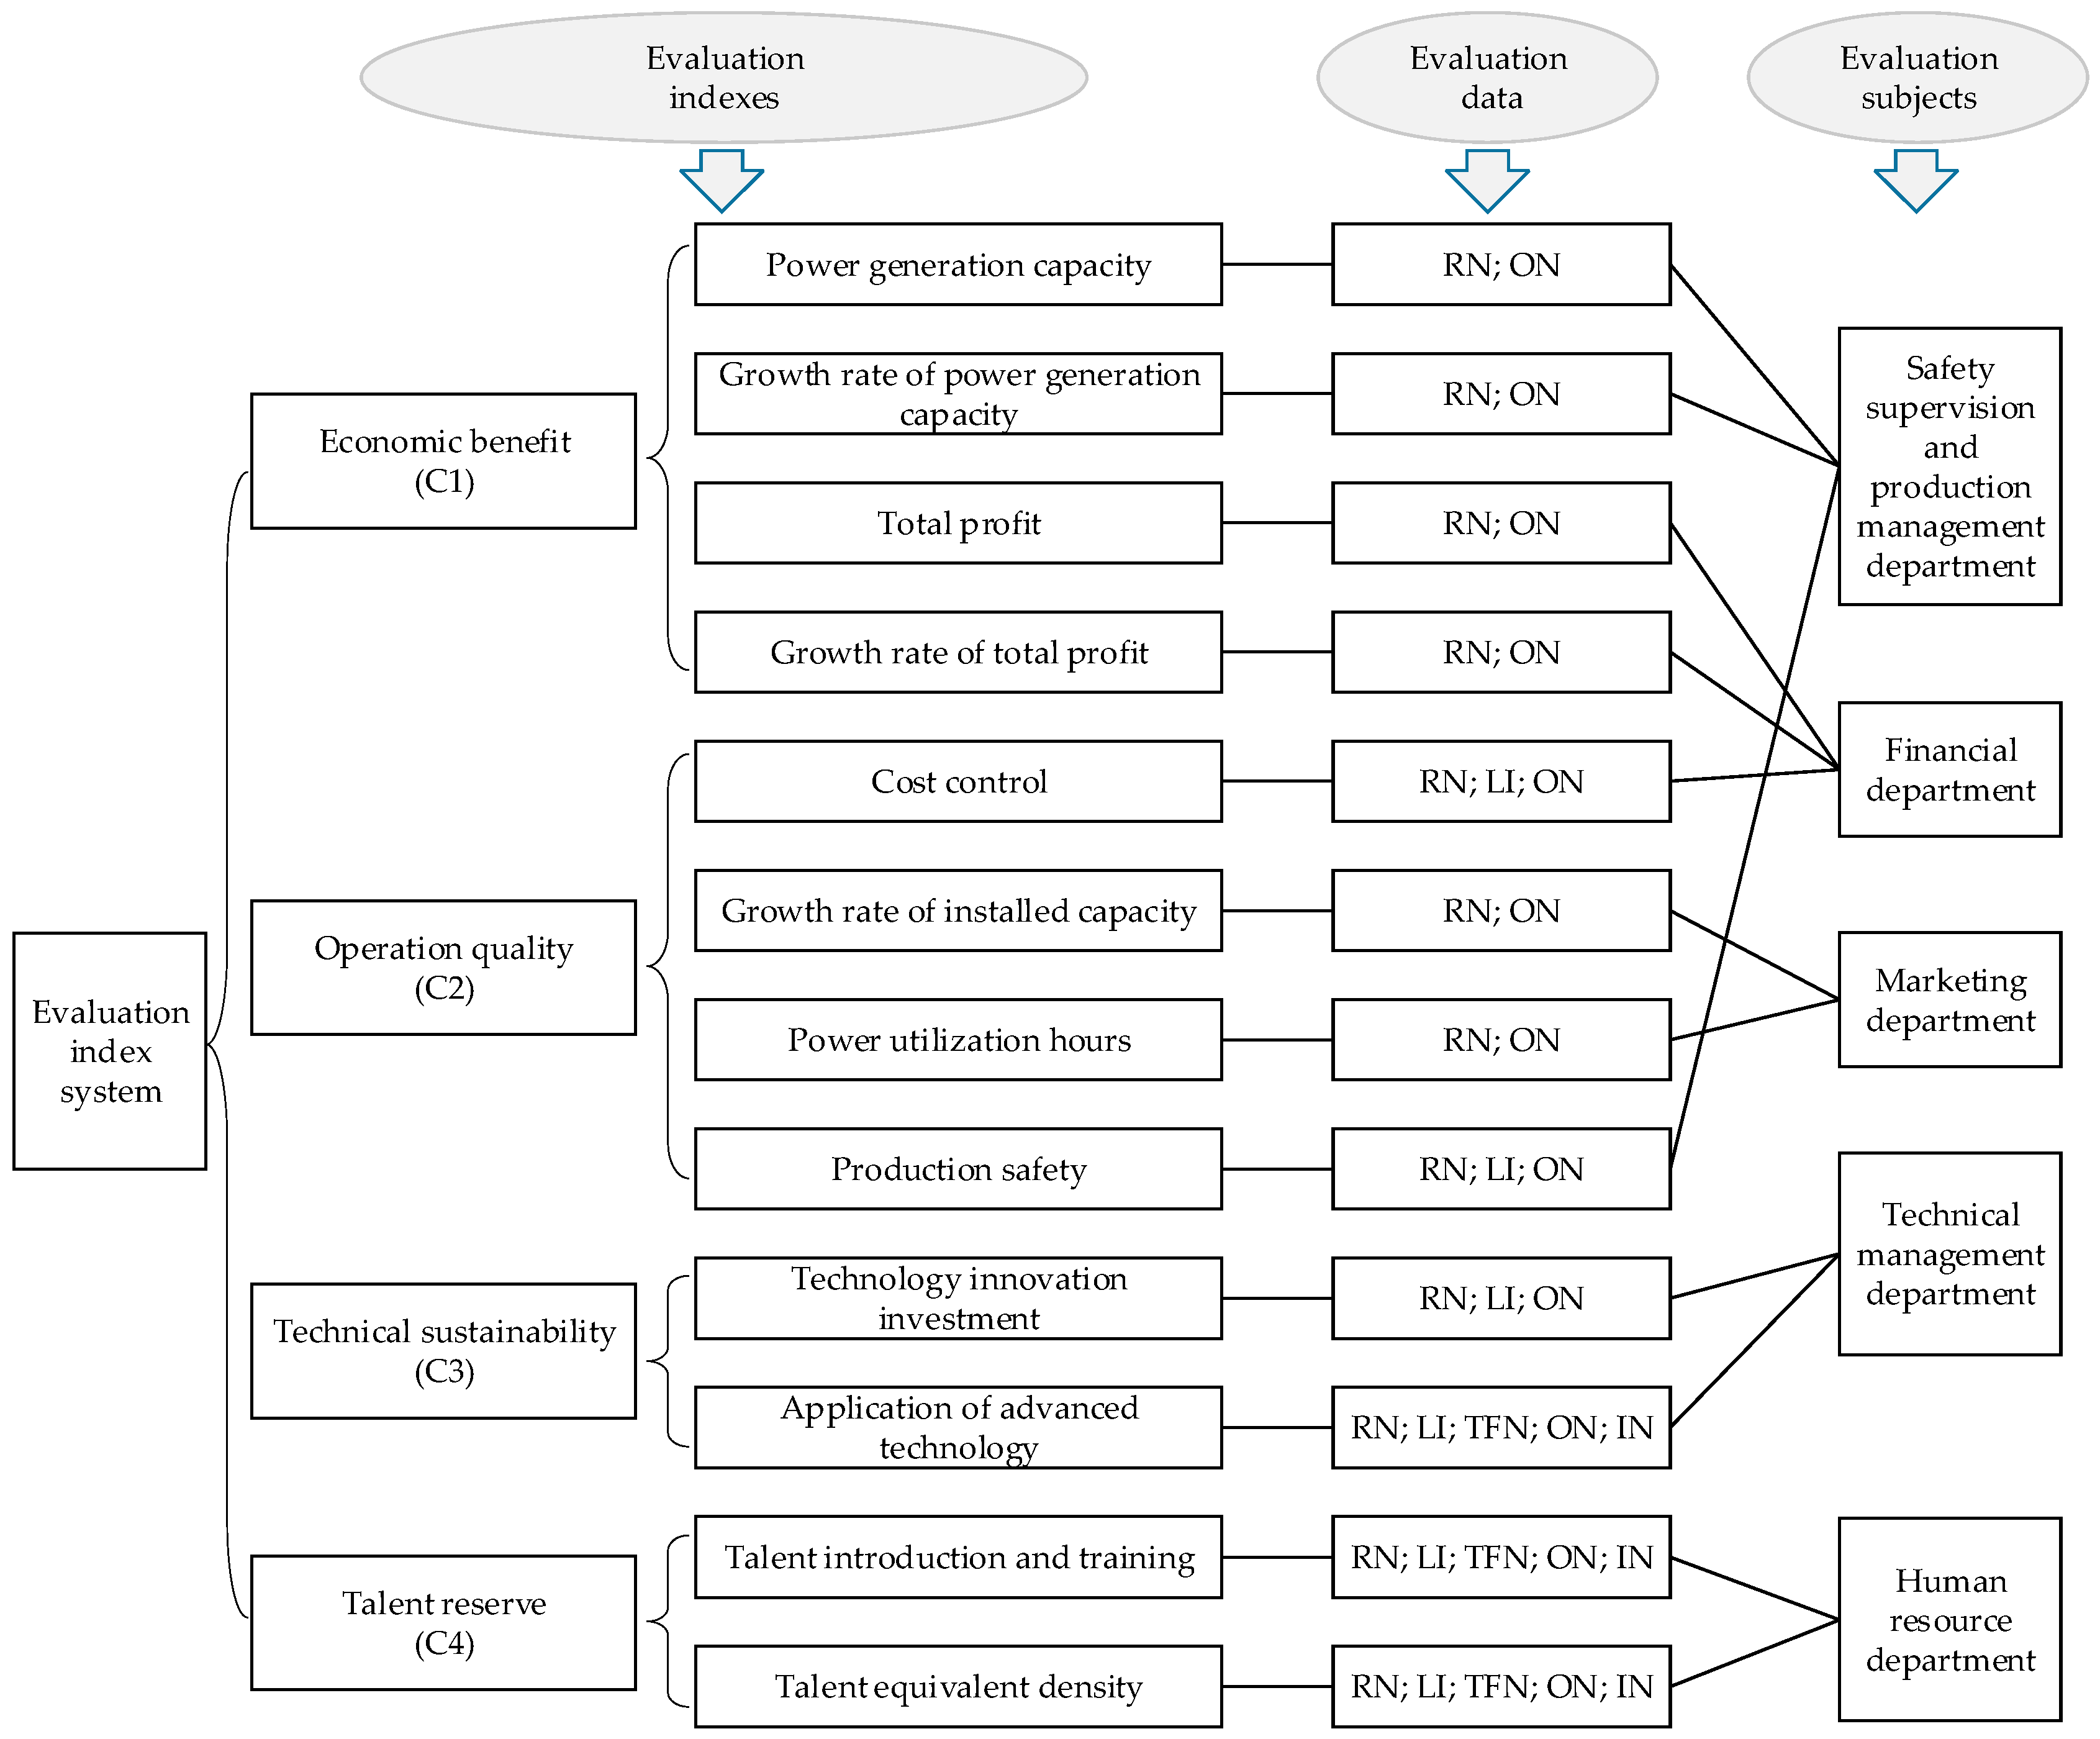
6.1. Build the Evaluation Indicator System

The evaluation indicator system is established according to Section 2, which includes four aspects (economic benefit, operation quality, technical sustainability and talent quality) and twelve indicators. Five departments from the parent company are authorized to evaluate the corresponding indicators based on their duties.

6.2. Construct the Integrated Framework of Evaluation Data

According to Section 3, the evaluation information integrated framework can be constructed, including all the elements needed for the whole evaluation process, among which, types of evaluation data for all indicators are determined through a decision-making procedure (as shown in Figure 3), as shown in Table 3.

6.3. Evaluate the Comprehensive Benefit of Alternatives Based on the Combined Technique of STBI and TOPSIS

(1)
After reviewing the annual operating performance data of the four regional enterprises, each evaluation subject gives the corresponding evaluation data on each indicator for the benefit evaluation (Table 4).
(2)
According to Equations (3)–(11), the initial indicator data is standardized and the standardized decision matrix R can be obtained.
R T = [ 1.0000 0.3206 0 0.3658 1.0000 0.4177 0 0.6741 1.0000 0.4127 0 0.5494 1.0000 0.4328 0 0.8145 ( 0.5 , 0.75 , 1 ) ( 0.5 , 0.75 , 1 ) ( 0.25 , 0.5 , 0.75 ) ( 0.75 , 1 , 1 ) 0 0.6154 1.0000 0 0 0.2300 0.1053 1.0000 ( 0.75 , 1 , 1 ) ( 0.75 , 1 , 1 ) ( 0.5 , 0.75 , 1 ) ( 0.75 , 1 , 1 ) [ 0.2353 , 0.6471 ] [ 0.4706 , 1.0000 ] [ 0 , 0.5294 ] [ 0.2941 , 0.7059 ] [ 0.75 , 1 ] [ 0.5 , 0.75 ] [ 0 , 0.25 ] [ 0.25 , 0.5 ] ( 0.75 , 1 , 1 ) ( 0.75 , 1 , 1 ) ( 0.5 , 0.75 , 1 ) ( 0.5 , 0.75 , 1 ) [ 0.25 , 0.5 ] [ 0.75 , 1 ] [ 0.5 , 0.75 ] [ 0 , 0.25 ] ]
(3)
In order to fully reflect the management orientation of the group company, an expert group of six executives including the board chairman, the general manager and four assistant general managers are established to determine the weights ω j of the indicators by using AHP [46]. After checking the Consistency Ratio (CR is computed as 0.056 < 0.1 according to Ref. [46]), the results obtained can be considered consistent, which is shown in Table 5.
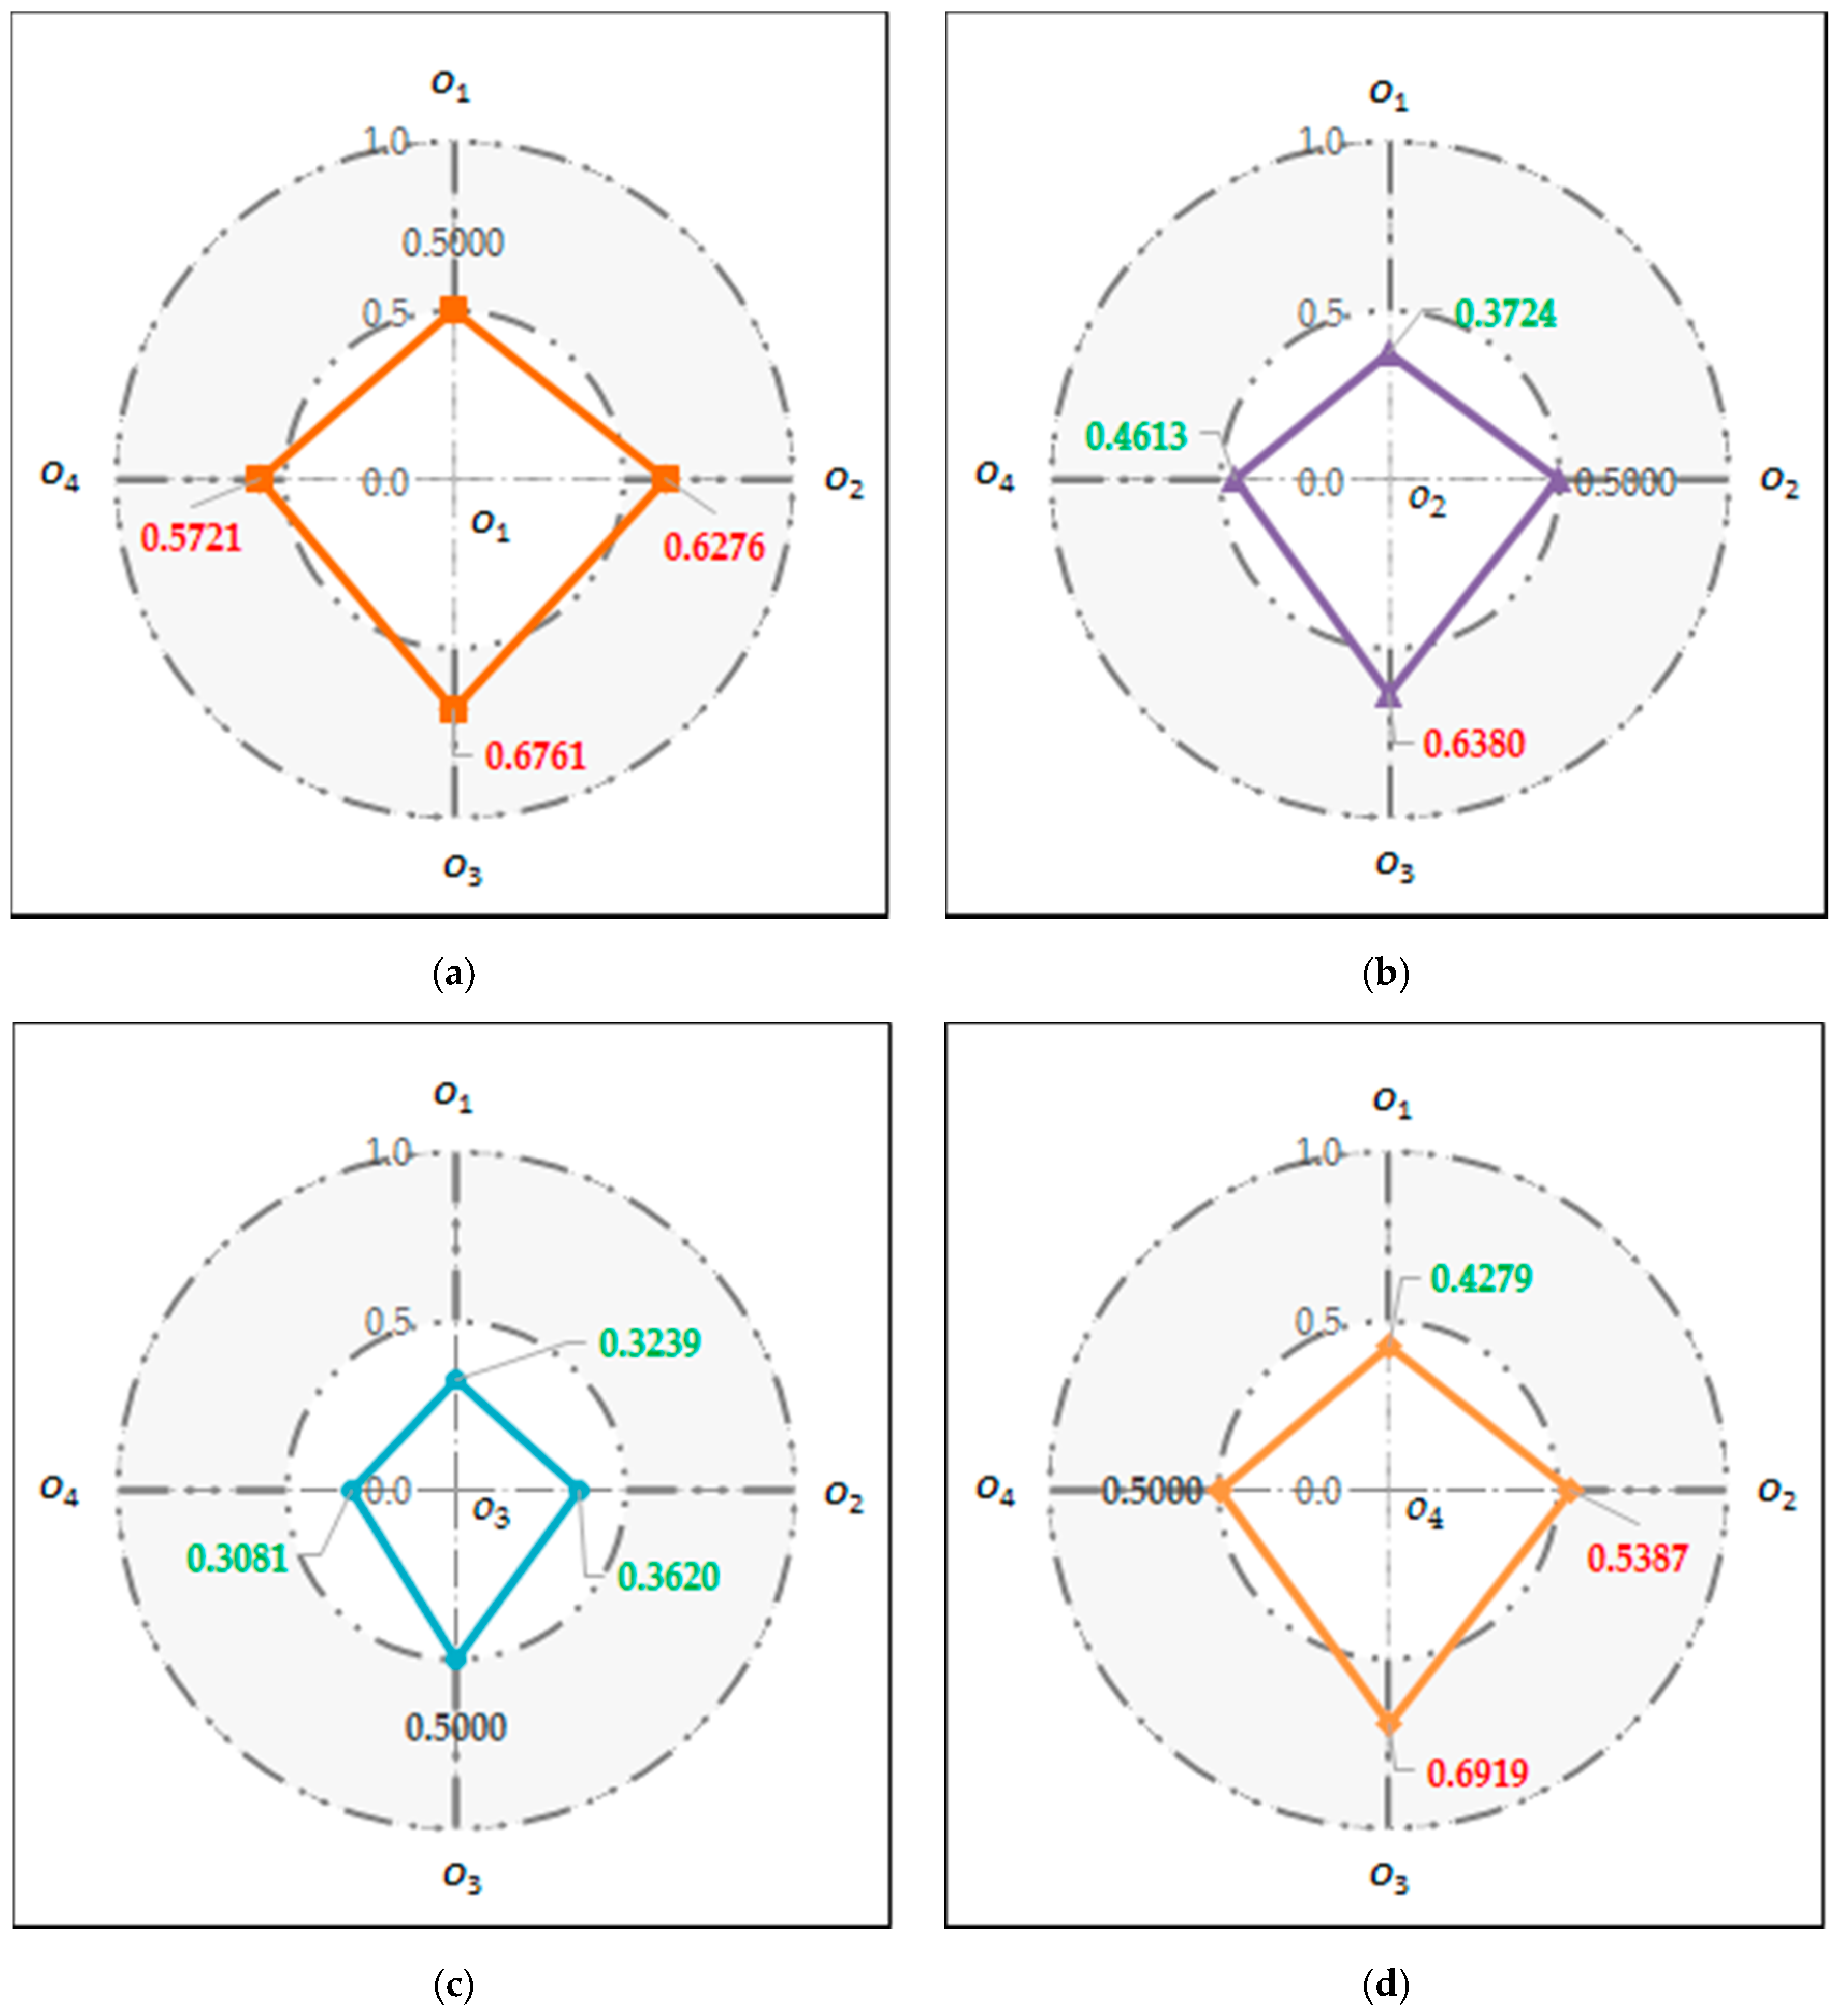
(4)
Use MATLAB to compile the program of the computational process based on the combined technique of STBI and TOPSIS proposed in this paper. Aiming at obtaining a stable and consistent result, the total number of replications sum is set as 1,000,000. Finally, the advantage rate matrix of the evaluation objects S is obtained. In order to get a better insight of the evaluation results, a graphical representation of pairwise comparisons results is shown in Figure 7.
S = [ 0.5000 0.6276 0.6761 0.5721 0.3724 0.5000 0.6380 0.4613 0.3239 0.3620 0.5000 0.3081 0.4279 0.5387 0.6919 0.5000 ]
According to Equation (23), the superior value of each evaluation object can be computed as follows:
g ( o 1 ) = c o u n t ( s 1 i > 0.5 ) + 0.5 c o u n t ( s 1 i = 0.5 ) = 3
g ( o 2 ) = c o u n t ( s 2 i > 0.5 ) + 0.5 c o u n t ( s 2 i = 0.5 ) = 1
g ( o 3 ) = c o u n t ( s 3 i > 0.5 ) + 0.5 c o u n t ( s 3 i = 0.5 ) = 0
g ( o 4 ) = c o u n t ( s 4 i > 0.5 ) + 0.5 c o u n t ( s 4 i = 0.5 ) = 2
As we can see,
g ( o 1 ) > g ( o 4 ) > g ( o 2 ) > g ( o 3 )
Combining the simulated advantage rate matrix and the calculated superior value, the ranking result of comprehensive benefit of the four regional enterprises can be concluded as below:
o 1 0.5721 o 4 0.5387 o 2 0.6380 o 3

7. Discussion

The comprehensive benefit of four regional affiliated new energy power generation enterprises are ranked using STBI and TOPSIS methods, in which Inner Mongolia (o1) obtains the highest possibility to outrank the other three regional enterprises. In order to obtain better insights from the benefit evaluation, we will probe into the weight of evaluation indicator and the corresponding evaluation data of different enterprises.
Table 2 shows that the indicators affiliated with economic benefit obtain much more attention from the parent company (X13 ranks the first, X11 the second, X14 the fourth and X11 the fifth), which is consistent with the goal of benefit promotion in energy development during the “Thirteenth Five-Year Plan” period. Meanwhile, the indicators affiliated with operation quality comes second (X21 ranks the third and X23 the sixth), which reflects one of the essential goal and benchmark for energy development in china, as mentioned in “Thirteenth Five-Year Plan for Energy Development”, is to reduce the comprehensive energy utilization cost. As we all know, currently, wind power, solar power and biomass power have relatively higher generation costs than the traditional fossil fuels, so the operation cost is one of the main concerns while evaluating the comprehensive benefit of new energy power generation enterprises. Moreover, the massive curtailment of wind power and solar power is still a serious problem, therefore the annual utilization hours have been given much consideration by the parent company for the benefit evaluation of affiliated enterprises.
In accordance with the real situation, as shown in Table 3, Inner Mongolia (o1) owns the best performance in both the absolute value and the relative growth rate of power generation capacity and total profit compared to the other regional enterprises and the total weights of the four corresponding indicators account for more than 50% of the total. At the same time, the indicators X31, X32 and X41 show the best performance, too. Although indicators X22 and X23 obtains the lowest value, the weights of the two indicators are not large. Accordingly, the possibility that the benefit of Inner Mongolia (o1) enterprise is the best among the four affiliated enterprises is maximal.
For the regional enterprise of Yunnan (o4), the indicators X11, X12, X13 and X14 obtain the second-best performance and X23 and X31 have the best performance. Taking the indicator data as well as weights into consideration, the benefit of Yunnan (o4) shows a possibility to be the second ranking among four affiliated enterprises. For the regional enterprise of Shandong (o3), there are eight indicators with the lowest performance and the combined weights are large, which leads to a high possibility that the benefit of Shandong (o3) is the worst.
From the evaluation results and the analysis above, it can be seen that
(1)
As we can see, the evaluation results based on the combined technique of STBI and TOPSIS present in probabilities that one evaluation subject is superior to one another. Such a ranking form as this is consistent with diverse types of evaluation information given by different evaluation subjects and can be more acceptable by the evaluation objects than the traditional absolute ranking results, especially when the benefit evaluation of group-affiliated new energy power generation enterprises is put into trail use in the early stage.
(2)
Based on the newly constructed benefit evaluation system, new energy power generation enterprises affiliated with a new energy group should focus on both improving the efficiency for their existing capacity but also securing high efficiency for their newly installed capacity instead of blindly pursuing a quantitative accumulation of the installed capacity, which means that, in order to improve economic benefit, it is necessary for the enterprises to maintain a healthy development pattern of higher growth of power generation capacity than average growth of installed capacity and higher growth of profit than that of power generation capacity.
(3)
Effective measures should be taken by both the parent company and the new energy power generation enterprises to reduce operation costs including construction costs, power costs and finance costs and optimize the marketing mechanism under new circumstances and proactively engaged in market transactions to reduce the curtailment of wind power and solar power and further improve power utilization hours.
(4)
Technical progress and its widely application is the basic way to reduce the new energy power costs, which has been highly stressed by the Chinese government in the “Thirteenth Five-Year Plan for Renewable Energy Development”. Therefore, it is essential for new energy generation groups to strengthen technical innovation and the application of new technology throughout the group. Meanwhile, technical progress is strongly supported by a large number of talent. Thus, talent introduction, training and accumulation is also a major task for new energy power generation groups.

8. Conclusions

This paper presents a novel model for evaluating comprehensive benefit of group-affiliated new energy power generation enterprises. First, we construct a multi-angle evaluation indicator system including four aspects of economic benefit, operation quality, technical sustainability and talent reserve. Second, the evaluation framework to aggregate all the needed evaluation information is built. Then, the evaluation model of a combined technique of STBI and TOPSIS has been proposed in the paper. Since the indicator data given by different evaluation subjects is characterized by multi-source and multi-form, in order to avoid information loss, STBI is employed to transform the indicator data into a RN, IN or TFN among the standard numerical intervals and a simulation with a million replications s is used to obtain the possible ranking result based on the random numbers obeying a certain distribution generated in each replication, while TOPSIS is adopted to assess the comprehensive benefit of each affiliated enterprise. Finally, the paper puts the indicator system and comprehensive evaluation model into the context of empirical research, combined with the actual data of Huaneng Renewables Group and its affiliated four regional new energy power generation enterprises. The results have demonstrated great consistency with the actual situation, which indicates that the method proposed in this paper has great potential for evaluating and ranking the benefit of group-affiliated new energy power generation enterprises and has a certain reference value.
Although the results obtained from this method are highly consistent with the actual situation, the proposed method can still be improved. It is worth mentioning that the data prepossessing methods used may have an indirect impact on the evaluation results obtained, so the comparisons of different data prepossessing methods should be analyzed in the future research. Furthermore, an application software based on the proposed method can be developed to quickly calculate and analyze the comprehensive benefit of the affiliated enterprises for new energy generation groups.

Acknowledgments

This study is supported by the Natural Science Foundation of China (Project No. 71772060) and the Fundamental Research Funds for the Central Universities (2016XS85).

Author Contributions

All authors have contributed to this paper. Wenyin Yang designed the model, analyzed the data and completed the paper in English. Lin Liu initiated the project and gave guidance for the methods. Xiaobao Yu provided some ideas to enrich the first draft and to form the final draft.

Conflicts of Interest

The authors declare no conflict of interest.

References

  1. Ji, H.; Niu, D.X.; Wu, M.; Yao, D. Comprehensive Benefit Evaluation of the Wind-PV-ES and Transmission Hybrid Power System Consideration of System Functionality and Proportionality. Sustainability 2017, 9, 65. [Google Scholar] [CrossRef]
  2. National Development and Reform Commission, National Energy Administration. The Thirteenth Five-Year Plan for Energy Development; National Development and Reform Commission, National Energy Administration: Beijing, China, 2016. [Google Scholar]
  3. National Development and Reform Commission, National Energy Administration. The Thirteenth Five-Year Plan for Renewable Energy Development; National Development and Reform Commission, National Energy Administration: Beijing, China, 2016. [Google Scholar]
  4. Zhang, X.G.; Wang, D.; Liu, Y.H.; Yi, H.T. Wind Power Development in China: An Assessment of Provincial Policies. Sustainability 2016, 8, 734. [Google Scholar] [CrossRef]
  5. Li, B.; Pan, A.L. Research on the Three-dimensional Structure Analyzing and Value Correlation Testing of Parent-Subsidiary Corporations’ Synergy. Nankai Bus. Rev. 2014, 17, 76–84. (In Chinese) [Google Scholar]
  6. Henri, J.F. Management Control Systems and Strategy: A Resource-Based Perspective. Account. Organ. Soc. 2006, 31, 529–558. [Google Scholar] [CrossRef]
  7. Yu, S.K.; Yang, W.Y. Information Integrated Method in Enterprise-Department Performance Appraisal Based on Network Organization. Chin. J. Manag. Sci. 2017, 25, 176–183. (In Chinese) [Google Scholar]
  8. Herrera, F.; Herrera-Viedma, E.; Chiclana, F. Multiperson Decision-Making Based on Multiplicative Preference Relations. Eur. J. Oper. Res. 2001, 129, 372–385. [Google Scholar] [CrossRef]
  9. Guo, Y.J. Comprehensive Evaluation Theory, Method and Application; Science Press: Beijing, China, 2007; pp. 14–100. [Google Scholar]
  10. Li, C.B.; Liu, Y.Q.; Li, S.K. Risk Evaluation of Qinghai–Tibet Power Grid Interconnection Project for Sustainability. Sustainability 2016, 8, 85. [Google Scholar] [CrossRef]
  11. Xu, Z.S. Linguistic Decision Making: Theory and Methods; Science Press: Beijing, China, 2008; pp. 1–10. [Google Scholar]
  12. Li, N.N.; Zhao, H.R. Performance evaluation of eco-industrial thermal power plants by using fuzzy gra-vikor and combination weighting techniques. J. Clean. Prod. 2016, 135, 169–183. [Google Scholar] [CrossRef]
  13. Grabisch, M. The application of fuzzy integrals in multicriteria decision making. Eur. J. Oper. Res. 1996, 89, 445–456. [Google Scholar] [CrossRef]
  14. Taylan, O.; Kaya, D.; Demirbas, A. An integrated multi attribute decision model for energy efficiency processes in petrochemical industry applying fuzzy set theory. Energy Convers. Manag. 2016, 117, 501–512. [Google Scholar] [CrossRef]
  15. Liang, D.C.; Liu, D.; Pedrycz, W.; Hu, P. Triangular fuzzy decision-theoretic rough sets. Int. J. Approx. Reason. 2013, 54, 1087–1106. [Google Scholar] [CrossRef]
  16. Zhang, X.Z.; Zhu, C.X. Generalized precedence order method with ranking preference for multi-attribute decision making. Syst. Eng.-Theory Pract. 2013, 33, 2852–2858. (In Chinese) [Google Scholar]
  17. Wu, Y.N.; Xu, H.; Xu, C.B.; Chen, K.F. Uncertain multi-attributes decision making method based on interval number with probability distribution weighted operators and stochastic dominance degree. Knowl.-Based Syst. 2016, 113, 199–209. [Google Scholar] [CrossRef]
  18. Xu, Z.S.; Da, Q.L. Research on Method for Ranking Interval Numbers. Syst. Eng. 2001, 19, 94–96. (In Chinese) [Google Scholar]
  19. Sevim, C. Economic Evaluation of Onshore Wind Energy Plants for Turkey. Energy Sour. B Econ. Plan. Policy 2010, 5, 308–313. [Google Scholar] [CrossRef]
  20. Ortegaizquierdo, M.; Río, P.D.; Kazmerski, L. Benefits and costs of renewable electricity in Europe. Renew. Sustain. Energy Rev. 2016, 61, 372–383. [Google Scholar] [CrossRef]
  21. Yang, J.; Song, D.; Wu, F. Regional variations of environmental co-benefits of wind power generation in china. Appl. Energy 2017, 206, 1267–1281. [Google Scholar] [CrossRef]
  22. Botelho, A.; Pinto, L.M.C.; Lourenço-Gomes, L.; Valente, M.; Sousa, S. Social sustainability of renewable energy sources in electricity production: An application of the contingent valuation method. Sustain. Cities Soc. 2016, 26, 429–437. [Google Scholar] [CrossRef]
  23. Dvořák, P.; Martinát, S.; Dan, V.D.H.; Frantál, B.; Turečková, K. Renewable energy investment and job creation; a cross-sectoral assessment for the Czech Republic with reference to EU benchmarks. Renew. Sustain. Energy Rev. 2017, 69, 360–368. [Google Scholar] [CrossRef]
  24. Ferreira, P.; Vieira, F. Evaluation of an offshore wind power project: Economic, strategic and environmental value. World Acad. Sci. Eng. Technol. 2010, 47, 161–166. [Google Scholar]
  25. Carneiro, P.; Ferreira, P. The economic, environmental and strategic value of biomass. Renew. Energy 2012, 44, 17–22. [Google Scholar] [CrossRef] [Green Version]
  26. Saaty, T.L. Decision-making with the AHP: Why is the principal eigenvector necessary. Eur. J. Oper. Res. 2003, 145, 85–91. [Google Scholar] [CrossRef]
  27. Zhao, H.R.; Li, N.N. Performance Evaluation for Sustainability of Strong Smart Grid by Using Stochastic AHP and Fuzzy TOPSIS Methods. Sustainability 2016, 8, 129. [Google Scholar] [CrossRef]
  28. Niemira, M.P.; Saaty, T.L. An analytic network process model for financial-crisis forecasting. Int. J. Forecast. 2004, 20, 573–587. [Google Scholar] [CrossRef]
  29. Tang, Y.; Sun, H.H.; Y, Q.; W, Y.B. The selection of key technologies by the silicon photovoltaic industry based on the Delphi method and AHP (analytic hierarchy process): Case study of China. Energy 2014, 75, 474–482. [Google Scholar] [CrossRef]
  30. Cavallaro, F.; Zavadskas, E.K.; Raslanas, S. Evaluation of Combined Heat and Power (CHP) Systems Using Fuzzy Shannon Entropy and Fuzzy TOPSIS. Sustainability 2016, 8, 556. [Google Scholar] [CrossRef]
  31. Li, Y.B.; Yu, X.Y.; Wang, Z.J. Research on the risk assessment of photovoltaic power generation project based on grey correlation degree and TOPSIS method. Power Grid Technol. 2013, 6, 1514–1519. (In Chinese) [Google Scholar]
  32. Dong, X.; Guo, J.; Höök, M.; Pi, G. Sustainability Assessment of the Natural Gas Industry in China Using Principal Component Analysis. Sustainability 2015, 7, 6102–6118. [Google Scholar] [CrossRef]
  33. Xu, X.M.; Niu, D.X.; Qiu, J.P.; Wu, M.Q.; Wang, P.; Qian, W.Y.; Jin, X. Comprehensive Evaluation of Coordination Development for Regional Power Grid and Renewable Energy Power Supply Based on Improved Matter Element Extension and TOPSIS Method for Sustainability. Sustainability 2016, 8, 143. [Google Scholar] [CrossRef]
  34. Li, W.W.; Yi, P.T.; Guo, Y.J. Blended Evaluation Information Random Transformation Methods and Its Application. Control Decis. 2014, 29, 753–758. (In Chinese) [Google Scholar]
  35. Yi, P.T.; Zhang, D.N.; Guo, Y.J. The Study on a Stochastic Simulation Solution Method of Comprehensive Evaluation and Application. Oper. Res. Manag. Sci. 2009, 18, 97–106. (In Chinese) [Google Scholar]
  36. Yi, P.T.; Li, W.W.; Guo, Y.J. Information Integrated Framework and Its Algorithm of Generic Comprehensive Evaluation and the Applications. Chin. J. Manag. Sci. 2015, 23, 131–138. (In Chinese) [Google Scholar]
  37. Baležentis, T.; & Streimikiene, D. Multi-criteria ranking of energy generation scenarios with Monte Carlo simulation. Appl. Energy 2017, 185, 862–871. [Google Scholar] [CrossRef]
  38. Blanco, M.I. The economics of wind energy. Renew. Sustain. Energy Rev. 2009, 13, 1372–1382. [Google Scholar] [CrossRef]
  39. Hepbasli, A. A key review on exergetic analysis and assessment of renewable energy resources for a sustainable future. Renew. Sustain. Energy Rev. 2008, 12, 593–661. [Google Scholar] [CrossRef]
  40. Martin, J.; Ramsey, D. The economics of wind energy. J. Appl. Corp. Financ. 2010, 21, 100–109. [Google Scholar] [CrossRef]
  41. Timilsina, G.R.; Kurdgelashvili, L.; Narbel, P.A. Solar energy: Markets, economics and policies. Renew. Sustain. Energy Rev. 2012, 16, 449–465. [Google Scholar] [CrossRef]
  42. Seetharaman, A.; Sandanaraj, L.L.; Moorthy, M.K.; Saravanan, A.S. Enterprise framework for renewable energy. Renew. Sustain. Energy Rev. 2016, 54, 1368–1381. [Google Scholar] [CrossRef]
  43. Hwang, C.L.; Yoon, K. Multiple Attribute Decision Making; Spring-Verlag: Berlin, Germany, 1981. [Google Scholar]
  44. Ümran, Ş.; Eren, M.; Shiraz, S.E.; Gezder, V.; Şengül, A.B. Fuzzy TOPSIS method for ranking renewable energy supply systems in Turkey. Renew. Energy 2015, 75, 617–625. [Google Scholar]
  45. Zadeh, L.A. Fuzzy sets. Inf. Control 1965, 8, 338–353. [Google Scholar] [CrossRef]
  46. Shankar, K.M.; Kumar, P.U.; Kannan, D. Analyzing the drivers of advanced sustainable manufacturing system using AHP approach. Sustainability 2016, 8, 824. [Google Scholar] [CrossRef] [Green Version]
Figure 1. Common organizational structure of a new energy power generation group.
Sustainability 10 00024 g001
Figure 2. Benefit evaluation indicator system of group-affiliated new energy power generation enterprises.
Sustainability 10 00024 g002
Figure 3. The process of evaluation standards formulation.
Sustainability 10 00024 g003
Figure 4. Integrated framework of evaluation information of group-affiliated new energy power generation enterprises.
Sustainability 10 00024 g004
Figure 5. The illustration of transformation from an ON to an IN.
Sustainability 10 00024 g005
Figure 6. The Evaluation procedure based on the combined technique of STBI and TOPSIS.
Sustainability 10 00024 g006
Figure 7. Advantage rate of pairwise comparisons of the four regional enterprises. (a) advantage rates of o1 compared to others; (b) advantage rates of o2 compared to others; (c) advantage rates of o3 compared to others; (d) advantage rates of o4 compared to others.
Sustainability 10 00024 g007
Table 1. Cumulative installed capacity during the “Twelfth Five-Year Plan” period (unit: GW).
Energy TypePower Source TypeCumulative Installed CapacityAverage Annual GrowthGrowth Ranking
20102015
New energysolar power0.8043.18122%1
wind power29.58130.7534.6%2
biomass power5.5010.3013.4%4
Conventional energyhydropower2203208.1%5
coal-fired power6609006.4%6
gas power26.4266.0320.1%3
Table 2. The normalized linguistic term.
NotationLinguistic TermCorresponding TFN
S0Very poor(0,0,0.25)
S1Poor(0,0.25,0.5)
S2Fair(0.25,0.5,0.75)
S3Good(0.5,0.75,1)
S4Very good(0.75,1,1)
Table 3. Type of Evaluation data for each indicator.
Indicator NameData Type
Power generation capacityRN
Growth rate of power generation capacityRN
Total profitRN
Growth rate of total profitRN
Cost controlLI (T = 4)
Growth rate of installed capacityRN
Power utilization hoursRN
Production safetyLI (T = 4)
Technology innovation investmentIN
Application of advanced technologyON
Talent introduction and trainingLI (T = 4)
Talent equivalent densityON
Table 4. Indicator data of four affiliated enterprises.
Indicator Numbero1o2o3o4
X114,284,7492,572,3171,764,3912,686,241
X1236.70%18.30%5.10%26.40%
X131,118,425701,685408,791798,666
X1438.30%17.20%1.10%31.40%
X21s3(T = 4)s3(T = 4)s2(T = 4)s4(T = 4)
X2203.20%5.20%0
X231744193418312570
X24s4(T = 4)s4(T = 4)s3(T = 4)s4(T = 4)
X31[78,85][82,89][74,83][79,86]
X321243
X41s4(T = 4)s4(T = 4)s3(T = 4)s3(T = 4)
X423124
Table 5. Weights of evaluation indicators.
Indicator NumberIndicator WeightIndicator NumberIndicator Weight
X110.1526X230.0717
X120.0834X240.0709
X130.1745X310.0698
X140.0935X320.0623
X210.1079X410.0523
X220.0223X420.0388

