Green Eco-Driving Effects in Non-Congested Cities


1
Betancourt Research Group, Universidad de Extremadura, 06071 Badajoz, Spain
2
Transport Research Centre, TRANSyT, Universidad Politecnica de Madrid, 28040 Madrid, Spain
*
Author to whom correspondence should be addressed.
Sustainability 2018, 10(1), 28; https://doi.org/10.3390/su10010028
Submission received: 6 November 2017
/
Revised: 19 December 2017
/
Accepted: 20 December 2017
/
Published: 22 December 2017
(This article belongs to the Section Sustainable Engineering and Science)
Abstract
:Despite technological advances in engines and fuels, the transportation sector is still one of the largest emitters of greenhouse gas (GHG). Driving patterns, including eco-driving techniques, are a complementary measure for saving GHG emissions. Most eco-driving studies so far have been conducted in large cities suffering chronic congestion problems. The aim of this research is therefore to analyse the potential of driver behaviour for reducing emissions in a small non-congested city. Driver performance parameters such as travel speeds, number of stops, revolutions per minute, and maximum acceleration-deceleration are also studied. The methodology is designed to measure the effect of both eco-driving and eco-routing under real traffic conditions. A campaign was carried out in the city of Caceres (Spain) to collect data on various types of roads under different traffic conditions. This research concludes that eco-driving leads to CO2 savings on all routes and road types of 17% in gasoline engines and 21% in diesel, although travel times are increased by 7.5% on average. The shortest route is also the most ecological, regardless of the traffic volume and characteristics, implying that consumption in non-congested cities depends mainly on distance travelled rather than driving patterns in terms of number of stops, speed and acceleration.
1. Introduction
Greenhouse gas (GHG) emissions and overconsumption of energy resources pose a global problem in terms of both their causes and consequences [1]. The transportation sector is one of the largest emitters of GHG [2], despite advances in the field of engine technology and improvements in fuel quality. This sector accounted for 25.6% of global energy consumption in 2015, and transportation energy use is expected to increase by 1.1% every year until 2040 [3].
Public authorities have different ways of achieving environmental objectives: promoting social changes in mobility patterns to achieve greater use of cleaner modes, improving vehicle technology and fuel [4], reducing the number of motorized journeys through demand management [5], and using information and communication technologies (ICT) to improve transport efficiency [6].
However, these objectives can only be achieved with the contribution of the consumer. Some policies need to be accepted by the public, while others depend directly on the mode of driving and on travel decisions. These measures include efficient driving or eco-driving, which has major potential for individual fuel savings, e.g., Xia et al. [7] developed an eco-driving velocity planning methodology, showing individual vehicle fuel consumption and CO2 reductions of around 10–15% depending on corridor parameters (including traffic volume and speed), and on the other hand, Ahn and Rakha [8] achieved significant improvements to energy and air quality (6–7% fuel and CO2 savings) when drivers utilize a slower route although they incur additional travel time.
The Spanish Energy Saving and Efficiency Action Plan 2011–2020 [9] considers the efficient driving of private cars to be a key measure for achieving energy savings over the next few years. Specifically, by 2020 this practice is expected to produce significant energy savings in Spain of 493 ktoe (5.5% of the total estimated savings for the entire transportation sector) and to avoid emissions for a value of 1703 ktCO2. In order to achieve its objectives, the plan lays down some clear guidelines to encourage the rational use of transport modes and to promote demand management policies for route optimization and efficient driving.
Real-life automotive research done in EU context has identified the potential of driving styles for reducing consumption and CO2 emissions [10]. It also highlights the need to provide real-time data to use the infrastructures in the most efficient way possible. There are many devices and technologies available for travel planning but whose potential has not yet been quantified to enable a more efficient use of transport infrastructures (including eco-driving and eco-routing).
In this context, efficient driving aimed at reducing fuel consumption by modifying driver behaviour has increased in importance since the 1990s. However, this simple definition includes many concepts and strategic actions, depending on the level of decision-making considered [11]:
- Strategic decisions: vehicle selection and maintenance.
- Operational decisions: driving style geared to maintaining a constant speed, smooth acceleration, etc.
- Tactical decisions: route selection and vehicle load.
This research focuses on the analysis of two of these efficient driving actions in practice: operational (eco-driving) and tactical (eco-routing). It aims to examine their impacts on energy savings and current traffic conditions.
1.1. Eco-Driving
At the operational level, efficient fuel consumption behaviour implies moderate acceleration and braking, changing gears at low revolutions, maintaining a constant speed, and anticipating traffic to avoid stopping as much as possible [12]. Drivers must adapt their driving to become efficient, which can be achieved with awareness [13] and specific training courses [14]. Even virtual games involving driving skills are becoming increasingly common and can have a positive impact on driver behaviour. In some countries, such as The Netherlands, training in efficient driving techniques is widespread in driving schools [15].
The results of several studies show a wide variability, with individual savings of between 5% and 20% in fuel consumption [16]. However, very few studies take into account the different penetration rates of eco-drivers, and the preliminary evidence suggests that the presence of a large proportion of efficient drivers is not positive in scenarios with high traffic volumes [17,18].
García-Castro et al. [19] conducted a complete study of efficient driving in central Madrid (Spain) and concluded that:
- Eco-drivers influence not only their own vehicle driving characteristics but also the surrounding vehicles and thus the traffic flow in the corridor.
- The effects of eco-driving are not the same on a local road as on an urban motorway and also depend on the traffic volumes.
- Eco-driving behaviour could produce more congestion; driving smoothly increases distances among cars, reducing density of road use. Therefore, when traffic flow increases, eco-driving could reduce the number of car per road section, increasing congestion accordingly.
The greatest potential for eco-driving policies appears to be in areas where traffic levels are not very heavy, and yet most studies have analysed the impact of eco-driving in large cities suffering chronic congestion problems. To fill this gap, we set out to study the effects of eco-driving in a small city where traffic flow is not conditioned by peak hours or congestion.
1.2. Eco-Routing
The eco-routing concept implies choosing travel itineraries with a view to minimizing environmental impacts. Several authors have concluded that eco-route navigation has great potential for reducing fuel consumption [20,21,22,23]. However, this concept is somewhat complicated to implement, since the optimal speed profile for reducing fuel consumption and CO2 emissions may produce an increase in some types of pollutants, such as CO and HC [24,25]. Ericsson et al. [26] conclude that emissions could be reduced by around 8.2% by choosing an eco-route. Ahn and Rakha [27] report fuel savings of between 3.3% and 9.3% but not necessarily time savings. In line with this result, Kono et al. [28] estimate that eco-route practice can reduce emissions by around 9% while increasing travel times by another 9%. Perez-Prada et al. [29] evaluated the impacts of different percentages of eco-routing drivers on traffic, CO2, and NOx in the entire Madrid Region. The results showed reductions of up to 10.4% in CO2 and 13.8% in NOx in congested traffic conditions with a 90% penetration of green drivers; however, the population’s exposure to NOx increased by up to 20.2% as the results of eco-routing drivers choose a shorter route that has a higher population density.
Since all the studies so far have been done on large cities with congestion problems, there is a need to investigate the factors involved in the eco-route for small and non-congested cities. Based on the possibility of improving driving patterns to reduce GHG, and on previous work in this field [30], the aim of this research is to analyse the potential for reducing CO2 emissions from driver behaviour (eco-driving and eco-routing) in a non-congested city such as Caceres (Spain). Emissions are correlated to drivers’ performance parameters such as travel speeds, number of stops, revolutions per minute (rpm) and maximum acceleration-deceleration.
After this introductory section, Section 2 presents the methodology for testing the impacts of eco-driving and eco-routing in practice in a small city. Section 3 analyses the results and compares them with previous studies in other types of cities. The final part includes the main conclusions and possible policy recommendations based on these results.
2. Methodology
In order to achieve the aim of this research, both eco-driving and eco-routing were tested under real traffic conditions, in a campaign conducted to collect data on different road types (urban roads and access roads to the city) under different traffic conditions in a small city such as Caceres (less than 100,000 inhabitants). The field test phases were as follows:
- Campaigns were organised to collect data on driver behaviour following routes with different types of city roads and traffic conditions. Four itineraries were selected with different levels of service (LOS). Level of Service is a quality measure describing operational conditions within a traffic stream; these conditions affect to speed and travel time, freedom to maneuver, traffic interruptions, and comfort and convenience. The test was first performed with drivers driving normally, and then a second set of car runs was recorded after they had taken an eco-driving course, following the same routes and at the same times of day.
- Individual driving variations produced by eco-driving were measured using an OBD-key (KBM Systems Ltd., London, UK) installed on board (see Section 2.5), the corresponding CO2 emissions savings were estimated also.
- The combined effects of route selection and eco-driving were calculated for the different types of urban road in the test city as a proxy for eco-routing.
- Drivers were surveyed to capture changes in their way of driving and perceptions once they were trained in eco-driving techniques.
2.1. Case Study: City of Caceres, Spain
The city of Caceres is located in western Spain and has a population of 95,000 inhabitants in an area of 30 km². It is a historic city with a high density of monuments and a unique medieval urban layout and was named a World Heritage site by the UNESCO in 1986 [31]. The city today has succeeded in maintaining a moderate and constant economic growth (Caceres has had a GDP growth of 4.5% in 2015, 3.1% in 2016, and a population reduction of 323 inhabitants in the year 2017), despite a slight decline in its population, as has occurred in other similar cities and which is to a large extent due to the current economic crisis.
Caceres is formed by a protected pedestrianised historic centre and a series of urban areas that have developed slowly over time. The dominant transport mode is the car, which accounts for 55% of all the movements taking place within the city. Despite the city’s size and hilly layout, pedestrian trips account for one third of all movements, while public transportation is used for only 10% [32].
Caceres has three peak hours related to the main movements of access to the city: between 8 and 9 h, entry into jobs and schools (10% higher than the average); at 2:00 pm, coinciding with the lunch hour (28% above the average) and between 6:00 pm and 7:00 pm, the return to home takes place (15% above the average), e.g., the main street of the city center has an average of 1000 v/h per direction increasing this value until 1300 v/h at 2 pm [33].
The city of Caceres needs to implement measures to encourage further use of public transport and pedestrian mobility to make it even more sustainable. Although policies for environmental protection and emission reduction have already been applied in the historic town centre, which is mostly restricted to pedestrians, they need to be extended to the more car-dependent surrounding areas to achieve sustainability targets for the whole city.
2.2. Selecting Routes to Represent Different Road Types and Traffic Conditions
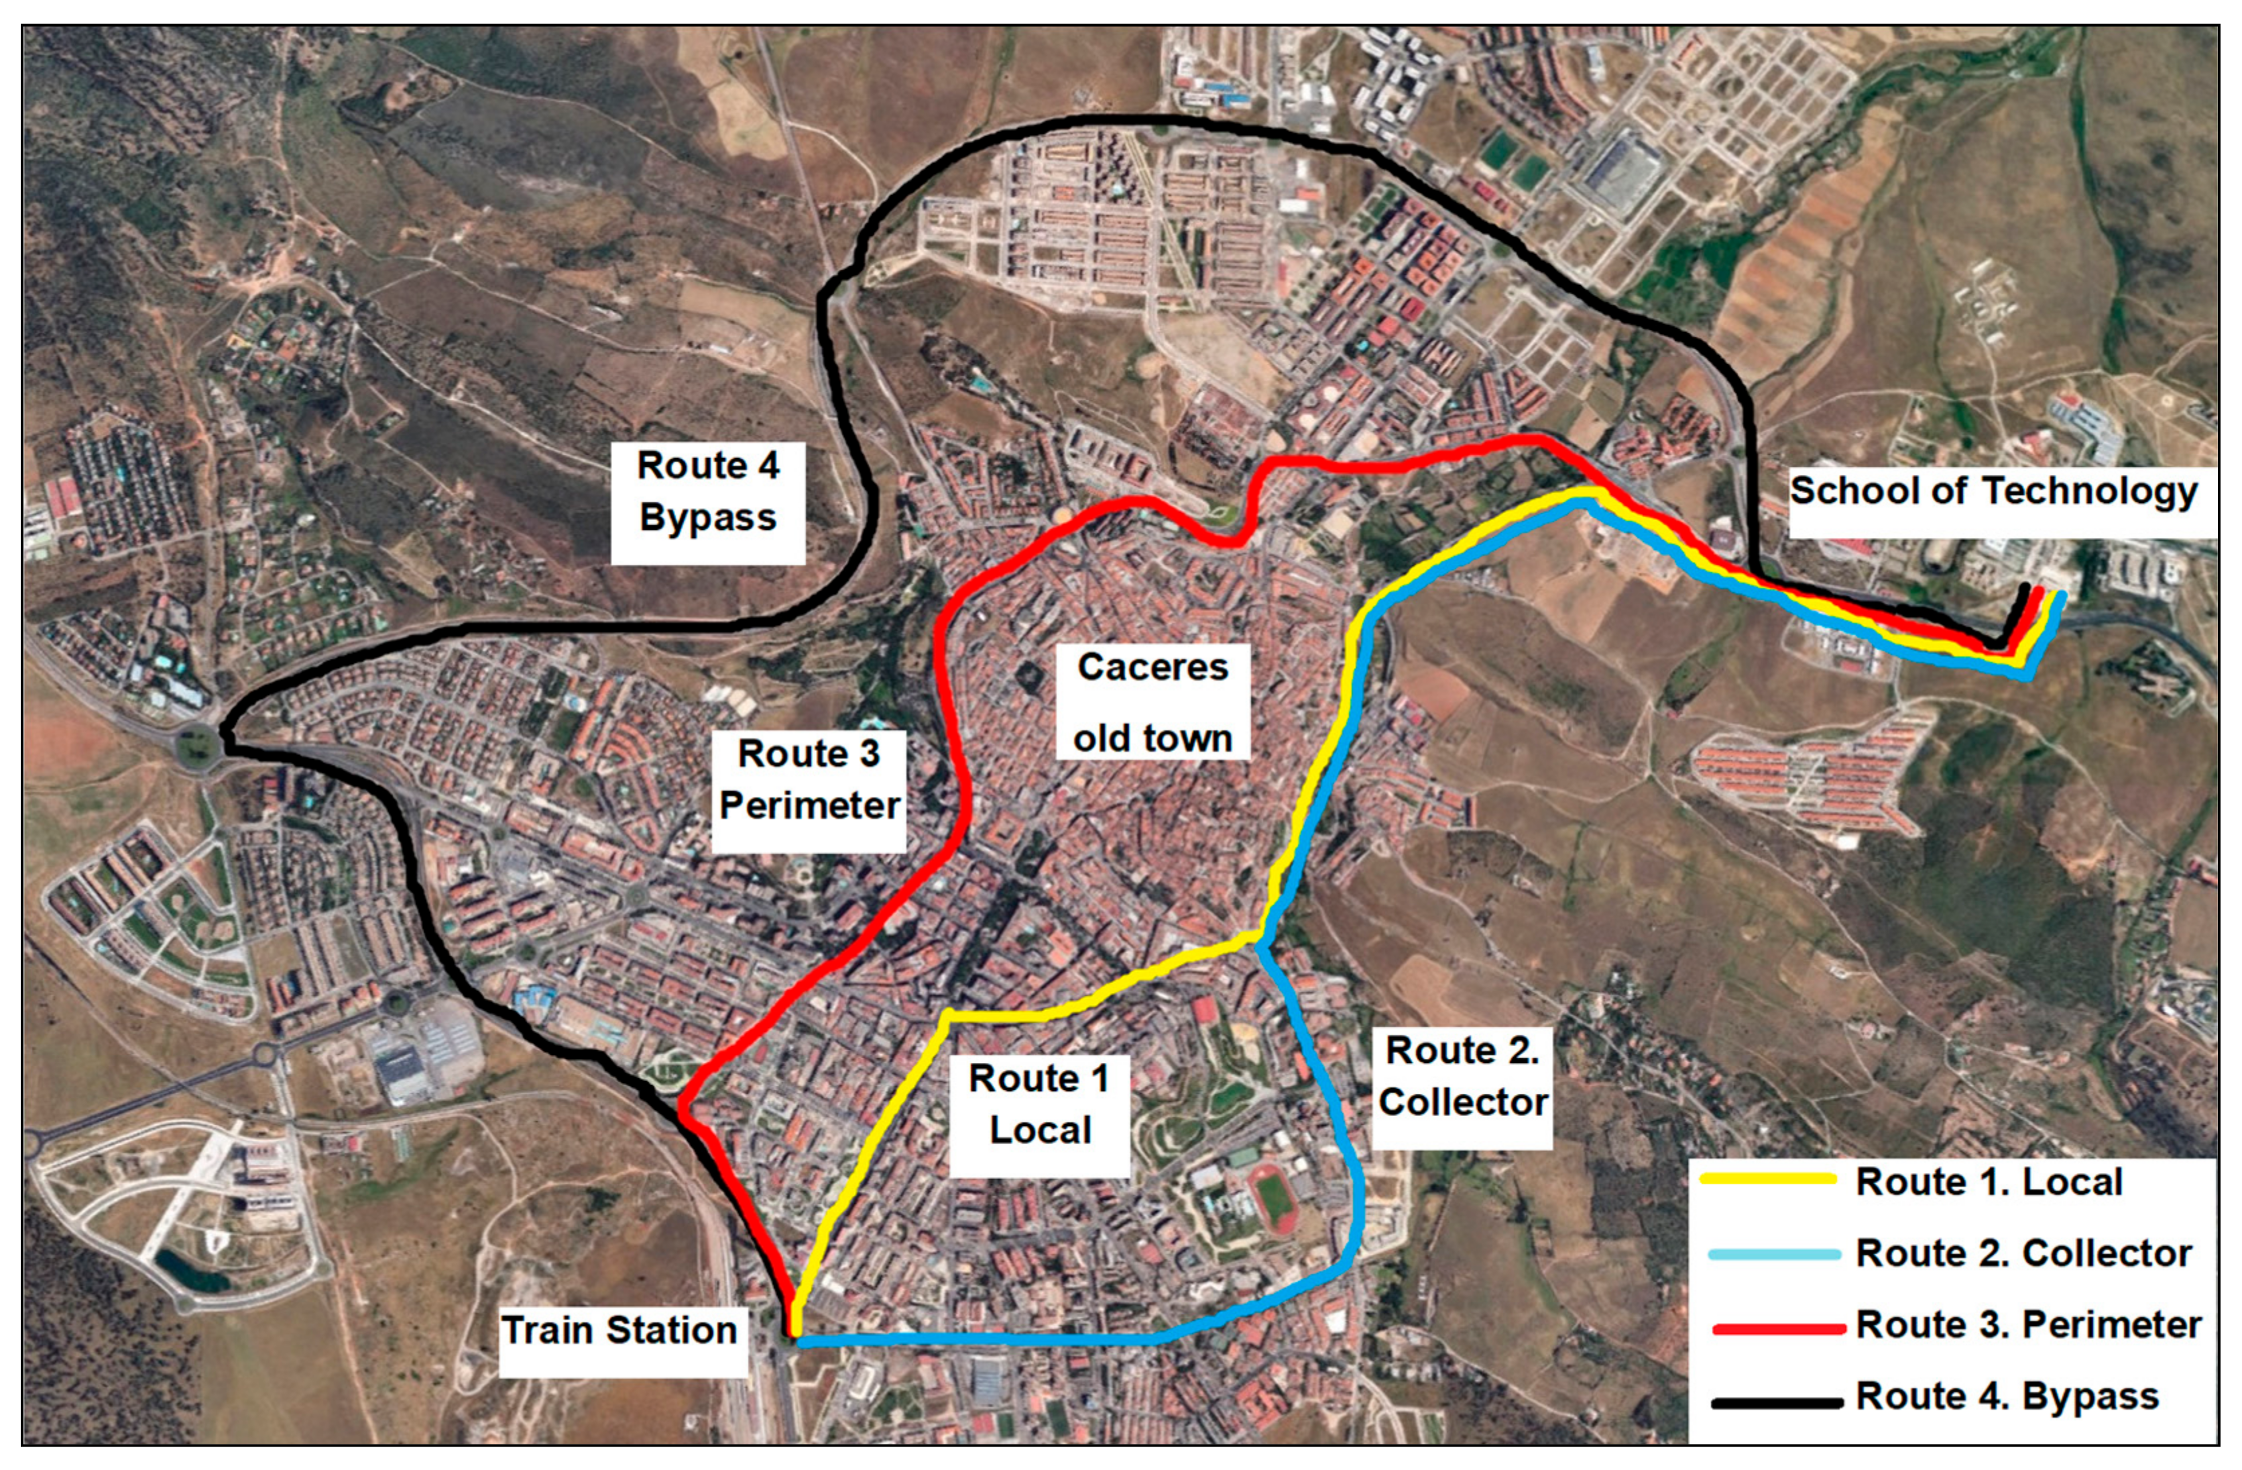
The city of Caceres is quite small and can be crossed from side by side in less than 15 min. Four test routes were selected with the same origin and destination, as shown in Figure 1. They all start from the train station located in the western part of the city and end at the School of Technology (University of Extremadura) in the eastern part. Four alternative routes with different LOS [34] were chosen to cross the city following itineraries with different characteristics and traffic volumes.
They can be ordered in terms of their increasing LOS (from lowest to highest), as follows:
Route 1 (local) runs along urban streets and passes right through the heart of Caceres city centre. It is 6.1 km long, and its travel time is around 15 min. This route has a dual carriageway with a median. Speed is limited to 50 km/h. It is regulated by traffic lights and suffers some congestion problems at peak hours.
Route 2 (collector) is 6.7 km long and its travel time is about 14 min. It is one of the most important avenues in Caceres as it provides access to the bus station, conference centre, sports arena, mortuary, and hospital, leading to some traffic delays. It also has a dual carriageway with a median, but due to its urban character, the speed limit is 50 km/h and 30 km/h in several sections.
Route 3 (perimeter) is the old bypass road, which is already integrated in the urban network. It also has a two-lane dual carriageway and a median or is demarcated by a continuous double line. The speed limit is 50 km/h. It has a length of 6.7 km and a travel time of about 13 min. It has almost no congestion.
Route 4 (bypass) follows the outer city bypass known as “Ronda Norte”. It has a length of 10.3 km and can be travelled in about 12 min. It is the longest and quickest route. It runs through the north of the city with a two-lane dual carriageway with a median. Intersections are in the form of roundabouts and pedestrian crossings regulated by traffic lights. Speed limits vary between 80 km/h and 40 km/h. Traffic is usually fluid all day.
2.3. Driver Selection, Eco-Driving Training, and Assignment
Twelve drivers of different sexes were recruited in a wide range of ages and driving types, comprising eight men and four women aged between 21 and 44, in a fairly representative sample of the driving population in the city of Caceres. (The 2016 directory of the general traffic management [35] indicates that the range between 25–44 years exceeds 51% of the census. In addition, the distribution of male/female drivers is 62% and 38%, respectively). The 12 drivers received an eco-driving course (see Appendix A) so they could deploy these techniques during the second driving week and compare the results with the first week’s driving.
During the driving test, six people were assigned to each vehicle, with two people taking turns to drive (driver and assistant, changing every hour) who iteratively performed trips along the four selected routes. They drove 12 h a day to obtain enough data on the different traffic situations (free circulation, moderate traffic, and congestion) and weather conditions (rain, fog, etc.). The driving turns were adjusted to cover peak hours according to the mobility records for Caceres [33]. The following driving turns were selected:
- 1st period. Morning peak: 7:30–11:30 am
- 2nd period. Lunchtime: 12:00–4:00 pm
- 3rd period. Evening peak: 4:30–8:30 pm
The first test was done from 2 May to 5 May 2017, and the second the following week, from 9 May to 12 May, after taking the eco-driving training course.
2.4. Experimental Car Data Collection
Caceres has a fleet of 48,554 passenger cars (approximately one vehicle for every two people), of which 60% are diesel and 40% gasoline. Two different cars were used for the data campaign, an Opel Astra 1600 cc diesel and a Fiat 500 1200 cc gasoline (Table 1). These vehicles correspond to the small (Fiat 500) and medium (Opel Astra) car segments, which represent approximately 75% of the fleet in Caceres [36]. The sample is therefore quite representative of the Caceres fleet composition. Driving was done following the experimental car method in order to reproduce the average driver behaviour.
2.5. Measured Variables
Data was collected using an OBD-key installed on board to obtain and store the parameters that define driving profiles. The geographical location of the vehicle was recorded at all times. The operating procedure is shown in Figure 2.
The following parameters were collected before and after the drivers took the eco-driving training course:
- GPS position (longitude and latitude) and distance travelled (km);
- Travel time (h);
- Instantaneous speed (km/h);
- Fuel consumption (L);
- Number of stops, rpm, acceleration, and deceleration (m/s2).
These data are necessary to measure the variation in speeds, accelerations and emissions produced by eco-driving and eco-routing at the individual level. They can be used in future research to build a micro and macro simulation.
2.6. Survey to Capture Individual Driving Perceptions
The final part of the driving experiment consisted of surveys after each driving turn. The aim was to determine any perceived differences in comfort and ease with and without eco-driving, and any other external circumstances that may have influenced the driving technique, such as weather and traffic conditions. The survey was done after each driving turn and drivers were asked to rate four questions from 1 to 7 on a Likert scale [39], shown below in Table 4. A Likert scale is a psychometric scale with multiple categories from which respondents choose to indicate their opinions, attitudes, or feelings about a particular issue. Likert-scale questionnaires have predominantly been used in research into individual difference variables, such as motivation, anxiety, and self-confidence. Some advantages of Likert-scale questionnaires are that (a) data can be gathered relatively quickly from large numbers of respondents, (b) they can provide highly reliable person ability estimates, (c) the validity of the interpretations of the data can be established through a variety of means, and (d) the data can be profitably compared, contrasted, and combined with qualitative data-gathering techniques such as open-ended questions, participant observation, and interviews.
3. Results
The performance features of the driving test in Caceres are shown in Table 2, along with the experimental statistics of distances driven by route and gender with each vehicle.
For each driving cycle, we analysed drivers’ behaviour, fuel consumption, and travel time.
3.1. Driver Behaviour
The driving variables recorded are: number of stops, rpm and the maximum acceleration-deceleration. Table 3 compares the results without vs. with eco-driving. In all routes, average rpm and accelerations are reduced when eco-driving. However, low-speed driving periods do not change significantly.
All routes except route 4 (bypass) have similar average speed values (Figure 3). Average speeds on routes 1 (local), 2 (collector), and 3 (perimeter) are below 50 km/h, so there is little room for improvement. In contrast, on route 4 (bypass)—the fastest route with the highest LOS—eco-driving reduces the time by 18% at a speed over 70 km/h. This route has fewer stops, which are further reduced when eco-driving.
Figure 4 shows the drivers’ instantaneous speed patterns in route 1 (local) and route 4 (bypass) before and after the eco-driving course. Both graphs confirm that eco-driving produces lower and more homogeneous speed profiles. The number of stops, accelerations and decelerations are higher in route 1 (local) due to the greater number of intersections and traffic lights. In route 4 (bypass), decelerations are caused by roundabouts, which are quite far apart.
These results should be considered in conjunction with the drivers’ perceptions of eco-driving. The questions and results of the questionnaire with the scores of the eco-driving experience are shown in Table 4. There were four questions: one on driving ease, the second on trip context, and the other two relating to the trip itself.
The results of the drivers’ perceptions are as follows:
- There is no significant difference in driving difficulty before and after eco-driving training. More than 90% of drivers consider vehicle handling easy (scores 1 and 2). This implies that the eco-driving technique is easy to learn and practice.
- The driving environment has very little influence, although some drivers admit to having more difficulty in bad traffic and weather conditions. Here, 74% of drivers consider the driving circumstances to be easy (scores 1 and 2) before eco-driving, while only 66% do so after eco-driving. Some 5% of eco-drivers reported difficult driving conditions (scores 6 and 7).
- The drivers’ feelings are modified with efficient driving. Here, 74% feel entertained before eco-training (scores 6 and 7) vs. 59% after eco-driving, and 15% of drivers therefore consider eco-driving to be less entertaining.
- Finally, it is worth noting that eco-driving causes a 10% decrease in drivers’ relaxation during the trip. Here, 79% of drivers are relaxed (scores 1 and 2) before eco-driving, compared to 68% who are afterwards.
Eco-driving increases boredom and driver stress, probably due to lack of experience in this type of driving. Also, eco-driving requires effort and attention which might lead to increases in stress under some circumstances (congested traffic) and boredom in others, such as when operating in uncongested areas [40]. The average speed is lower in eco-driving, making traffic smoother.
3.2. Fuel Consumption and CO2 Emissions
Table 5 shows the results for both driving modes (non-eco and eco) and fuel types (gasoline and diesel). The consumption data collected through the OBD-key were validated with the real consumption information for the two test periods, before and after eco-driving training course, and for the two types of vehicles.
There is always a clear saving in fuel consumption between conventional driving and eco-driving, and these savings are also higher for diesel than for gasoline vehicles, although the consumption rates per km are lower in the case of diesel. CO2 emissions were estimated using the technical values from Table 1. Diesel engines account for 12% and 17% lower CO2 emissions than gasoline on average in the four selected routes without and with eco-driving, respectively. Eco-driving reduces CO2 emissions by 20% in the case of gasoline and 24% for diesel.
Figure 5 includes information of consumption by type of vehicle, route and driving turns along the different times of day. Peak hours have not significantly conditioned the consumption of fuel, because Caceres is a small city where occasional congestions do not involve large delays or modify the type of driving performed.
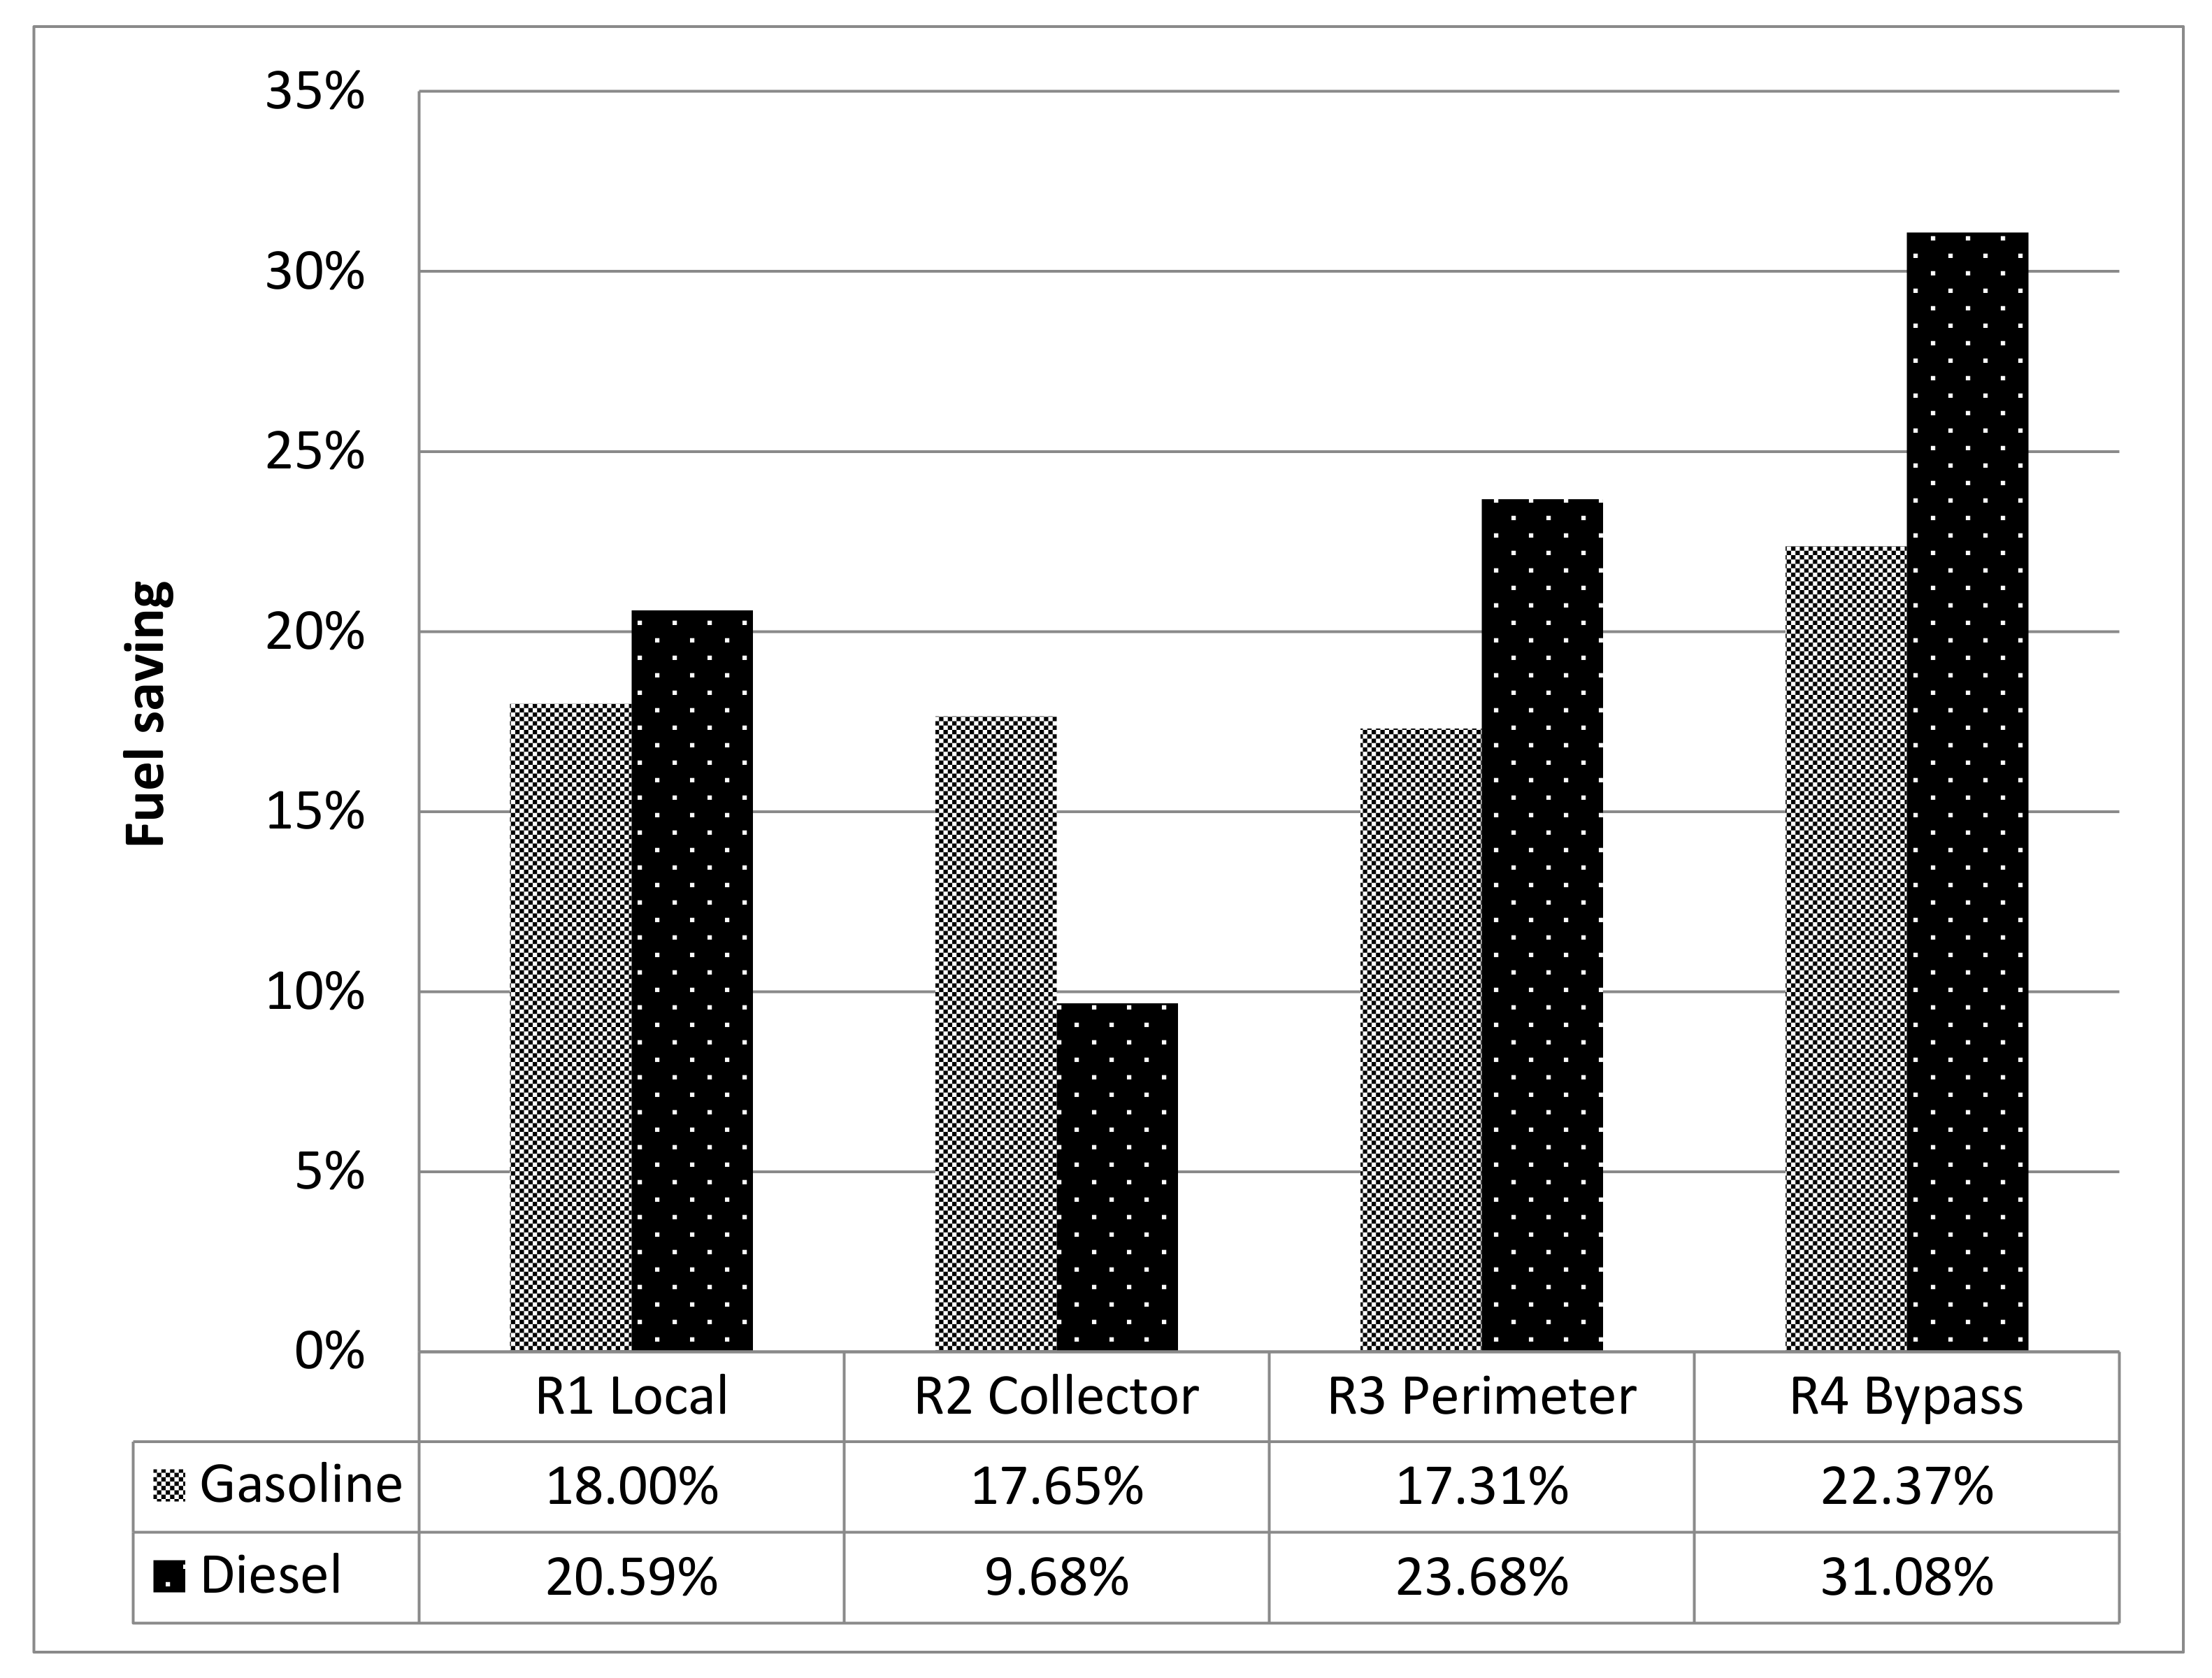
All routes have similar consumption rates (non-eco and eco-driving) for both diesel and gasoline, except for route 4 (bypass), which has higher values. The greatest savings are in route 4 (bypass), with 31% and 22% in diesel and gasoline, respectively. For the other three routes, the savings are around 17% in gasoline and 21% in diesel. This means that the greatest savings occur on the routes with the best LOS.
Figure 6 shows the fuel savings per route between conventional and eco-driving that were presented in the Table 5.
Eco-driving always produces savings compared to conventional driving, and more so in diesel than in gasoline vehicles. Since this factor is directly linked to fuel consumption, route 4 (bypass) shows the largest decrease, so eco-driving achieves better results with high fuel consumption routes. Eco-driving causes a generalized decrease in CO2 emissions in all routes. CO2 emissions depend directly on fuel consumption, so the largest decrease corresponds to route 4 (bypass) with a savings of 31% in diesel and 22% in gasoline. The route that produces the least CO2 emissions is route 1 (local) since it involves the lowest fuel consumption. The local route can therefore be considered to be the most ecological route of the four tested. This implies that in terms of CO2 emissions, shorter is better in both eco and non-eco driving styles.
3.3. Travel Times
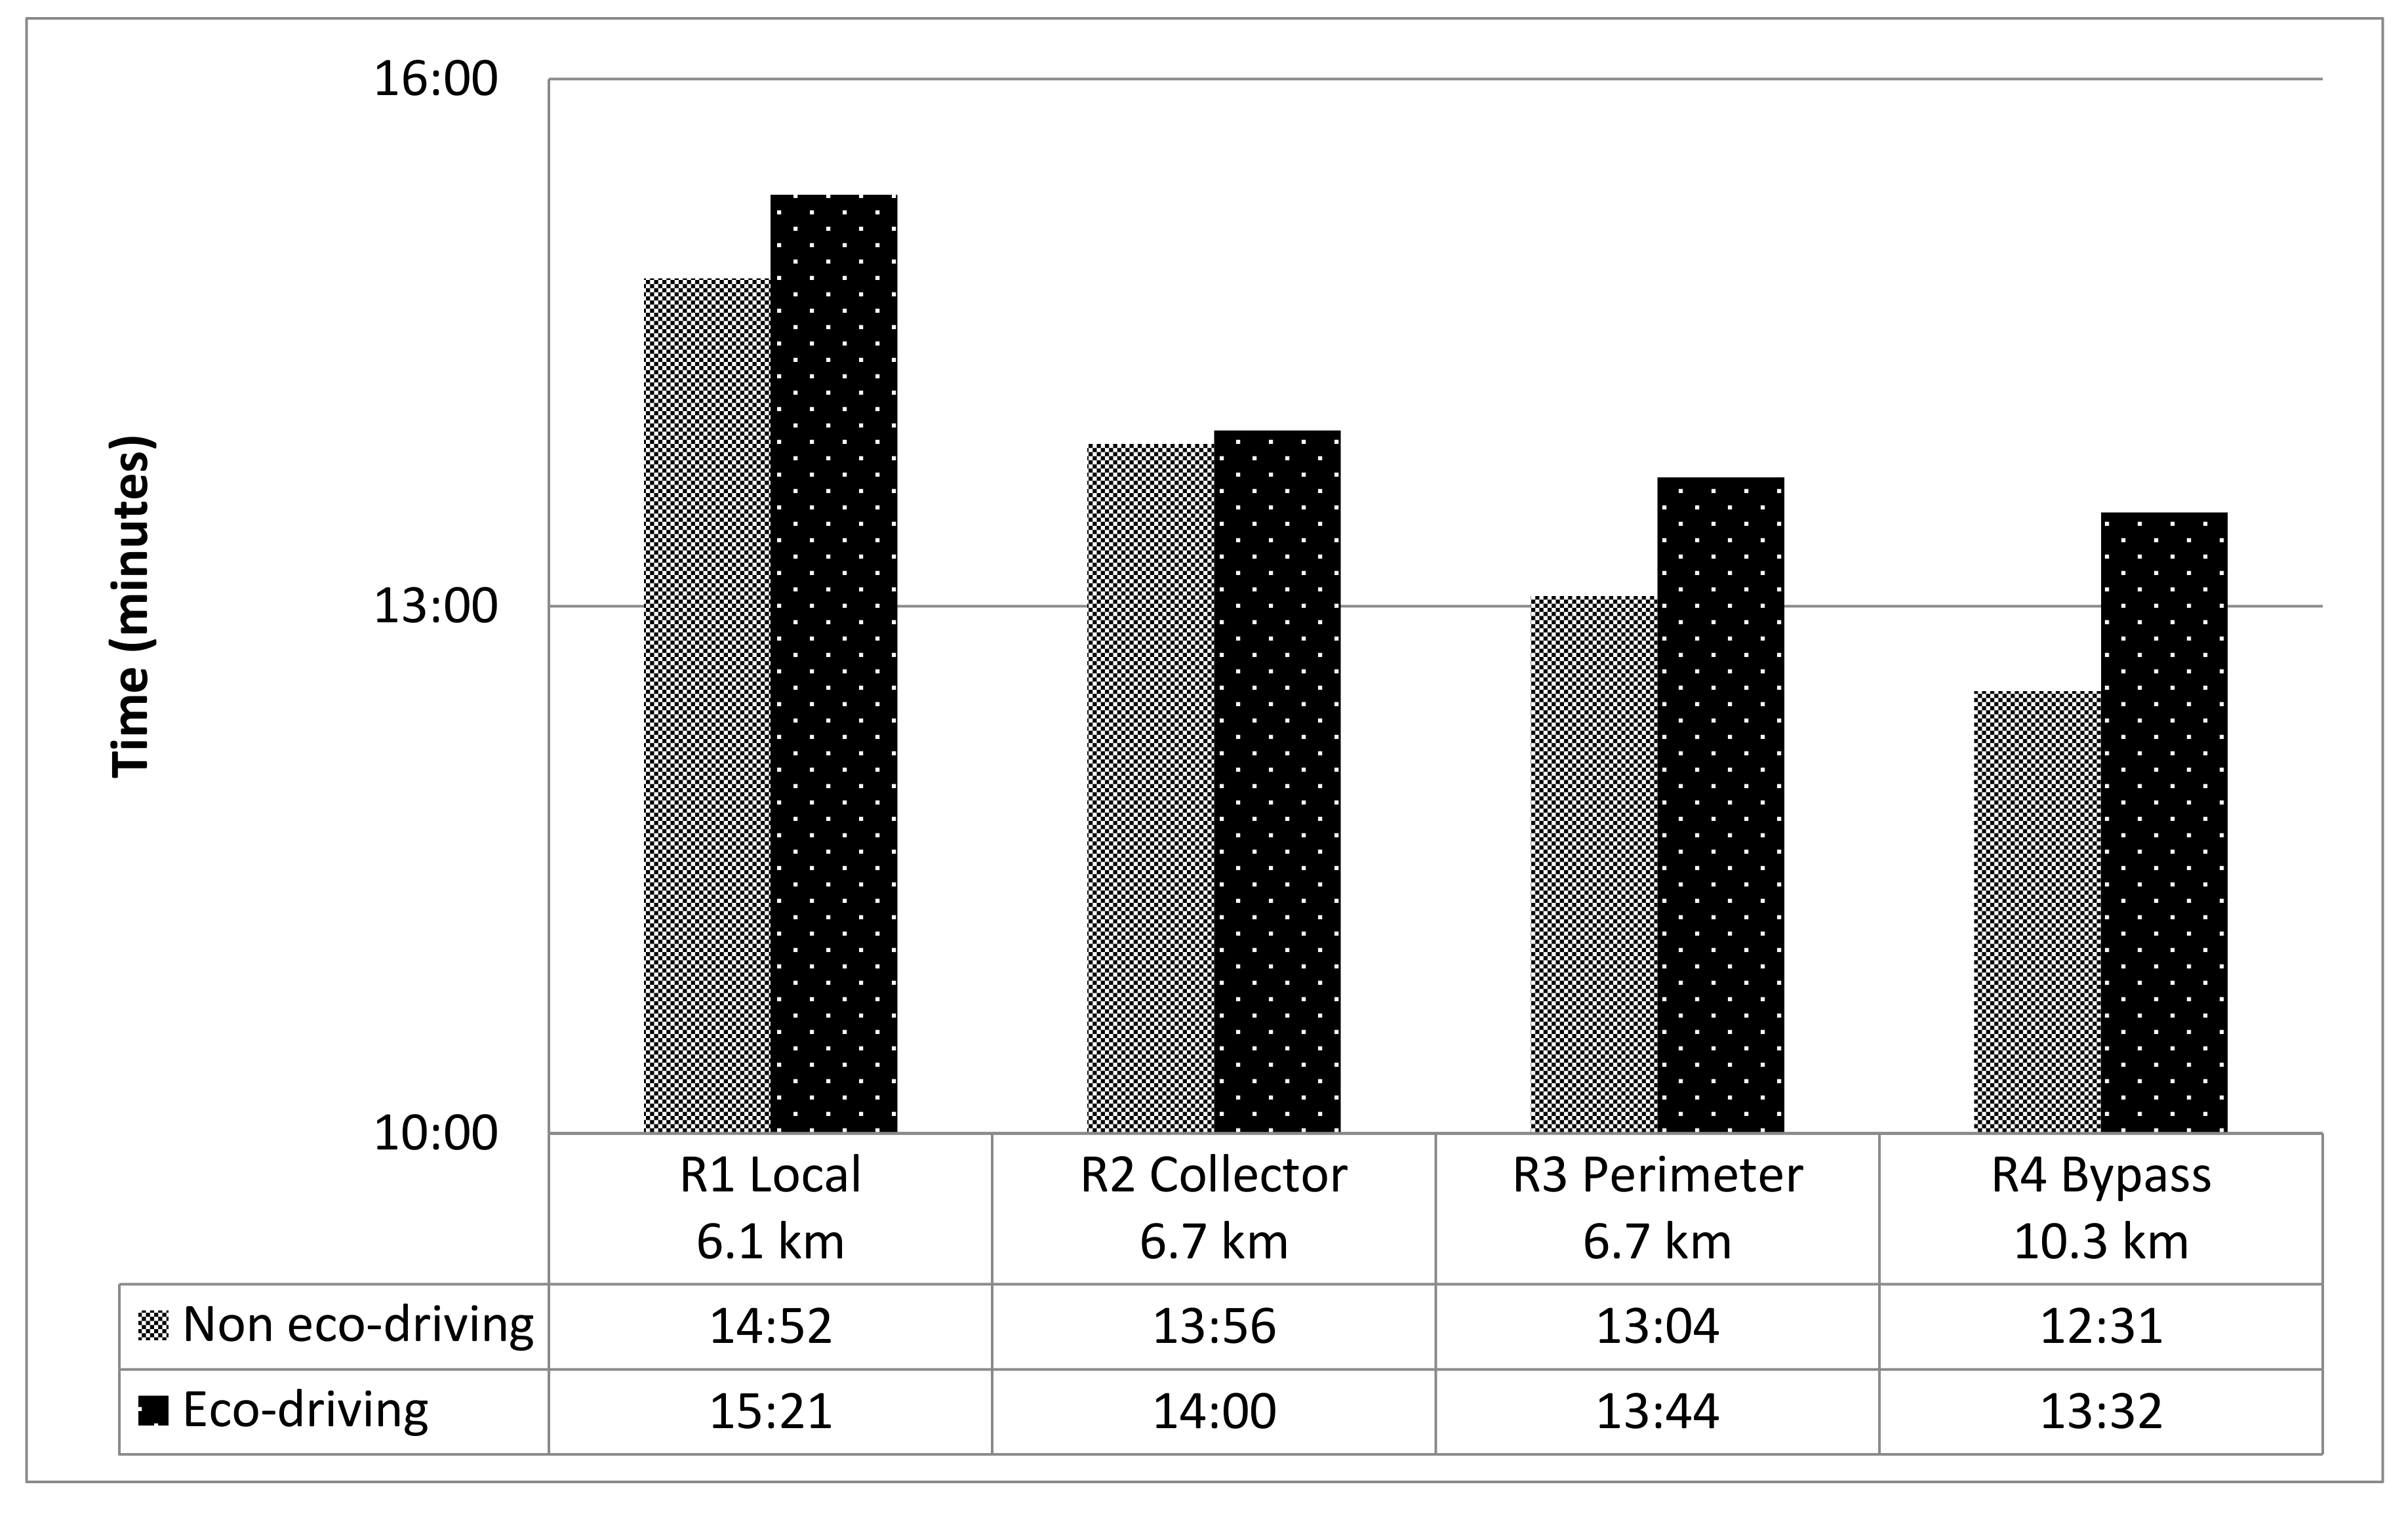
Figure 7 shows the trip times of each route. Eco-driving produces increases of around 7.5% in travel times. The fastest route is route 4 (bypass), as despite being the longest, it has a higher traffic speed with no congestion and fewer stops than the other routes. The slowest is route 1 (local), which is shorter but with more stops, which increases travel time by 10% compared to the fastest (bypass).
4. Conclusions and Policy Recommendations
The transportation sector is responsible for 20.3% of total GHG emissions in the EU-27 [41]. It is also estimated that cities account for two-thirds of fuel consumption worldwide and 70% of GHG [42]. This contribution is set to rise due to the increase in the share of the urban population. Cities are therefore key for fostering the use of clean technologies and changing drivers’ behaviour toward sustainability. Municipalities have different instruments for achieving their environmental targets, but they can only be successful with the contribution of the drivers themselves. Certain policies must be accepted by the public, and some depend directly on the mode of driving and travel decisions. These measures include efficient driving or eco-driving, which has a significant potential for individual fuel savings.
Most studies so far have been conducted in large cities due to their serious congestion problems. However, small cities also have problems and must contribute to the global goal of reducing GHG emissions. This research therefore examines the impact of eco-driving in a small city such as Caceres (Spain), where traffic flows are not affected by peak hours or congestion. The results reveal several findings in regard to eco-driving and eco-routing techniques.
Eco-driving reduces the number of stops and accelerations by maintaining speed values much more uniformly than in conventional driving, leading to a reduction in fuel consumption of around 25%. The savings are clearly higher in the bypass (route 4) as it is longer and less dependent on traffic lights and rights of way. These relative savings are higher than those reported for larger cities such as Naples, Turin, Lisbon, Madrid, London, or Beijing [43,44,45,46,47,48].
However, as in other cases reported in the literature [49,50], travel time increases with eco-driving by 7.5% on average. The results of route 4 (bypass) and the other three routes are very different. The bypass is the fastest and has the highest consumption and CO2 emission levels, and yet eco-driving is most efficient on this route and produces the greatest savings in fuel and CO2 emissions.
The eco-route is the shortest (local), indicating that consumption in non-congested cities depends mostly on the distance travelled and not on the number of stops or time spent.
Eco-driving causes boredom in drivers, which can make them unwilling to practice this technique despite the clear savings in fuel and CO2 emissions.
Bypasses in small cities improve LOS by removing cars from the city centre, leading to significant reductions in overall travel time. However, traffic on this type of road entails higher fuel consumption and CO2 emissions, so they are not positive from a strictly energetic point of view. But what would happen if all traffic were to pass through the city centre? Further research would need to model these effects at both the macro and micro level. Therefore, although in non-congested cities eco-routing corresponds to the shortest route regardless of the type of vehicle or time spent, it could generate more congestion and worsen LOS in the city centre.
The results of this study clearly show that eco-driving has very positive effects on fuel savings and CO2 emissions. As small cities do not suffer major congestion, a large proportion of efficient drivers can be expected to produce clear environmental benefits. Public authorities would therefore be advised to promote this type of driving among the public by highlighting its beneficial effects.
These results point to certain policy recommendations to reduce negative externalities from traffic even in cities that have no major problems of pollution or congestion. Small cities usually have a significant proportion of cars used for daily trips, so reducing car-based environmental impacts would therefore have a significant effect. Awareness-raising actions to promote eco-driving and select the route with lowest emissions (eco-route), in conjunction with other measures such as reducing car access and parking spaces in the city centre, would have a great potential for achieving sustainability city targets.
Acknowledgments
This work was supported in part by the national R & D programme (Ministerio de Economía y Competitividad) under the Eco-Traffic Project “Medición y Modelización de Eco-Driving táctico y operacional”. Ref TRA2016-76485-R. The authors also acknowledge the collaboration of the City of Caceres in the data collection process.
Author Contributions
Juan Francisco Coloma was responsible for collecting and processing the data from Caceres, and wrote the manuscript; Marta García coordinated the data collection in Caceres and designed some tables and figures; Yang Wang was responsible for OBD-Key data processing; Andrés Monzón coordinated the research, reviewed the manuscript and proposed changes and improvements to its structure.
Conflicts of Interest
The authors declare no conflict of interest.
Appendix A. Eco-Driving Course
The Eco-driving course consist of two parts:
Part 1—Theoretical (1 h) in a Group Class
Explaining the technical operation of the car engine and its relation to consumption, the foundations of efficient driving techniques and practicalities of eco-driving.
Part 2—Practical (1 h) Individual
Two sessions of driving, one where student drive on his own style and another one incorporating the eco-driving technique.
After a session with recommendations to implement eco-driving in each case.
References
- Ramanathan, V.; Feng, Y. Air pollution, greenhouse gases and climate change: Global and regional perspectives. Atmos. Environ. 2009, 43, 37–50. [Google Scholar] [CrossRef]
- Emberger, G. Low carbon transport strategy in Europe—A critical review. Int. J. Sustain. Transp. 2015. [Google Scholar] [CrossRef]
- Energy Information Administration. International Energy Outlook; (No. DOE/EIA-0484(2017)); DOE: Washington, DC, USA, 2017. Available online: https://www.eia.gov/outlooks/ieo/pdf/0484(2017).pdf (accessed on 30 November 2017).
- Bottiglione, F.; Contursi, T.; Gentile, A.; Mantriota, G. The fuel economy of hybrid buses: The role of ancillaries in real urban driving. Energies 2014, 7, 4202–4220. [Google Scholar] [CrossRef]
- Li, Y.; Bao, L.; Li, W.; Deng, H. Inventory and policy reduction potential of greenhouse gas and pollutant emissions of road transportation industry in China. Sustainability 2016, 8, 1218. [Google Scholar] [CrossRef]
- Lin, Y.C.; Nguyen, H.L.T. Development of an eco-cruise control system based on digital topographical data. Inventions 2016, 1, 19. [Google Scholar] [CrossRef]
- Xia, H.; Boriboonsomsin, K.; Barth, M. Dynamic eco-driving for signalized arterial corridors and its indirect network-wide energy/emissions benefits. J. Intell. Transp. Syst. 2013, 17, 31–41. [Google Scholar] [CrossRef]
- Ahn, K.; Rakha, H. The effects of route choice decisions on vehicle energy consumption and emissions. Transp. Res. Part D 2008, 13, 151–167. [Google Scholar] [CrossRef]
- Instituto para la Diversificación y Ahorro de la Energía (IDAE). Plan de Acción de Ahorro y Eficiencia Energética 2011–2020. Spain, 2011. Available online: http://www.idae.es/uploads/documentos/documentos_11905_PAEE_2011_2020._A2011_A_a1e6383b.pdf (accessed on 12 May 2017).
- FIAT ECO-DRIVE. Eco-Driving Uncovered—The Benefit and Challenges of Eco-Driving, Based on the First Study Using Real Journey Data. 2010. Available online: www.fiat.com/ecodrive (accessed on 14 December 2017).
- Sivak, M.; Schoettle, B. Eco-driving: Strategic, tactical, and operational decisions of the driver that influence vehicle fuel economy. Transp. Policy 2012, 22, 96–99. [Google Scholar] [CrossRef]
- Barkenbus, J.N. Eco-driving: An overlooked climate change initiative. Energy Policy 2010, 38, 762–769. [Google Scholar] [CrossRef]
- Ecowill. The Golden Rules of Eco-Driving. 2013. Available online: http://cieca.eu/sites/default/files/documents/projects_and_studies/ECOWILL_FINAL_REPORT.pdf (accessed on 12 May 2017).
- IDAE. Conducción Eficiente. Controlas tu Energía. 2015. Available online: http://www.controlastuenergia.gob.es/consumo-inteligente/Paginas/conduccion-eficiente.aspx (accessed on 12 May 2017).
- Wilbers, P.; Wardenaar, H. The Dutch National Ecodriving Programme Het Nieuwe Rijden: A Success Story. In ECEEE 2007 Summer Study, Saving Energy—Just Do It! ECEEE Secretariat: Stockholm, Sweden, 2007; Available online: http://www.eceee.org/static/media/uploads/site-2/library/conference_proceedings/eceee_Summer_Studies/2007/Panel_8/8.111/paper.pdf (accessed on 26 June 2017).
- Garcia-Castro, A.; Monzon, A. Using floating car data to analyse the effects of its measures and eco-driving. Sensors 2014, 14, 21358–21374. [Google Scholar] [CrossRef] [PubMed]
- Kobayashi, I.; Tsubota, Y.; Kawashima, H. Eco-driving simulation: Evaluation of eco-driving within a network using traffic simulation. Urban Transp. XIII 2007. [Google Scholar] [CrossRef]
- Orfila, O. Impact of the Penetration Rate of Ecodriving on Fuel Consumption and Traffic Congestion. In YRS11: Young Researchers Seminar; ECTRI: Bruxelles, Belgien, 2011; Available online: http://www.ectri.org/YRS11/Documents/Final%20website/Session%2014/YRS11_Session14_OrfilaIFSTTAR.pdf (accessed on 26 June 2017).
- Garcia-Castro, A.; Monzon, A.; Valdes, C.; Romana, M. Modelling different penetration rates of eco-driving in urban areas. Impacts on traffic flow and emissions. Int. J. Sustain. Transp. 2017, 11, 282–294. [Google Scholar]
- Boriboonsomsin, K.; Barth, M.J.; Zhu, W.; Vu, A. Eco-routing navigation system based on multisource historical and real-time traffic information. IEEE Trans. Intell. Transp. Syst. 2012, 13, 1694–1704. [Google Scholar] [CrossRef]
- Boriboonsomsin, K.; Dean, J.; Barth, M. Examination of attributes and value of ecologically friendly route choices. Transp. Res. Rec. 2014, 2427, 13–25. [Google Scholar] [CrossRef]
- Yao, E.; Song, Y. Study on eco-route planning algorithm and environmental impact assessment. J. Intell. Transp. Syst. 2014, 17, 42–53. [Google Scholar] [CrossRef]
- Guo, L.; Huang, S.; Sadek, A.W. An evaluation of environmental benefits of time-dependent green routing in the greater Buffalo–Niagara region. J. Intell. Transp. Syst. 2013, 17, 18–30. [Google Scholar] [CrossRef]
- Bandeira, J.M.; Almeida, T.G.; Khattak, A.J.; Rouphail, N.M.; Coelho, M.C. Generating emissions information for route selection: Experimental monitoring and routes characterization. J. Intell. Transp. Syst. 2013, 17, 3–17. [Google Scholar] [CrossRef]
- Mensing, F.; Bideaux, E.; Trigui, R.; Ribet, J.; Jeanneret, B. Eco-driving: An economic or ecologic driving style? Transp. Res. Part C 2013, 38, 110–121. [Google Scholar] [CrossRef]
- Ericsson, E.; Larsson, H.; Brundell-Freij, K. Optimizing route choice for lowest fuel consumption–potential effects of a new driver support tool. Transp. Res. Part C 2006, 14, 369–383. [Google Scholar] [CrossRef]
- Ahn, K.; Rakha, H. Network-wide impacts of eco-routing strategies: A large scale case study. Transp. Res. Part D 2013, 25, 119–130. [Google Scholar] [CrossRef]
- Kono, T.; Fushiki, T.; Asada, K.; Nakano, K. Fuel Consumption Analysis and Prediction Model for “Eco” Route Search. In Proceedings of the 15th World Congress on Intelligent Transport Systems and ITS America’s, New York, NY, USA, 16–20 November 2008; Available online: https://trid.trb.org/view/902235 (accessed on 22 December 2017).
- Perez-Prada, F.; Monzon, A.; Valdes, C. Managing traffic flows for cleaner cities: The role of green navigation systems. Energies 2017, 10, 791. [Google Scholar] [CrossRef]
- Ericsson, E. Independent driving pattern factors and their influence on fuel-use and exhaust emission factors. Transp. Res. Part D 2001, 6, 325–345. [Google Scholar] [CrossRef]
- UNESCO (United Nations, Educational, Scientific and Cultural Organization). Available online: http://www.ciudadespatrimonio.org/ciudades/index.php?cd=3 (accessed on 18 July 2017).
- Ayuntamiento de Cáceres. Plan de Infraestructuras para la Movilidad Urbana Sostenible. 2014. Available online: http://zetaestaticos.com/comun/upload/0/580/580017.pdf (accessed on 12 May 2017).
- Ayuntamiento de Cáceres. Estudio de Tráfico y Movilidad. Revisión y Adaptación del Plan General Municipal de Cáceres. 2010. Available online: http://sig.caceres.es/PGM2010/TOMO_VI_EST_TRAFICO/ESTUDIO_DE_TRAFICO_REFUNDIDO.pdf (accessed on 13 June 2017).
- U.S. Department of Transportation. Highway Functional Classification: Concepts, Criteria and Procedure. 2013. Available online: https://www.fhwa.dot.gov/planning/processes/statewide/related/highway_functional_classifications/fcauab.pdf (accessed on 12 May 2017).
- Dirección General de Tráfico. Censo Conductores 2016. Available online: http://www.dgt.es/Galerias/seguridad-vial/estadisticas-e-indicadores/censo-conductores/tablas-estadisticas/2016/censo_2016_anuario.xlsx (accessed on 1 December 2017).
- Dirección General de Tráfico. Parque de Vehículos por Provincias. 2016. Available online: http://www.dgt.es/es/seguridad-vial/estadisticas-e-indicadores/parque-vehiculos/tablas-estadisticas/ (accessed on 20 July 2017).
- Instituto para la Diversificación y Ahorro de la Energía (IDAE). Consumo de Carburante y Emisiones de CO2 en Coches Nuevos. 2017. Available online: http://coches.idae.es/portal/BaseDatos/MarcaModelo.aspx (accessed on 13 June 2017).
- OBDKEY. 2017. Available online: http://www.obdkey.com (accessed on 12 May 2017).
- Nemoto, T.; Beglar, D.; Questionnaires, L.-S.; Sonda, N.; Krause, A. JALT2013 Conference Proceedings. Tokyo: JALT. 2014. Available online: http://jalt-publications.org/files/pdf-article/jalt2013_001.pdf (accessed on 18 July 2017).
- Staubach, M.; Schebitz, N.; Krehle, T.; Oeltze, K.; Kuck, D. User Acceptance of an Eco-Driving Support System. In Proceedings of the 9th ITS European Congress, Dublin, Ireland, 4–7 June 2013; Available online: http://www.ecomove-project.eu/assets/Documents/Presentations/ITS-Dublin-2013/ITSDublin-paper366Staubach.pdf (accessed on 18 December 2017).
- European Environmental Agency. Total Greenhouse Gas Emissions Trends and Projections. Available online: https://www.eea.europa.eu/data-and-maps/indicators/greenhouse-gas-emission-trends-6 (accessed on 18 October 2017).
- International Energy Agency. CO2 Emissions from Fuel Combustion. Available online: https://www.iea.org/statistics/relateddatabases/co2emissionsfromfuelcombustion/ (accessed on 18 October 2017).
- Bifulco, G.N.; Galante, F.; Pariota, L.; Spena, M.R. A linear model for the estimation of fuel consumption and the impact evaluation of advanced driving assistance systems. Sustainability 2015, 7, 14326–14343. [Google Scholar] [CrossRef]
- ICT-Emissions Project “Development of a Methodology and Tool to Evaluate the Impact of ICT Measures on Road Transport Emissions”. Available online: http://www.ict-emissions.eu/ (accessed on 26 June 2017).
- Baptista, P.C.; Azevedo, I.L.; Farias, T.L. ICT solutions in transportation systems: Estimating the benefits and environmental impacts in the Lisbon. Procedia-Soc. Behav. Sci. 2012, 54, 716–725. [Google Scholar] [CrossRef]
- Perez-Prada, F.; Monzon, A. Ex-post environmental and traffic assessment of a speed reduction strategy in Madrid’s inner ring-road. J. Transp. Geogr. 2017, 58, 256–268. [Google Scholar] [CrossRef]
- Hickman, R.; Ashiru, O.; Banister, D. Transport and climate change: Simulating the options for carbon reduction in London. Transp. Policy 2010, 17, 110–125. [Google Scholar] [CrossRef]
- Ma, H.; He, G. Effects of the post-olympics driving restrictions on air quality in Beijing. Sustainability 2016, 8, 902. [Google Scholar] [CrossRef]
- Barth, M.; Boriboonsomsin, K. Energy and emissions impacts of a freeway-based dynamic eco-driving system. Transp. Res. Part D 2009, 14, 400–410. [Google Scholar] [CrossRef]
- Qian, G.; Chung, E. Evaluating Effects of Eco-Driving at Traffic Intersections Based on Traffic Micro-Simulation. In Proceedings of the 34th Australasian Transport Research Forum (ATRF), Adelaide, Australia, 28–30 September 2011; Available online: https://eprints.qut.edu.au/45778/1/ATRF11_0092_revised.pdf (accessed on 26 June 2017).
Figure 1.
Map of the selected routes.

Figure 2.
Experimental car data collection through the OBD-key device [38].
Figure 2.
Experimental car data collection through the OBD-key device [38].
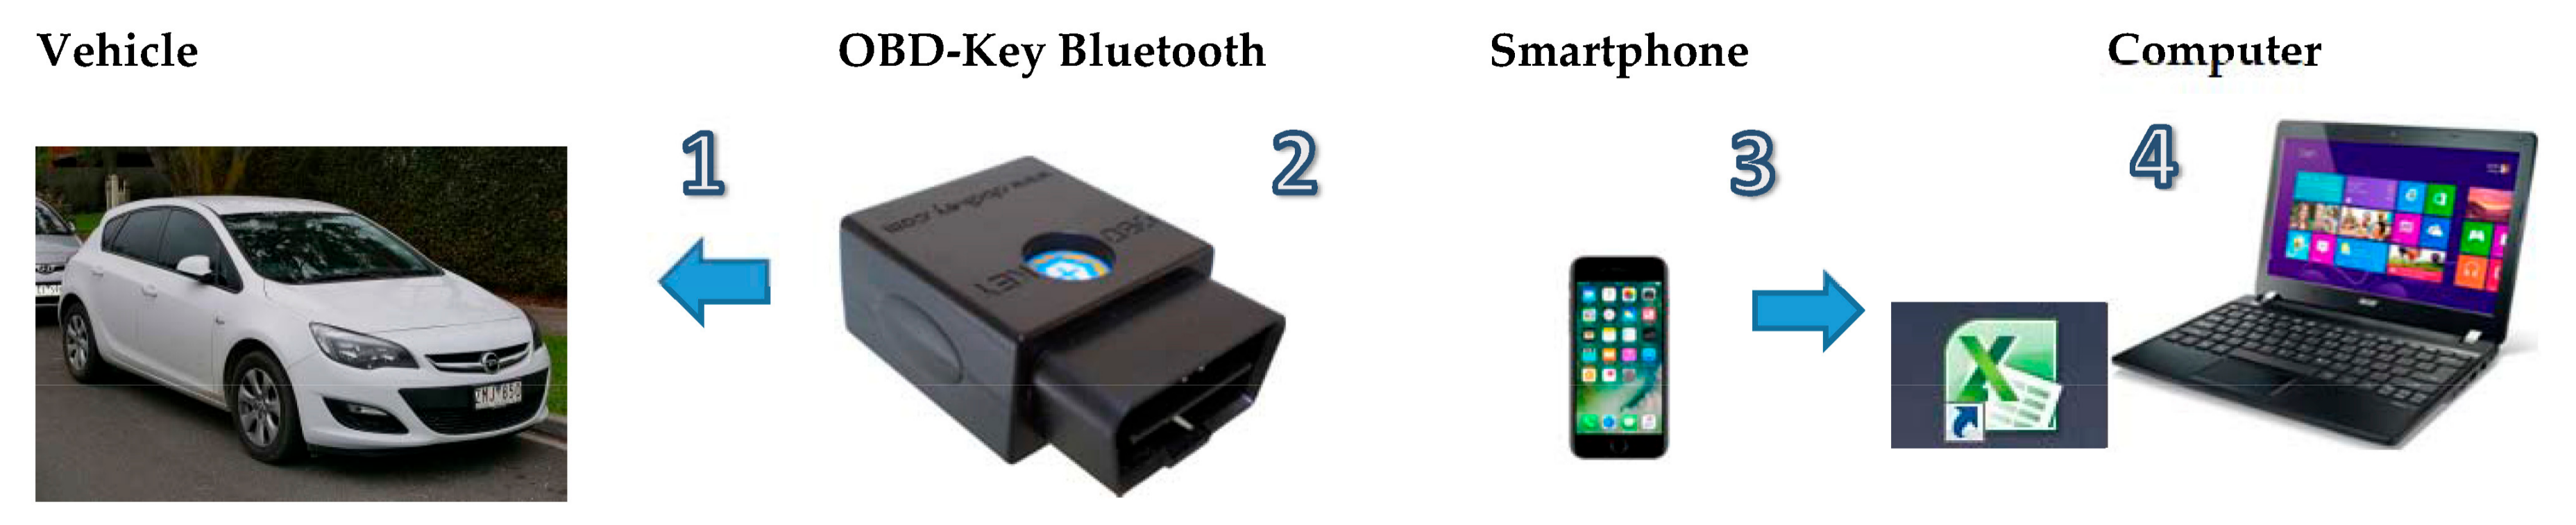
Figure 3.
Travel speeds for each route for non-eco- and eco-driving.
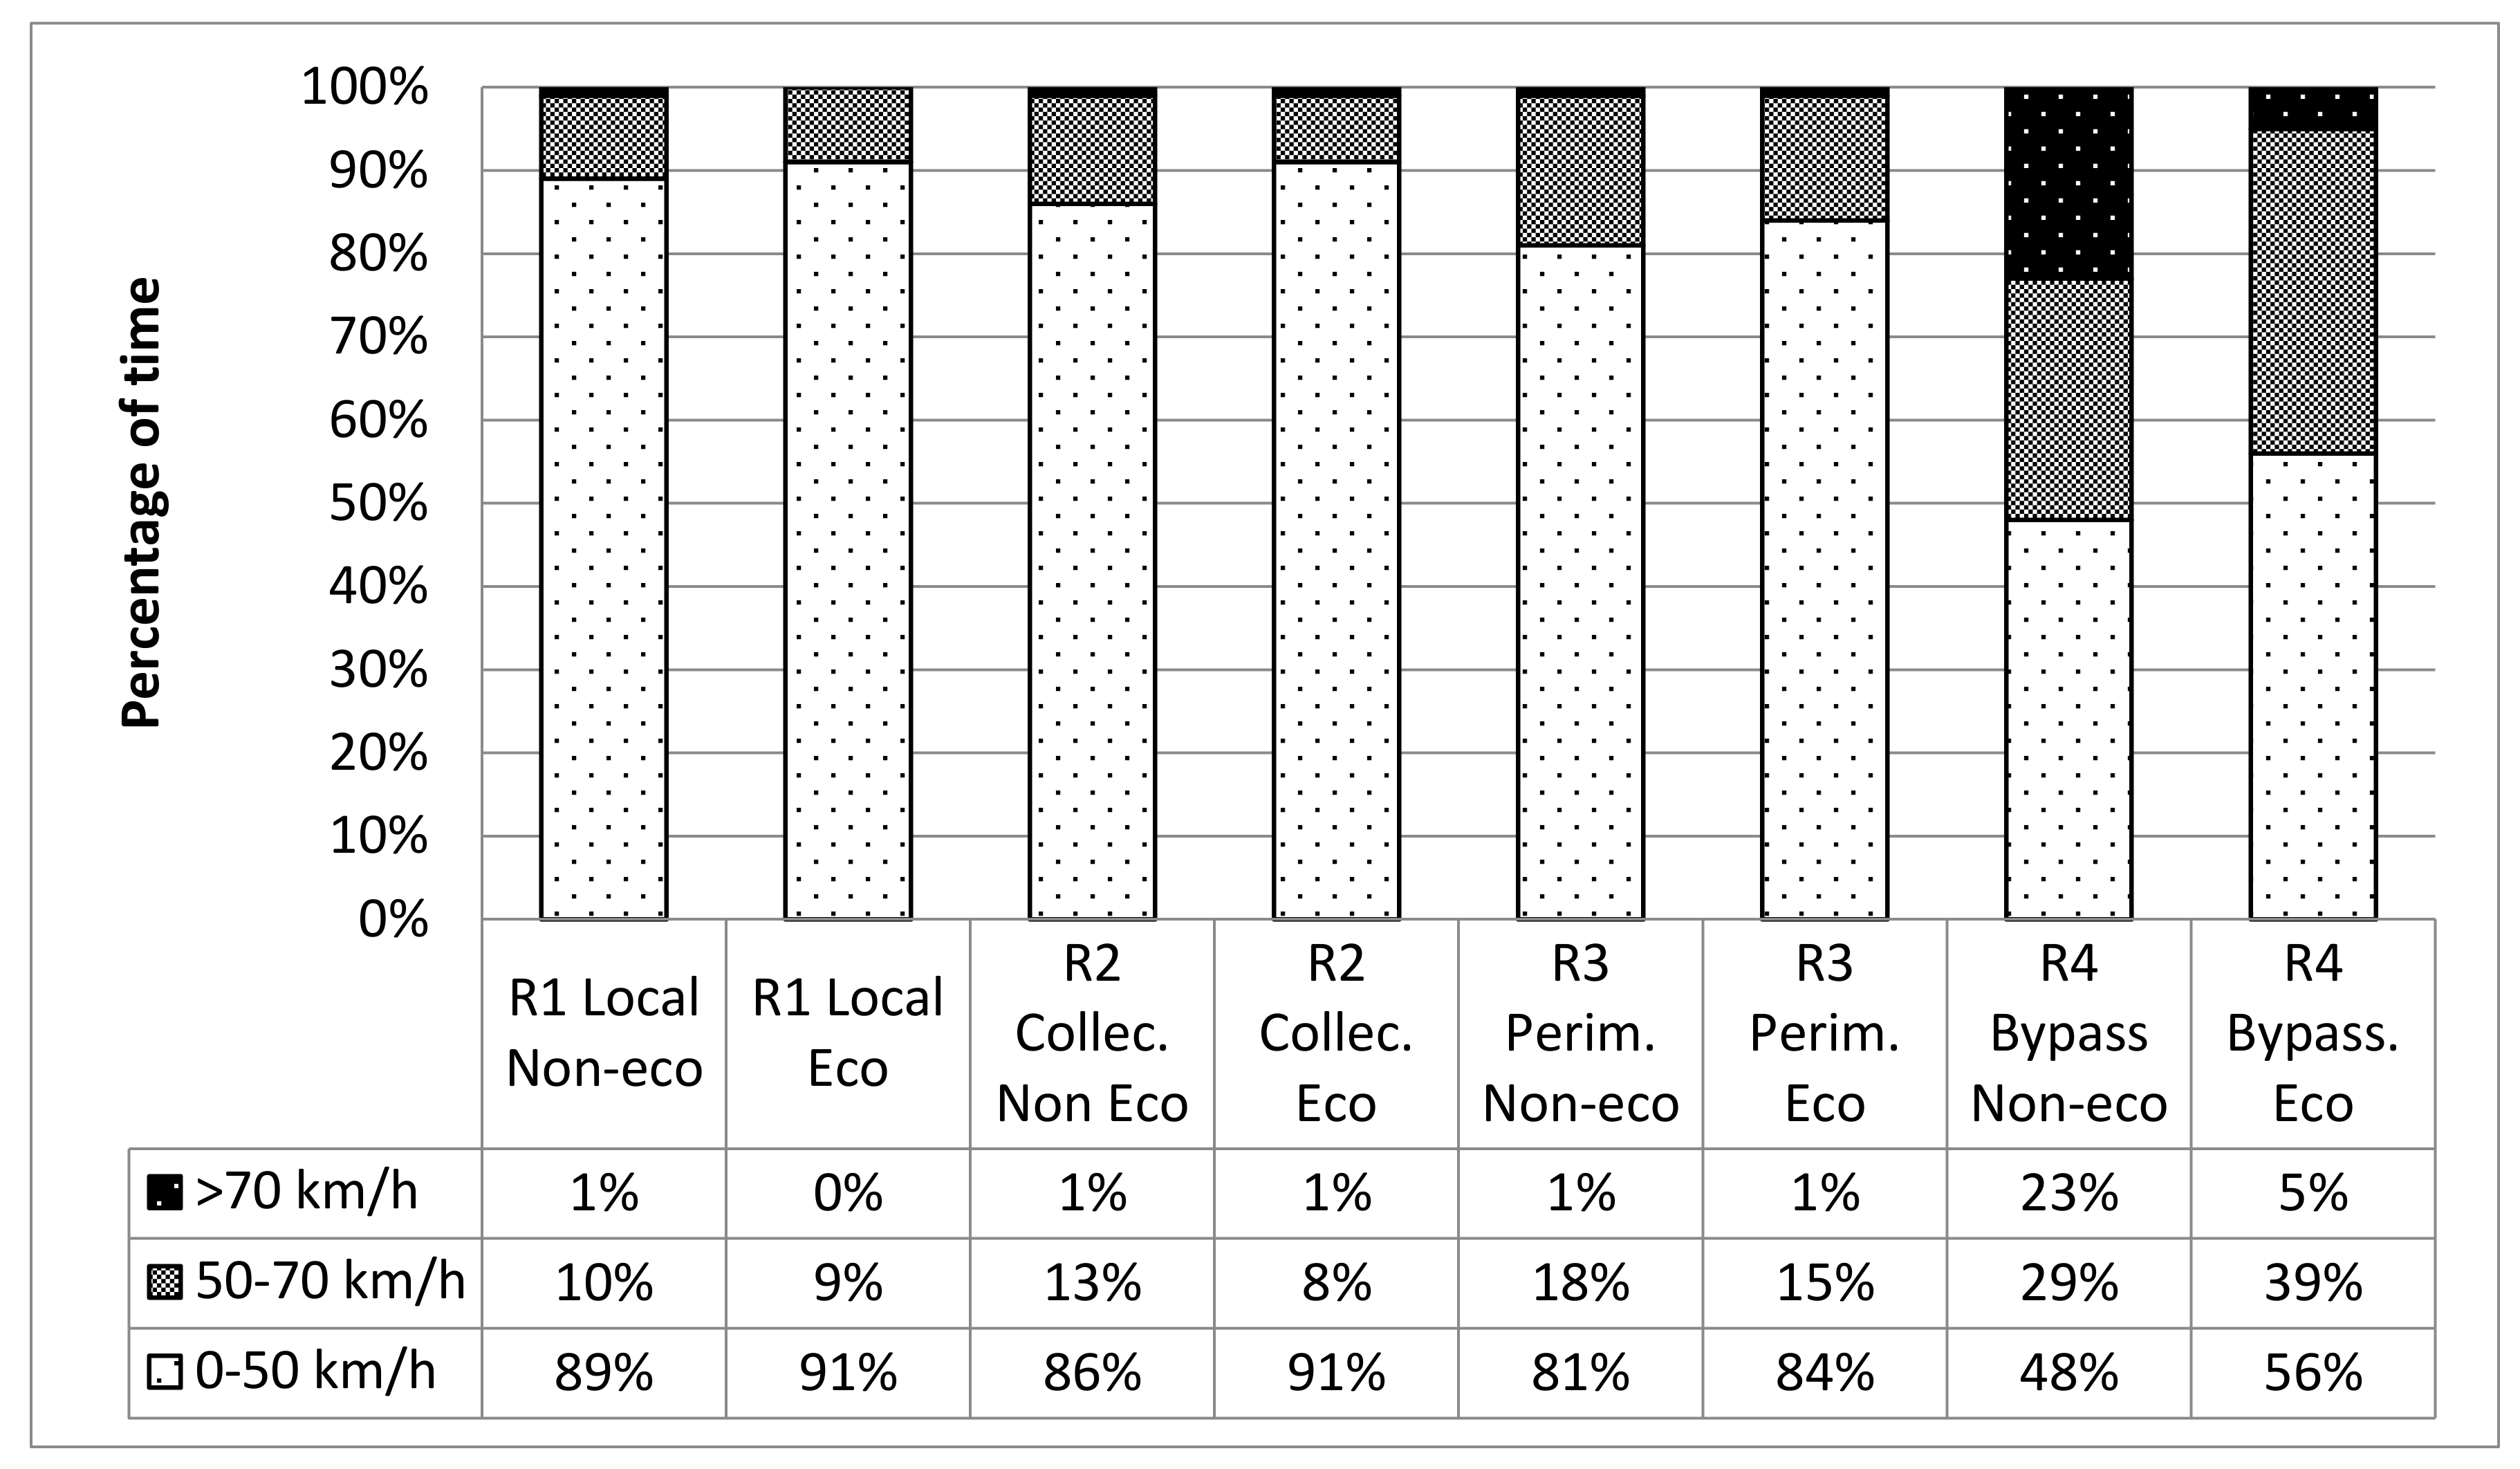
Figure 4.
Differences in instantaneous speed patterns with eco- and non-eco-driving on two selected routes.
Figure 4.
Differences in instantaneous speed patterns with eco- and non-eco-driving on two selected routes.
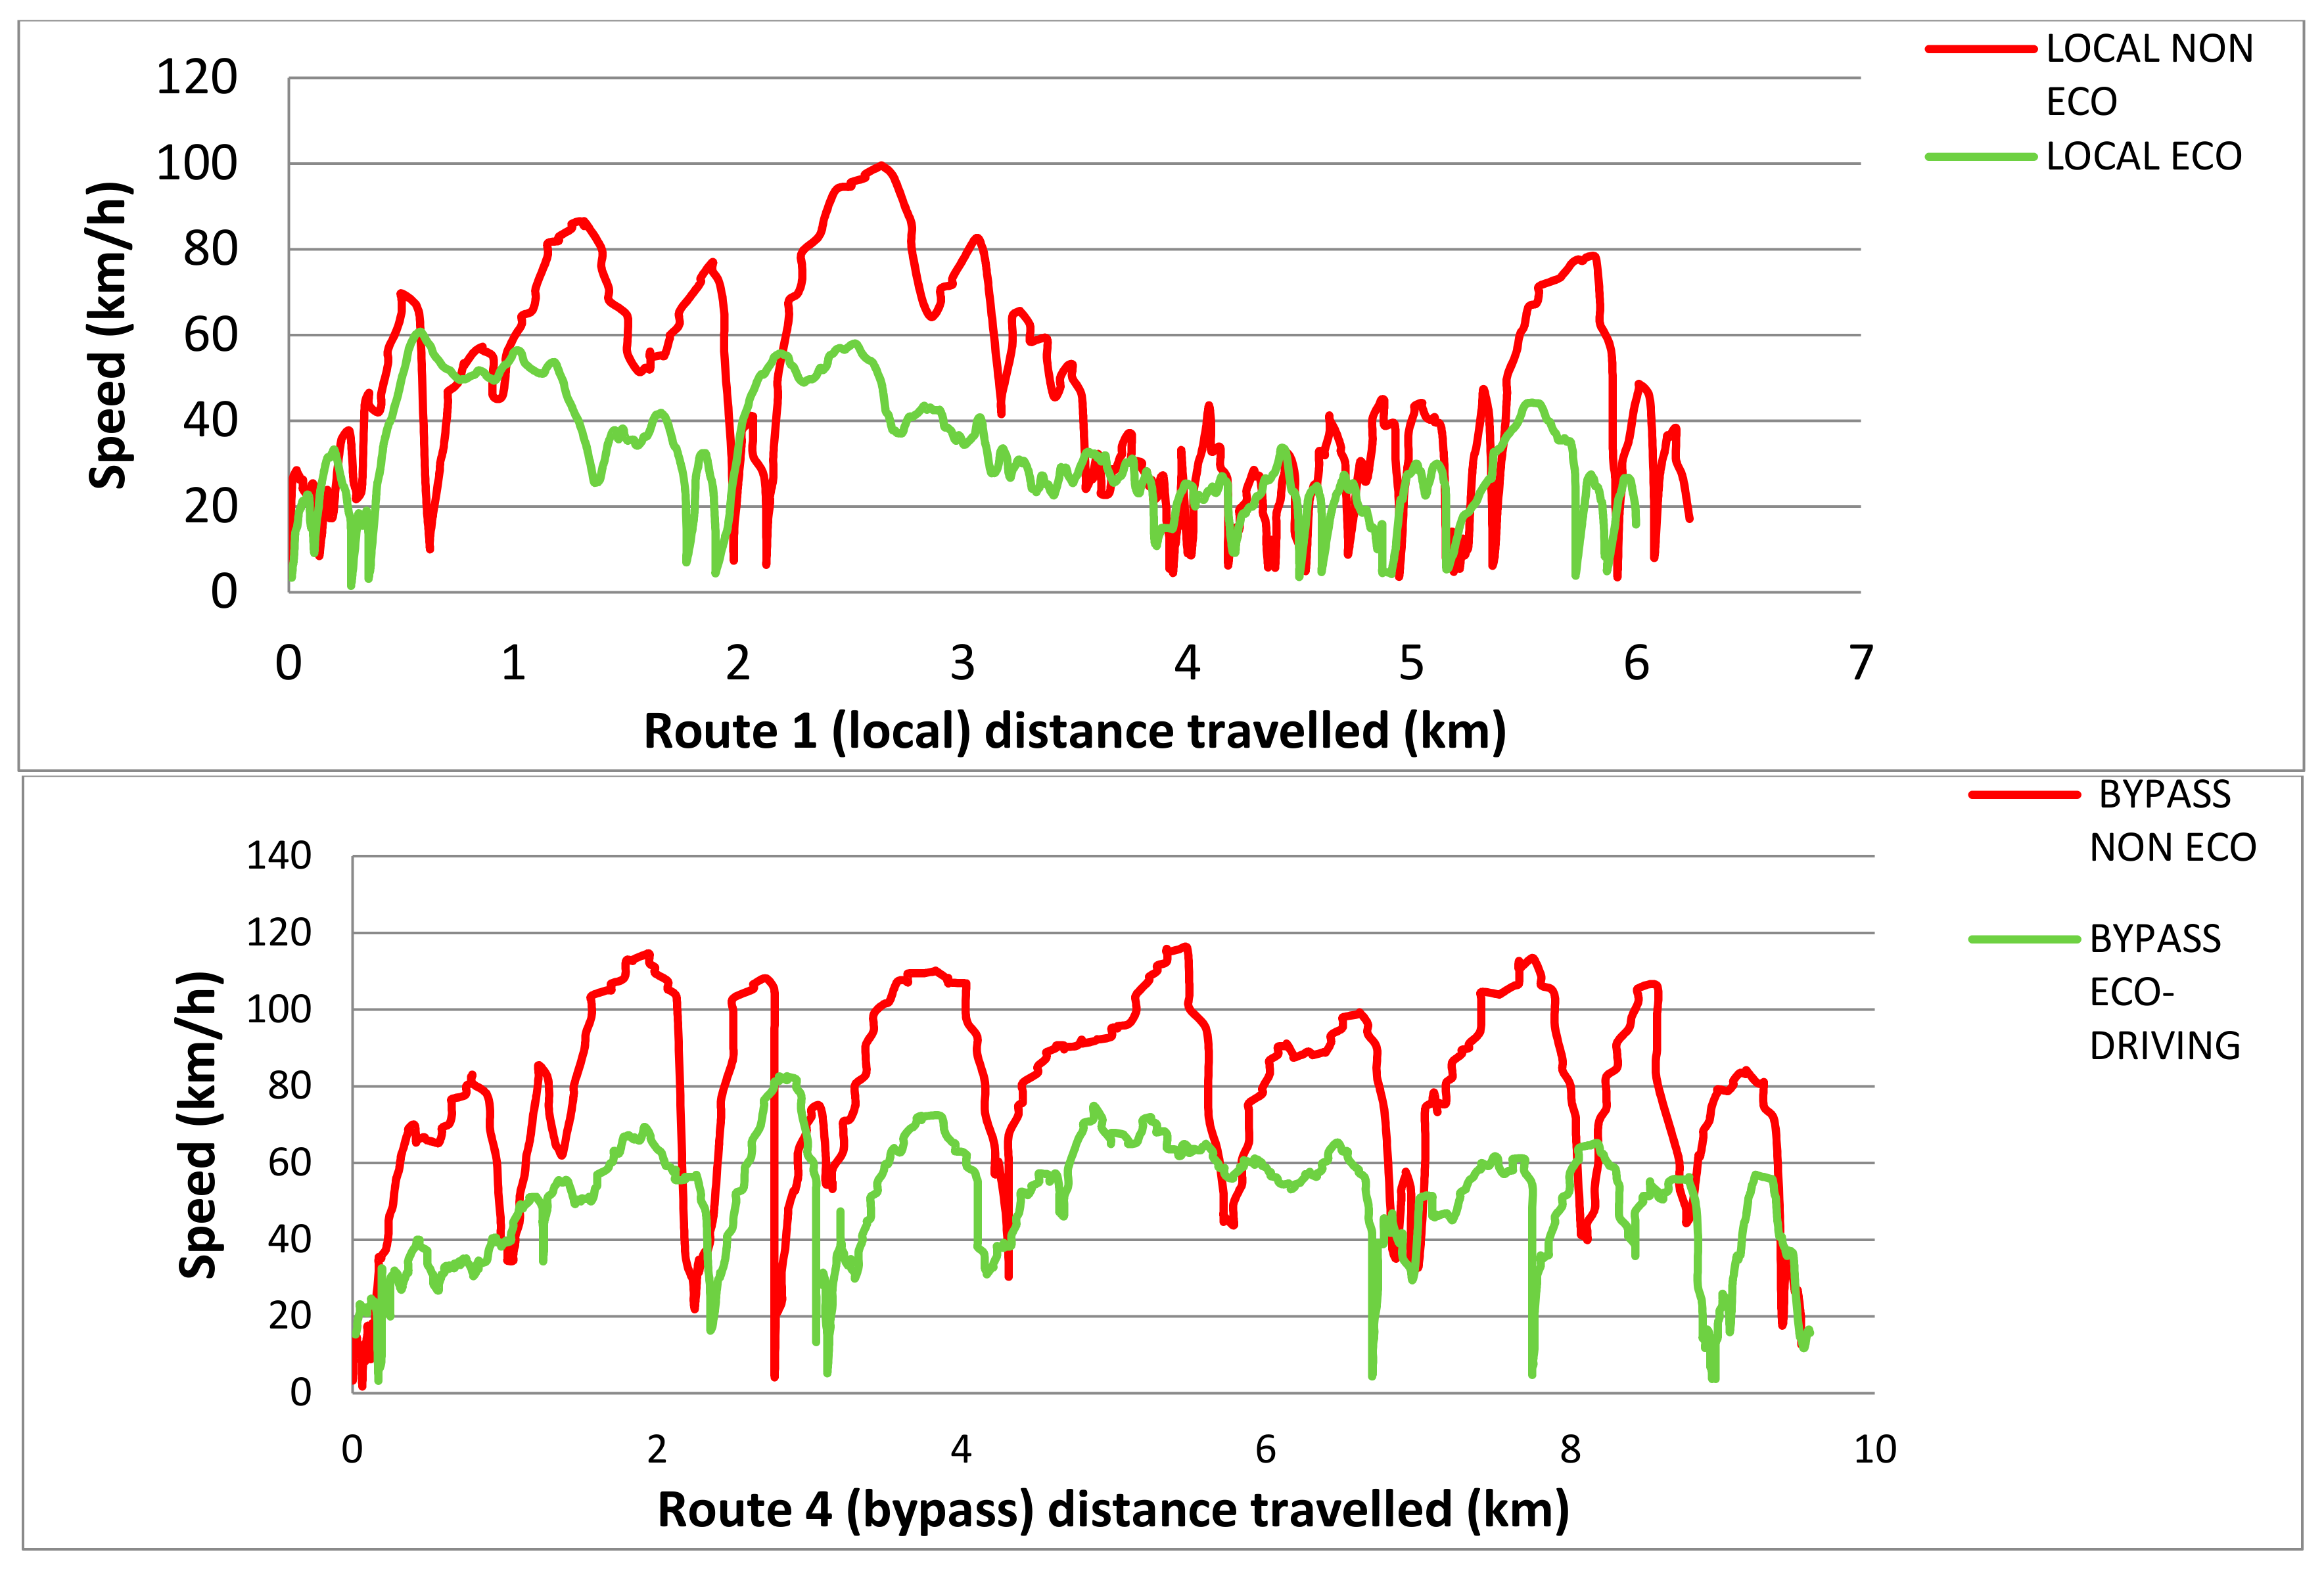
Figure 5.
Average fuel consumption by type of vehicle and route along the different times of day.
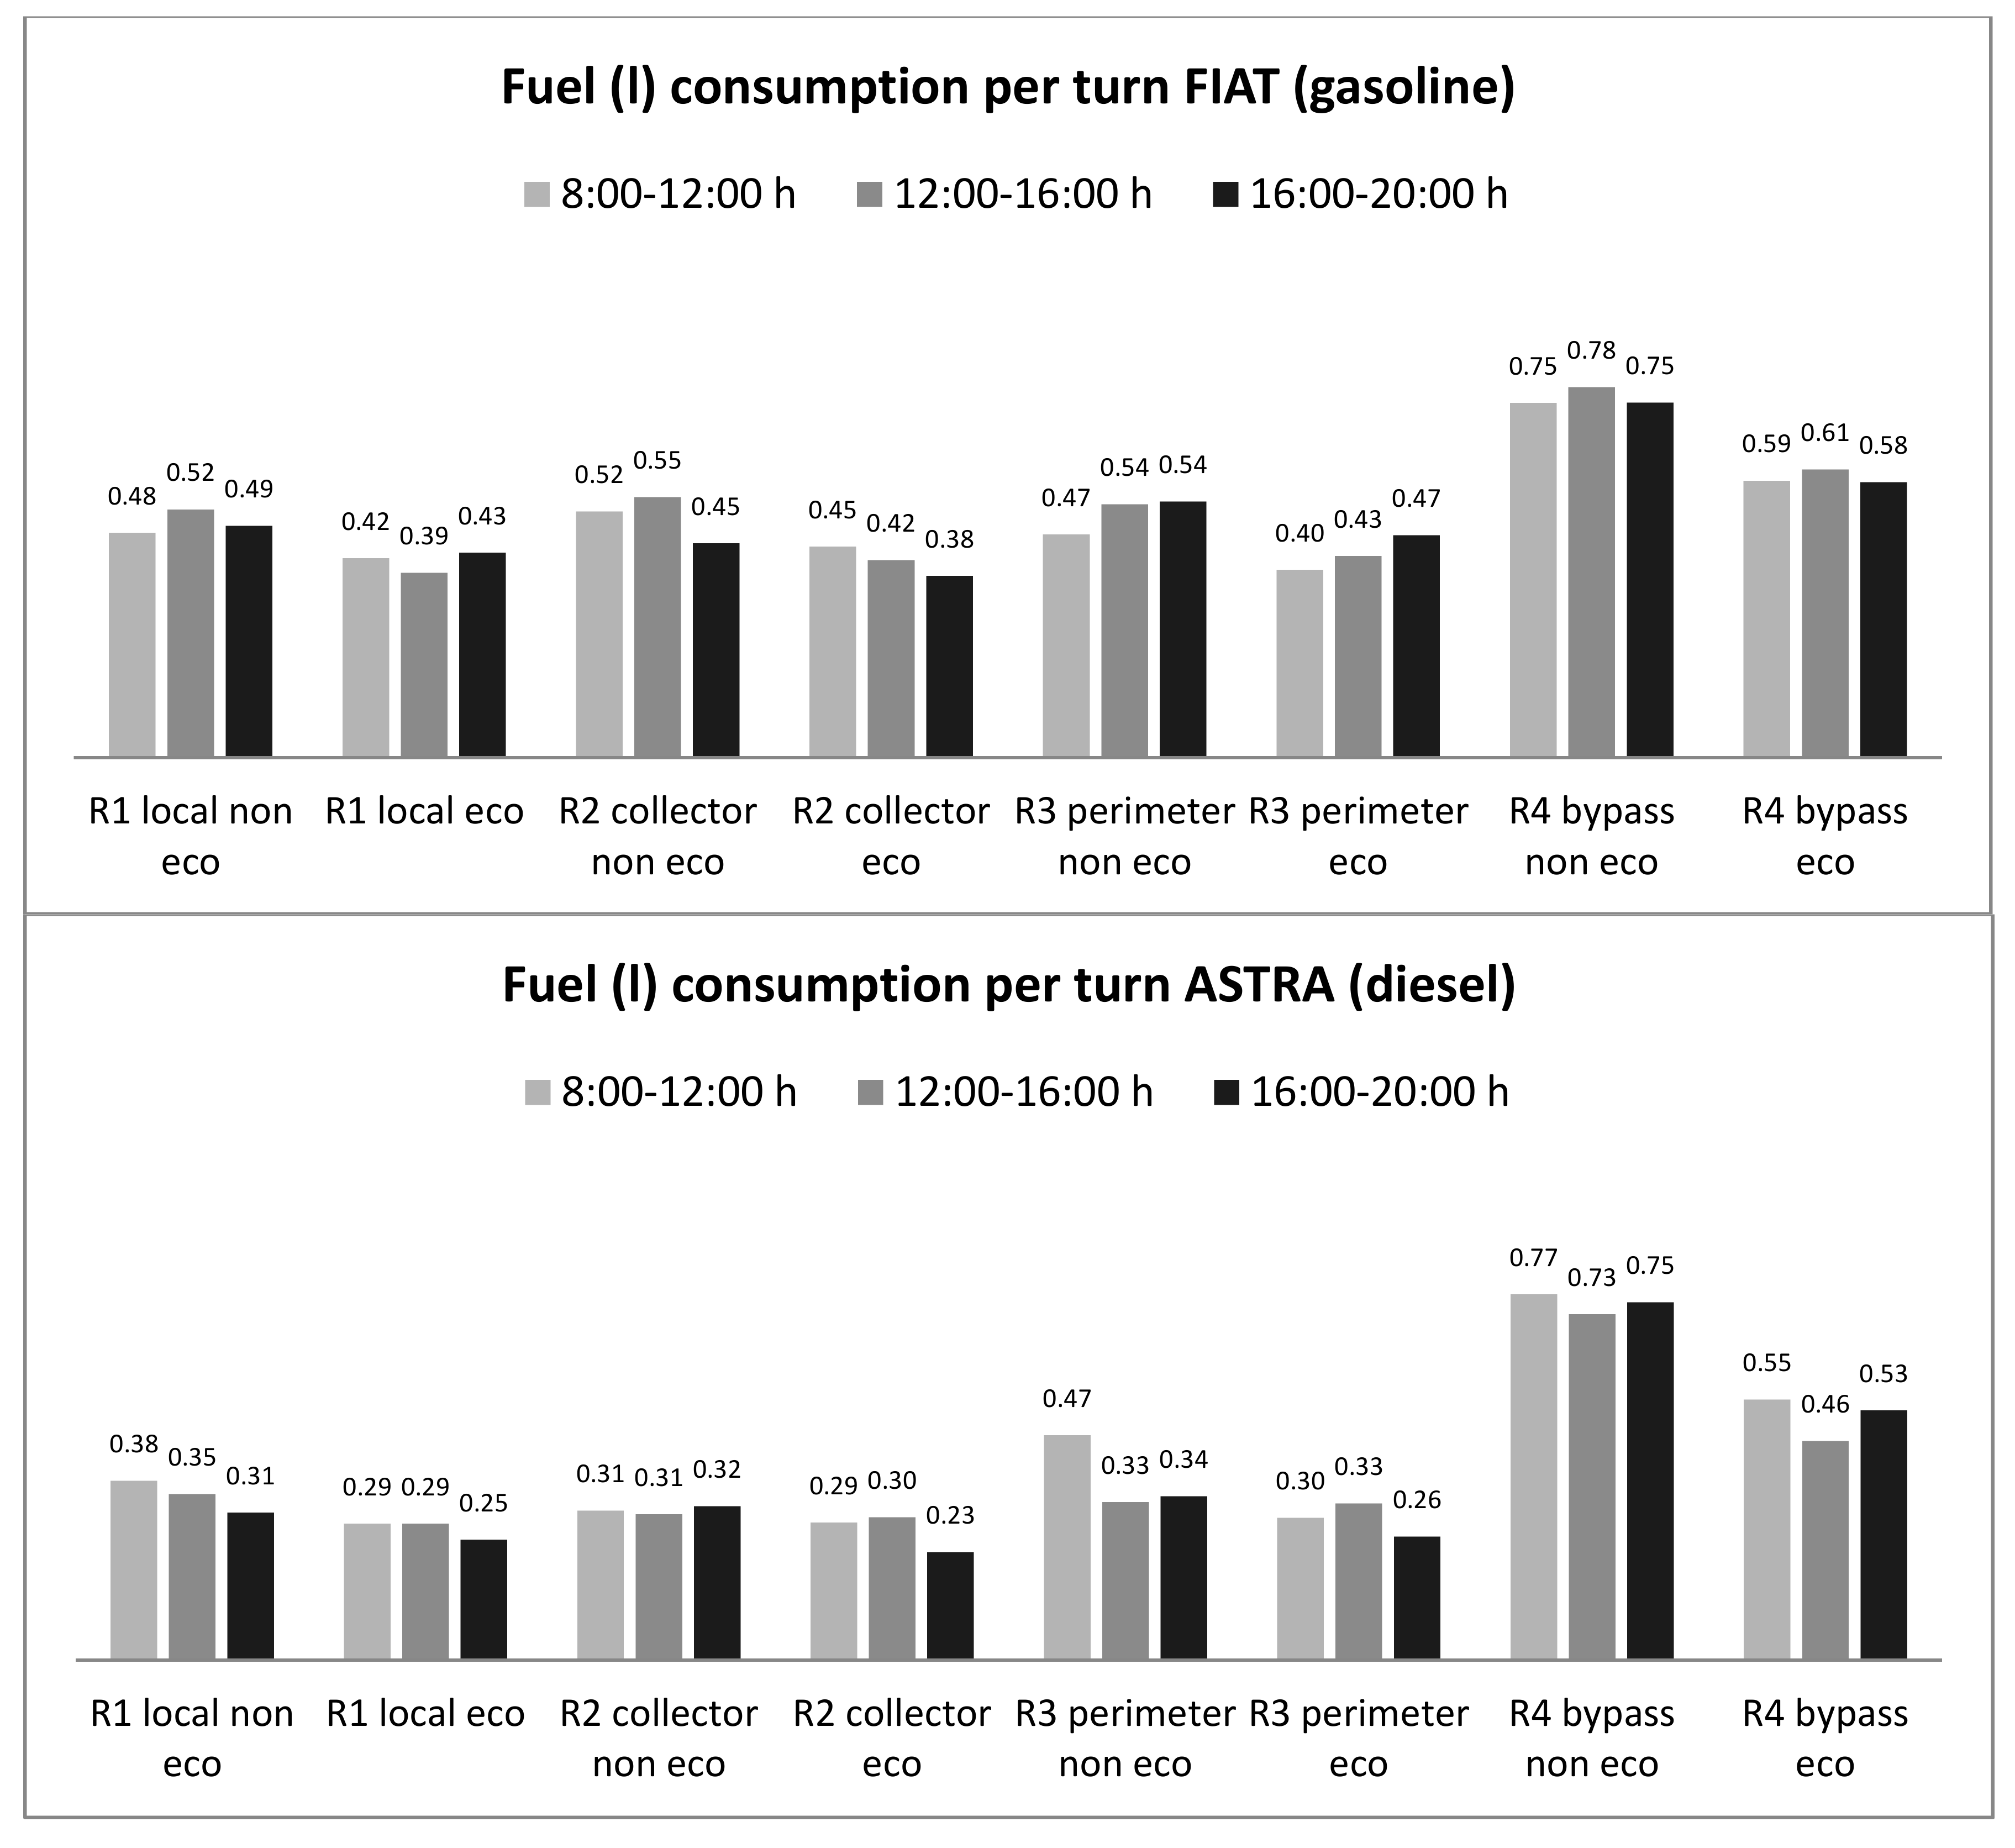
Figure 6.
Fuel savings for non-eco and eco-driving per route and type of vehicle.

Figure 7.
Travel time for each route and driving type.


Table 1.
Technical information on the vehicles used in this research [37].
Table 1.
Technical information on the vehicles used in this research [37].
| Features | Astra | Fiat |
|---|---|---|
| Commercial classification | Saloon | Mini |
| Gear shift type | Manual | Manual |
| Maximum authorized mass | 2010 | 1305 |
| HP power | 110.05 | 93.75 |
| Dimensions (LxWxH) (mm) | 4419 × 1814 × 1510 | 3546 × 1627 × 1488 |
| Seats | 5 | 4 |
| Emissions (gCO2/km) | 109 | 115 |
| Emissions (gCO2/L) | 2658 | 2347 |
| Classification by relative consumption |  |  |
Table 2.
Distance travelled (km), number of trips per route, type of vehicle and drivers’ sex.
| Vehicle | Total Km Travelled | Route 1 Local | Route 2 Collector | Route 3 Perimeter | Route 4 Bypass | Total | Men | Women | |
|---|---|---|---|---|---|---|---|---|---|
| Non-eco-driving | Astra | 1010 | 39 | 35 | 35 | 39 | 148 | 187 | 103 |
| Fiat | 1091 | 40 | 34 | 34 | 34 | 142 | |||
| Eco-driving | Astra | 1022 | 41 | 32 | 34 | 38 | 145 | 190 | 100 |
| Fiat | 1045 | 37 | 35 | 37 | 36 | 145 | |||
| Total | 4168 | 157 | 136 | 140 | 147 | 580 | 377 | 203 |
Table 3.
Driver behaviour parameters before and after eco-driving course.
| Parameters | Driving Mode | R1 Local | R2 Collector | R3 Perimeter | R4 Bypass |
|---|---|---|---|---|---|
| Average rpm | Non-eco | 1439.85 | 1493.36 | 1584.79 | 1811.81 |
| Eco-driving | 1246.54 | 1241.85 | 1267.33 | 1330.95 | |
| Max rpm | Non-eco | 3506.21 | 3406.55 | 3535.95 | 3740.99 |
| Eco-driving | 2787.63 | 3001.73 | 3046.17 | 2879.58 | |
| Max positive acceleration m/s2 | Non-eco | 2.31 | 2.07 | 2.25 | 2.66 |
| Eco-driving | 1.86 | 1.80 | 2.19 | 2.24 | |
| Max negative acceleration m/s2 | Non-eco | −2.35 | −2.31 | −2.54 | −2.95 |
| Eco-driving | −2.08 | −2.13 | −2.26 | −2.34 | |
| Average positive acceleration m/s2 | Non-eco | 0.35 | 0.36 | 0.44 | 0.54 |
| Eco-driving | 0.34 | 0.34 | 0.37 | 0.36 | |
| Average negative acceleration m/s2 | Non-eco | −0.41 | −0.40 | −0.48 | −0.57 |
| Eco-driving | −0.38 | −0.37 | −0.40 | −0.39 | |
| Average number of times driving below 5 km/h | Non-eco | 6.54 | 4.97 | 4.97 | 3.01 |
| Eco-driving | 6.27 | 4.75 | 5.10 | 2.31 |
Table 4.
Survey for capturing individual driving perception.
| Questions | Driving | Answers (%) | ||||||
|---|---|---|---|---|---|---|---|---|
| Mode | 1 | 2 | 3 | 4 | 5 | 6 | 7 | |
| Driving the vehicle was easy (1)—difficult (7). | Non-eco | 72 | 20 | - | 4 | 4 | - | - |
| Eco | 63 | 31 | 3 | - | 3 | - | - | |
| The driving environment was easy (1)—difficult (7) | Non-eco | 45 | 29 | 13 | 6 | 7 | - | - |
| Eco | 33 | 33 | 14 | 11 | 4 | 4 | 1 | |
| During the trip you were bored (1)—entertained (7) | Non-eco | - | 1 | 3 | 7 | 13 | 34 | 40 |
| Eco | - | 4 | 8 | 11 | 18 | 31 | 28 | |
| During the trip you felt relaxed (1)—stressed (7) | Non-eco | 52 | 27 | 10 | 4 | 6 | - | 1 |
| Eco | 34 | 34 | 15 | 4 | 10 | 3 | - | |
Table 5.
Validated fuel consumption and CO2 emissions.
| Vehicle | Parameter | Non-Eco-Driving | Eco-Driving | ||||||
|---|---|---|---|---|---|---|---|---|---|
| R1 Local | R2 Collector | R3 Perimeter | R4 Bypass | R1 Local | R2 Collector | R3 Perimeter | R4 Bypass | ||
| Fiat (gasoline) | Fuel (L) | 0.50 | 0.51 | 0.52 | 0.76 | 0.41 | 0.42 | 0.43 | 0.59 |
| Fuel (L/100 km) | 8.44 | 8.03 | 8.06 | 7.54 | 6.96 | 6.63 | 6.69 | 5.84 | |
| estimated CO2 (g) | 1173.50 | 1196.97 | 1220.44 | 1783.72 | 962.27 | 985.74 | 1009.21 | 1384.73 | |
| Astra (diesel) | Fuel (L) | 0.34 | 0.31 | 0.38 | 0.74 | 0.27 | 0.28 | 0.29 | 0.51 |
| Fuel (L/100 km) | 5.76 | 4.84 | 5.90 | 7.39 | 4.53 | 4.45 | 4.56 | 5.09 | |
| estimated CO2 (g) | 903.72 | 823.98 | 1010.04 | 1966.92 | 717.66 | 744.24 | 770.82 | 1355.58 | |
© 2017 by the authors. Licensee MDPI, Basel, Switzerland. This article is an open access article distributed under the terms and conditions of the Creative Commons Attribution (CC BY) license (http://creativecommons.org/licenses/by/4.0/).
Share and Cite
MDPI and ACS Style
Coloma, J.F.; García, M.; Wang, Y.; Monzón, A. Green Eco-Driving Effects in Non-Congested Cities. Sustainability 2018, 10, 28. https://doi.org/10.3390/su10010028
AMA Style
Coloma JF, García M, Wang Y, Monzón A. Green Eco-Driving Effects in Non-Congested Cities. Sustainability. 2018; 10(1):28. https://doi.org/10.3390/su10010028
Chicago/Turabian StyleColoma, Juan Francisco, Marta García, Yang Wang, and Andrés Monzón. 2018. "Green Eco-Driving Effects in Non-Congested Cities" Sustainability 10, no. 1: 28. https://doi.org/10.3390/su10010028
Note that from the first issue of 2016, this journal uses article numbers instead of page numbers. See further details here.