Article

Exploring Farmers’ Pro-Ecological Intentions after Ecological Rehabilitation in a Fragile Environment Area: A Structural Equation Modeling Approach

1
College of Life Sciences, Yan’an University, Yan’an 716000, China
2
College of Agronomy, Northwest A&F University, Yangling 712100, China
*
Author to whom correspondence should be addressed.
Sustainability 2018, 10(1), 29; https://doi.org/10.3390/su10010029
Submission received: 18 October 2017 / Revised: 19 December 2017 / Accepted: 20 December 2017 / Published: 23 December 2017
(This article belongs to the Section Environmental Sustainability and Applications)

Abstract

:
Farmers’ pro-ecological intentions (PEI) after ecological rehabilitation are crucial to the sustainability of ecological conservation achievements and attract attention from policy-makers and managers. However, studies regarding multiple factors and their mechanism of influence on farmer's PEI are limited in fragile environmental areas. We conducted a household survey that measures the perceptions and attitudes, and the individual, demographic, and economic properties of 2025 farmers in the Loess Plateau of China. Results showed that only 28.74% of the respondents intended to apply the pro-ecological behavior after ecological restoration. The structural equation model reported a high explanatory power of 77.6% for farmers’ PEI. Farmers’ intentions to apply pro-ecological behaviors are jointly affected by various factors, with their perceptions and attitudes found to be the most influential factor and a vital link to other factors. Farmers’ individual, demographic, and economic factors also showed significant effects. Younger male farmers with higher education degrees, and better self-assessment of their abilities and perception of environmental improvement tend to state a greater intention to apply pro-ecological behaviors after the ecological rehabilitation. Results suggest that policy-makers and managers wanting to encourage farmers taking pro-ecological actions after ecological programs should value both enhancing farmers’ abilities to conserve ecological achievements and their perceptions of ecological benefits.

Graphical Abstract

1. Introduction

Evidence is mounting that anthropogenic over-exploitation (e.g., over-harvest of renewable resources) and disturbance can weaken ecosystems’ functional attributes, such as water and soil conservation, climate regulation, biodiversity, and more, thus altering the stability and diversity of the ecosystem [1,2,3]. In fragile environmental areas, where the ecosystem was very sensitive to any environmental change, human activities in combination with poor natural resources and harsh environments increase the risk of ecosystem collapse [4]. To counter the deterioration of ecosystems in fragile environment areas, payment for ecosystem service (PES) programs were conducted around the world by providing financial support to encourage individuals and communities to undertake actions that increase the levels of the desired ecosystem service [5,6]. These programs have created considerable ecological achievements, including increasing biodiversity and vegetation cover, promoting carbon sequestration capacity, reducing soil and water erosion, and others [7,8,9,10]. However, increasing evidence has shown that these ecological achievements are usually under threat of being destroyed by landowners after the termination of the PES programs for its uncertain land use succeeding the programs. For example, Cao’s study regarding the Grain to Green Program (GTGP) in China reported that 37.2% of the farmers planned to re-cultivate the revegetated land once the program expired [11]. Another study indicated that 22.6% of the afforested land in the GTGP in Southwest China would probably be re-cultivated [12]. Moreover, the Conservation Reserve Program in the United States also suffered from a similar predicament [13,14]. The limited long-term conservation outcomes achieved by these programs indicates that further research on the influence mechanisms of sustainable conservation achievements can be of great assistance to policy-makers when designing extended policies and conservation practices.
To conserve ecological achievements, several kinds of pathways have been carried out, such as permanent inclusion into the conservation estate, pay extend subsidy for ecological conservation, or even banning farming in sensitive areas [11,12,13]. These measures required a large amount of external input to protect the ecological benefits, but did not provide thorough solutions to sustainable ecological benefits. Farmers are the key point at which to secure long-term ecological conservation achievements in the PES programs as they are the program implementers and stakeholders [15,16]. Ecological programs aimed at obtaining effective achievements must consider the intentions and attitudes of farmers [15,16,17]. This is especially relevant in fragile environment areas where the ecological environment is more sensitive to human activities. Considerable evidence has shown that many internal and external factors may affect farmers’ intentions and decision-making processes concerning pro-ecological (or ecologically friendly) behavior. For example, by using the Tobit model [12], farmers’ ages, off-farm household income, and number of household laborers have been found to be the most influential factors on farmers’ land reconversion plans after the PES programs, while a study based on a survey of 2000 farmers showed that income, education level, age, and land location were significantly correlated to farmers’ attitudes toward the GTGP in Northern China [11]; another study reported similar results [18]. A study in Haiti showed that benefits from the forests, annual income, education, organizational memberships, and the involvement of women in the forest management process may have significant influence on farmers’ participation in forestry management programs [19]. Although these studies were conducted in different areas using different methods, personal, economic, and sociodemographic characteristics seem to have generally significant effect on farmers’ intentions. In addition, farmers’ social-psychological constructs were also used to explore the factors affecting their intention and behavior. For example, social norms and attitudes had the largest direct influence on farmers’ forest conservation intentions when using the theory of planned behavior and the modified theory of planned behavior methods [20]. Perceived behavioral control was revealed to be the most influential factor to farmers’ ecological conservation behavior in Northern China [21]. These previous studies have contributed valuable information to understanding the factors affecting farmers’ pro-ecological intention (PEI) and behaviors. However, these studies now appear insufficient to reliably support the policy-making process for at least two reasons. First, there are large inconsistencies between the selected factors and those proven to have significant effects in different studies, for example, the effects of policy subsidy on farmers’ PEI among GTGP were proven to be significant in Cao et al.’s study [11], but insignificant in Bo et al.’s study [22], this inconsistency was usually attribute to different research region and socioeconomic backgrounds [23]. Second, most of the studies are focused on certain kinds of factors (either sociodemographic characteristics or social-psychological constructs) and the internal influence process between different kinds of factors still lacks evidence. Since social-psychological properties are as important as farmers’ individual, economic and demographic characteristics in affecting their ecological conservation behaviors [24,25], it is necessary to reveal the possibility of changing social norms such that farmers choose not to cultivate in ecologically sensitive areas and to help preserve the ecological achievements of the PES programs.
As with many other fragile environment areas, the Loess Plateau of China (LPC), with an area of 62.4 × 10⁴ km2 (at 33°43′–41°16′ N and 100°54′–114°33′ E), is undergoing an impressive ecological restoration project, the GTGP, which is one of the largest PES programs in the world [26,27]. Since it was piloted in 1999, the GTGP in the LPC has produced ecological achievements including an increase in biodiversity, soil quality improvement, and carbon sequestration [8,28]. The most important measures of GTGP is restoring vegetation on steep slope (>25°) cultivated land, which is the kind of land most likely to experience severe erosion resulting from cultivation. In the GTGP, farmers receive subsidies (about $35 USD/ha) and grain (about 1500 kg/ha) for converting farmland into vegetation land. The subsidies are provided for eight years during the project and are extend to another eight years (i.e., 16 years subsidies in total) [11]. About 22.54 million households were involved in GTGP by the end of 2012, and with a total investment of $40.83 billion USD, this program has increased the artificial vegetation areas by 26.75 million ha [21]. Recently, in 2014, a subsequent program was launched to convert another 2.8 million ha of barren cropland to vegetation to sustain the achievements obtained [29]. However, the ecological achievements are also under threat of being destroyed by local farmers. Various related factors, such as farmers’ individual characteristics, family condition, economic conditions, and socio-psychological attributes have been proven to have effect on farmers reconversion intentions and behaviors in the GTGP [11,21,22], but, as stated before, most of the studies are concerning certain kinds of factors and the relationship between different kinds of factors are still poorly understood. For policy-makers, and administrators concerned with farmers’ conservation behaviors after the GTGP, many questions remain unanswered or only partially answered. How can governments use social norms or pressures to increase adoption of pro-ecological behaviors without financial subsidies or compensation? How can subsequent policies be effectively designed to strengthen the sustainability of the GTGP and other PES programs?
In this research, farmers’ PEIs after GTGP were explored in the LPC using a structural equation model (SEM) to address these questions. The specific objective of this study is to reveal the factors affecting farmers’ PEIs after a PES program, and provide insights into the relationship between social-psychological constructs and other kinds of factors. Doing so can provide assistance to extended policy-making and inform the interventions after PES programs in fragile environment areas so that they are more efficiently designed and targeted.

2. Materials and Methods

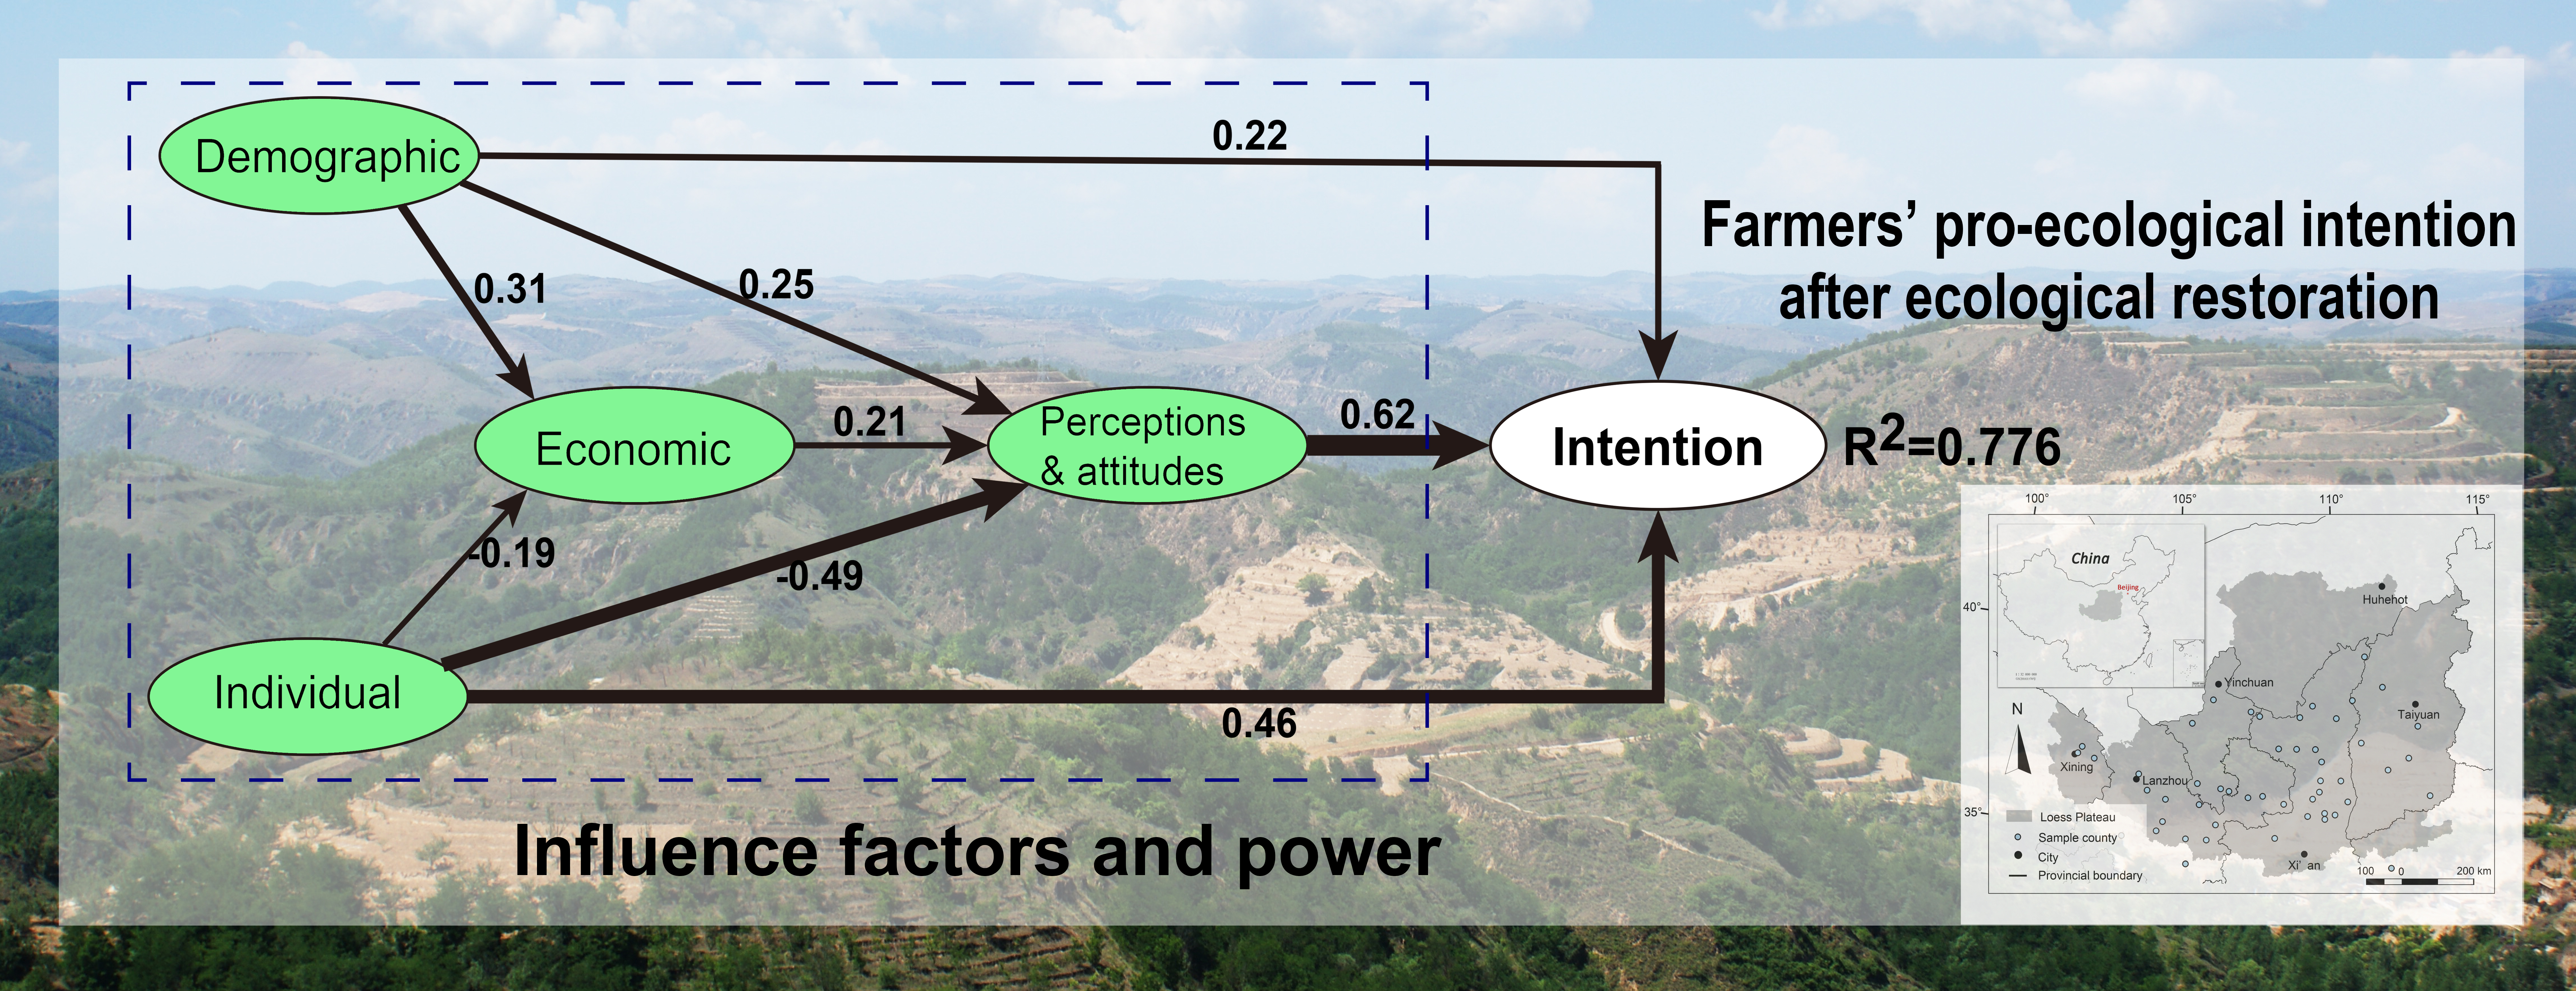
2.1. Description of the Study Area

The data in this study were collected from the entire LPC, which covers about 6.5% of China’s land area (Figure 1). The climate type of this region is a temperate, arid and semi-arid, continental monsoon climate, where the mean annual temperature ranges from 3.6 °C to 14.3 °C, and the mean annual precipitation ranges from 150 to 800 mm; the rainfall is highly asymmetrical during the year [30]. Many ecological problems including land degradation, desertification, soil erosion, and declining soil fertility threaten this area and have led to it becoming the most fragile environment area in the world with a 150 mg/ha per year average erosion rate [28,31]. Since the 1980s, the Chinese government has started to implement a series of ecological restoration programs to encourage local landowners to restore vegetation. In 1999, the GTGP was piloted in the LPC and this area was set as the national key area for applying the GTGP. The population of the LPC is about 108 million (population density is 167 people/km2), of which more than 70% is of an agricultural population. The main income was from agriculture for a long time. The cultivated land takes about 22.48% of the total land, and is usually relatively barren and low-yield. The overall income of the people is very low (less than $500 USD per person per year before 2000) [32]. After the implementation of GTGP, more and more farmers change to migrant workers in the city. The income of people in this area has also increased somewhat ($1025.42 USD per capita per year in our survey area), but still much less than China’s national level ($2965.74 USD per capita income in 2014) [33].

2.2. Survey and Question Design

The data in the study were obtained by a household survey. The questionnaire was designed based on existing literature [21,34], and preparatory interviews with the staff of the GTGP management department, village heads, and farmers from several pilot counties were undertaken using several open-ended questions, including “What do you think can be considered as farmers’ pro-ecological intentions after GTGP?” and “What factors may affect farmers’ ecologically friendly intentions after GTGP?” A pilot questionnaire was then developed, and a pilot survey was conducted in 20 villages from nine counties in the study area. The main purposes of the preparatory interviews and pilot survey were (1) to determine the construct of the theoretical model, i.e., the variables and paths between variables, and (2) to identify items that were ambiguous or difficult to answer in the questionnaire. The pilot survey obtained 211 completed questionnaires, and the data were used to select reliable and valid items, and improve the quality of the final questionnaire. Some unreliable and invalid items were deleted to improve internal consistency and discriminant validity, and the final questionnaire was subsequently formulated. In the questionnaire, the farmers’ responses referring to their attitudes, perceptions, and intentions were surveyed using a five-point Likert scale; other variables were measured by fill-in-the-blank and multiple choices type questions (Table 1).
This survey was conducted using face-to-face interviews. The survey was undertaken both in December 2014 and December 2015 and the data were mixed (the main variables showed no significant difference at p < 0.05). About 60 undergraduate students were trained as research assistants and they participated in the survey. The respondents were selected by using a disproportionate stratified sampling method. Fifty counties were randomly selected from the list of counties in the LPC (total 341 counties) and 3–5 villages were randomly selected in each county and adjusted correspondingly (about 10% of the total villages) based on the household location of the investigators (Figure 1). Respondents in 10–15 households (8%–10% of the total households) in each village were randomly selected from a roster. Eventually, 2216 respondents were invited to participate in the survey and 2025 completed questionnaires (91.4%) were obtained.

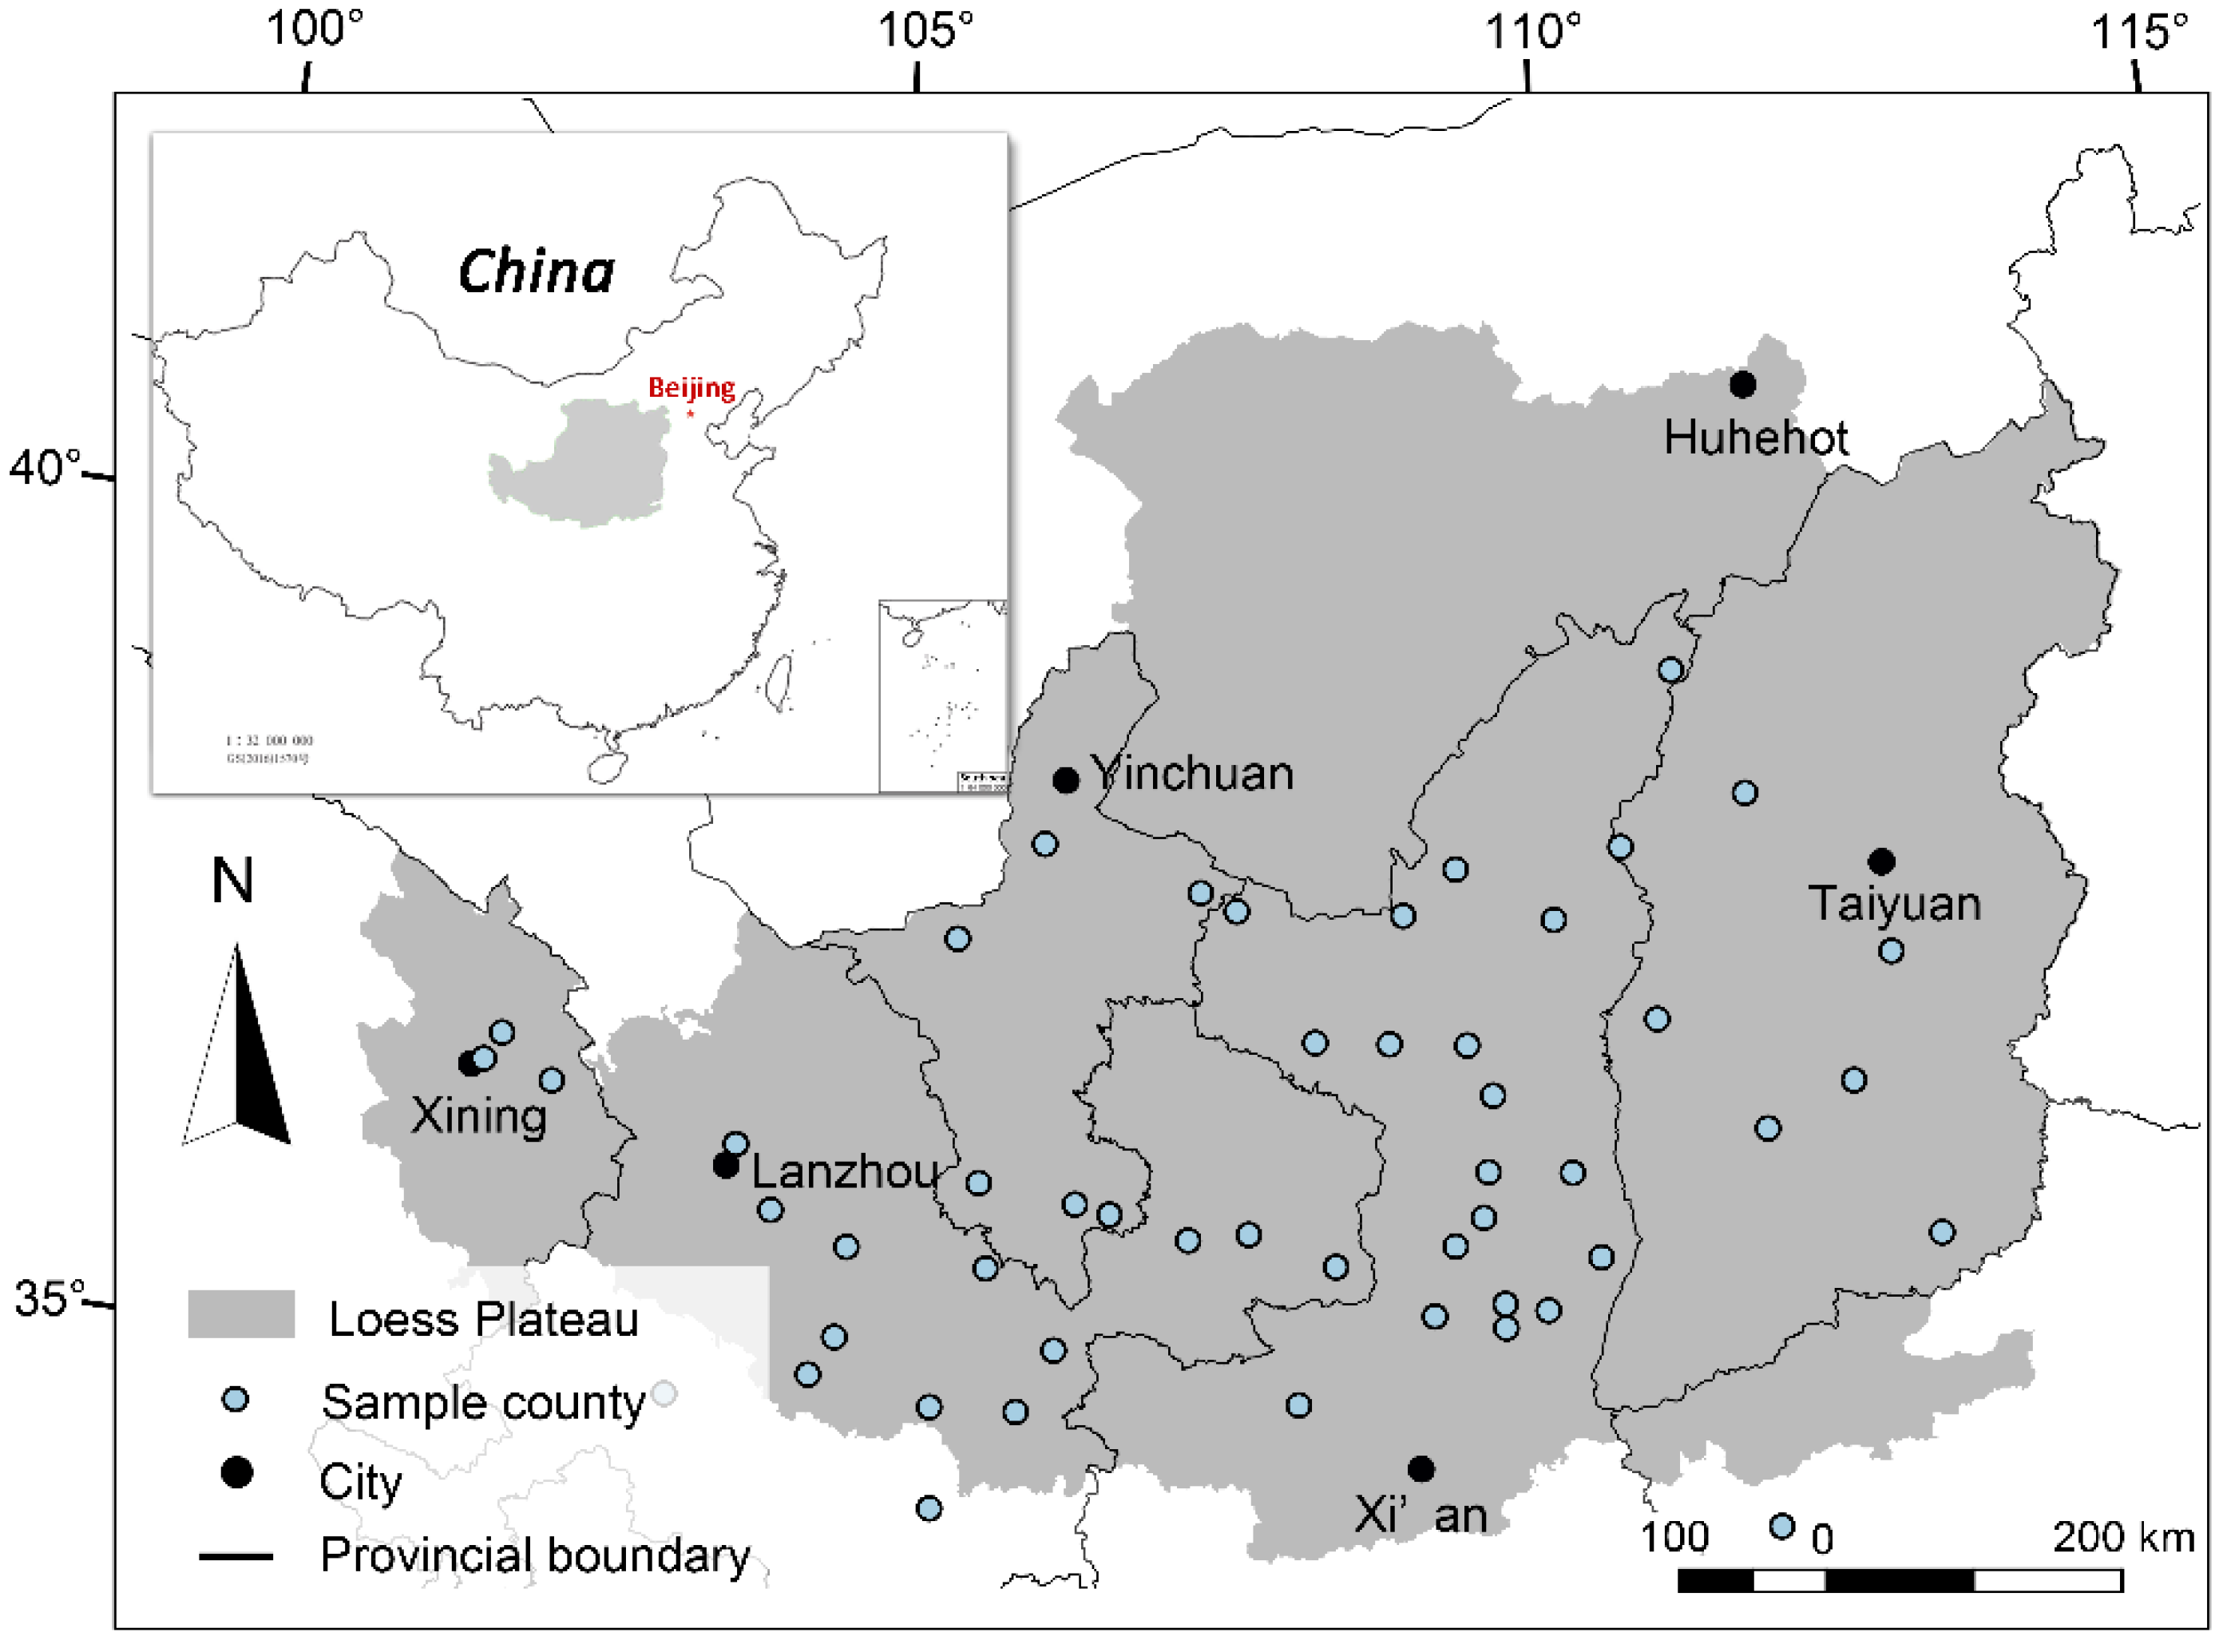
2.3. The Initial and Hypothesis Development

We proposed a theoretical model based on the existing literature and the preparatory interviews (Figure 2). Specifically, based on a survey of the previous studies in the GTGP, the farmers’ individual properties, farmers’ household and demographic properties, economic indicators related to income and expenditure, and the structure of land properties are widely recognized to have effects on farmers’ pro-ecological intentions [11,12,18,35,36]. Perceived behavioral control was revealed to be the most influential factor to farmers’ ecological conservation behavior in Northern China [21]. As a result, there are six latent variables contained in the theoretical model, i.e., farmers’ pro-ecological intentions (PEI) toward pro-ecological behaviors, participants’ individual properties (IP), farmers’ perceptions and attitudes toward pro-ecological behaviors (P&As), the demographic properties (DP) of households, the economic indexes (EI), and the land properties (LP). The influence paths and direction between latent variables and observable variables used to explain each latent variable (Table 1) are from the analysis of the literature (as mentioned before) and actual situations based on the preparatory interviews and pilot survey (Table 1).
Based on the developed theoretical model, the present research tested the following hypotheses illustrated in Figure 2:
Hypothesis 1 (H1):
Farmers’ individual properties significantly influence their intention to adopt pro-ecological behavior.
Hypothesis 2 (H2):
The land properties of household significantly influence their intention to adopt pro-ecological behavior.
Hypothesis 3 (H3):
The economic indices of farmers’ households significantly influence their intention to adopt pro-ecological behavior.
Hypothesis 4 (H4):
Farmers’ perceptions and attitudes toward pro-ecological behaviors significantly influence their intention to adopt pro-ecological behavior.
Hypothesis 5 (H5):
The demographic properties of farmers’ household significantly influence their intention to adopt pro-ecological behavior.
Hypothesis 6 (H6):
Farmers’ perceptions and attitudes toward pro-ecological behaviors are significantly affected by their economic indices (H6a), individual properties (H6b) and demographic properties (H6c).
Hypothesis 7 (H7):
The economic indexes of farmers’ households are significantly affected by their LP(H7a), IP(H7b), and demographic properties(H7c).

2.4. Nondeterminacy and Bias

Nondeterminacy and bias are ubiquitous in social survey design [37], and in the present research they mainly lie in two aspects. Firstly, the responder-effects such as social desirability bias exists in our survey. Specifically, farmers are likely to answer questions more positively depending on what they think the researchers want to hear. Especially, farmers’ statements regarding future intentions are highly likely to be influenced by interview technique, survey design, and require some form of validation. This form of bias has been mentioned in previous studies [38,39]. This bias was minimized by providing detailed explanations prior to the questionnaire or interviews, and respondents were requested to be honest and independent in answering the questions. Secondly, the latent variables and pathways used in the model were difficult to measure entirely and accurately. In the present research, the variables and paths way were carefully chosen and determined (as described in Section 2.2) based on literature research, pre-interviews, and the pilot survey. Although this method was widely used in previous studies [20,40], it may not have addressed the influencing factors completely and objectively. To address this, a wide selection of typical villages in our research area was selected for the pre-interview and pilot surveys.

2.5. Statistical Analysis

Prior to the analysis, all the data, both qualitative and quantitative, were standardized by deviation standardization methods. The validity and reliability of the survey results were then estimated using Cronbach’s α coefficient as a Cronbach’s α coefficient at greater than 0.6 ensures the data have good internal consistency. The statistical analyses were carried out based on the SEM in three steps: first, an exploratory factor analysis was conducted to inspect factorability and suitability, and the Kaiser–Meyer–Olkin (KMO > 0.5) [41] and Bartlett’s test of sphericity (p < 0.05) [42] were used as assessment parameters. The items with low factor loadings (<0.5) were dropped. Second, confirmatory factor analysis was used to evaluate whether the theoretical model (integrally and partly) fit the observed variables and the initial model was then modified to achieve a better degree of fit. Third, the final model was obtained after modification, and the relationships between the variables were estimated. The hot-deck imputation algorithm was used to supplement the missing values in a few questionnaires (about 5.5% of the total completed questionnaires) to obtain a complete dataset.
Several indices were used to evaluate the goodness of fit of the model, i.e., the chi-squared fit statistic (χ2/df), the root mean square error of approximation (RMSEA), goodness of fit index (GFI), normed fit index (NFI), comparative fit index (CFI), parsimonious goodness of fit index (PGFI), and parsimonious normal-fit index (PNFI). The exploratory factor analysis was operated use the principal component analysis procedure in SPSS 20.0 (IBM Corporation, Armonk, NY, USA), the confirmatory factor analysis and SEM was operated in AMOS 21.0 version, and the hot-deck imputation algorithm was operated in SAS version 8.0 (SAS Institute Inc., Cary, NC, USA).

3. Results

3.1. General Information of Sample Individuals and Households

The respondents in our survey were mostly male, and the average age was 45.15 years (Table 2). The education level of our respondents was relatively low (mean = 5.63 years). Each surveyed household had an average of 2.90 laborers. Farming income constituted about one third of the total household income, but the governmental subsidy only constituted a small percentage (8.32%). In addition, 40.78% of the total lands in our study area had been converted to vegetation land. Of the participants, 28.74% were intending to apply pro-ecological behavior and the degree of support for protecting the ecology was relatively high.

3.2. Validity and Reliability Estimate, and the Exploratory Factor Analysis

The Cronbach’s alpha value for each construct of the model was close to or larger than 0.6 and the overall Cronbach’s alpha value was 0.708, which showed good validity and reliability for the survey data (Table 3). Based on the exploratory factor analysis results, the variables of subsidies from ecological restoration program was dropped for its low standard factor loading (<0.5 in each principal component) and, eventually, 13 observation variables were retained. The high KMO value (0.717, well above the recommended threshold value of ≥0.5 [41]) and Bartlett’s test of sphericity (p < 0.001) suggested that factor analysis can be validly applied to the dataset, and supported the factorability of the correlation matrix.

3.3. Confirmatory FactorAnalysis and the Model Fit

The initial model was used to analyze the survey data. However, several goodness of fit measure indices did not reach the recommended levels (i.e., GFI, NFI, and PGFI, Table 4) and the results showed a relatively poor fit to the data. More importantly, the land properties showed extremely low and insignificant correlation with farmers’ intentions and other latent variables (Figure 3A). The effect of EI on farmers’ intentions was also insignificant (path coefficients = 0.02, p = 0.326). In order to improve the goodness-of-fit, the non-significant pathways were deleted, and a modified model was then obtained (Figure 3B). Subsequently, the modified model was rerun and provided a good fit to the data with a high explanatory degree of PEI (R2 = 0.776). All of the path coefficients were significant (p < 0.01) and all of the goodness of fit measure indices reached the recommended levels (Table 4). Thus, the modified model was used as the final model to analyze the factors affecting farmers’ PEI and their mutual relations.
According to the final model (Figure 3B), the most important explanatory factor for farmers’ PEI was their P&A, with a path coefficient of 0.62 (p < 0.01). Farmers’ IP was the second most important and decisive factor for farmers’ PEI, followed by the households’ DP (path coefficient = 0.22, p < 0.01). Of the variance in farmers’ PEI, 77.6% can be explained by these three latent variables. The EI did not show a significant direct effect on farmers’ PEI, but showed a significant effect on farmers’ P&As (path coefficient = 0.21, p < 0.01). Moreover, 85.2% of the variance of farmers’ P&As can be collectively explained by households’ DP, EI, and farmers’ IP, with path coefficients of 0.25, 0.21, and −0.49, respectively (p < 0.01). The EI can also be partly explained (31.1%) by households’ DP and farmers’ IP with path coefficients of 0.31 and −0.19 (p < 0.01). Moreover, the relationship between the latent and observational variables also appeared in the final model. Farmers’ PEI was mostly reflected by their willingness to apply pro-ecological behavior with a path coefficient of 0.75, and this was followed by farmers’ willingness to learn pro-ecological knowledge and technology. The most important observational variables for IP, DP, EI, and P&As were the education level, number of laborers, farming income, and perception of economic benefits from the restoration program, respectively (p < 0.01). Among all the observed variables, only farmers’ age and gender showed a negative effect.

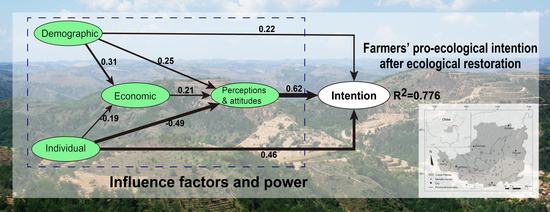
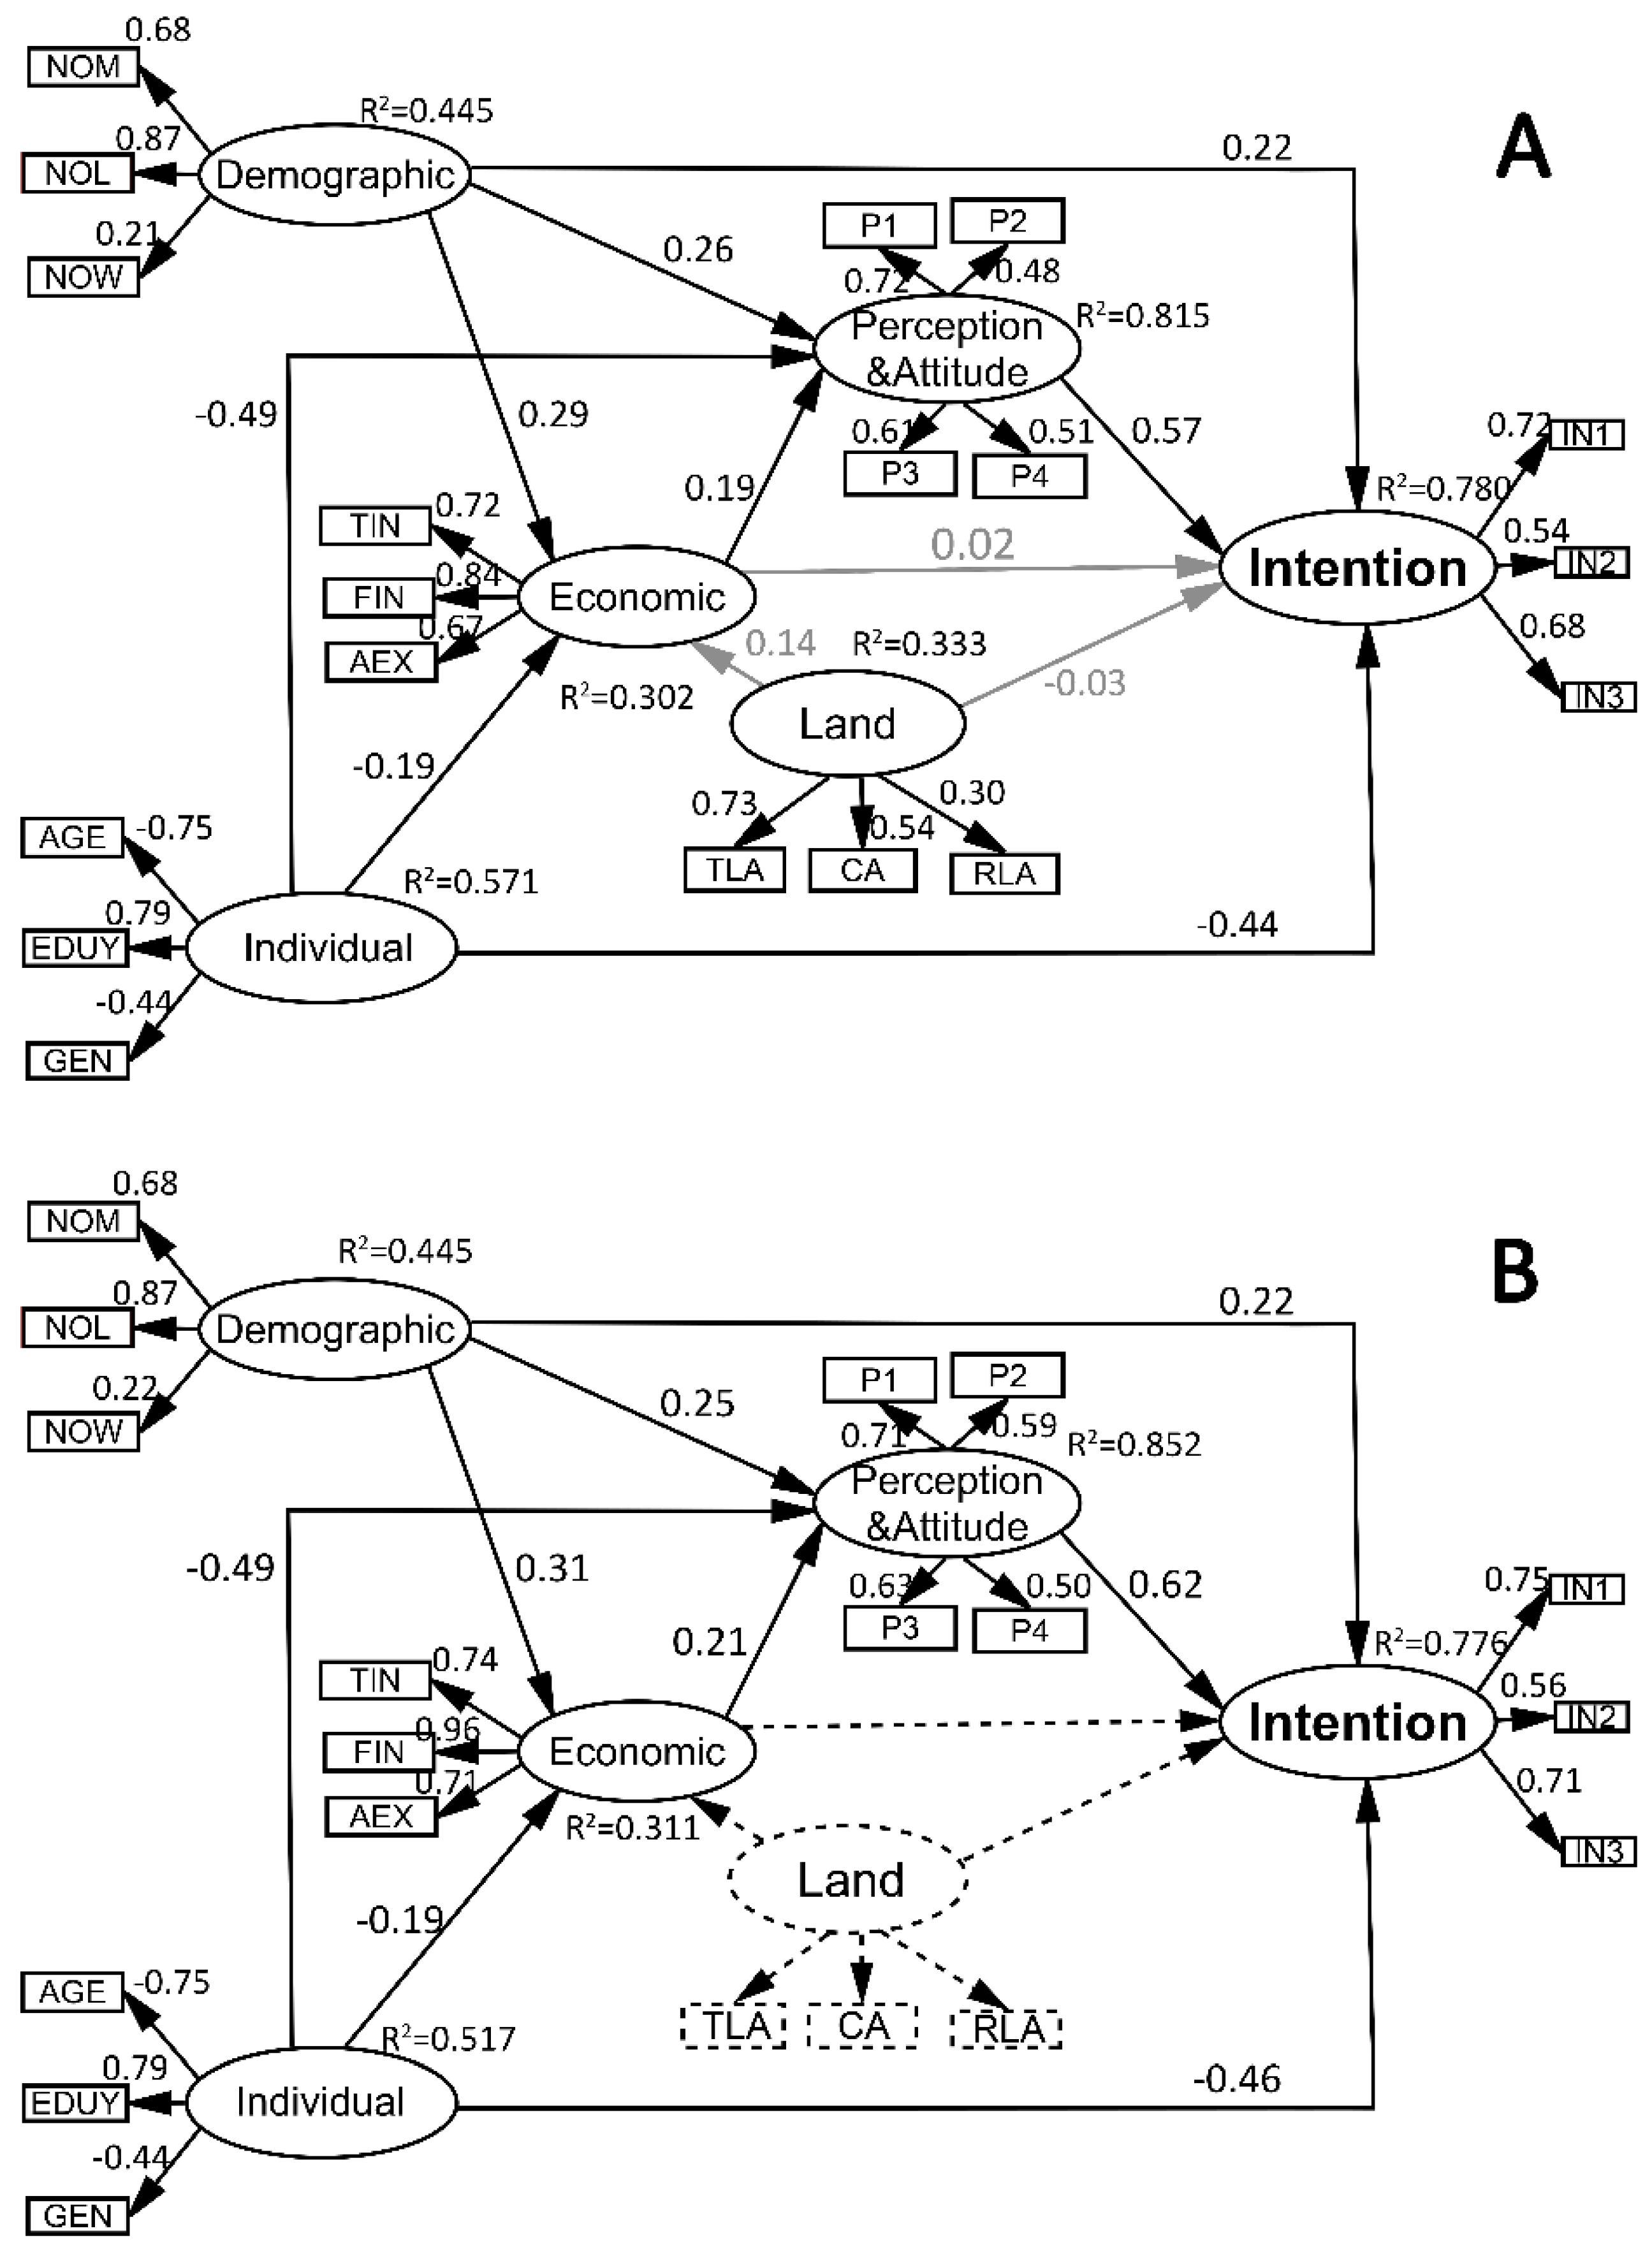
3.4. Hypothesis Testing, and the Estimation of Direct and Indirect Effects

All of the latent effect factors have a direct effect on farmers’ PEI except for the EI, which only has an indirect effect through the P&A on farmers’ PEI. Moreover, the IP and DP affected the PEI through two indirect pathways, as shown in Table 5. Both of these two indirect effects suggested the important mediating effects of P&A. In addition, the hypothesis testing results in Table 4 indicate that the H2, H3, and H7a were rejected and the other hypotheses were accepted.

4. Discussion

The results of the present study provide evidence for exploring farmers’ intentions to apply pro-ecological behavior after PES programs in fragile environment areas, and a better understanding of the comprehensive priorities of the factors of influence. The overall explanatory power of our research model had an R2 of 77.6% for intention to apply pro-ecological behavior. In addition, the directional linkages among the model’s latent variables were also explored. Several important results can be derived from the present research, and merit further discussion.

4.1. Farmers’ Intention to Apply Pro-Ecological Behavior was Comprehensively Influenced by Various Factors

Rather than study one-sided factors affecting farmers’ intentions concerning pro-ecological behavior, the present study tried to explore the effect of different kinds of factors on farmers’ PEI and obtained excellent results. The present study revealed that the influence of different kinds of factors on farmers’ PEI after the GTGP in the LPC is of a different degree, and operates through different pathways (Figure 3). For example, the households’ EI has an effect on farmers’ intention indirectly through their P&A concerning behavior, whereas the households’ DP and farmers’ IP affected farmers’ intentions both directly and indirectly, and the indirect influences had different pathways (Table 5). Clarifying the relationship between different factors and their mechanism of influence on farmers’ PEI is of great importance in designing extended and specific policies to preserve ecological achievements after the PES program.
The results showed that farmers’ PEI was jointly affected by their IP, households’ EI, DP, and their P&As toward pro-ecological behavior. This is consistent with the study [24] concerning farmers’ behaviors toward adopting improved grassland management in Mexico. P and A is the most influential factor in farmers intentions to apply pro-ecological behavior (path coefficient = 0.62). This confirms our earlier findings in Northern Shaanxi Province of China [21] and is consistent with other research [40,43] which showed that farmers’ perceived behavioral control and attitudes have a powerful impact on their intentions to apply ecological conservation behavior after the PES program. In addition, previous studies also proved that farmers’ individual characteristics have an effect on their intention to apply pro-ecological behavior after the PES program [11,12], which was confirmed in the present research. The farmers’ ages and genders had negative effects, but education level had a positive impact in explaining farmers’ PEI. This implies that younger and well-educated male participants tend to state a greater intention for continued pro-ecological behavior. Our results also provide powerful support for the hypothesis that farmers’ household demographic characteristics have a significant influence on their intentions to apply pro-ecological behavior (path coefficient = 0.22). In particular, farmers’ households that have more members and more available labor tend to state a greater intention for apply pro-ecological behavior after the GTGP in LPC. This is consistent with another study [19], but contrasts to research [12] which found that farmers’ households with more labor available are likely to reconvert revegetated land to cultivated land after the PES program, so they can handle more cropland and increase their farming income. Various reasons may lead to this difference and two are explicit [44]: first, the farming in the LPC is very inefficient and farmers are aware of this problem [21,22], and second, more and more laborers are becoming migrant workers (60% of the laborers are migrant workers in our survey). They obtained more advanced ideas and improved their view of ecological protection [45].

4.2. The Indirect Effect of Households’ EI and the Important Role of P and A on Farmers’ PEI

Another point should be concerned is that we didn’t observe a direct relationship between the households’ EI and farmers’ PEI based on the present survey and model. This is different from previous studies which have stated that the households’ EI has an impact on their land plan and conservation behavior after the PES program [12,18,22]. Due to the fact that we only used particular pathways of correlation, it is difficult to distinguish whether the insignificant direct relationship is real. However, the indirect relationship between households’ EI and farmers’ PEI after the GTGP (Figure 3B) revealed that farmers’ households EI have a significant effect on their P and A to applying pro-ecological behavior and then acting on their PEI. This may provide an inspiration that measures designed to encourage farmers to take pro-ecological actions should not only aim at improving their household economic income, but also recognize how to make farmers aware that they have the ability to take action, and improve their attitudes toward the PES program. It is important for policy-makers to design subsequent policies for strengthening the sustainability of GTGP and other PES programs.
Another issue of crucial importance in the present study is that the farmers’ P&As toward applying pro-ecological behaviors act as a vital link for other factors’ effects on farmers’ PEI after the GTGP. As more attention has been paid to the social-psychological construct of farmers’ ecological conservation intentions and behaviors after the PES program in recent years, the important role of farmers’ perceptions and attitudes has increasingly been recognized [20,46,47]. Farmers’ self-assessment of their abilities plays an important role in conserving ecological achievements. Specifically, farmers tend to make decisions based on their personal ability, family conditions, and estimation of costs and earnings [48], which have also been confirmed in the present research. Moreover, previous studies have illustrated that farmers who have recognized greater degrees of environmental improvement from GTGP are more willing to preserve ecological achievements than others [34]. These results underscore the fact that concerns about farmers’ perception and attitudes are foremost in promoting farmers’ PEI after the PES program. Thus, two approaches are recommended based on the present research. First, policy-makers and managers should endeavor to enhance farmers’ abilities to conserve ecological achievements including developing comprehensive regional developing measures to increase farmers’ income, and providing vocational skills training to increase their production efficiency. Second, efforts should also be made to enhance farmers’ perceptions of the ecological benefits of the PES program, for example by improving their community living conditions and environment, and by rolling out a wide range of publicity and training; such efforts are especially vital in fragile environment areas.

4.3. The External Factors Affecting Farmers’ PEI

The present study showed that farmers’ PEI was jointly affected by their IP, households’ EI, DP, and their P&As toward pro-ecological behavior, and proven that farmers’ P&As toward applying pro-ecological behavior act as a vital link for other factors’ effects on farmers’ PEI after the GTGP. These results were place emphasis on the intrapersonal factors on farmers’ pro-ecological intention and behavior. However, the important role of external factors towards farmers behavior have also been confirmed previously, such as the economic motivations were proven to be a crucial motivation for farmers operating commercial operations [49]. Research has indicated that the main factors affecting the extent of the farmers’ support for PES programs include reasonable compensation and the judgment of costs and benefits from the land [50]. Ruibin et al. (2014) showed that whether farmers intend to maintain ecological restoration achievements mainly depend on their evaluation of the earnings from the land, including economic and ecological benefits [51]. These studies showed a possibility that farmers may seek to cultivate land for which it is profitable to do so once they have stopped being paid to abstain from cultivation. Unfortunately, our findings and some existing studies suggest that this phenomenon may seem to be occurring in the GTGP [18,21]. Only 28.74% of the farmers were intending to apply pro-ecological behavior in our research area. In most of the GTGP implementation areas in China farmers can only obtain a minimal forest management subsidy after the termination of the living subsidy. The forest management subsidy is usually insufficient for GTGP land management. Furthermore, planting numerous simplex ecological forests (e.g., Robinia pseudoacacia L.) without any economic benefits may also lead to adverse effects on the farmers’ satisfaction and support with regard to the program [21,52]. Therefore, the economic motivations, mainly referring to providing sustained eco-compensation and increase farmers’ income from the forest, are as important as enhancing farmers’ perceptions of the ecological benefits to promote their pro-ecological intentions in PES programs in the EEF areas.

5. Conclusions

In the present research, we developed an empirical model based on the SEM to explore the factors affecting farmers’ pre-ecological intentions after the PES programs in fragile environment areas. Using household survey data from the GTGP area in the LPC, the research reported that only 28.74% of the respondents intended to apply the pre-ecological behavior. Farmers’ stated intentions to do so after the GTGP program are jointly affected by different kinds of factors such as their perceptions and attitudes, their individual characteristics, and household properties. Farmers’ P&As are the most influential factors for farmers’ PEI, and this is the vital link for the effect of other factors on farmers’ PEI after the GTGP in the LPC. Other factors, including farmers’ IP, household DP, and EI all showed significant indirect effects on farmers’ PEI through P&As. The P&As were mostly reflected in farmers’ self-assessment of their abilities and their perceptions of environmental improvement from the PES program. Thus, both the measurements contribute to promoting the farmers’ abilities to conserve ecological achievements or improve the community environment and improve the degree of ecological awareness concerning measures can enhance farmers’ PEI. IP is the second most important factor for PEI and the results suggest that young men with greater education are more likely to state a greater intention for protecting the ecological achievements after the PES program. In addition, the DP of the household is also of great importance for farmers’ PEI as farmers’ household with more members and more labors are more likely to state a greater intention for apply the pre-ecological behaviors. Moreover, farmers’ household EI only showed an indirect effect through P&As of their PEI, indicating that intervening measures that can both make farmers aware of their ability to take pro-ecological behavior into account and improve their household income. These characteristics should be valued by policy-makers and managers.

Acknowledgments

The study was financially supported by National Natural Science Foundation of China (No. 41571501) and Ph.D. research startup foundation of Yan’an University (No. YDBK2017-22).

Author Contributions

J.D., W.H., and G.Y. conceived and designed the experiments; and W.Z. and K.L. performed the experiments; X.H., J.D., and Y.F. analyzed the data; and J.D. wrote the paper.

Conflicts of Interest

The authors declare no conflict of interest. The founding sponsors had no role in the design of the study; in the collection, analyses, or interpretation of data; in the writing of the manuscript; or in the decision to publish the results.

References

  1. Hooper, D.U.; Adair, E.C.; Cardinale, B.J.; Byrnes, J.E.K.; Hungate, B.A.; Matulich, K.L.; Gonzalez, A.; Duffy, J.E.; Gamfeldt, L.; O’Connor, M.I. A global synthesis reveals biodiversity loss as a major driver of ecosystem change. Nature 2012, 486, 105–108. [Google Scholar] [CrossRef] [PubMed]
  2. Foley, J.A.; DeFries, R.; Asner, G.P.; Barford, C.; Bonan, G.; Carpenter, S.R.; Chapin, F.S.; Coe, M.T.; Daily, G.C.; Gibbs, H.K.; et al. Global consequences of land use. Science 2005, 309, 570–574. [Google Scholar] [CrossRef] [PubMed]
  3. Salim, E.; Ullsten, O. Our Forests, Our Future; Cambridge University Press: Cambridge, UK, 1999. [Google Scholar]
  4. MacDougall, A.S.; McCann, K.S.; Gellner, G.; Turkington, R. Diversity loss with persistent human disturbance increases vulnerability to ecosystem collapse. Nature 2013, 494, 86–89. [Google Scholar] [CrossRef] [PubMed]
  5. Tacconi, L. Redefining payments for environmental services. Ecol. Econ. 2012, 73, 29–36. [Google Scholar] [CrossRef]
  6. Wunder, S.; Wertz-Kanounnikoff, S. Payments for ecosystem services: A new way of conserving biodiversity in forests. J. Sustain. For. 2009, 28, 576–596. [Google Scholar] [CrossRef]
  7. Deng, J.; Sun, P.; Zhao, F.; Han, X.; Yang, G.; Feng, Y.; Ren, G. Soil C, N, P and Its Stratification Ratio Affected by Artificial Vegetation in Subsoil, Loess Plateau China. PLoS ONE 2016, 11, e0151446. [Google Scholar] [CrossRef] [PubMed]
  8. Zhao, F.; Chen, S.; Han, X.; Yang, G.; Feng, Y.; Ren, G. Policy-guided nationwide ecological recovery: Soil carbon sequestration changes associated with the Grain-to-Green Program in China. Soil Sci. 2013, 178, 550–555. [Google Scholar] [CrossRef]
  9. Peng, H.; Cheng, G.; Xu, Z.; Yin, Y.; Xu, W. Social, economic, and ecological impacts of the “Grain for Green” project in China: A preliminary case in Zhangye, Northwest China. J. Environ. Manag. 2007, 85, 774–784. [Google Scholar] [CrossRef] [PubMed]
  10. Jellinek, S.; Rumpff, L.; Driscoll, D.A.; Parris, K.M.; Wintle, B.A. Modelling the benefits of habitat restoration in socio-ecological systems. Biol. Conserv. 2014, 169, 60–67. [Google Scholar] [CrossRef]
  11. Cao, S.; Xu, C.; Chen, L.; Wang, X. Attitudes of farmers in China’s northern Shaanxi Province towards the land-use changes required under the Grain for Green Project, and implications for the project’s success. Land Use Policy 2009, 26, 1182–1194. [Google Scholar] [CrossRef]
  12. Chen, X.D.; Lupi, F.; He, G.M.; Ouyang, Z.Y.; Liu, J.G. Factors affecting land reconversion plans following a payment for ecosystem service program. Biol. Conserv. 2009, 142, 1740–1747. [Google Scholar] [CrossRef]
  13. Roberts, M.J.; Lubowski, R.N. Enduring impacts of land retirement policies: Evidence from the Conservation Reserve Program. Land Econ. 2007, 83, 516–538. [Google Scholar] [CrossRef]
  14. Johnson, P.N.; Misra, S.K.; Ervin, R.T. A qualitative choice analysis of factors influencing post-CRP land use decisions. J. Agric. Appl. Econ. 1997, 29, 163–173. [Google Scholar] [CrossRef]
  15. Page, G.; Bellotti, B. Farmers value on-farm ecosystem services as important, but what are the impediments to participation in PES schemes? Sci. Total Environ. 2015, 515–516, 12–19. [Google Scholar] [CrossRef] [PubMed]
  16. Lise, W. Factors influencing people’s participation in forest management in India. Ecol. Econ. 2000, 34, 379–392. [Google Scholar] [CrossRef]
  17. Greiner, R. Motivations and attitudes influence farmers’ willingness to participate in biodiversity conservation contracts. Agric. Syst. 2015, 137, 154–165. [Google Scholar] [CrossRef]
  18. Yang, X.; Xu, J. Program sustainability and the determinants of farmers’ self-predicted post-program land use decisions: Evidence from the Sloping Land Conversion Program (SLCP) in China. Environ. Dev. Econ. 2014, 19, 30–47. [Google Scholar] [CrossRef]
  19. Dolisca, F.; Carter, D.R.; McDaniel, J.M.; Shannon, D.A.; Jolly, C.M. Factors influencing farmers’ participation in forestry management programs: A case study from Haiti. For. Ecol. Manag. 2006, 236, 324–331. [Google Scholar] [CrossRef]
  20. Mastrangelo, M.E.; Gavin, M.C.; Laterra, P.; Linklater, W.L.; Milfont, T.L. Psycho-Social Factors Influencing Forest Conservation Intentions on the Agricultural Frontier. Conserv. Lett. 2014, 7, 103–110. [Google Scholar] [CrossRef]
  21. Deng, J.; Sun, P.; Zhao, F.; Han, X.; Yang, G.; Feng, Y. Analysis of the ecological conservation behavior of farmers in payment for ecosystem service programs in eco-environmentally fragile areas using social psychology models. Sci. Total Environ. 2016, 550, 382–390. [Google Scholar] [CrossRef] [PubMed]
  22. Bo, N.; Ning, M.; Houqiang, Z.; Li, H. Empirical Analysis on the Influencing Factors of Farmer Households’ Willingness of Maintaining the Results of the Conversion of Cropland to Forestland Program in Western China. For. Econ. 2014, 4, 72–76. [Google Scholar]
  23. Li, H.; Yao, S.; Guo, Y. Analysis on Willingness of Farmers’s Strengthening Fruit of SLCP in Loess Plateau under New Subsidy. J. Huazhong Agric. Univ. (Soc. Sci. Ed.) 2011, 6, 76–82. [Google Scholar]
  24. Martínez-García, C.G.; Dorward, P.; Rehman, T. Factors influencing adoption of improved grassland management by small-scale dairy farmers in central Mexico and the implications for future research on smallholder adoption in developing countries. Livest. Sci. 2013, 152, 228–238. [Google Scholar] [CrossRef]
  25. Beedell, J.; Rehman, T. Using social-psychology models to understand farmers’ conservation behaviour. J. Rural Stud. 2000, 16, 117–127. [Google Scholar] [CrossRef]
  26. Yin, R.; Liu, C.; Zhao, M.; Yao, S.; Liu, H. The implementation and impacts of China’s largest payment for ecosystem services program as revealed by longitudinal household data. Land Use Policy 2014, 40, 45–55. [Google Scholar] [CrossRef]
  27. Liu, J.; Li, S.; Ouyang, Z.; Tam, C.; Chen, X. Ecological and socioeconomic effects of China’s policies for ecosystem services. Proc. Natl. Acad. Sci. USA 2008, 105, 9477–9482. [Google Scholar] [CrossRef] [PubMed]
  28. Fu, B.; Chen, L.; Ma, K.; Zhou, H.; Wang, J. The relationships between land use and soil conditions in the hilly area of the loess plateau in northern Shaanxi, China. CATENA 2000, 39, 69–78. [Google Scholar] [CrossRef]
  29. State Forestry Administration of China. China Forestry Statistical Yearbook; China Forestry Press: Beijing, China, 2012.
  30. Yang, W.Z.; Shao, M.A. Soil Water Research on the Loess Plateau; Science Press: Beijing, China, 2000. [Google Scholar]
  31. Liu, Z.; Shao, M.; Wang, Y. Effect of environmental factors on regional soil organic carbon stocks across the Loess Plateau region, China. Agric. Ecosyst. Environ. 2011, 142, 184–194. [Google Scholar] [CrossRef]
  32. National Development and Reform Commission, The Ministry of Water Resourcrs of the People’s Republic of China, Ministry of Agriculture of the People’s Republic of China, and State Forestry Administration of the People’s Republic of China. Comprehensive Management Planning Outline of Loess Plateau (2010–2030); National Development and Reform Commission, The Ministry of Water Resourcrs of the People’s Republic of China, Ministry of Agriculture of the People’s Republic of China, and State Forestry Administration of the People’s Republic of China: Beijing, China, 2010.
  33. National Bureau of Statistics of the People’s Republic of China. Statistical Bulletin of China’s National Economic and Social Development in 2014; National Bureau of Statistics of the People’s Republic of China: Beijing, China, 2014.
  34. Wang, S.; Zhi, L.; Zhang, Y. The Research Analysis about the Choose of Farmers’ Rehabilitation in the Later of Returning Land from Farming to Forestry—Cases Study of Anding District in Gansu Province. Probl. For. Econ. 2010, 30, 478–481. [Google Scholar]
  35. Cao, S.; Chen, L.; Yu, X. Grain for Green Project: Willingness evaluation of the farmers in northern Shaanxi Province of China. J. Appl. Ecol. 2009, 20, 426–434. [Google Scholar]
  36. Chen, X.; Lupi, F.; He, G.; Liu, J. Linking social norms to efficient conservation investment in payments for ecosystem services. Proc. Natl. Acad. Sci. USA 2009, 106, 11812–11817. [Google Scholar] [CrossRef] [PubMed]
  37. Ajzen, I. Theory of Planned Behavior; Sage: London, UK, 2011; Volume 1, pp. 438–459. [Google Scholar]
  38. Meijer, S.S.; Catacutan, D.; Sileshi, G.W.; Nieuwenhuis, M. Tree planting by smallholder farmers in Malawi: Using the theory of planned behaviour to examine the relationship between attitudes and behaviour. J. Environ. Psychol. 2015, 43, 1–12. [Google Scholar] [CrossRef]
  39. Oppenheim, A.N. Questionnaire Design, Interviewing and Attitude Measurement; Bloomsbury Publishing: London, UK, 2000. [Google Scholar]
  40. Borges, J.A.R.; Oude Lansink, A.G.J.M.; Marques Ribeiro, C.; Lutke, V. Understanding farmers’ intention to adopt improved natural grassland using the theory of planned behavior. Livest. Sci. 2014, 169, 163–174. [Google Scholar] [CrossRef]
  41. Kaiser, H. An index of factorial simplicity. Psychometrika 1974, 39, 31–36. [Google Scholar] [CrossRef]
  42. Bartlett, M.S. A note on the multiplying factors for various chi square approximations. Ann. Math. Stat. 1940, 11, 204–209. [Google Scholar]
  43. Poppenborg, P.; Koellner, T. Do attitudes toward ecosystem services determine agricultural land use practices? An analysis of farmers’ decision-making in a South Korean watershed. Land Use Policy 2013, 31, 422–429. [Google Scholar] [CrossRef]
  44. Burton, R.J.F. The influence of farmer demographic characteristics on environmental behaviour: A review. J. Environ. Manag. 2014, 135, 19–26. [Google Scholar] [CrossRef] [PubMed]
  45. Goldsmith, P.D.; Gunjal, K.; Ndarishikanye, B. Rural-urban migration and agricultural productivity: The case of Senegal. Agric. Econ. 2004, 31, 33–45. [Google Scholar]
  46. Price, J.C.; Leviston, Z. Predicting pro-environmental agricultural practices: The social, psychological and contextual influences on land management. J. Rural Stud. 2014, 34, 65–78. [Google Scholar] [CrossRef]
  47. Wauters, E.; Mathijs, E. An Investigation into the Socio-psychological Determinants of Farmers’ Conservation Decisions: Method and Implications for Policy, Extension and Research. J. Agric. Educ. Ext. 2012, 19, 53–72. [Google Scholar] [CrossRef]
  48. Shuifa, K. Empirical and Theory Research of Farmers Participate in the Returning Farmland to Forest Program; China Agriculture Press: Beijing, China, 2007. [Google Scholar]
  49. Vik, J.; McElwee, G. Diversification and the Entrepreneurial Motivations of Farmers in Norway*. J. Small Bus. Manag. 2011, 49, 390–410. [Google Scholar] [CrossRef] [Green Version]
  50. Cacho, O.J.; Milne, S.; Gonzalez, R.; Tacconi, L. Benefits and costs of deforestation by smallholders: Implications for forest conservation and climate policy. Ecol. Econ. 2014, 107, 321–332. [Google Scholar] [CrossRef]
  51. Kang, R.; Yan, X.X.; Wang, L.Q. Study on the Farmer’s Willingness to Maintain the Results from Returning the Grain Land to the Forestry and the Affecting Factors—A case Study in Datong County, Shanxi Province. For. Econ. 2014, 3. [Google Scholar] [CrossRef]
  52. Cao, S.; Chen, L.; Liu, Z. An investigation of Chinese attitudes toward the environment: Case study using the Grain for Green Project. Ambio 2009, 38, 55–64. [Google Scholar] [CrossRef] [PubMed]
Figure 1. Study area and the sample plots.
Sustainability 10 00029 g001
Figure 2. The theoretical model showing the factors affecting farmers’ pro-ecological intention. Each ellipse is a latent variable. The arrows are the influence paths and label in the arrow is the hypotheses number.
Sustainability 10 00029 g002
Figure 3. Graphical output and the standardized path coefficients of initial (A) and final (B) model for factors affecting farmers’ pro-ecological intention. The direction of arrow is the influence direction. Arrows in black mean a significant effect, while those in gray indicate insignificant effect. The dashed lines indicate that these paths are analyzed in the initial model but dropped in the final model. The values close to the path arrow is the standardized path coefficients. R2 is the coefficient of determination, which is also the rate of interpreted variance. Minus means the negative effect.
Sustainability 10 00029 g003
Table 1. Variable descriptions included in the initial model and its value range.
Constructs (Abbreviation)VariablesDescription of Variables and Questions (Unit)Ranges
Individual properties (IP)AGEAge of respondent (year)15–78
EDUYEducation years of respondent (year)0–16
GENGender of respondentFemale (0)–Male (1)
Demographic properties
(DP)
NOMNumber of respondent’s family member (person)2–11
NOLNumber of labor force in respondent’s family (person)0–8
NOWNumber of migrant workers in respondent’s family (person)0–7
Economic indexes (EI)TINTotal income in a year (USD)$76.923–$77,779.811
FINFarming income in a year (USD)$0–$55,111.371
AEXAgricultural expenditure in a year (USD)$0–$42,740.523
SUBSubsidies from ecological restoration program (USD)$0–$3500
Land properties
(LP)
TLATotal land area, include cultivated land, and forest land (ha)0.10–10.600
CACultivated land area (ha)0–8.000
RLAEcological restoration land of household (ha)0–5.33
Perception and attitudes
(P&A)
P1The income of my family was increased benefit from the achievements and subsidy of ecological restoration program.“strongly disagree” (1)–“strongly agree” (5)
P2I have sufficient resources (labor, time and financial resources) to apply pro-ecological behavior.
P3Our living environment was improved because of the ecological benefits from ecological governance.
P4I support the behaviors of protecting ecology.
Pro-ecological intention
(PEI)
IN1I was willing to apply pro-ecological behavior.“very reluctant” (1)–“very glad” (5)
IN2I was willing to publicize and promote pro-ecological behavior to people around me
IN3I was willing to learn new knowledge and technology about protecting ecosystems.
Table 2. Social-economical characteristics of sample individuals and households.
Index (Unit)MeanStandard Deviation
Age (year)45.1512.50
Education level (year)5.634.77
Gender (0 = female; 1 = male)0.650.48
Number of laborers in a family (person)2.901.32
Total income (USD)$6665.22$5801.05
% farming income from total income33.7936.60
% governmental subsidy from total income8.3210.52
Total land area (ha)1.471.14
% ecological restoration land from total land40.7832.22
% farmers’ willing to apply pro-ecological behavior28.74--
Farmers’ support degree of protecting ecology (1 = not support; 5 = support)3.421.21
Table 3. Exploratory factor analysis and reliability testing. The rotation method is Varimax with Kaiser normalization. Rotation converged in six iterations (N = 2025) and factor loading with a value larger than 0.50 in absolute terms are in bold.
VariablesFactor 1 LoadingFactor 2 LoadingFactor 3 LoadingFactor 4 LoadingFactor 5 LoadingCronbach’s Alpha Value
Individual properties 0.598
AGE−0.173−0.821−0.0410.025−0.003
EDUY0.230.7610.1180.030.059
GEN0.1730.5650.0770.111−0.007
Demographic properties 0.695
NOM0.0990.1450.1330.8220.038
NOL0.1810.2490.1980.7450.011
NOW0.008−0.337−0.1140.6210.075
Economic index 0.823
TIN0.1920.1370.7790.226−0.024
FIN0.1130.0670.9210.0350.07
AEX0.0660.0610.826−0.0140.148
Land properties 0.739
TLA0.0280.0440.0950.0310.948
CA−0.0430.250.0170.0370.801
RLA0.094−0.2540.0860.0470.673
Perception & attitude 0.726
P10.6370.2470.2120.1830.099
P20.7140.1580.0160.1090.043
P30.7270.1480.1870.090.01
P40.7410.1040.028−0.037−0.033
Variance contribution rate28.85%14.90%9.47%7.73%2.30%
Accumulated variance contribution rate63.260%
Overall Cronbach’s alpha value0.708
Kaiser-Meyer-Olkin0.717
Bartlett’s test of sphericity<0.001
Table 4. Goodness of fit measures of initial and final model. χ2/df = chi-squared fit statistic, RMSEA = the root means square error of approximation, GFI = goodness of fit index, NFI = normed fit index, CFI = comparative fit index, PGFI = parsimonious goodness of fit index, PNFI = parsimonious normal-fit index. Indices in bold means did not reach the recommended levels.
Fit IndexIndexRecommended LevelsEstimate Values for Initial ModelEstimate Values for Final Model
Absolute fit indexχ2/df<57.124.868
RMSEA<0.100.0810.072
GFI>0.90.8900.932
Incremental fit indicesNFI>0.90.8290.898
CFI0 (no fit) to 1 (perfect fit)0.8480.914
Parsimony fit indicesPGFI>0.50.4790.658
PNFI>0.50.5930.719
Table 5. Hypothesis test, and estimation of direct and indirect effect for different pathways. The effect pathways are from the final model. Estimate = Standardized regression weights; S.E. = standardized error; C.R. = critical ratio, dividing the regression weight estimate by the estimate of its standard error. * Means the estimate, S.E. C.R., and p used for this is not standardized and was rejected in the initial model.
HypothesisEffect PathwayEstimateS.E.C.R.pTest Result
Direct effectH1IP→PEI−0.4600.069−10.744<0.01Validated
H2 *LP→PEI−0.0349.1752.4290.052Rejected
H3 *EI→PEI0.060.0031.6630.096Rejected
H4P&A→PEI0.6240.06012.092<0.01Validated
H5DP→PEI0.2150.0676.093<0.01Validated
H6aEI→P&A0.2070.1435.520<0.01Validated
H6bIP→P&A−0.4870.062−10.913<0.01Validated
H6cDP→P&A0.3110.0717.127<0.01Validated
H7a *LP→EI0.04549.1752.4290.055Rejected
H7bIP→EI−0.1900.014−4.972<0.01Validated
H7cDP→EI0.2510.0176.268<0.01Validated
Indirect effect EI→P&A→PEI0.129----<0.01
IP→EI→P&A→PEI
IP→P&A→PEI
−0.328----<0.01
DP→EI→P&A→PEI
DP→P&A→PEI
0.227----<0.01
IP→EI→P&A−0.039----<0.01
DP→EI→P&A0.052----<0.01

