Evaluation of Future Water Use for Electricity Generation under Different Energy Development Scenarios in China


1
Academy of Chinese Energy Strategy, China University of Petroleum—Beijing, Beijing 104429, China
2
Department of Geography and Resource Management, and Institute of Environment, Energy and Sustainability, The Chinese University of Hong Kong, Hong Kong, China
*
Author to whom correspondence should be addressed.
Sustainability 2018, 10(1), 30; https://doi.org/10.3390/su10010030
Submission received: 16 October 2017
/
Revised: 15 December 2017
/
Accepted: 15 December 2017
/
Published: 23 December 2017
(This article belongs to the Special Issue Sustainable Electric Power Systems Research)
Abstract
:Water scarcity and uneven water demand in regional electricity generation pose substantial challenges to the sustainable development of water resources and electricity production in China. Based on the latest official policy of China’s electricity development, i.e., the 13th Five-Year Plan of electricity development, this study quantified annual water withdrawal and consumption for future electricity generation in China from 2015 to 2030. This study simulated a three-prong approach to impacting water use for electricity development, i.e., updating the cooling technology mix, increasing non-thermal power generation and relocating thermal power plants to the west. The results showed that solutions to relieve water stress caused by electricity production entail major trade-offs. Annual water withdrawal and consumption were projected to exceed 63.75 and 8.30 billion m3 by 2030, up approximately 14% and 21% of those in 2015, respectively, if China does not implement any new water and energy policies. Replacing once-through cooling systems with closed-loop cooling systems would decrease national water withdrawal remarkably but increase water consumption. The west-centered spatial distribution of thermoelectric power generation would reduce water use at the national level; however, it will largely increase water stress in northern and northwestern China. Thus, relieving the stress of growing electricity demand on water resources in China requires comprehensive measures and quantitative estimates.
1. Introduction
Water is an essential input in electricity generation. Cooling water is indispensable for generating electricity and normally constitutes the largest portion of industrial wastewater discharge [1,2]. Water evaporating from man-made reservoirs in hydropower plants is of a considerable amount [3]. The growing use of biofuels requires increasingly more irrigation water [4]. In the United Kingdom and the United States, the electricity sector accounts for approximately half of all water withdrawn for industrial use [5,6]. This interdependence between water and energy resources has been increasingly studied as the water–energy nexus, and has attracted much attention in recent years [7,8].
China has been experiencing rapid economic growth, which has led to high electricity consumption. China’s installed and generating capacities rank first in the world after years of rapid development [9]. Presently, China continues to undergo urbanization and industrialization, and its per-capita electricity consumption is less than half of that in developed countries [9]. Along with its continued economic growth largely driven by industrialization and modernization, China’s installed and generating capacities are expected to continue to increase in the future. However, water resources are becoming major constraints on rapid growth in electricity consumption. In China, energy extraction, processing, and power generation amount for 64.0% of the national total industrial freshwater withdrawals in 2007 according to the first national pollution source census conducted by the Ministry of Environmental Protection (MEP) [1]. Moreover, China experiences severe water shortages, with a spatial mismatch between water resources and the energy industry’s demand for water. For example, the amount of coal, crude oil, and electricity production in northern China accounts for more than 60% of the national total in 2015 [9], whereas the amount of annual average water resources in that area accounts for only approximately 16% of the national total [10]. Nevertheless, recent energy development policies have planned to increase the amounts of coal extraction and power generation in the northern part of the country [11,12], a region with large coal reserves but limited water availability. This water-intensive expansion certainly leads to more severe water crisis and thus aggravates water scarcity problems.
Currently, policy-making related to energy is separate from that related to water. Despite energy choices entailing numerous trade-offs, including trade-offs in water use, little direct official action is aimed at managing water use for energy generation. Multiple departments with the same power and rank are involved in energy and water resource management in China. In addition, several official organizations are responsible for statistics, accounting, and reporting regarding both resources and their usage. Therefore, the problems are under separate accounting systems and statistical standards, which makes effective accounting and comparison difficult.
To understand the relationship between water and energy, researchers have quantified and projected water demands of the energy sector and power generation at global, national, regional and plant levels [5,6,7,13,14,15,16,17,18]. Particularly in China, studies on water for energy have attracted much attention in the recent five years, which focus on the whole energy production chain [19,20], the international trade of energy resources [21], thermoelectric power production [22,23], coal-fired power production [18,24], biofuel production [4], hydropower generation [3] and solar power infrastructure [25]. Most of the studies estimate and assess current and historical status [4,18,19,21,24,25]. Several studies concern future water used in energy generation because of the increasing trend in future energy demand in China [20,26], especially the large volume of future water used in electricity generation [22,23]. Cai et al. estimated that water withdrawal will increase by 77% by 2030 based on the International Energy Agency (IEA)’s energy scenarios, and concluded 67% of energy production will occur in areas which face water scarcity [20]. Qin et al. also used the IEA’s energy scenarios to assess future water demands for energy from the initial resources and the services. This study revealed that to comply with the “Three Red Lines” water policies, which aim to reduce industrial water use, China should implement several measures with trade-offs for both water and energy [26]. Liao et al. used the World Wide Fund for Nature (WWF)’s energy development scenarios to project future water withdrawal and consumption from 2014 to 2050 at both national and regional levels [22]. The results showed that improving energy efficiency or transforming the energy infrastructure to renewable or low-carbon sources provides an opportunity to reduce water use by over 50%. Although Liao et al.’s projections were conducted under the scenarios at provincial levels, the scenarios assume future provincial electricity demand would be satisfied by its local electricity production. This assumption ignores the spatial mismatch between electricity demand and supply in China, which results in a large amount of multiprovincial electricity transmission posing a challenge in managing water scarcity in various regions. For example, the amount of electricity transmission among provinces and power grids was more than 126 GWh in 2016, accounting for 21.3% of the national total electricity consumption [27]. According to the latest 13th five-year (2016–2020) plan of the electricity development, just the transmission capacity of the west-to-east power transfer project, which was designed to bring China’s western electricity to China’s electricity-hungry east, will be up to 270 GW by 2020 [11]. Therefore, it will be more important to focus on the water impact of future electricity production rather than that of future electricity demand. Moreover, at the end of the year 2016, China’s National Development and Reform Commission, which is in charge of China’s energy development, released an official plan to set up the foundations and principles of electricity development in the following five years, i.e., the 13th Five-Year Plan of electricity development. Subsequently, provincial governments released their 13th Five-Year Plans of energy development. However, the impact on water resources of these latest electricity development plans has not yet been assessed.
The main purpose of this study is to evaluate future water use for national and regional electricity generation under the latest official policy of China’s electricity development and to simulate different approach to impacting water use in electricity production. The following section describes the methods for calculating water withdrawal and consumption in future electricity generation. The scenario setting and data sources are described. Section 3 presents the results of water withdrawal and consumption at national and regional levels under different scenarios. Section 4 discusses the results and their policy implications. Section 5 concludes the study.
2. Methods
2.1. Methodology
To study water use in energy production, distinguishing between water withdrawal and water consumption is crucial [2]. Water withdrawal represents water that is diverted or withdrawn from a surface water or groundwater source. By contrast, water consumption represents the water that is withdrawn from natural water bodies, but that does not return to the environment, being consumed through evaporation, absorbed by a product, or lost by other means [19]. In this study, both water withdrawal and consumption were estimated. In addition, although the life cycle water use of energy sector is important and should be investigated, only operational freshwater uses are analyzed in this study.
A bottom-up approach was employed in this study to evaluate the water demands for the electricity generation sector in China at a provincial level, using the following equation:
where Wi and Ci refer to water withdrawal and consumption for electricity generation in province i respectively; w and c are the water withdrawal and consumption factors; e is the amount of electricity generation; k indicates the fuel types considered in this study, namely thermal power, nuclear power, wind power, solar PV power, and hydropower; therefore, n equals 5; and i is the index of provinces.
In particular, for thermal power generation, since different cooling technologies have different water intensities, the water demands of a province can be calculated using the following equation:
where Wthermal,i and Cthermal,i are water withdrawal and consumption for thermal power generation in province i; wg and cg are water withdrawal and consumption factors of various types of cooling technology (i.e., once-through cooling, closed-loop cooling, and air cooling); pg,i is the proportion of cooling technology g in province i; ethermal,i is the amount of thermal power generation in province i; and i is the index of provinces.
2.2. Electricity Generation Scenarios
This section introduces the five scenarios adopted to evaluate the possible trend in water demand by the power generation industry in China. The scenarios were designed based on the considerations of mitigating environmental and resource pressures. All scenarios had the same national total electric power generation values (i.e., 6834 TWh in 2020 and 8521 TWh in 2030), which were approximated from the 13th Five-Year Plan of electricity development issued in November 2016 [11] and a study by the China Energy Research Society [28]. The latest plan issued a blueprint for electricity development for the next five years, including the capacity of various types of electricity generation and the planned amount of electricity generation at the national level in 2020. The planned amount of electricity generation is 6800 to 7200 TWh in 2020; the proportion of nonthermal power is 29%. The plan also announced the installed capacity of hydropower, nuclear, solar PV, wind and biomass power, with the figures of 380 GW, 58 GW, 105 GW, 210 GW, and 15 GW, respectively. However, the plan didn’t contain province-specific electricity generation amount. The provincial 13th Five-Year Plans of energy development and relevant policies were examined and the planned amounts of various types of electricity generation were collected. The latter study projected the amounts of various types of electricity generation in 2020 and 2030 not only at the national level but also at the provincial level. It was used to disaggregate provincial distribution of future electricity production in 2030. These estimates were used as a reference scenario for provincial electric power generation in this study (Table S2).
To design the scenarios of electricity generation, two other factors were considered. One is the electricity generation mix, which refers to shares of different power generation technologies (i.e., thermal power, nuclear power, hydropower, wind power, and solar photovoltaic (PV) power. We designed a “power generation reallocation” scenario (“reallocation” for short; Table S3), in which the national proportion of non-thermal power generation increases to 35% by 2020 and 40% by 2030. The other is the spatial distribution of new thermal power production. We designed a “west-centered thermal power generation” scenario (“west-centered” for short; Table S4) to coordinate power development with a stringent air quality policy. To protect air quality, new thermal power plants have been banned in the three eastern areas. In the west-centered scenario, newly built thermal power plants are moved from east to north. The amount of electric power generation under the three scenarios at the regional level is shown in Table 1.
Water use intensities are reduced by upgrading cooling technology in thermal power production. The three cooling technologies in use are once-through cooling systems, which withdraw large amounts of water but consume little water; closed-loop cooling systems, which withdraw less but consume more water per unit of generation than once-through cooling systems in similar power plants; and air-cooling systems, which do not use freshwater for cooling. At power plants equipped with air-cooling systems, freshwater is used only for equipment flushing and drinking; therefore, water withdrawal and water consumption are both minimal. The replacement of once-through cooling systems with closed-loop cooling systems decreases local water withdrawal intensity. Increasing the proportion of air cooling in water-scarce regions by equipping newly built thermal power plants with air-cooling systems can substantially mitigate water resource stress.
Combining the aforementioned electricity generation scenarios and water use intensity scenarios produces five scenarios. The first scenario (S0) is the “business as usual” case, which reflects no water conservation measures or energy development policies under resource and environmental constraints. This scenario assumes that the current water use intensities will remain unchanged, and represents a mix of cooling technology without any change. The energy mix and layout of the year 2020 are derived from those issued in the 13th Five-Year Plans, which means that no environment-friendly measures will be implemented in energy development.
Scenario 1 (S1) is the “cooling technology updating” case, which reflects the effect of updating cooling technology, and assumes that the energy mix and layout are the same as those in 2015. In this scenario, the proportion of air cooling in water-scarce regions (i.e., the North, Northwest, and SX-InnerM regions) is increased by equipping newly built thermal power plants with air-cooling systems. In addition, once-through cooling systems are gradually replaced by closed-loop cooling systems in all regions. This scenario represents the effect of end-of-pipe measures and improvement of technology.
Scenario 2 (S2) is the “power generation reallocation” case, which represents a decreasing proportion of thermal power generation. This scenario assumes that cooling technology remains the same as that in 2015, whereas the proportion of non-thermal power generation will reach 35% by 2020 and 40% by 2030. Regarding to the provincial disaggregation of non-thermal power generation, firstly it was assumed that future proportions of wind, hydropower and solar PV at a national level would all increase by 2% in 2020 and by 2.67% in 2030 (compared with that in the “reference” scenario, the proportion of non-thermal power generation in the “reallocation” scenario is increased from 29% to 35% by 2020 and from 32% to 40% by 2030). Then the proportion of each province was regarded as the same as that in the “reference” scenario. The comparison of water use saving in S1 and S2 indicates the individual effects of two types of measures in mitigating environmental and resource pressures. Moreover, Scenario 3 (S3) combines the measures in S1 and S2.
Scenario 4 (S4) is designed to reflect the changes in the spatial distribution of thermal power generation. New thermal power plants have been banned in Beijing, Tianjin, Hebei, the Pearl River Delta, and the Yangtze River Delta to reduce air pollution in these regions. The electricity demand in these regions will be satisfied through import from the SX-InnerM and northwest regions.
2.3. Data
In this study, water withdrawal and consumption for electricity generation come from both fresh water extracted from natural water bodies (i.e., surface water and groundwater) and supplied by tap water. Seawater usually used in thermal power plants or nuclear power stations was not considered. A number of review articles have addressed the water withdrawal and consumption intensities of various types of electric power generation based on data from U.S. power plants [29,30,31] and UK power plants [5]. Zhang et al. have extracted China-specific water use intensities from the Energy Efficiency Benchmarking Report by the China Electricity Council (CEC), determining individual power plants’ operational performance and providing the water withdrawal factors of EGUs for different cooling technologies and generator scales [32,33]. In this study, we calculated average water use intensities of various cooling technologies according to installed capacity and corresponding water use intensities derived from the study by Zhang et al.
In terms of coastal nuclear power generation, the amount of seawater used for cooling was not included in this study. Freshwater use in nuclear power generation includes water used for equipment flushing, desalination, and drinking. The water withdrawal factor of nuclear power generation was reported by Guo et al. [34] (i.e., 0.0543 m3/MWh), whereas the water consumption of nuclear power generation is calculated as water withdrawn minus water recycled (3.75%) (i.e., 0.0523 m3/MWh). For future inland nuclear power plants, no data exist on water use factors. We have assumed that their water use factors are 1.5 times those of closed-loop cooling systems in thermal power plants [35].
Wind power and solar PV power generation require negligible amounts of water during normal operation [31]. Therefore, this study considered their water use factors to be zero, which is also used in the previous studies of operational water use for electricity generation in China [20,36], the United States [6], the United Kingdom [5], India [16] and globally [15]. For hydropower generation, water is consumed through evaporation from a reservoir’s surface. However, reservoirs often serve many purposes, including providing irrigation water and fishing; thus, not all the evaporation can be attributed to hydropower generation [3]. Moreover, water evaporated from a reservoir’s surface is not used for the purposes of human life and production, which is also not included in statistics. Consequently, this study considered fresh water used for hydropower generation to be zero.
The above-mentioned values of water withdrawal and consumption factors are summarized in Table 4.
3. Results and Analysis
3.1. National Water Withdrawal and Consumption for Electricity Generation under Various Water–Energy Strategies
National total water withdrawal and consumption are shown in Figure 1 by scenario. Under S0, without any water conservation technologies and environment-friendly energy policies, the amounts of both water withdrawal and consumption for electricity generation increase because of the expansion of electricity generation. Electricity generation increases by 21% and 51% from 2015 to 2020 and from 2015 to 2030, respectively; in the same periods, water withdrawal increases by 5% and 14%, respectively, and water consumption increases by 8% and 21%, respectively.
Under the other scenarios, the amounts of both water withdrawal and consumption drop first during 2015–2020 and then increase during 2020–2030. Regarding the water withdrawal factor, measures to conserve water and implement environment-friendly energy policies markedly decrease the amounts. In particular, saving water by updating cooling technologies under S1 reduces water withdrawal by 9–16% in the subsequent 15 years. Compared with S1, S2, in which the proportion of nonthermal power generation increases to 35–40%, has a smaller effect on water withdrawal reduction, with the reduction being 2–4%.
Both shifts in cooling technologies (S1) and in power generation reallocation (S2) have a considerable impact on the reduction of electricity sector water withdrawal. However, the shift in cooling technologies has a larger reduction impact. The water withdrawal intensities of thermal power generation are much larger than those of nuclear power, wind power, and hydropower. For example, air-cooling technology requires the least water withdrawal among the three cooling technologies, with a value of 0.34 m3/MWh, whereas nuclear power withdraws only 0.0543 m3/MWh, and the water withdrawal intensities of wind and hydropower are both trivial and set to zero. Moreover, thermal power generation is responsible for the majority of electricity generation, accounting for 56–65% under S1 and 48–59% under S2. Third, different cooling technologies have considerable differences in water withdrawal intensity. For example, once-through cooling, closed-loop cooling, and air cooling have national average water withdrawal values of 89.13 m3/MWh, 2.37 m3/MWh, and 0.34 m3/MWh, respectively. Therefore, the shift from thermal power generation to nuclear power, wind power, and hydropower generation provides a smaller water withdrawal reduction than the shift in cooling technologies.
Compared with S1, the results of S4 show a 15–18% reduction in water withdrawal. S1 and S4 have the same scales but different layouts of thermal power generation. Under S4, the SX-InnerM region and the Northwest region account for more than 60% of the national total new thermal power generation during 2015–2020. This west-centered layout of new thermal power plants contributes to reduction of national total water withdrawal for two reasons: (1) Water withdrawal intensities in the SX-InnerM region and the Northwest region are much lower than those in the East Coastal region and the South Coastal region, where new thermal power plants are banned, because air-cooling systems with much lower water withdrawal factors than once-through cooling systems prevail in the Northwest and SX-InnerM regions. (2) New thermal power plants must be equipped with air-cooling technology in the SX-InnerM region and the Northwest region where water shortages are severe. Moreover, replacement of closed-loop cooling technology with once-through cooling technology is encouraged in the SX-InnerM region and the Northwest region, which also results in water withdrawal reduction. Therefore, to generate the same thermal power, the SX-InnerM Region and the Northwest region withdraw less water than the East Coastal region and the South Coastal region.
Regarding the water consumption factor, except in S0, the amounts of water consumption for electricity generation fall slightly during 2015–2020 and then rise substantially during 2020–2030 by 1–16% compared with those in 2015. S1 and S4 have a similar tendency for water consumption. Both scenarios result in a water consumption increase of 15% during 2015–2030. The cause again is the shift from once-through cooling technology to closed-loop cooling technology. Despite closed-loop cooling technology having a much lower water withdrawal intensity than once-through cooling technology, its water consumption intensity is much higher than that of once-through cooling technology (i.e., 1.89 m3/MWh and 0.343 m3/MWh). Replacing once-through cooling technology with closed-loop cooling technology in thermal power systems increases the average water consumption intensity.
In contrast to the results regarding water withdrawal, increasing nonthermal power generation reduces the extent of increase in national water consumption for electric power production compared with updating cooling technologies. In S2, water consumption rises by 6% during 2015–2030, which is much smaller than the 15% increase under S1.
To summarize, measures related to water-saving technology and management of energy development both have considerable impacts on water use reduction for electricity generation. At the national level, updating cooling technologies provides greater water withdrawal reduction than increasing non-thermal power generation; however, their impacts on water consumption reduction are opposite. The west-centered thermal power generation policy substantially decreases water withdrawal, but its impact on water consumption reduction is negligible compared with the current layouts of thermal power generation.
3.2. Regional Water Withdrawal and Consumption of Electricity Generation under Various Water–Energy Strategies
The preceding analysis reveals that water withdrawal will decrease slowly but water consumption will increase during the projection period at the national level. However, the trends observed for the national water use do not apply to regional water use, which varies between the eight regions.
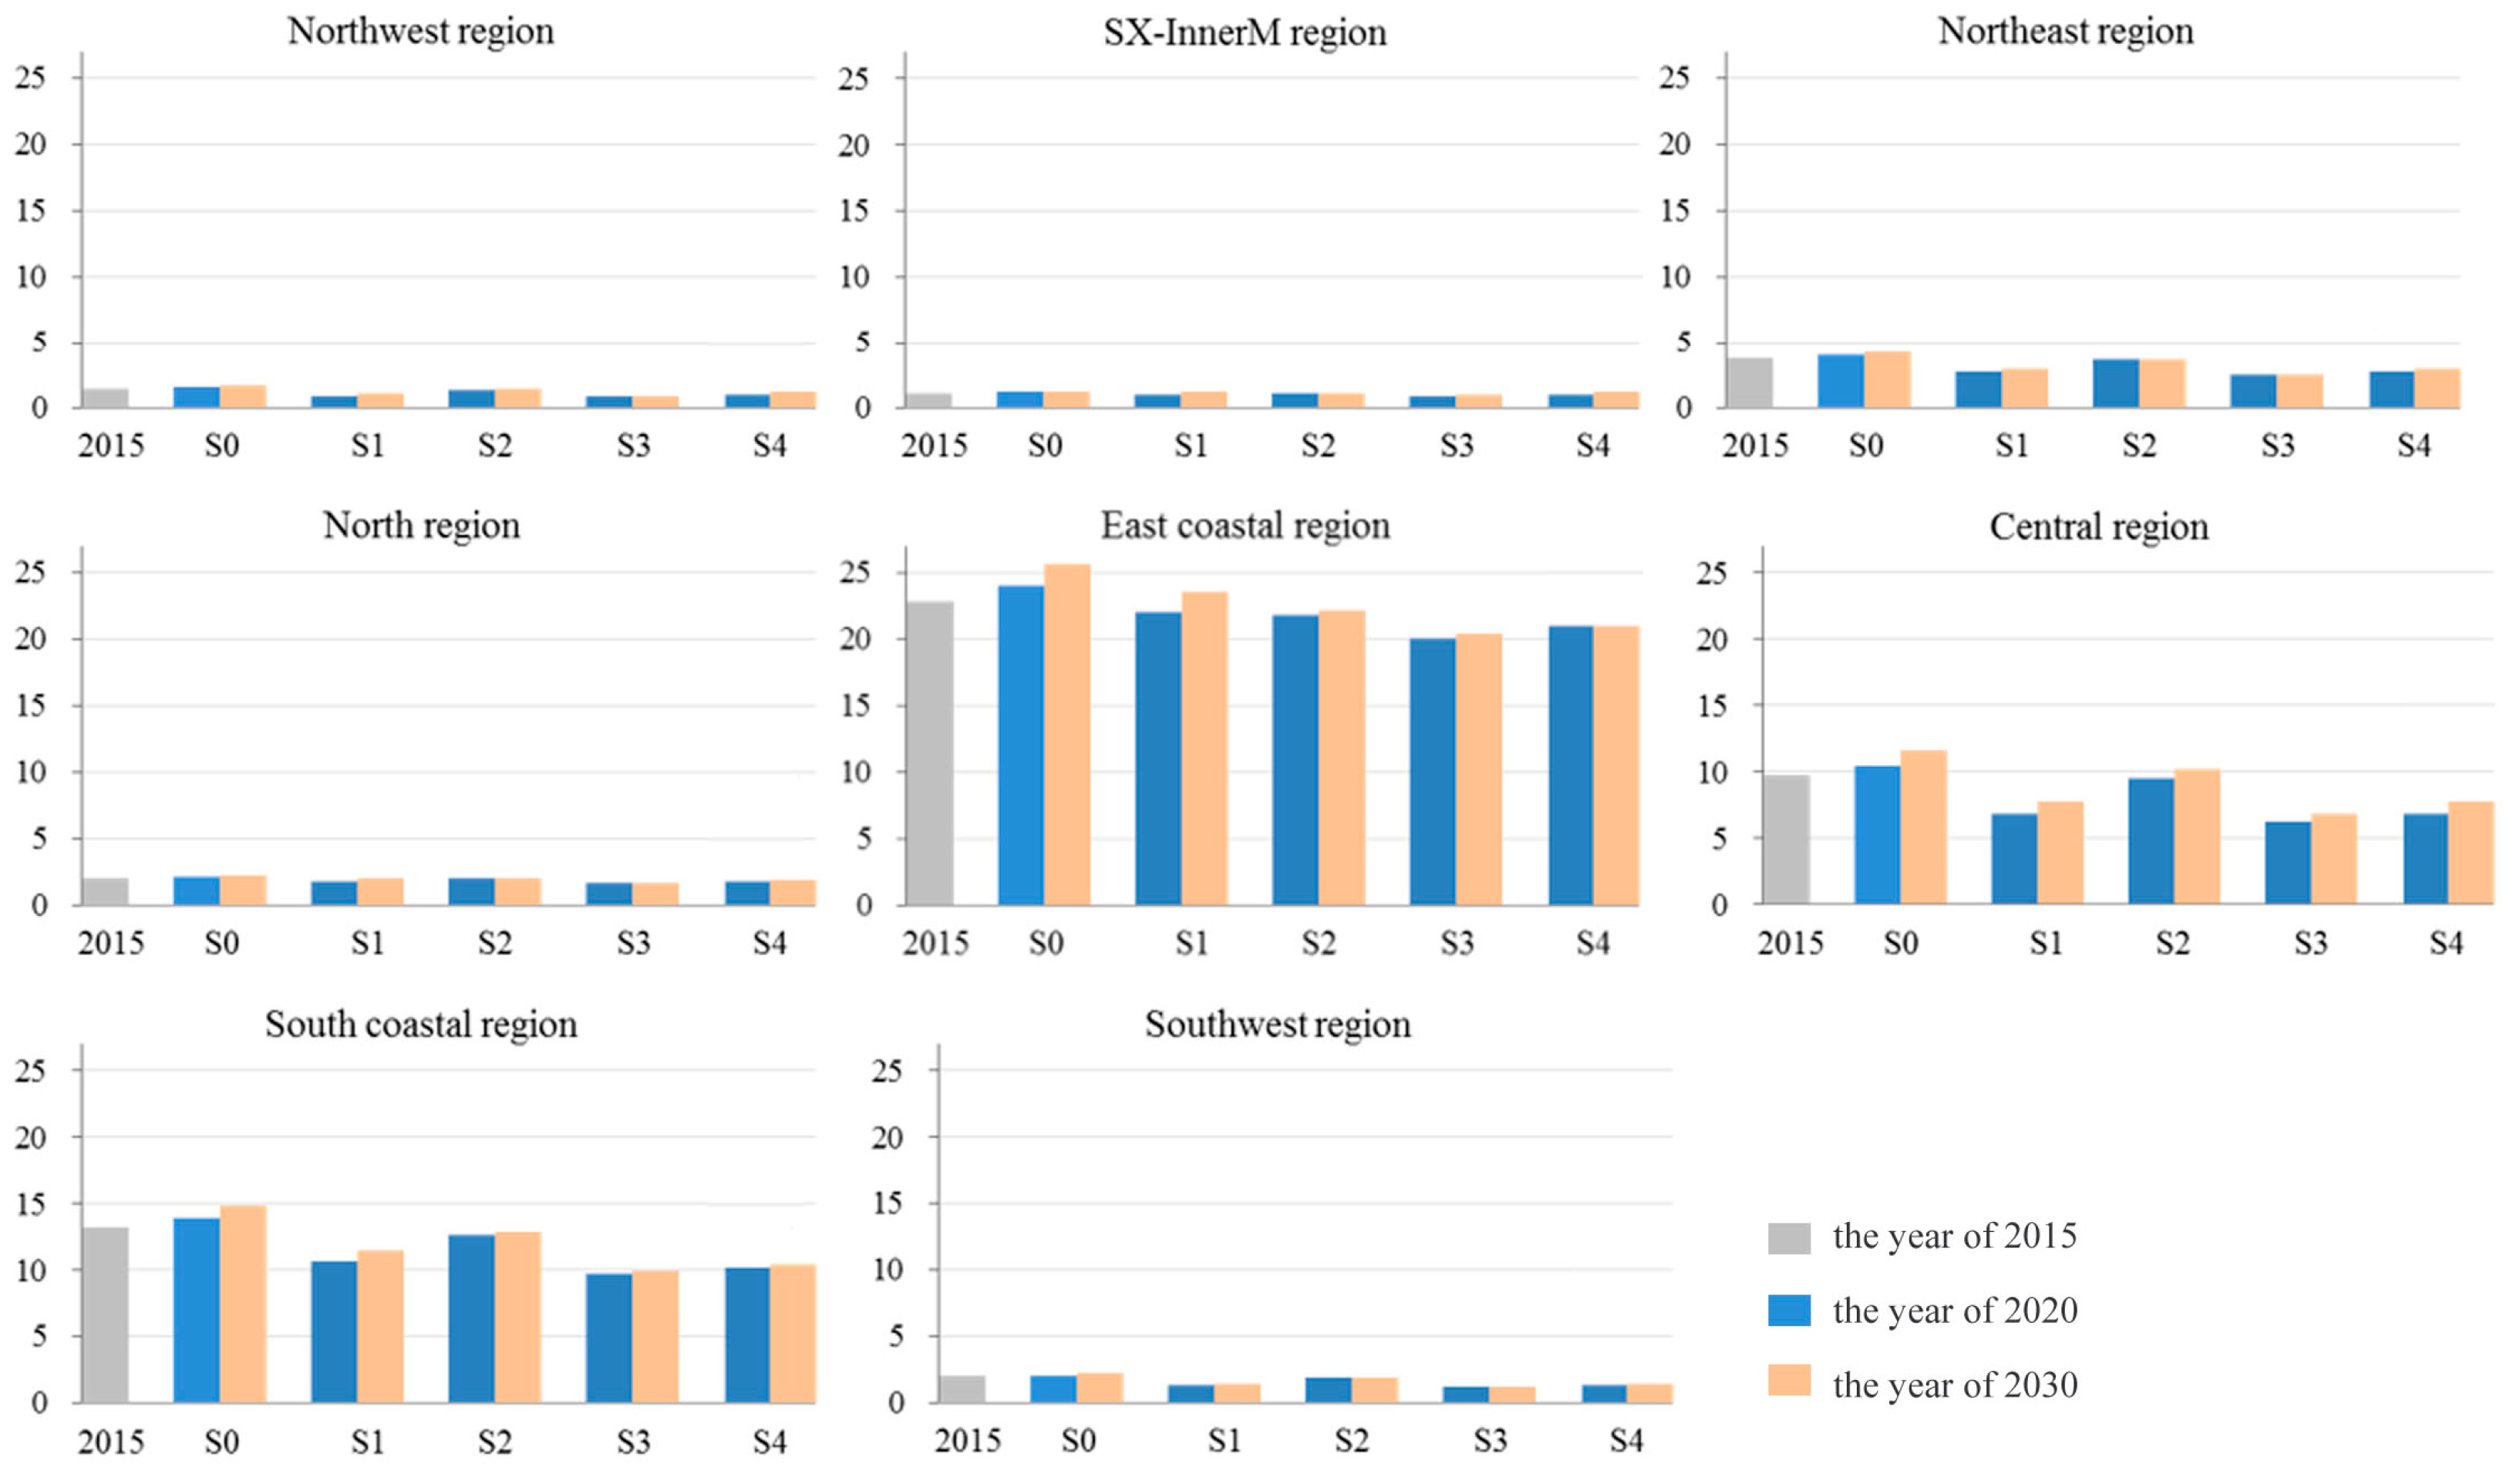
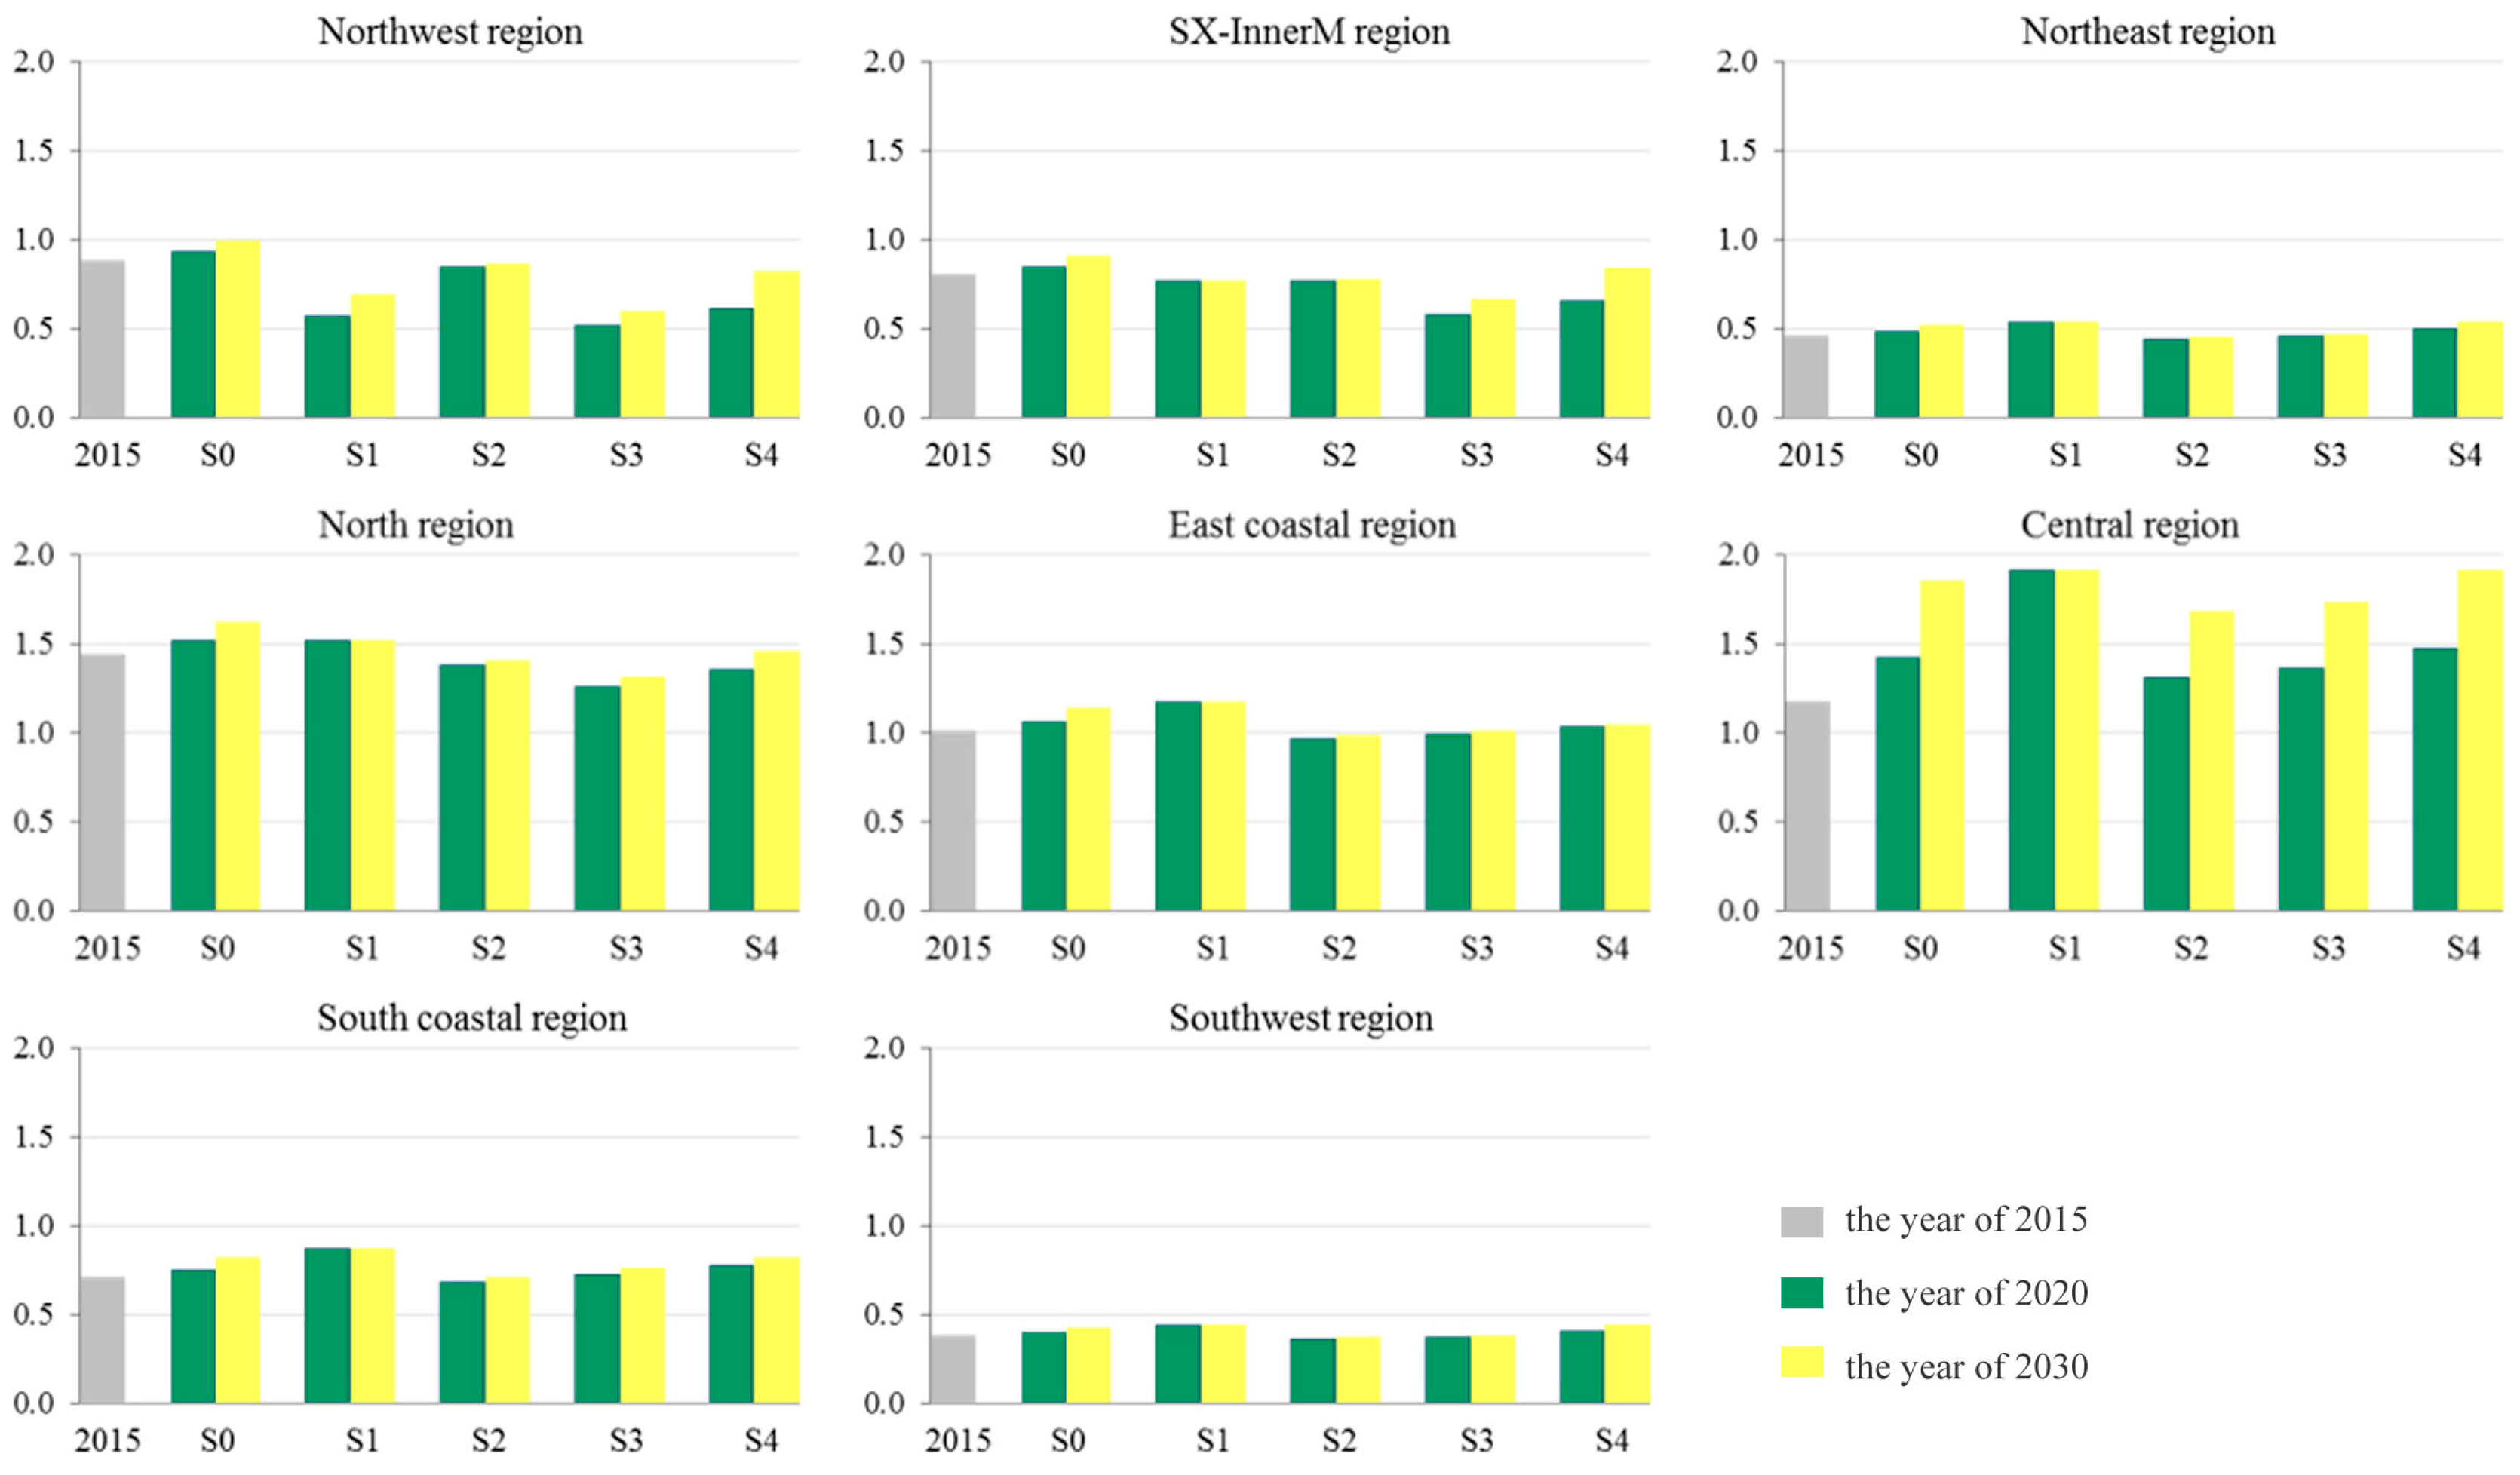
The four measures do not change the spatial distribution of water use for electricity generation. Regarding water withdrawal (Figure 2), water-rich regions, namely the East Coastal, South Coastal, and Central regions, are the top three water users, together accounting for over 80% of the national total water withdrawal for electricity generation, whereas regions with severe water shortages (i.e., Northwest, SX-InnerM, and North regions), have small amounts of water withdrawal, and are responsible for approximately 12% of the national total water withdrawal for electricity generation.
Regional differences in water consumption do not vary as much as those in water withdrawal (Figure 3). The largest water consumer is the Central region, accounting for 19–25% of the national total. The three regions with severe water shortages together account for 37–44% of the national total, and the three regions with abundant water resources together account for 44–51% of the national total.
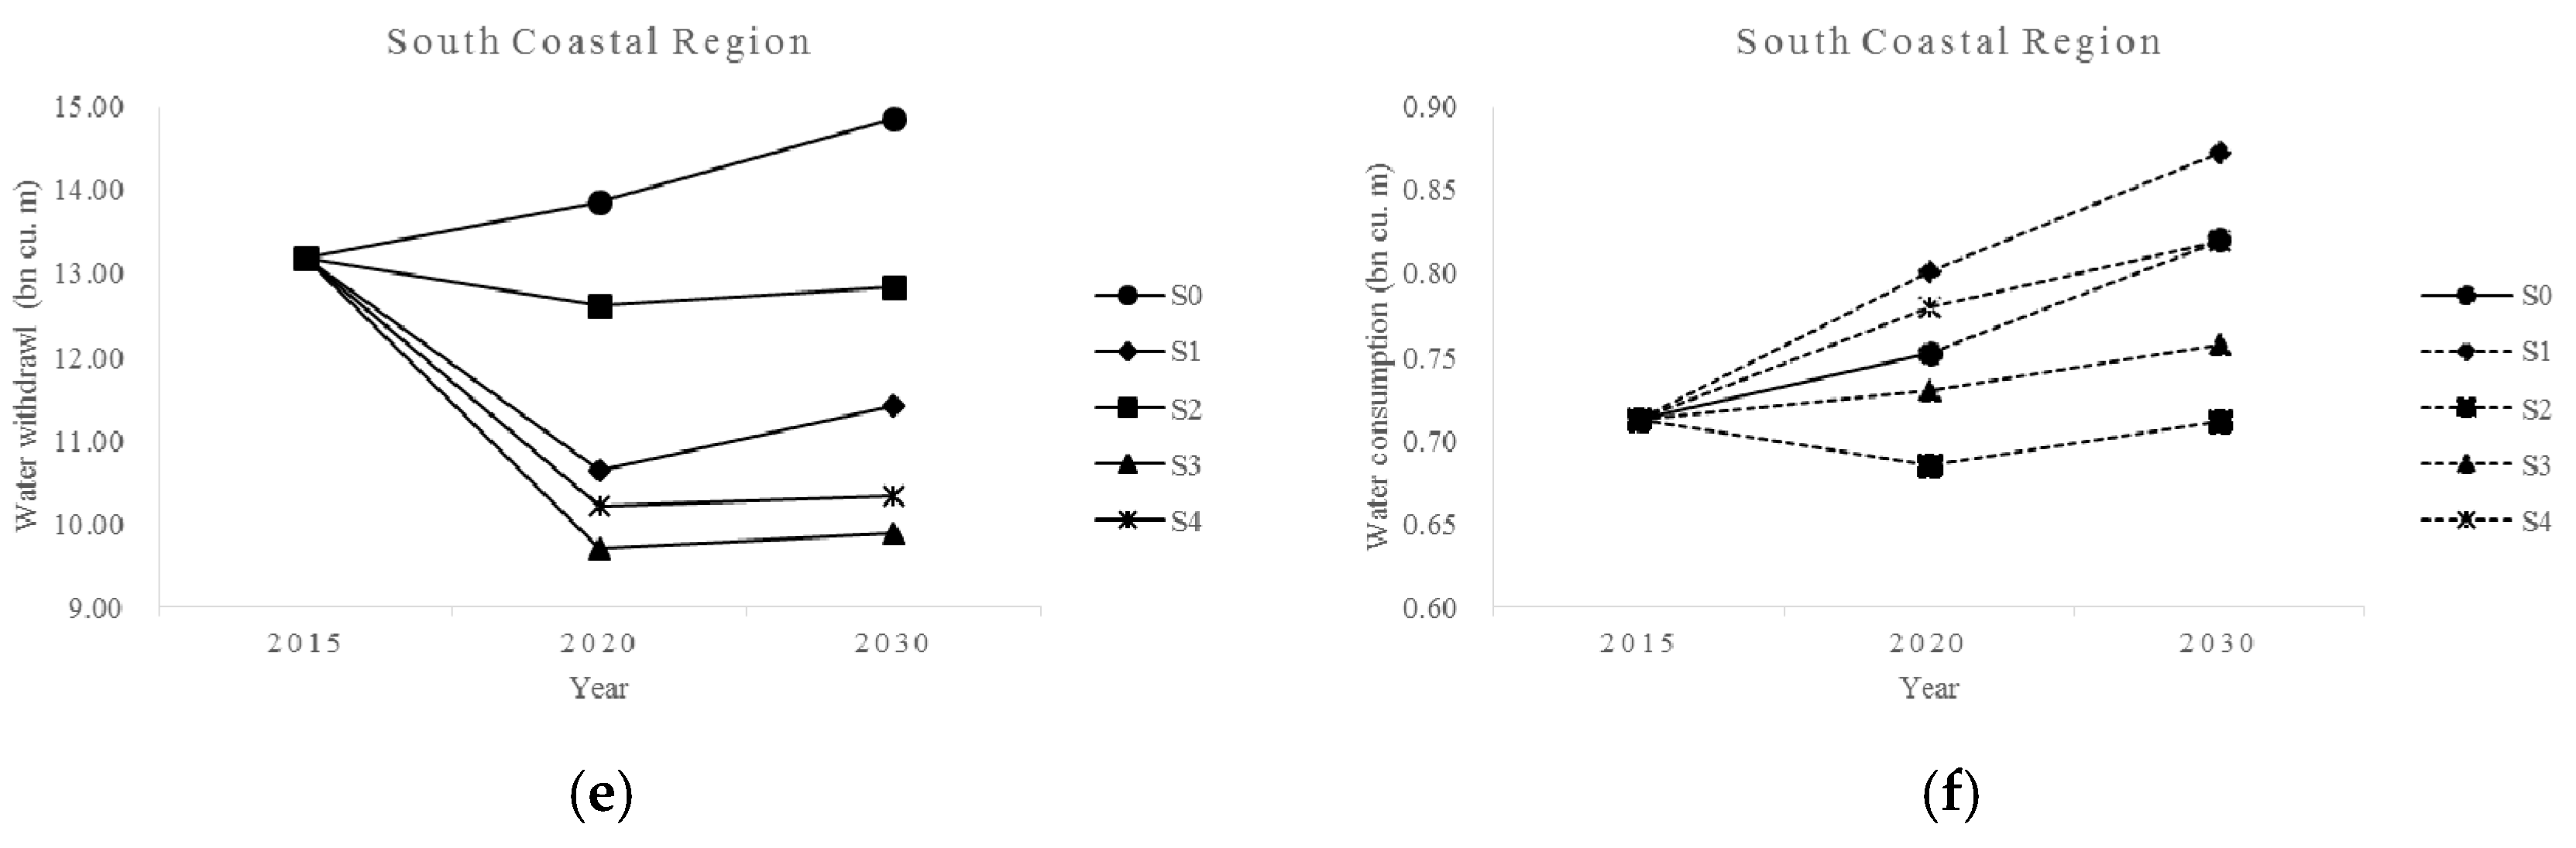
In the two highly developed regions, the North region and the South Coastal region, the trends of regional water withdrawal in the five scenarios exhibit the same patterns as those observed for national water withdrawal (Figure 4). Specifically, reductions in water withdrawal decrease through scenarios S2, S1, S4, and S3.
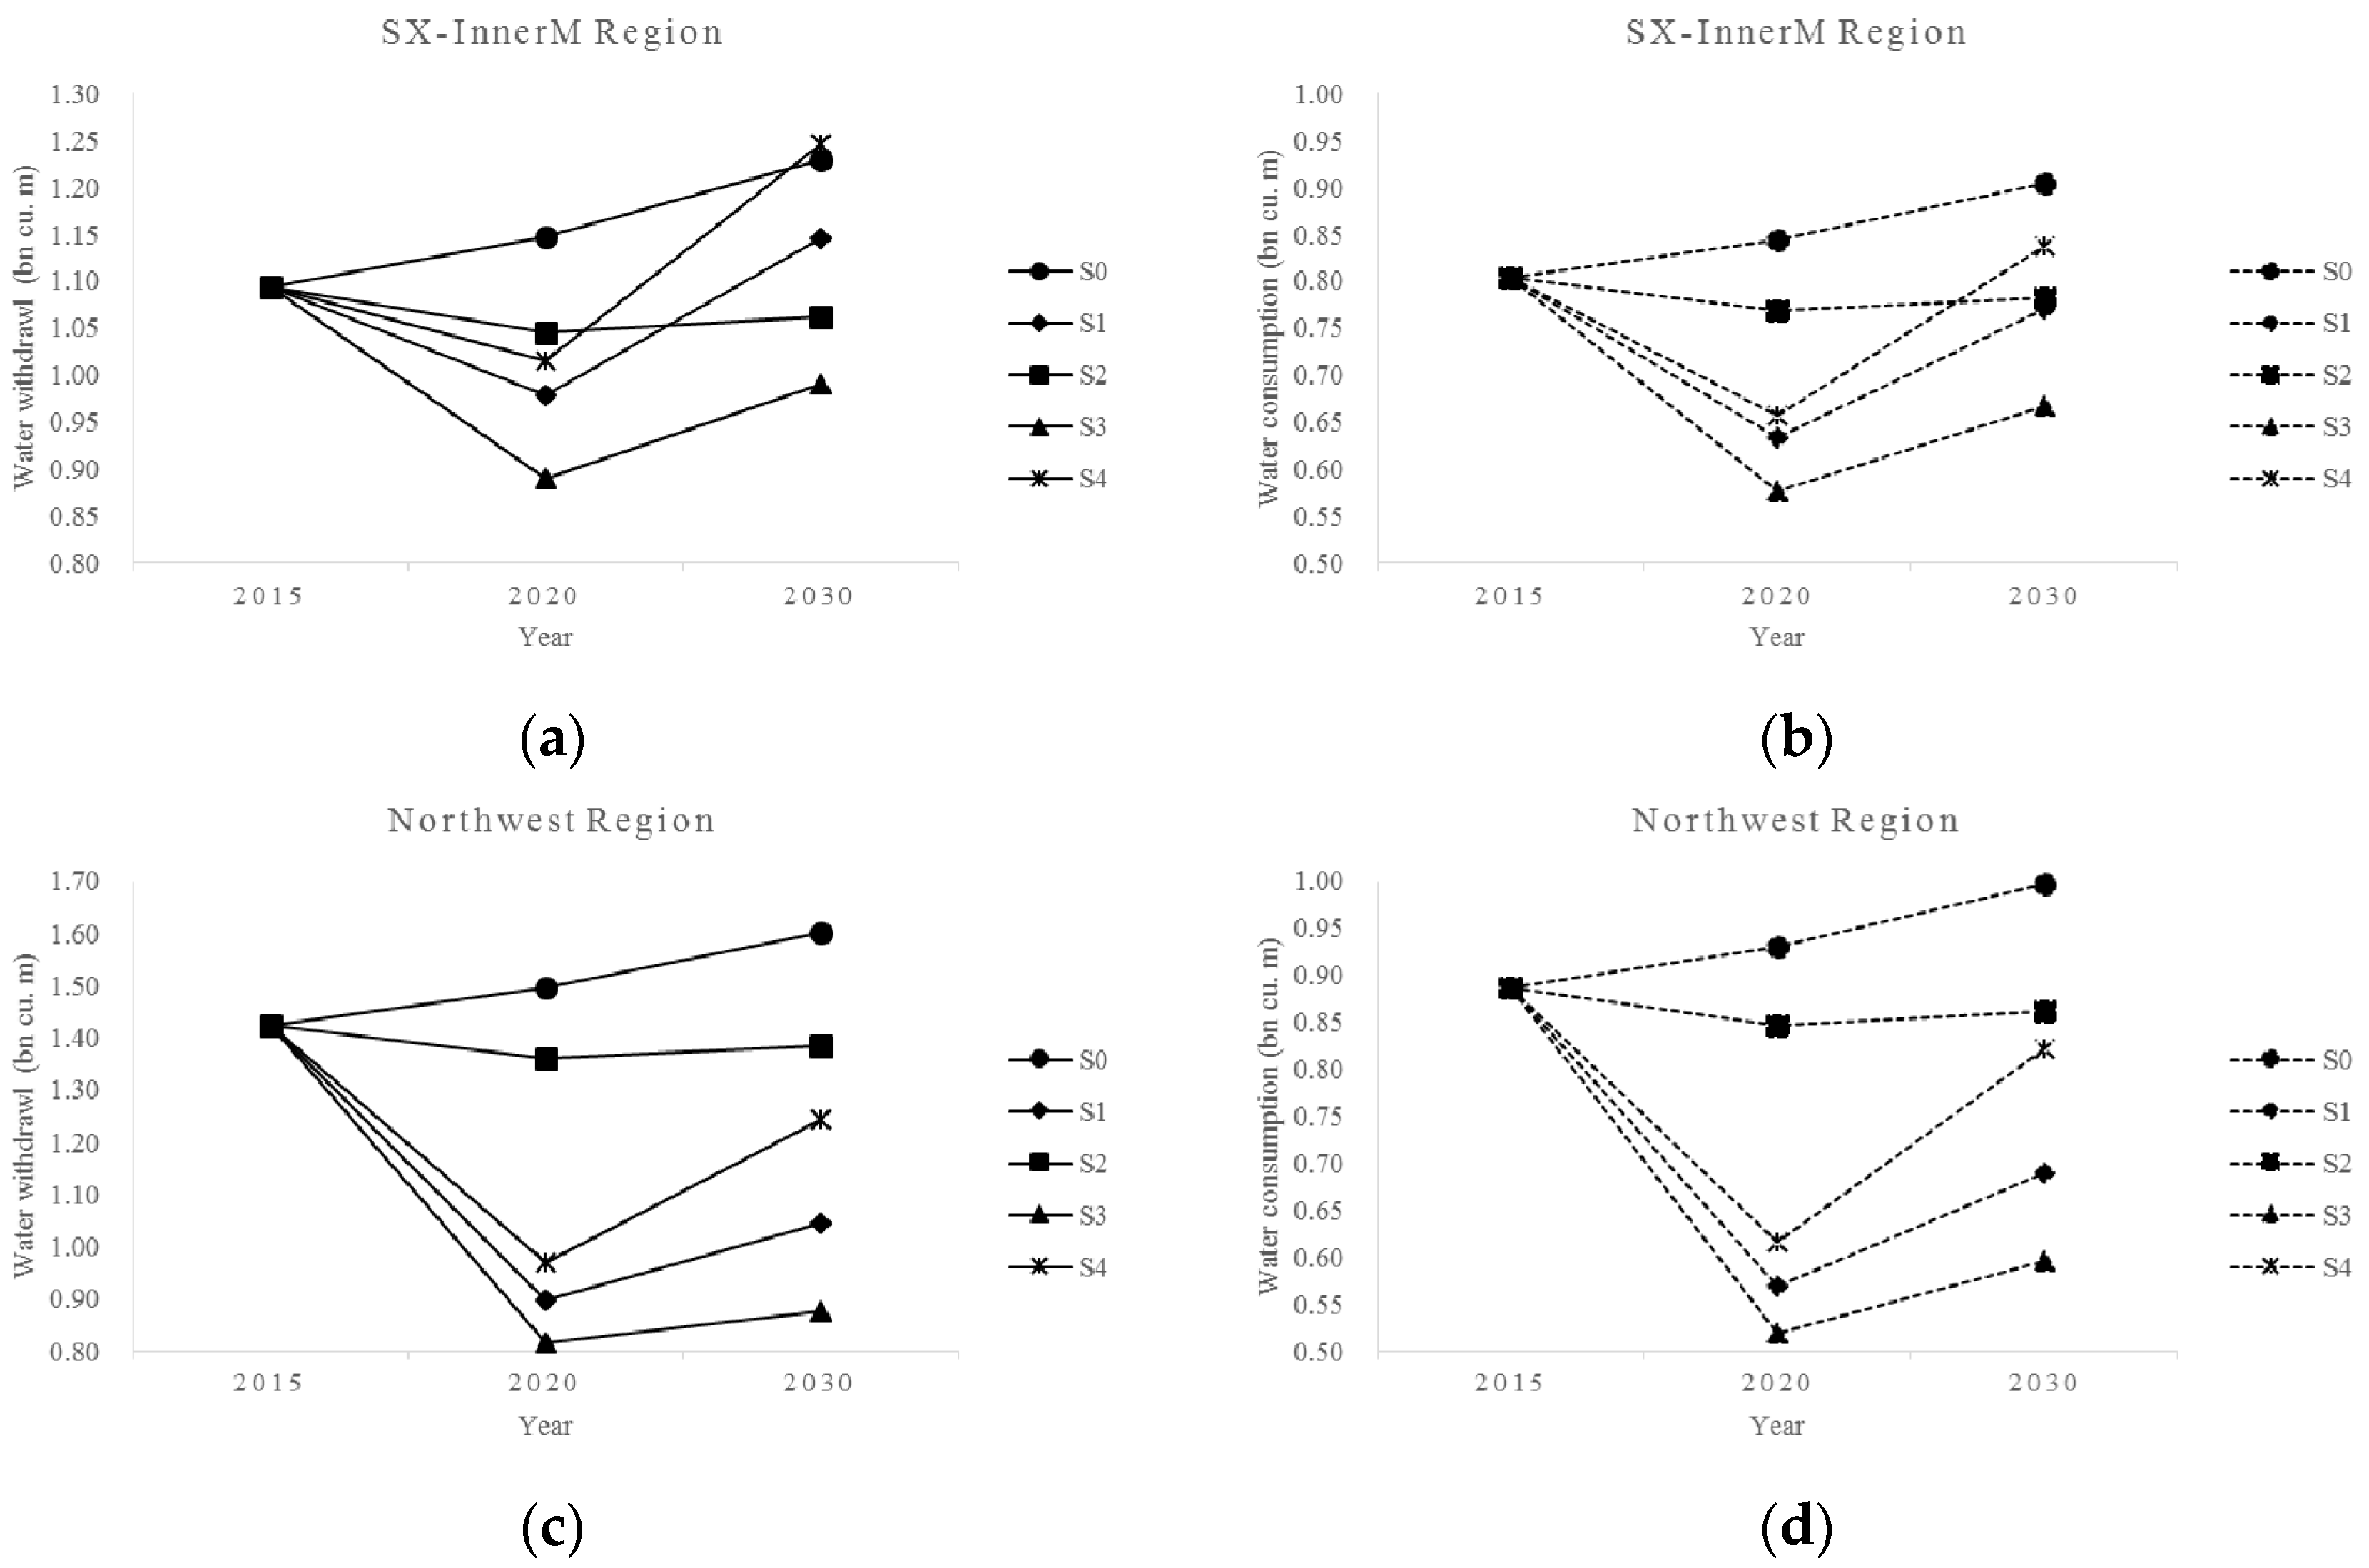
In the two arid regions that are also major energy producers, the SX-InnerM region and the Northwest region, increasing the proportion of air-cooling technology and closed-loop technology in thermal power generation is effective in reducing water consumption and water withdrawal (Figure 5). From 2015 to 2030, all thermal power plants equipped with once-through cooling technology will be retrofitted with closed-loop technology. This retrofitting could make regional water withdrawal drop during 2015–2020, which is represented in S1 and S3. In these two regions, wind power and PV power will be further developed to partly replace thermal power generation. However, since the water use intensities of wind and PV power are both trivial and set to zero [15,19,31], increasing nonthermal power generation has a small impact on water conservation in these two regions, as shown in S1 and S3.
However, under S4, because of the expansion of thermal power generation in the SX-InnerM and Northwest regions, water withdrawal and consumption increase markedly and even exceed the values under S0 without any measures for water conservation in the SX-InnerM region.
4. Discussion
This study simulated three approaches to impacting water use in electricity development, but each entails major trade-offs. For instance, if China moves its coal-fired power producers to the dry north from the water-abundant south, the cost and burden of long-distance transportation of coal, as well as air pollution in the south would be significantly reduced. However, China faces more challenges in regional water use, including the high cost of retrofitting current thermal power plants with water-efficient technologies, decreasing plants’ thermal efficiency by using air-cooling systems, and extensive competition for water use with other users. Previous research indicated that if the existing once-through cooling system were forcibly retrofitted, more than 100 GW of coal-fired power plants would be affected at a cost of 20 billion dollars [37].
Regarding water resources, water shortage problems have been severe in the dry northern regions. In fact, the shift in the layout of thermal power generation relocates air pollution problems in the eastern and southern regions to water-scare northern regions. A previous study estimated that virtual water consumption outflowing from the dry northern regions is increasing substantially [38]. The amount of water transferred by the South-to-North Water Transfer Project (SNWTP) through the western route is 16–17 billion m3 per year, from the upper Yangtze River to the upper Yellow River. By contrast, virtual water consumption outflow through electricity trade from the Northwest region and the SX-InnerM region is 746–812 million m3 per year, accounting for 4.6–5.1% of the water transferred by the SNWTP. Moreover, most of this virtual water consumption flows to the North region, which is the target area of eastern and middle routes of the SNWTP. The amount of water transferred from the lower and middle Yangtze River to the North region is approximately 14 billion m3 per year. The North region is not only supported by real water resources from the distant south, but also by virtual water resources from the dry north [38]. Therefore, a layout of moving more thermal power generation to the north issued in the latest energy development strategy [11] will definitely intensify this type of virtual water flow and impose much more water stress on the severe water situation in the north. Policy-makers focus on local development and do not understand environmental impacts from the perspective of regional sustainable development, which would aggravate fragileness of regional ecological environment.
A number of technologies can mitigate the water–energy conflict. One effective solution is to use more water-efficient cooling technologies. Currently, 18.2% of the thermoelectric generators in the country use once-through cooling, 66.6% use closed-loop cooling, and 15.3% use air cooling [33]. According to our estimates, retrofitting coal-fired power plants with more water-efficient closed-cooling technologies from once-through cooling technologies could increase water consumption but reduce water withdrawal.
Air-cooling systems do not require water and can decrease total power plant water withdrawal by more than 88% [5,39]. The Chinese government has issued a number of policies to promote air-cooling technology use in arid regions since the mid-2000s [40,41,42]. The policies require new coal-fired power plants in the arid northern regions to be equipped with air-cooling systems and have a water consumption coefficient below 0.18 m3/s per million kilowatts. However, air-cooling systems have higher costs and lower efficiencies. For example, according to a survey that we conducted in Lanzhou, the capital city of Gansu, a northwestern province located in a water-scarce region, power plants with air-cooling systems are in the top 20% of provincial power plants for water saving; however, air-cooling systems average a 3% higher energy consumption than closed-loop cooling systems. Under the current performance examination system of an enterprise or an industrial sector by the government [43], the performance of saving energy attracts much more attention than that of saving water. This performance examination system lowers the motivation for adopting air-cooling systems in power plants and increases pressure on power plants equipped with air-cooling systems. This trade-off between water and energy poses a challenge toward a low-carbon and less-water-intensive future. Incentive measures should be taken to draw attention to the water conservation benefits of air-cooling technology, for example, allowances for water saving, rewards for meeting the electricity generation quota, and preferential taxes and feed-in tariffs for power plants equipped with air-cooling systems.
Other advanced power technologies for promoting water saving are ultra-supercritical (USC) coal power technology and integrated gasification combined-cycle (IGCC) power technology. Along with reducing air pollutants and energy consumption, USC and IGCC power plants can achieve water consumption reductions of 10% [31] and 36–60%, respectively, compared with conventional coal plants [44,45]. IGCC technology can reduce the water withdrawal factor by 40–64% [31].
Exploring alternative water sources is likely to relieve the stress on freshwater supplies in the growing electricity generation of the future. In recent years, energy and water policies have encouraged thermal power plants to implement wastewater recycling and use reclaimed water for cooling. The “Tenth Five-Year Plan for Industrial Water Conservation” issued in 2001 explicitly required that the re-use ratio of wastewater must reach up to 96% in power plants equipped with closed-loop cooling systems by 2005, and 34% for power plants equipped with once-through cooling systems. Most power plants have met the requirements; water recycling within power plants has been deployed efficiently. The measure being promoted is to use reclaimed water from municipal sewage treatment plants for supplementary water use in power plants. Additionally, salt water is another possible cooling water source. Salt water is an obvious and abundant option for coastal power plants [46], but such plants face similar challenges as inland plants with regard to damaging the local aquatic ecosystems through excessive withdrawal or thermal pollution from discharge of hot cooling water.
This study has several limitations. First, we did not consider biomass power generation because of data unavailability. Biomass power generation includes biomass combustion electricity production, waste incineration power generation and biogas power generation, which requires water use intensities ranging from 450 to 35,000 gal/MWh of water withdrawal and from 35 to 553 gal/MWh of water consumption [31]. However, there are few statistical data on biomass power generation or its surrogates at the provincial level. Moreover, in the provincial 13th Five-Year Plans of energy development, few provinces set targets for various biomass power generation technologies. Future research can be extended to examine the water use for various biomass power generation types at a provincial level by surveys. Second, this study considered fresh water used for hydropower generation to be zero because water evaporating from multifunctional reservoir cannot contribute to hydropower generation. Although some of the previous studies made the similar assumption to estimate water use by hydropower [19,22], water consumed through evaporation from reservoir cannot be neglected. There have been studies trying to separate water use by hydropower from the total water evaporated from reservoir according to hydropower’s economic value [3]. Third, this study used national average water withdrawal and consumption intensities by cooling technology, because province-specific water use intensities are not available.
5. Conclusions
This study estimated and assessed water withdrawal and consumption for electricity generation at the national and regional levels from 2015 to 2030 in China. Based on the latest official policy of China’s electricity development, this study simulated three approaches to impacting water use for electricity development, i.e., updating cooling technology mix, increasing non-thermal power generation and moving more thermal power generation to the west. The results reveal that water withdrawal and consumption increase remarkably to 63.75 and 8.3 billion m3 respectively by 2030, up approximately 14% and 21% of those in 2015, respectively, if China does not implement any new water and energy policies. To equip the newly built thermal power plants with air-cooling systems in water-scarce regions and to replace once-through cooling with closed-loop cooling could reduce water withdrawal by 9%, but could still increase water consumption by 15% in 2030. To increase non-thermal power generation could reduce water withdrawal by 2%, but increase water consumption by 6% in 2030.
To reduce water use of electricity generation, cooling technology upgrading will be effective, such as replacing once-through cooling systems with closed-loop systems and imposing the requirement of using air-cooling systems in all new thermal power plants in northern China. Compared to technology upgrading, adjustment of the power generation mix through increasing the proportion of non-thermal power (nuclear, hydro, wind and solar) will alleviate water stress, but to a lesser degree. Change in the spatial distribution of thermal power plants across the country will also influence water management in China. The west-centered layout of thermal power generation which aims to reduce air pollution in the coastal regions will aggravate water scarcity in the Shanxi-Inner Mongolia and the Northwest regions. Relieving the stress of growing electricity demand on water resources in China requires comprehensive planning and measures.
Water resources have not been sufficiently considered in formulating energy strategies and policies at regional and national levels in China. This study has proved the great importance and urgent need of a water–energy nexus and also provided an approach to integrating water use into energy industry planning and management.
Supplementary Materials
The following are available online at www.mdpi.com/2071-1050/10/1/30/s1: Table S1: Amount of electricity production in 2015 at province level (TWH); Table S2: Amount of electricity production in 2020 and 2030 at province level, reference (TWH); Table S3: Amount of electricity production in 2020 and 2030 at province level, reallocation (TWH); Table S4: Amount of electricity production in 2020 and 2030 at province level, west-centered (TWH); Table S5: Amount of energy water withdrawal in 2015, 2020, and 2030 under the five scenarios (billion cubic meters); Table S6: Amount of energy water consumption in 2015, 2020, and 2030 under the five scenarios (billion cubic meters).
Acknowledgments
This work was supported by a fund from the Young Talents Plan at China University of Petroleum-Beijing (Grant No. 2462015YJRC018); Humanities and Social Science Foundation of Ministry of Education in China (17YJCZH104).
Author Contributions
Lu Lin and Yongqin David Chen conceived and designed the research, analyzed the data, and wrote the paper.
Conflicts of Interest
The authors declare no conflict of interest.
Appendix A
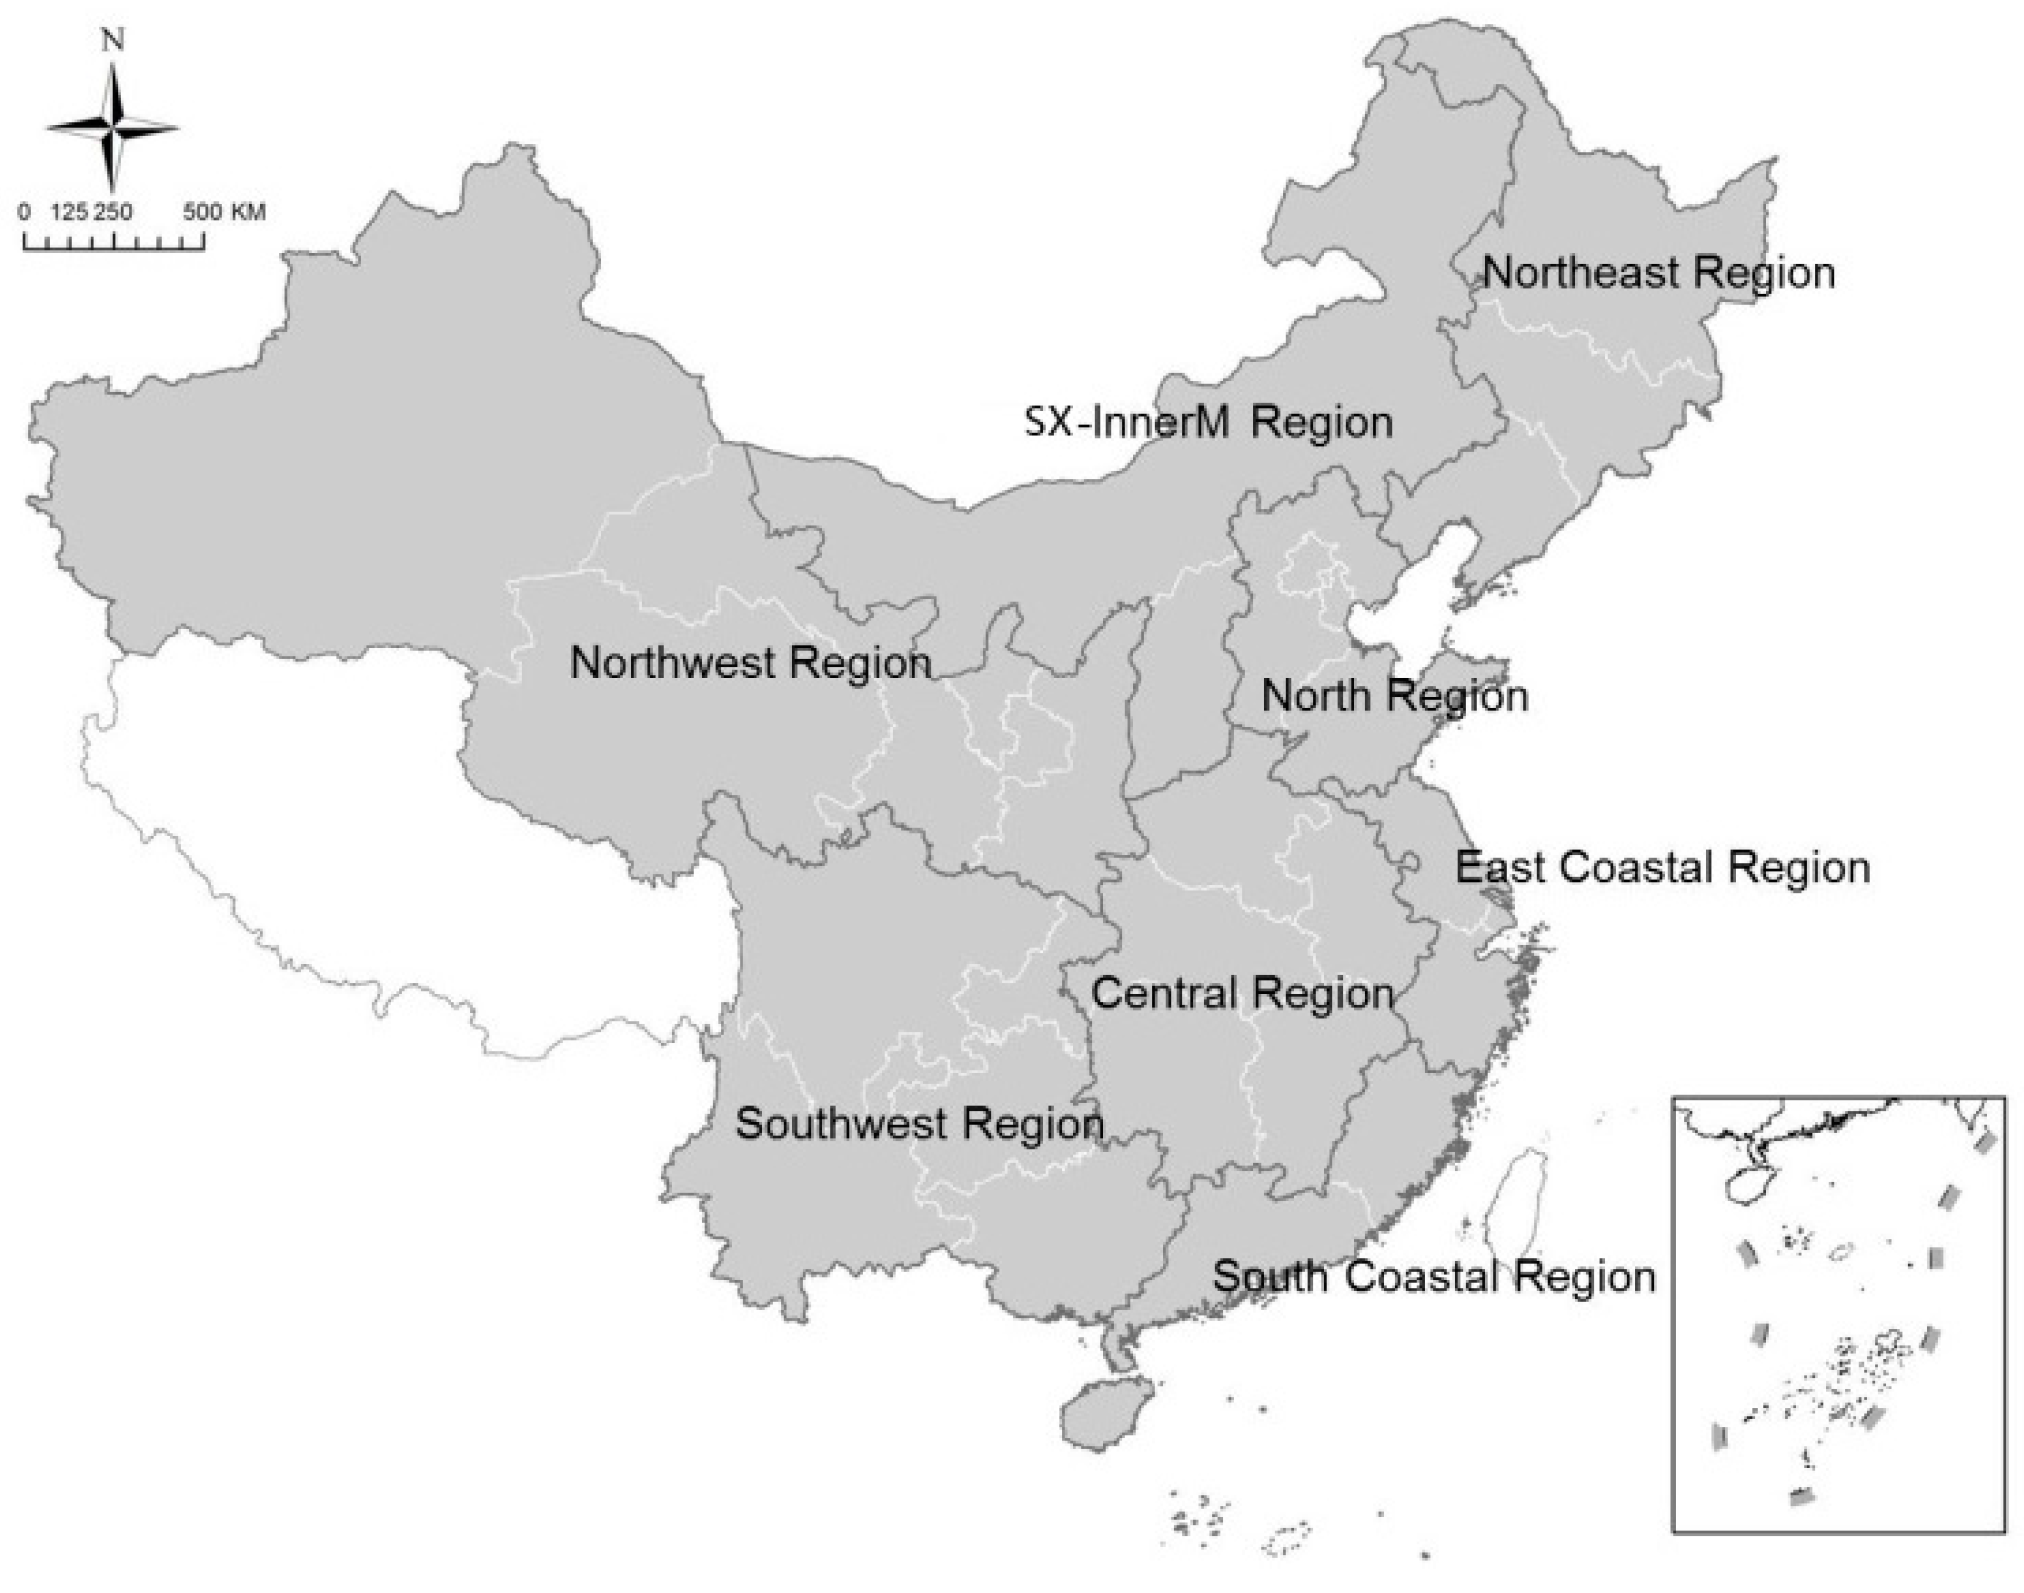
In this study, 30 provincial administrative regions were included, and Tibet, Hong Kong, Macau, and Taiwan were excluded because of data unavailability. Hong Kong, Macau, and Taiwan are not listed in traditional statistical analyses, and the economy of Tibet accounts for less than 0.2% of the national total. Therefore, omitting these four regions is not expected to generate substantial errors in the calculation. The calculation is based on the 30 provinces, but for the ease of interpretation and clear discussion, the analysis is organized into eight regions (Figure A1): North (Beijing, Tianjin, Hebei, Shandong), Northeast (Heilongjiang, Jilin, Liaoning), SX-InnerM (Shanxi and Inner Mongolia), Northwest (Xinjiang, Qinghai, Gansu, Ningxia, Shaanxi), Central (Henan, Hunan, Hubei, Jiangxi, Anhui), East Coastal (Shanghai, Jiangsu, Zhejiang), South Coastal (Fujian, Guangdong, Hainan), and Southwest (Sichuan, Chongqing, Yunnan, Guizhou, Guangxi).
Figure A1.
Eight regions.
References
- MEP (Ministry of Environmental Protection). Dataset of the First National Pollution Source Census; China Environmental Science Press: Beijing, China, 2011.
- Mielke, E.; Anadon, L.D.; Narayanamurti, V. Water Consumption of Energy Resource Extraction, Processing, and Conversion. Energy Technology Innovation Policy Discussion Paper 2010-15; Belfer Center for Science and International Affairs; Harvard Kennedy School: Cambridge, MA, USA, 2010; Available online: https://www.belfercenter.org/sites/default/files/legacy/files/ETIP-DP-2010-15-final-4.pdf (accessed on 15 December 2017).
- Liu, J.; Zhao, D.; Gerbensleenes, P.W.; Guan, D. China’s rising hydropower demand challenges water sector. Sci. Rep. 2015, 5, 11446. [Google Scholar] [CrossRef] [PubMed] [Green Version]
- Xie, X.; Zhang, T.; Wang, L.; Huang, Z. Regional water footprints of potential biofuel production in China. Biotechnol. Biofuels 2017, 10, 95. [Google Scholar] [CrossRef] [PubMed]
- Byers, E.A.; Hall, J.W.; Amezaga, J.M. Electricity generation and cooling water use: UK pathways to 2050. Glob. Environ. Chang. 2014, 25, 16–30. [Google Scholar] [CrossRef]
- Macknick, J.; Sattler, S.; Averyt, K.; Clemmer, S.; Rogers, J. The water implications of generating electricity: water use across the United States based on different electricity pathways through 2050. Environ. Res. Lett. 2012, 7, 189–190. [Google Scholar] [CrossRef]
- IEA (International Energy Agency). Water for Energy. Is energy becoming a thirstier resource? In World Energy Outlook 2012; IEA: Paris, France, 2012; pp. 501–528. [Google Scholar]
- United Nations World Water Assessment Programme (WWAP). United Nations World Water Development Report 2014: Water and Energy; United Nations Educational, Scientific and Cultural Organizatoion: Paris, France, 2014. [Google Scholar]
- China National Bureau of Statistics (CNBS); China National Energy Administration (CNEA). China Energy Statistical Yearbook; China Statistics Press: Beijing, China, 2016.
- MWR (Ministry of Water Resources). Water Resources Bulletin; MWR: Beijing, China, 2016.
- National Energy Administration. The 13th Five-Year Plan for Electricity Development. Available online: http://news.bjx.com.cn/html/20161107/786734.shtml (accessed on 10 November 2016).
- Song, X.; Bu, H.; Ma, Y. Thirsty Coal: A Water Crisis Exacerbated by China’s New Mega Coal Power Bases; China Environmental Science Press: Beijing, China, 2012. [Google Scholar]
- Fricko, O.; Parkinson, S.C.; Johnson, N.; Strubegger, M.; Vliet, M.T.V.; Riahi, K. Energy sector water use implications of a 2 °C climate policy. Environ. Res. Lett. 2016, 11, 034011. [Google Scholar] [CrossRef]
- Clemmer, S.; Rogers, J.; Sattler, S.; Macknick, J.; Mai, T. Modeling low-carbon US electricity futures to explore impacts on national and regional water use. Environ. Res. Lett. 2013, 8, 3865–3879. [Google Scholar] [CrossRef]
- Davies, E.G.R.; Kyle, P.; Edmonds, J.A. An integrated assessment of global and regional water demands for electricity generation to 2095. Adv. Water Resour. 2013, 52, 296–313. [Google Scholar] [CrossRef]
- Srinivasan, S.; Kholod, N.; Chaturvedi, V.; Ghosh, P.P.; Mathur, R.; Clarke, L.; Evans, M.; Hejazi, M.; Kanudia, A.; Koti, P.N. Water for electricity in India: A multi-model study of future challenges and linkages to climate change mitigation. Appl. Energy 2017, 110, 673–684. [Google Scholar] [CrossRef]
- Tidwell, V.; Moreland, B. Mapping water consumption for energy production around the Pacific Rim. Environ. Res. Lett. 2016, 11, 94008. [Google Scholar] [CrossRef]
- Zhang, X.; Liu, J.; Tang, Y.; Zhao, X.; Yang, H.; Gerbens-Leenes, P.W.; Vliet, M.T.H.V.; Yan, J. China’s coal-fired power plants impose pressure on water resources. J. Clean. Prod. 2017, 161, 1171–1179. [Google Scholar] [CrossRef]
- Zhang, C.; Anadon, L.D. Life cycle water use of energy production and its environmental impacts in China. Environ. Sci. Technol. 2013, 47, 14459–14467. [Google Scholar] [CrossRef] [PubMed]
- Cai, B.; Zhang, B.; Bi, J.; Zhang, W. Energy’s thirst for water in China. Environ. Sci. Technol. 2014, 48, 11760–11768. [Google Scholar] [CrossRef] [PubMed]
- Lin, G.; Jiang, D.; Duan, R.; Fu, J.; Hao, M. Water Use of Fossil Energy Production and Supply in China. Water 2017, 9, 513. [Google Scholar] [CrossRef]
- Liao, X.; Hall, J.W.; Eyre, N. Water use in China’s thermoelectric power sector. Glob. Environ. Chang. 2016, 41, 142–152. [Google Scholar] [CrossRef]
- Zheng, X.; Wang, C.; Cai, W.; Kummu, M.; Varis, O. The vulnerability of thermoelectric power generation to water scarcity in China: Current status and future scenarios for power planning and climate change. Appl. Energy 2016, 171, 444–455. [Google Scholar] [CrossRef]
- Zhang, C.; Zhong, L.; Fu, X.; Zhao, Z. Managing Scarce Water Resources in China’s Coal Power Industry. Environ. Manag. 2016, 57, 1188–1203. [Google Scholar] [CrossRef] [PubMed]
- Wu, X.D.; Chen, G.Q. Energy and water nexus in power generation: The surprisingly high amount of industrial water use induced by solar power infrastructure in China. Appl. Energy 2017, 195, 125–136. [Google Scholar] [CrossRef]
- Qin, Y.; Curmi, E.; Kopec, G.M.; Allwood, J.M.; Richards, K.S. China’s energy-water nexus—Assessment of the energy sector’s compliance with the “3 Red Lines” industrial water policy. Energy Policy 2015, 82, 131–143. [Google Scholar] [CrossRef]
- China Electricity Council (CEC). Analysis and Forecast of National Electricity Supply and Demand Situation in 2016. Available online: http://www.cec.org.cn/yaowenkuaidi/2017-01-25/164285.html (accessed on 4 May 2017).
- China Energy Research Society. China Energy Outlook 2030; Economy & Management Publishing House: Beijing, China, 2016. [Google Scholar]
- Gleick, P.H. Water and Energy. Annu. Rev. Energy Environ. 2003, 19, 267–299. [Google Scholar] [CrossRef]
- Grubert, E.; Beach, F.C.; Webber, M.E. Can switching fuels save water? A life cycle quantification of freshwater consumption for Texas coal- and natural gas-fired electricity. Environ. Res. Lett. 2012, 7, 45801. [Google Scholar] [CrossRef]
- Macknick, J.; Newmark, R.; Heath, G.; Hallett, K.C. Operational water consumption and withdrawal factors for electricity generating technologies: A review of existing literature. Environ. Res. Lett. 2012, 7, 189–190. [Google Scholar] [CrossRef]
- Zhang, C.; Anadon, L.D.; Mo, H.; Zhao, Z.; Liu, Z. Water-carbon trade-off in China’s coal power industry. Environ. Sci. Technol. 2014, 48, 11082–11089. [Google Scholar] [CrossRef] [PubMed]
- Zhang, C.; Zhong, L.; Fu, X.; Wang, J.; Wu, Z. Revealing water stress by the thermal power industry in China based on a high spatial resolution water withdrawal and consumption inventory. Environ. Sci. Technol. 2016, 50, 1642–1652. [Google Scholar] [CrossRef] [PubMed]
- Guo, L.; Huang, B.; Qiu, J.; Qiu, S. Research on the characteristics of fresh water consumption in nuclear power plant. J. Hydraul. Eng. 2013, 5, 615–621. [Google Scholar]
- Guo, Y.; Cao, Y.; Xian, T.; Zhang, R. Water consumption indexes analysis for inland nuclear power stations. Water Resour. Hydropower Eng. 2012, 43, 119–122. (In Chinese) [Google Scholar]
- Wan, L.; Wang, C.; Cai, W. Impacts on water consumption of power sector in major emitting economies under INDC and longer term mitigation scenarios: An input-output based hybrid approach. Appl. Energy 2016, 184, 26–39. [Google Scholar] [CrossRef]
- Bullard, N. China’s Power Utilities in Hot Water. Available online: http://chinawaterrisk.org/opinions/chinese-utilities-in-hot-water/ (accessed on 19 November 2016).
- Lin, L. Regional Water Use Assessment and Management of Energy Industry in China: A Virtual Water Approach; The Chinese University of Hong Kong: Hong Kong, China, 2014. [Google Scholar]
- Peizhang, W. Scientific Development of the Domestic Thermal Power Air Cooling Units and Their Technology Progress. In Proceedings of the Fifth Academic Annual Meeting, Thermal Power Branch of China Electrical Engineering Institute of Air Cooling, Taiyuan, China, 14–15 September 2009; p. 36. (In Chinese). [Google Scholar]
- Ministry of Water Resources (MWR). Regulations on Implementing Water Resources Evaluation for Development Plan of Large Coal Power Bases. Available online: http://www.mwr.gov.cn/zwzc/tzgg/tzgs/201312/t20131217_520799.html (accessed on 17 November 2016).
- National Development and Reform Commission (NDRC). Requirements on the Planning and Construction of Coal Power Plants. Available online: http://www.nea.gov.cn/2012-01/04/c_131262602.htm (accessed on 17 November 2016).
- National Development and Reform Commission (NDRC); Ministry of Science and Technology (MOST); Ministry of Water Resources (MWR); Ministry of Construction (MOC); Ministry of Agriculture (MOA). China Water Conservation Technology Policy Outline. Available online: http://bgt.ndrc.gov.cn/zcfb/200506/t20050602_500425.html (accessed on 17 November 2016).
- National Development and Reform Commission (NDRC). Action Plan for Updating and Reforming Energy Conservation and Emission Reduction in Coal-fired Power Industry (2014–2020). Available online: http://www.sdpc.gov.cn/gzdt/201409/t20140919_626240.html (accessed on 17 November 2016).
- Gerdes, K.; Nichols, C. Water Requirements for Existing and Emerging Thermoelectric Plant Technologies; National Energy Technology Laboratory: Pittsburgh, PA, USA, 2009. [Google Scholar]
- Yu, F.; Chen, J.; Sun, F.; Zeng, S.; Wang, C. Trend of technology innovation in China’s coal-fired electricity industry under resource and environmental constraints. Energy Policy 2011, 39, 1586–1599. [Google Scholar] [CrossRef]
- The State Council, Action Plan for Water Pollution Prevention. Available online: http://zfs.mep.gov.cn/fg/gwyw/201504/t20150416_299146.htm (accessed on 17 November 2016).
Figure 1.
National total water withdrawal (a) and consumption (b) for the five scenarios.
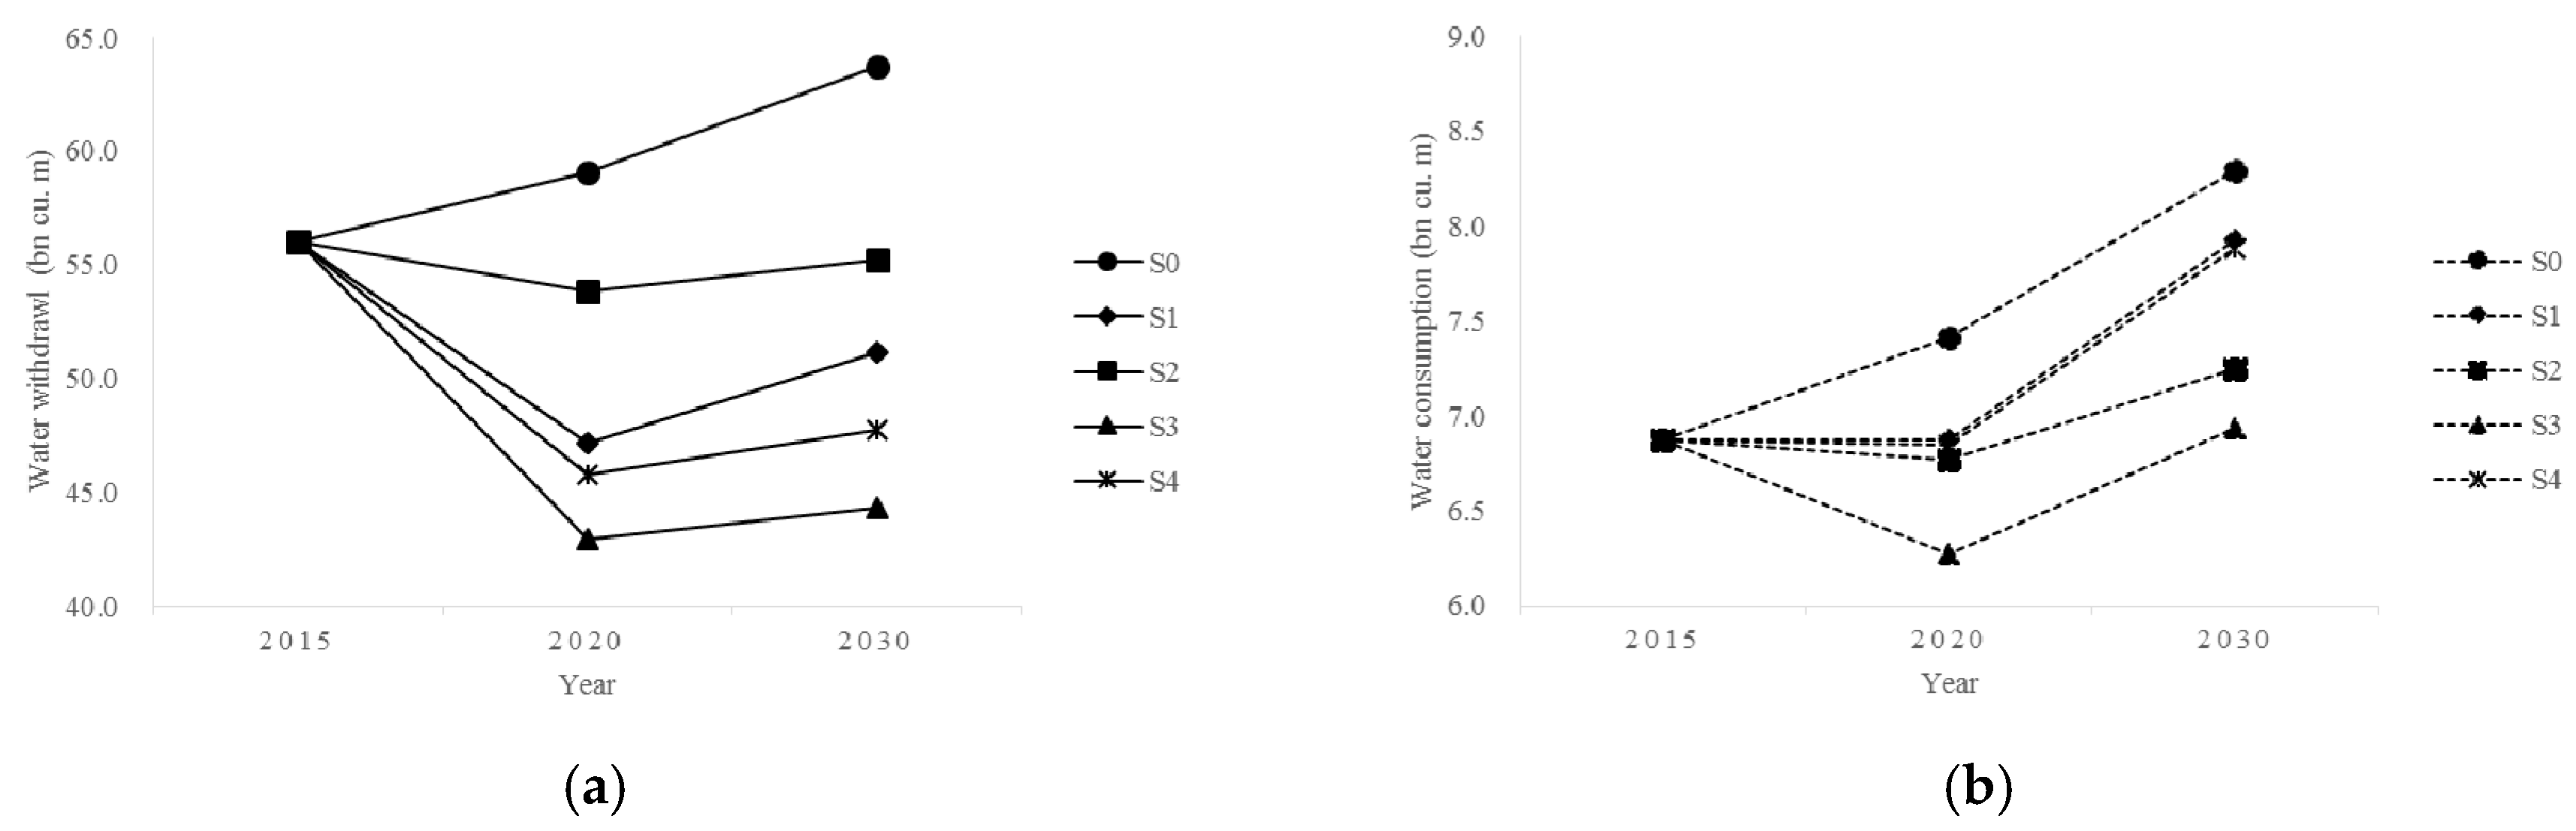
Figure 2.
Water withdrawal by region under different scenarios (in billion m3) for the year of 2015, 2020 and 2030; y-axes have the same scales for a multiregional comparison purpose.
Figure 2.
Water withdrawal by region under different scenarios (in billion m3) for the year of 2015, 2020 and 2030; y-axes have the same scales for a multiregional comparison purpose.

Figure 3.
Water consumption by region under different scenarios (in billion m3) for the year of 2015, 2020 and 2030; y-axes have the same scales for a multiregional comparison purpose.
Figure 3.
Water consumption by region under different scenarios (in billion m3) for the year of 2015, 2020 and 2030; y-axes have the same scales for a multiregional comparison purpose.

Figure 4.
Water withdrawal (a,c,e) and consumption (b,d,f) for the five scenarios in the three highly developed regions: North region (a,b), East Coastal region (c,d), and South Coastal region (e,f).
Figure 4.
Water withdrawal (a,c,e) and consumption (b,d,f) for the five scenarios in the three highly developed regions: North region (a,b), East Coastal region (c,d), and South Coastal region (e,f).
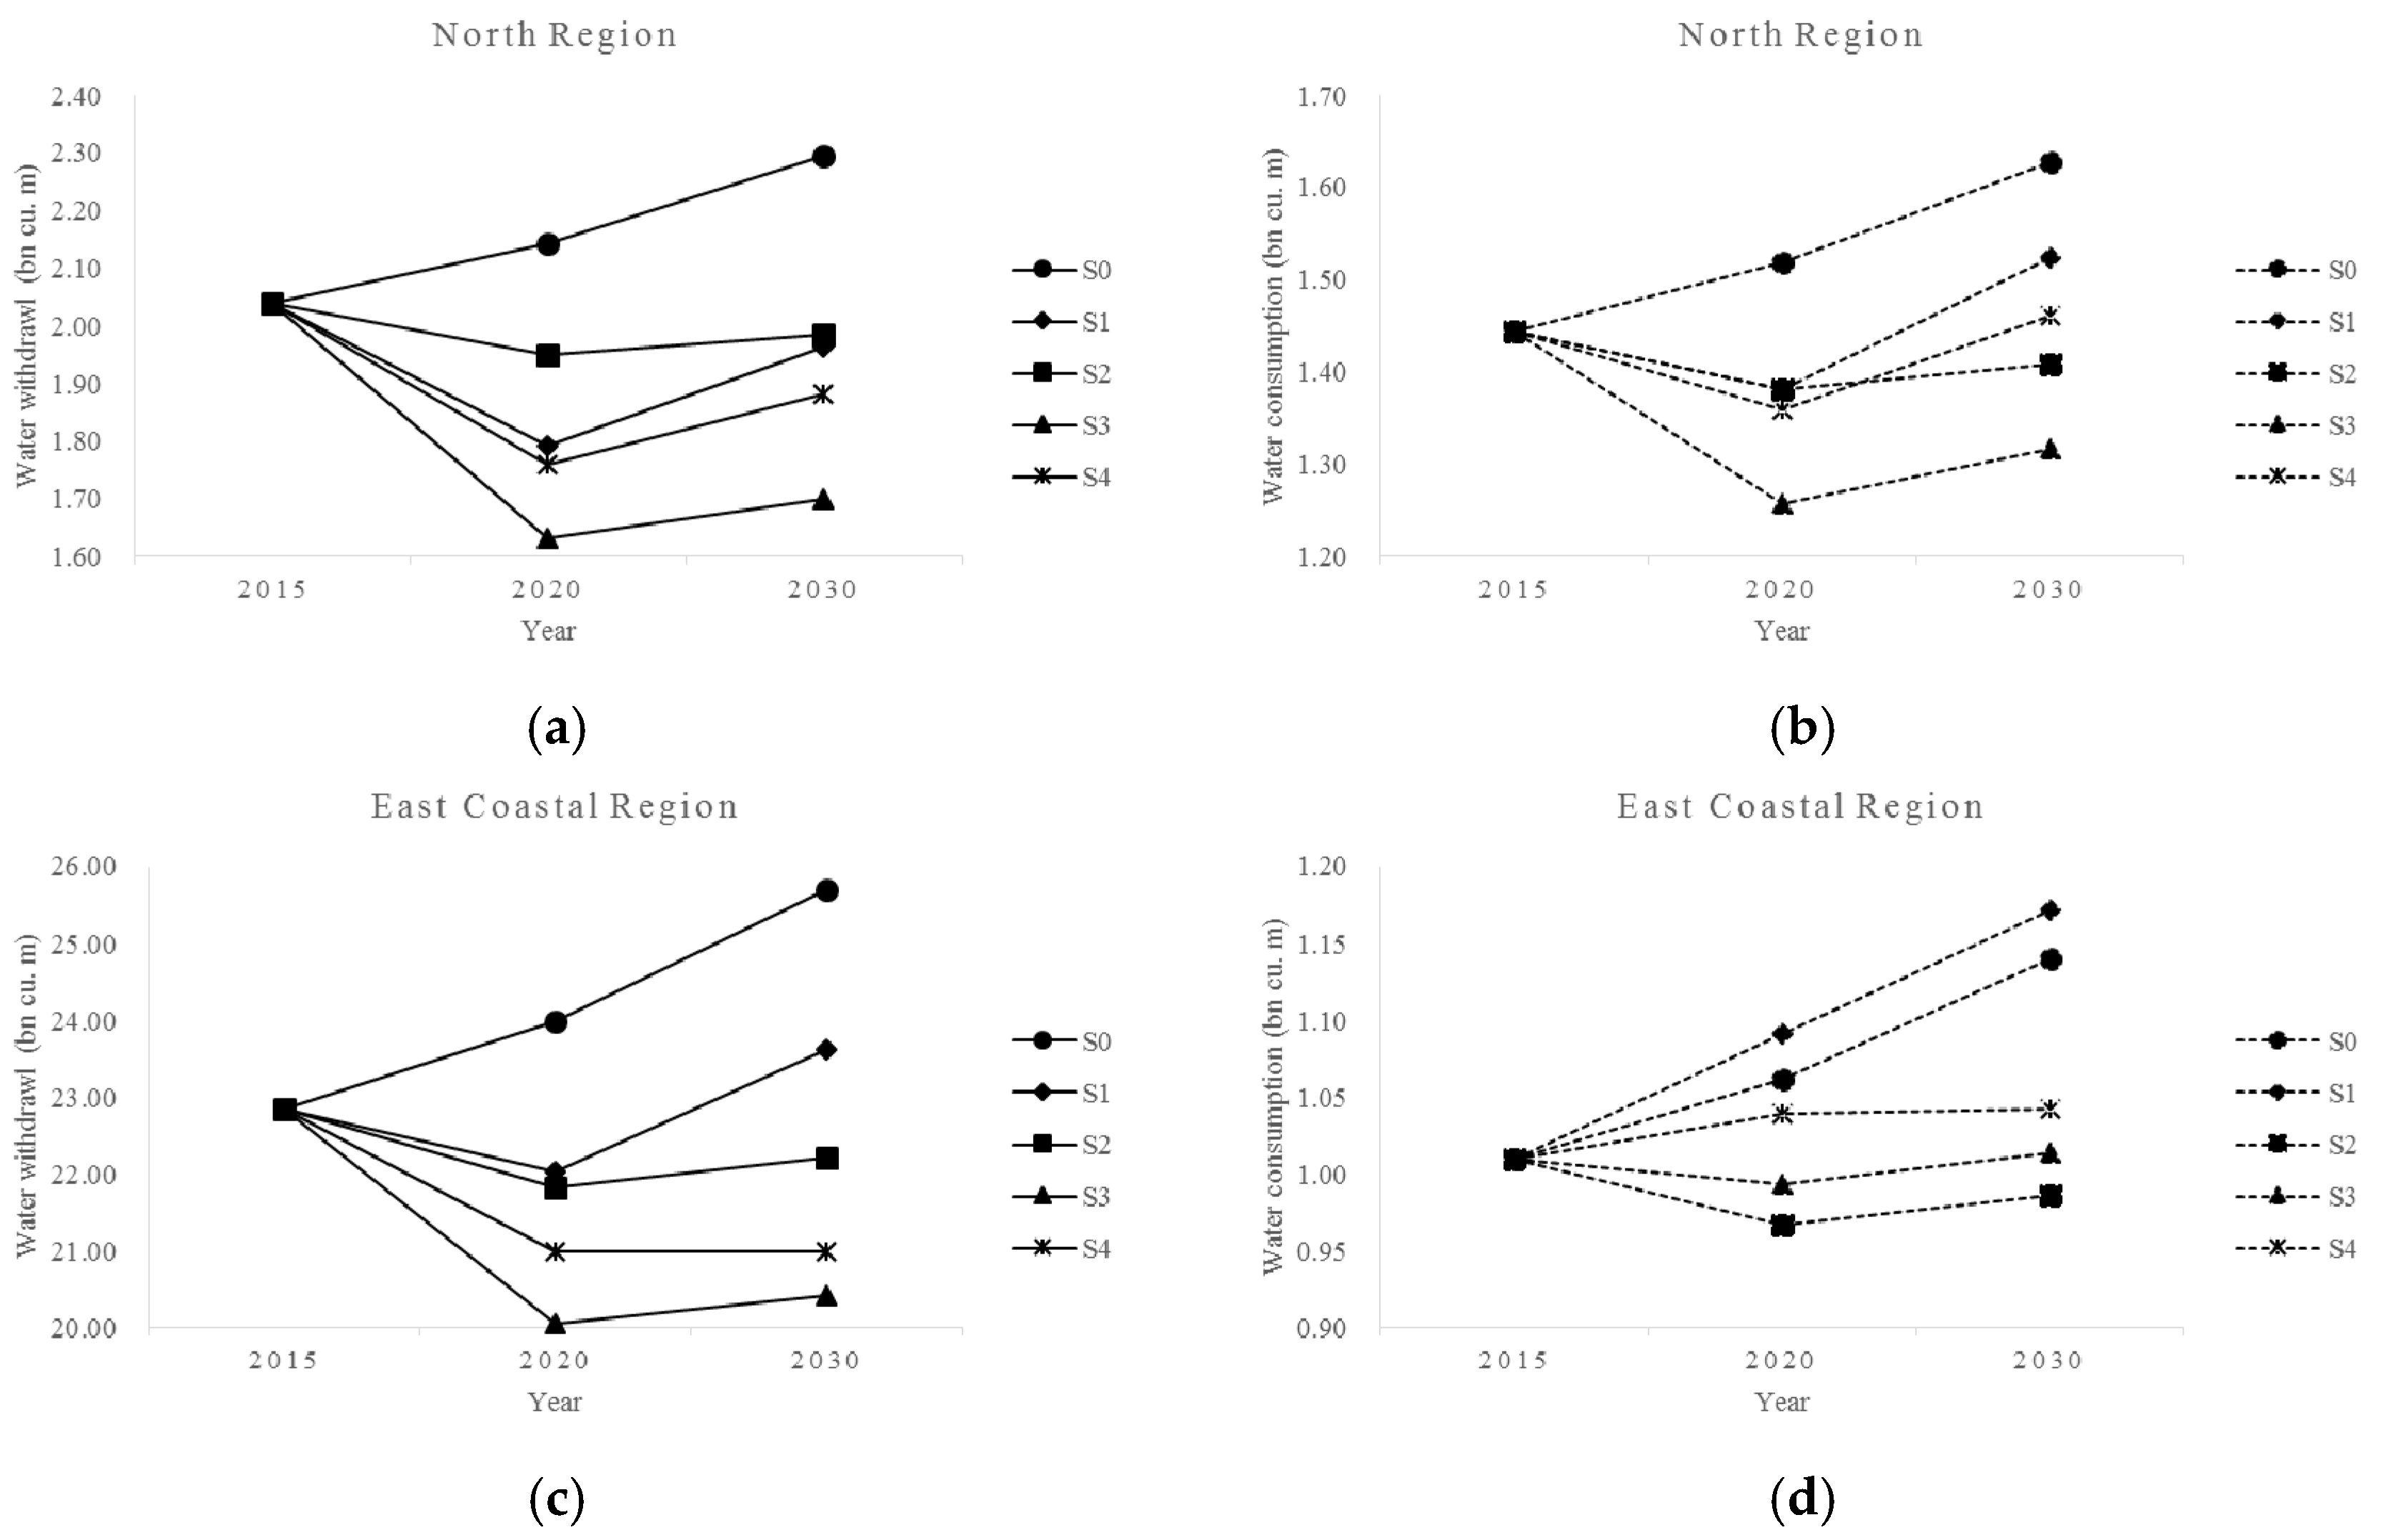

Figure 5.
Water withdrawal (a) and consumption (b) for the five scenarios in the SX-InnerM region and water withdrawal (c) and consumption (d) for the five scenarios in the Northwest region.
Figure 5.
Water withdrawal (a) and consumption (b) for the five scenarios in the SX-InnerM region and water withdrawal (c) and consumption (d) for the five scenarios in the Northwest region.


Table 1.
Electricity generation by region in 2020 and 2030 (TWh).
| Region | 2020 | 2030 | ||||
|---|---|---|---|---|---|---|
| Reference | Reallocation | West-Centered | Reference | Reallocation | West-Centered | |
| North | 914 | 862 | 898 | 1053 | 967 | 1012 |
| Northeast | 449 | 462 | 449 | 684 | 701 | 684 |
| SX-InnerM | 723 | 711 | 745 | 891 | 872 | 946 |
| Northwest | 926 | 992 | 970 | 1223 | 1350 | 1333 |
| Central | 1079 | 1053 | 1079 | 1304 | 1259 | 1304 |
| East coastal | 901 | 861 | 866 | 1064 | 995 | 976 |
| South coastal | 872 | 858 | 857 | 1231 | 1205 | 1195 |
| Southwest | 970 | 1036 | 970 | 1072 | 1173 | 1072 |
| National total | 6834 | 6834 | 6834 | 8521 | 8521 | 8521 |
Note: The aggregation of the eight regions is introduced in Appendix A.
Table 2.
Summary of the five scenarios.
| Scenario | Objectives | Descriptions |
|---|---|---|
| S0 | Business as usual | The cooling technologies are the same as those in 2015 |
| S1 | Cooling technology upgrading | The proportion of air cooling in water-scarce regions is increased by equipping newly built thermal power plants with air-cooling systems; moreover, once-through cooling systems are replaced with closed-loop cooling systems |
| S2 | Power generation reallocation | The proportion of nonthermal power generation is increased to more than 35% by 2020 and 40% by 2030 |
| S3 | S1 + S2 | The effects of cooling technology updating and power generation reallocation are combined |
| S4 | West-centered layout of thermal power generation | Building new thermal power plants in the three eastern key areas is banned; electricity is transferred from the western areas to the eastern areas |
Table 3.
Configuration details for the five scenarios.
| Scenario | Cooling | Electricity Mixture | Layout of Electricity Generation |
|---|---|---|---|
| S0 | No change | Reference | Reference |
| S1 | Upgrading | Reference | Reference |
| S2 | No change | More nonthermal | Reallocation |
| S3 | Upgrading | More nonthermal | Reallocation |
| S4 | Upgrading | Reference | West-centered |
Table 4.
Water withdrawal and consumption factors.
| Electric Power Type | Coal-Fired Power | Nuclear Power | |||
|---|---|---|---|---|---|
| Cooling Technology | Water Withdrawal Factor (m3/MWh) | Water Consumption Factor (m3/MWh) | Water Withdrawal Factor (m3/MWh) | Water Consumption Factor (m3/MWh) | |
| Once-through cooling | 89.13 | 0.30 | / | / | |
| Closed-loop cooling | 2.37 | 1.89 | 0.0543 (coastal) 3.56 (inland) | 0.0523 (coastal) 2.84 (inland) | |
| Air cooling | 0.34 | 0.018 | / | / | |
© 2017 by the authors. Licensee MDPI, Basel, Switzerland. This article is an open access article distributed under the terms and conditions of the Creative Commons Attribution (CC BY) license (http://creativecommons.org/licenses/by/4.0/).
Share and Cite
MDPI and ACS Style
Lin, L.; Chen, Y.D. Evaluation of Future Water Use for Electricity Generation under Different Energy Development Scenarios in China. Sustainability 2018, 10, 30. https://doi.org/10.3390/su10010030
AMA Style
Lin L, Chen YD. Evaluation of Future Water Use for Electricity Generation under Different Energy Development Scenarios in China. Sustainability. 2018; 10(1):30. https://doi.org/10.3390/su10010030
Chicago/Turabian StyleLin, Lu, and Yongqin David Chen. 2018. "Evaluation of Future Water Use for Electricity Generation under Different Energy Development Scenarios in China" Sustainability 10, no. 1: 30. https://doi.org/10.3390/su10010030
Note that from the first issue of 2016, this journal uses article numbers instead of page numbers. See further details here.