Article

Assessing Green and Blue Water Footprints in the Supply Chain of Cocoa Production: A Case Study in the Northeast of Colombia

by
Carlos Andrés Naranjo-Merino
1,
Oscar Orlando Ortíz-Rodriguez
2,* and
Raquel A. Villamizar-G
3
1
Gaia Servicios Ambientales. Cll 32b sur-47-06, Envigado 050001, Antioquia, Colombia
2
Departamento de Ingeniería Industrial, Universidad de Pamplona, Km 1 Bucaramanga, Campus Universitario, Pamplona 760032, Norte de Santander, Colombia
3
Departamento de Microbiología, Universidad de Pamplona, Km 1 Bucaramanga, Campus Universitario, Pamplona 760032, Norte de Santander, Colombia
*
Author to whom correspondence should be addressed.
Sustainability 2018, 10(1), 38; https://doi.org/10.3390/su10010038
Submission received: 11 October 2017 / Revised: 20 December 2017 / Accepted: 22 December 2017 / Published: 25 December 2017
(This article belongs to the Special Issue Water Footprint in Supply Chain Management)

Abstract

:
Cocoa is an important commercial crop in the tropics, and estimating the water footprint to target areas of improvement is a worthwhile effort. The main goal of this paper was to assess the regional green and blue water footprints (WF) of cocoa (Theobroma cacao L.) production in the department of Norte de Santander, Colombia. Water footprint assessment was based on the Water Footprint Assessment Manual. The results show that the green water footprint was about 13,189 m3/ton, and the blue water footprint was 5687 m3/ton. The WF proposed method can be a good approximation for the uses of water for different crops, but weather conditions and hydrological modeling must be considered in extreme conditions, which would permit a much more detailed analysis for a region. This study allowed us to provide data on the cocoa water footprint, principally concentrating on elevated grain production in the department of Norte de Santander, Colombia. In addition, some of these results may positively contribute to water resource management improvement, especially regarding food security and water scarcity, both at the local and national levels. Therefore, the cocoa production process was analyzed from agronomic practices in settled crops, through the primary processing of the grain, to the procedures of grain selection and packaging. Thus, taking into consideration that most cocoa crops produced in Colombia are not irrigated, it is possible to implement productivity enhancement programs.

1. Introduction

Africa is the largest producer of cocoa beans in the world, producing 66% of the global volume, while Asia produces 15% and the Americas produce only 15%. Colombia is the fourth largest Latin American producer of cocoa. Cocoa production in Colombia grew by 3.6% in 2016. However, the domestic demand for cocoa for chocolate is insufficient [1].
The importance of the cocoa supply chain in Colombia is seen in its economic and social impact, since cocoa is grown by approximately 25,000 farmer families, with 90% of production being carried out by smallholders. Furthermore, the cocoa cultivation area in Colombia is about 100,000 ha, with a productivity of 450 kg/ha/year, which is certainly a small figure when compared to that of the first producer worldwide (Ivory Coast: 700 kg/ha/year). In 2012, the department of Norte de Santander (N. de S.) reached an average yield of 467 kg/ha. These are both low figures when compared to the national production objective of 1200 kg/ha/year [2].
Since the Abidjan Cocoa Declaration in 2012, the cocoa sector has gained more attention; and a Global Cocoa Agenda was published which called for a strategy looking for the development of new knowledge aimed at conciliating productivity, technological innovation, and sustainability within the cocoa value chain [3].
Water scarcity is one important environmental challenge the agriculture sector is facing due to the high direct bearing on cropping activities [4,5,6,7,8]. This challenge is all the greater because the problems associated with water availability may appear sooner than expected, particularly in food and environmental issues, such as climate change [9,10,11,12,13]. There are numerous factors which influence and affect global water resources, such as population growth, changes in production and consumption patterns, increasing competition over water because of increased demands for domestic, industrial and agricultural purposes [14,15,16].
Therefore, water scarcity has been studied by several researchers resorting to a variety of indicators based on human water requirements, water resources vulnerability indices and indices incorporating environmental water requirements [17,18]. More than a decade ago, the water footprint (WF) concept was introduced as an indicator of freshwater use. WF is, in this sense, a method aimed at studying the situation of water from the perspective of production and consumption, as well as indirect water use. It allows the segregation of the blue, green and grey WF, which detail consumption according to the whole production chain. The blue WF refers to consumption of blue water resources (surface and groundwater) along the supply chain of a product. ‘Consumption’ refers to loss of water from the available ground-surface water body in a catchment area. Losses occur when water evaporates, returns to another catchment area or the sea or is incorporated into a product. The green WF refers to consumption of green water resources (rainwater insofar as it does not become run-off); however, the non-consumptive part of water withdrawals (the return flow) is not part of the WF [19,20,21]. This water fraction is usually represented by the amount of precipitated water that is consumed by the crop during its entire productive life [22]. The grey water footprint is the water that has been previously used and may contains some impurities.
Crops use 70% of the world’s water. Rice paddy use is around 21% of the total water consumed for crops, wheat comprises 12%, maize comprises 9%, and cocoa beans comprise around 1% [23]. In this sense, it is necessary to assess the impact of water use on production systems to the development of water management policies at the national and local levels. For this reason, the main objective of the present study is to evaluate, on a regional basis, the green and blue WF of cocoa cultivation in the rural zones of the department of Norte de Santander located in the northeast of Colombia. To accomplish the proposed objective, the information obtained in this research has been compiled in four parts: the methodology application, results, discussion and, finally, conclusions. To our knowledge, this research is one of the first to apply the mentioned WF methodology to the agronomic sector in Norte de Santander, Colombia and the first that documents the contribution to water resource management improvement, especially regarding water scarcity at the local level.

2. Materials and Methods

Water footprint assessment is based on the Water Footprint Assessment Manual [19]. The zone of the study was the department of Norte de Santander, Colombia in the rural zones of Tibú, El Zulia, El Tarra, and San Cayetano. Data were obtained during 2014 from 30 farms representing the current state of cocoa farming in each rural zone, which actually corresponds to conventional cropping and currently reaches yearly averages from 400 to 1200 kg/ha. Thus, three varieties were sampled in this system: clone CCN-51, clone ICS-39, and a hybrid. Both clones show yields of cocoa higher than 1500 kg/ha/year, partly due to their resistance to pests and diseases. In contrast, the hybrid one yields between 1000 and 1200 kg/ha/year. The climate data such as temperature, humidity, wind, and sunshine were calculated in a period of one year during 2014 based on monthly average hydrological data taken from the IDEAM (Colombian Institute for Hydrology, Meteorology and Environmental Studies). The calculation was based on the CROPWAT 8.0 model, which has been developed by the Food and Agriculture Organization of the United Nations [24].
The evapotranspiration of the crop (ETc) was calculated using Equations (1) and (2):
ETc = Kc × ET0
ETc adj = ET0 × Kc × Ks
where:
  • ETc = total crop evapotranspiration;
  • Kc = crop specific coefficient;
  • Ks = water stress coefficient;
  • ET0 = evapotranspiration of the reference crop; and
  • ETc adj = crop evapotranspiration in non-optimal conditions.
Then, the Ks is a function of the total available water that is dependent on the hydrophysical soil conditions, the root zone depletion and the fraction of the total available water that the crop can extract from the root zone without suffering water stress. Therefore, field measurements were taken in order to calculate it, as shown in Table 1.
Parameters such as the crop conditions factor (Kc) were estimated using the crop’s evapotranspiration through the Penman-Monteith’s equation [25].
The crop parameters used for the estimation of the crop evapotranspiration, water-balance calculations, and yield reductions due to stress include: Kc; the length of the growing season; critical depletion level, Cd; and yield response factor, Ky.
The critical depletion fraction (Cd) represents the critical soil moisture level where the first drought stress occurs that affects crop evapotranspiration and crop production. Values are expressed as a fraction of total available water (TAW) and normally vary between 0.4 and 0.6, with lower values taken for sensitive crops with limited rooting systems under high evaporative conditions, and higher values for deep and densely rooting crops and low evaporation rates. In addition, the fraction p is a function of the evapotranspiration power of the atmosphere [22]. At lower rates of ETc, the values of the fraction p are higher than those at high rates of ETc.
The CROPWAT software (FAO, Rome, Italy) includes standard data for main crops and it is possible to adjust them to meet actual conditions [24]. The critical depletion factor varies depending on crop conditions; therefore, it was statied using the Equation (3):
Cd = 0.3 + 0.04 (5 − ETc)
Green evapotranspiration (ETgreen) was defined as the lesser value between crop evapotranspiration (ETc) and effective precipitation (Pef) (Equation (4)), implying that it equals Pef when water is scarce and irrigation becomes necessary. This is only the case when ETc is estimated for longer than 10-day periods within the total cultivation period. ETc is estimated with a ten-day time step and over the total growing season using the effective rainfall [19] total ETgreen is defined as the sum of the ETgreen values estimated for all periods:
ETgreen = min {Pef, ETc}
where
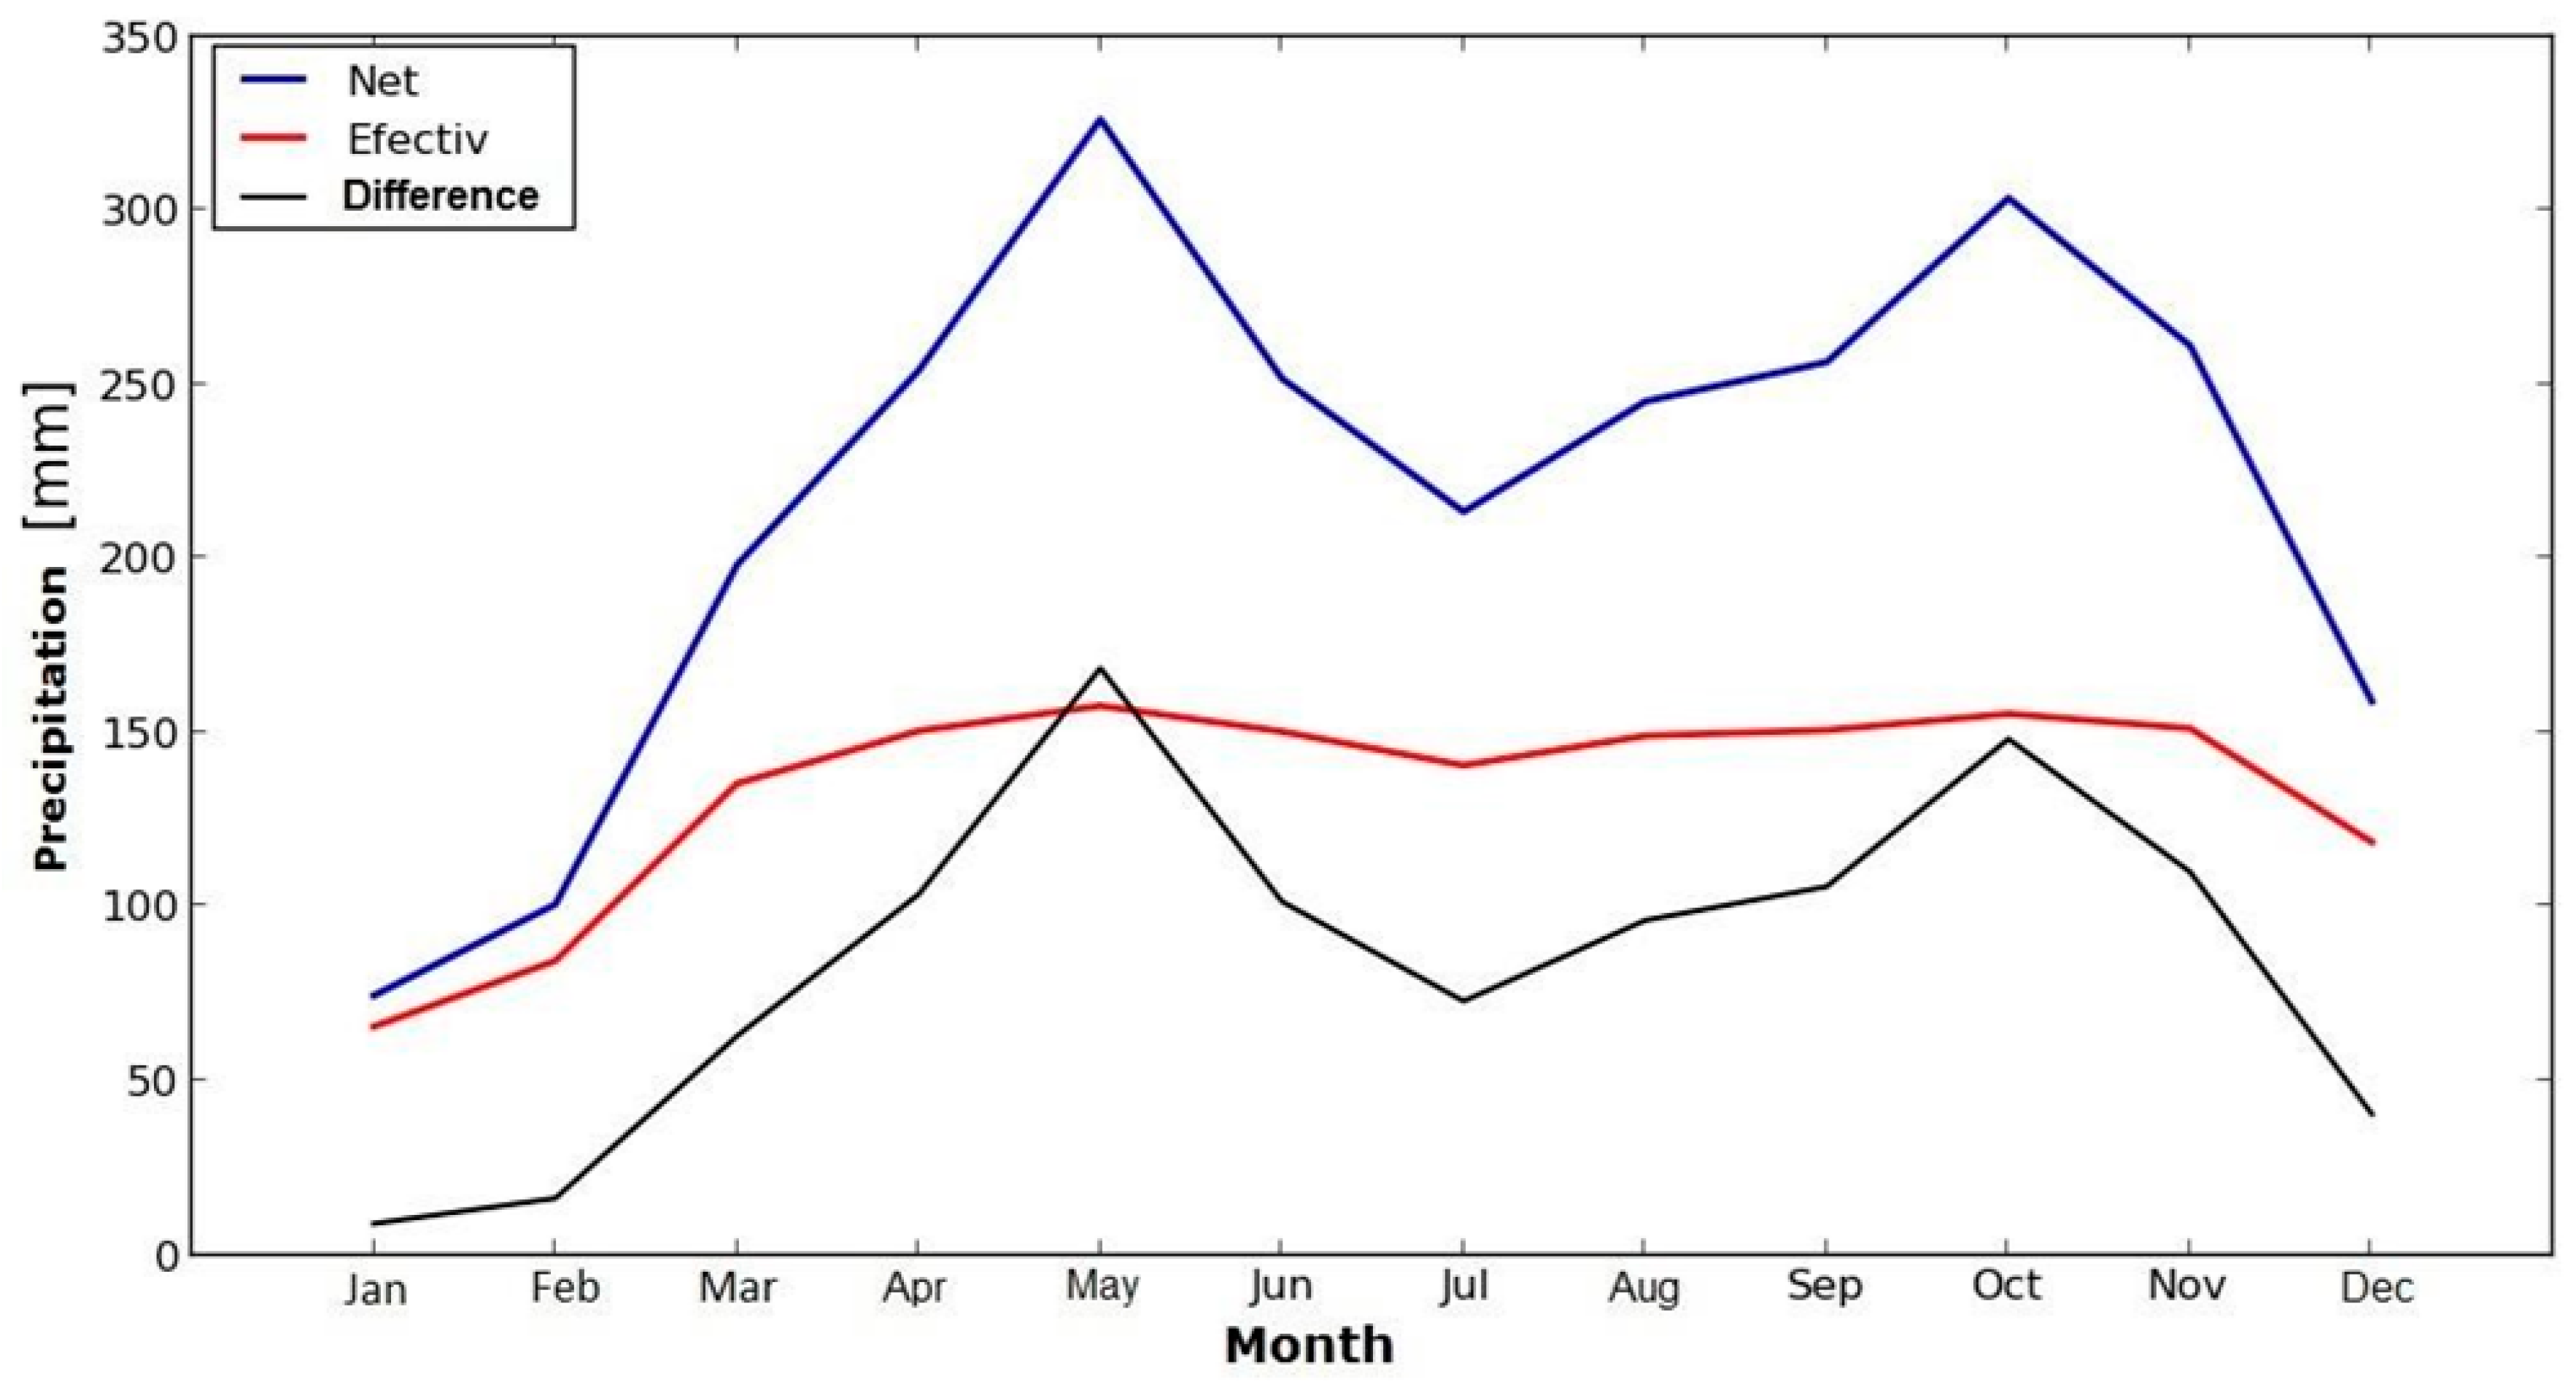
  • Pef = effective precipitation; and
  • Blue evapotranspiration (ETblue) was estimated using Equation (5):
    ETblue = max {0, ETc − Pef}
Finally, the green and blue component of the crop’s WF were estimated through Equations (6) and (7), respectively. “The ‘green’ crop water use represents the total rainwater evaporated from the field during the growing period; the ‘blue’ crop water use represents the total irrigation water evaporated from the field” [21]:
WFgreen = CWUgreen Y − 1
WFblue = CWUblue Y − 1
where:
  • CWUgreen = the green component of crop water usage (m3/ha);
  • CWUblue = the blue component of crop water usage (m3/ha); and
  • Y = crop yield (ton/ha).
For the present study, the following assumptions have been made:
A constant, crop specific value (Kc) relating ETc with ET0 was empirically obtained. In the case of cocoa, Kc = 1.0 for the initial crop stage, and Kc = 1.05 for subsequent stages.
ETc is the single crop coefficient (Kc) [23].
The following assumptions have been considered:
  • Root depth for the adult crop was assumed to be 1 m.
  • Crop development time was assumed to be 360 days because, although cocoa takes four to five years to start producing, once it does, it yields one yearly harvest.
  • The soil’s initial water deficit was assumed to be 30%.
  • A 12-h daily sunshine period was uniformly assumed for all the months of the year. This data was considered because Colombia is located at 4° north latitude.
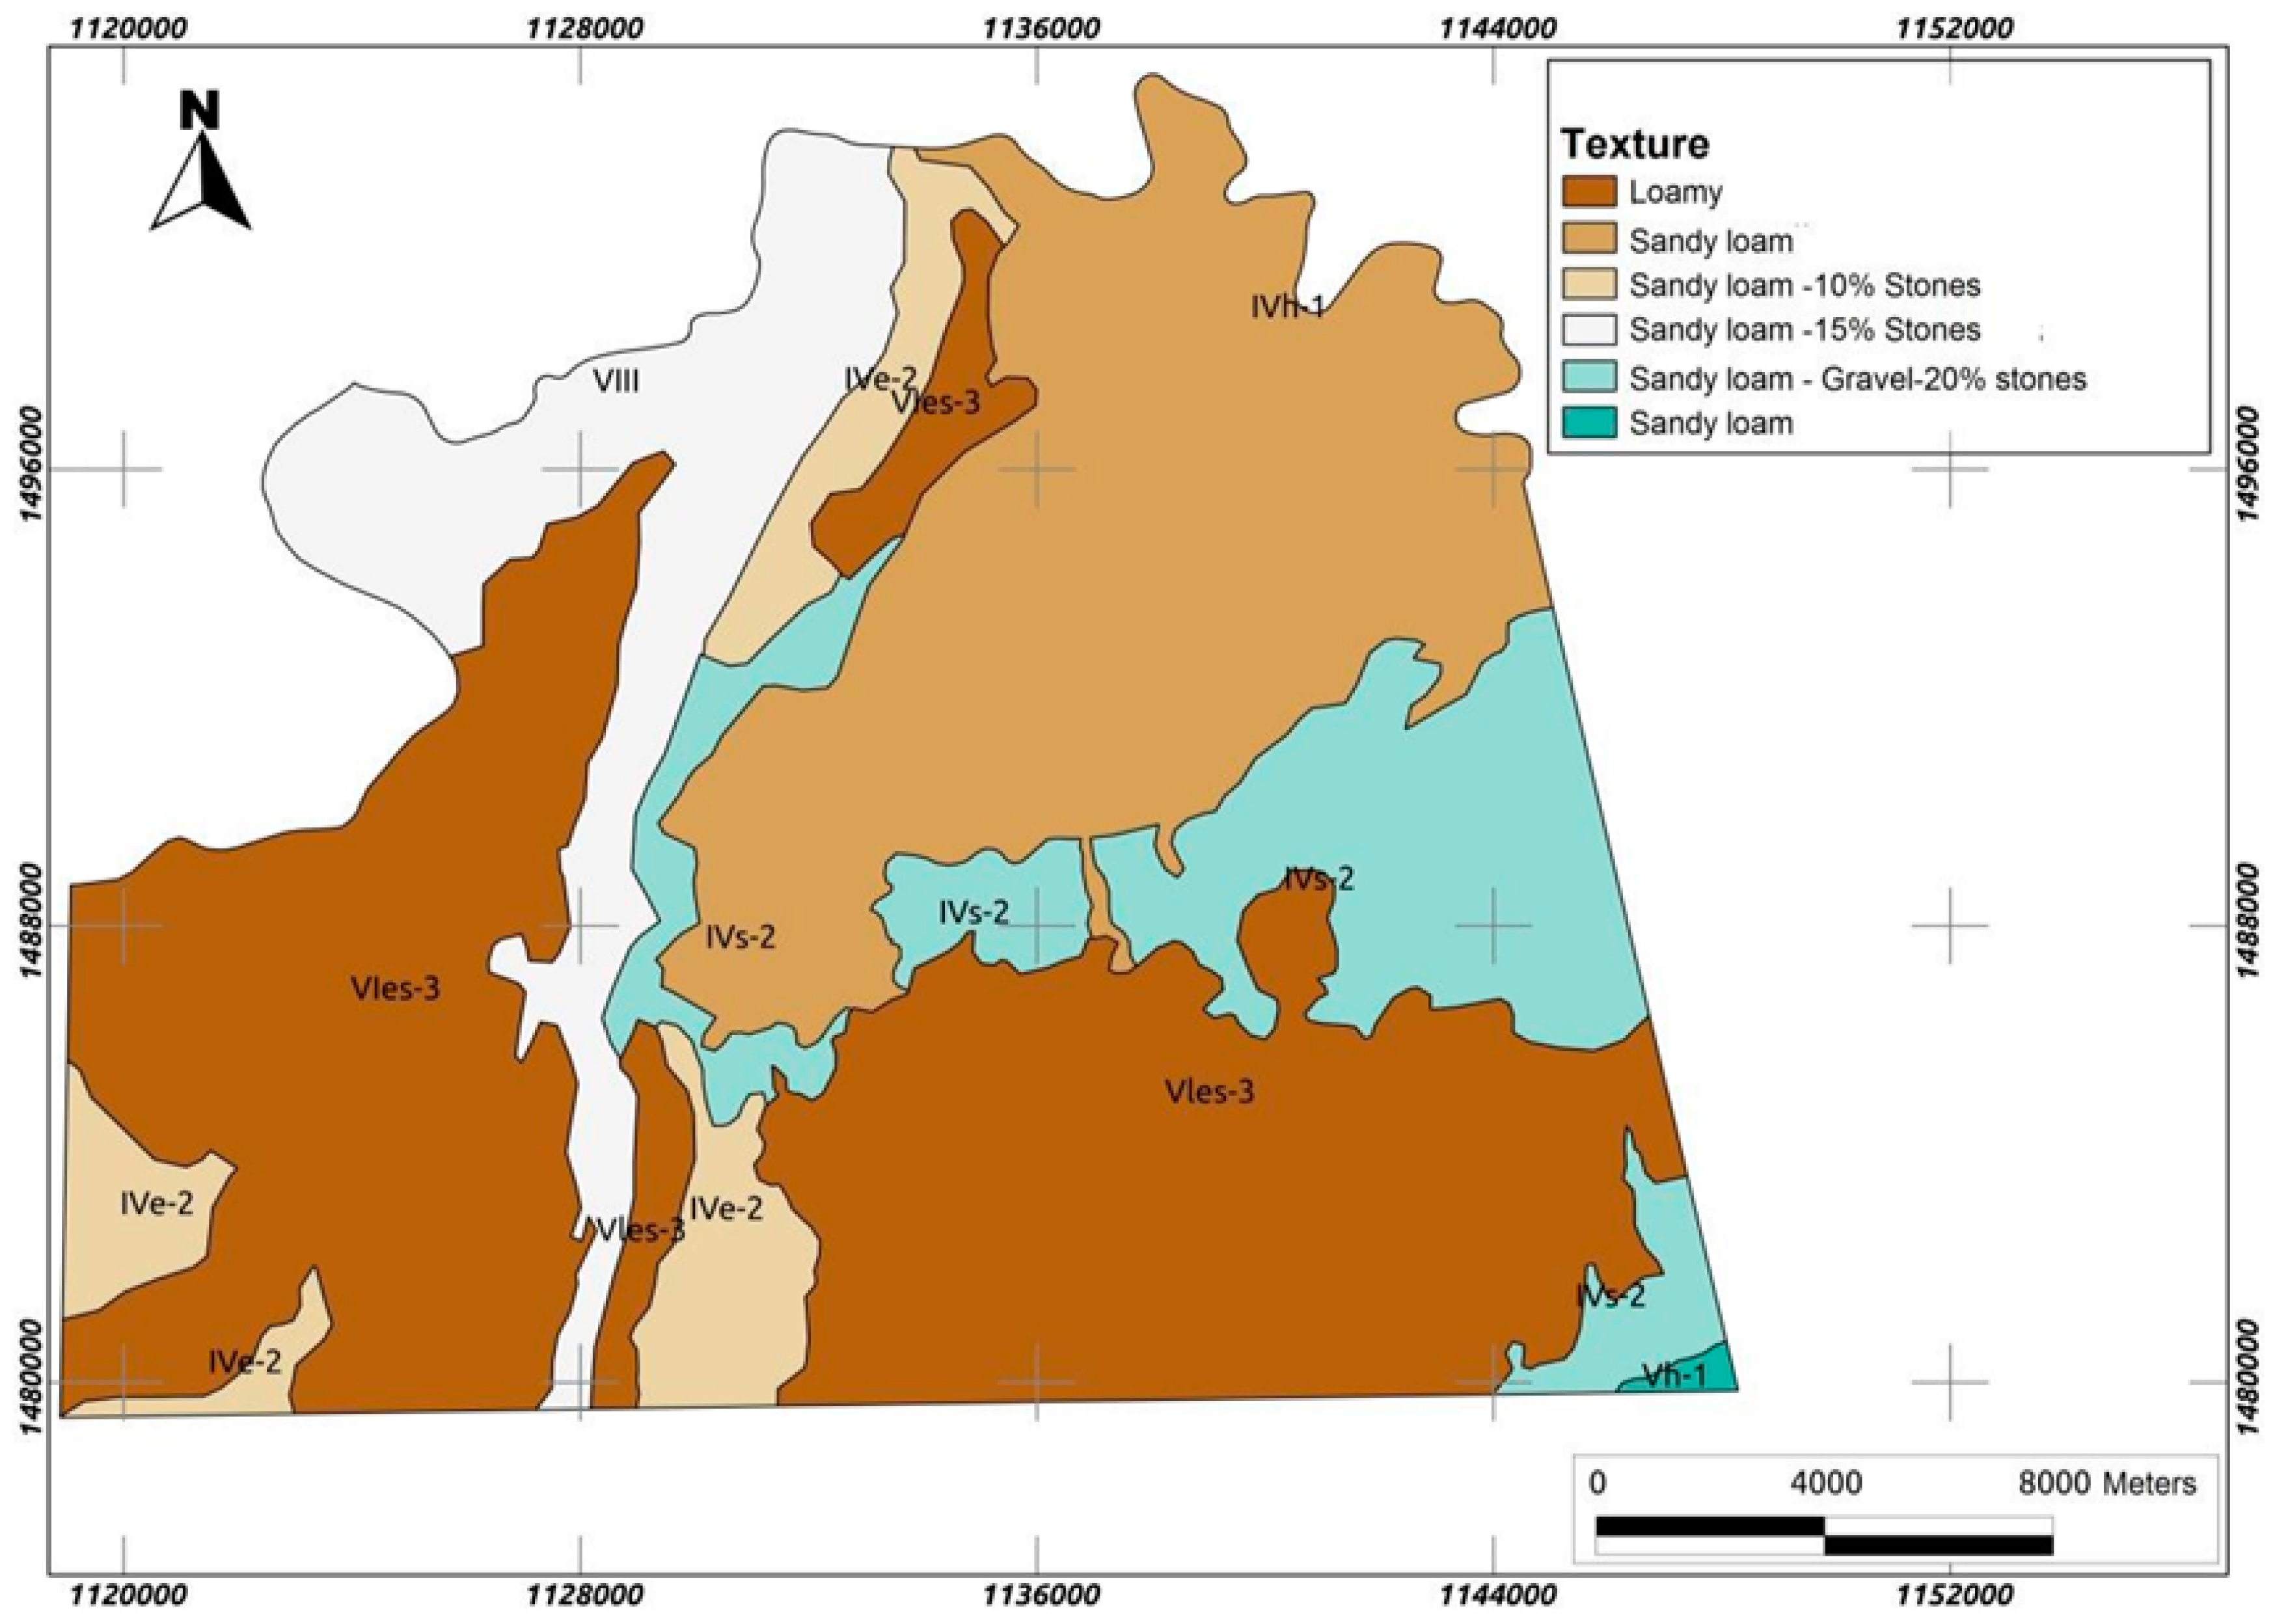
  • Soil texture data was based on the soil texture map number 57 of the general soil and land study of the department of Norte de Santander (see Figure 1).
The cocoa cultivation area in Colombia has a productivity of 450 kg/ha/year and the national production target is 1200 kg/ha/year [2]. Finally, in this paper, the grey WF is out of scope because it occurs during the cultivation phase of the farmer, and this is not a common agricultural practice among Colombian farmers [23].

3. Results

Available soil moisture reported the amount of water stored in the soil per meter of linear depth [26]. The maximum infiltration rate was based on water infiltration speed in saturated soil. According to the parameters presented and weighted by the area of each Ks, the Ks was estimated at 187 mm/day.
Figure 2 compares annual monthly precipitation to effective precipitation as calculated for each month. It can be observed how the bimodal cycle does not largely affect net precipitation, except for the driest periods, during which the difference between both precipitations decreased considerably. The results also reveal that yearly average net precipitation was 2642.5 mm/year, and that effective yearly average precipitation was 1608.4 mm/year, the latter being approximately 60% of the former.
In calculating green (ETgreen) and blue (ETblue) evapotranspiration values, it is important to keep in mind that ETblue equals zero during rainy periods in which Pef exceeds ETc.
Table 2 shows the calculation of green, blue and effective evapotranspiration records as measured in (mm/day), i.e., millimeters of water precipitated every 10 days. Hence, the calculated values were: ETgreen = 1582.7 mm/day, and ETblue = 682.5 mm/day.
Then, the green and blue components of the amount of water employed by the crop were respectively 13,189 m3/ton and 5687 m3/ton. Hence, the total WF was (WFtot) 18,876 m3/ton.
The present case study has dealt particularly with the volume of water used to produce cocoa because of its importance within the agriculture sector, and because water scarcity is an environmental impact that affects the whole planet [27]. Therefore, we undertook comparative WF analyses of cocoa production both externally and locally.
For instance, Van Oel et al. in 2009 calculated the external WF of the Netherlands and assessed the impact of this footprint by contrasting the geographically-explicit WF with water scarcity in different parts of the world [28]. The result shows that the WF of cocoa beans was about 18,876 m3/ton. Another study performed by Mekonnen and Hoekstra in 2010 concluded that the global average WF (m3/ha) of cocoa beans was 19,745 [29]. Local data on the WF of crops from developing and emerging countries, especially Colombia, however, is still lacking.

4. Discussion

The WF of the cocoa production equals 18,876 m3/ton, in the same order of magnitude as the previously-published WF of primary crops; the global average WF (m3/ha) of cocoa beans was 19,745 [29]. The differences lies in the meteorological variables: humidity and wind velocity. Another aspect that strongly influences the water consumption is shade. Almost all of the cocoa production system is under an agroforestry system, of which the shade could reduce the water consumption and the rainfall distributions and the water balance as well. Nevertheless, cocoa productivity strongly influences the amount of water needed per kg of cocoa, so policies that increase productivity per hectare allow a more efficient use of resources, in particular water. Secondly, agricultural techniques and different conditions, such as climate and cultural consumption behavior, vary from country to country [30]. The WF method can be a good approximation of the uses of water for different crops, but weather conditions and hydrological modeling must be considered in extreme conditions, which would permit a much more detailed analysis for a region [31]. Finally, the methods available for global scale analysis have a limited spatial or temporal resolution. In a global context, the WF is a relevant indicator of the how much of the global scarce freshwater resources are used for a specific product. In a local context, the spatiotemporally explicit WF can be overlaid with a water-stress map. This could help to arrive at a spatiotemporally explicit WF impact map [32]. Another limitation is the lack of data, and that limits the computational effort and method complexity [33]. For agronomics, a reliable set of data is indispensable when crop productivity is pursued. In a country such as Colombia, with broad differences in landscape morphology and large areas with no meteorological registration, the remote sensing technologies are relevant for achieving goals in monitoring and crop protection. Thus, it is important to conduct hydric source protection programs, in the sense of reviewing the condition of the basins that guarantee water supply, regardless of whether they are used for irrigation or not, because they are part of the hydrological cycle.

5. Conclusions

This study allowed us to provide data on cocoa WF, principally concentrating elevated grain production in the department of Norte de Santander, Colombia. In addition, some of these results may positively contribute to water resource management improvement, especially regarding food security and water scarcity, both at the local and national levels.
Therefore, the cocoa production process was analyzed from agronomic practices in settled crops, through the primary processing of the grain, to the procedures of grain selection and packaging. Thus, taking into consideration that most cocoa crops produced in Colombia are not irrigated, it is possible to implement productivity enhancement programs.
Cocoa varieties that yield up to 1500 kg ha−1 year are, compared to the 300 kg ha−1 year records of the local varieties, considerably more efficient, all the more so because they use the same amount of green water (rainfall) to produce these significantly higher yields. These highly productive varieties can be promoted from the Cocoa Growers Federation (Federación de Cacaoteros) or from local cocoa associations. Provided that fertilizer and pesticide use are common practices in the Department of Norte de Santander as well as most Colombian cocoa cultivations, organic agriculture can be fruitfully promoted, thus reducing water contamination, which, in turn, contributes to a crop’s grey WF which is the water that has been previously used and may contain some impurities. Future research is anticipated to analyze the environmental impacts of the grey water footprint during the supply chain of the cocoa production phase of the farmer.

Acknowledgments

This work has been fully financed by the Colombian Administrative Department of Science, Technology, and Innovation (COLCIENCIAS), Inter-American Development Bank (IDB), and World Bank (WB) BIRF, Project Reference 0371-2012.

Author Contributions

Carlos Naranjo was the principal of the study and responsible for the carried out the work. Oscar Ortiz was the scientific supervisor, carried out the characterization, design of experiment, data analysis of the WF and drafted the manuscript. Raquel Villamizar wrote the manuscript and contributed to the scientific support of this article. All authors read and approved the final manuscript.

Conflicts of Interest

The authors declare no conflict of interest. The founding sponsors had no role in the design of the study; in the collection, analyses, or interpretation of data; in the writing of the manuscript; or in the decision to publish the results.

References

  1. García-Cáceres, R.G.; Perdomo, P.; Ortiz, O.; Beltrán, P.; López, K. Characterization of the supply and value chains of Colombian cocoa. Dyna 2014, 81, 30–40. [Google Scholar] [CrossRef]
  2. Ortiz-R, O.O.; Villamizar, R.V.; Rangel, J.M. Applying life cycle management of Colombian cocoa production. Food Sci. Technol. 2014, 34, 62–68. [Google Scholar] [CrossRef]
  3. International Cocoa Organization (ICCO). Abidjan Cocoa Declaration and Global Cocoa Agenda. World Cocoa Conference 2012. Available online: http://www.icco.org (accessed on 4 April 2016).
  4. Bradley, G.; Pfister, S. A revised approach to water footprinting to make transparent the impacts of consumption and production on global freshwater scarcity. Glob. Environ. Chang. 2010, 20, 113–120. [Google Scholar]
  5. Jefferies, D.; Muñoz, I.; Hodges, J.; King, V.; Aldaya, M.; Ercin, A.E.; Milà i Canals, L.; Hoekstra, A.Y. Water Footprint and Life Cycle Assessment as approaches to assess potential impacts of products on water consumption. Key learning points from pilot studies on tea and margarine. J. Clean. Prod. 2012, 33, 155–166. [Google Scholar] [CrossRef]
  6. Duarte, R.; Pinilla, V.; Serrano, A. The effect of globalisation on water consumption: A case study of the Spanish virtual water trade, 1849–1935. Ecol. Econ. 2014, 100, 96–105. [Google Scholar] [CrossRef]
  7. Ercin, A.E.; Mekonnen, M.M.; Hoekstra, A.Y. Sustainability of national consumption from a water resources perspective: The case study for France. Ecol. Econ. 2013, 88, 133–147. [Google Scholar] [CrossRef]
  8. Newton, P.; Agrawal, A.; Wollenberg, L. Enhancing the sustainability of commodity supply chains in tropical forest and agricultural landscapes. Glob. Environ. Chang. 2013, 23, 1761–1772. [Google Scholar] [CrossRef]
  9. Falkenmark, M.; Lannerstad, M. Consumptive water use to feed humanity—Curing a blind spot. Hydrol. Earth Syst. Sci. 2005, 9, 15–28. [Google Scholar] [CrossRef]
  10. Singh, S.P.; Singh, B.; Kumar, U. Water Management Strategies for Achieving Food Security. APCBEE Procedia 2013, 5, 423–428. [Google Scholar] [CrossRef]
  11. Ercin, A.E.; Hoekstra, A.Y. Water footprint scenarios for 2050: A global analysis. Environ. Int. 2014, 64, 71–82. [Google Scholar] [CrossRef] [PubMed]
  12. Misra, A.K. Climate change and challenges of water and food security. Int. J. Sustain. Built Environ. 2014, 3, 153–165. [Google Scholar] [CrossRef]
  13. Ortiz, O.O.; Villamizar, R.A.; Naranjo, C.A.; García, R.G.; Castañeda, M.T. Carbon footprint of the colombian cocoa production. Eng. Agríc. 2016, 36, 260–270. [Google Scholar] [CrossRef]
  14. Chen, H.; Yada, R. Nanotechnologies in agriculture: New tools for sustainable development. Trends Food Sci. Technol. 2011, 22, 585–594. [Google Scholar] [CrossRef]
  15. Parish, E.S.; Kodra, E.; Steinhaeuser, K.; Ganguly, A. Estimating future global per capita water availability based on changes in climate and population. Comput. Geosci. 2012, 42, 79–86. [Google Scholar] [CrossRef]
  16. Hseu, Z.-Y.; Chen, Z.-S. Review Experiences of Mass Pig Carcass Disposal Related to Groundwater Quality Monitoring in Taiwan. Sustainability 2017, 9, 46. [Google Scholar]
  17. Perveen, S.; James, L.A. Scale invariance of water stress and scarcity indicators: Facilitating cross-scale comparisons of water resources vulnerability. Appl. Geogr. 2011, 31, 321–328. [Google Scholar] [CrossRef]
  18. Zeng, Z.; Liu, J.; Savenije, H.G. A simple approach to assess water scarcity integrating water quantity and quality. Ecol. Indic. 2013, 34, 441–449. [Google Scholar] [CrossRef]
  19. Hoekstra, A.Y. The Water Footprint Assessment Manual: Setting the Global Standard; Water Footprint Network: London, UK; Washington, DC, USA, 2011. [Google Scholar]
  20. Rinaldi, S.; Bonamente, E.; Scrucca, F.; Merico, M.C.; Asdrubali, F.; Cotana, F. Water and Carbon Footprint of Wine: Methodology Review and Application to a Case Study. Sustainability 2016, 8, 621. [Google Scholar] [CrossRef]
  21. Bonamente, E.; Rinaldi, S.; Nicolini, A.; Cotana, F. National water footprint: Toward a comprehensive approach for the evaluation of the sustainability of water use in Italy. Sustainability 2017, 9, 1341. [Google Scholar] [CrossRef]
  22. Hoekstra, A.Y. Virtual Water Trade: Proceedings of the International Expert Meeting on Virtual Water Trade; Value of Water Research Report Series No. 12; UNESCO-IHE: Delft, The Netherlands, 2003. [Google Scholar]
  23. Martínez-Ángel, J.D.; Villamizar-G, R.A.; Ortíz-Rodriguez, O.O. Characterization and evaluation of cocoa (Theobroma cacao L.) pod husk as a renewable energy source. Agrociencia 2015, 49, 329–345. [Google Scholar]
  24. Food and Agriculture Organization (FAO) of the United Nations. CROPWAT 8.0 Model 2009. Available online: http://www.fao.org/land-water/databases-and-software/cropwat/es/ (accessed on 6 April 2014).
  25. Allen, G.A. Crop Evapotranspiration—Guidelines for Computing Crop Water Requirement; FAO Irrigation and Drainage Paper 56; FAO: Rome, Italy, 1998. [Google Scholar]
  26. Instituto Geográfico Agustín Codazzi (IGAC) (Ed.) General Soil and Land Study of the Department of Norte de Santander; Document Available in Spanish, Código: AGC0332; IGAC: Bogotá, Colombia, 2007; ISBN 9789588323015. [Google Scholar]
  27. Lawford, R.; Strauch, A.; Toll, D.; Fekete, B.; Cripe, D. Earth observations for global water security. Curr. Opin. Environ. Sustain. 2013, 5, 633–643. [Google Scholar] [CrossRef]
  28. Van Oel, P.R.; Mekonnen, M.M.; Hoekstra, A.Y. The external water footprint of the Netherlands: Geographically-explicit quantification and impact assessment. Ecol. Econ. 2009, 69, 82–92. [Google Scholar] [CrossRef]
  29. Mekonnen, M.M.; Hoekstra, A.Y. The Green, Blue and Grey Water Footprint of Crops and Derived Crop Products; Value of Water Research Report Series No. 47; UNESCO-IHE: Delft, The Netherlands, 2010. [Google Scholar]
  30. Pfister, S.; Bayer, P. Monthly water stress: Spatially and temporally explicit consumptive water footprint of global crop production. J. Clean. Prod. 2014, 73, 52–62. [Google Scholar] [CrossRef]
  31. Läderach, P.; Martinez-Valle, A.; Schroth, G.; Castro, N. Predicting the future climatic suitability for cocoa farming of the world’s leading producer countries, Ghana and Côte d’Ivoire. Clim. Chang. 2013, 119, 841–854. [Google Scholar] [CrossRef]
  32. Castro-Díaz, R. Evaluation of MODIS Land products for air temperature estimations in Colombia. Agron. Colomb. 2013, 31, 223–233. [Google Scholar]
  33. Barbieri, J.D.; Dallacort, R.; Santi, A.; Pereira Rocha, R.; Camillo de Carvalho, M.A. Zoneamento agroclimático de amendoinzeiro para a Bacia do Alto Paraguai (MT). Pesq. Agropecu. Trop. 2015, 45, 231–240. [Google Scholar] [CrossRef]
Figure 1. Soil and text map of the rural zones of Tibú, El Zulia, El Tarra, and San Cayetano, department of Norte de Santander.
Sustainability 10 00038 g001
Figure 2. Net and effective precipitation records.
Sustainability 10 00038 g002
Table 1. Soil and field measurements.
IDSoilTextureAreaWeightHuKs
1Vh-1Sandy loam9.81 × 1050.00 × 1001.80 × 1022.64 × 102
2IVs-2Sandy loam–Gravel-20% stones4.15 × 1078.00 × 10−28.00 × 1012.50 × 102
3IVs-2Sandy loam–Gravel-20% stones6.75 × 1061.00 × 10−28.00 × 1012.50 × 102
4Vles-3Loamy1.05 × 1082.10 × 10−11.20 × 1021.75 × 101
5IVs-2Sandy loam– Gravel-20% stones6.68 × 1061.00 × 10−28.00 × 1012.50 × 102
6Vles-3Loamy5.54 × 1061.00 × 10−21.20 × 1021.75 × 101
7IVe-2Sandy loam–10% Stones2.99 × 1061.00 × 10−21.00 × 1022.85 × 102
8IVs-2Sandy loam–Gravel-20% Stones1.12 × 1072.00 × 10−28.00 × 1012.50 × 102
9VIes-3Loamy7.12 × 1061.00 × 10−21.20 × 1021.75 × 101
10IVh-1Sandy loam1.23 × 1082.50 × 10−11.40 × 1028.09 × 101
11IVe-2Sandy loam–10% Stones1.09 × 1072.00 × 10−21.00 × 1022.85 × 102
12IVe-2Sandy loam–10% Stones1.23 × 1073.00 × 10−21.00 × 1022.85 × 102
13IVe-2Sandy loam–10% Stones7.30 × 1061.00 × 10−21.00 × 1022.85 × 102
14VIes-3Loamy9.30 × 1071.90 × 10−11.20 × 1021.75 × 101
15VIIISandy loam–15% Stones5.70 × 1071.20 × 10−18.00 × 1019.12 × 102
Table 2. Estimated green and blue evapotranspiration data.
Month (Average)Etc mm/DayEtadj mm/PeriodPef mm/PeriodIrri Req mm/PeriodET Green mm/PeriodET Blue mm/PeriodCd
May6.9571.8352.5019.3752.5019.330.22
June7.1371.2750.0021.2750.0021.270.21
July7.1874.2346.8727.3046.8727.370.21
August7.1874.1749.6324.5349.6324.530.21
September6.7267.2050.2716.9350.2716.930.23
October6.2664.6051.7712.8351.7712.830.25
November5.5655.6350.335.3350.335.300.28
December5.0151.8339.5012.3739.5012.330.30
January5.3455.2321.8733.4021.8733.370.29
February5.7153.2728.1325.1328.1325.130.27
March6.0562.5045.0717.4345.0717.430.26
April6.4153.3041.635.5341.6311.670.24

