Effects of Building Design Elements on Residential Thermal Environment


1
School of Earth Sciences and Engineering, Hohai University, Nanjing 211100, China
2
State Key Laboratory of Lake Science and Environment, Nanjing Institute of Geography and Limnology, Chinese Academy of Sciences, Nanjing 210008, China
*
Author to whom correspondence should be addressed.
Sustainability 2018, 10(1), 57; https://doi.org/10.3390/su10010057
Submission received: 19 November 2017
/
Revised: 21 December 2017
/
Accepted: 25 December 2017
/
Published: 28 December 2017
(This article belongs to the Special Issue Urban Climate Modeling and Assessment in Support of Sustainable Development)
Abstract
:Residential thermal environment affects the life of residents in terms of their physical and mental health. Many studies have shown that building design elements affect the urban thermal environment. In this study, Nanjing City was used as the study area. A three-dimensional microclimate model was used to simulate and analyze the effects of four main factors, namely, building height, density, layout and green ratio, on thermal environment in residential areas. Results showed that 25% building density obtained a low average air temperature (ATa) and average predicted mean vote (APMV) during 24 h. Thus, a higher building height indicates a lower ATa and APMV and better outdoor comfort level. In addition, peripheral layout had the lowest ATa and APMV, followed by the determinant and point group layouts. The green ratio increased from 0% to 50% with a 10% step and the ATa and APMV decreased gradually. However, when the green ratio increased from 30% to 40%, ATa and APMV decreased most. The effects of building height, density and green ratio on the thermal environment in residential areas were interactive. The effects of building density, green ratio and layout on hourly air temperature and hourly predicted mean vote in daytime varied from these indicators during night time. How the four building design elements interact with thermal environment were probed from two aspects of air temperature and thermal comfort based on the validated ENVI-met, which is the element of novelty in this study. However, thermal comfort has rarely been considered in the past studies about urban outdoor thermal environment.
1. Introduction
In recent years, global urbanization has promoted rapid economic development. According to the recent demographic statistics from the UN, global urbanization rate has reached 54% and this percentage will reach 66% by 2050 [1]. The thermal environment problem has attracted significant attention with the progress of urbanization [2,3] and it has received extensive attention from scholars for both indoor and outdoor thermal environment [4,5,6]. Thermal environment problem affects human health, economic development, leisure activities and well-being of urban dwellers [7,8,9], especially the health of vulnerable people [10,11] and it causes air pollution [12]. In addition, urban thermal environment has a dominant influence on precipitation [13] and global warming [14]. In many tropical countries where rapid urbanization is experienced, the intensity and its negative impacts are likely to be substantial [15,16].
The forming mechanism and simulation of urban thermal environment are the key and difficult points in this study. From small scale, the formation of urban thermal environment is closely related to urban planning and design elements. Therefore, researchers have mainly investigated the influence of architectural design elements (i.e., building height, density, layout and green ratio) on urban thermal environment in residential areas in recent years and the effects have been simulated by computational fluid dynamics technology.
Considerable researches have investigated the influence of green on thermal environment in residential areas in terms of number [17,18], type [19,20], shape, location and layout [21,22] of green space [23,24,25]. In addition, several studies have shown that the main reason for thermal environment deterioration is the expansion and transformation of a city, in which the influence of buildings cannot be ignored; factors include building height, density [26], layout [27,28], materials [29,30], aspect ratio [31] and sky view factor (SVF) [32,33,34]. A significant linear negative correlation was found between urban thermal environment and SVF. However, urban thermal environment was positively correlated with height/width (H/W) [35,36]. Unger calculated the correlation coefficient between urban heat island intensity and SVF as −0.43. Algeciras claimed that the aspect ratio between 1 and 1.5 provided a relatively lower air temperature (Ta). Fazia found that building direction affected the thermal comfort of a residential area and that the surface temperature of buildings in south and west directions was higher than that of the east and north [37]. The buildings located in dominant wind direction should be constructed with an open layout to have more superior thermal environment with staggered pattern than parallel pattern. A larger building spacing generally indicates a better outdoor thermal environment in residential areas.
At present, high-rise buildings have become the major option for urban construction to cope with rapid urbanization. Studies have shown that unplanned high-rise buildings have caused discomfort in cities [38]. Colombo found that outdoor conditions were poor in existing wide streets with low-rise buildings and no shade trees. Narrow streets with tall buildings and shade trees were regarded as the most comfortable conditions [39]. However, current studies about the influence of building density on thermal environment in residential areas are limited. General studies have considered that high building density caused high temperature [40]. However, Ewing insisted that the increase in building density contributed to thermal environment improvement because high building density had small areas and exterior walls in each household; this condition improved energy storage efficiency and reduced energy consumption and carbon emissions [41]. Therefore, no unified conclusion has been reported about the relationships among building height, density, layout and thermal environment. Considerable researches should be conducted to analyze the interaction mechanism between those factors and thermal environment.
The main evaluation indices of urban thermal environment are Ta, land surface temperature and thermal comfort. Among them, Ta and land surface temperature are utilized more in analyzing spatial distribution difference of temperature. However, the index of thermal comfort can further evaluate the effects of different thermal environments and climates on human health, comfort and performance [5]. From the developmental stage and scientific basis, the indices of thermal comfort assessment are divided into empirical and mechanism indices. Empirical indices include heat index, wet bulb globe temperature (WBGT) and apparent temperature [42]. However, these empirical indices do not have sufficient scientific basis for lack of consideration to heat transfer of the human body. Moreover, the assessment results of different indices lack comparability [43]. Mechanism indices include standard effective temperature (SET), predicted mean vote (PMV) [44], outdoor SET (OUT_SET) [45], physiological equivalent temperature (PET) [46], universal thermal climate index (UTCI) [47]. However, PMV and SET are initially used in indoor assessment; hence, errors will occur when they are directly used in outdoor thermal comfort assessment [48,49], given that outdoor thermal environment is more complicated than indoor thermal environment. Pickup et al. [45] improved SET and proposed the index of OUT_SET for outdoor thermal comfort assessment. PMV has been extended for application in outdoor conditions by adding solar radiation and the present modified PMV can be used to calculate outdoor thermal comfort [50]. The above outdoor mechanical comfort indices are commonly used; however, they have not become the international universal indices of thermal comfort assessment because the scientific bases of PMV, PET and OUT_SET are considerably different. The COST Action 730 combined multidisciplinary expertise and established UTCI in 2002 [47]. The indices of PMV, PET and UTCI are considered to be suitable and exact indices to assess outdoor thermal comfort [43], which are used by many software programs. The free version of ENVI-met can output PMV value and has been used by several researchers. The research results show that PMV can accurately characterize outdoor thermal comfort in a local region [6,51].
This study aimed to simulate and analyze the relationship between the four elements (i.e., building density (% of building area), height (canyon effect), layout (building arrangement) and green ratio) and the thermal environment in residential areas by designing various simulated cases. The key factors affecting the thermal environment of residential area were investigated, which could provide theoretical basis for the improvement measures of urban thermal environment from the residential area scale.
2. Methods-Simulated Area and Configurations
2.1. Simulated Tool and Area
The simulation tool, ENVI-met Version 3.1 BETA V, is used to investigate the microclimatic changes with building design factors. The constants of ENVI-met model are calibrated and their simulation accuracy of Ta in Nanjing City was approximately 1.3 °C [22]. A numerical model requires an initialization time and the start time of the model cannot be at noon because the model will not be able to ‘guess’ the correct initial conditions [40]. Thus, the simulation began at 10:00 a.m. on 11 June 2016 and the simulations last for 24 h. The main input parameters of the simulation are shown in Table 1. The simulation location is Nanjing, China. Nanjing City, one of the ‘four furnaces’ in China, has a subtropical humid climate. The thermal environment problem has been increasingly serious with the increase of city population. The simulated area size is 500 m × 500 m (250,000 m2).
2.2. Simulated Configurations
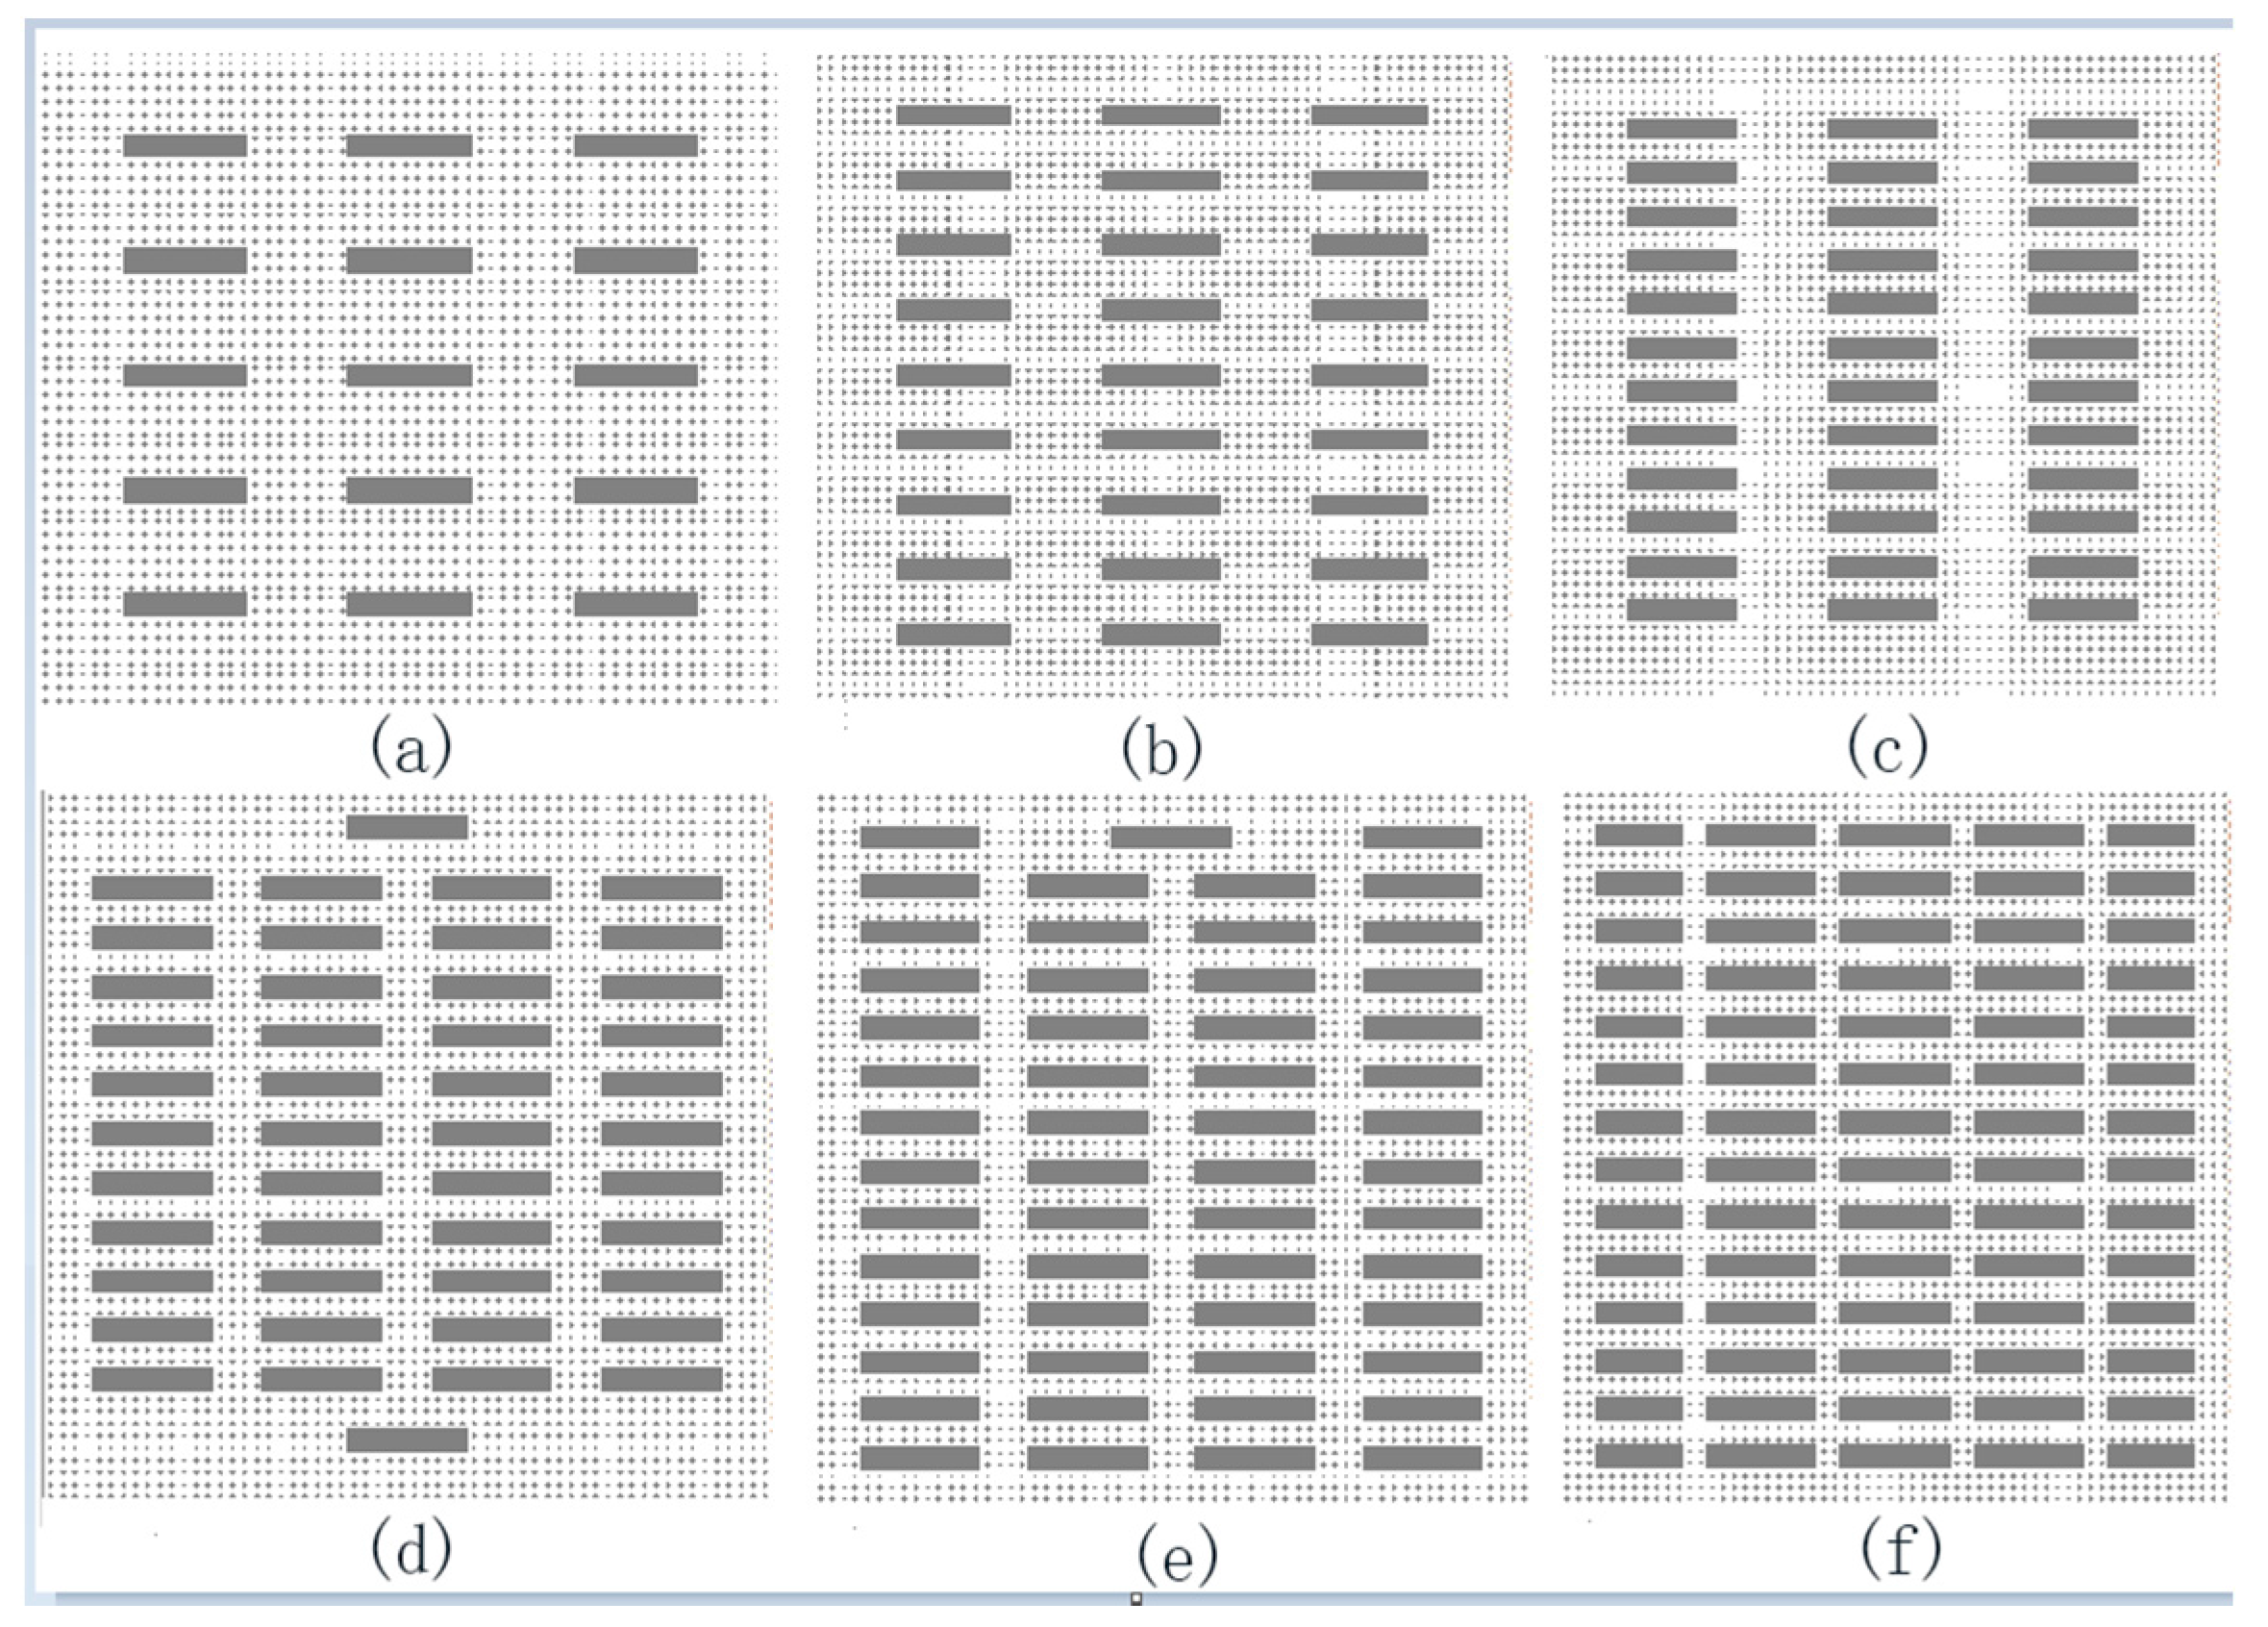
From the urban space utilization perspective, considerable economical values can be created in an effective space by increasing building density and height. To investigate the effect of building density on urban thermal environment in the residential area, six cases of building density are simulated (i.e., 10%, 15%, 20%, 25%, 30% and 35%) with 20 m building height, 0% green ratio and determinant building layout (Figure 1).
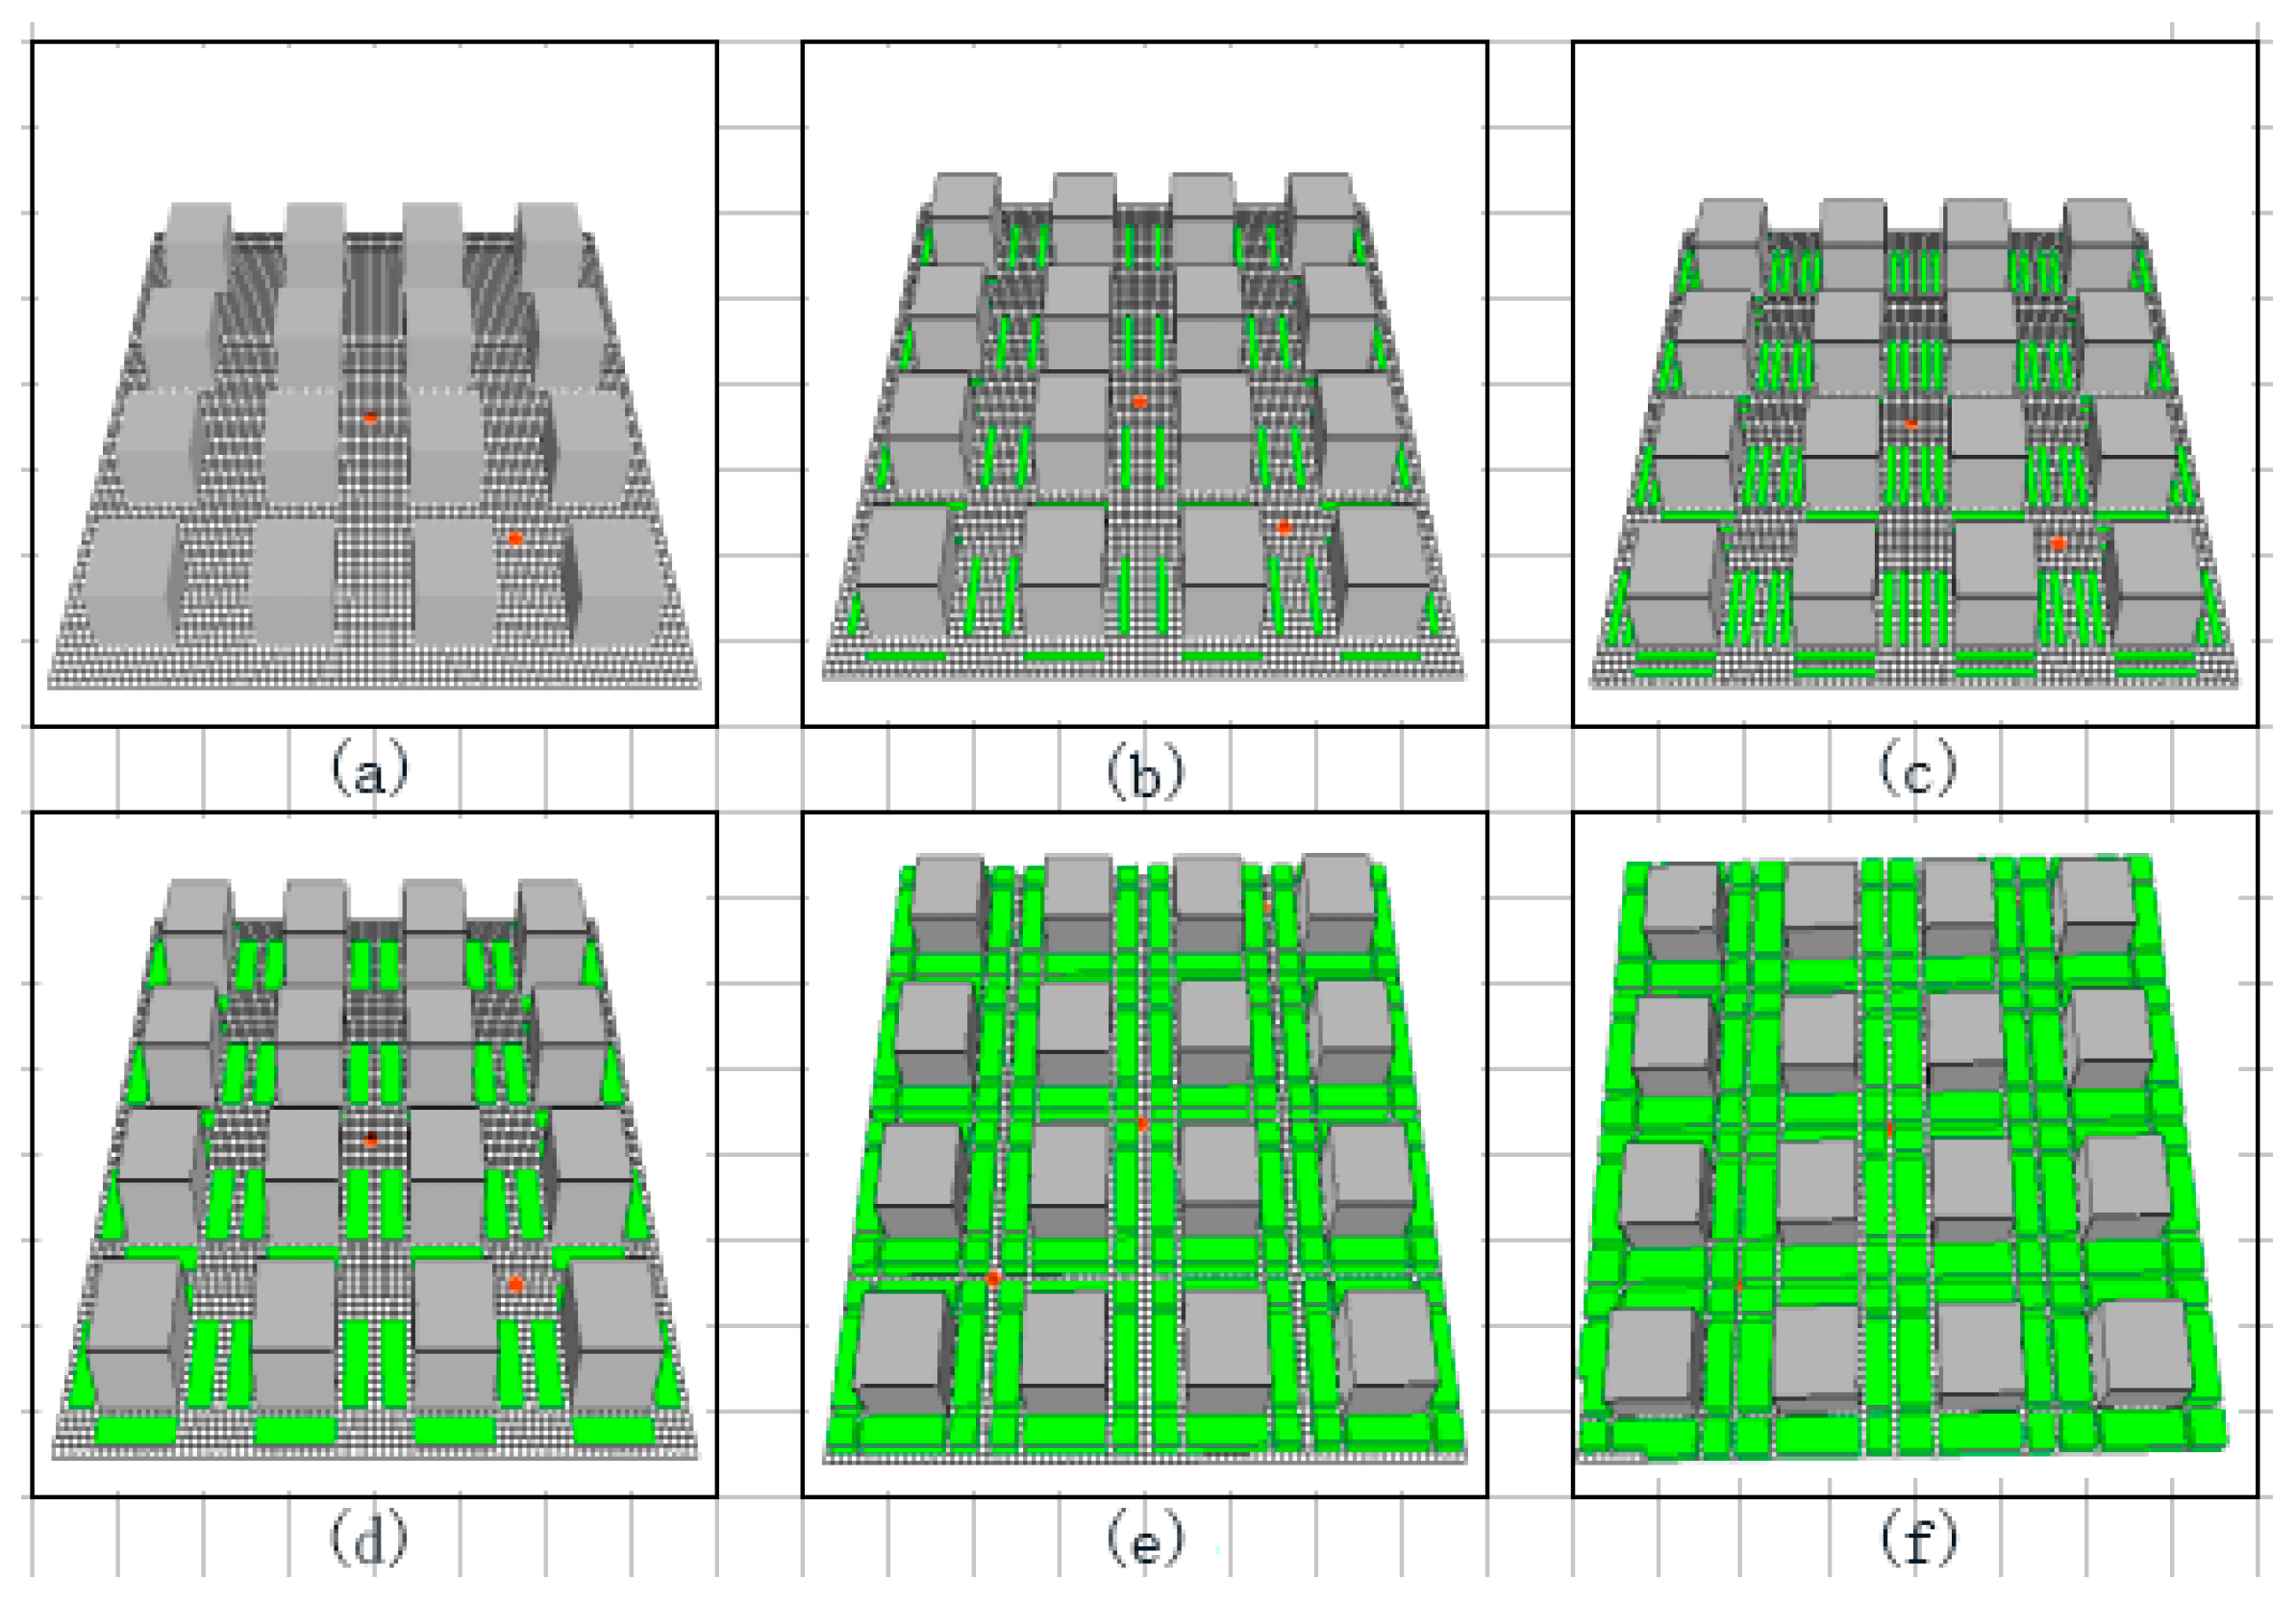
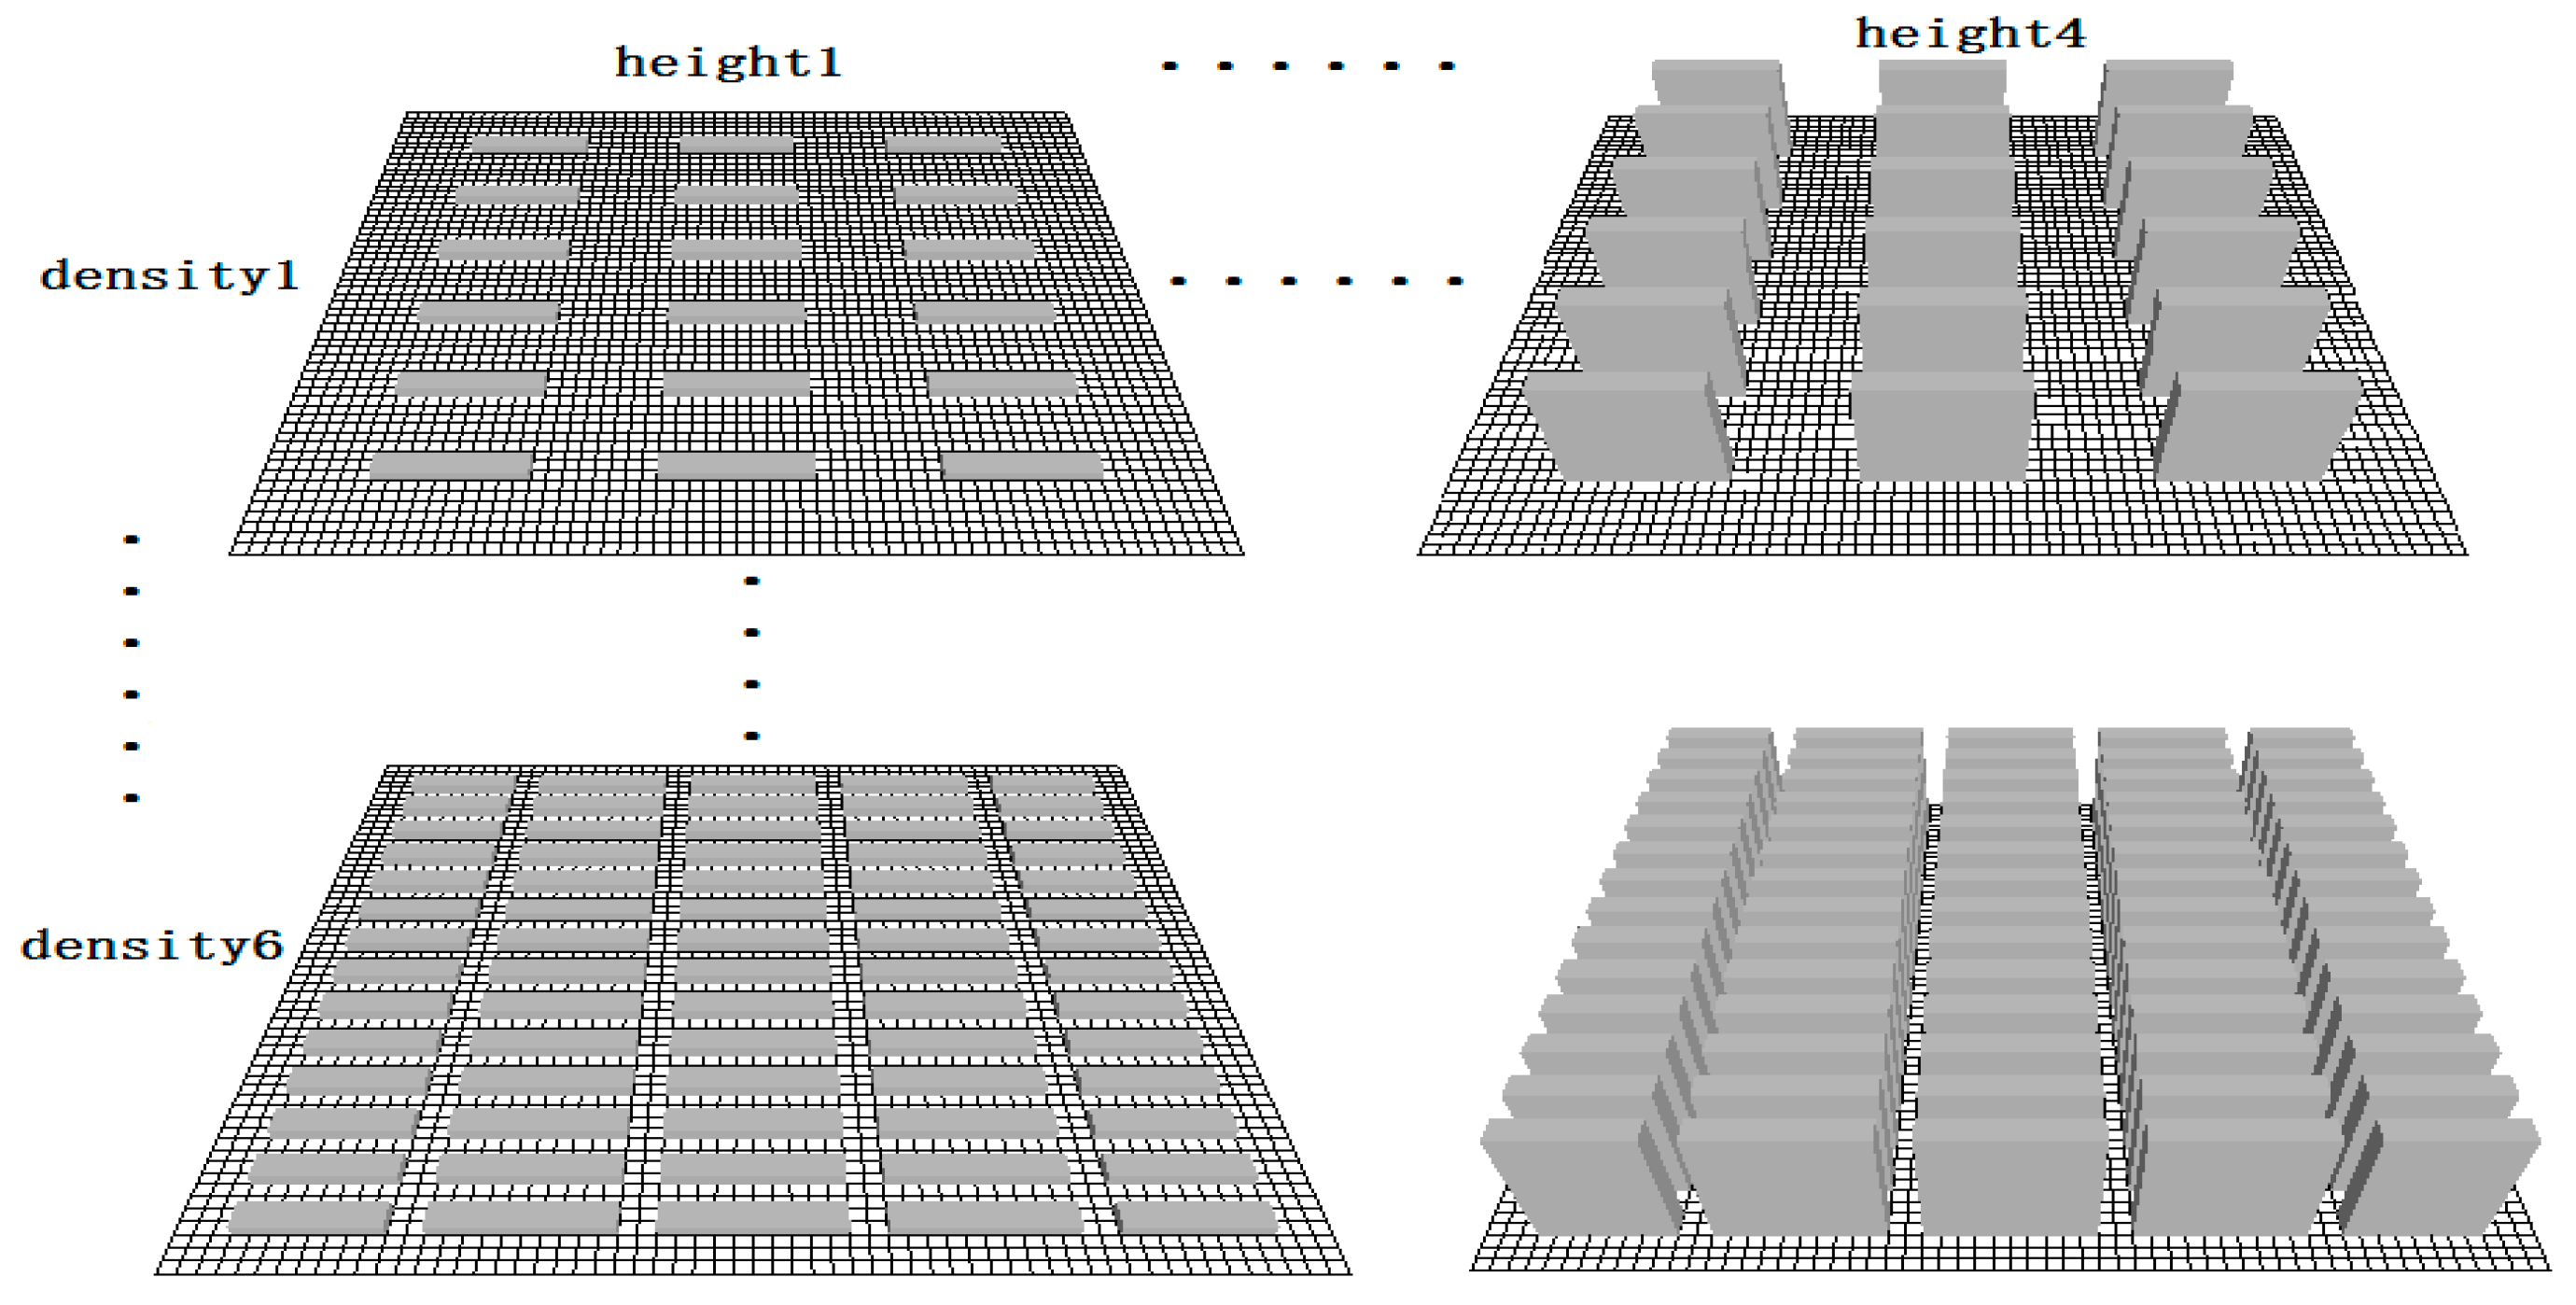
However, high-rise buildings cause considerable shadows and produce strong wind convection. Thus, the same building density with different building heights may have different effects on thermal environment in residential areas. This study analyses the influence of building height on the thermal environment of residential areas at 25% building density, 0% green ratio and the determinant building layout. Four cases of building height are simulated (i.e., 6, 20, 40 and 60 m). Different building layouts affect solar radiation and ventilation. A reasonable layout can utilize the space and make the thermal environment of residential areas considerably comfortable. The common building layouts of residential areas in Nanjing City include determinant, point group and periphery type, which are simulated with 20 m building height, 25% building density and 0% green ratio (Figure 2). Green is widely assumed to have a good cooling effect. A higher green ratio indicates better residential thermal environment conditions. To reduce the influence of green space settings on simulation results, this study adopts average allocation and mixed-type green in which the allocation ratio of tree, shrub and grass is 1:2:4. Then, six cases are simulated to analyze their effects on thermal environment within the same climate conditions (i.e., ratios 1 to 6 are 0%, 10%, 20%, 30%, 40% and 50% with 20 m building height, 25% building density and determinant building layout (Figure 3). A comprehensive simulation scheme with 24 cases is designed to discuss the comprehensive effects of building height, density, layout and green on thermal environment. Each case simulates three building layouts (i.e., determinant, point group and periphery type) and six greening ratios (i.e., 0%, 10%, 20%, 30%, 40% and 50%; Figure 4).
The three indicators were used to evaluate the residential thermal environment for all simulated configurations, which are ATa, Ta, APMV, PMV, comfort hour (CH) and extremely hot hour (EH). PMV value is calculated by ENVI-met software, which is based on Fangers’ model [44] and extended for outdoor conditions. This value relates the energy balance of the human body with the human thermal impression using a straight empirical function. Normally, the PMV scale is defined between −4 (extremely cold) and +4 (extremely hot) where 0 is the thermal neutral (comfort) value. The PMV value is a mathematical function of the local climate; thus, it can reach also values above or below the [−4]–[+4] values in most applications, which are off scale values in the original Fanger experimental data [52]. Positive and negative PMV values indicate hot–warm and cold temperatures, respectively. In this study, CH corresponds to the time length when thermal condition is considerably comfortable and the PMV value is between −1.5 and +1.5. In addition, EH refers to the time length when thermal condition is extremely uncomfortable and the PMV value is larger than 3.5.
3. Results and Discussion
3.1. The Effects of Building Density on Urban Thermal Environment
The ATa, APMV and EH initially decreased and then increased with the increase of building density. At 25% building density, ATa, APMV and EH were the lowest and CH was the highest. At 35% building density, CH was the lowest, ATa, APMV and EH were the highest. Therefore, 25% building density possessed the optimum thermal environment by comprehensively considering ATa, APMV and CH (Table 2). Large building density results in the enlargement of architectural shadow and reduction of direct solar radiation during the day, which leads to a decrease in Ta and PMV. However, extremely large building density affects the overall ventilation of the community and delays the cooling of the heat, which will lead to the increase in Ta and decrease in human comfort.
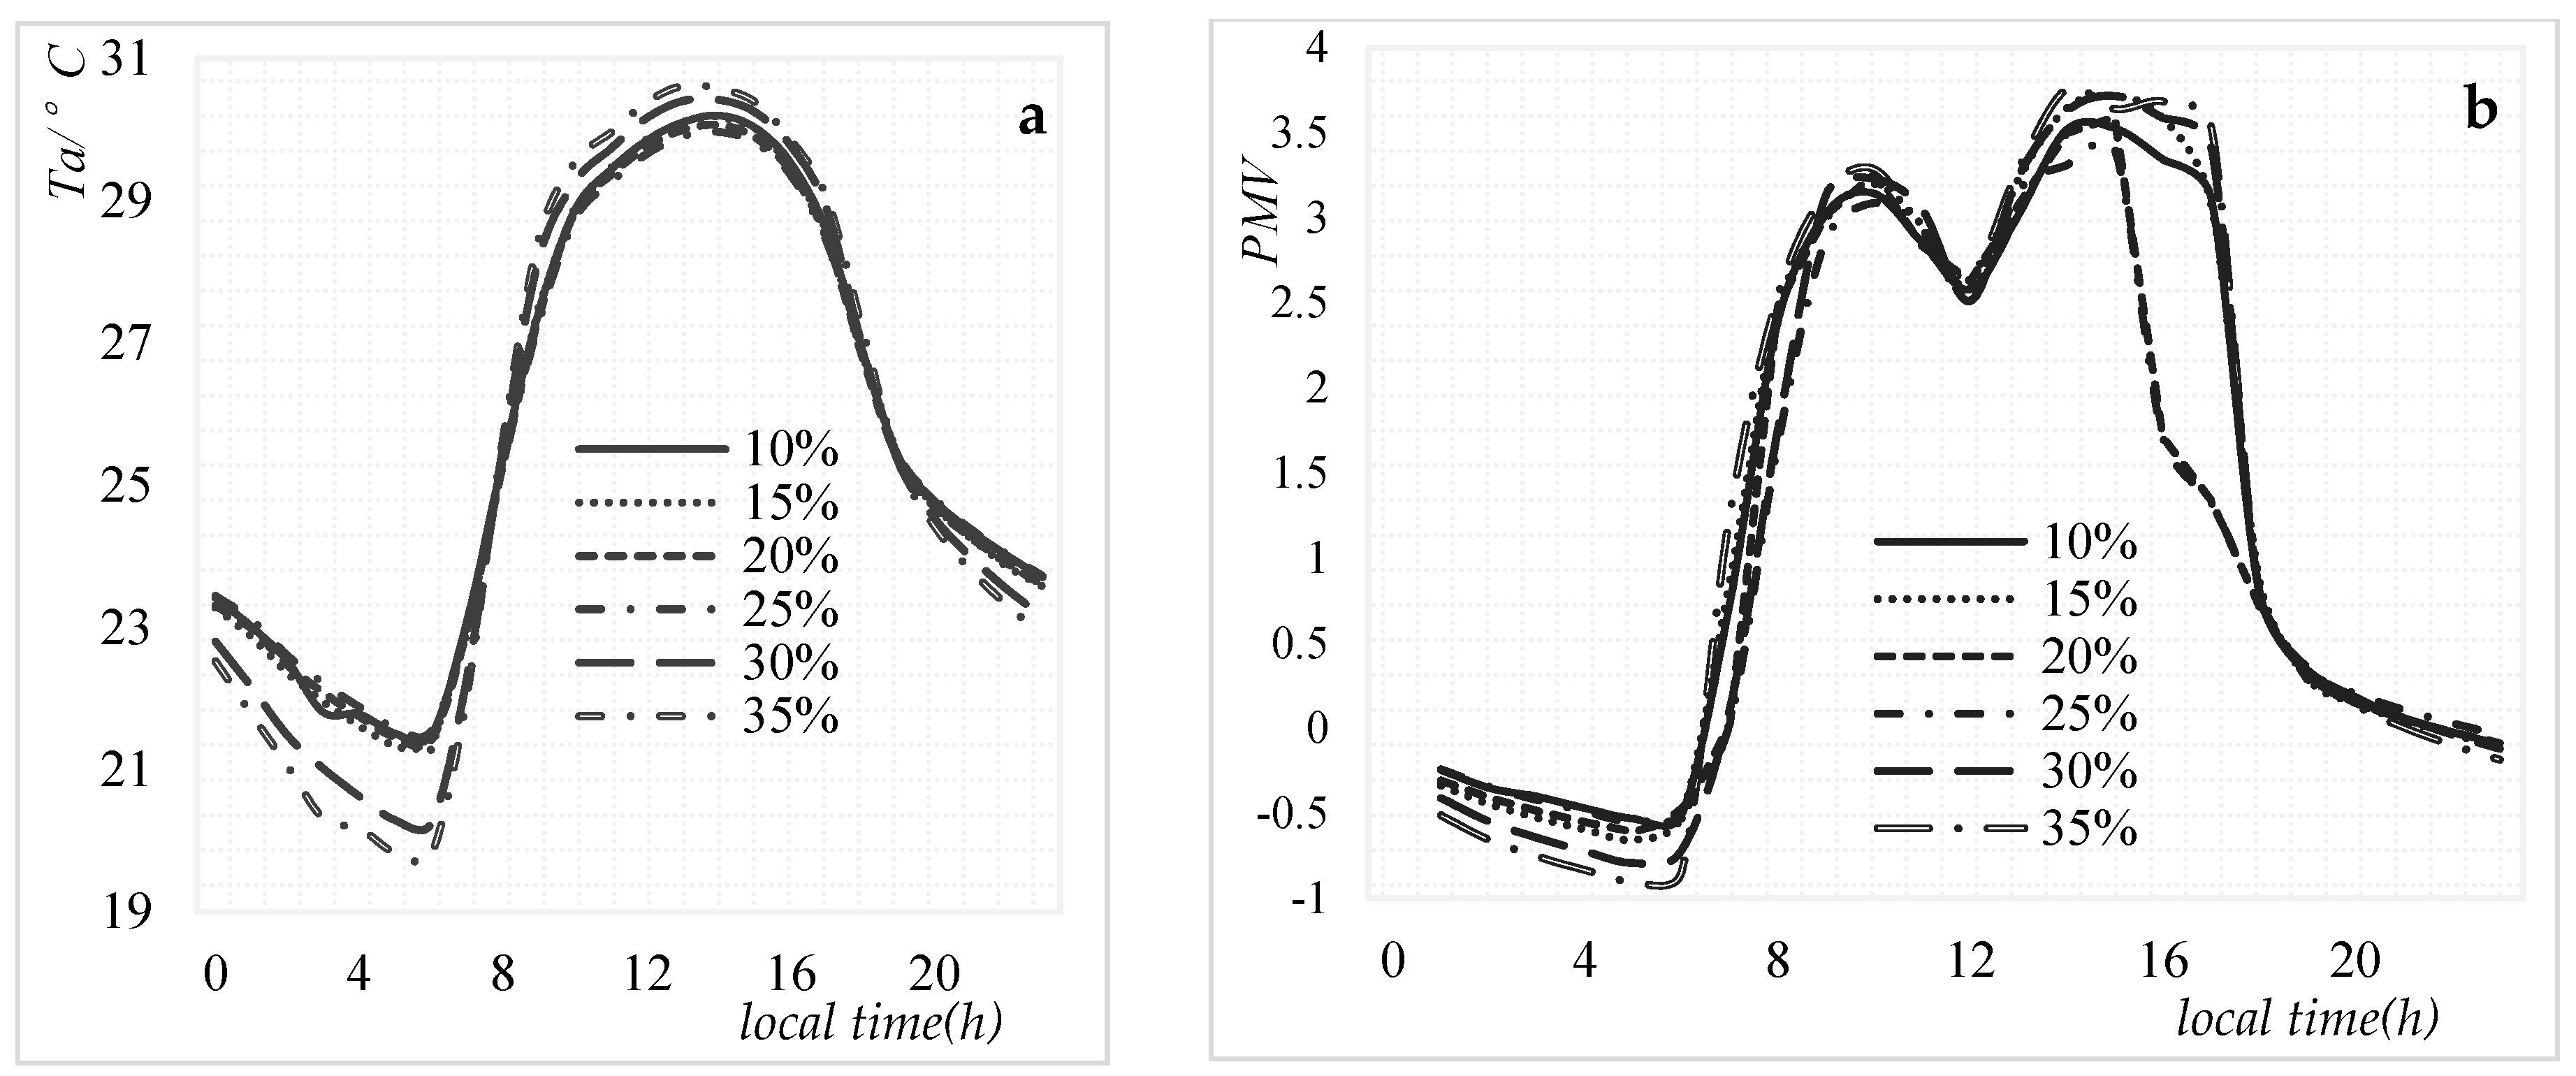
The effects of building density on Ta and PMV in daytime varied from these indicators during night time (Figure 5). During the day, Ta and PMV initially decreased and then increased with the increase of building density, whereas the opposite was true during night time. APMV showed two peaks during the day at approximately 10:00 a.m. and 3:00 p.m. Minimum PMV occurred around noon.
3.2. The Effects of Building Height on Urban Thermal Environment
As the height of the building increased, ATa and APMV decreased gradually, CH gradually increased and EH gradually decreased. ATa decreased by 0.6 °C, APMV declined by 0.61, CH extended by 4 h and EH decreased by 2 h with building height from 20 m to 60 m (Table 3). The variation trend of APMV was consistent with ATa.
Furthermore, the effects of building height on Ta and PMV were consistent during day and night time (Figure 6). Thus, building height was negatively related to Ta and PMV in residential area. This finding is mainly caused by the gradual increase of shadow area in residential areas and the decrease of the direct acceptance of solar radiation energy with the increase of building height. At the same time, high-rise buildings improve the ventilation conditions of residential areas.
3.3. The Effects of Building Layout on Urban Thermal Environment
The peripheral layout had the lowest ATa and APMV. The point group layout had the highest ATa and APMV and the determinant layout was in the middle among the three layouts (Table 4). The point group and determinant layouts had a positive effect on CH and they exhibited an increase on EH. This result is mainly caused by the blocking of air flow in the stimulated area by the two above layouts. Moreover, the air in the high-temperature period cannot be updated in a timely manner, which resulted in the extension on EH.
The ATa and PMV of the three layouts presented the same trend, that is, increasing slowly after 7:00 a.m., reaching maximum at 3:00 p.m. and then declining gradually (Figure 7). In comparison with the determinant and point layouts, the peripheral layout exhibited its own unique characteristics. The Ta and PMV of the peripheral layout were higher than those of the determinant and point group layouts at night but lower in daytime. Furthermore, the ATa and APMV of the determinant layout were lower than those of the point group layout during daytime and night time; because solar radiation was not easily exposed to the buildings in the peripheral layout in daytime and the heat inside the building group was not easily emitted at night. Different building layouts affect solar radiation and ventilation of communities. A reasonable layout should utilize space and make the thermal environment of residential areas considerably comfortable.
3.4. The Effects of Green on Urban Thermal Environment
Generally, ATa and APMV declined, EH decreased and CH increased with the increase of green ratio in residential areas. This condition is caused by the transpiration, shielding and reflection characteristics of vegetation, which reduce the reception of solar radiation capability in the surrounding environment. At the same time, the transpiration of vegetation consumes considerable heat and reduces the temperature in residential areas. However, in this study, PMV per hour from 0:00 a.m. to around 7:00 a.m. was inversely proportional to green ratio due to the increase of green ratio and the decrease of wind speed in the residential area, which led to the increase in PMV(Figure 8).
The EH in the residential area decreased from 9 h to 7 h, CH increased from 11 h to 13 h and ATa decreased by 1 °C and PMV dropped 1.29 with the increase of green ratio from 0% to 50%. Green ratio increased by 10% from 10% to 50%, the average drop of ATa was 0.2 °C, EH was 0.4 h, CH was 0.4 h and PMV was 0.26. However, the green ratio increased from 30% to 40%, ATa decreased by 0.3 °C, EH decreased by 1 h, CH increased by 1 h and PMV decreased by 0.53. Furthermore, when the green ratio increased from 30% to 40%, ATa and APMV decreased most (Table 5).
3.5. The Combined Effects of Building Density, Height, Layout and Green Ratio on Urban Thermal Environment
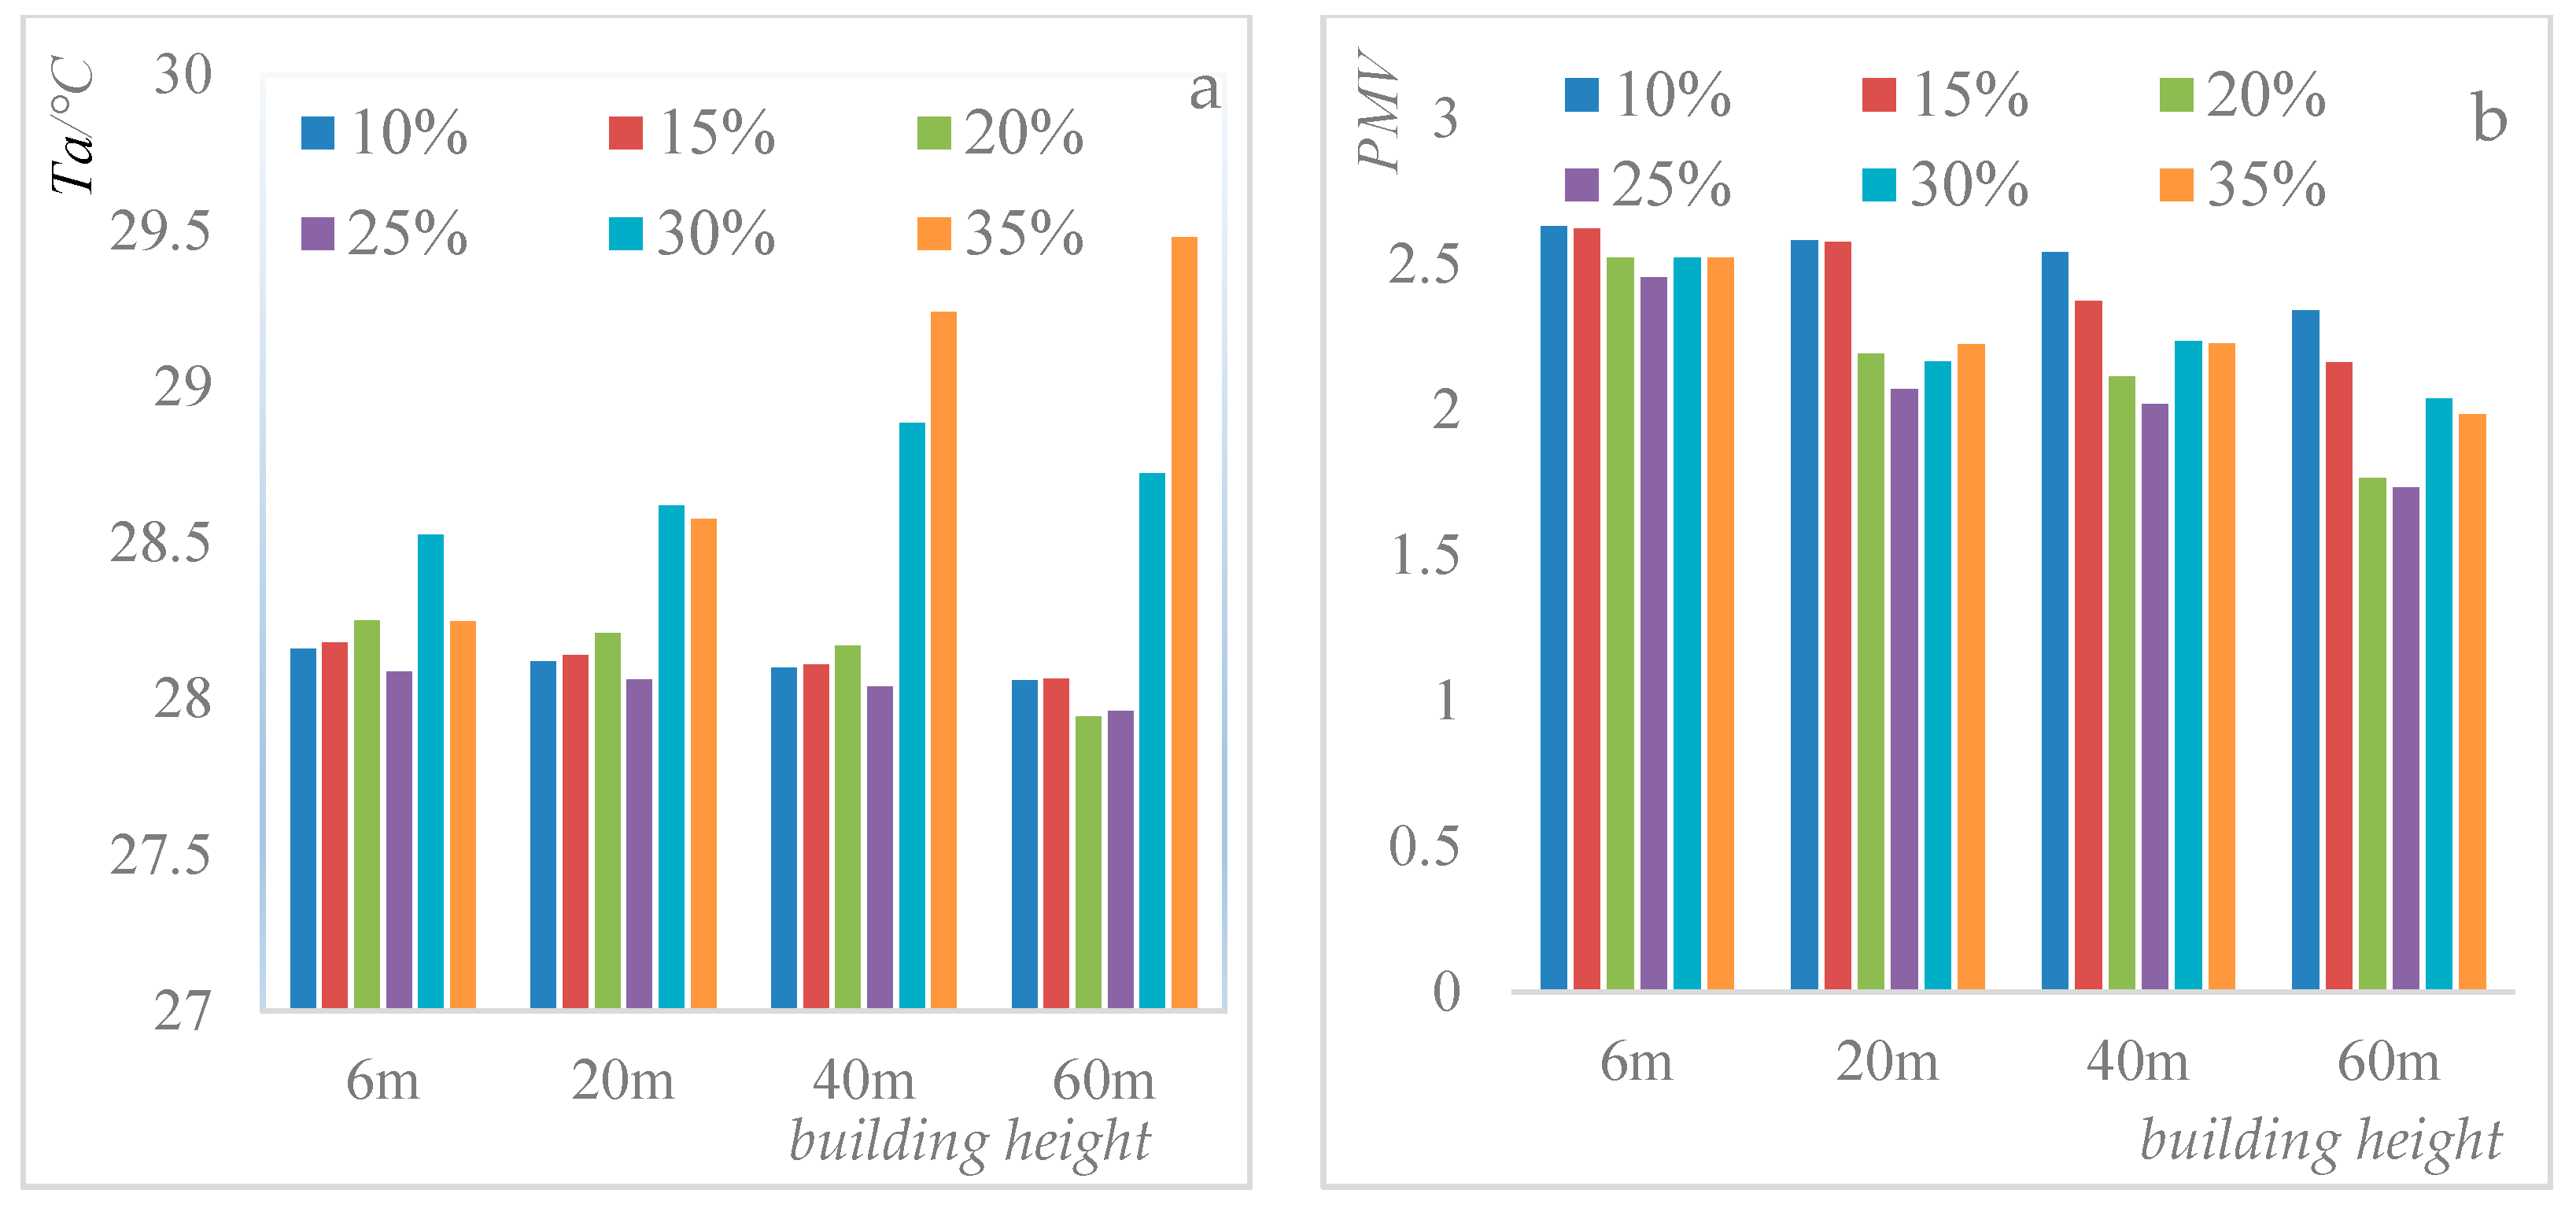
The effects of building height, density, layout and green ratio on thermal environment in residential areas are interactive. The relationships between building density and thermal environment of residential areas were affected by building height. The Ta and PMV were the lowest (day time) for building height lower than 60 m at 25% building density and for 60 m building height at 20% building density (Figure 9).
The relationships between building height and Ta were also affected by building density. If building density was lower than 25%, there was lower ATa in higher buildings. Because the wind speed will increase and there are more shadows with higher buildings and then Ta decreases. By contrast, if building density was greater than 25%, there was higher ATa in higher buildings. Because air circulation is greatly affected and Ta reduces in high buildings with greater density, though more shadows are produced. However, the interactions between building height and density had little significant effects on PMV probably. The higher buildings indicated greater impacts of building density on Ta and PMV. For the 60 m building height, ATa and PMV increased by 1.2 °C and 0.15 from building density of 25–35%, respectively. For 6 m building height, ATa and PMV increased by 0.1 °C and 0.003 from building density of 25–35%, respectively. The relationships among building density, Ta and PMV during night time are opposite to daytime. Therefore, this study mainly discussed the interactions of building density, height and thermal environment during daytime in the residential areas.
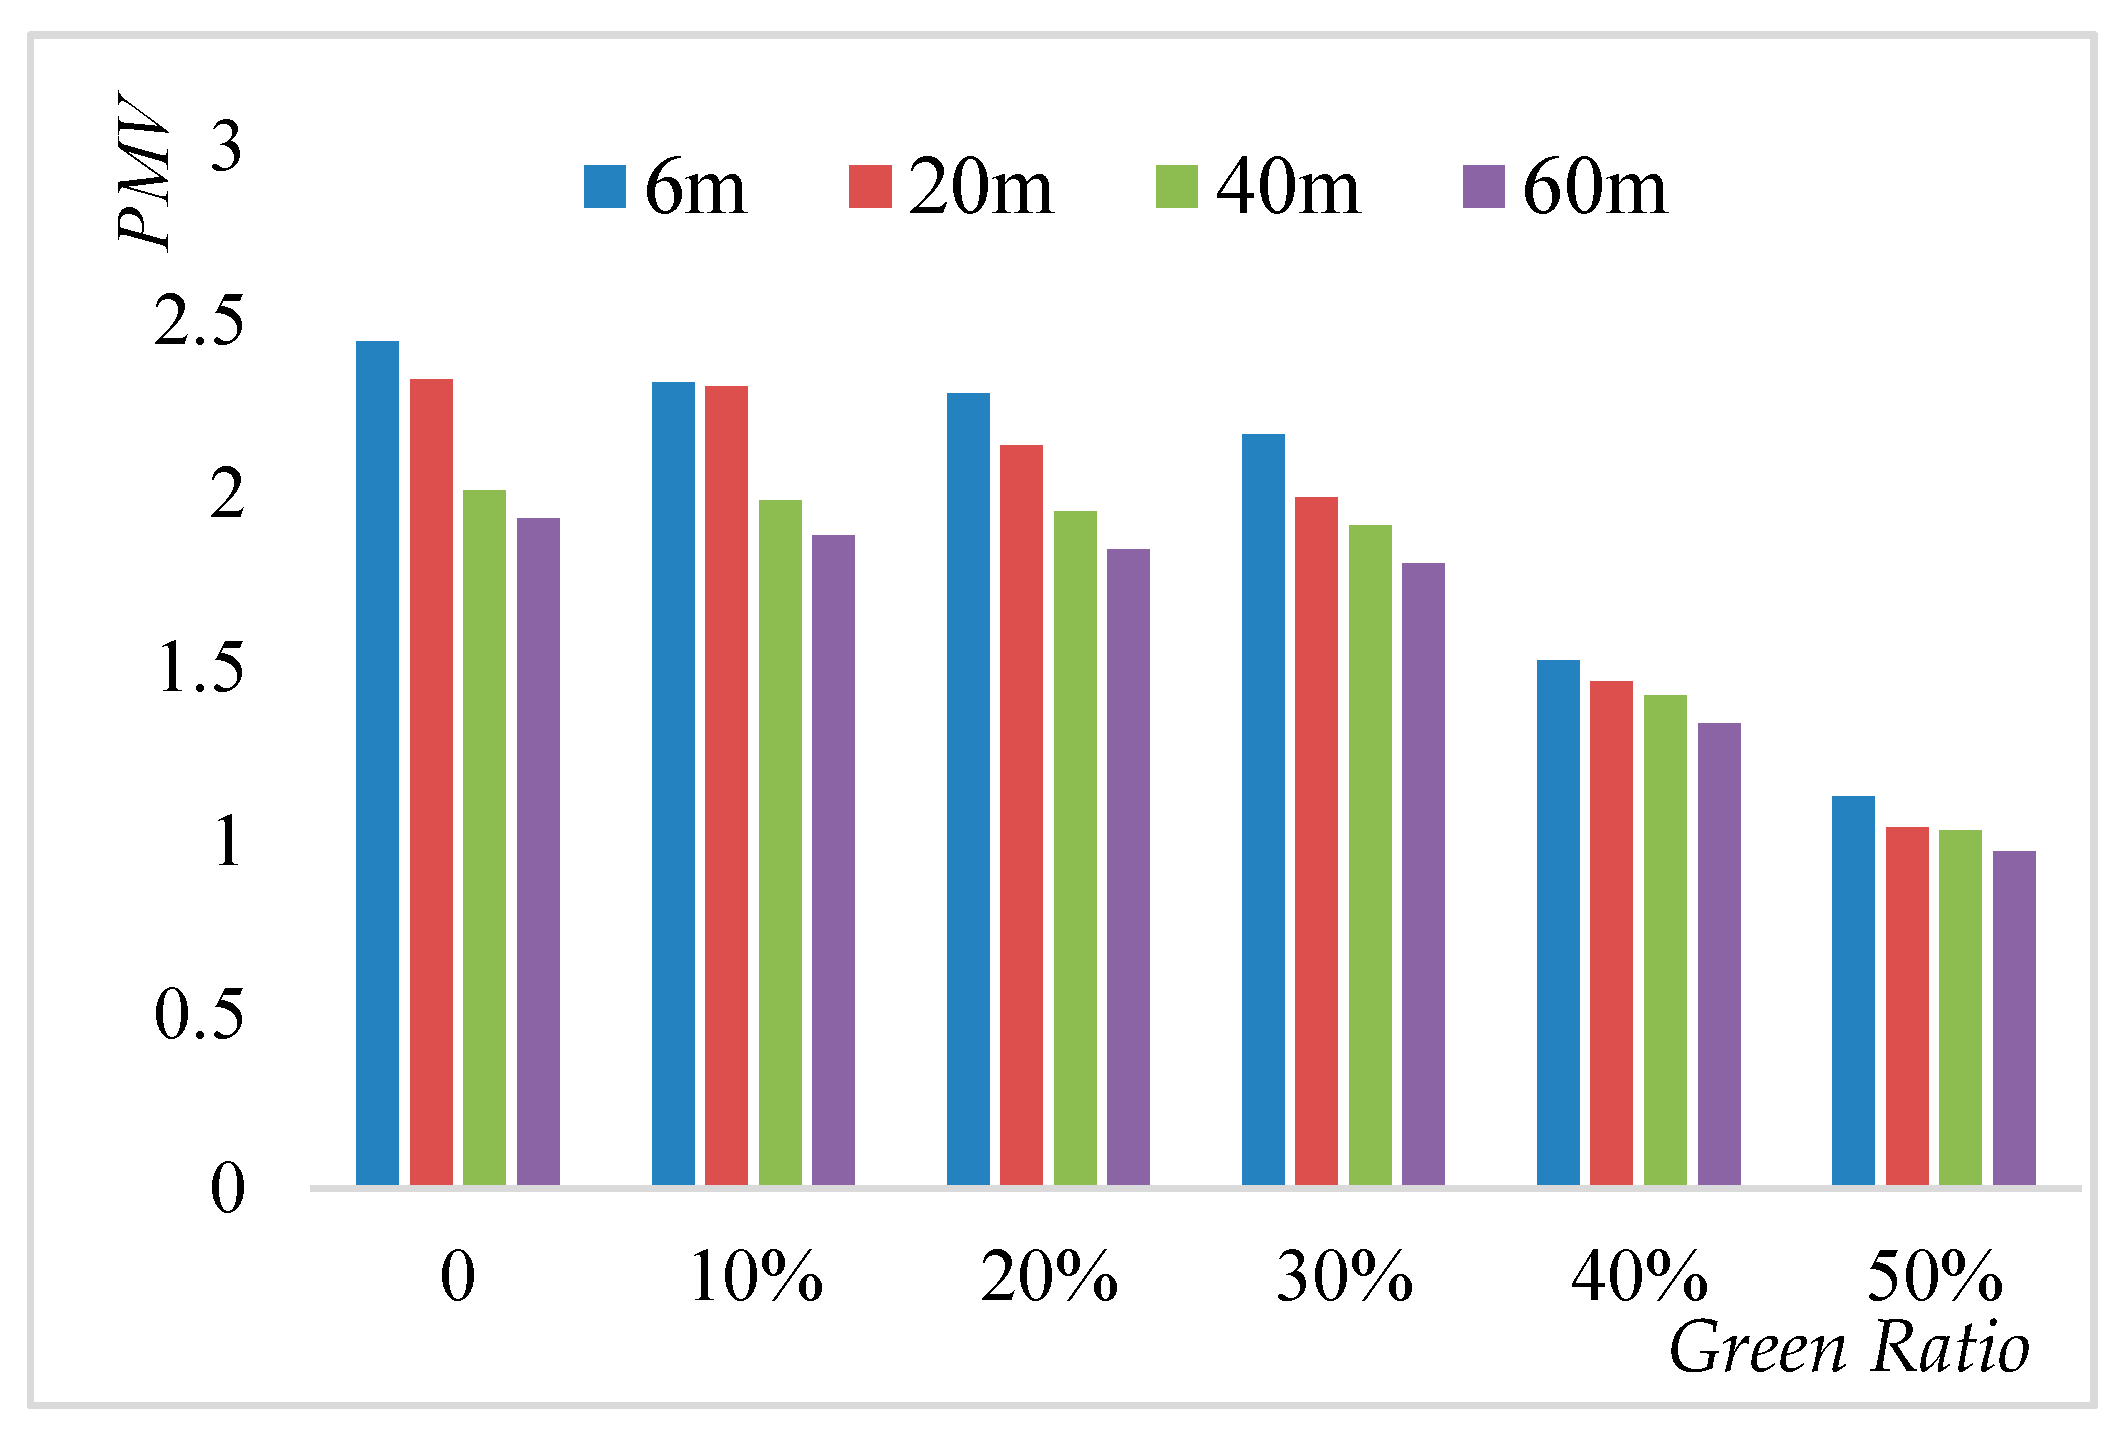
The improved effects of green on thermal environment in residential areas were also affected by building height and density (Figure 10, Figure 11, Figure 12 and Figure 13). If the green ratio increased from 10% to 50% for 10% building density, ATa and PMV decreased by 0.6 °C and 1.19, respectively. ATa and PMV decreased by 0.9 °C and 1.51, respectively, for 35% building density. If the green ratio increased from 10% to 50% for 6 m buildings, ATa and PMV decreased by 1.4 °C and 0.8, respectively. ATa and PMV reduced by 0.9 °C and 0.48 for 60 m building, respectively. Thus, if the same green area was added, there would be poorer improvement effect of green on thermal environment in residential areas with higher building height and less density. Building layout had minimal influence on the relationships among building height, density, green ratio and thermal environment.
3.6. Uncertainties Associated with the ENVI-Met Model Solution
The ENVI-met software package was developed at regions with a high latitude and cold climate in the beginning and it is required to be validated for tropical and subtropical regions. It has been validated in Nanjing city and results showed a good agreement between measurement data and simulated results [22]. All cases in this study were simulated based on the validated ENVI-met model. However, that study [22] only considered the impact of a green pattern which cannot be seen as completely analogue to the cases studied in this work. Because this study is more about the impact of buildings on thermal environment, which maybe introduces a certain level of uncertainty to the results presented in this work. In order to solve this uncertainty, it is important to interpret the simulated results in an appropriate way. As the uncertainty associated to building density, height and layout for a certain case is expected to be higher or lower, we will primarily focus on the general change trends that show up from the multitude of studied cases rather than on individual results. We believe that the simulated results presented in this work do have a valuable role: we are able to make a fair analyze of what influence of building design elements there were on the thermal environment in residential areas at least from a quantitative point of view. However, further studies to support and confirm our findings are necessary.
4. Conclusions
This study simulated the relationships among building density, height, layout, green ratio and city microclimate by ENVI-met to investigate the effects of these factors on the thermal environment of residential areas quantitatively. The conclusions are summarized as follows.
The ATa and APMV in residential areas initially decreased and then increased when the building density ranged from 20% to 50%. The 25% building density obtained the lowest ATa and APMV. As the building height increased from 20 m to 60 m, ATa decreased by 0.6 °C, APMV declined by 0.61. Peripheral layout had the lowest ATa and APMV, followed by determinant and point group layouts. Compared peripheral layout with point group layout, the former is 0.6 and the PMV is 0.12 lower than that of the latter. Green ratio improved the thermal environment of residential areas. The green ratio increased from 0% to 50% with a 10% step, the ATa and APMV decreased gradually. However, when the green ratio increased from 30% to 40%, ATa and APMV decreased most.
The relationships between building density and thermal environment in residential areas were affected by building height. Ta and PMV were the lowest (day time) for 25% building density if building height is lower than 60 m but for 60 m building height, Ta and PMV were the lowest for 20% building density. The effects of green on thermal environment were also affected by building height and density. If the green ratio increased from 10% to 50% when building density was 10%, ATa and PMV decreased by 0.6 °C and 1.19, respectively. ATa and PMV decreased by 0.9 °C and 1.51, respectively, for 35% building density. If the green ratio increased from 10% to 50% when building height was 6 m, ATa and PMV decreased by 1.4 °C and 0.8, respectively. ATa and PMV reduced by 0.9 °C and 0.48 for 60 m building, respectively. Building layouts had minimal influence on the relationships among building density, height, green ratio and thermal environment of residential areas.
The daytime effects of building density, layout and green ratio on the thermal environment in residential areas varied from these factors during night time. In daytime, Ta and PMV initially decreased and then increased with the increase of building density. This condition was opposite during night time. Ta and PMV of the peripheral layout were lower than those of the determinant and point group layouts in daytime but higher at night time. Furthermore, the ATa and APMV of the determinant layout were lower than those of the point group layout during daytime and night time. No difference was found about the effects of building height on Ta and PMV between daytime and night time. These research results could provide theoretical guidelines for the improvement of urban thermal environment in the residential area scale.
The main contributions of this study are as follows. Firstly, the relationships among building density, building height, building layout, green ratio and thermal environment in residential areas have been investigated. Secondly, the thresholds of some effect factors that can better reduce the ATa and APMV values in residential areas, such as 40% green ratio and 20% and 25% building density, have been determined. Finally, the comprehensive effects of building density, building height, building layout and green ratio on the thermal environment of residential areas have been discussed. The above results can provide theoretical guidance for the improvement of residential thermal environment.
In future researches, some issues should be further explored. (1) The relationships among building density, building height, building layout, green ratio and thermal environment of residential areas will be investigated for different climate zones. (2) Better indicators, such as Ta, surface land temperature, mean radiant temperature and thermal comfort, should be identified to characterize the thermal environment of residential areas more accurately. (3) How anthropocentric heat affects the outdoor thermal environment in residential areas should be further investigated. (4) More suitable outdoor thermal comfort indices should also be compared to analyze their adaptability and sensibility.
Acknowledgments
This study is supported by the National Nature Science Foundation of China (41271538), y the Fundamental Research Funds for the Central Universities of China (2016B05614), by the Fundamental Research Funds for the Central Universities of China (2016B05614 and 2017B781X14), by the Fundamental Research Funds for the Central Universities (2017B781X14) and by Postgraduate Research & Practice Innovation Program of Jiangsu Province (SJCX17_0155).
Author Contributions
Yingbao Yang proposed the main idea, offered invaluable suggestions for data analysis and revised the manuscript thoroughly; Xize Zhang performed the experiments and made careful data analysis; Weizhong Su designed the experiments and wrote this paper. Jia Hu, Xi Lu and Xin Pan also conceived the experiments and contributed analysis tools; Qin Zhu proposed some suggestions for the revised manuscript.
Conflicts of Interest
The authors declare no conflict of interest.
Abbreviations
| Ta | air temperature |
| ATa | average air temperature |
| PMV | predicted mean vote |
| APMV | average predicted mean vote |
| UHI | Urban heat island |
| SVF | sky view factor |
| H/W | building aspect ratio |
| CH | comfort hours |
| EH | extreme hot hours |
| WBGT | wet bulb globe temperature |
| SET | standard effective temperature |
| OUT_SET | outdoor standard effective temperature |
| PET | physiological equivalent temperature |
| UTCI | universal thermal climate index |
| PPD | predicted percentage of dissatisfied |
| H/W | height/width |
References
- United Nations. World Urbanization Prospects: The 2014 Revision; Population Division, Department of Economic and Social Affairs: New York, NY, USA, 2015. [Google Scholar]
- Kaloustian, N.; Diab, Y. Effects of urbanization on the urban heat island in Beirut. Urban Clim. 2015, 14, 154–165. [Google Scholar] [CrossRef]
- Kikon, N.; Singh, P.; Singh, S.K.; Vyas, A. Assessment of urban heat islands (UHI) of Noida City, India using multi-temporal satellite data. Sustain. Cities Soc. 2016, 22, 19–28. [Google Scholar] [CrossRef]
- d’Alfano, F.R.; Olesen, B.W.; Palella, B.I. Povl Ole Fanger’s Impact Ten Years Later. Energy Build. 2017, 152, 243–249. [Google Scholar]
- Parsons, K. Human Thermal Environments: The Effects of Hot, Moderate and Cold Environments on Human Health, Comfort and Performance; CRC Press, Inc.: Boca Raton, FL, USA, 2014; pp. 67–68. [Google Scholar]
- Gilani, S.I.U.H.; Khan, M.H.; Pao, W. Thermal Comfort Analysis of PMV Model Prediction in Air Conditioned and Naturally Ventilated Buildings. Energy Procedia 2015, 75, 1373–1379. [Google Scholar] [CrossRef]
- Hirano, Y.; Fujita, T. Evaluation of the impact of the urban heat island on residential and commercial energy consumption in Tokyo. Energy 2012, 37, 371–383. [Google Scholar] [CrossRef]
- Taha, H. Meteorological, air-quality and emission-equivalence impacts of urban heat island control in California. Sustain. Cities Soc. 2015, 19, 207–221. [Google Scholar] [CrossRef]
- Shahmohamadi, P.; Che-Ani, A.I.; Etessam, I.; Maulud, K.N.A.; Tawil, N.M. Healthy Environment: The Need to Mitigate Urban Heat Island Effects on Human Health. Procedia Eng. 2011, 20, 61–70. [Google Scholar] [CrossRef]
- Patz, J.A.; Campbell-Lendrum, D.; Holloway, T.; Foley, J.A. Impact of regional climate change on human health. Nature 2005, 438, 310–317. [Google Scholar] [CrossRef] [PubMed]
- Tan, J.; Zheng, Y.; Tang, X.; Guo, C.; Li, L.; Song, G.; Zhen, X.; Yuan, D.; Kalkstein, A.J.; Li, F. The urban heat island and its impact on heat waves and human health in Shanghai. Int. J. Biometeorol. 2010, 54, 75–84. [Google Scholar] [CrossRef] [PubMed]
- Jacob, D.J.; Winner, D.A. Effect of climate change on air quality. Atmos. Environ. 2009, 43, 51–63. [Google Scholar] [CrossRef]
- Ganeshan, M.; Murtugudde, R.; Imhoff, M.L. A multi-city analysis of the UHI-influence on warm season rainfall. Urban Clim. 2013, 6, 1–23. [Google Scholar] [CrossRef]
- Alcoforado, M.J.; Andrade, H. Global warming and the urban heat island. In Urban Ecology; Springer: Berlin/Heidelberg, Germany, 2008; pp. 249–262. [Google Scholar]
- Morris, K.I.; Chan, A.; Morris, K.J.K.; Ooi, M.C.G.; Oozeer, M.Y.; Abakr, Y.A.; Nadzir, M.S.M.; Mohammed, I.Y. Urbanisation and urban climate of a tropical conurbation, Klang Valley, Malaysia. Urban Clim. 2017, 19, 54–71. [Google Scholar] [CrossRef]
- Doan, Q.-V.; Kusaka, H.; Ho, Q.-B. Impact of future urbanization on temperature and thermal comfort index in a developing tropical city: Ho Chi Minh City. Urban Clim. 2016, 17, 20–31. [Google Scholar] [CrossRef]
- Kikegawa, Y.; Genchi, Y.; Kondo, H.; Hanaki, K. Impacts of city-block-scale countermeasures against urban heat-island phenomena upon a building’s energy-consumption for air-conditioning. Appl. Energy 2006, 83, 649–668. [Google Scholar] [CrossRef]
- Li, X.; Zhou, W.; Ouyang, Z.; Xu, W.; Zheng, H. Spatial pattern of greenspace affects land surface temperature: Evidence from the heavily urbanized Beijing metropolitan area, China. Landsc. Ecol. 2012, 27, 887–898. [Google Scholar] [CrossRef]
- Armson, D.; Stringer, P.; Ennos, A.R. The effect of tree shade and grass on surface and globe temperatures in an urban area. Urban For. Urban Green. 2012, 11, 245–255. [Google Scholar] [CrossRef]
- Lehmann, I.; Mathey, J.; Rößler, S.; Bräuer, A.; Goldberg, V. Urban vegetation structure types as a methodological approach for identifying ecosystem services—Application to the analysis of micro-climatic effects. Ecol. Indic. 2014, 42, 58–72. [Google Scholar] [CrossRef]
- Liu, Y.; Guo, J.; Wei, Q. Urban green space landscape patterns and thermal environment investigations based on computational fluid dynamics. Acta Ecol. Sin. 2012, 32, 1951–1959. [Google Scholar]
- Su, W.; Zhang, Y.; Yang, Y.; Ye, G. Examining the Impact of Greenspace Patterns on Land Surface Temperature by Coupling LiDAR Data with a CFD Model. Sustainability 2014, 6, 6799–6814. [Google Scholar] [CrossRef]
- Oliveira, S.; Andrade, H.; Vaz, T. The cooling effect of green spaces as a contribution to the mitigation of urban heat: A case study in Lisbon. Build. Environ. 2011, 46, 2186–2194. [Google Scholar] [CrossRef]
- Pompeii, W.C., II; Hawkins, T.W. Assessing the impact of green roofs on urban heat island mitigation: A hardware scale modeling approach. Geogr. Bull. 2011, 52, 52–61. [Google Scholar]
- Skelhorn, C.; Lindley, S.; Levermore, G. The impact of vegetation types on air and surface temperatures in a temperate city: A fine scale assessment in Manchester, UK. Landsc. Urban Plan. 2014, 121, 129–140. [Google Scholar] [CrossRef]
- Rosenfeld, A.H.; Akbari, H.; Bretz, S.; Fishman, B.L.; Kurn, D.M.; Sailor, D.; Taha, H. Mitigation of urban heat islands: Materials, utility programs, updates. Energy Build. 1995, 22, 255–265. [Google Scholar] [CrossRef]
- Yang, F.; Lau, S.S.Y.; Qian, F. Urban design to lower summertime outdoor temperatures: An empirical study on high-rise housing in Shanghai. Build. Environ. 2011, 46, 769–785. [Google Scholar] [CrossRef]
- Md Din, M.F.; Lee, Y.Y.; Ponraj, M.; Ossen, D.R.; Iwao, K.; Chelliapan, S. Thermal comfort of various building layouts with a proposed discomfort index range for tropical climate. J. Therm. Biol. 2014, 41, 6–15. [Google Scholar] [CrossRef] [PubMed]
- Akbari, H.; Menon, S.; Rosenfeld, A. Global cooling: Effect of urban albedo on global temperature. In Proceedings of the 28th AIVC and 2nd Palenc Conference, Building Low Energy Cooling and Ventilation Technologies in the 21st Century, Crete, Greece, 27–29 September 2007. [Google Scholar]
- Liu, W.; Gong, A.; Zhou, J.; Zhan, W. Investigation on relationships between urban building materials and land surface temperature through a multi-resource. Remote Sens. Approach 2011, 4, 46–53. [Google Scholar]
- Memon, R.A.; Leung, D.Y.C.; Liu, C.-H. Effects of building aspect ratio and wind speed on air temperatures in urban-like street canyons. Build. Environ. 2010, 45, 176–188. [Google Scholar] [CrossRef]
- Giridharan, R.; Lau, S.S.Y.; Ganesan, S.; Givoni, B. Lowering the outdoor temperature in high-rise high-density residential developments of coastal Hong Kong: The vegetation influence. Build. Environ. 2008, 43, 1583–1595. [Google Scholar] [CrossRef]
- Gál, T.; Lindberg, F.; Unger, J. Computing continuous sky view factors using 3D urban raster and vector databases: Comparison and application to urban climate. Theor. Appl. Climatol. 2008, 95, 111–123. [Google Scholar] [CrossRef]
- Wang, Y.; Akbari, H. Effect of Sky View Factor on Outdoor Temperature and Comfort in Montreal. Environ. Eng. Sci. 2014, 31, 272–287. [Google Scholar] [CrossRef]
- Oke, T.R. Street design and urban canopy layer climate. Energy Build. 1988, 11, 103–113. [Google Scholar] [CrossRef]
- Unger, J. Connection between urban heat island and sky view factor approximated by a software tool on a 3D urban database. Int. J. Environ. Pollut. 2008, 36, 59–80. [Google Scholar] [CrossRef]
- Ali-Toudert, F.; Mayer, H. Effects of asymmetry, galleries, overhanging façades and vegetation on thermal comfort in urban street canyons. Sol. Energy 2007, 81, 742–754. [Google Scholar] [CrossRef]
- Deosthali, V. Assessment of impact of urbanization on climate: An application of bio-climatic index. Atmos. Environ. 1999, 33, 4125–4133. [Google Scholar] [CrossRef]
- Johansson, E.; Emmanuel, R. The influence of urban design on outdoor thermal comfort in the hot, humid city of Colombo, Sri Lanka. Int. J. Biometeorol. 2006, 51, 119–133. [Google Scholar] [CrossRef] [PubMed]
- Perini, K.; Magliocco, A. Effects of vegetation, urban density, building height and atmospheric conditions on local temperatures and thermal comfort. Urban For. Urban Green. 2014, 13, 495–506. [Google Scholar] [CrossRef]
- Ewing, R.; Rong, F. The impact of urban form on US residential energy use. Hous. Policy Debate 2008, 19, 1–30. [Google Scholar] [CrossRef]
- Steadman, R.G. The Assessment of Sultriness. Part I: A Temperature-Humidity Index Based on Human Physiology and Clothing Science. J. Appl. Meteorol. 1979, 18, 861–873. [Google Scholar] [CrossRef]
- Fiala, D.; Havenith, G.; Bröde, P.; Kampmann, B.; Jendritzky, G. UTCI-Fiala multi-node model of human heat transfer and temperature regulation. Int. J. Biometeorol. 2012, 56, 429–441. [Google Scholar] [CrossRef] [PubMed] [Green Version]
- Fanger, P.O. Thermal Comfort; Danish Technical Press: Copenhagen, Denmark, 1970. [Google Scholar]
- Pickup, J.; de Dear, R. (Eds.) An outdoor thermal comfort index (OUT_SET*): Part I: The model and its assumptions. In Proceedings of the 15th International Congress of Biometeorology and International Conference on Urban Climatology, Sydney, Australia, 8–12 November 1999; Macquarie University: Sydney, Australia, 1999; pp. 279–283. [Google Scholar]
- Höppe, P. The physiological equivalent temperature—A universal index for the biometeorological assessment of the thermal environment. Int. J. Biometeorol. 1999, 43, 71–75. [Google Scholar] [CrossRef] [PubMed]
- Jendritzky, G.; Maarouf, A.; Fiala, D.; Staiger, H. An update on the development of a Universal Thermal Climate Index. In Proceedings of the Conference on Biometeorology/Aerobiology & International Congress of Biometeorology, Kansas City, MO, USA, 28 October–1 November 2002. [Google Scholar]
- Alfano, F.R.D.A.; Palella, B.I.; Riccio, G. On the Transition Thermal Discomfort to Heat Stress as a Function of the PMV Value. Ind. Health 2013, 51, 285–296. [Google Scholar] [CrossRef]
- ISO 15265—Ergonomics of Thermal Environments−Strategy of Evaluation of the Risk for the Prevention of Constraints or Discomfort under Thermal Working Conditions; International Organisation for Standardization: Geneva, Switzerland, 2004.
- VDI 3787—Methods for the Human Biometeorological Evaluation of Climate and Air Quality for Urban and Regional Planning at Regional Level. Part I: Climate, Blatt 2/Part 2. Available online: http://www.oalib.com/references/13169540 (accessed on 21 December 2017).
- Ku, K.L.; Liaw, J.S.; Tsai, M.Y.; Liu, T.S. Automatic Control System for Thermal Comfort Based on Predicted Mean Vote and Energy Saving. IEEE Trans. Autom. Sci. Eng. 2014, 12, 378–383. [Google Scholar] [CrossRef]
- ENVI-MET: A Holistic Microclimate Model. Available online: http://www.envi-met.info/doku.php?id=apps:biomet_pmv#definition_range (accessed on 10 November 2017).
Figure 1.
Building density cases (a) 10%; (b) 15%; (c) 20%; (d) 25%; (e) 30%; (f) 35%.

Figure 2.
Building layout cases (a) determinant group; (b) point group; (c) periphery type.
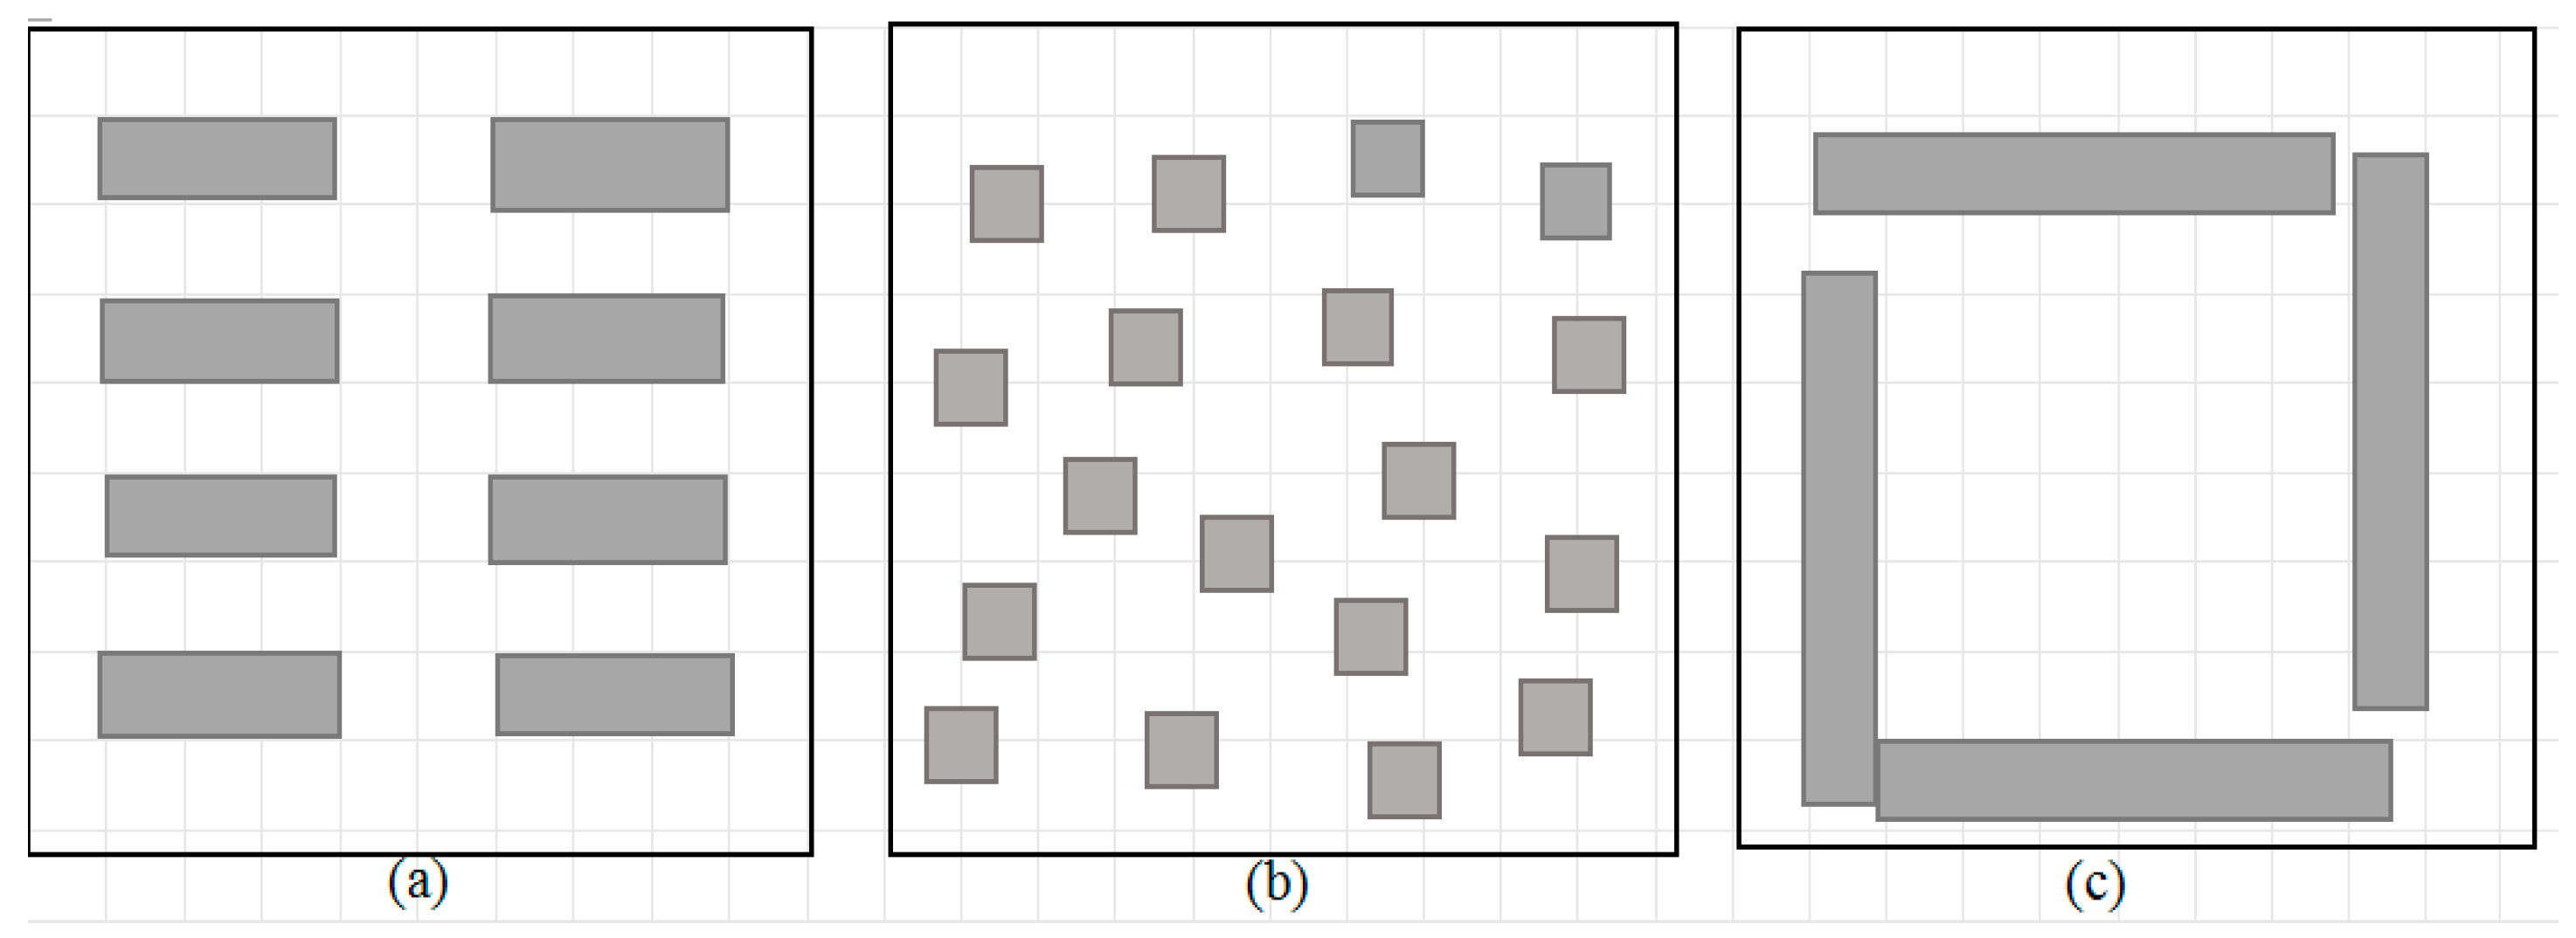
Figure 3.
Green ratio cases (a) 0%; (b) 10%; (c) 20%; (d) 30%; (e) 40%; (f) 50%.

Figure 4.
Combined 24 cases.

Figure 5.
The effects of building density on Ta, PMV during 24 h (a) the effects on Ta, (b) the effects on PMV.
Figure 5.
The effects of building density on Ta, PMV during 24 h (a) the effects on Ta, (b) the effects on PMV.

Figure 6.
The effects of building height on thermal environment during 24 h (a) the effects on Ta, (b) the effects on PMV.
Figure 6.
The effects of building height on thermal environment during 24 h (a) the effects on Ta, (b) the effects on PMV.
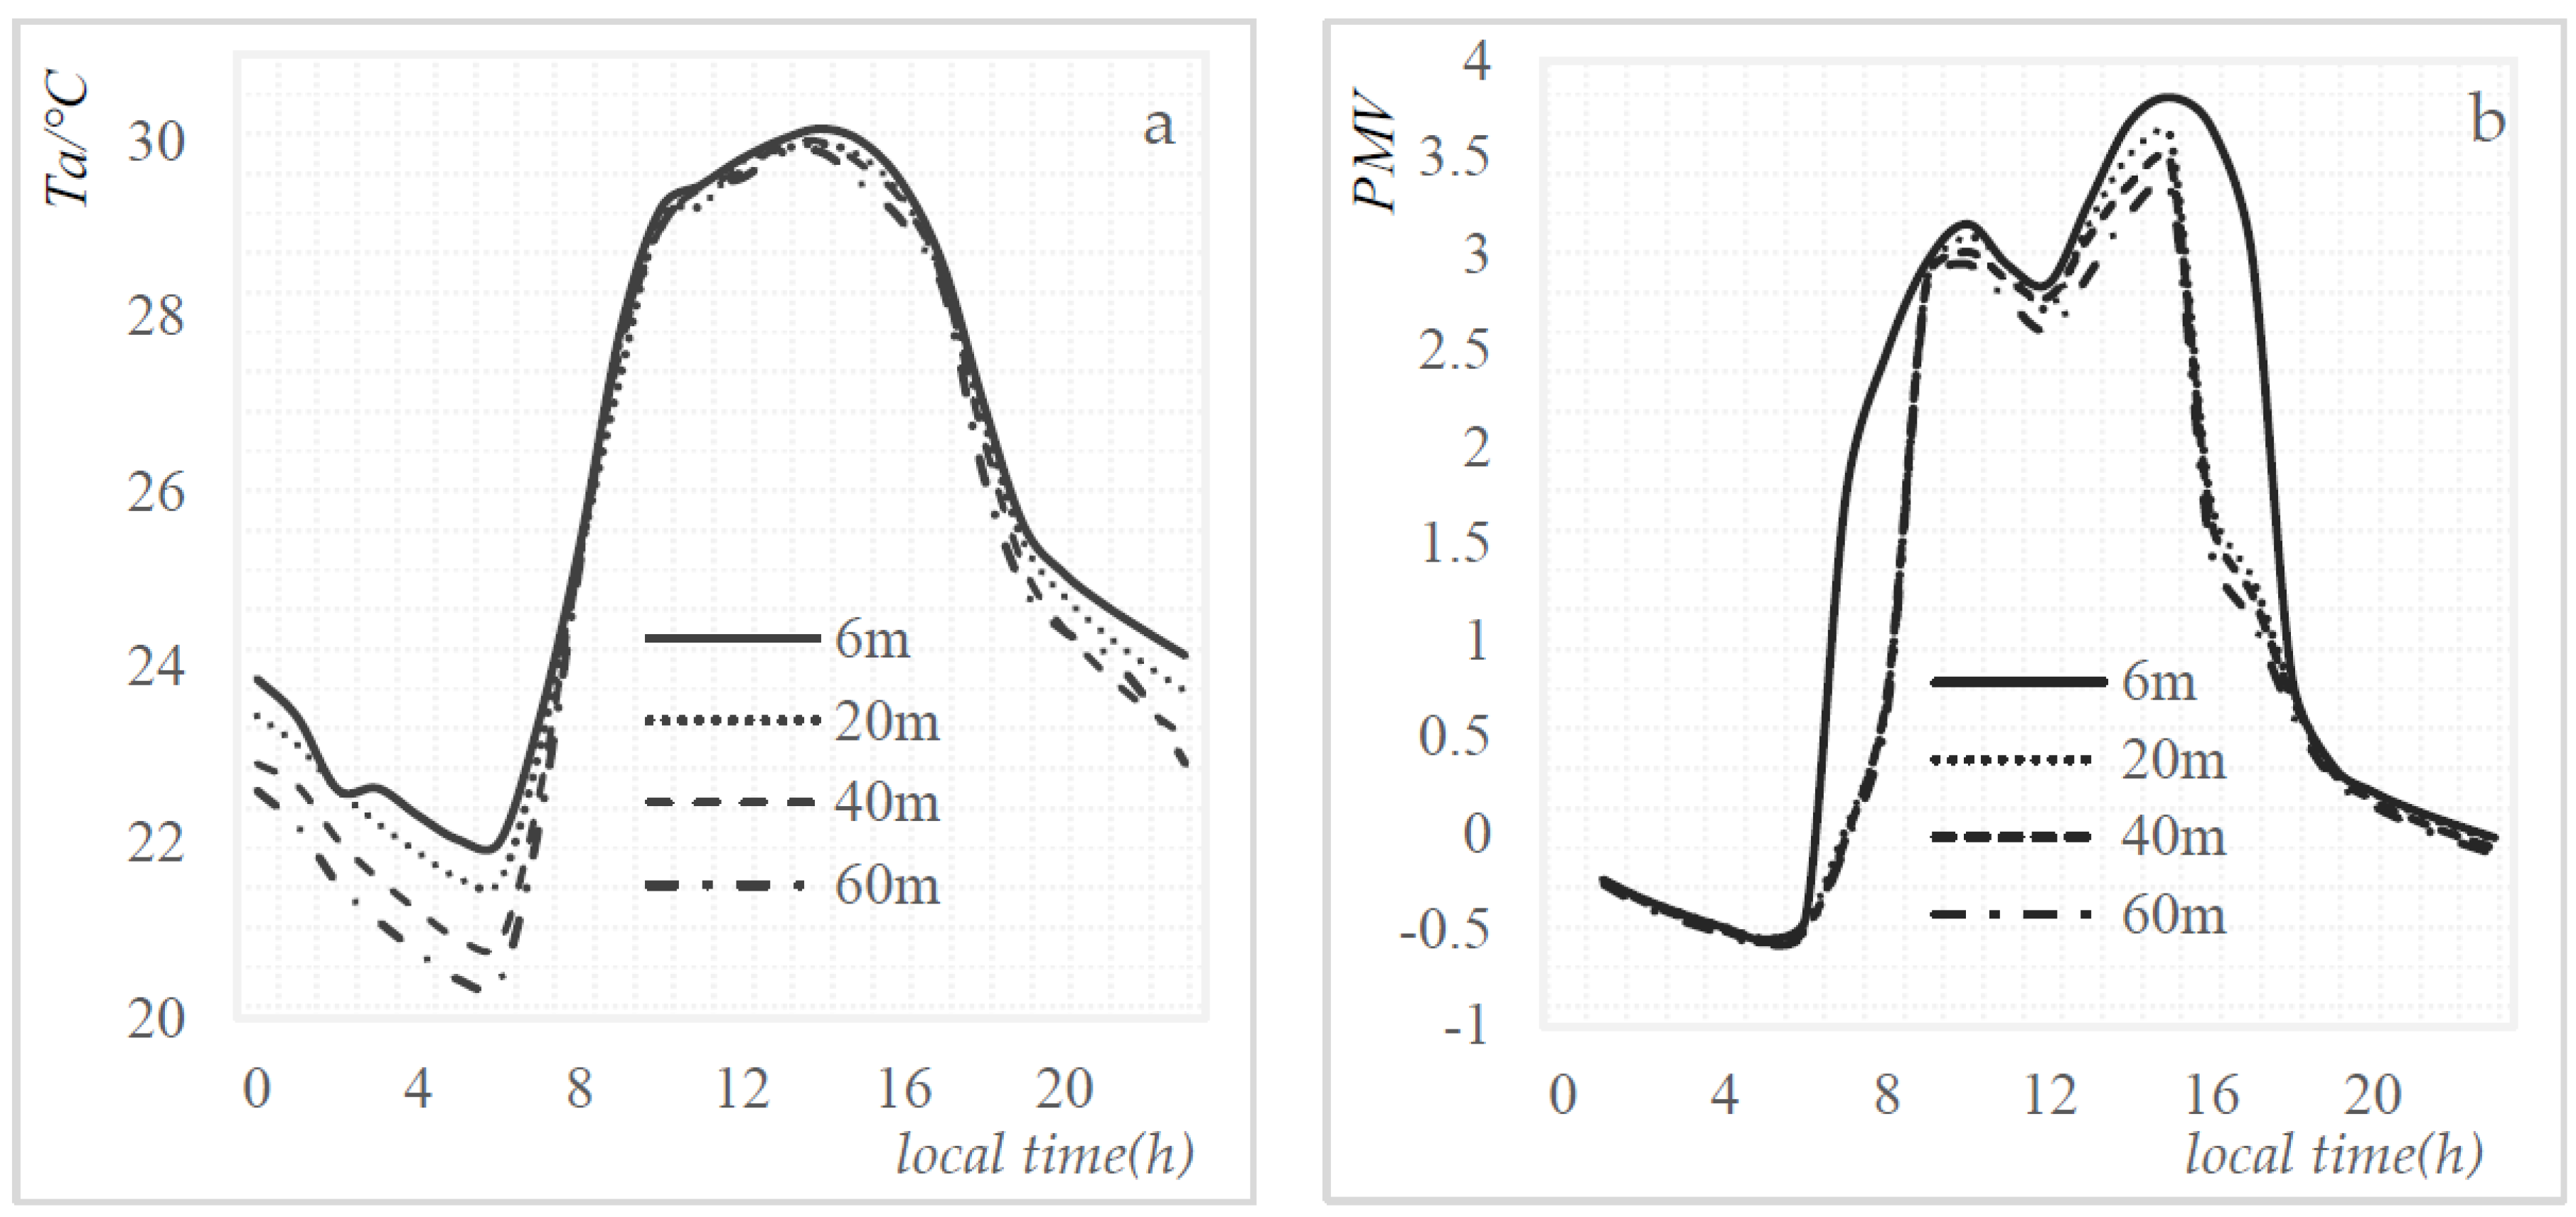
Figure 7.
The effects of building layout on thermal environment during 24 h (a) the effects on Ta, (b) the effects on PMV.
Figure 7.
The effects of building layout on thermal environment during 24 h (a) the effects on Ta, (b) the effects on PMV.
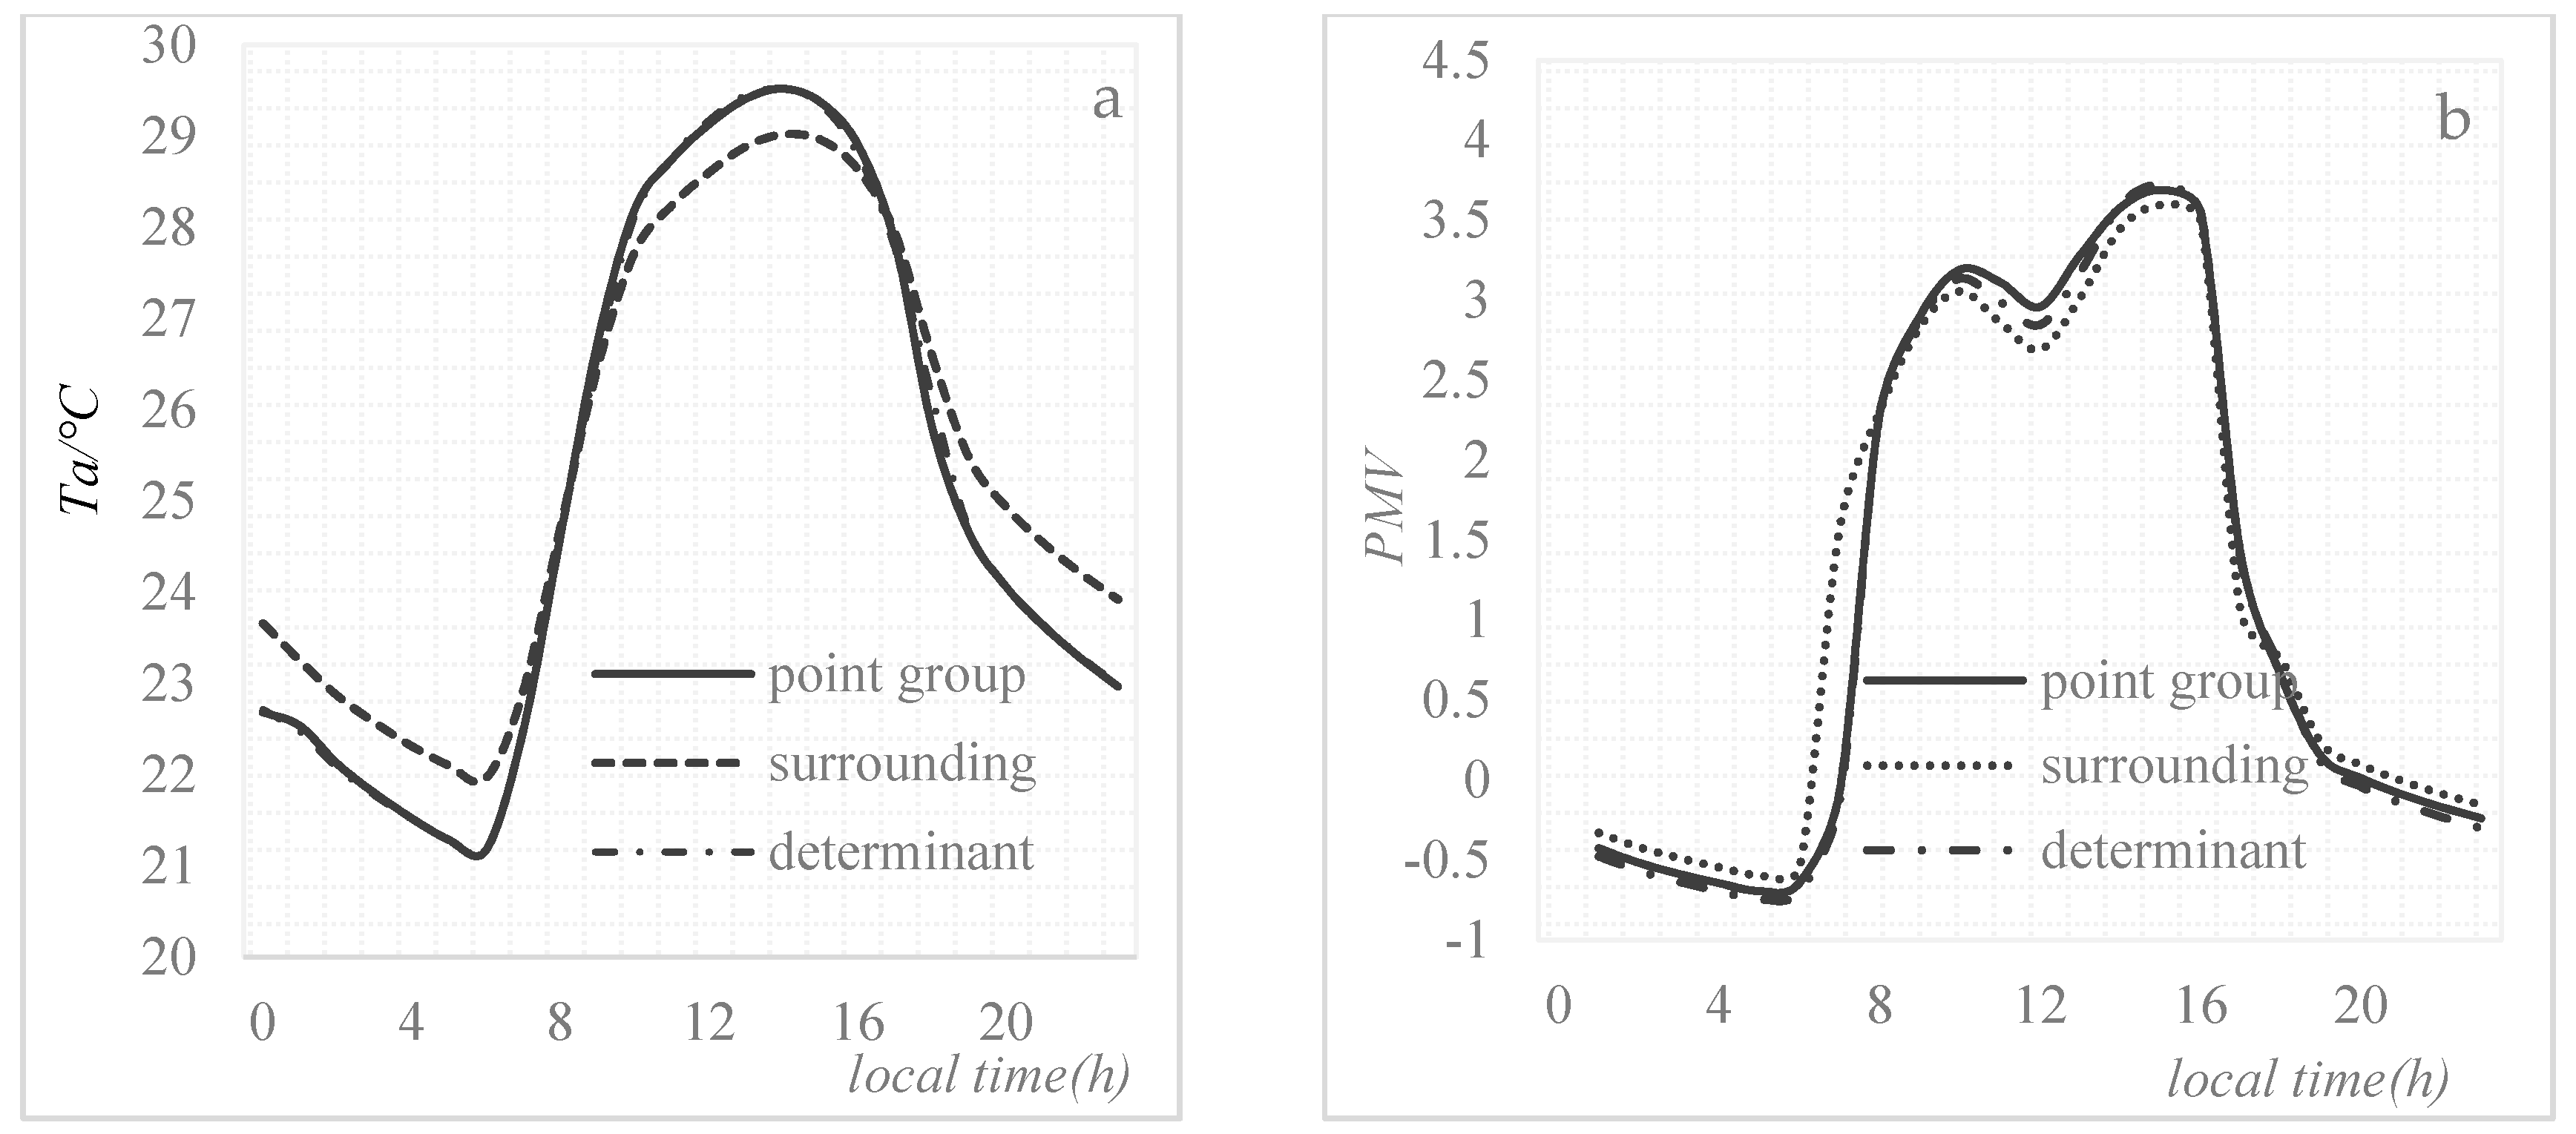
Figure 8.
The effects of green ratio on thermal environment during 24 h (a) the effects on Ta, (b) the effects on PMV.
Figure 8.
The effects of green ratio on thermal environment during 24 h (a) the effects on Ta, (b) the effects on PMV.
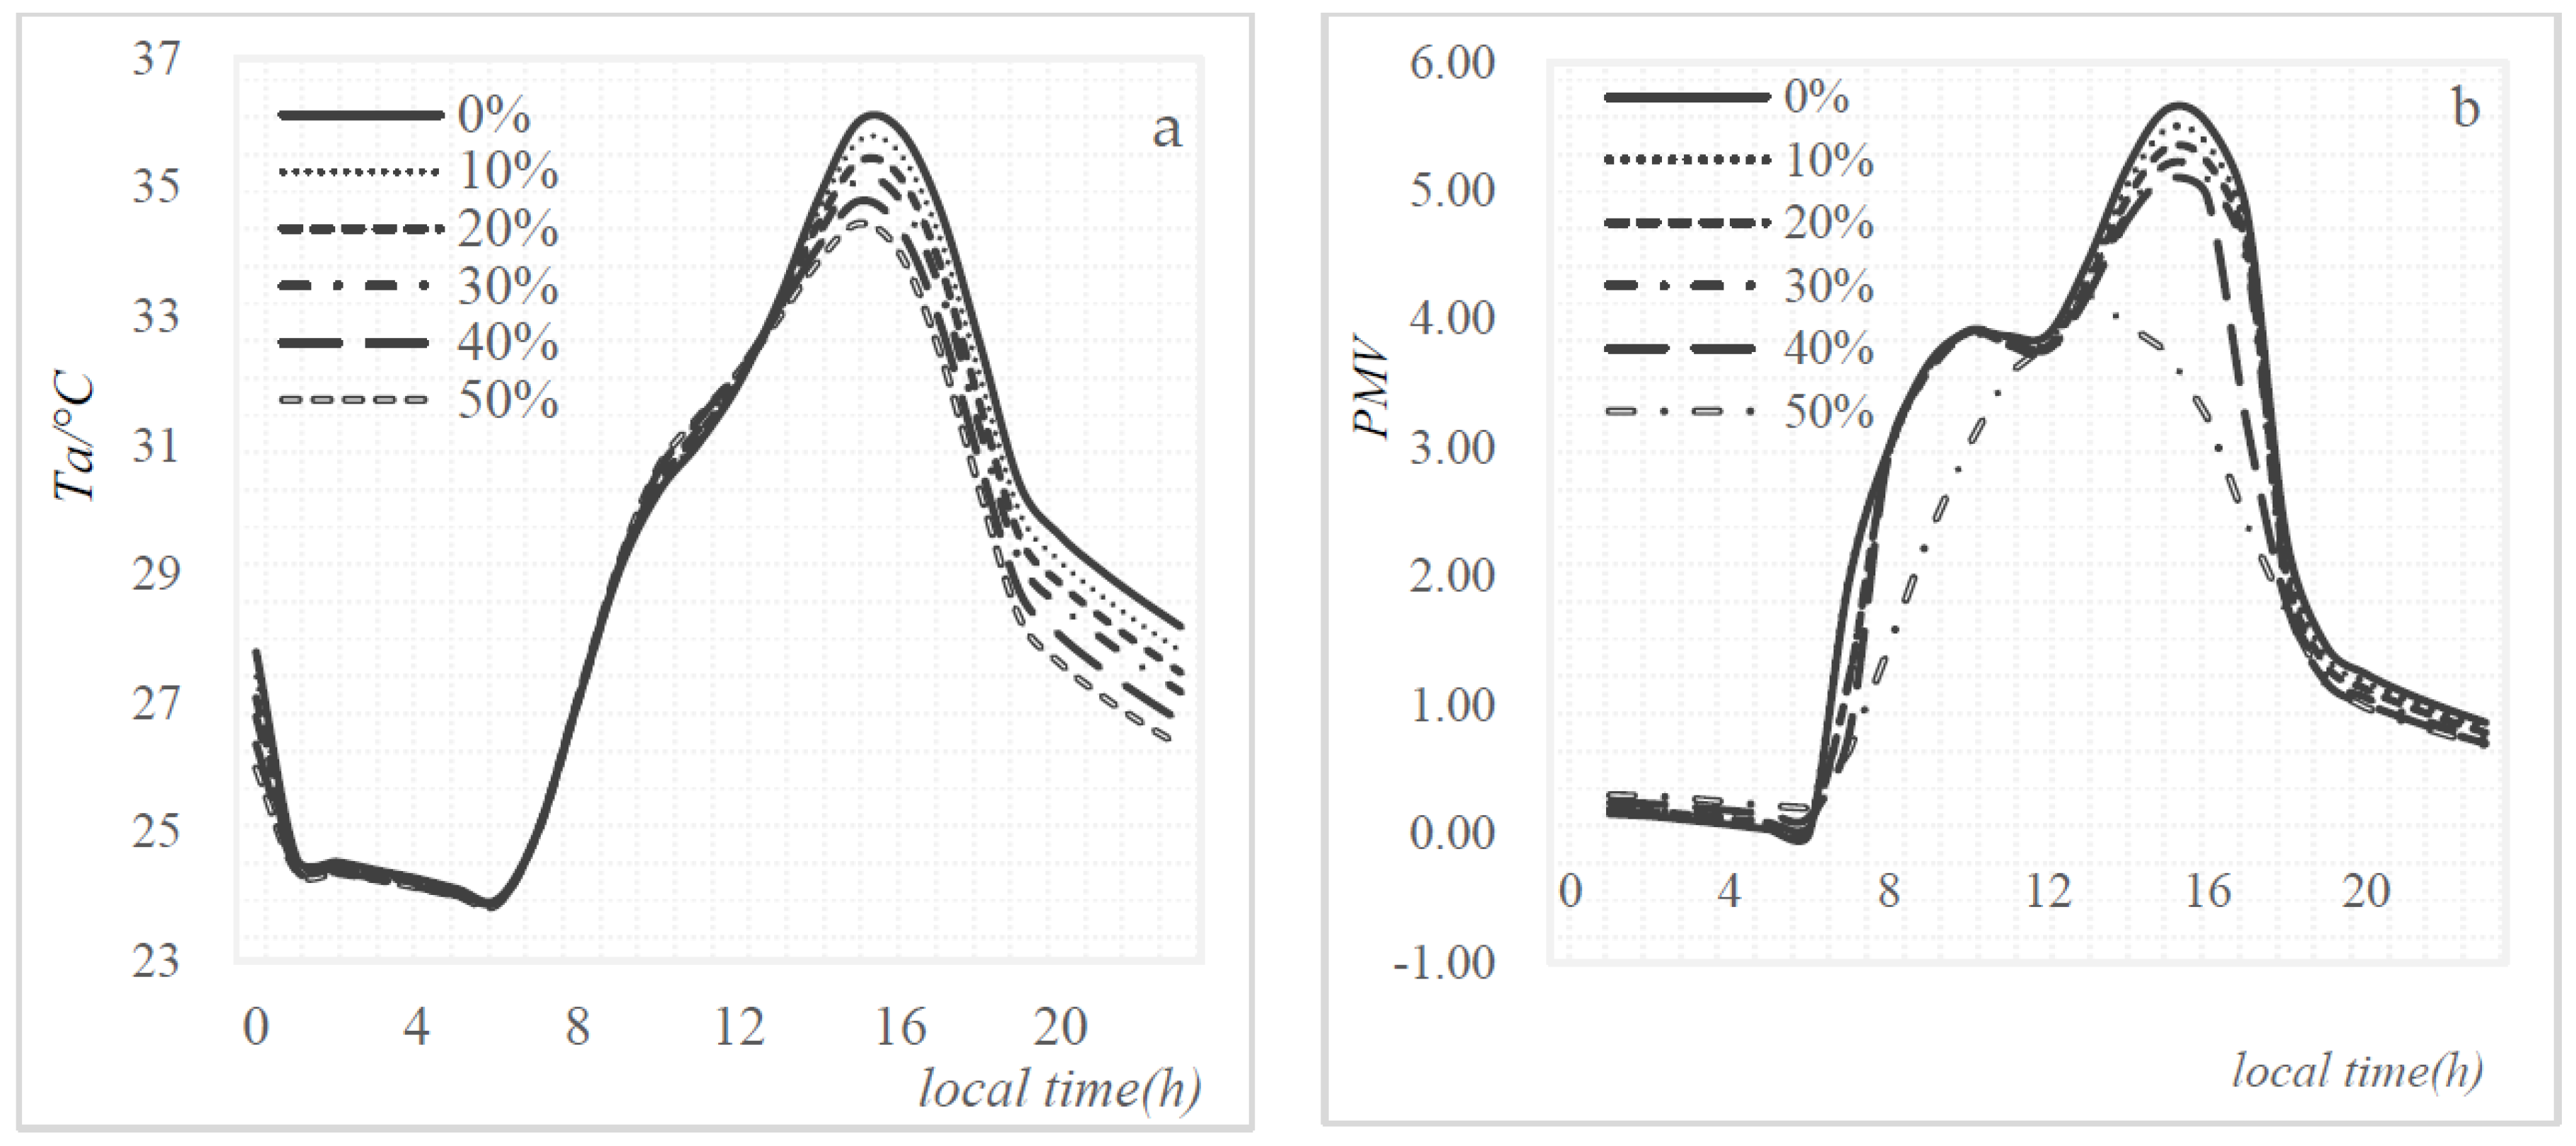
Figure 9.
The interactive effects of building density, height on thermal environment (a) the effects on Ta, (b) the effects on PMV.
Figure 9.
The interactive effects of building density, height on thermal environment (a) the effects on Ta, (b) the effects on PMV.

Figure 10.
The influence of building density on the relationships between green ratio and Ta at 20 m building height.
Figure 10.
The influence of building density on the relationships between green ratio and Ta at 20 m building height.
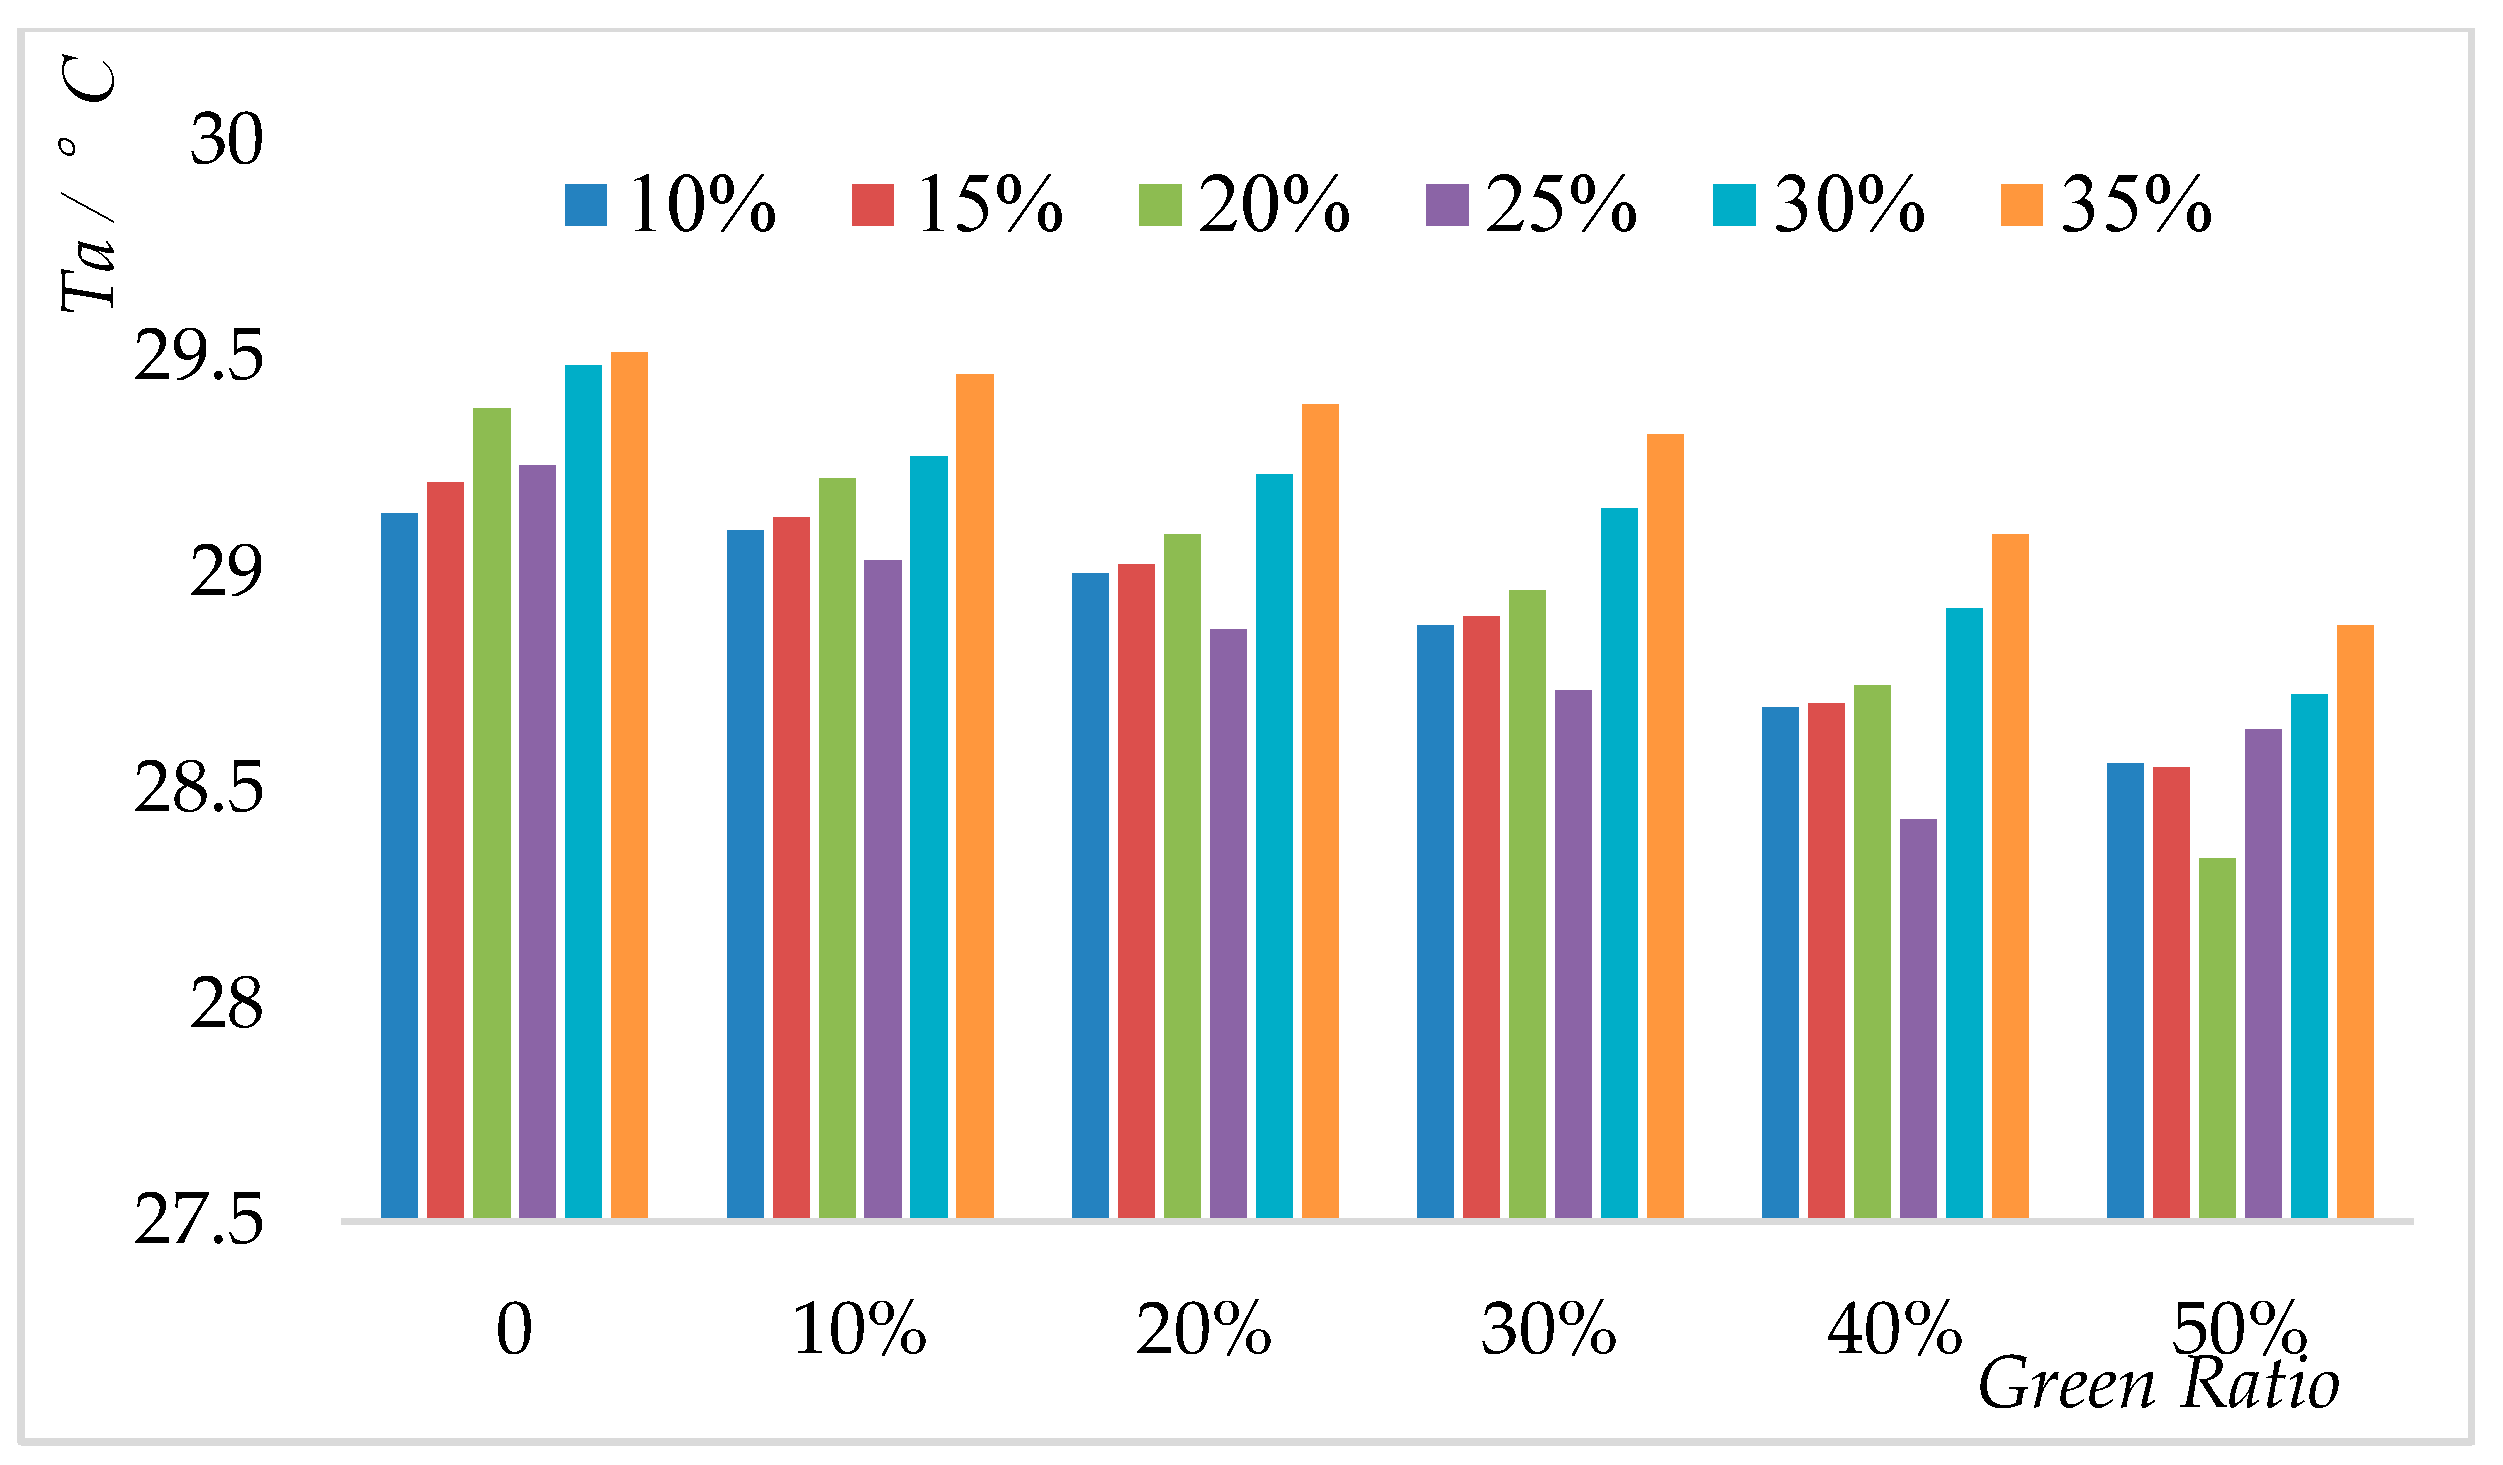
Figure 11.
The influence of building density on the relationships between green ratio and PMV at 20 m building height.
Figure 11.
The influence of building density on the relationships between green ratio and PMV at 20 m building height.
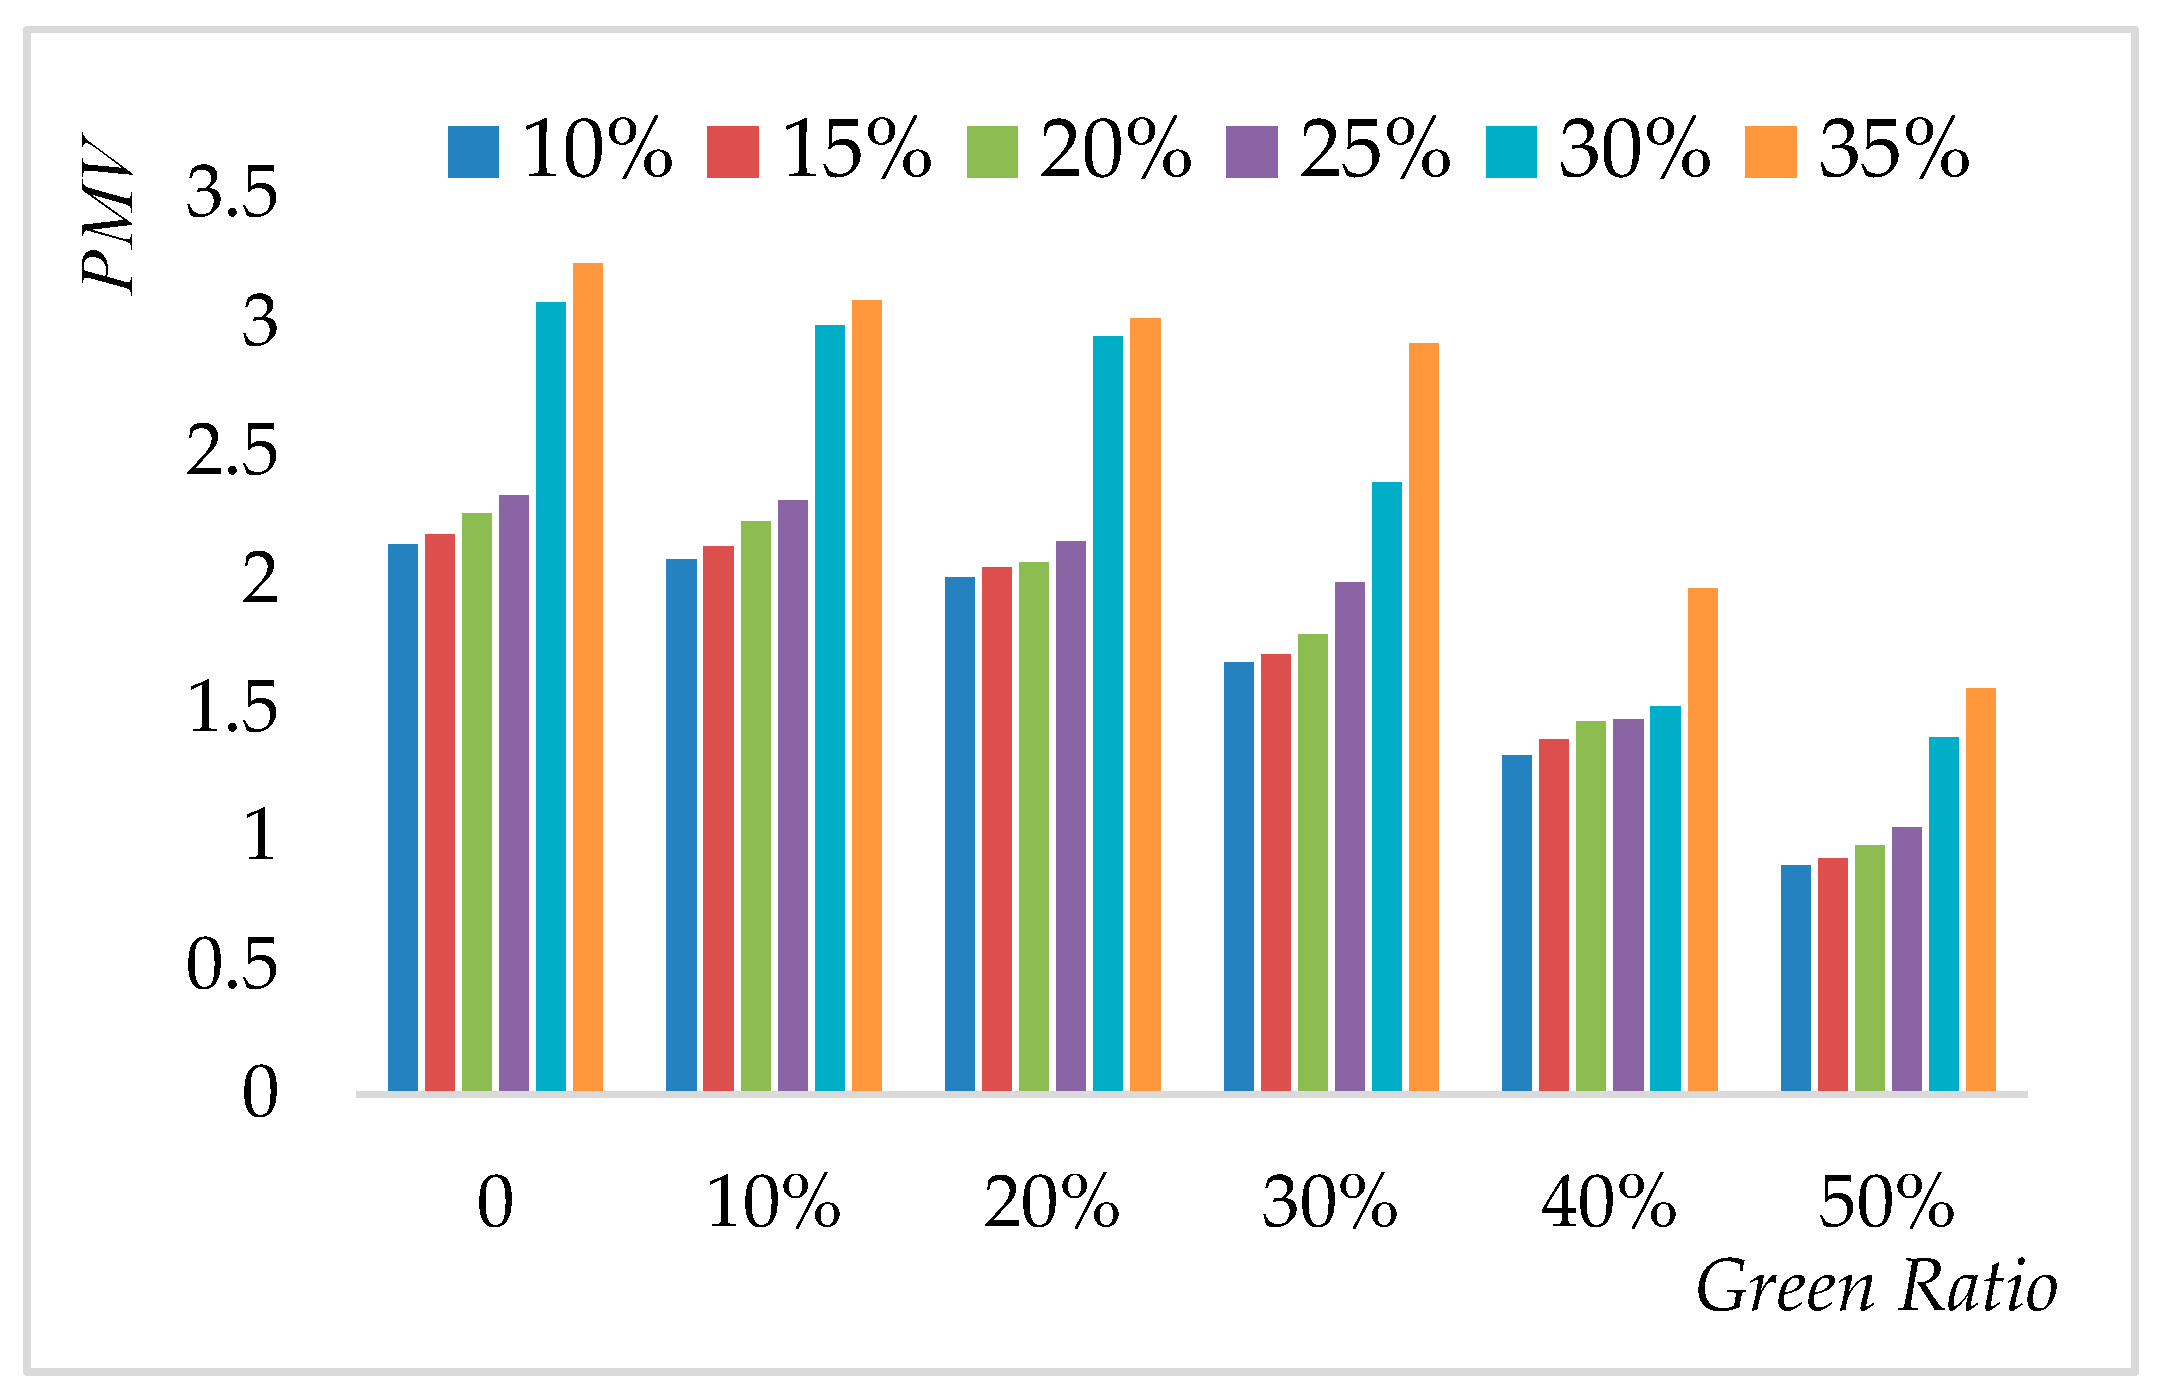
Figure 12.
The influence of building height on the relationships between green ratio and ATa at 25% building density.
Figure 12.
The influence of building height on the relationships between green ratio and ATa at 25% building density.
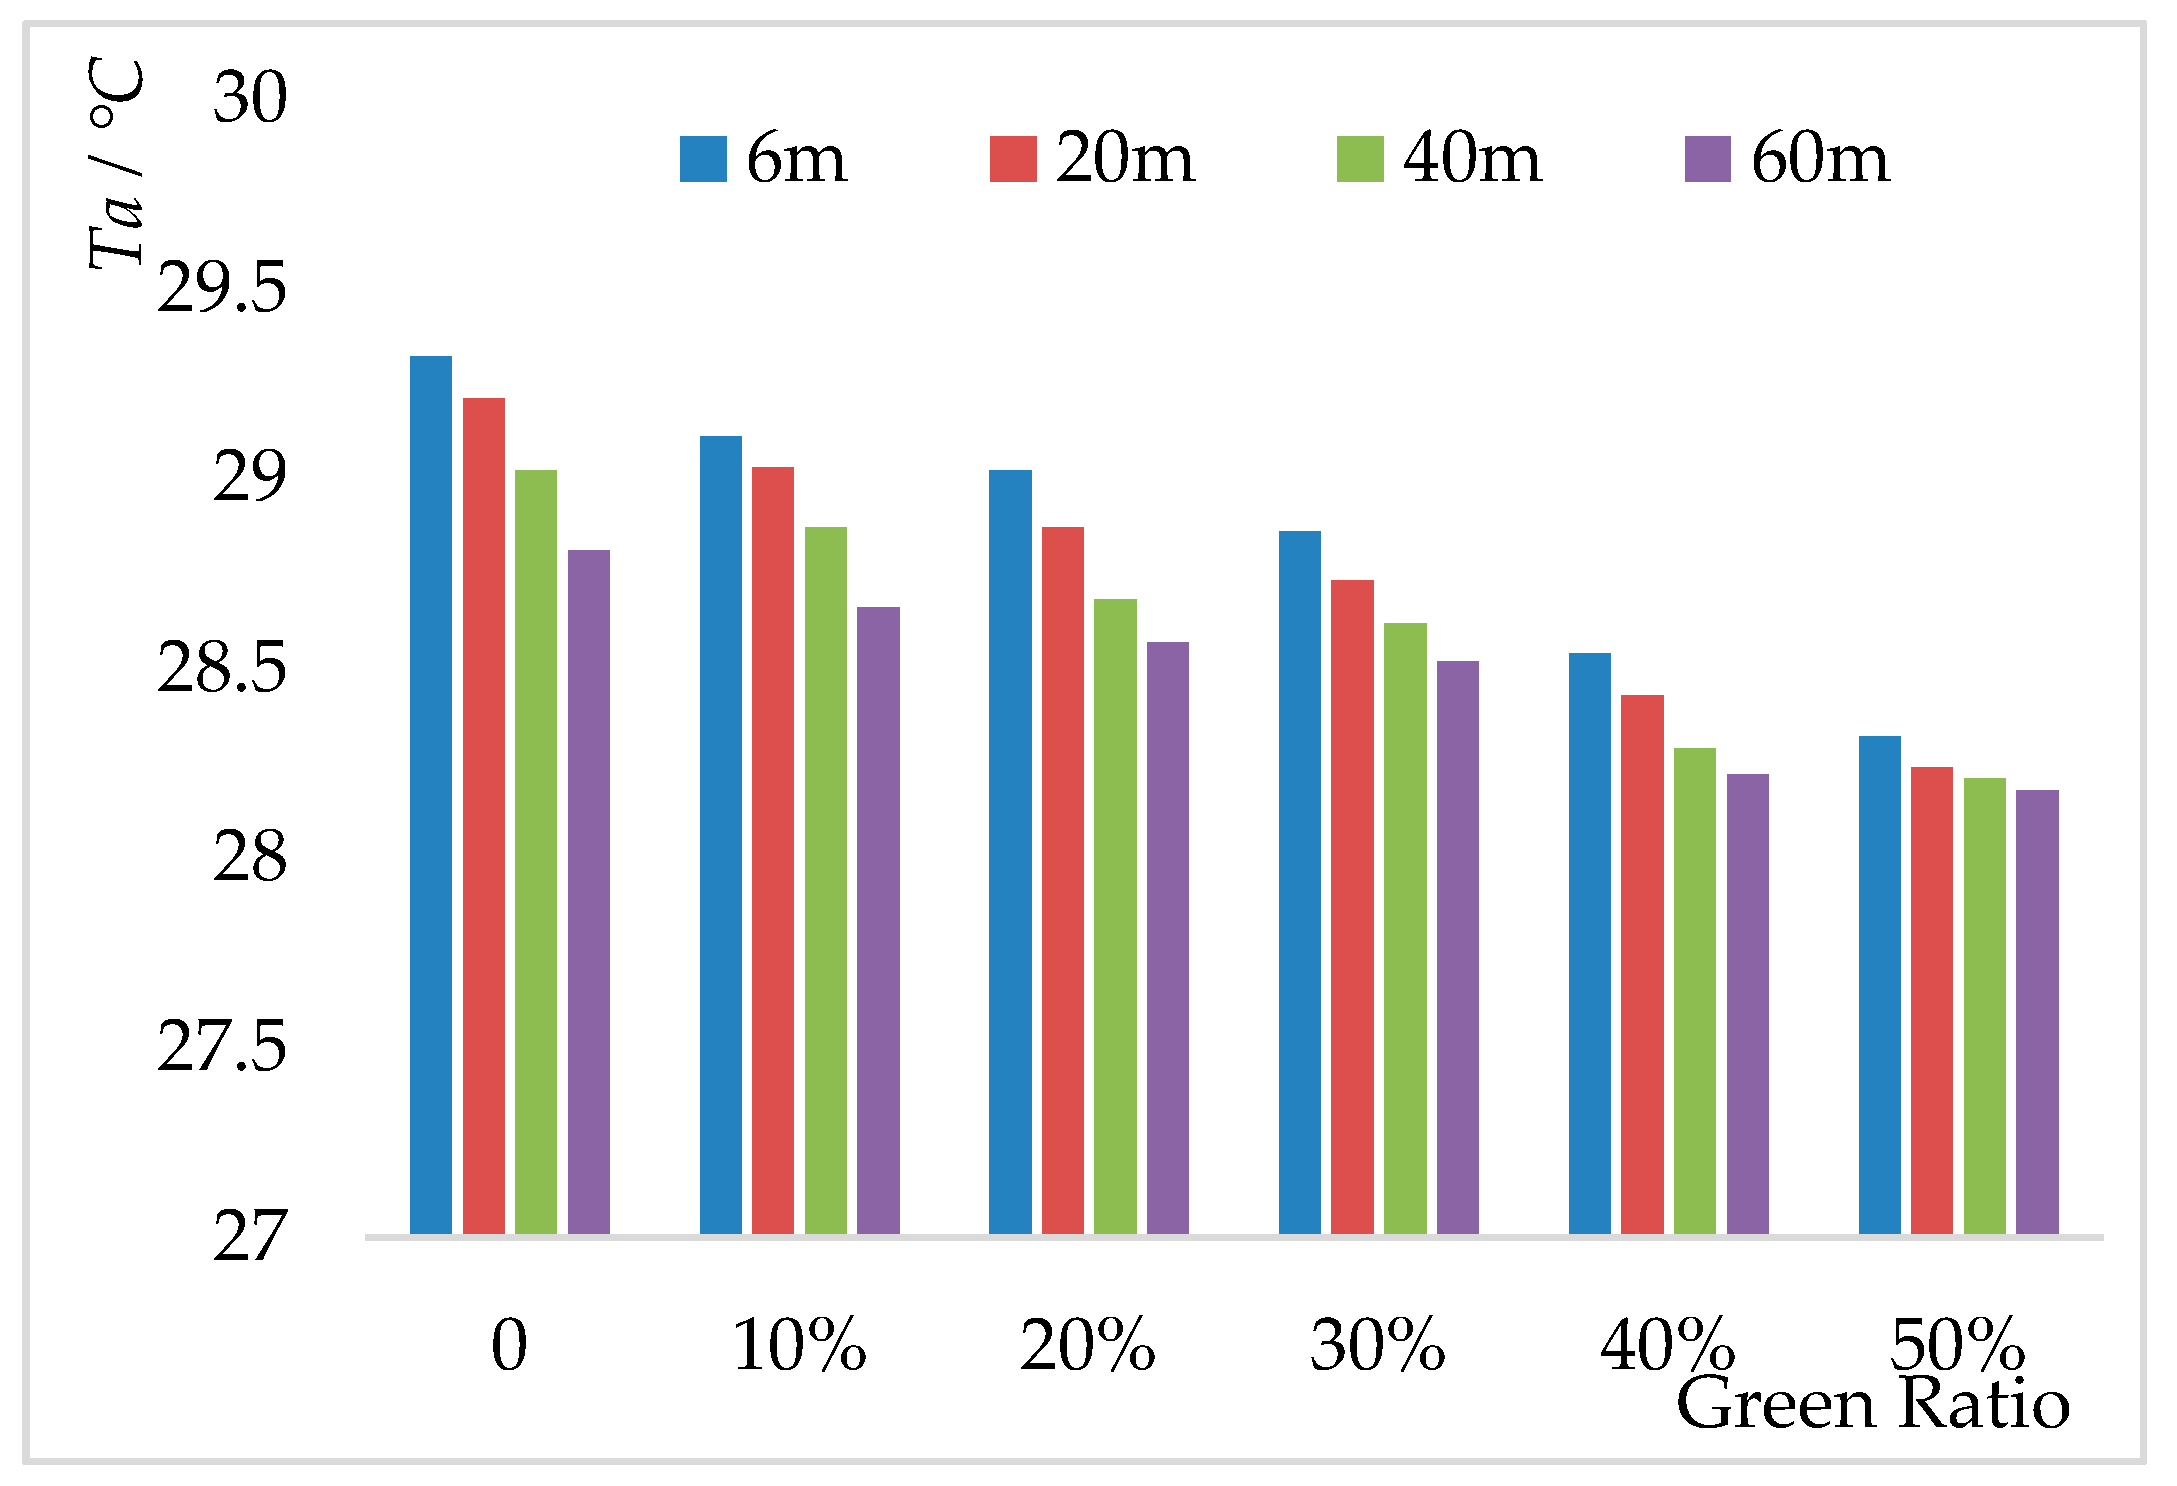
Figure 13.
The influence of building height on the relationships between green ratio and PMV at 25% building density.
Figure 13.
The influence of building height on the relationships between green ratio and PMV at 25% building density.

Table 1.
Definition of inputted simulation parameters.
| Parameters | Value |
|---|---|
| latitude and longitude of the simulated area | 118.78°, 32.08° |
| Initial air temperature (K) | 301.9 |
| Albedo of building wall | 0.2 |
| Heat coefficient of building wall | 0.33 |
| Roof albedo | 0.2 |
| Heat coefficient of roof | 0.33 |
| Wind direction | East wind |
| Soil relative humidity (%) | 60 |
| Initial soil temperature(K) | 294 |
| Wind velocity (m/s) | 3 |
| Air relative humidity (%) | 50 |
Table 2.
The effects of building density on ATa, APMV, CH and EH.
| Building Density | 10% | 15% | 20% | 25% | 30% | 35% |
|---|---|---|---|---|---|---|
| CH (h) | 14 | 14 | 14 | 15 | 13 | 12 |
| EH (h) | 3 | 3 | 2 | 1 | 3 | 4 |
| ATa/°C | 28.3 | 28.2 | 28.1 | 27.8 | 28.0 | 28.7 |
| APMV | 1.86 | 1.53 | 1.45 | 1.11 | 1.92 | 1.98 |
Table 3.
The effects of building height on thermal environment.
| Building Height | 6 m | 20 m | 40 m | 60 m |
|---|---|---|---|---|
| CH (h) | 12 | 14 | 14 | 16 |
| EH (h) | 3 | 2 | 1 | 1 |
| ATa/°C | 28.3 | 28.1 | 28.0 | 27.7 |
| APMV | 1.40 | 1.11 | 1.03 | 0.81 |
Table 4.
The effects of building layout on thermal environment.
| Building Layout | Point | Peripheral | Determinant |
|---|---|---|---|
| CH (h) | 10 | 9 | 10 |
| EH (h) | 9 | 7 | 9 |
| ATa/°C | 28.7 | 28.1 | 28.4 |
| APMV | 1.21 | 1.09 | 1.13 |
Table 5.
The effects of green ratio on thermal environment.
| Green Ratio | 0% | 10% | 20% | 30% | 40% | 50% |
|---|---|---|---|---|---|---|
| CH (h) | 11 | 11 | 12 | 12 | 13 | 13 |
| EH (h) | 9 | 9 | 9 | 9 | 8 | 7 |
| ATa/°C | 29.2 | 29.0 | 28.9 | 28.7 | 28.4 | 28.2 |
| APMV | 2.33 | 2.31 | 2.14 | 1.99 | 1.46 | 1.04 |
© 2017 by the authors. Licensee MDPI, Basel, Switzerland. This article is an open access article distributed under the terms and conditions of the Creative Commons Attribution (CC BY) license (http://creativecommons.org/licenses/by/4.0/).
Share and Cite
MDPI and ACS Style
Yang, Y.; Zhang, X.; Lu, X.; Hu, J.; Pan, X.; Zhu, Q.; Su, W. Effects of Building Design Elements on Residential Thermal Environment. Sustainability 2018, 10, 57. https://doi.org/10.3390/su10010057
AMA Style
Yang Y, Zhang X, Lu X, Hu J, Pan X, Zhu Q, Su W. Effects of Building Design Elements on Residential Thermal Environment. Sustainability. 2018; 10(1):57. https://doi.org/10.3390/su10010057
Chicago/Turabian StyleYang, Yingbao, Xize Zhang, Xi Lu, Jia Hu, Xin Pan, Qin Zhu, and Weizhong Su. 2018. "Effects of Building Design Elements on Residential Thermal Environment" Sustainability 10, no. 1: 57. https://doi.org/10.3390/su10010057
Note that from the first issue of 2016, this journal uses article numbers instead of page numbers. See further details here.