Solar Heat Gain Reduction of Ventilated Double Skin Windows without a Shading Device


1
Korea Institute of Civil Engineering and Building Technology, 10223 Goyang-si, Korea
2
Kolon Global Corp., 21984 Incheon-si, Korea
*
Author to whom correspondence should be addressed.
Sustainability 2018, 10(1), 64; https://doi.org/10.3390/su10010064
Submission received: 13 November 2017
/
Revised: 26 December 2017
/
Accepted: 27 December 2017
/
Published: 28 December 2017
(This article belongs to the Special Issue Advanced Innovative Solutions for Final Design in Terms of Energy Sustainability of Nearly/Net Zero Energy Buildings (nZEB))
Abstract
:With global efforts to strengthen various energy-saving policies for buildings to reduce greenhouse gas emissions, in South Korea, new laws and regulations have been in force since May 2015 to install shading devices in public buildings and to include the solar heat gain coefficient (SHGC) reduction performance of shading devices in the evaluation of building performance. By making a ventilated air layer outer glass and inner glass to lower the temperatures of the air layer and glass surface, it is possible to reduce the amount of heat flowing into the building while maintaining the same level of light transmission as plain window systems. This study proposes a double-skin façade window with a 20 mm ventilated air cavity, and assumes that insolation inflow indoors would be reduced through ventilation in the air cavity. The artificial solar lab test results show that the SHGC can be lowered through ventilation by 28% to 52.9%. Additionally, in an outdoor test cell experiment, the results show that the mean temperature was 0.6 K and the peak temperature was 0.9 K lower with ventilation in the air cavity than that without ventilation in the air cavity.
1. Introduction
Demand for curtain wall systems has increased rapidly due to the activation of high-rise buildings. However, curtain wall buildings made of metal, such as aluminum, have limitations in meeting the national insulation standards, and indoor overheating due to solar thermal heat gain in summer is another problem. The double-skin façade has arisen as an alternative to overcome the disadvantages of such a curtain wall system, and various studies have been conducted since the 2000s [1].
However, due to the nature of the double-skin façade, which adds a single envelope to the existing envelope, the increase in existing construction costs is inevitable and, thus, efforts to reduce the material cost by reducing the thickness of the double envelope system have been conducted.
Meanwhile, as the importance of building energy performance increases, the standards on building envelopes have been raised and windows, which are the most vulnerable part in the envelope, have double burdens: one being improvements to the energy efficiency rating, and the other is the installation of shades.
The Korean Government has strengthened the energy reduction policies in building sectors continuously with the aim of passive houses by 2017 and zero-energy buildings by 2025 while preparing for energy reduction measures in building sectors for greenhouse gas reduction.
In particular, windows with first-grade energy efficiency ratings should be purchased in priority during new building construction to play a leading role in energy saving for public buildings, and new buildings or building extensions whose total floor area is greater than 3000 m2 should acquire the first-grade building energy efficiency ratings. Furthermore, when public buildings whose total floor area is more than 3000 m2 install windows at outer walls, or use glass materials at outer walls during new building or remodeling, solar control devices, such as shades, should be installed or building owners should take other action to reduce solar heat gain and increase energy efficiency.
The Korean government is encouraging the installation of exterior shades, but this is limited in application with high initial cost. For this reason, it seems that the application of a slim form of double-skin window that has proper thermal resistance and reduces solar heat gain can be applied as an alternative.
Therefore, this study searched for a solution to the high cost problem of the existing double-skin façade system by means of reducing the width of the intermediate air cavity. To maintain a thickness of the window at the existing level of window thickness, a double-skin façade window whose intermediate cavity was 20 mm was proposed, and the reduction performance of indoor solar heat acquisition through ventilation through the intermediate cavity was evaluated.
2. Working Principle
2.1. Literature Reviews on Existing Double-Skin Façade Systems
A double-skin façade consists of a normal façade, an air cavity, and an additional external skin usually made of glass. It is common to apply a shading system within the cavity between the two layers of the façade [2].
Commonly, the most efficient running scenario for a double-skin façade is to close the cavity vent in winter and to open the cavity vent in summer. Sanchez et al. [3] approved the scenario with computer simulations. In the case of glazing properties and combination, Guardo et al. [4] determined that a further decrease in total solar energy transmission would be possible by increasing the outside solar reflectance of the shading screen and replacing the internal glazing for a low-emissivity glass can duplicate the reduction of the solar load gain. Perez-Grande et al. [5] insisted that a reduction of external glazing transmissivity by 55% can lead to a 40% enhancement in the reduction in the solar load gain.
However, the installation of the shading device can increase the size of the window, which can increase the construction cost. It is also ironic to abandon the transmittance of the glazing in order to reduce the heat gain.
Studies on cavity depth [6,7,8,9] mainly focused on a double skin with a cavity layer of at least 30 cm to 150 cm.
In this study, we proposed a double skin window that can maintain the level of transmittance at the level of the general window while reducing the amount of indoor solar energy heat gain, and a performance experiment was conducted to evaluate the effect of cooling load reduction on a double skin window with a minimum 2 cm cavity layer.
2.2. Principle of Solar Heat Gain through Ventilation via an Intermediate Air Cavity
The ventilated double skin window proposed in this study consists of single outer glass, double inner glass, and a 20 mm air layer between the two glasses. This air layer is ventilated at all times because the upper and lower parts of single glass are exposed to the outside air. It can be concluded that, with this configuration, the heat flowing into the room can be reduced by convection, and this principle can be explained as follows:
The solar heat gain coefficient (SHGC) refers to the ratio of solar heat penetrating through windows compared to the solar energy reaching the window per unit area in a given incident angle and environmental conditions (indoor temperature, outdoor air temperature, wind speed, and insolation). The SHGC can be expressed via the following equation:
- : Insolation that transmits the window;
- : Ratio of absorbed calorie radiated to the indoor; and
- : Solar heat absorption in the single-pane fenestration system.
Existing windows have heat transfer through conduction and radiation thereby constantly having heat transfer to the indoor side (Figure 1a). However, the proposed window can reduce heat transfer by naturally ventilating the inside of the air cavity whose temperature increases due to conduction (Figure 1b). That is, and values can be reduced through ventilation of the air cavity. Thus, the SHGC in the proposed window can be maintained at a lower value than that of the exiting window.
3. Artificial Solar Lab Test
3.1. Overview
3.1.1. Experimental Equipment and Measurement Plan
The artificial solar lab in which the SHGC can be calculated through samples using artificial sun is divided into an indoor chamber (heating box) and an outdoor chamber.(Figure 2 and Figure 3) Figure 2 shows the configuration. The wall, bottom, and ceiling of the chamber are made with sandwich panels filled with 75 mm-thick urethane foam. Each of the chambers controls the temperature and humidity via a thermo-hygrostat and the temperature outside the chamber can also be controlled through a separate thermo-hygrostat. The air conditioned at the thermo-hygrostat is supplied to the indoor chamber through 12 diffusers in the ceiling, and discharged through the outlet in the wall. The conditioned air is supplied and exhausted through the upper and lower grills in the outdoor chamber and an artificial solar device consisting of 250 W metal halide lamps is installed, directed towards the sample placed between the indoor and outdoor chambers. In this artificial solar lab, it is possible to control factors, such as the indoor and outdoor temperature, and solar radiation, which can affect SHGC, so that a steady state can be maintained. It is also easy to measure consistent SHGC because it is not affected by altitude, longitude, and seasonal solar spectrum changes. Summary of the facilities installed in the artificial solar laboratory chamber is shown in Table 1.
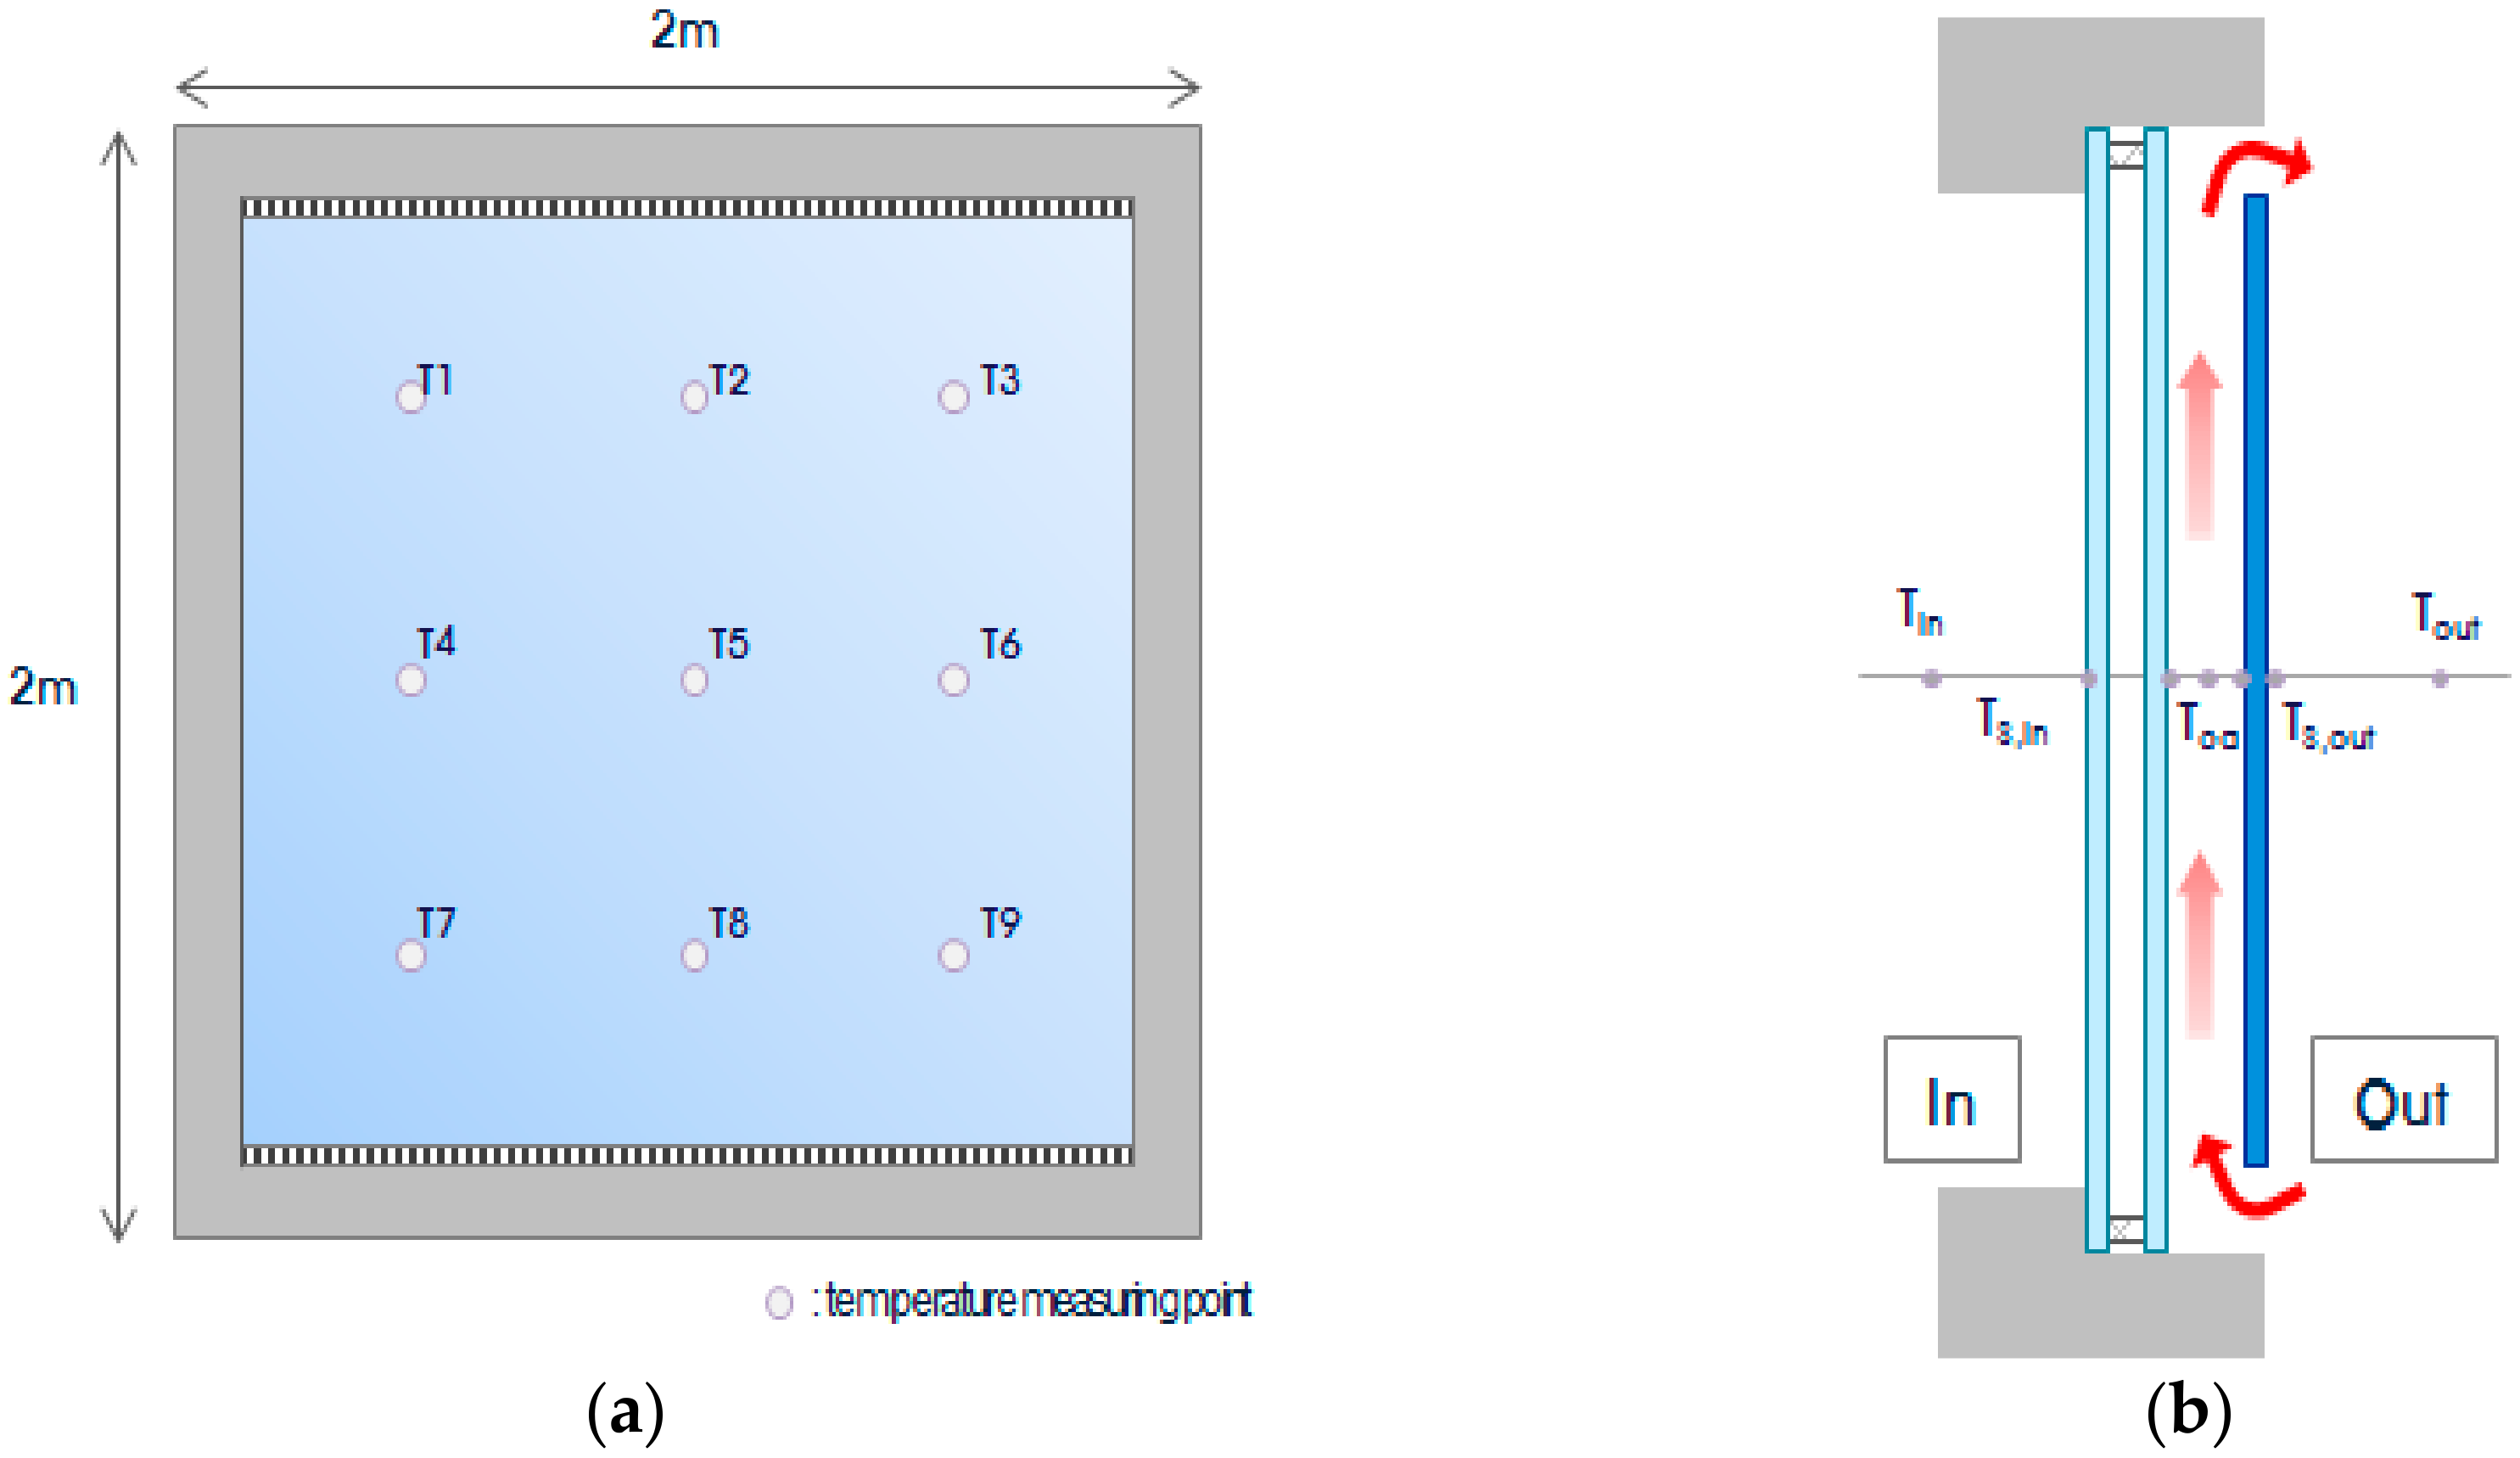
The maximum sample size that can be installed is 2 m × 2 m. Thermocouples are installed at 21 positions on each surface of the inner and outer sides of the sample, 15 positions in the indoor chamber, three positions in the outdoor chamber, three positions in the thermostatic chamber, and at each of the main duct and outlet of the heating, ventilation, and air conditioning (HVAC) to measure the temperature. In addition, a pyranometer is installed on the sample side facing the outdoor chamber to measure insolation reaching the sample.
The equation that calculates the SHGC is presented in Equation (1), which is derived via the insolation reaching the surface of the window system, insolation introduced to the indoor chamber, and the calories introduced due to difference between the indoor and outdoor temperatures:
where:
- : heat flux through the test specimen (W);
- : heat flux through the window specimen (W);
- : Projected area of the window specimen (m2);
- : Solar radiation energy incident to the window specimen (W/m2);
- is equivalent to Equation (3):
where:
- : heat flux through solar calorimeter walls (W);
- : heat flux through surround panel (W);
- : heat flux by flanking loss (W);
- : heat removed by fluid heat extraction system (W);
- : heat input into solar calorimeter by pumps and fans (W).
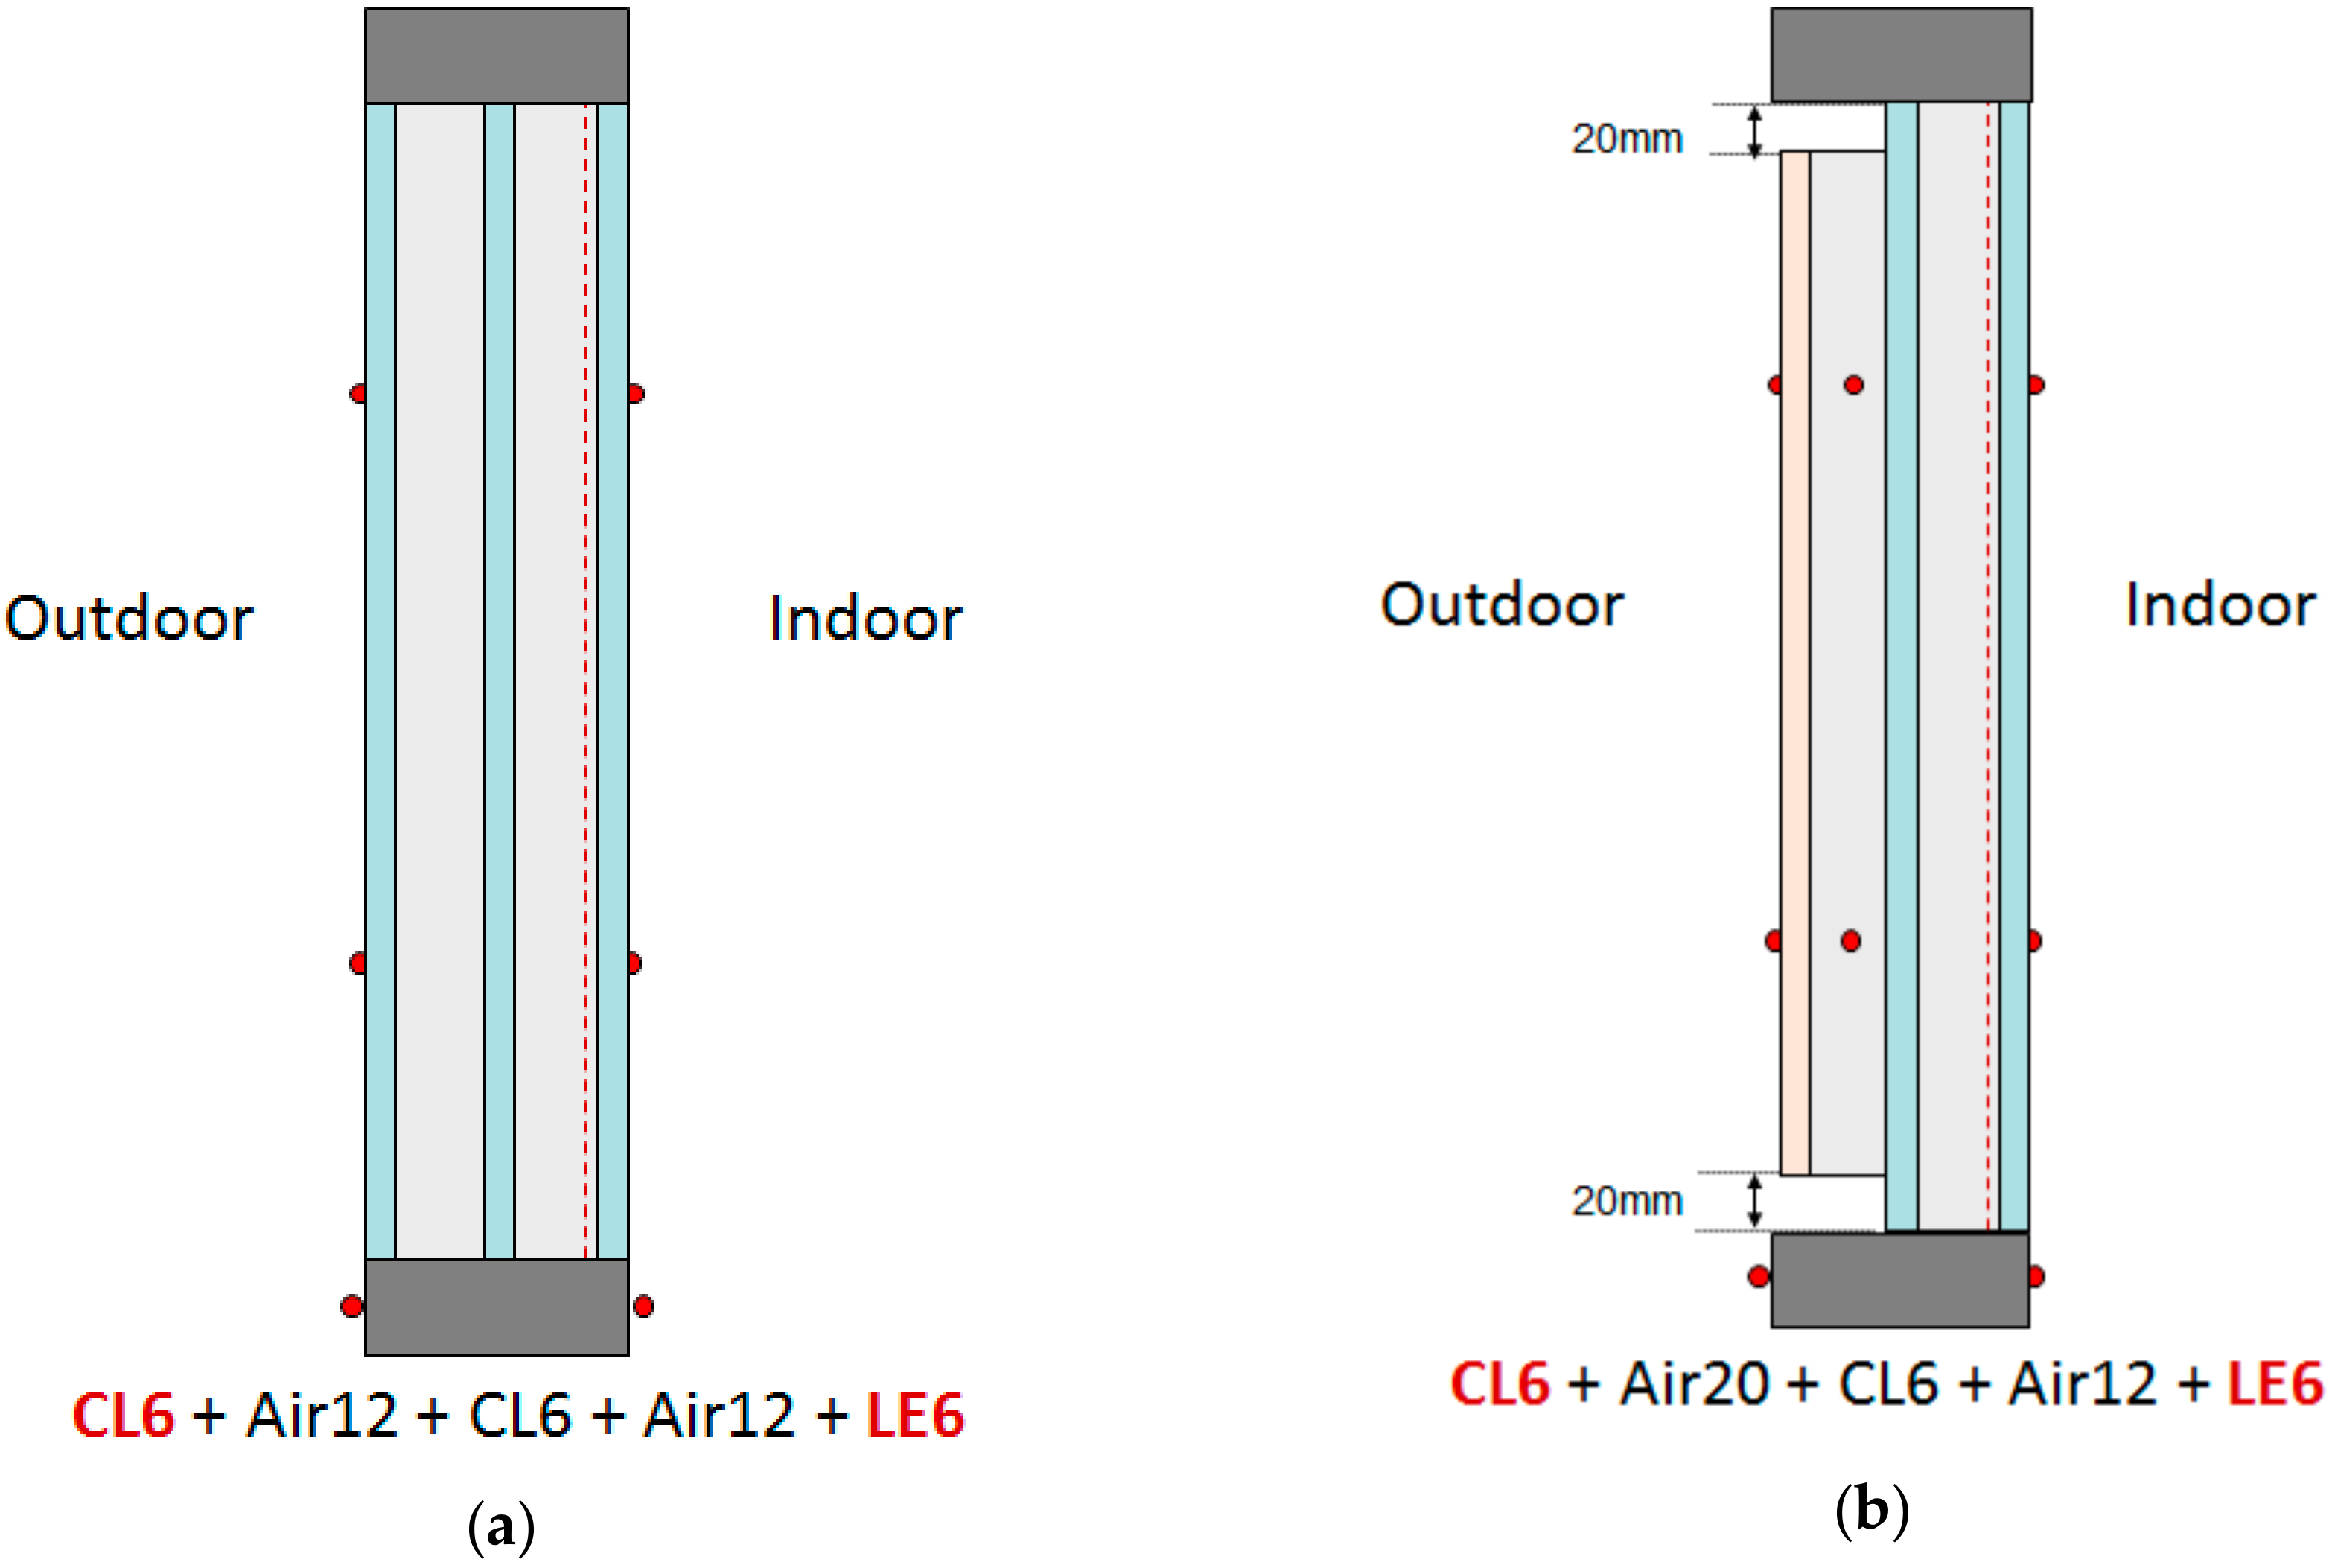
Temperatures of the test sample were measured at nine places on both the outside and the inside of the outer glass, air temperature was measured at one position inside the 20 mm air cavity, and nine positions each in the outside and inside of the double-skin façade. A mean temperature at the measured positions was calculated. However, the temperature of the 20 mm air cavity was measured at only one point in the center of the air cavity.
In order to reduce the error of the experimental results, the experiment was conducted more than three times for the same case. Each experiment was conducted for about eight hours for each case, and terminated when the SHGC value was found to be convergent.
During testing, insolation, temperature, power, flow rate, wind velocity, wind direction, and power of the HVAC were measured according to NFRC201 7.3 [10], and the final results were derived when a steady state was reached. The items below describe the criteria to determine the steady state. The steady state in the system was checked after measuring each factor five times to calculate a mean value and their variation was investigated to determine the steady state of the system.
- -
- Maintaining a temperature of outdoor air chamber: within ±2 °C;
- -
- Checking a thermal gradient in the inside and outside chamber: less than 2 °C; and
- -
- Variation of air volume: within ±5%.
- -
- Supply air temperature: within ±1 °C.
Since the indoor chamber temperature is always maintained at the set temperature, it is determined by the supply air temperature instead of the indoor chamber temperature. Due to the characteristics of the HVAC system, the supply air temperature shows a periodic rise and fall pattern (approximately in every 25 min). If this pattern is observed more than three times, it is regarded as the steady state. One period refers to a time taken from the minimum to the peak temperature and then back to the minimum temperature again.
3.1.2. Experimental Alternatives
Window configurations for the target windows with performance below 1.0 W/m2·K (the first grade window in window energy efficiency rating) were selected in accordance with Korean energy performance regulations for windows.
The target windows to be assessed are a window (Case A) consisting of outer glass (clear single glass) + 20 mm air cavity + inner glass (6 mm low-e glass + 12 mm argon gas + 6 mm low-e glass), and a window (Case B) consisting of outer glass (clear single glass) + 20 mm air cavity + inner glass (6 mm reflective glass + 12 mm air + 6 mm low-e glass). The target windows to be assessed and an overview of the cases are presented in Table 2. The thermal transmittance and SHGC of the entire glasses in Case A are 0.936 W/m2·K and 0.233, assuming that ventilation is not conducted, and those in Case B are 0.947 W/m2·K and 0.200. The thermal transmittance and SHGC of the inner glass in Case A are 1.683 W/m2·K and 0.203, and those of Case B are 1.695 W/m2·K and 0.141.
The emissivity of low-e coating glass, which is applied to Cases A and B, is 0.837 on the outside and 0.013 on the inside, and the reflectivity is 0.364 on the outside, and 0.592 on the inside. The transmittance is 0.239. The emissivity of reflective glass, which is applied to Case B, is 0.837 on the outside and 0.536 on the inside, and the reflectivity is 0.132 on the outside, and 0.259 on the inside. The transmittance is 0.136.
3.2. Experiment Results of Case A
For each case, the surface temperature at the window and air temperature in the air cavity were measured according to whether ventilation at the air cavity is available or not. Each case had three or more measurements, and the cases that converged to the steady state were analyzed. The measurement positions are shown in Figure 4 and Figure 5, and the temperature measurement results are presented in Table 3 and Figure 6.
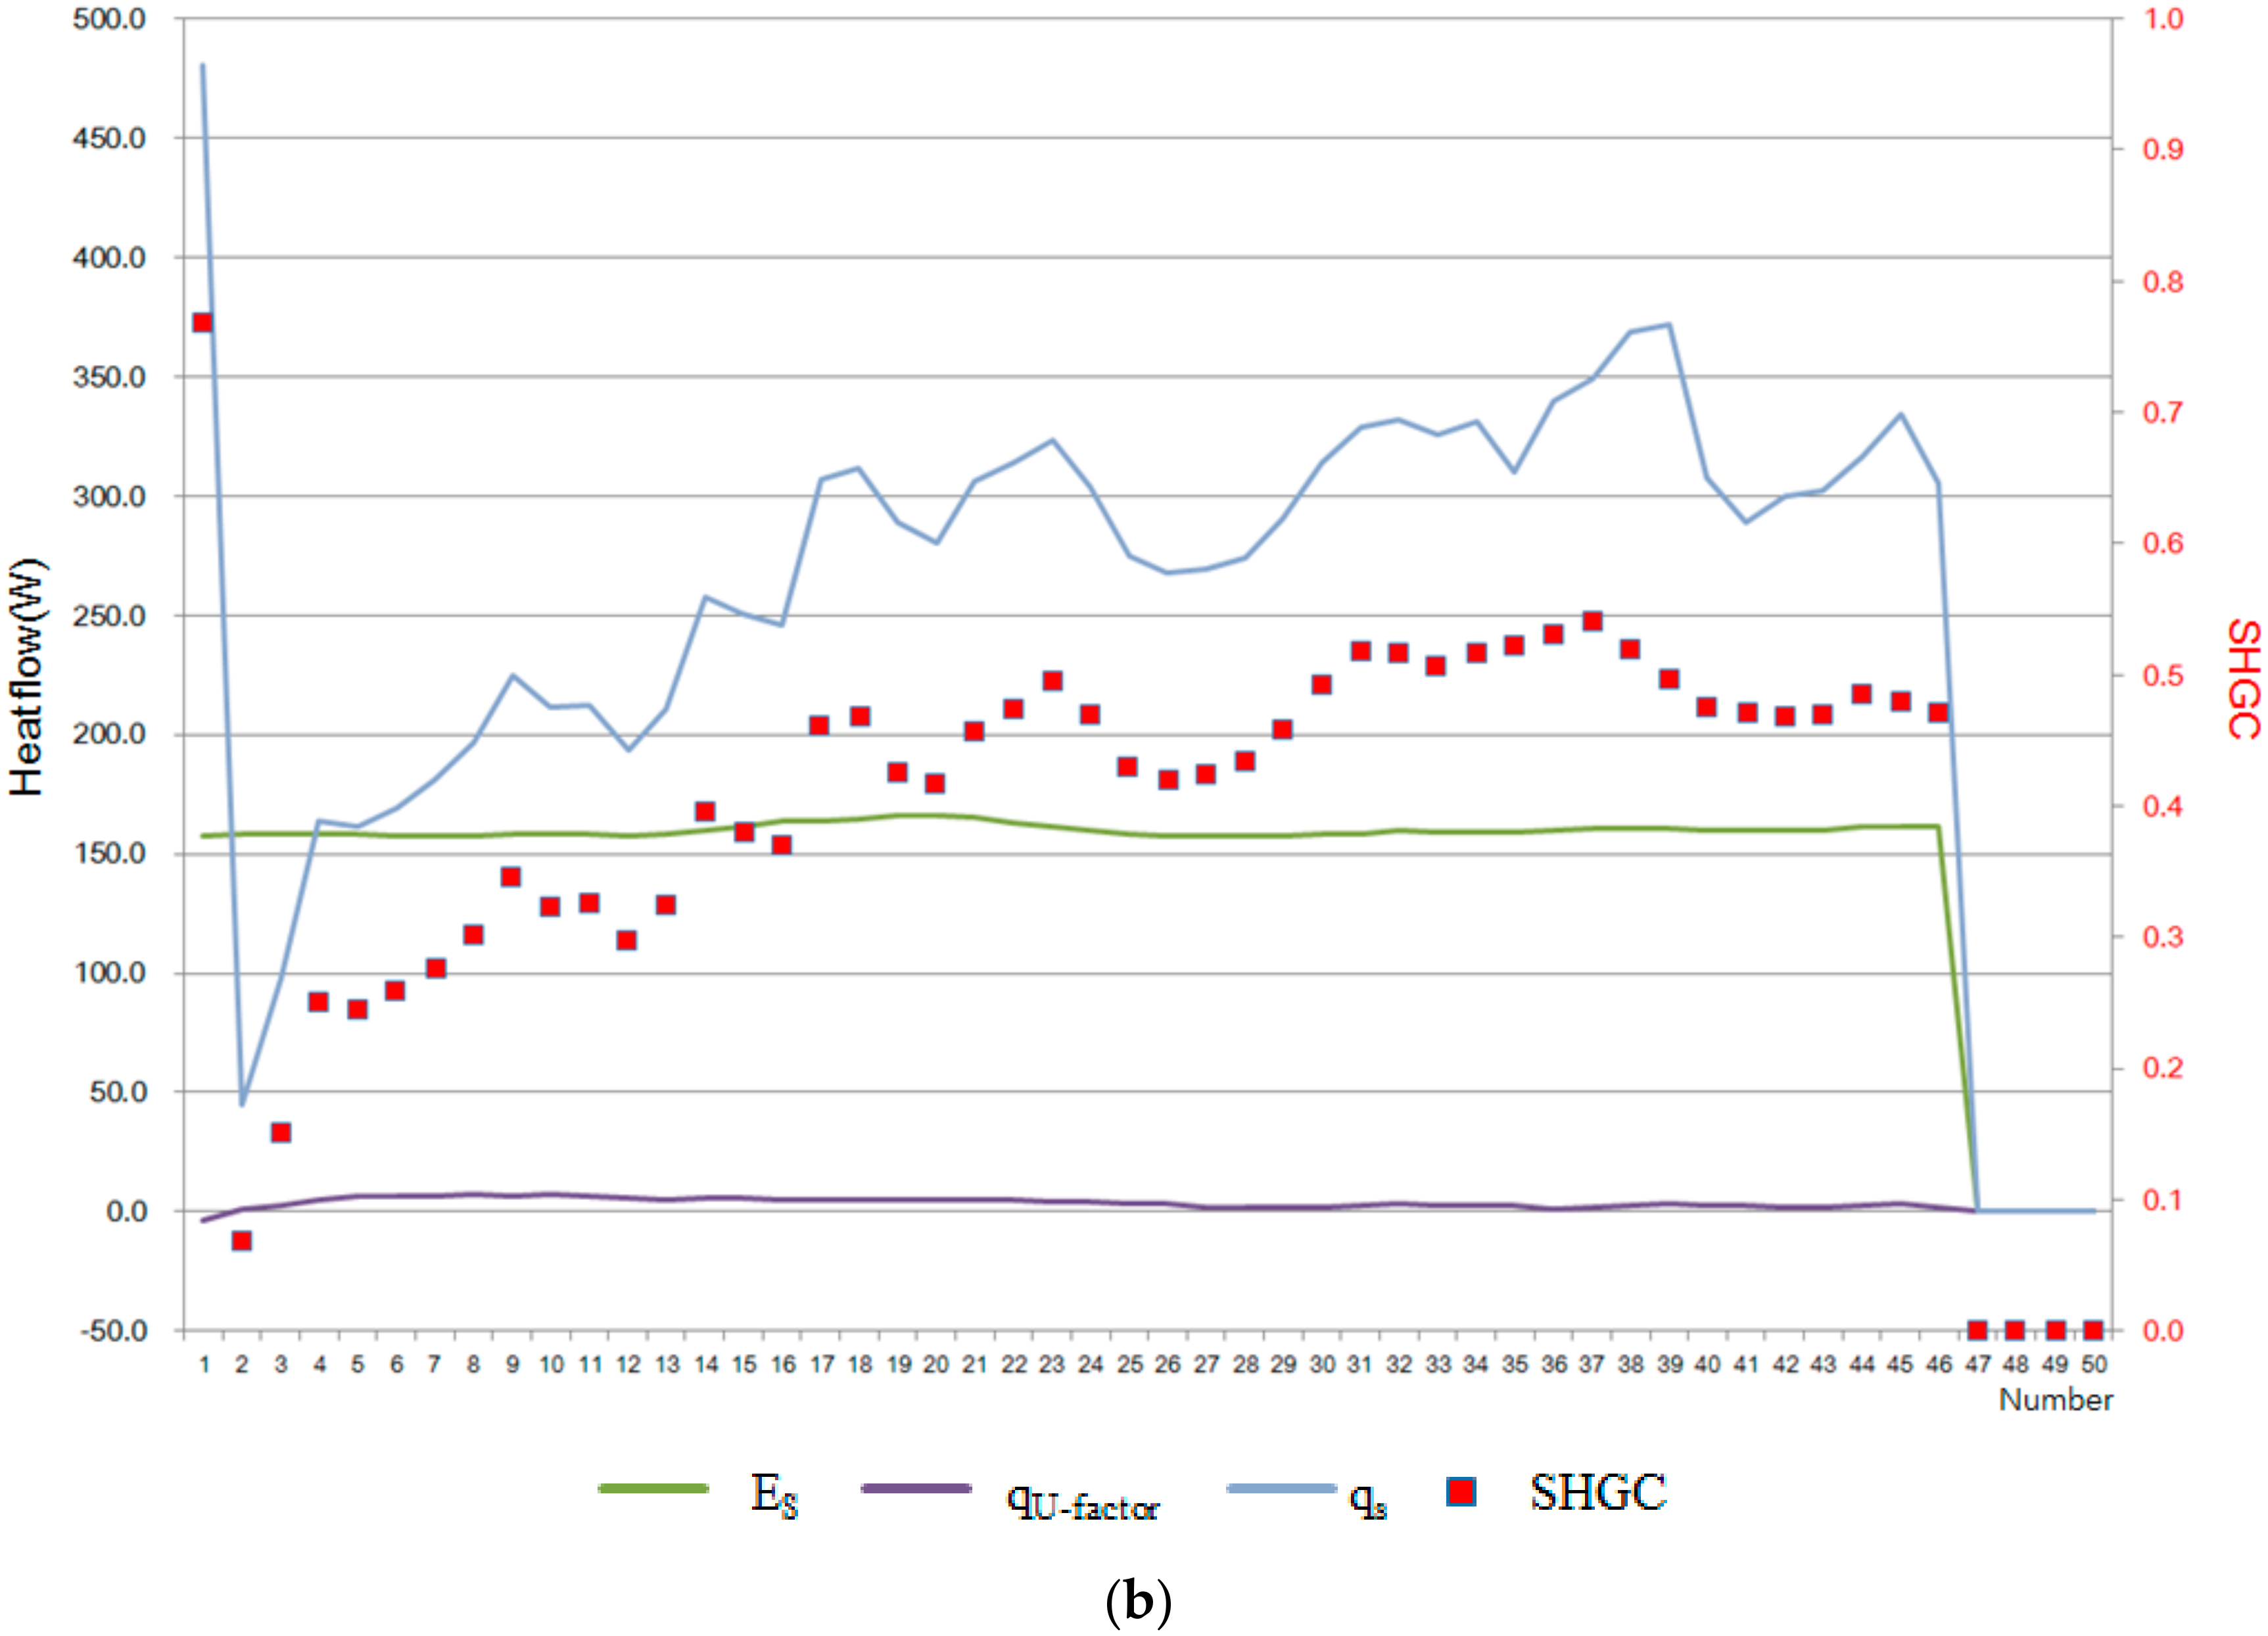
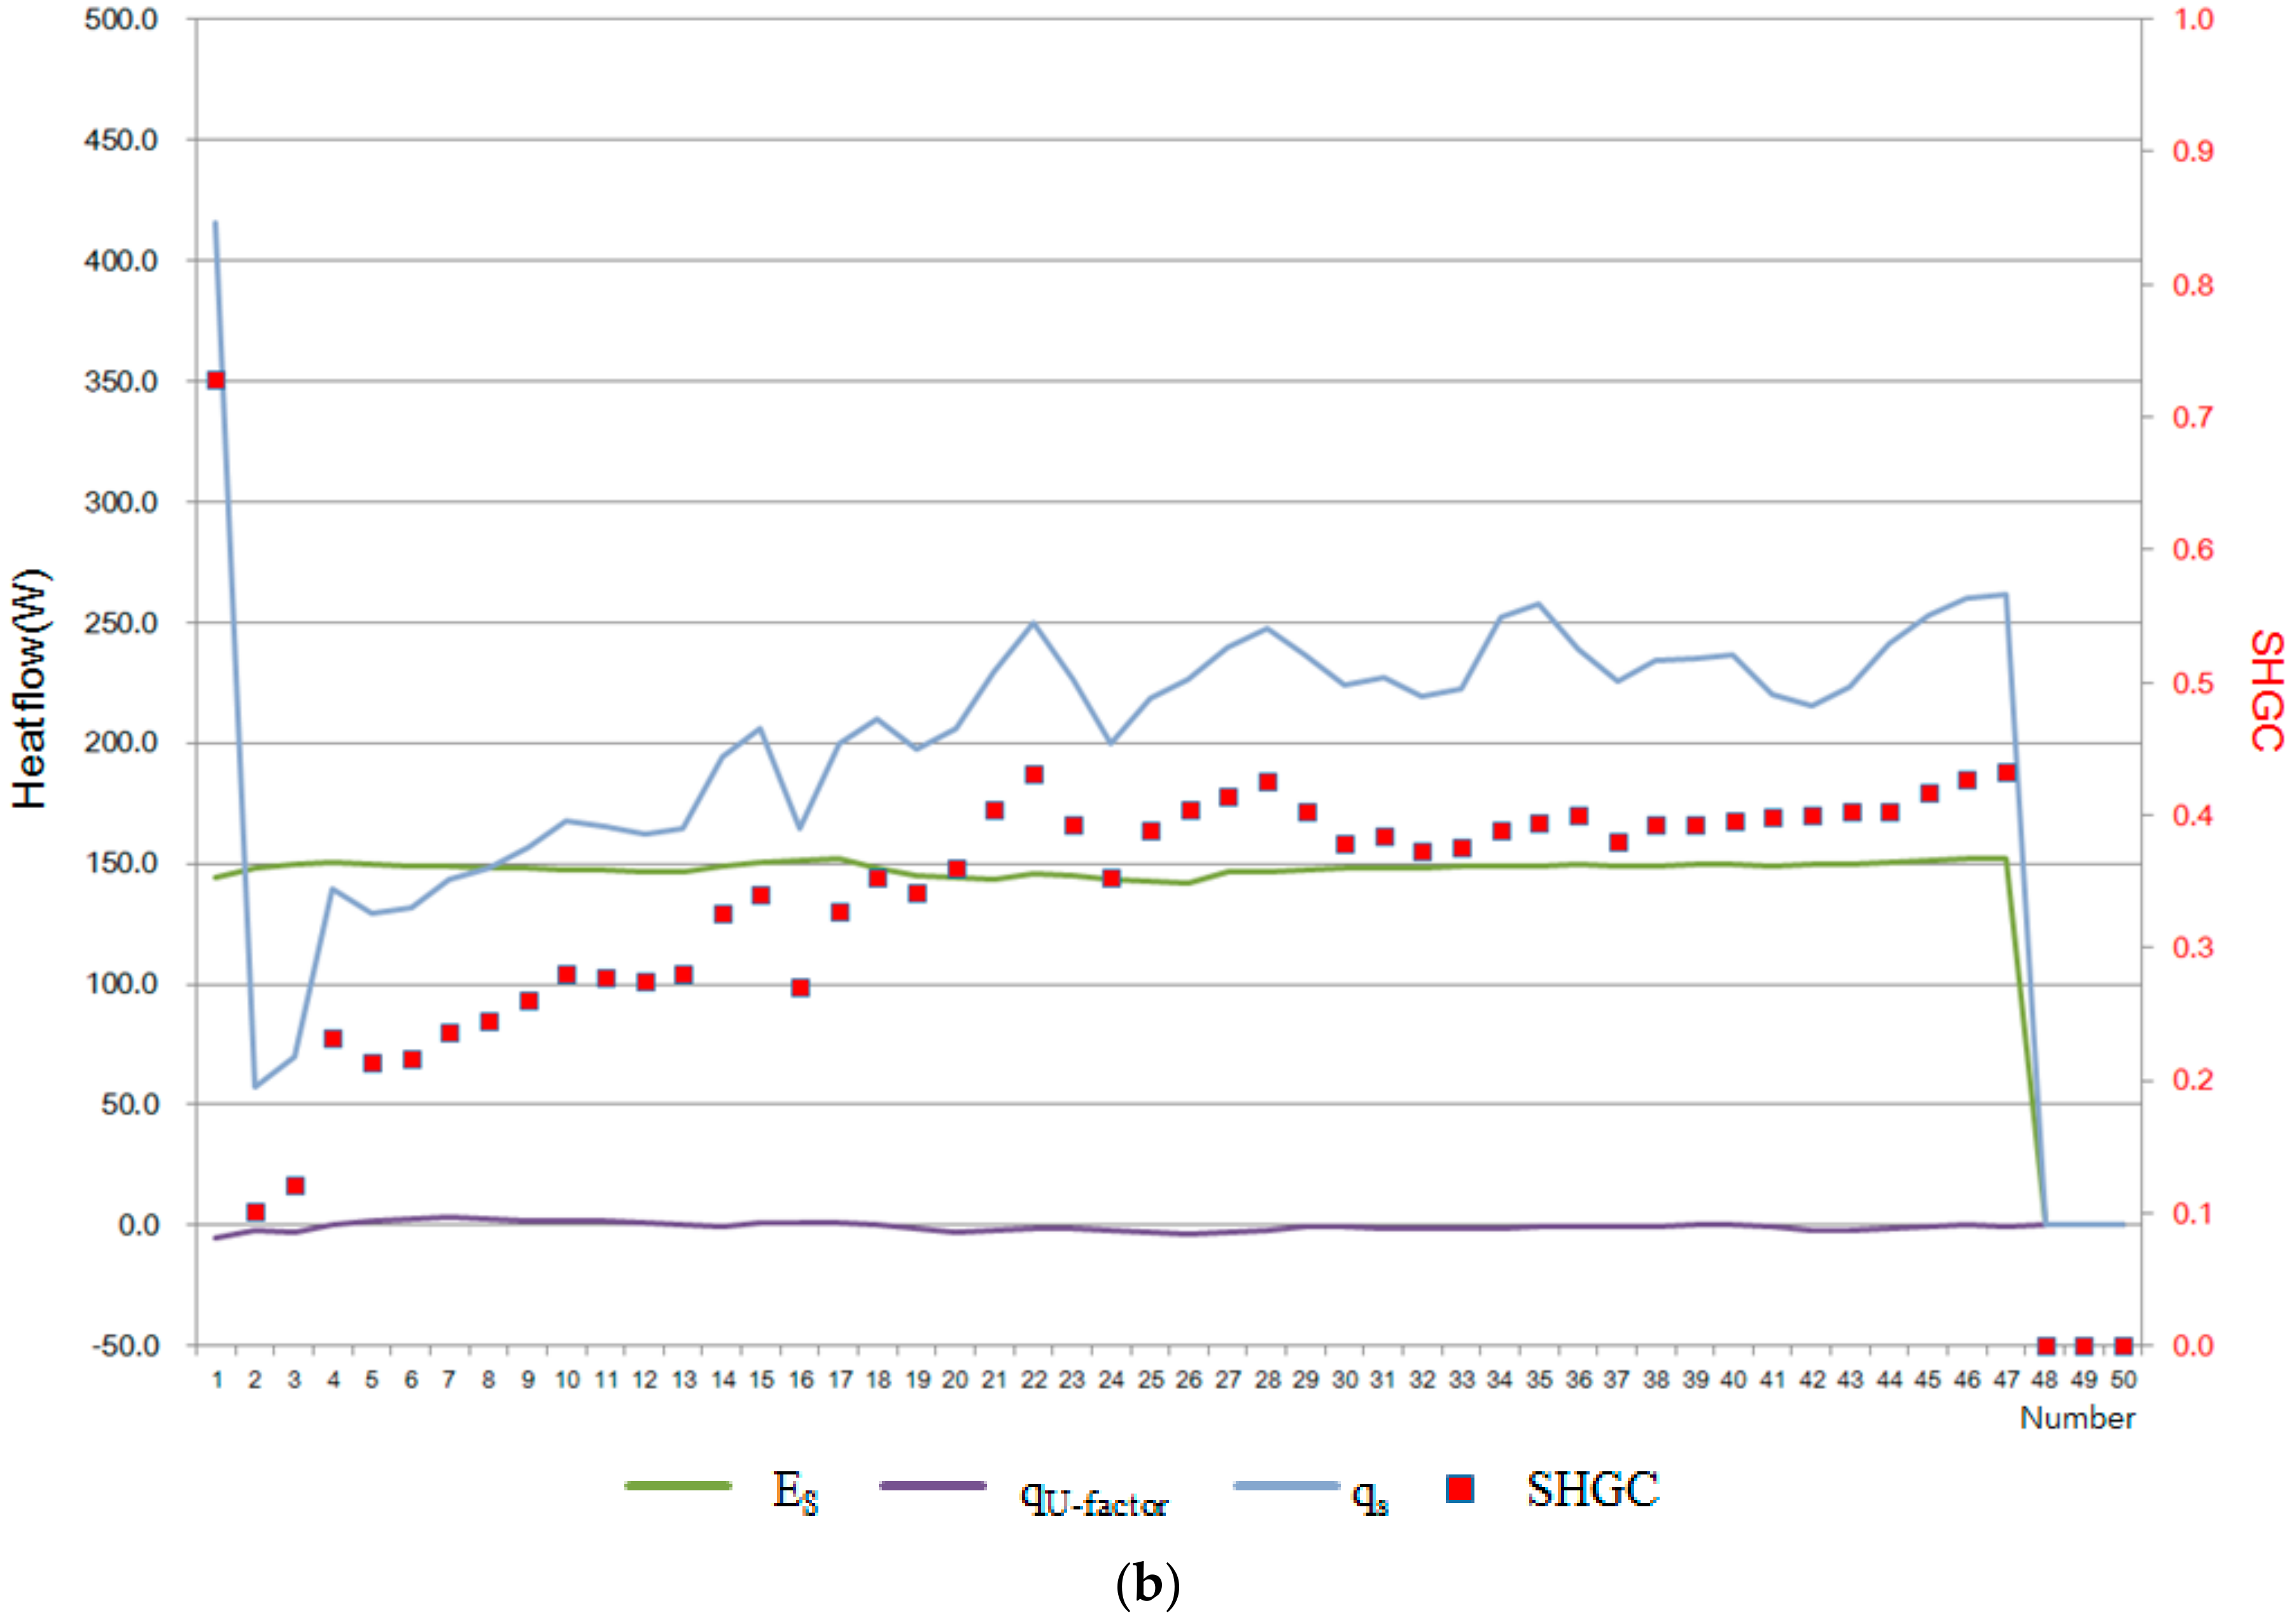
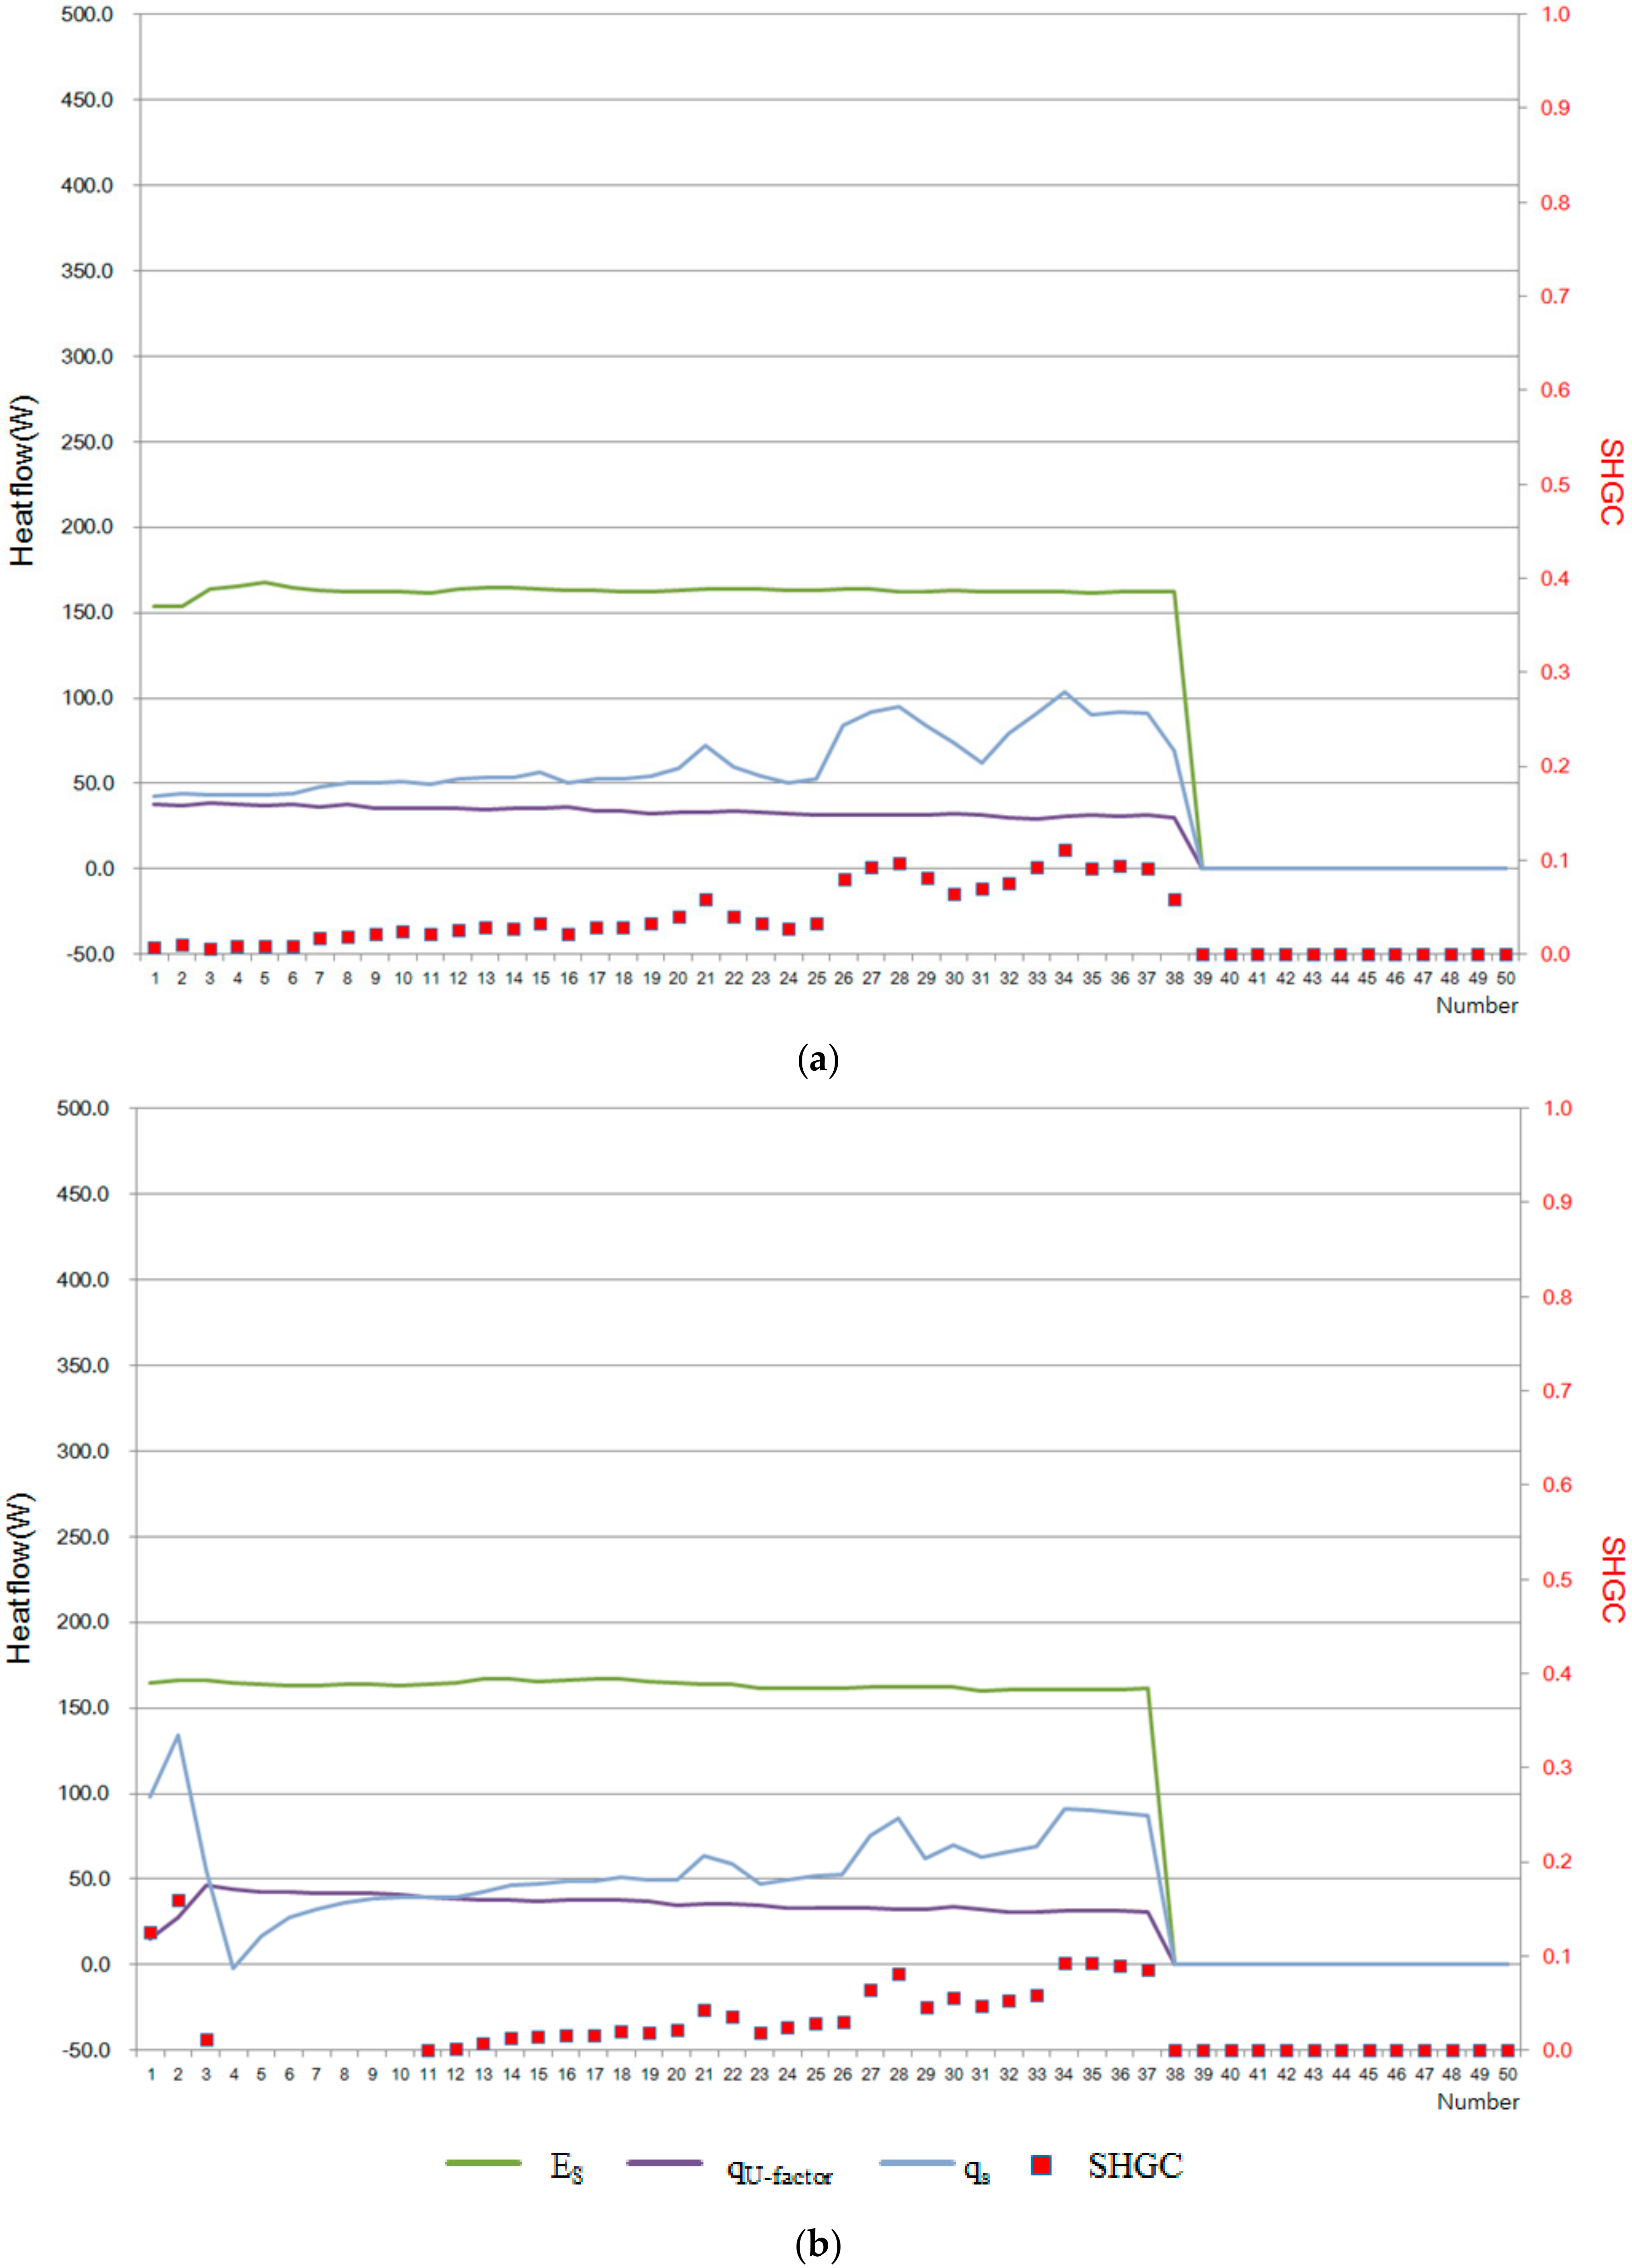
The results of SHGC values for each case and a graph of values applied to the calculation are shown in Figure 7 and Figure 8 and Table 4. The SHGC values are calculated by measuring the elements measured for the SHGC value at one-minute intervals, averaging the values for 10 min every one minute, and then averaging the values again at 50-min intervals. The SHGC value when it is judged that the steady state has been reached is calculated according to the steady state determination standard in Section 3.1. The X-axis in Figure 7 and Figure 8 are the order of the measurement values, and one number means the average value for about one hour.
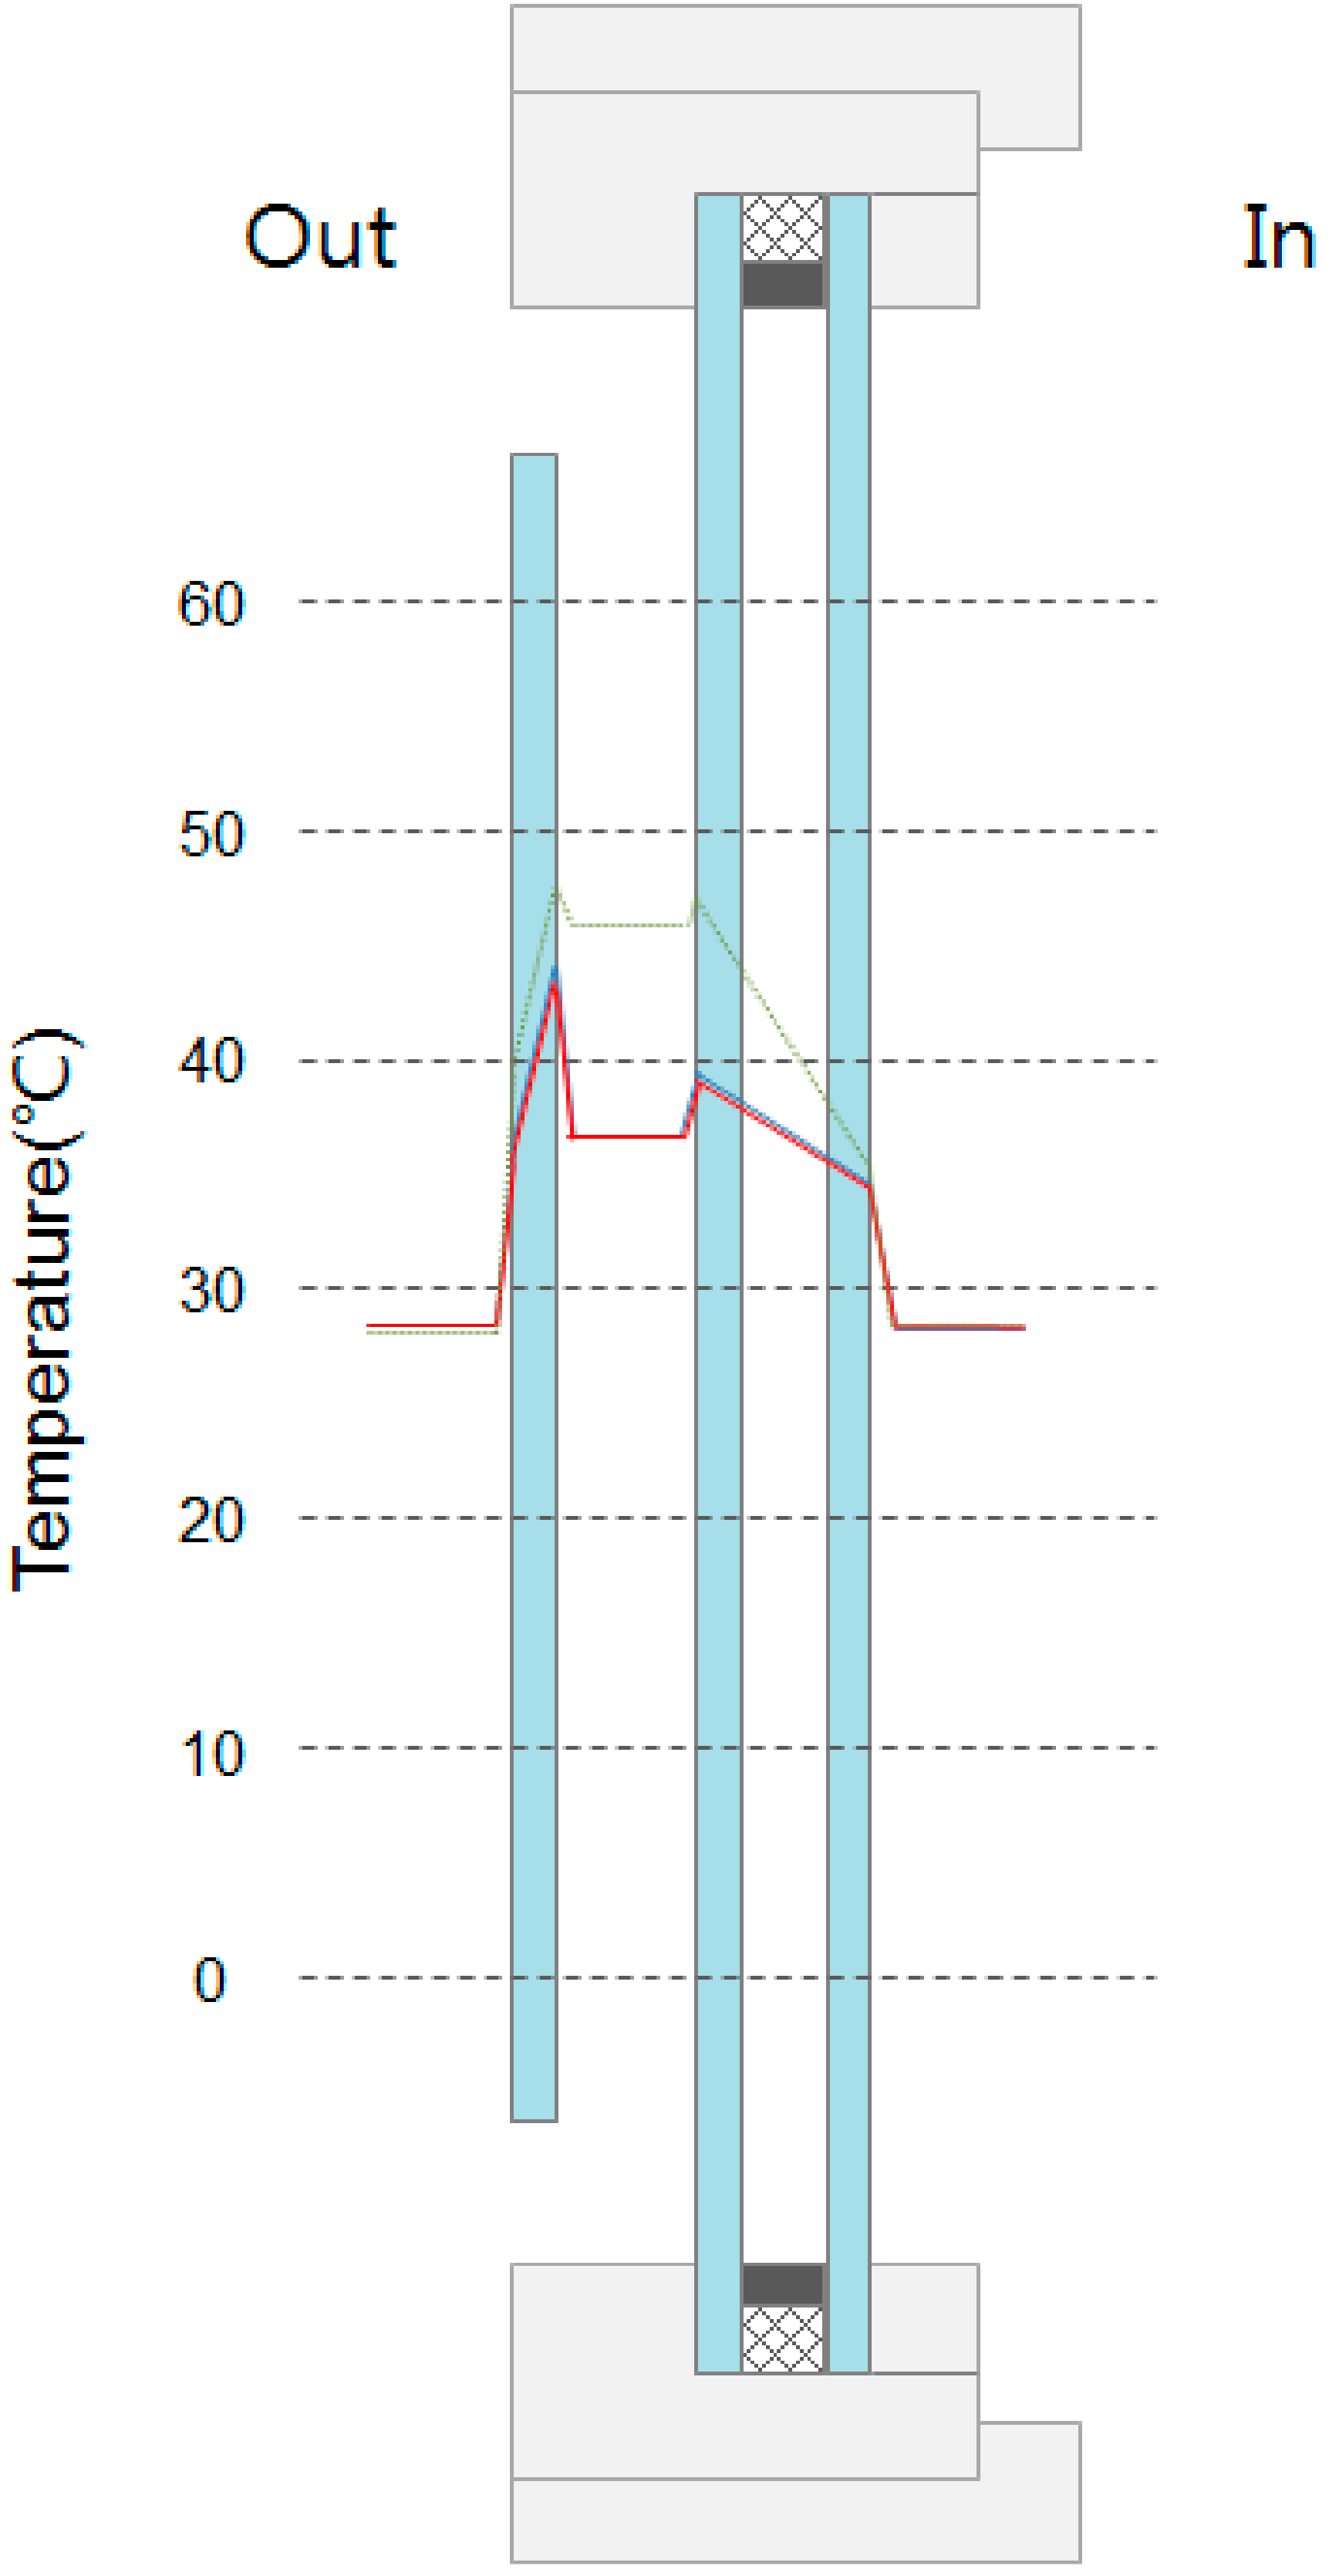
In Case A, when the air cavity was ventilated, a temperature inside the cavity was higher than that without ventilation. A temperature difference inside the air cavity was around 10 K with and without ventilation. The air velocity in the 20 mm air cavity was about 0.3 m/s.
The SHGC in Case A was around 0.46 without ventilation in the air cavity, and around 0.38 with ventilation, indicating the reduction effect on SHGC by about 28% through ventilation. As a result, the selectivity (ratio of visible light transmittance to SHGC) that was calculated in consideration of visible light transmittance (the verified value using the Window 7.4 simulation tool (Lawrence Berkeley National Laboratory, Berkeley, CA, USA) instead of measured value) was increased by about 20% from 0.63 to 0.76.
3.3. Experiment Results of Case B
In Case B, for each case, surface temperature at the window and air temperature in the air cavity were also measured according to whether ventilation at the air cavity is available or not. Each case had three or more measurements, and the cases that converged to the steady state were analyzed. The measurement results of temperature are presented in Table 5 and Figure 9.
In Case B, the inner glass consisted of reflective glass and low-e glass. When the air cavity was ventilated, the temperature inside the cavity was lower than that without ventilation. A temperature difference inside the air cavity was around 4 K with and without ventilation.
Due to the characteristic of reflective glass that absorbs and emits more solar heat than reflects and transmits the solar heat, a temperature inside the air cavity was increased more when the air cavity was not ventilated.
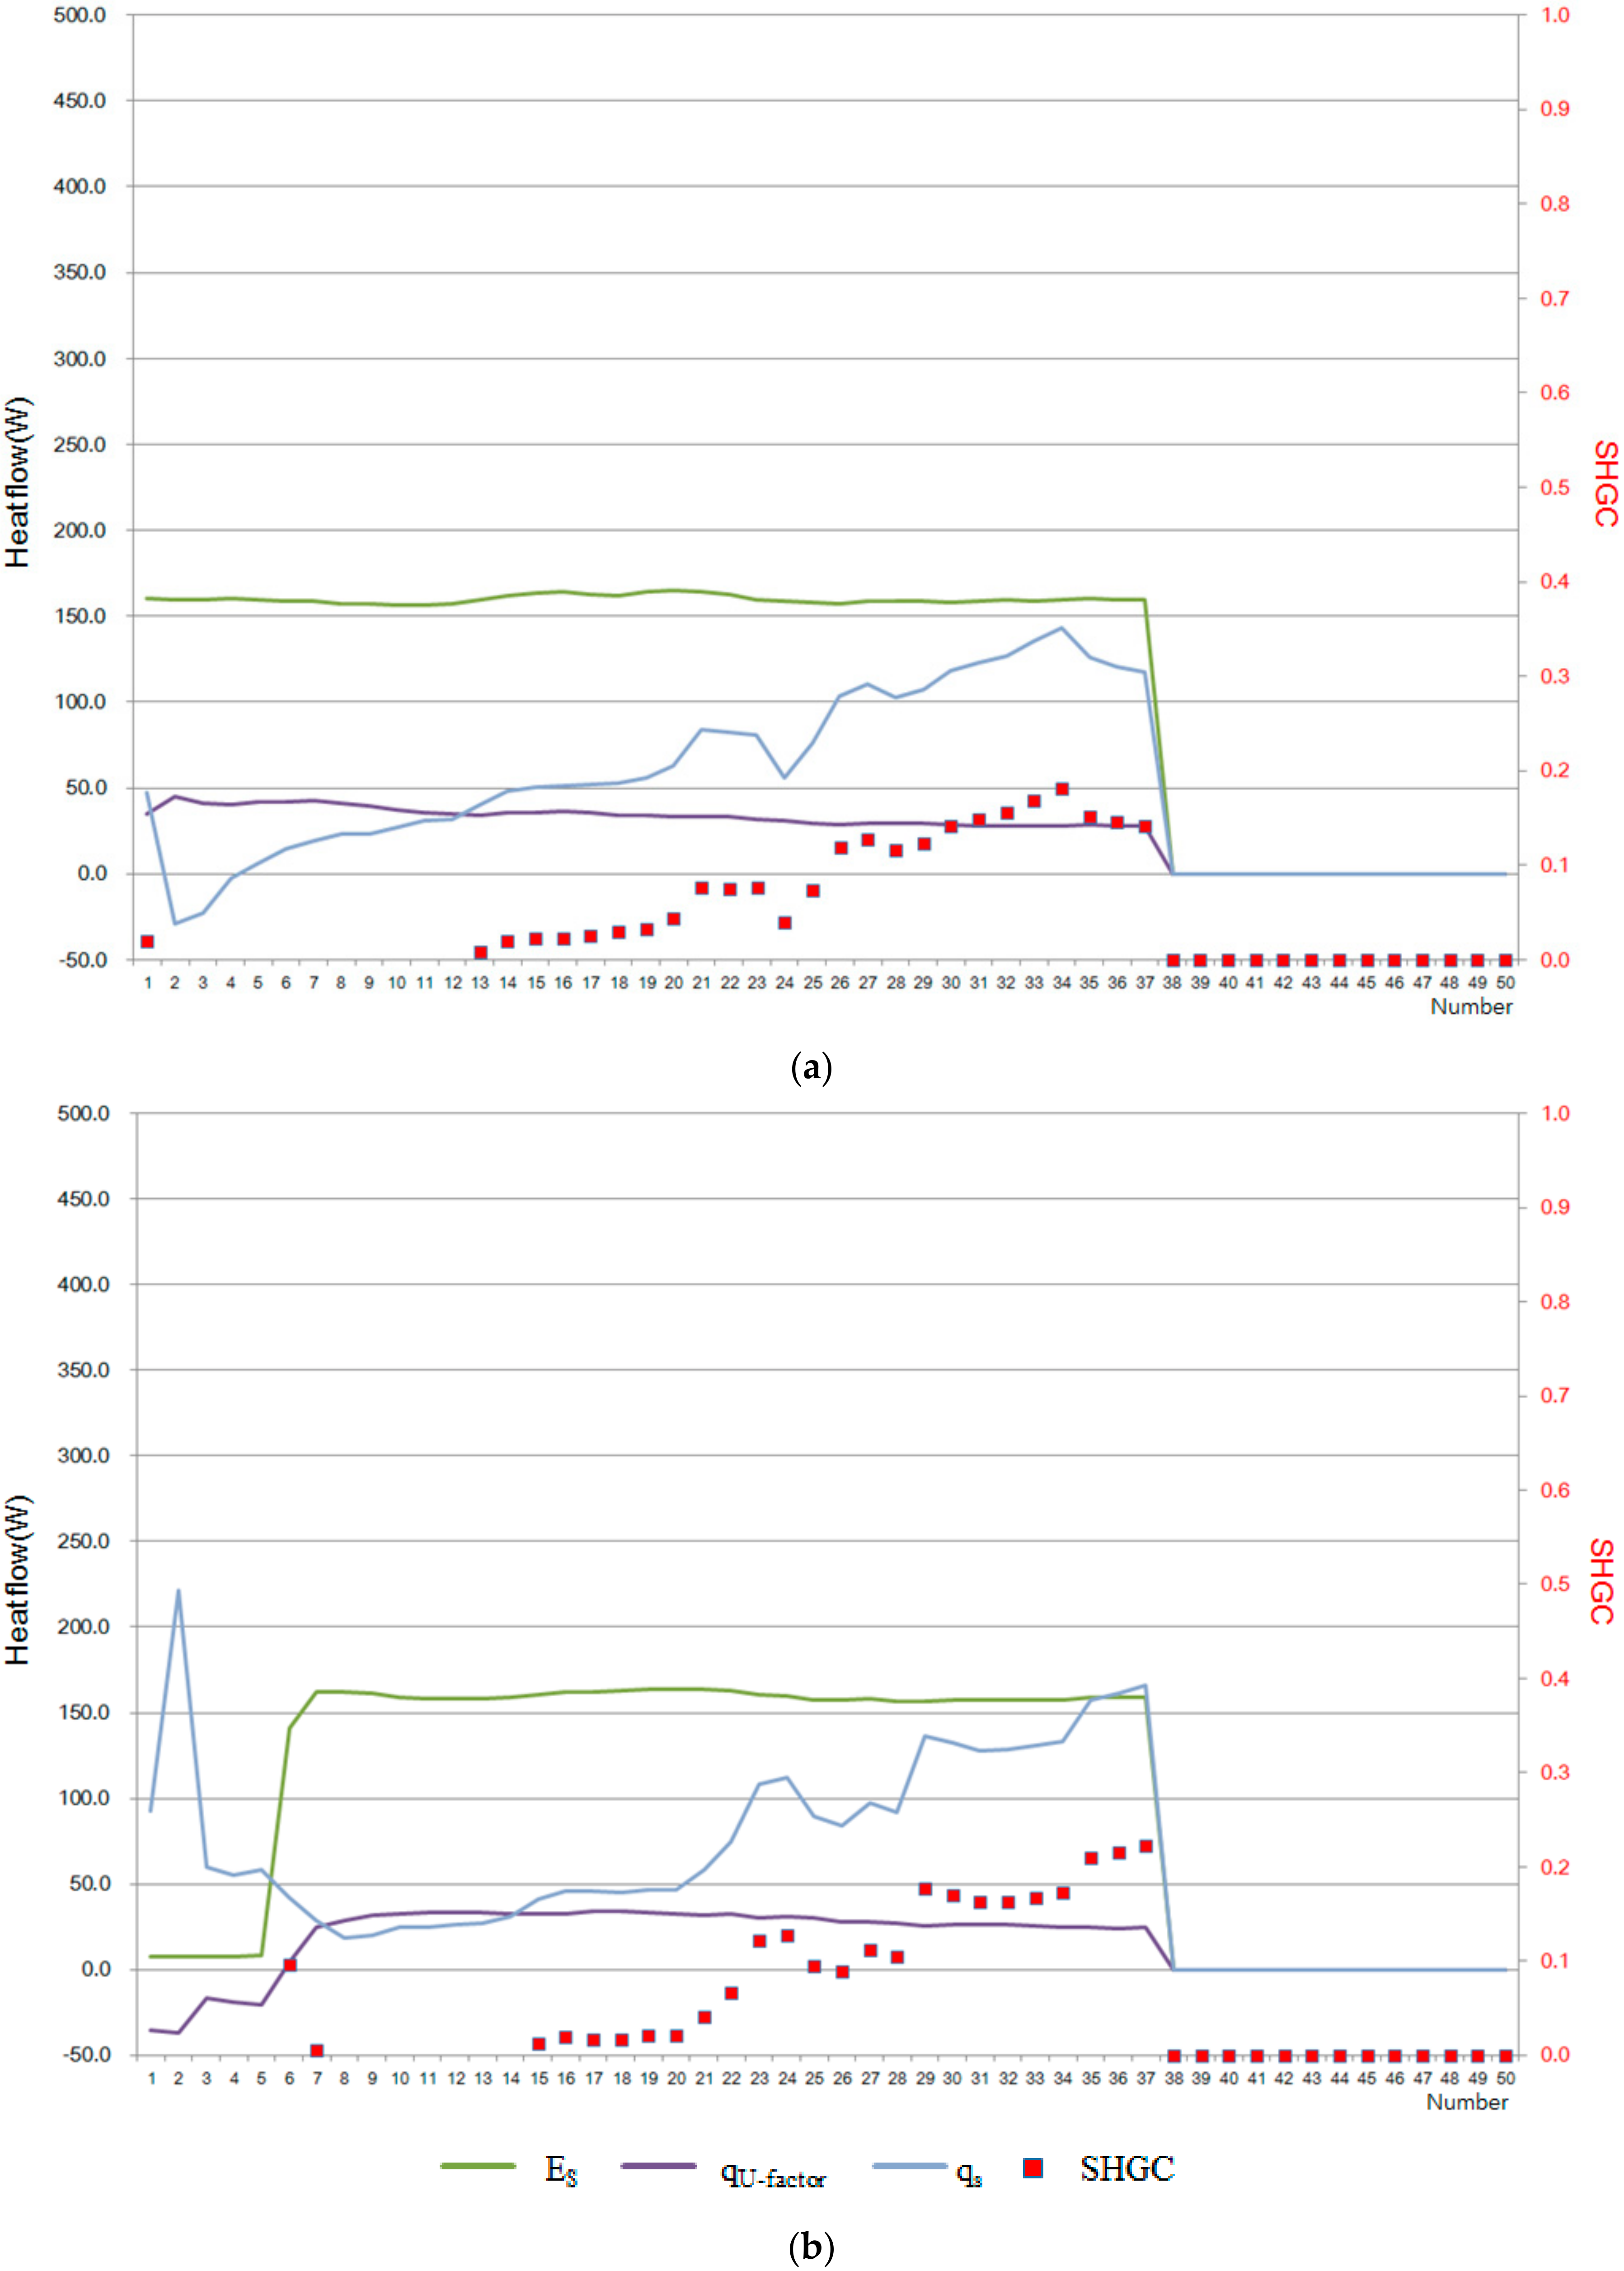
The results of SHGC values for each case and a graph of values applied to the calculation are shown in Figure 10 and Figure 11 and Table 6. The SHGC values are calculated by measuring the elements measured for the SHGC value at one-minute intervals, averaging the values for 10 min every one minute, and then averaging the values again at 50-min intervals. The SHGC value when it is judged that the steady state has been reached is calculated according to the steady state determination standard in Section 3.1. The X-axis in Figure 10 and Figure 11 is the order of the measurement values, and one number represents the average value for about one hour.
The SHGC in Case B was around 0.17 without ventilation in the air cavity, and around 0.08 with ventilation, indicating the reduction effect on SHGC by about 52.9% through ventilation. At this time, the air velocity in the 20 mm air cavity was about 0.3 m/s.
Furthermore, when selectivity (the ratio of visible light transmittance to SHGC) was calculated in consideration of visible light transmittance (the verified value using the Window 7.4 simulation tool (Lawrence Berkeley National Laboratory, Berkeley, CA, USA) instead of the measured value), it was increased by about 114% through ventilation, which maintained the comfortable indoor light environment while reducing cooling energy significantly.
4. Outdoor Test Cell Experiment
4.1. Overview
The test cell experiment exposed to the outdoor was conducted in the performance lab in the technical research center of the K Construction Company.
The performance lab was three-story building and the test cell was located in the third floor (Figure 12). It had two rooms for experimental and control groups and its dimension were: width = 2870 mm, depth = 4600 mm, and height = 2300 mm. The size of the window used in the experiment for the two groups was width = 2870 mm and 2300 mm, respectively.
The windows to be assessed used triple low-e glass (thermal transmittance 1.22 W/m2·K (6 mm clear glass + 12 mm air + 6 mm clear glass + 12 mm air + 6 mm low-e glass)) and a ventilated double-skin window (thermal transmittance 1.38 W/m2·K, with 20 mm air cavity ventilated (6 mm clear single glass + 20 mm air cavity + 6 mm clear glass + 12 mm air + 6 mm low-e glass)) in the control group.
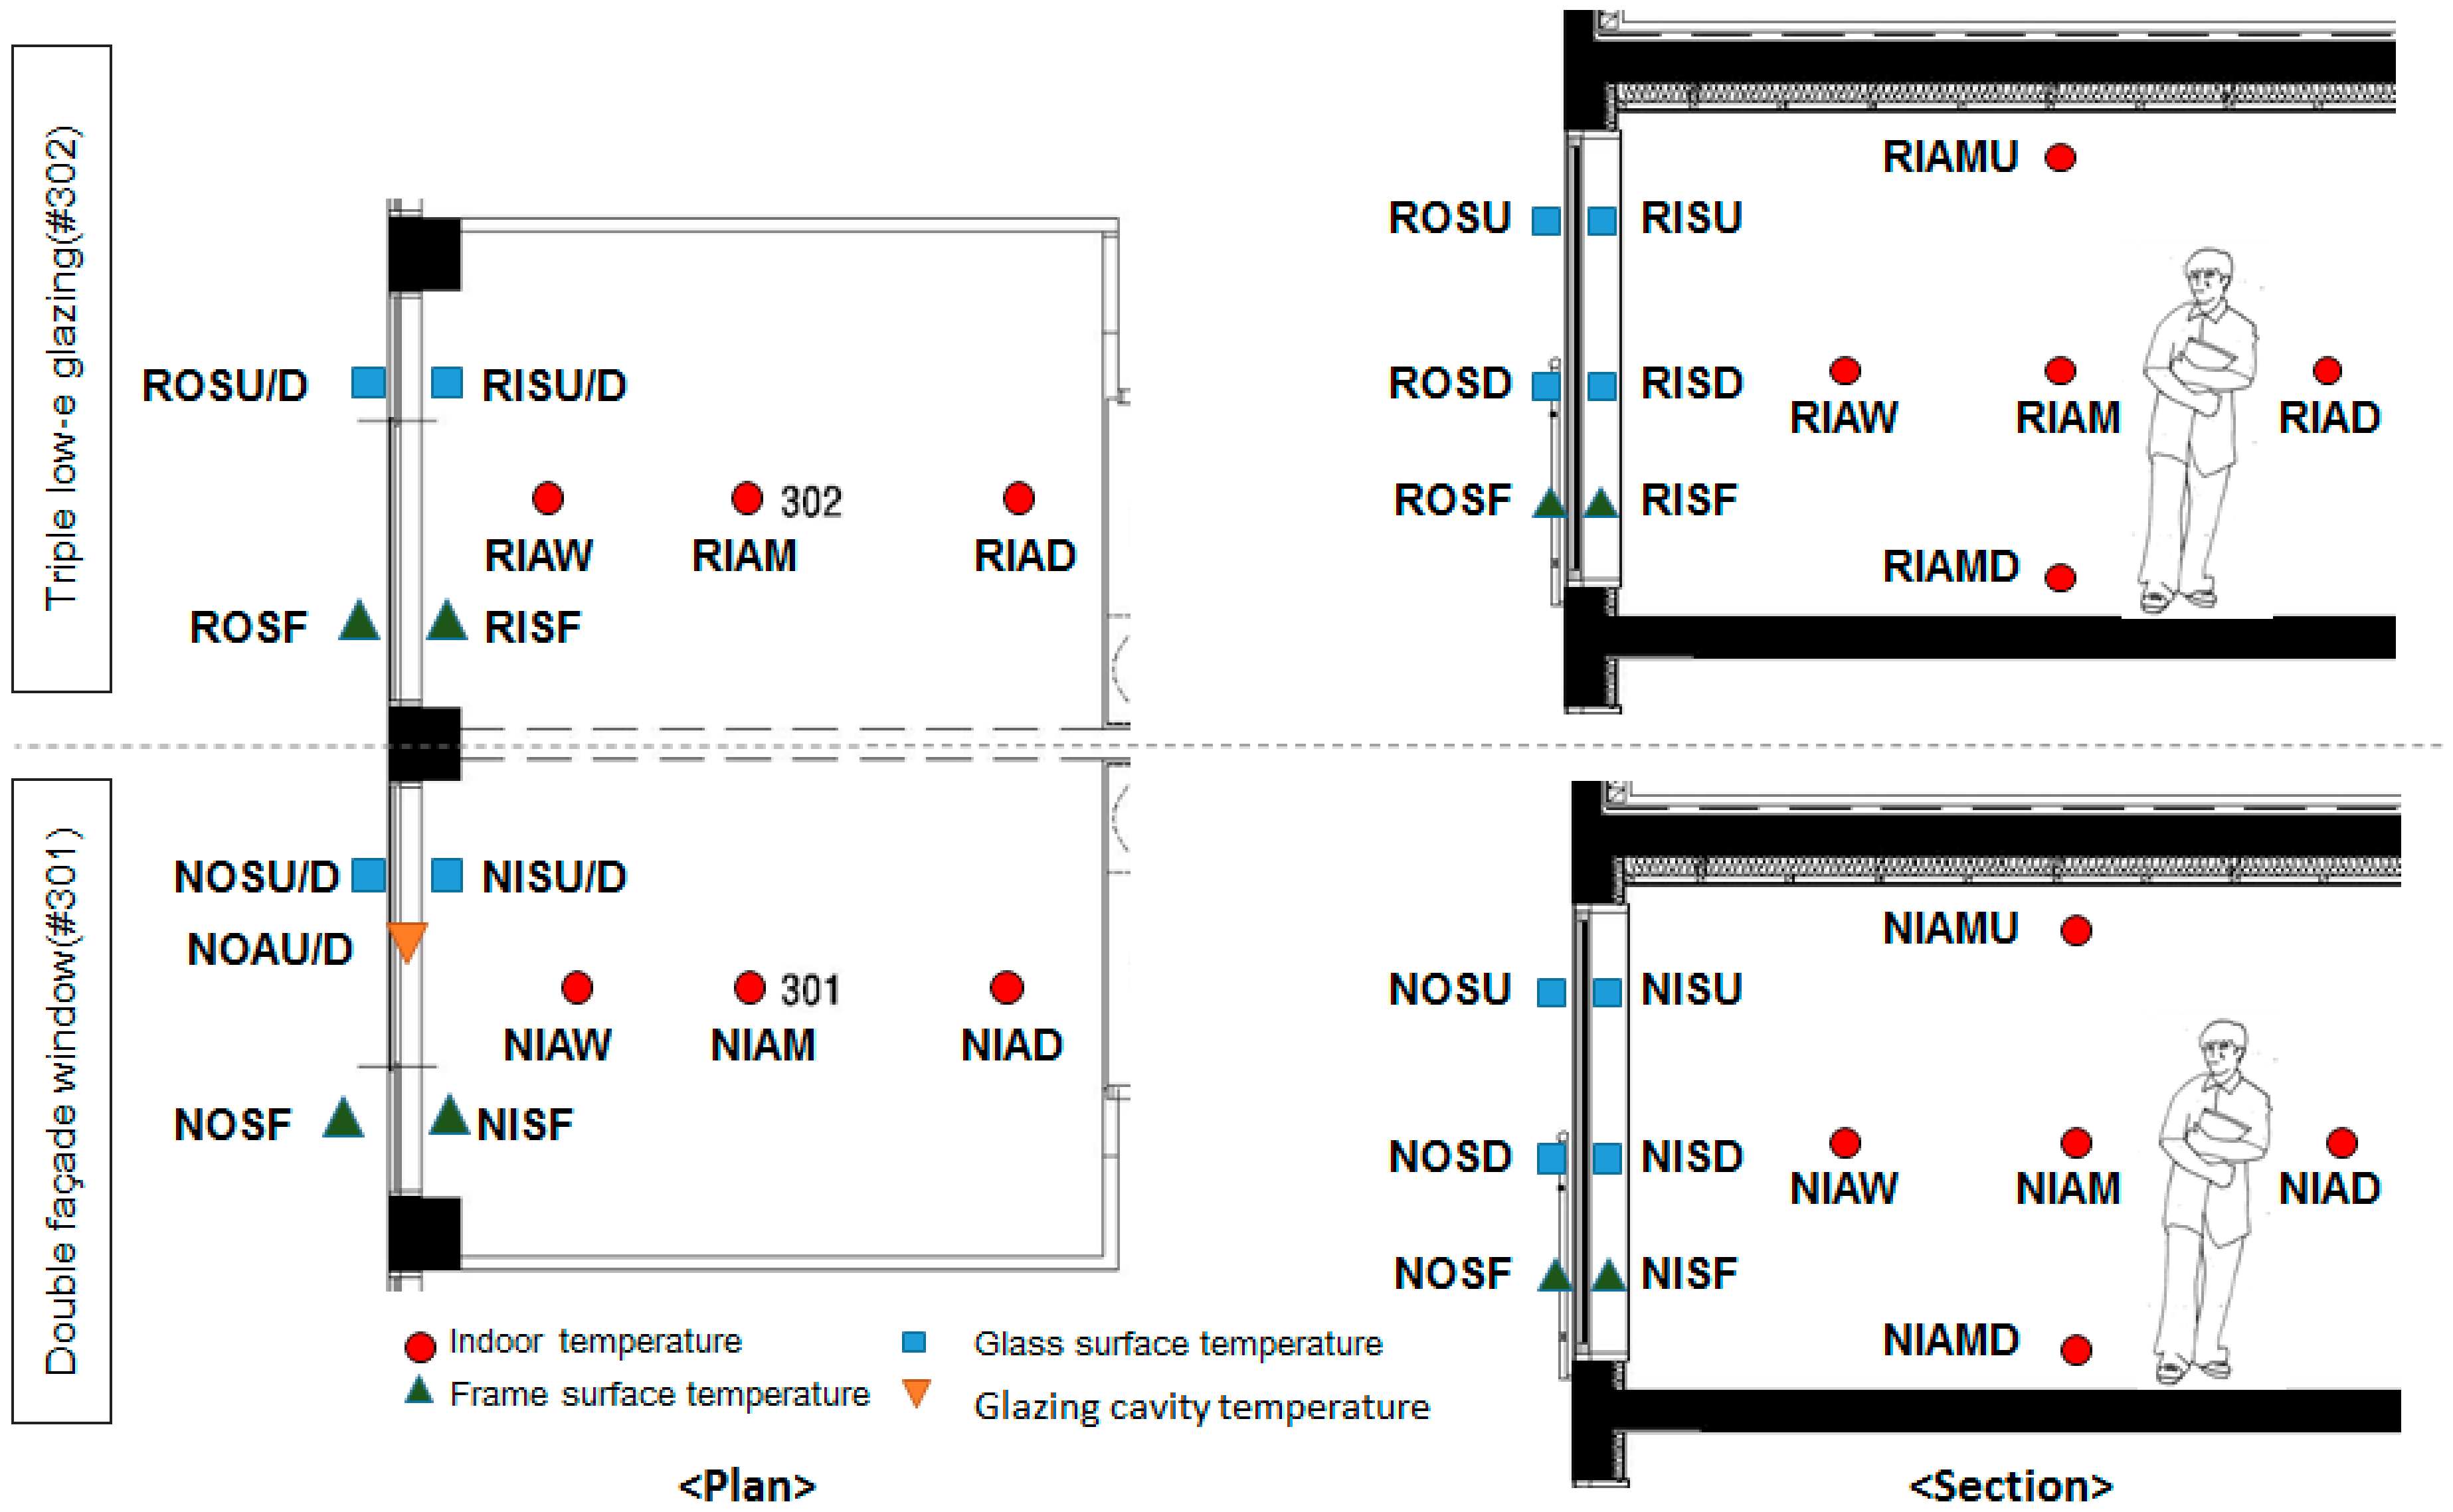
The outdoor temperature was measured around the outer wall of the test cell, and temperatures were measured at two positions on the outer surface of the window, two positions inside the air cavity, and two positions inside of the window. Furthermore, air temperatures inside were measured at five positions and a mean value was calculated, thereby determining the effect of insolation introduced through the window on the indoor temperature. Moreover, cooling requirements were analyzed through power consumption, thereby evaluating the performance of the cooling energy reduction in double-skin façade window with 20 mm air cavity proposed in this study. Finally, indoor comfort PMV was measured to analyze the effect on indoor comfort. PMV (Predicted Mean Vote) predicts the mean comfort response of a larger group of people on the following 7-point thermal sensation scale. +3: hot, +2: warm, +1: slightly warm, 0: neutral, −1: slightly cool, −2: cool, −3: cold.
The overview of the window used in the experiment is presented in Table 7, and the experimental cases divided by operation mode for each window type are presented in Table 8.
The measurement was conducted at mid-May when summer just started and from mid-June to early July during summer for 25 days.
Table 9 shows the measurement equipment used in the experiment.
4.2. Temperature Evaluation
4.2.1. Indoor Temperature and Power Consumption
The mean indoor temperature and cumulative power consumption for each case are presented in Table 10.
The measurement results of Case I measured during May showed that the mean temperature was 0.6 K and the peak temperature was 0.9 K lower with ventilation in the air cavity, even though the heat transmittance was relatively high, than that without ventilation in the air cavity. The measurement results of Case II during June and July showed that the mean temperature was 0.3 K and the peak temperature was 0.2 K lower with ventilation in the air cavity than that without ventilation in the air cavity.
Considering the error of the temperature measurement equipment, it can be said that there is almost no difference. However, the power consumption difference of 3% between II-1 and II-2 can be considered to mean that air cavity ventilation has the effect of reducing solar heat gain.
4.2.2. PMV Values
The measurement results of indoor thermal comfort for each experimental case are presented in Table 11.
The measurement results of Case I showed that a mean and peak PMVs were lower by 0.10 and 0.24, respectively, with ventilation in the air cavity than that without ventilation. The measurement results of Case II showed that a mean and peak PMVs were lower by 0.01 and 0.00, respectively, with ventilation in the air cavity than that without ventilation. The reason for the lower change in PMV in Case II was due to the control of the indoor temperature.
5. Conclusions
This study proposed a double-skin façade window with a 20 mm air cavity, and assumed that insolation inflow indoors would be reduced through ventilation in the air cavity. To achieve this, windows were installed in chambers in the artificial solar lab and real building test cells and their performances were evaluated.
- (1)
- The artificial solar lab test result showed that the SHGC in Case A was around 0.46 without ventilation in the air cavity, and around 0.38 with ventilation, indicating the reduction effect on SHGC by about 28% through ventilation. The SHGC in Case B was around 0.17 without ventilation in the air cavity, and around 0.08 with ventilation, indicating the reduction effect on SHGC by about 52.9% through ventilation.
- (2)
- In the test cell experiment exposed to the outdoors, the measurement results of Case I showed that a mean temperature was 0.6 K and the peak temperature was 0.9 K lower with ventilation in the air cavity than that without ventilation in the air cavity. The measurement results of Case II in the experiment showed that a mean temperature was 0.3 K and the peak temperature was 0.2 K lower with ventilation in the air cavity than that without ventilation in the air cavity. Furthermore, this study verified that cumulative power consumption was reduced by around 3% through ventilation in the air cavity and the effect on cooling energy reduction in actual buildings can be obtained.
Acknowledgments
This research was supported by the Research Grant from KICT through the Korea Agency for Infrastructure Technology Advancement funded by the Ministry of Land, Infrastructure and Transport of the Korean government (project No. 17TBIP-C111666-02).
Author Contributions
Bokyoung Koo and Keonho Lee designed the artificial solar lab experiments and analyzed the data; Youngsub An and Kyudong Lee conceived and designed the outdoor test cell experiments and analyzed the data; Bokyoung Koo wrote the paper.
Conflicts of Interest
The authors declare no conflict of interest.
References
- Cho, K.; Cho, D.; Yoo, J. Analysis of solar heat gain coefficients of slim-type double skin window systems using a solar simulator and a simulation. J. Archit. Inst. Korea Struct. Constr. 2017, 33, 53–60. [Google Scholar]
- Barbosa, S.; Ip, K. Perspectives of double skin facades for naturally ventilated buildings: A review. Renew. Sustain. Energy Rev. 2014, 40, 1019–1029. [Google Scholar] [CrossRef]
- Sanchez, E.; Rolando, A.; Sant, R.; Ayuso, L. Influence of natural ventilation due to buoyancy and heat transfer in the energy efficiency of a double skin façade building. Energy Sustain. Dev. 2016, 33, 139–148. [Google Scholar] [CrossRef]
- Guardo, A.; Coussirat, M.; Egusquize, E.; Alavedra, P.; Castilla, R.A. CFD approach to evaluate the influence of construction and operation parameters on the performance of Active Transparent Facades in Mediterranean climates. Energy Build. 2009, 41, 534–542. [Google Scholar] [CrossRef]
- Perez-Grande, I.; Meseguer, J.; Alonso, G. Influence of glass properties on the performance of double-glazed facades. Appl. Therm. Eng. 2005, 25, 3163–3175. [Google Scholar] [CrossRef]
- Rahmani, B.; Kandar, M.Z.; Rahmani, P. How double skin façade’s air-gap sizes effect on lowering solar heat gain in tropical climate? World Appl. Sci. J. 2012, 18, 774–778. [Google Scholar]
- Radhi, H.; Sharples, S.; Fikiry, F. Will multi-façade systems reduce cooling energy in fully glazed buildings? A Scoping study of UAE buildings. Energy Build. 2013, 56, 179–188. [Google Scholar] [CrossRef]
- Torres, M.; Alavedra, P.; Guzman, A.; Cuerva, E.; Planas, C.; Clemente, R.; Escalona, V. Double skin facades-cavity and exterior openings dimensions for saving energy on Mediterranean climate. In Proceedings of the Building Simulation, Beijing, China, 3–6 September 2007. [Google Scholar]
- Gratia, E.; De Herde, A. Greenhouse effect in double-skin façade. Energy Build. 2007, 39, 199–211. [Google Scholar] [CrossRef]
- NFRC (National Fenestration Rating Council). NFRC 201 Interim Standard Test Method for Measuring the Solar Heat Gain Coefficient of Fenestration Systems Using Calorimetry Hot Box Methods; National Fenestration Rating Council: Greenbelt, MD, USA, 2003. [Google Scholar]
Figure 1.
Concept of solar radiation rate reduction through cavity ventilation: (a) general single skin; and (b) ventilated double skin.
Figure 1.
Concept of solar radiation rate reduction through cavity ventilation: (a) general single skin; and (b) ventilated double skin.
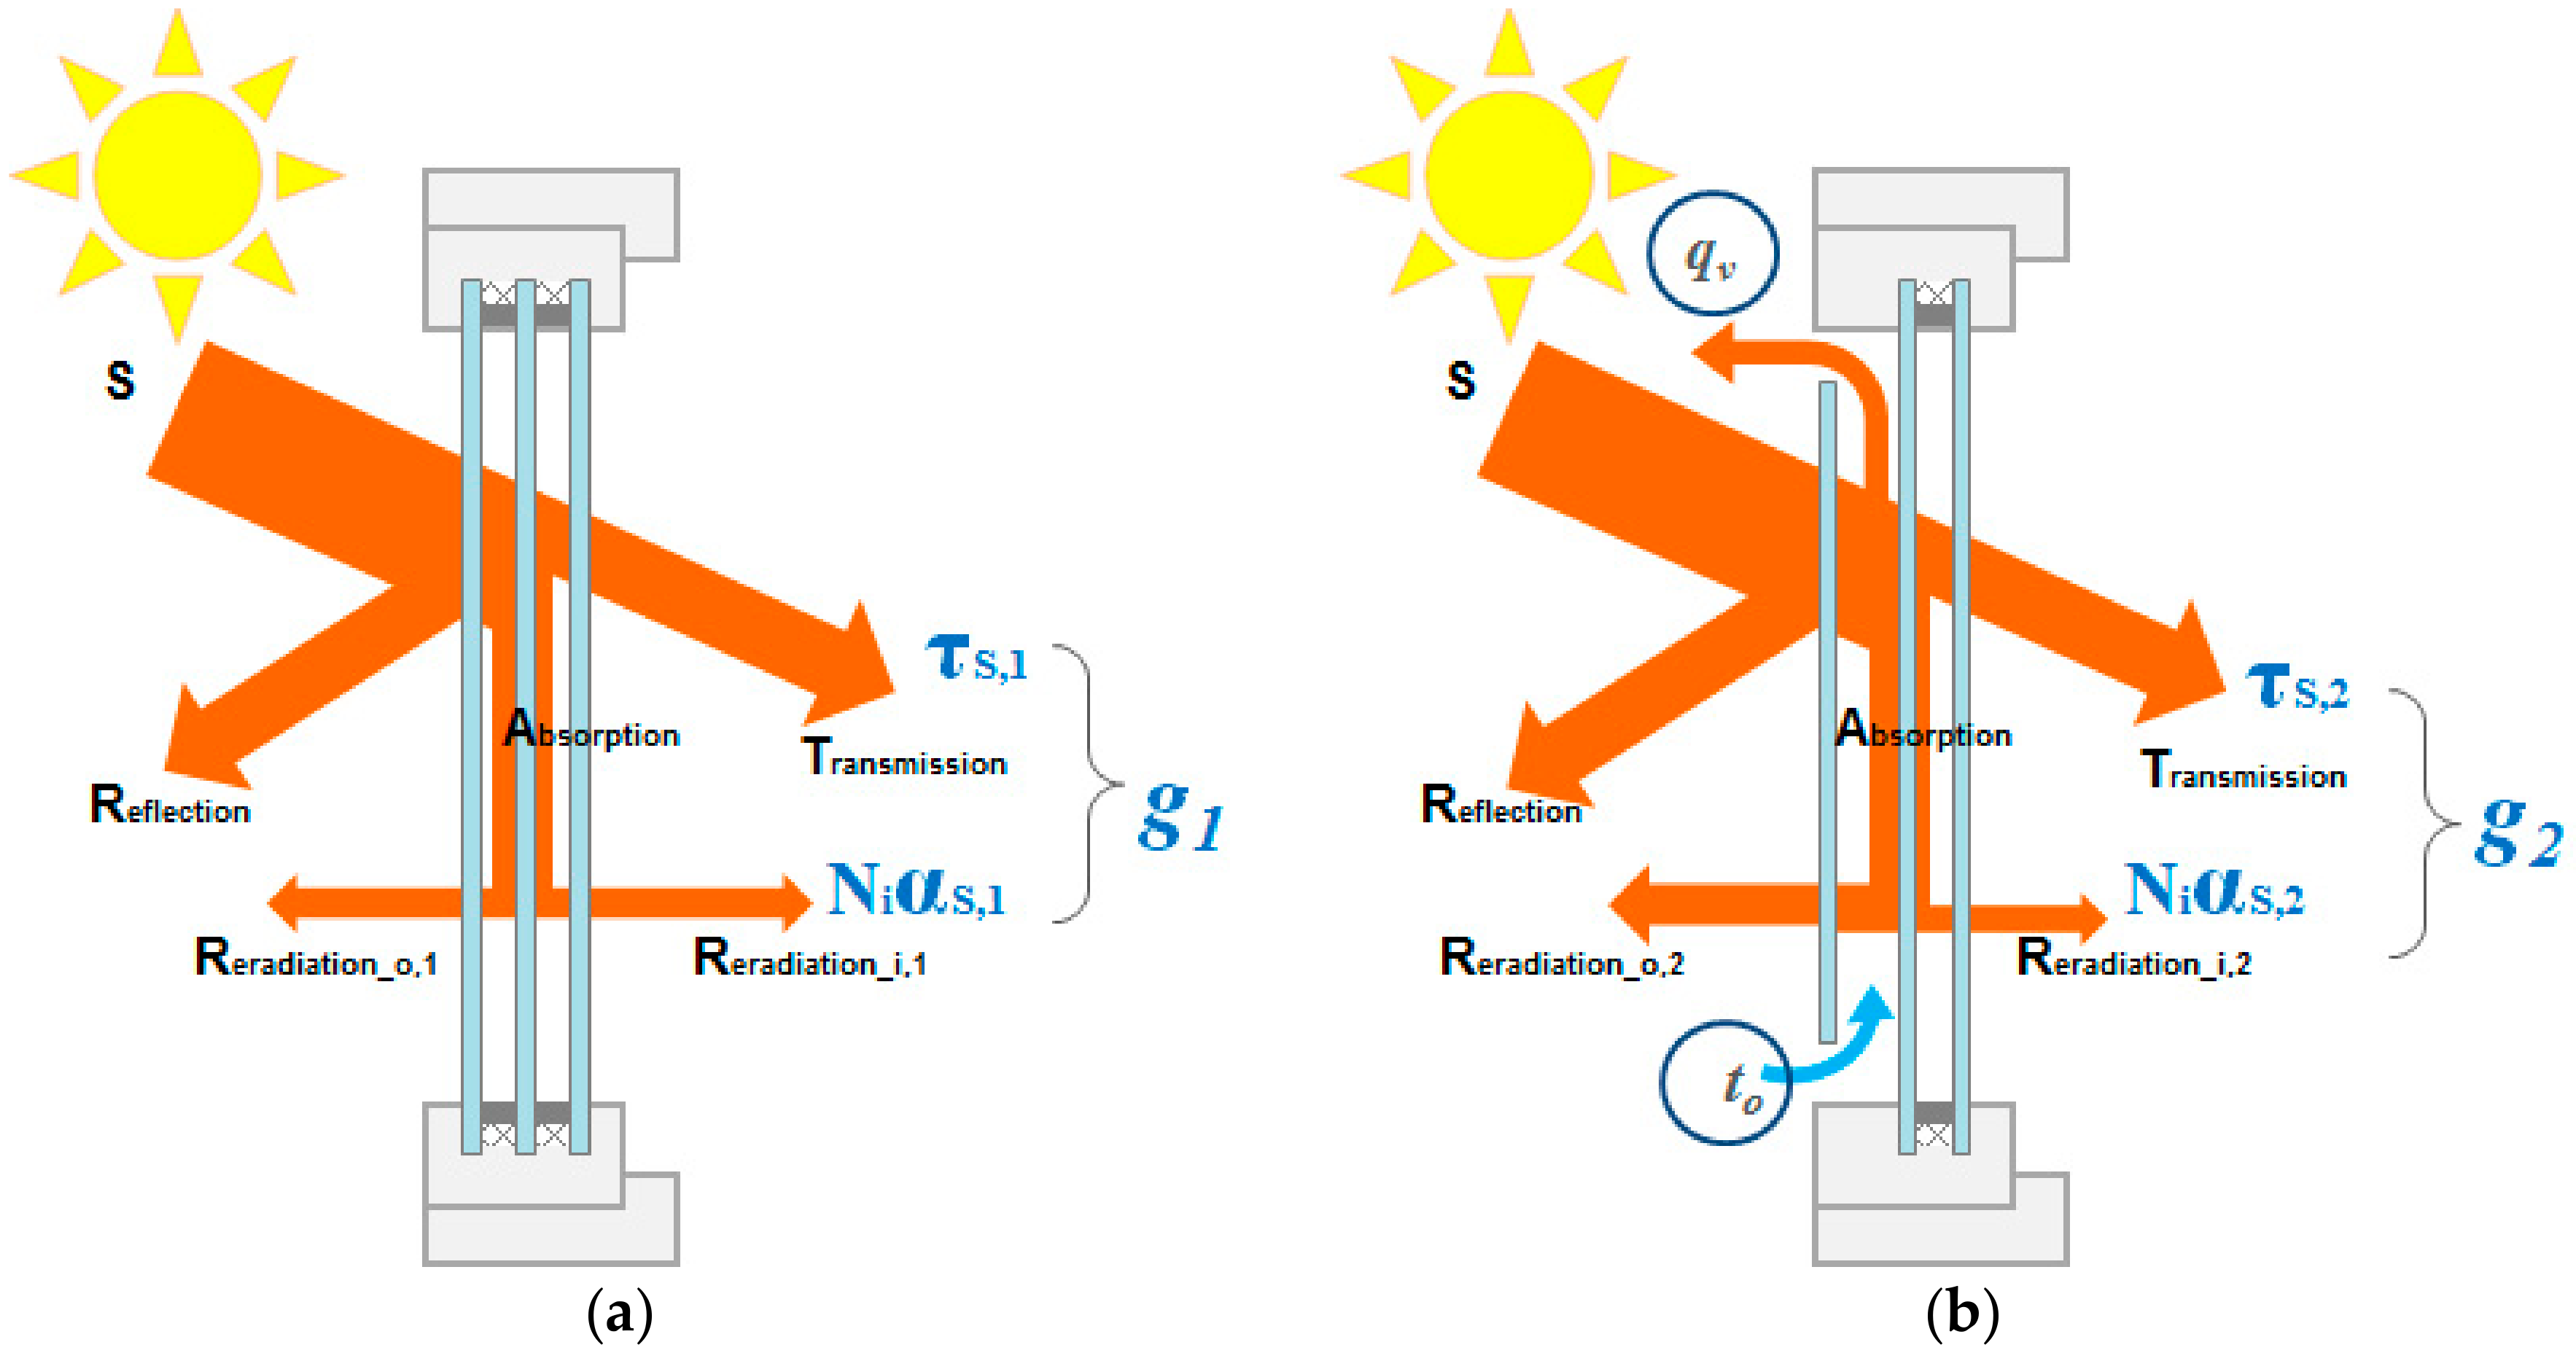
Figure 2.
Schematic diagram of the artificial solar lab.
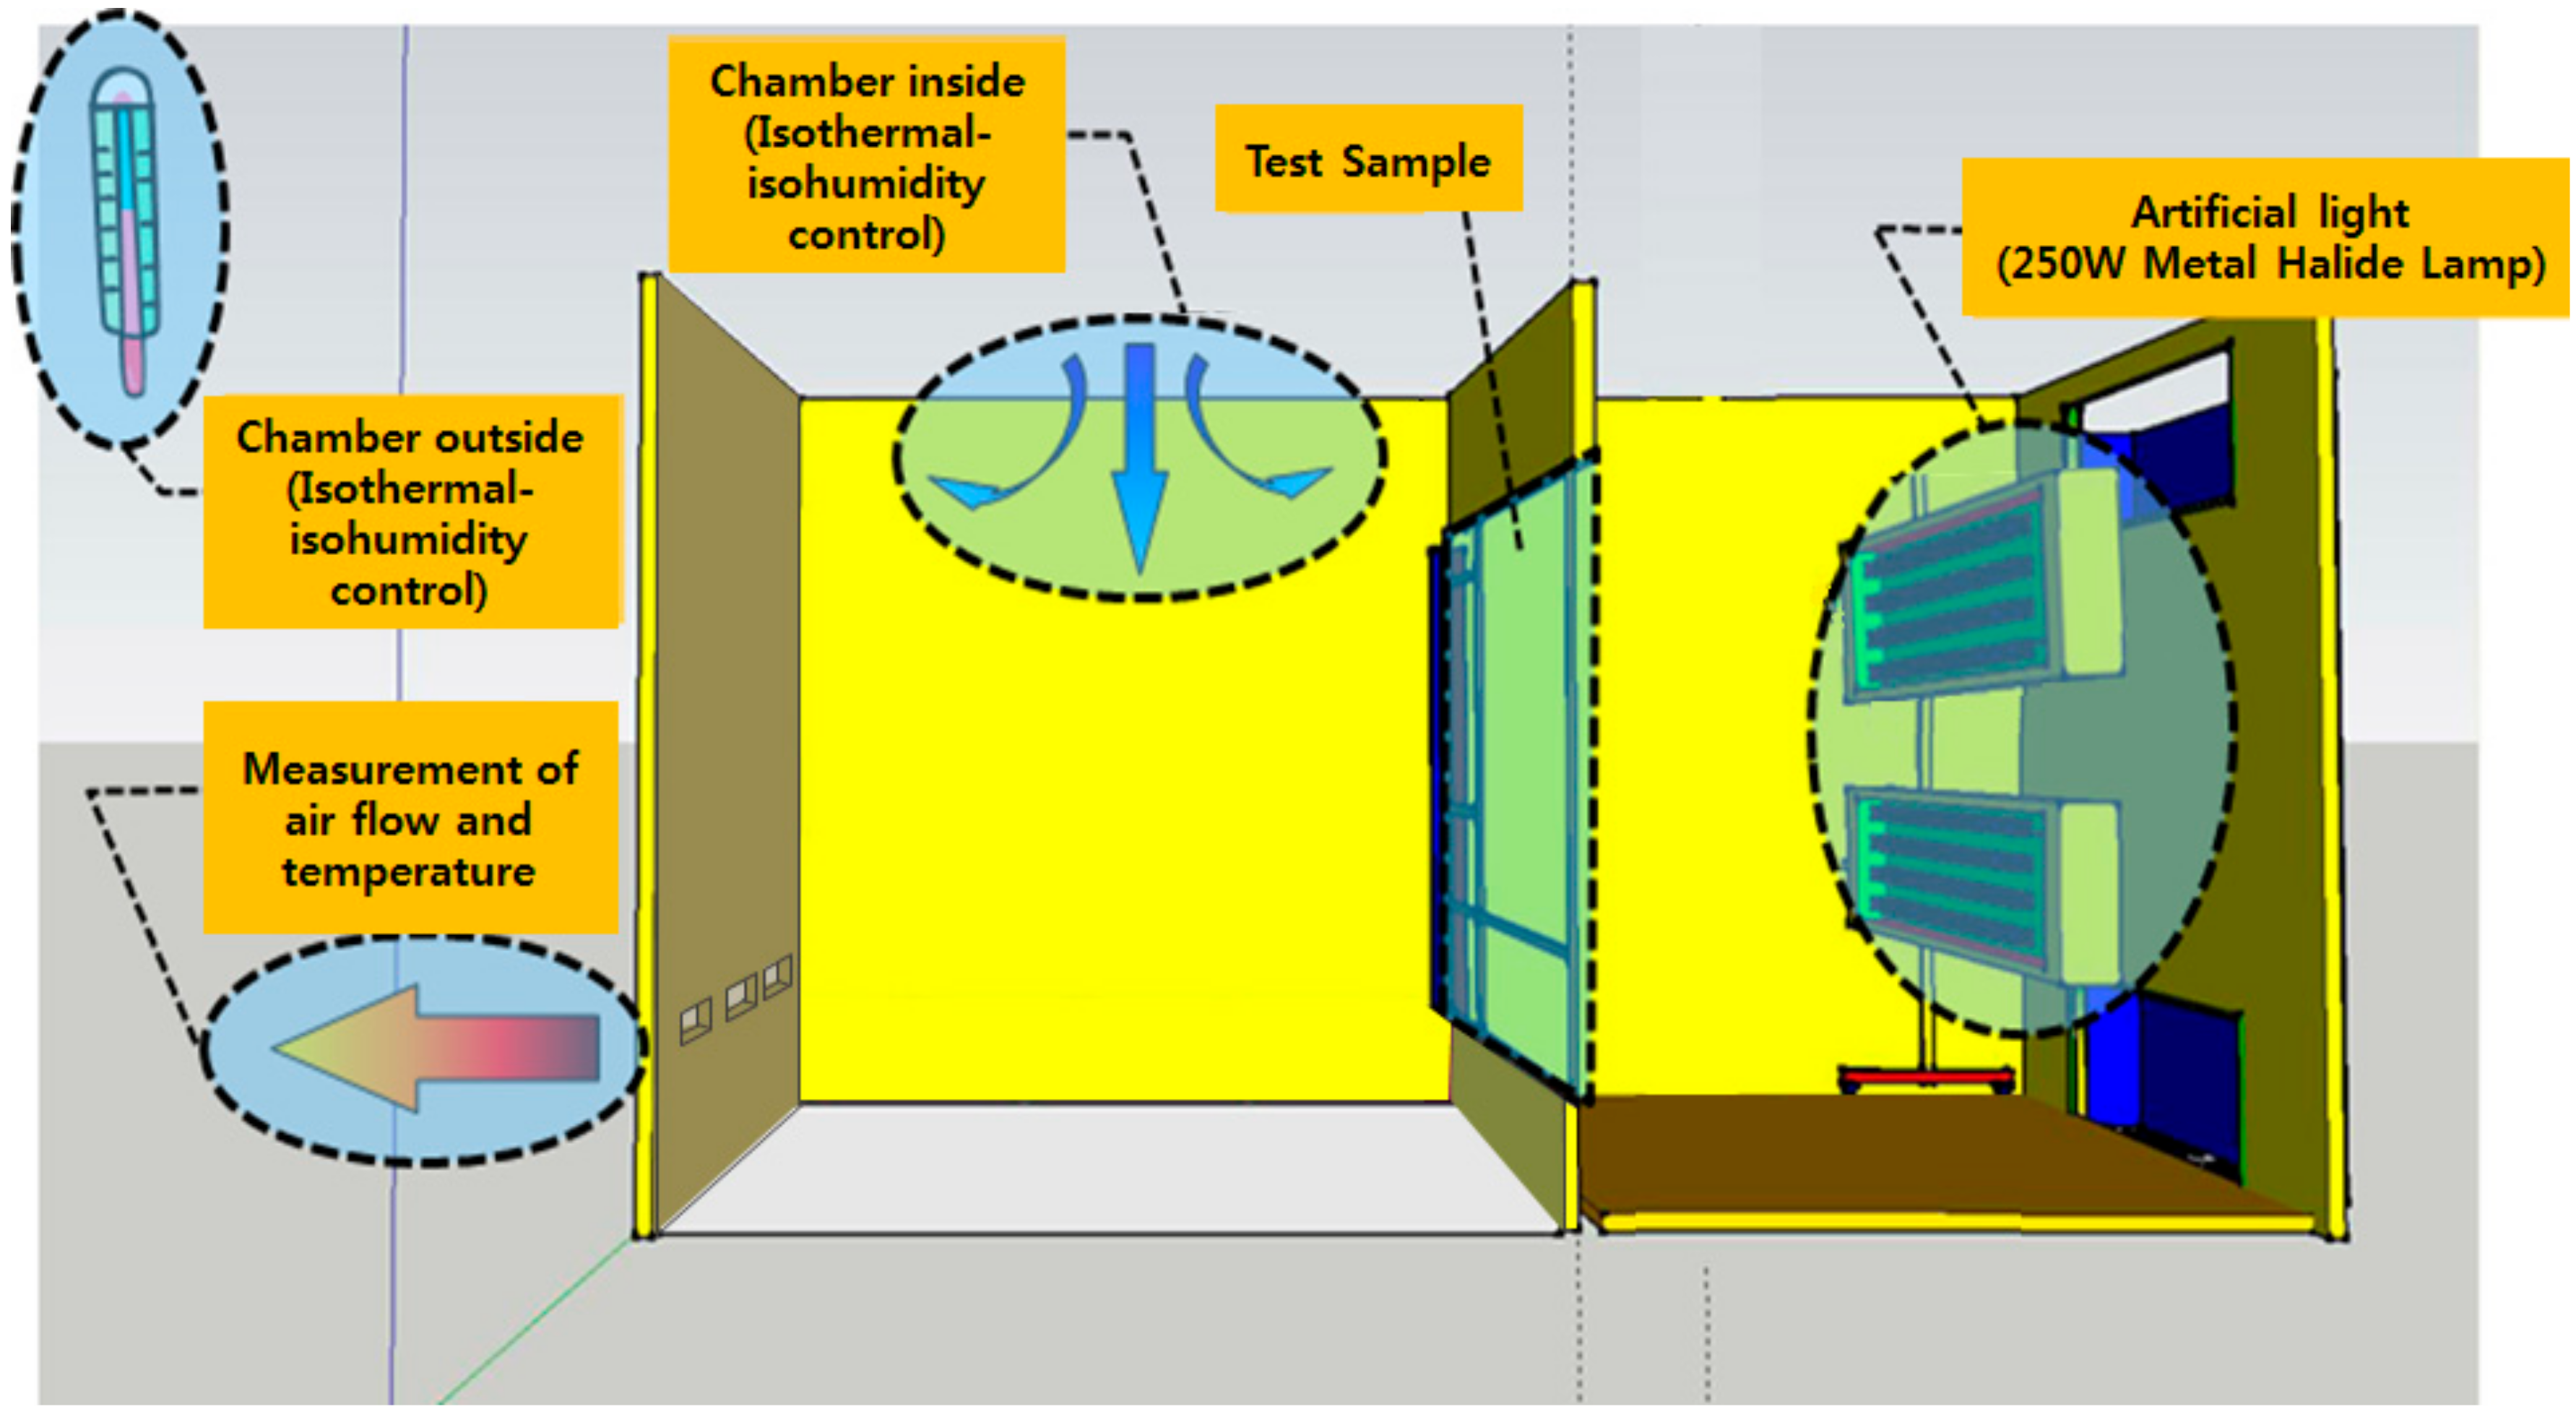
Figure 3.
Photo of the artificial solar lab: (a) indoor chamber; (b) outdoor chamber; and (c) artificial lights.
Figure 3.
Photo of the artificial solar lab: (a) indoor chamber; (b) outdoor chamber; and (c) artificial lights.
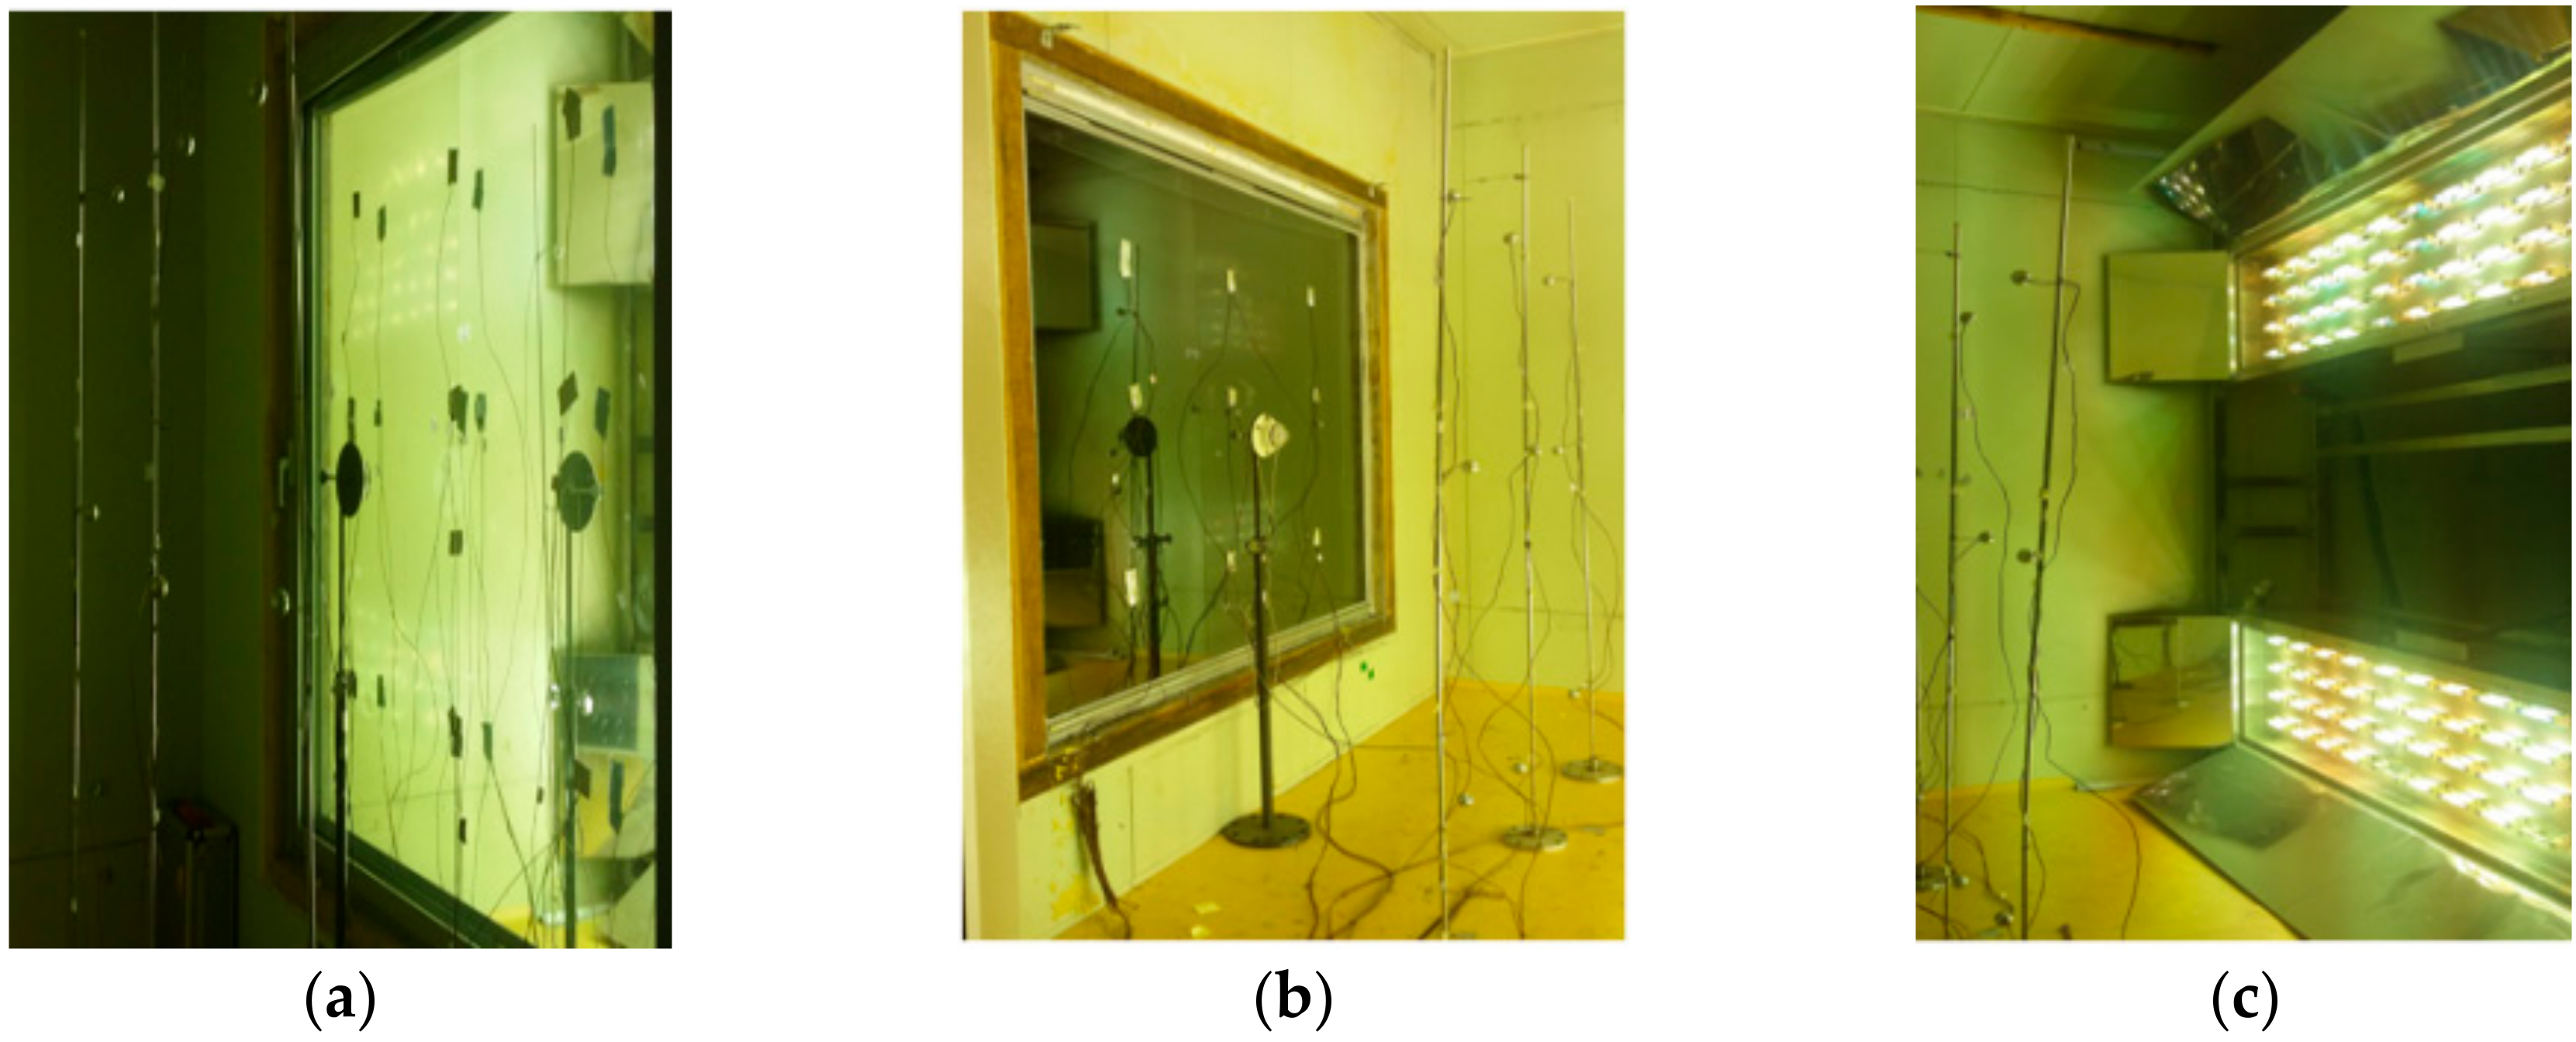
Figure 4.
Temperature measurement points of the specimen installed in the artificial solar lab. (a) Elevation of the specimen; (b) section of the specimen.
Figure 4.
Temperature measurement points of the specimen installed in the artificial solar lab. (a) Elevation of the specimen; (b) section of the specimen.

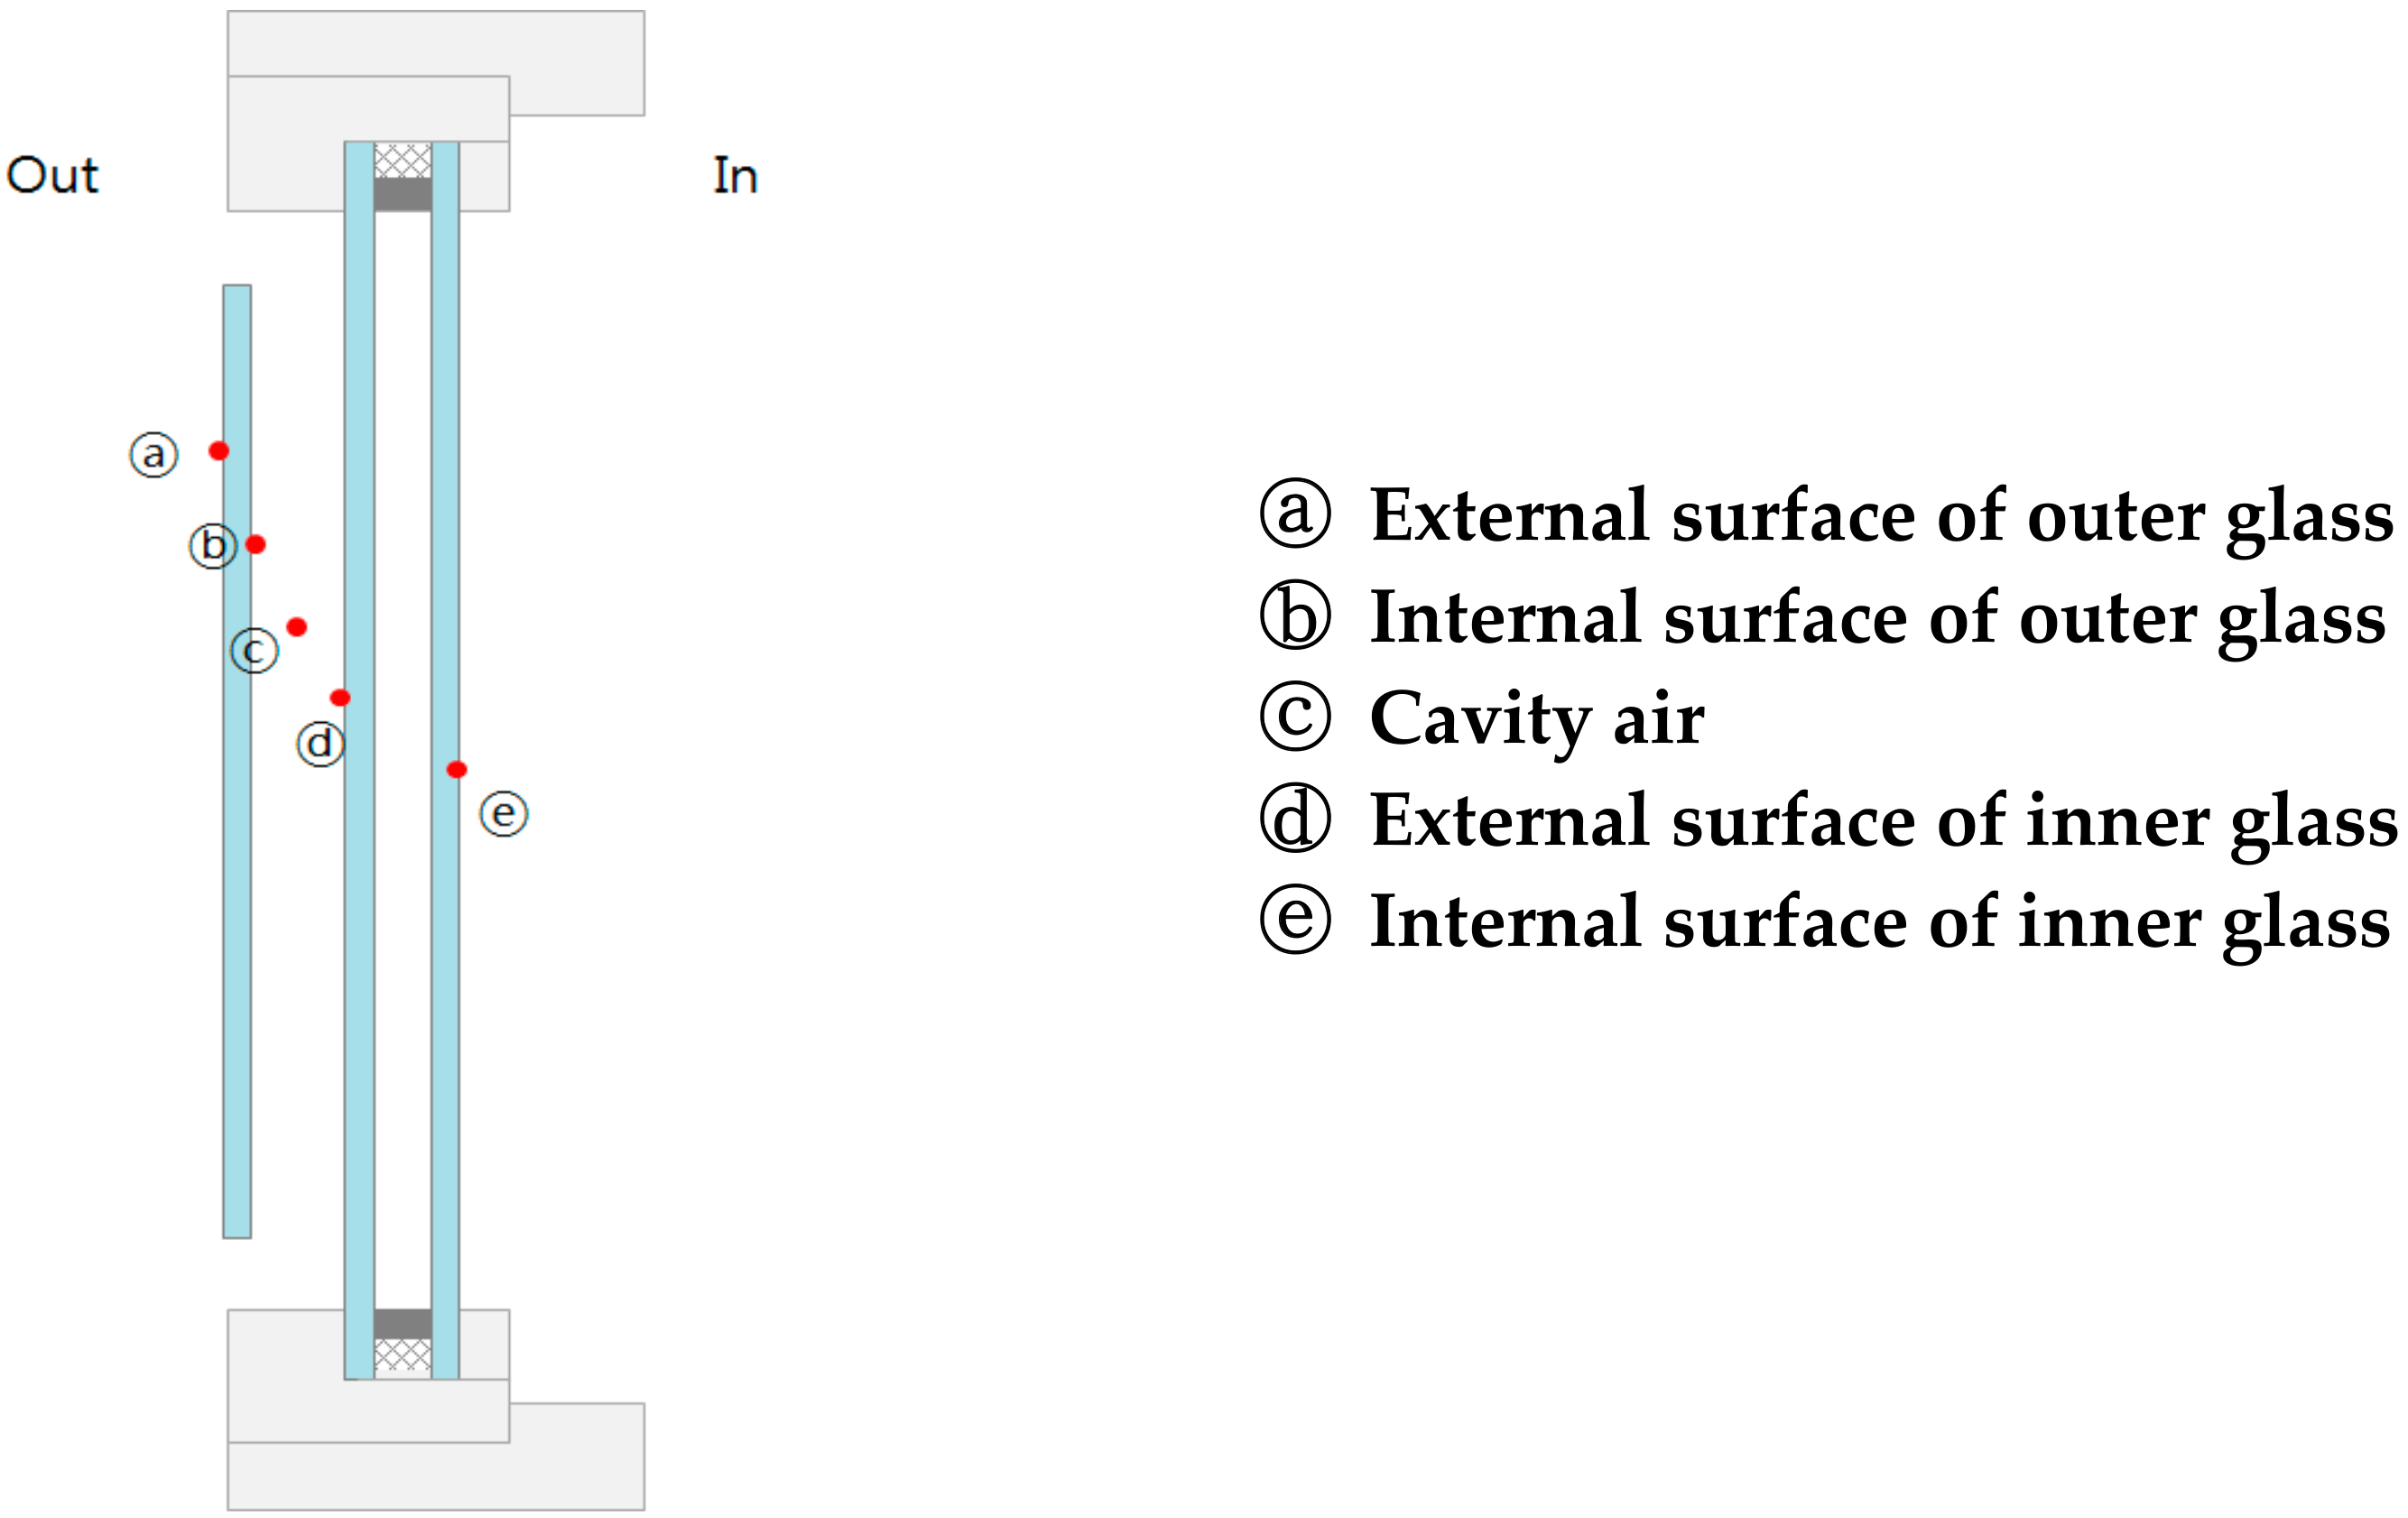
Figure 5.
Temperature measurement points.

Figure 6.
Temperature of measuring point of Case A: red and blue solid lines indicate the first and second test of Case A-1. The green and purple dotted lines indicate the first and second test of Case A-2.
Figure 6.
Temperature of measuring point of Case A: red and blue solid lines indicate the first and second test of Case A-1. The green and purple dotted lines indicate the first and second test of Case A-2.

Figure 7.
SHGC output graph of A-1: (a) first test of A-1 (SHGC = 0.46); and (b) the second test of A-1 (SHGC = 0.46).
Figure 7.
SHGC output graph of A-1: (a) first test of A-1 (SHGC = 0.46); and (b) the second test of A-1 (SHGC = 0.46).
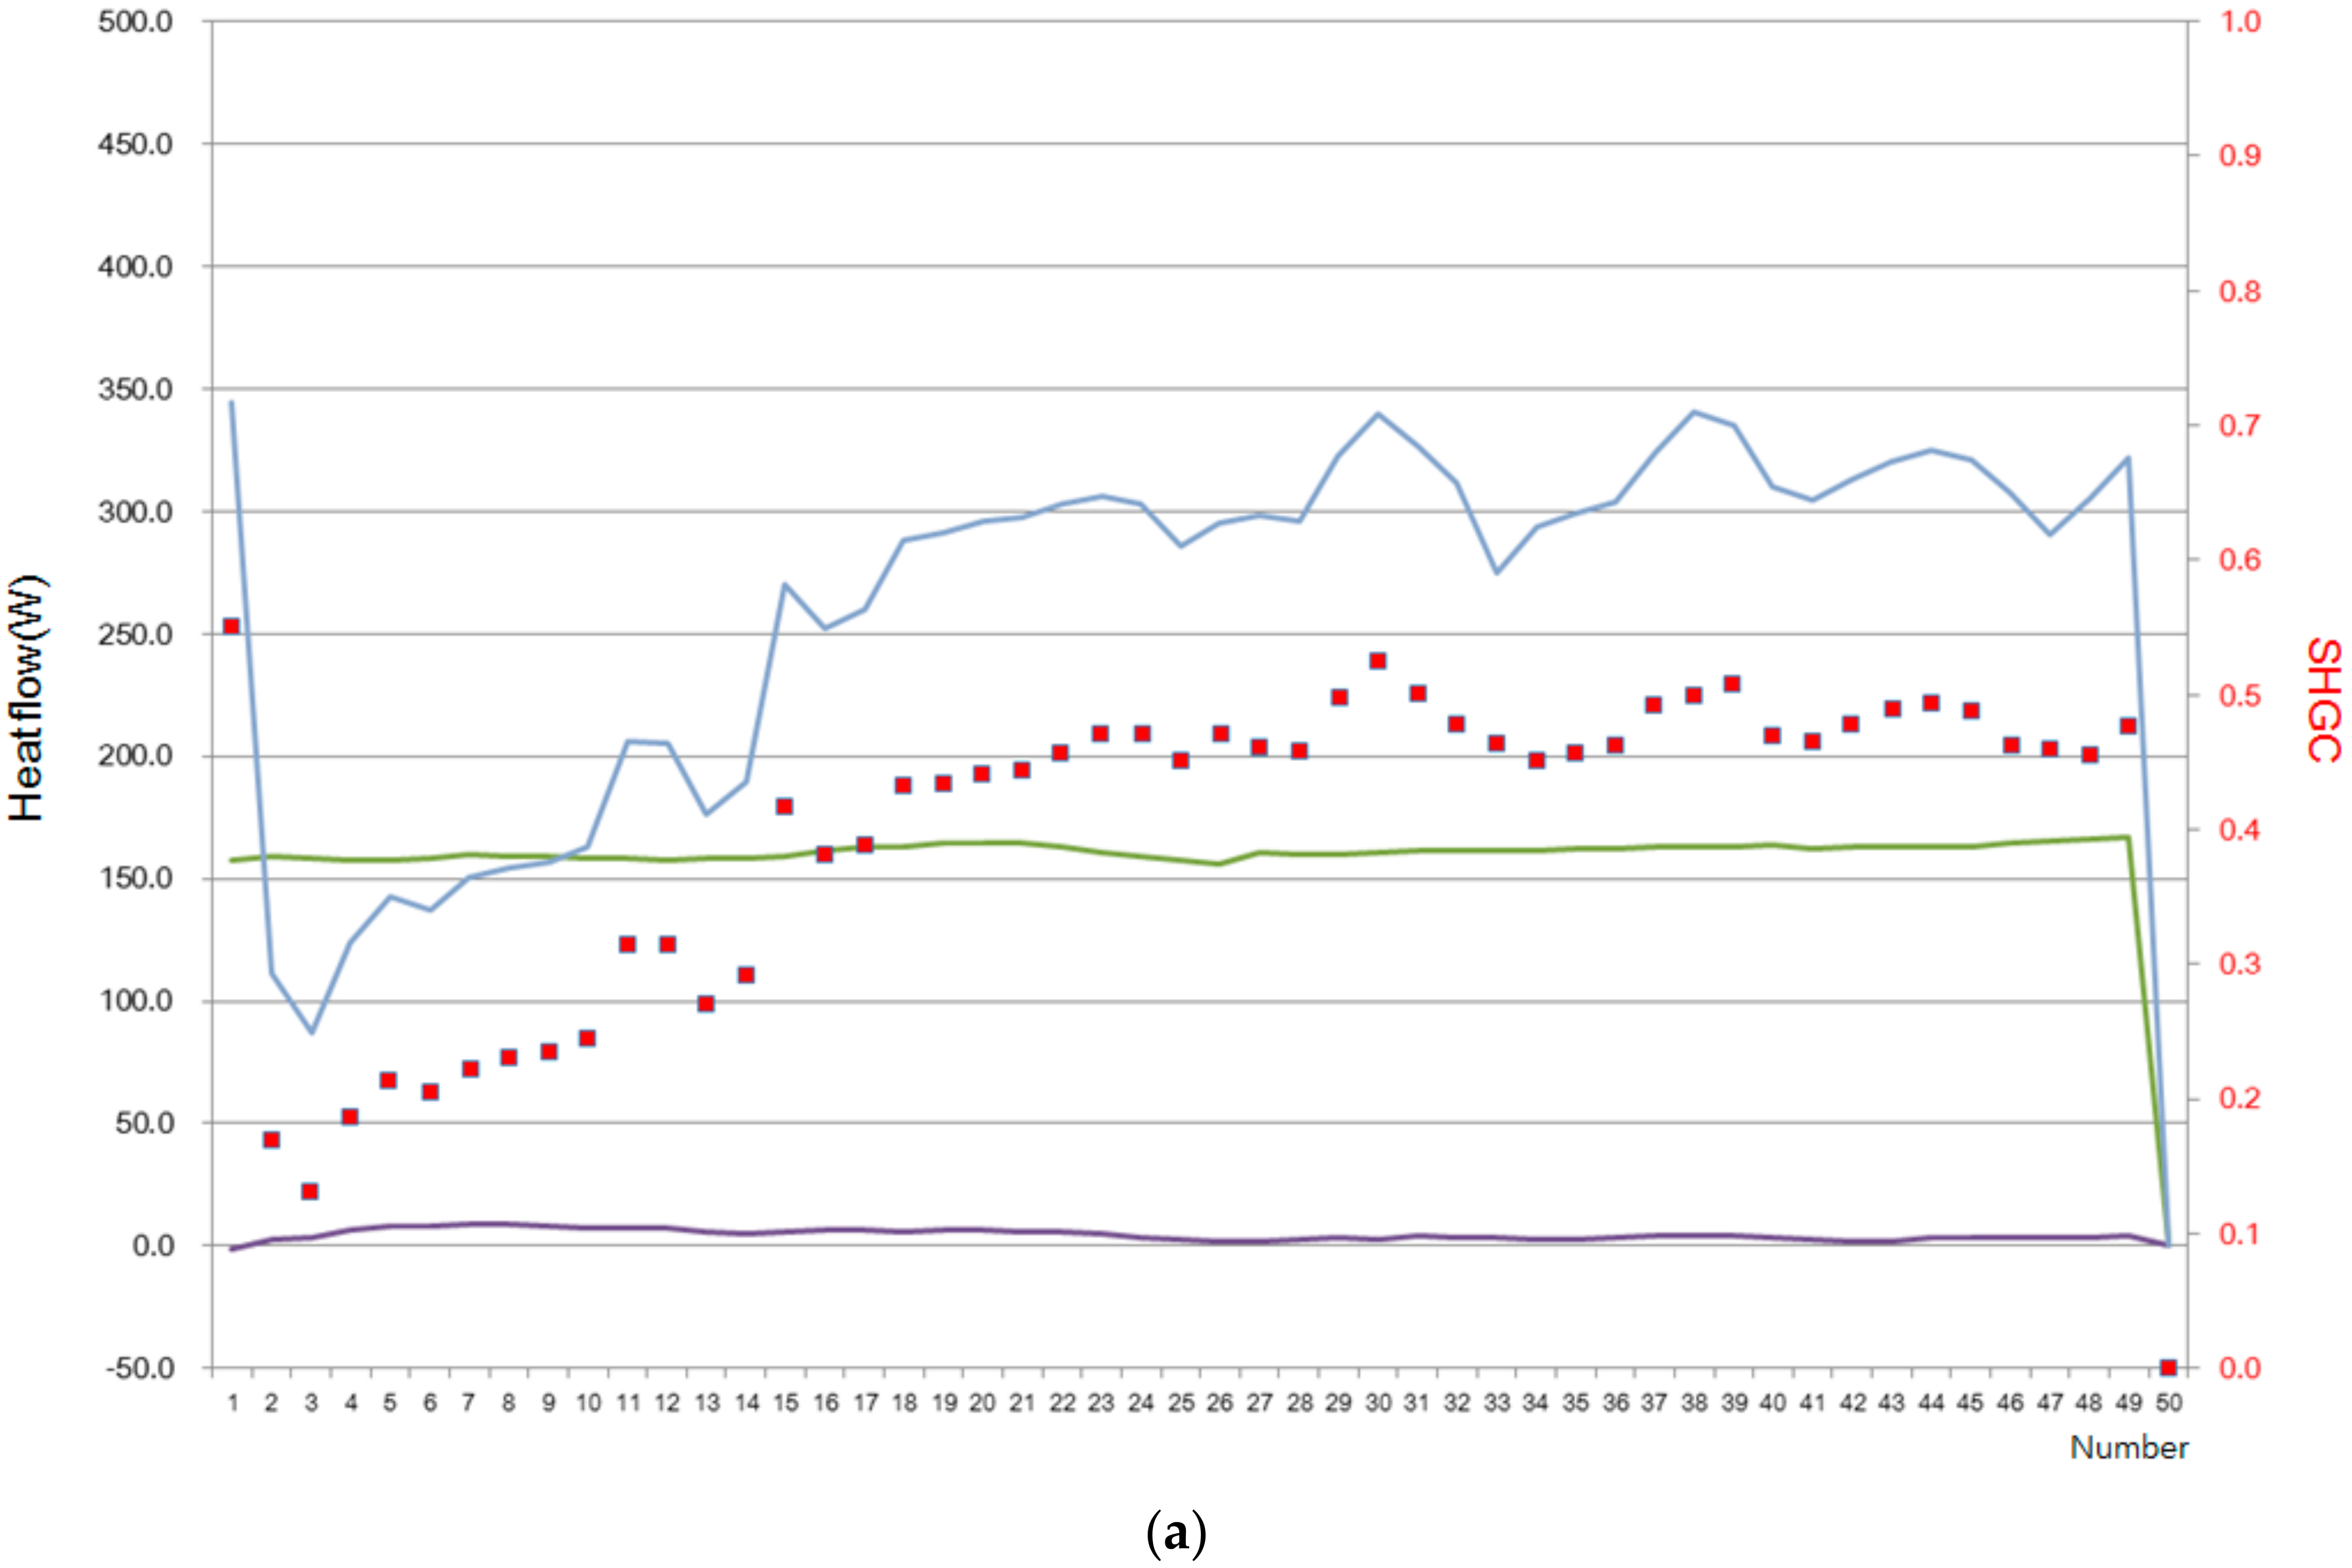

Figure 8.
SHGC output graph of A-2: (a) first test of A-2 (SHGC = 0.38); and (b) the second test of A-2 (SHGC = 0.37).
Figure 8.
SHGC output graph of A-2: (a) first test of A-2 (SHGC = 0.38); and (b) the second test of A-2 (SHGC = 0.37).
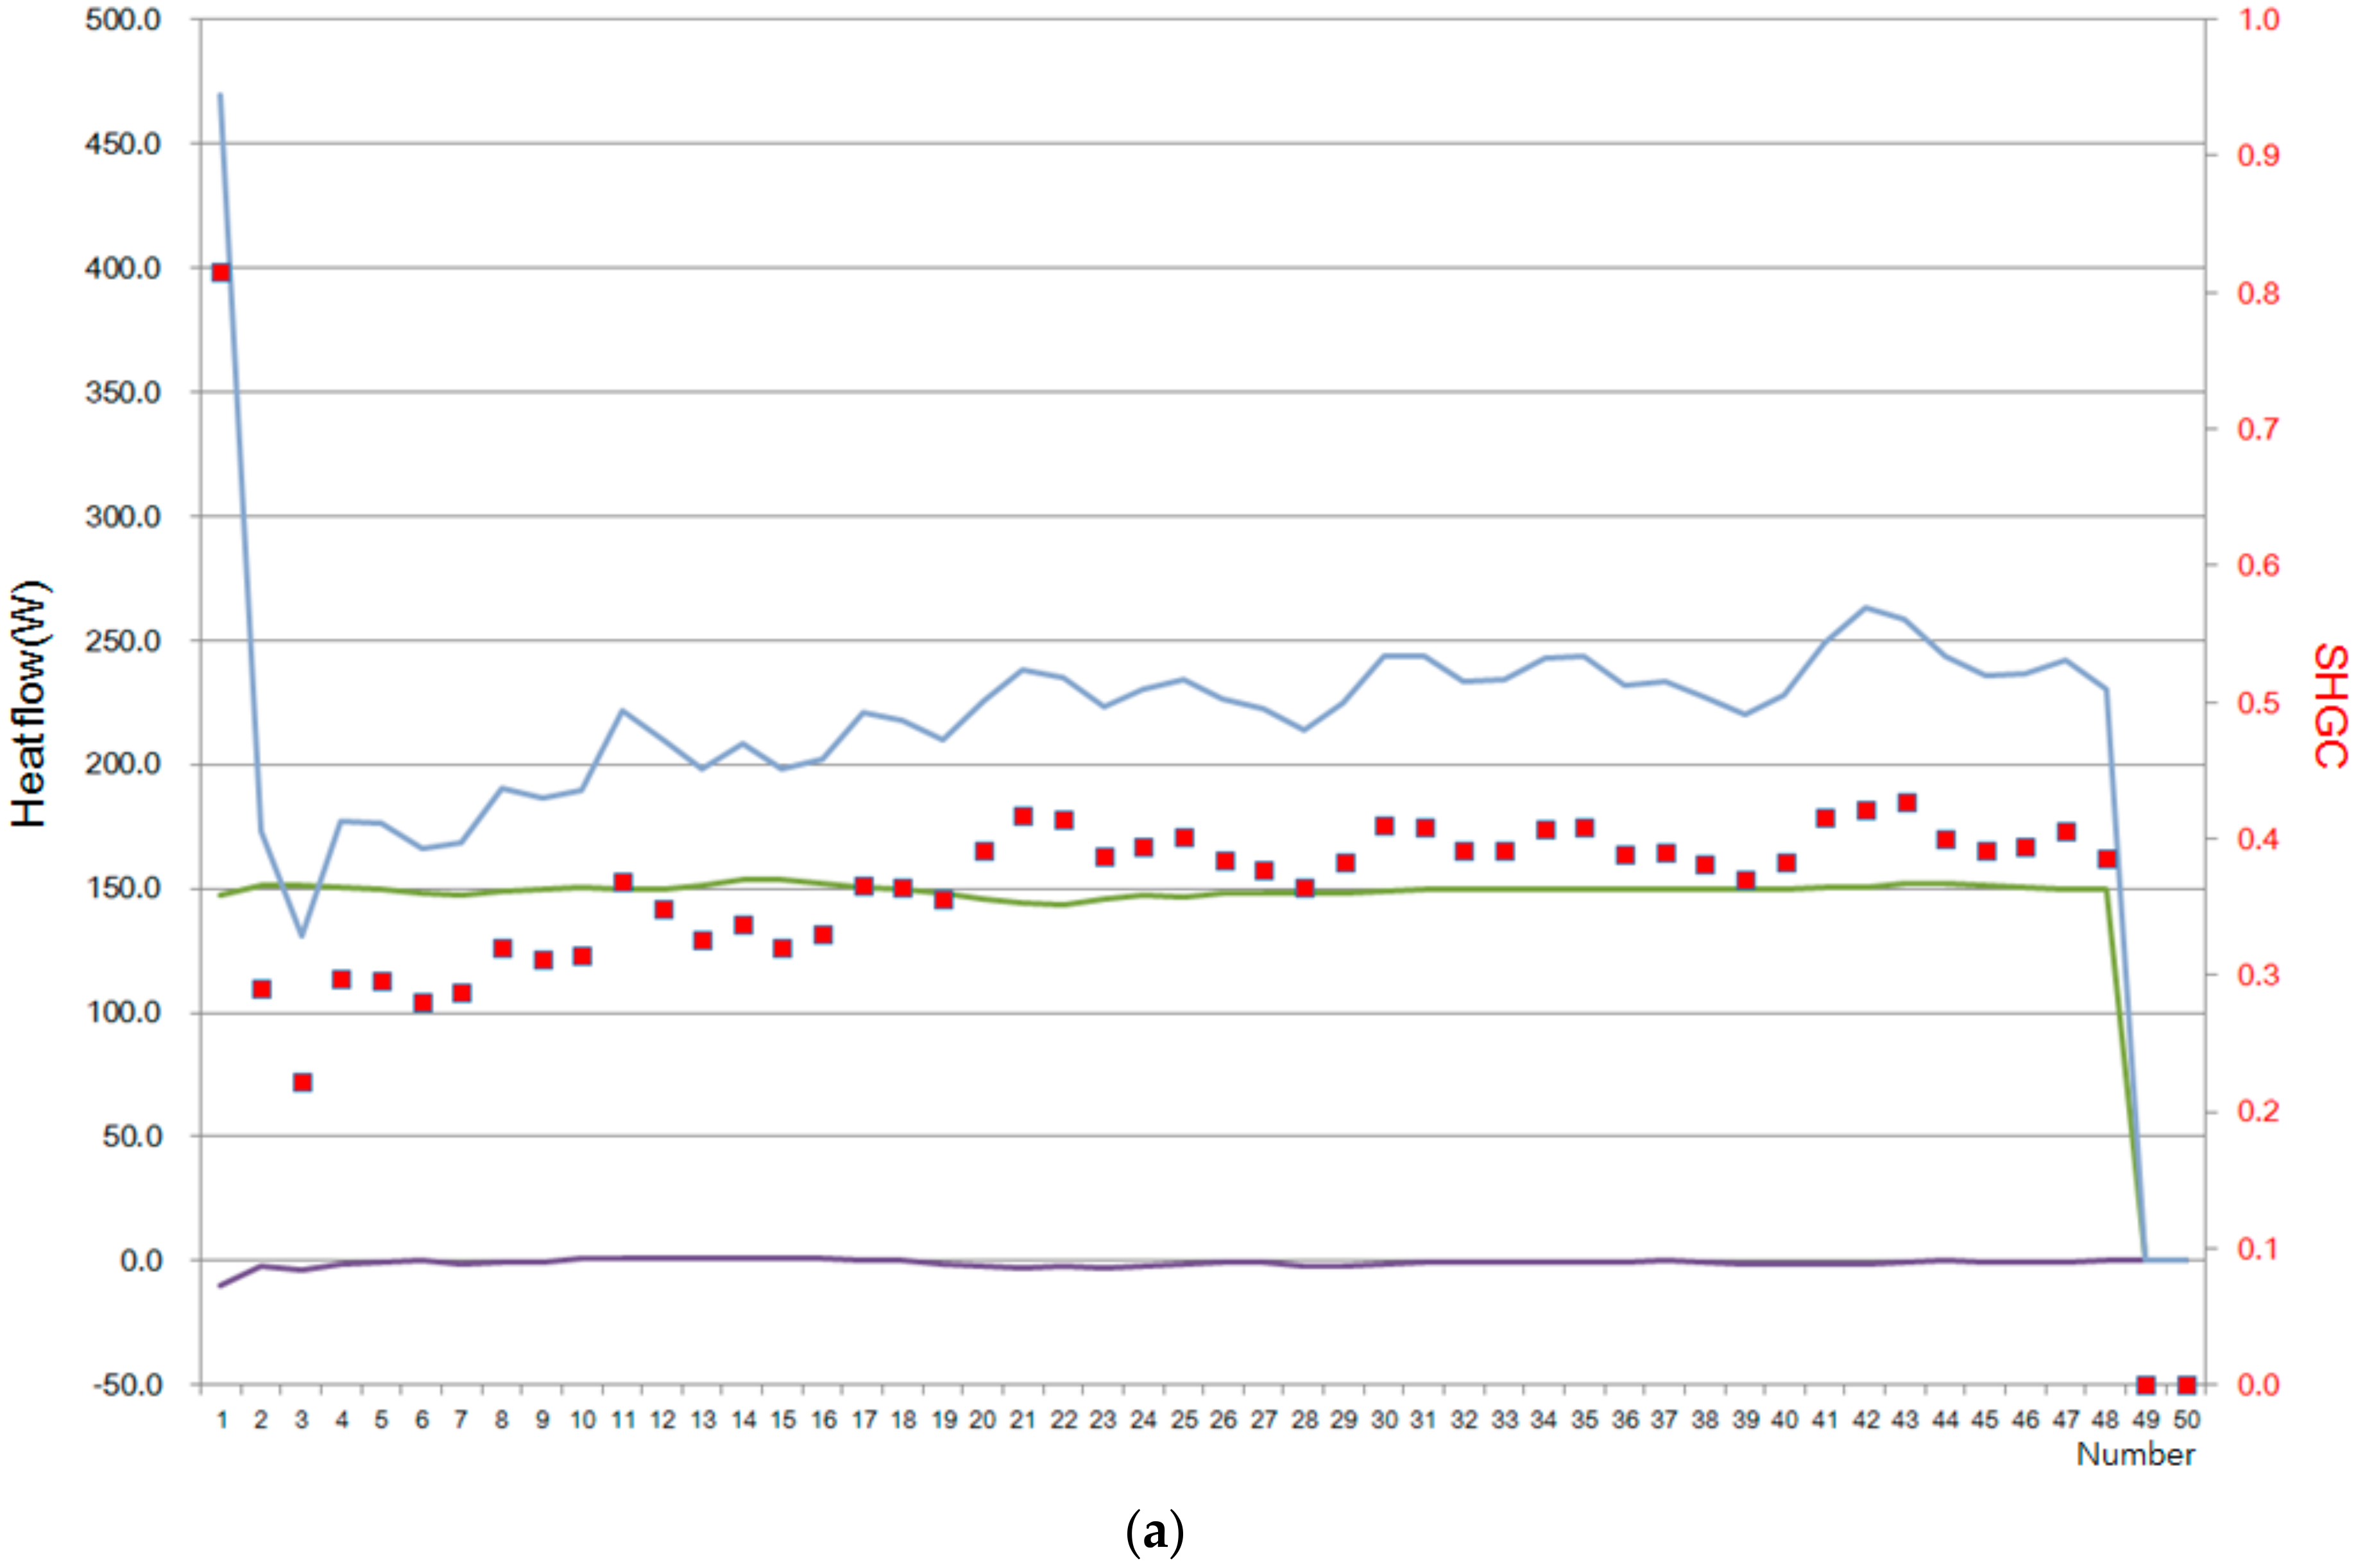

Figure 9.
Temperature of measuring point of Case B: red and blue solid lines indicate the first and second tests of case B-1. Green and purple dotted lines indicate the first and second test of case B-2.
Figure 9.
Temperature of measuring point of Case B: red and blue solid lines indicate the first and second tests of case B-1. Green and purple dotted lines indicate the first and second test of case B-2.
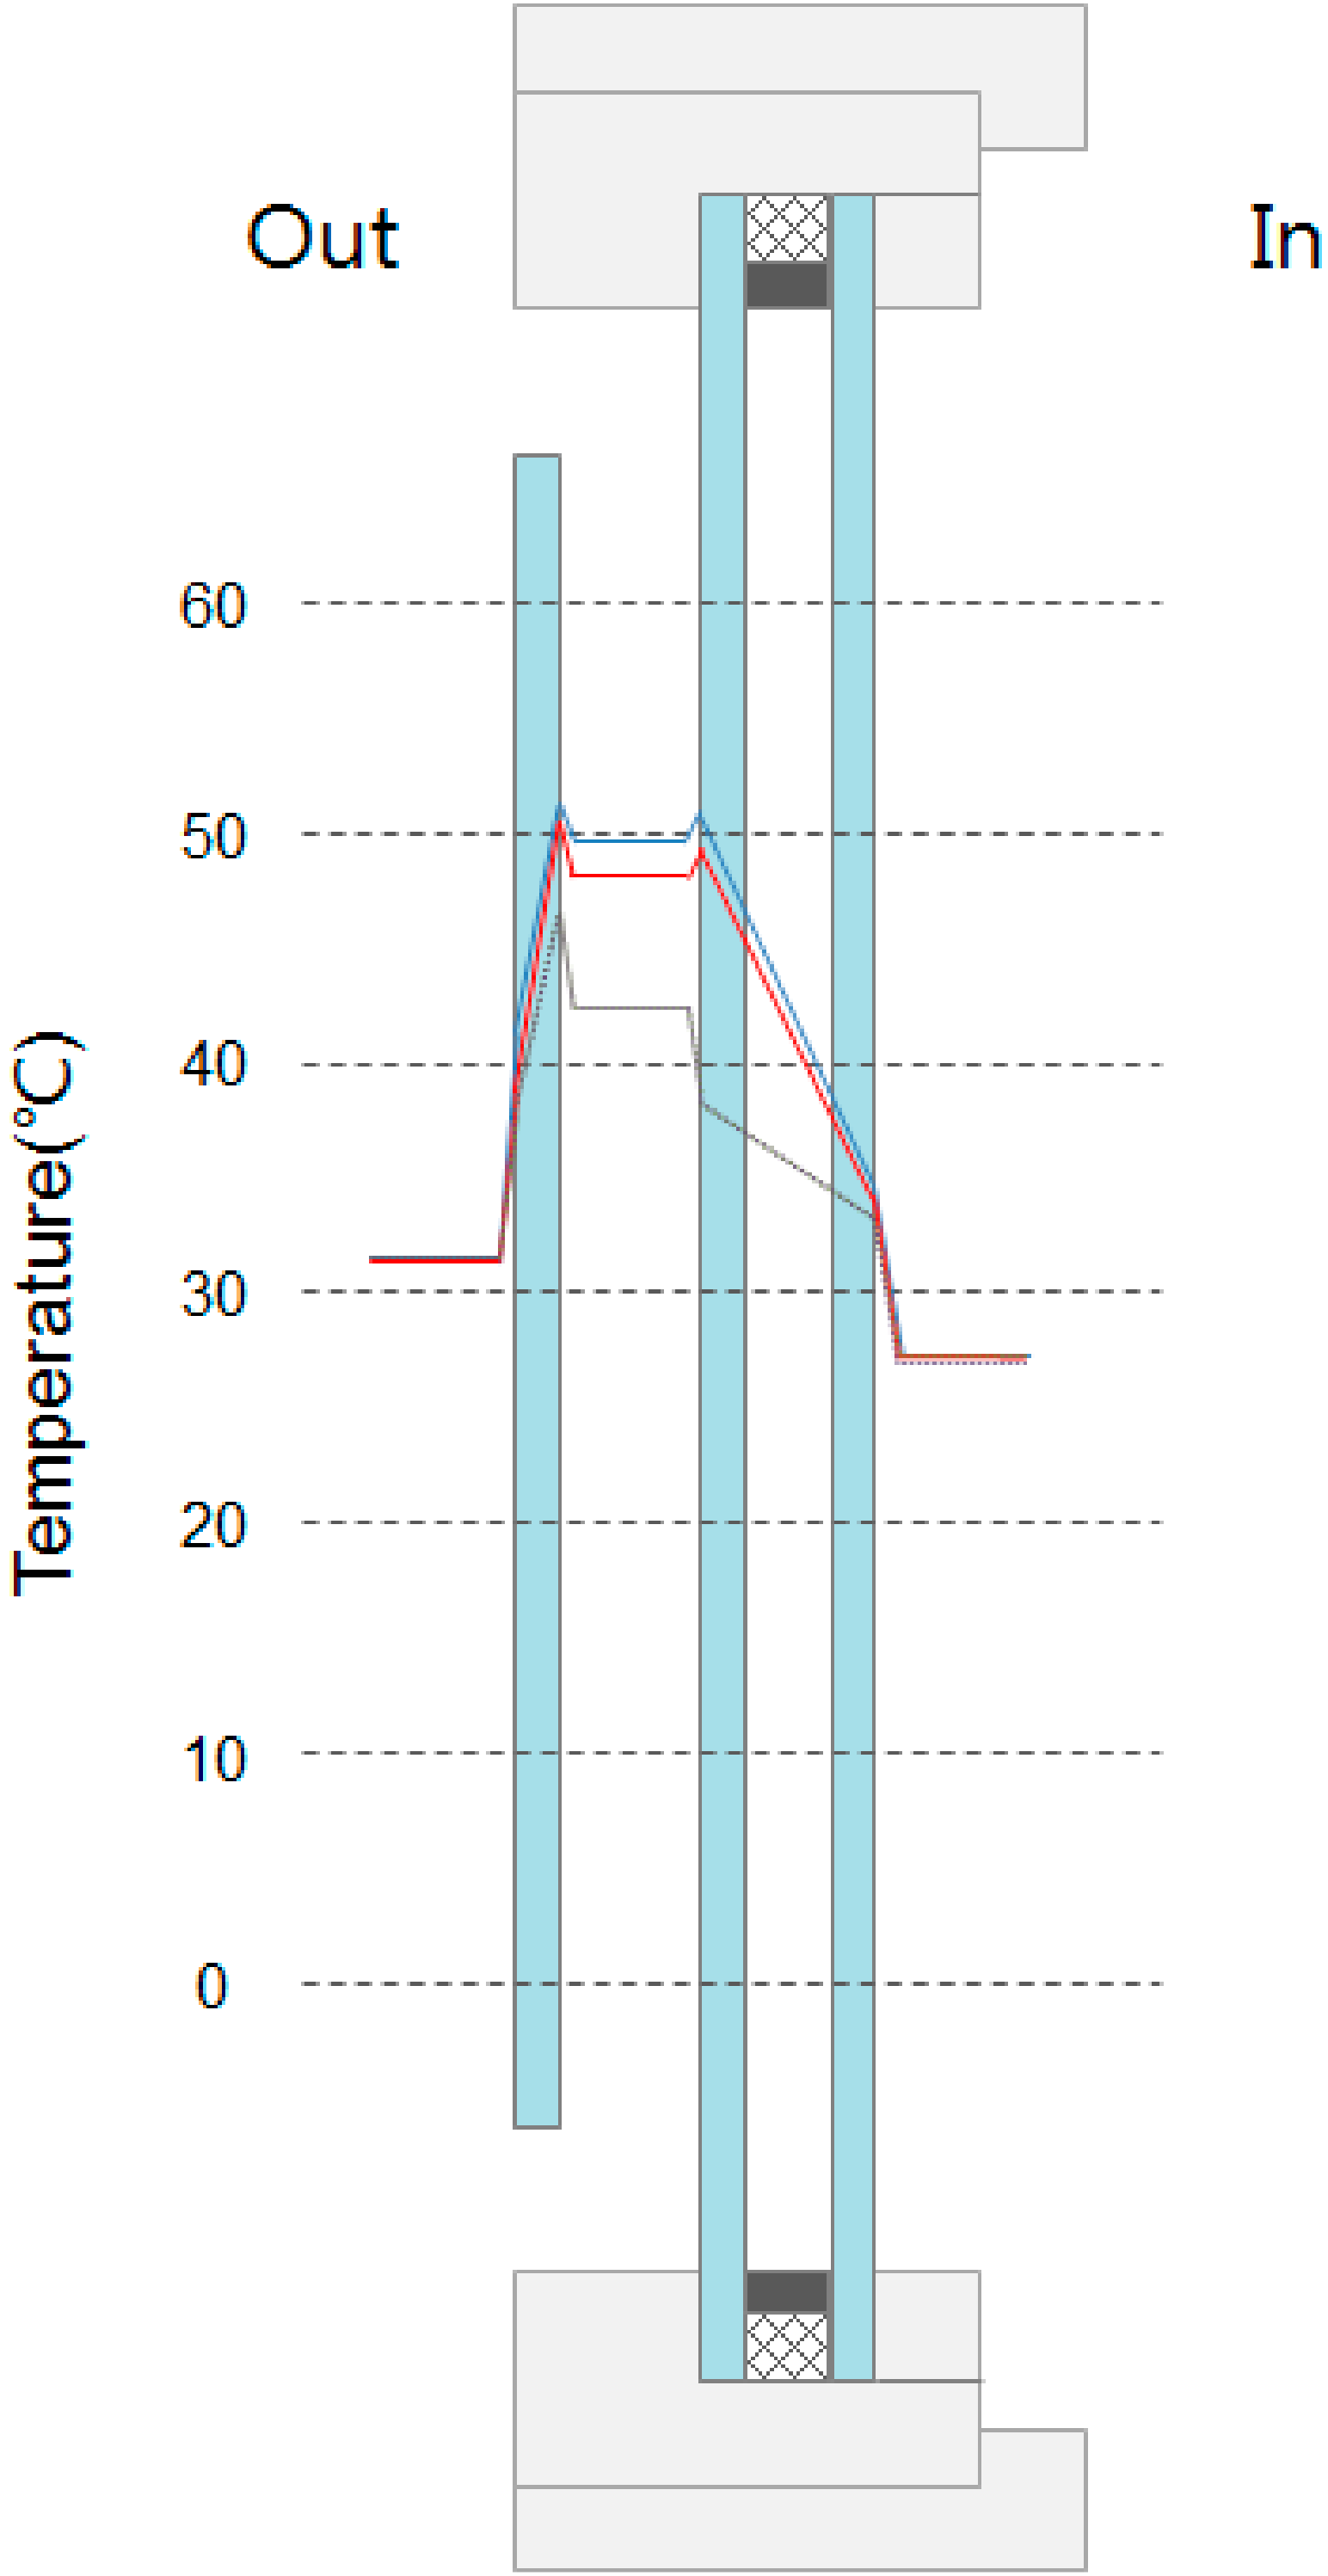
Figure 10.
SHGC output graph of B-1: (a) first test of B-1 (SHGC = 0.16); and the (b) second test of B-1 (SHGC = 0.18).
Figure 10.
SHGC output graph of B-1: (a) first test of B-1 (SHGC = 0.16); and the (b) second test of B-1 (SHGC = 0.18).

Figure 11.
SHGC output graph of B-2; (a) first test of B-2 (SHGC = 0.09); and the (b) second test of B-2 (SHGC = 0.07).
Figure 11.
SHGC output graph of B-2; (a) first test of B-2 (SHGC = 0.09); and the (b) second test of B-2 (SHGC = 0.07).

Figure 12.
Location of the window test cell.
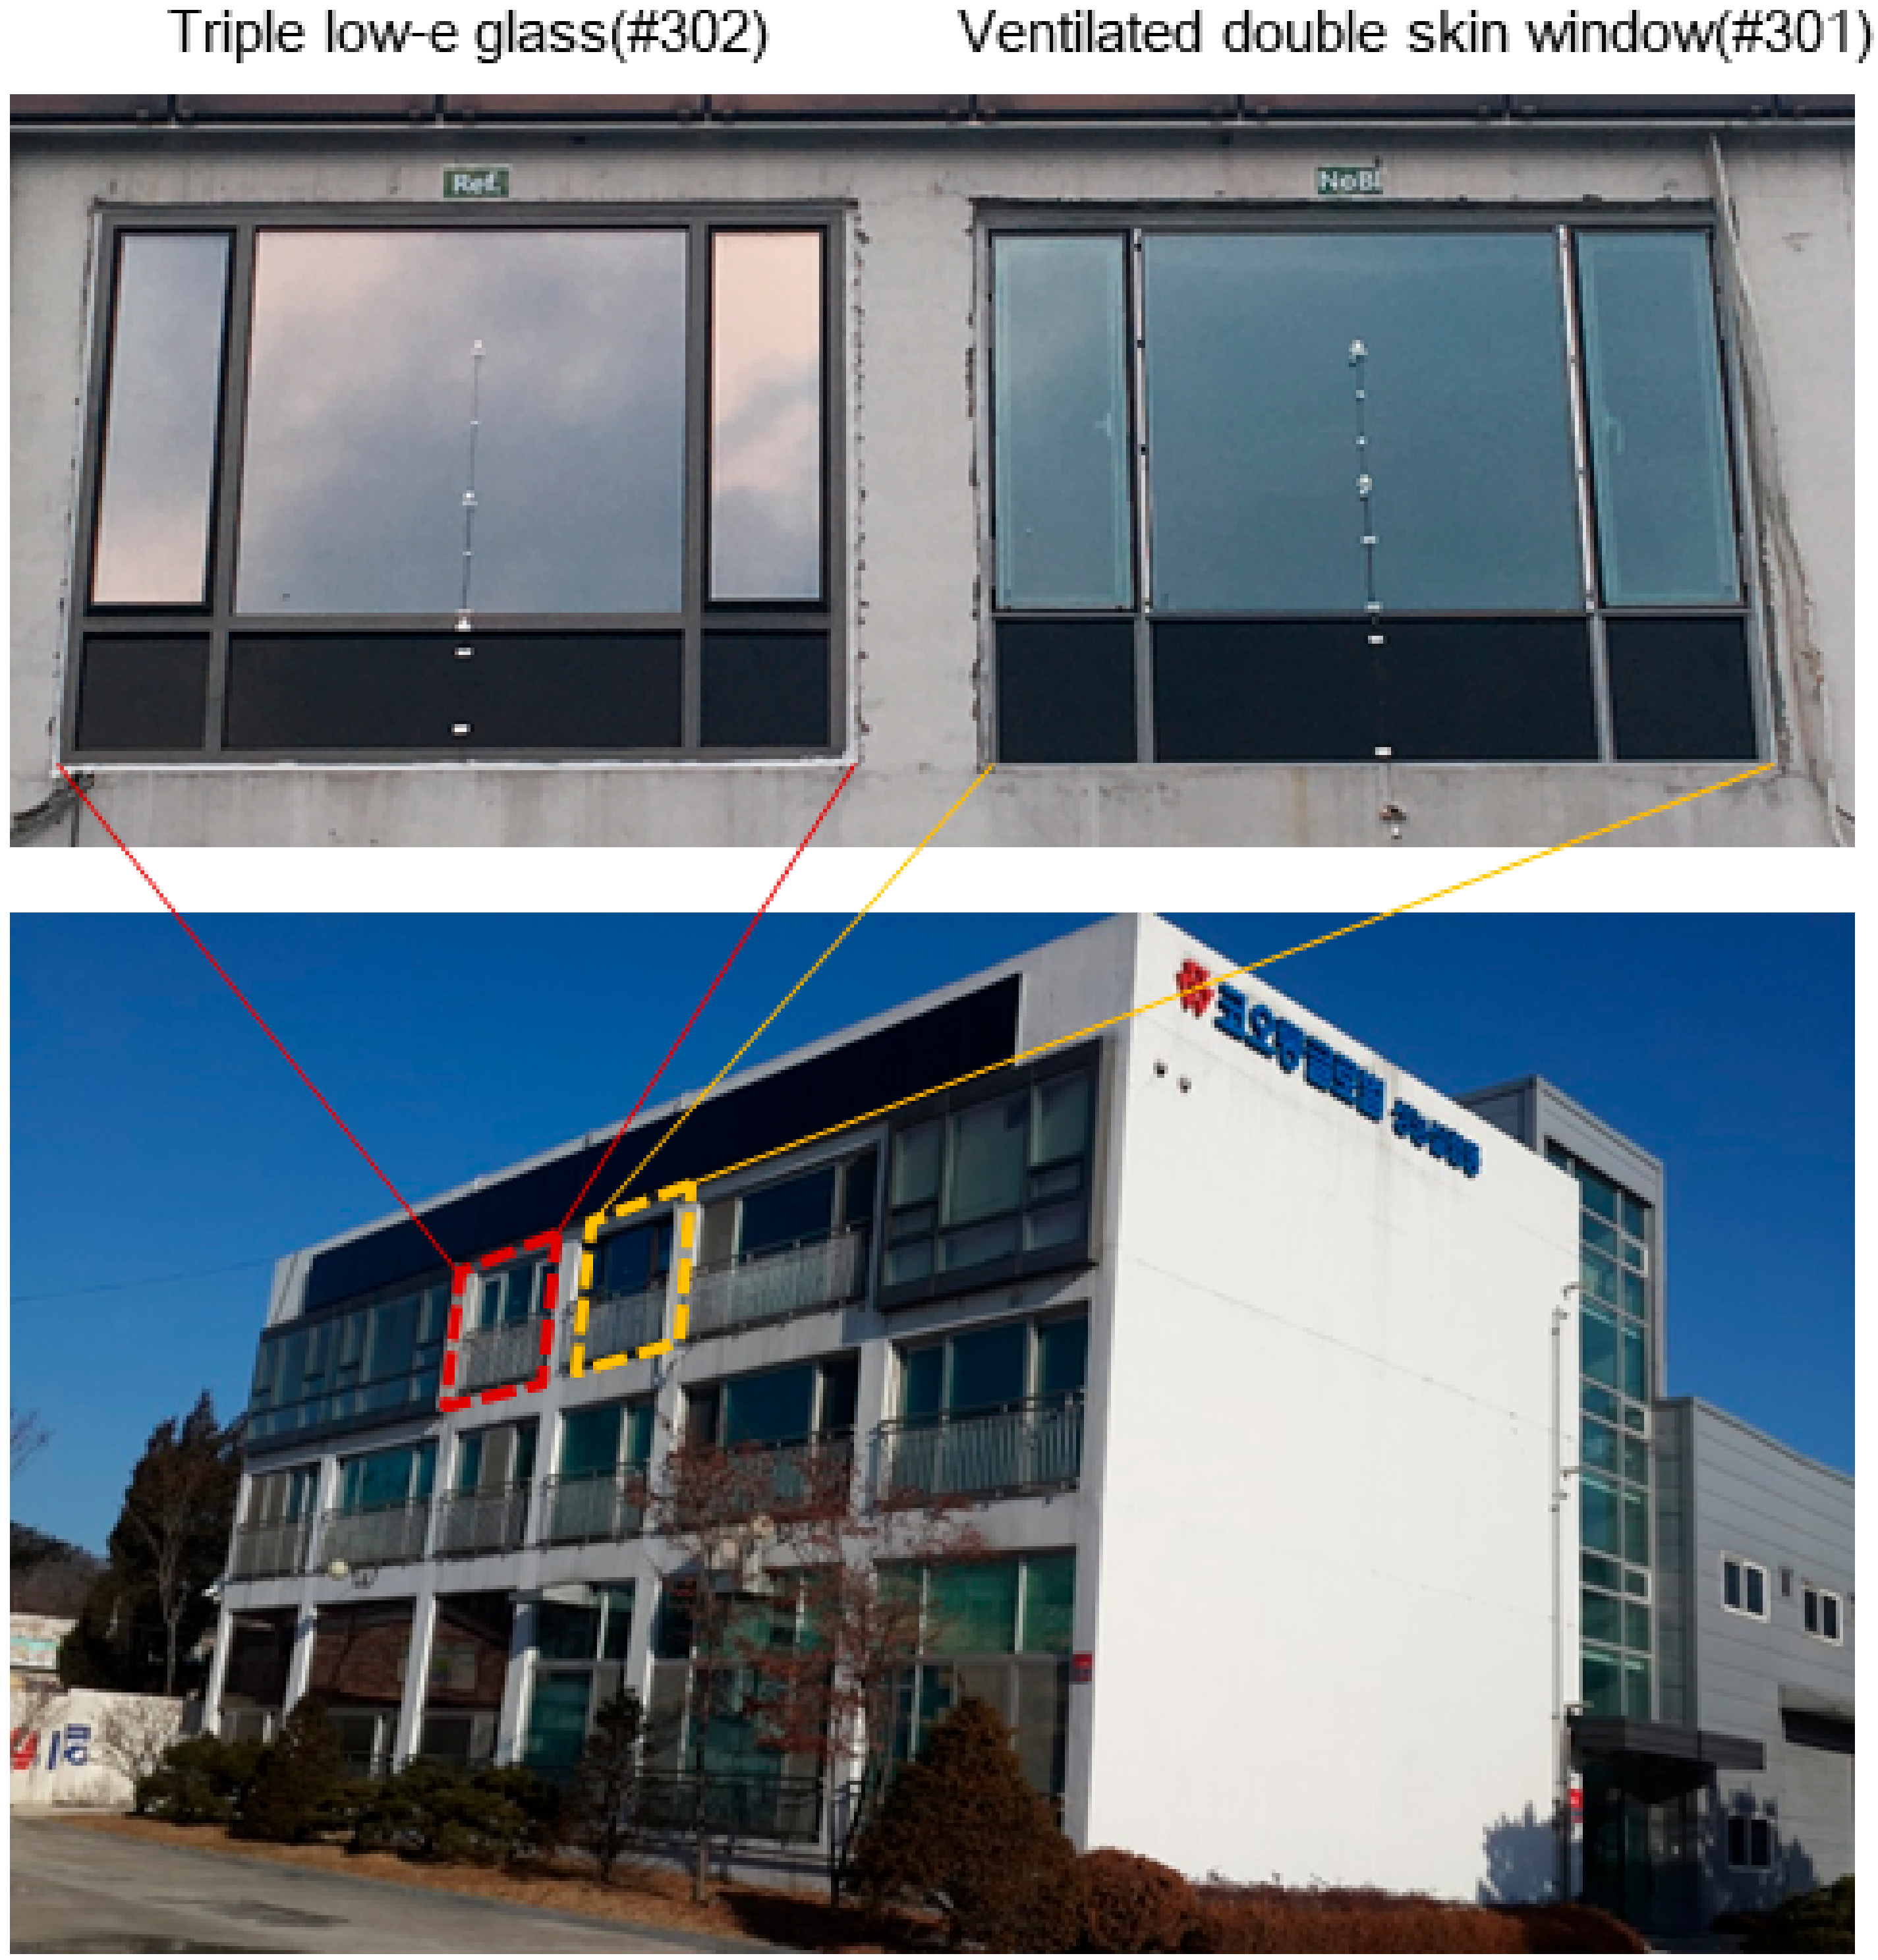
Figure 13.
Measurement point of window temperature: (a) triple low-e glass; and (b) ventilated double-skin window.
Figure 13.
Measurement point of window temperature: (a) triple low-e glass; and (b) ventilated double-skin window.

Figure 14.
Room interior temperature sensor location.


Table 1.
Summary of the facilities installed in the artificial solar laboratory test chamber.
| Size | (W) 4725 × (D) 3450 × (H) 2650 | |
|---|---|---|
| Indoor chamber | Materials of the inside and outside | SS400, 0.54 T, Color Steel. |
| Insulation material | Urethane foam, 75 mm | |
| Floor | Access floor + 50 mm expanded polystyrene | |
| Temperature range | 15 °C to 30 °C | |
| Temperature: cooling | 26 °C (±1 °C) | |
| Temperature: heating | 22 °C (±1 °C) | |
| Outdoor chamber | Size | (W) 2600 × (D) 3450 × (H) 3770 |
| Materials of the inside and outside | SS400, 0.54 T, Color Steel. | |
| Insulation material | Urethane foam, 75 mm | |
| Floor | Urethane panel + plywood + linoleum | |
| Air circulation fan | Sirocco Fan, 12″ × 6″, four each | |
| Temperature range | −10 °C to 40 °C | |
| Temperature: cooling | 32 °C (±1 °C) | |
| Temperature: heating | −5 °C (±1 °C) | |
| Wind speed | 0–4.7 m/s (max. 80.0 rpm) | |
| Artificial sun light | Max. 1000 W/m2 (adjustable by the number of lights on/off control) |
Table 2.
Test chamber cases.
| Cases | Outer Glass | Inner Glass | Cavity Ventilation |
|---|---|---|---|
| A-1 | Clear single glass | Low-e glass + Argon + Low-e glass | X |
| A-2 | O | ||
| B-1 | Clear single glass | Reflective glass + Air + Low-e glass | X |
| B-2 | O |
Note: X: No ventilation, O: ventilation.
Table 3.
Temperature results of Case A (°C).
| Cases | Cavity Ventilation | Test No. | Outdoor Chamber | ⓐ Point | ⓑ Point | ⓒ Point | ⓓ Point | ⓔ Point | Indoor Chamber |
|---|---|---|---|---|---|---|---|---|---|
| A-1 | X | 1st | 28.6 | 36.1 | 44 | 36.8 | 39.4 | 34.5 | 28.2 |
| 2nd | 28.5 | 35.7 | 43.6 | 36.6 | 39.2 | 34.4 | 28.2 | ||
| Avg. | 28.6 | 35.9 | 43.8 | 36.7 | 39.3 | 34.5 | 28.2 | ||
| A-2 | O | 1st | 28.1 | 39.3 | 47.6 | 45.9 | 46.1 | 35.2 | 28.3 |
| 2nd | 28.1 | 39.4 | 47.7 | 45.9 | 46.2 | 35.5 | 28.3 | ||
| Avg. | 28.1 | 39.4 | 47.7 | 45.9 | 46.25 | 35.4 | 28.3 |
Table 4.
Results of SHGC and selectivity of Case A.
| Cases | Cavity Ventilation | SHGC | Visual Transmittance (Tvis) | Selectivity (Tvis/SHGCavg) | ||
|---|---|---|---|---|---|---|
| 1st Test | 2nd Test | Average | ||||
| A-1 | X | 0.46 | 0.46 | 0.46 | 0.29 | 0.63 |
| A-2 | O | 0.38 | 0.37 | 0.38 | 0.76 | |
Table 5.
Temperature results of Case B (°C).
| Cases | Cavity Ventilation | Test No. | Outdoor Chamber | ⓐ Point | ⓑ Point | ⓒ Point | ⓓ Point | ⓔ Point | Indoor Chamber |
|---|---|---|---|---|---|---|---|---|---|
| B-1 | X | 1st | 31.4 | 41.3 | 51.4 | 49.8 | 50.9 | 34.4 | 27.2 |
| 2nd | 31.3 | 38.9 | 50.4 | 48.2 | 49.6 | 34.1 | 27.2 | ||
| Avg. | 31.4 | 40.1 | 50.9 | 49.0 | 50.3 | 34.3 | 27.2 | ||
| B-2 | O | 1st | 31.4 | 37.9 | 46.7 | 42.5 | 38.3 | 33.4 | 27.2 |
| 2nd | 31.5 | 37.9 | 46.7 | 42.5 | 38.4 | 33.2 | 27 | ||
| Avg. | 31.5 | 37.9 | 46.7 | 42.5 | 38.4 | 33.3 | 27.1 |
Table 6.
Results of SHGC and selectivity of Case B.
| Cases | Cavity Ventilation | SHGC | Visual Transmittance (Tvis) | Selectivity (Tvis/SHGCavg) | ||
|---|---|---|---|---|---|---|
| 1st Test | 2nd Test | Average | ||||
| B-1 | X | 0.16 | 0.18 | 0.17 | 0.13 | 0.76 |
| B-2 | O | 0.09 | 0.07 | 0.08 | 1.63 | |
Table 7.
Cases of outdoor test cell experiment.
| Cases | Glass | Cavity Ventilation | Chamber Air Conditioning |
|---|---|---|---|
| I-1 | Triple low-e glass | X | Off |
| I-2 | Ventilated double skin window | O | Off |
| II-1 | Triple low-e glass | X | On |
| II-2 | Ventilated double skin window | O | On |
Table 8.
Measurement period and experiment case overview.
| Cases | Measurement Period | Glass | Cavity Ventilation | Chamber Air Conditioning | Indoor Temperature |
|---|---|---|---|---|---|
| I-1 | 15~23 May 2016 | Triple low-e glass | X | Off | - |
| I-2 | Ventilated double skin window | O | Off | - | |
| II-1 | 21 June~4 July 2016 | Triple low-e glass | X | On | 28.0 °C |
| II-2 | Ventilated double skin window | O | On | 28.0 °C |
Table 9.
Measurement equipment.
| Equipment | Specification | |
|---|---|---|
| Air conditioner | Product type | Inverter heating/cooling equipment |
| Cooling capacity | 3000 W/W | |
| Cooling power consumption | 950 W | |
| Cooling period energy consumption efficiency | 4.4 W/W | |
| PMV meter | Product type | testo480 |
| Temperature: Pt100 | Measuring range: −100 to +400 °C Resolution: 0.01 °C | |
| Temperature: TC Type K (NiCr-Ni) | Measuring range: −200~+1370 °C Accuracy: ±(0.3 °C to 0.1% of mv) Resolution: 0.1 °C | |
| Humidity: Capacitive | Measuring range: 0–100% RH(Relative Humidity) Resolution: 0.1% RH | |
| Velocity: Vane anemometer | Measuring range: 0.6 to +50 m/s (vane anemometer Ø 16 mm) 0.1 to +15 m/s (vane anemometer Ø 100 mm) Resolution: 0.1 m/s (vane anemometer Ø 16 mm) 0.01 m/s (vane anemometer Ø 100 mm) | |
| Velocity: Hot wire anemometer | Measuring range: 0 to +20 m/s Resolution: 0.01 m/s | |
| Comfort level measurement | Measuring range: 0 to +5 m/s Resolution: 0.01 m/s | |
Table 10.
Results of average room temperature and cumulative power consumption measurement.
| Cases | Outdoor Average Temperature (24 H) | Indoor Temperature | Cumulative Power Consumption | ||
|---|---|---|---|---|---|
| 24 H Average | 9 H Avg. (09:00~18:00) | Max. Temperature (24 H) | |||
| I-1 | 23.5 °C | 28.3 °C | 29.7 °C | 36.0 °C | - |
| I-2 | 23.5 °C | 27.9 °C | 29.1 °C | 35.1 °C | - |
| II-1 | 24.8 °C | 26.6 °C | 26.7 °C | 28.0 °C | 19,939 kWh |
| II-2 | 24.8 °C | 26.2 °C | 26.4 °C | 27.8 °C | 19,350 kWh |
Table 11.
Results of the indoor comfort measurement.
| Cases | PMV | ||
|---|---|---|---|
| 24 H Average | 9 h Avg. (09:00~18:00) | Max. PMV (24 H) | |
| I-1 | 1.44 | 1.88 | 3.60 |
| I-2 | 1.32 | 1.78 | 3.36 |
| II-1 | 0.85 | 1.04 | 1.50 |
| II-2 | 0.85 | 1.03 | 1.50 |
© 2017 by the authors. Licensee MDPI, Basel, Switzerland. This article is an open access article distributed under the terms and conditions of the Creative Commons Attribution (CC BY) license (http://creativecommons.org/licenses/by/4.0/).
Share and Cite
MDPI and ACS Style
Koo, B.; Lee, K.; An, Y.; Lee, K. Solar Heat Gain Reduction of Ventilated Double Skin Windows without a Shading Device. Sustainability 2018, 10, 64. https://doi.org/10.3390/su10010064
AMA Style
Koo B, Lee K, An Y, Lee K. Solar Heat Gain Reduction of Ventilated Double Skin Windows without a Shading Device. Sustainability. 2018; 10(1):64. https://doi.org/10.3390/su10010064
Chicago/Turabian StyleKoo, Bokyoung, Keonho Lee, Youngsub An, and Kyudong Lee. 2018. "Solar Heat Gain Reduction of Ventilated Double Skin Windows without a Shading Device" Sustainability 10, no. 1: 64. https://doi.org/10.3390/su10010064
Note that from the first issue of 2016, this journal uses article numbers instead of page numbers. See further details here.