Predictive Measurement of the Structure of Land Use in an Urban Agglomeration Space


School of Information Engineering, China University of Geosciences (Beijing), Beijing 100083, China
*
Author to whom correspondence should be addressed.
Sustainability 2018, 10(1), 65; https://doi.org/10.3390/su10010065
Submission received: 4 December 2017
/
Revised: 23 December 2017
/
Accepted: 28 December 2017
/
Published: 29 December 2017
(This article belongs to the Section Sustainable Urban and Rural Development)
Abstract
:The scientific measurement of land use in space is an essential task in urban agglomeration studies, and the fractal feature is one of the most powerful tools for describing the phenomenon of space. However, previous research on the fractal feature of land use has mostly been conducted in urban space, and examines the fractal feature of different land use types, respectively; thus, the measurement of the relationship between different land use types was not realized. Meanwhile, previous prediction methods used for spatial land use mostly relied on subjective abstraction of the evolution, theoretically, regardless of whether they were calibrated, so that complete coverage of all the mechanisms could not be guaranteed. Based on this, here, we treat the land use structure in urban agglomeration space as the research object, and attempt to establish a fractal measure method for the relationship between different land use types in the space of urban agglomeration. At the same time, we use the allometric relationship between “entirety” and “local” to establish an objective forecast model for the land use structure in urban agglomeration space based on gray prediction theory, to achieve a predictive measurement of the structure of land use in urban agglomeration space. Finally, this study applied the methods on the Beijing–Tianjin–Hebei urban agglomeration to analyze the evolution of the stability of the structure of land use and achieve predictive measurement of the structure of land use. The results of the case study show that the methods proposed in this study can obtain the measurement of the relationship between different land use types and the land use prediction that does not depend on the subjective exploration of the evolution law. Compared with the measurement methods that analyzed the fractal feature of different land types, respectively, and the prediction methods that rely on subjective choice, the methods presented in this study recaps some innovations and reference values for relevant future research.
1. Introduction
Urban agglomeration is the carrier of social development, which is an important research object in urban geography. However, the development of urban agglomeration has faced a series of objective problems, such as unreasonable spatial patterns, blind policy guidance, and the contradiction between people and land. Land is the spatial platform for these issues [1], and the study of the structure of land use and the description of its status and evolutionary trends within the space of urban agglomeration is, of course, the foundation and prerequisite for exploring the evolution of urban agglomerations to set land use policy, making an urban agglomeration sustainable land use plan for the future, and solving problems, such as the unbalanced land status, during the development of urban agglomerations.
From the rise of land use and cover change (LUCC) projects, there has been extensive research working on providing empirical and theoretical advances in this field of study. Scholars often use land use change models to simulate and predict land use change to understand the reasons for, and the progress of, the evolution. A dynamic model to simulate the conversion of land use and its effects (CLUE), was presented in 1996 by Veldkamp and Fresco [2] and has been widely used for the simulation of land use. Verburg et al. developed the CLUE-S model to analyze land use change at the regional scale [3]. McConnell presented agent-based models of land-use and land-cover change [4]. Manson applied the agent-based modeling of land change to the Southern Yucatan Peninsula Region of Mexico [5]. Aspinall simulated land use change with generalized linear models in Gallatin Valley [6]. He et al. developed a land use scenario dynamics model by integrating the system dynamics model and the cellular automata model [7]. Huang et al. used an unbalanced support vector machine to model urban land use change in relation to various factors, such as population, distance to roads and facilities, and surrounding land use [8], but this approach had relatively high costs with regards to machine memory and computation time. Liu et al. studied the spatiotemporal characteristics, patterns, and causes of land-use changes in China since the late 1980s [9]. Liu et al. established a temporal-spatial dynamics method (TSDM) model by integrating the system dynamics model and the cellular automata model [10]. Deal et al. incorporated geographic automata systems, semiparametric spatial models, a recently introduced development in statistical, computational, and spatial econometrics fields, and spatio-temporal analysis into an urban land use change modeling approach [11]. However, land use change is a complicated process, which is determined by the interaction of spatial and temporal factors, such as natural, social, and economic factors. The models used to describe the land use change would not function without the selection of factors or judgment criteria, and it is impossible to choose all factors to avoid subjective faults. In addition, the method for measuring the weight of each factor lacks scientific evidence, so it is hard to achieve universal recognition.
Since Mandelbrot revealed the fractal dimension in 1967 [12], fractals have provided a powerful tool for geographers to describe complex geographic phenomena, including studies on complex urban and land use. British geographers Batty and Longley have pointed out that fractals are an effective tool for describing urban areas, and have studied the fractal features of urban boundaries, patterns of land use, and urban growth fractal features [13,14,15]. Scholars, such as Liu and Chen [16] and Chen and Luo [17], have also carried out related research about urban morphology with fractals. In terms of describing land use, White and Engelen used a cellular automaton method to simulate the fractal pattern of urban land use for the first time [18]. Zhao et al. measured and analyzed the box-counting dimension of each land use type in the center of Shenyang [19]. Zhu and Cai [20], Sun et al. [21], and Wang et al. [22] measured the boundary dimension of each land use type separately according to the different land use types. Zhao et al. measured the fractal dimension of built-up land and water, and analyzed and discussed the threshold for construction [23].
The research into the fractal features of land use described above were not in the space of urban agglomeration and most studied the fractal features of different land use types separately; thus, the measurements of the relationship between different land use types were not realized. On the other hand, the growth simulations based on these methods need complex conversion rules, which usually rely on subjective factors that cannot reflect the evolution law objective. Fortunately, the gray prediction method can realize the nonlinear time series prediction with small amounts of information, and can avoid the investigation of complex evolution [24]. It estimate the value of the original sequence based on the accumulated generating operation sequence to weaken the randomness and volatility and protrude the regularity of the original sequence. In addition, it has been applied to predict the land use change effectively by many scholars [25,26,27]. The allometry model can establish the relationship between two kinds of measurement, by which we can obtain one measurement based on the other measurement [28]. As its geographical meaning has been proved clearly, the allometry model can be considered as scientific [29]. Thus, if we regard each land use type as the “local”—one measurement, and the space of urban agglomeration as the “entirety”—the other measurement, based on the gray prediction of the “entirety”, we can obtain the prediction of one land use type through the allometric relationship between this type and the “entirety”, which can avoid the consideration of the spatial interactions among each land use type.
Thus, to describe the relationship between different land use types using fractals (not the fractal features of each land use type separately), in this research we intend to consider different land use types as the same sample space and measure its fractal features in the urban agglomeration space, and establish the measurement method for the land use structure in the urban agglomeration space. At the same time, to avoid subjective faults in the selection of judgment criteria or factors according to the complex spatial interactions, with the allometric relationship we established the contact between the “entirety” and the “local”, and based on the gray prediction for the entirety of the land of the urban agglomeration space we achieve the prediction for the local land of the urban agglomeration space and the predictive fractal measurement of the structure of land use in the urban agglomeration space. The efficiency is increased by avoiding the separate prediction of each land type, avoiding the selection of factors or judgment criteria, and realizing the measurements of the fractals between different land use types (not each land use type, separately). Finally, we applied the measurement and prediction method proposed in this study to the space of the Beijing–Tianjin–Hebei urban agglomeration to analyze the spatial evolution of the structure of land use in the Beijing–Tianjin–Hebei urban agglomeration space to validate the feasibility of the methods.
2. Measurement of the Structure of Land Use in the Urban Agglomeration Space
2.1. Method
In a spatial phenomenon, the scale will change following a regular rule with the measurement change, and it can be measured as the dimension corresponding to this regular rule. This regular rule is the fractal feature of this phenomenon, and to find such regular rules we can measure the fractal features, where the dimension corresponding to the regular rules is the fractal dimension.
The boundary dimension [13] is one of the measurement methods for the spatial fractal features. If we regard the space as a collection of objects, the area change of each element within the collection will change the morphology, such as the perimeter of the element within the collection. If the area of the collection changes, we will obtain different sets of morphology. Here, A represents the collection area, and L denotes the collection perimeter that corresponds to the collection area:
where D is the boundary dimension.
The fractal was gradually applied to the study of the spatial structure of land use. However, most land use fractal features research based on the boundary dimension currently analyzed the patches of each land use type as a respective sample collection. Through establishing the area–perimeter relationship of each land use type, we can obtain the calculation of the fractal dimension of each land use type, respectively. Based on this we can further analyze the complexity, stability, and other characteristics of different land use types on the spatial structure.
This research is based on the idea of “considering different land use types together as one overall sample collection, and each land use type as one element in the sole overall sample collection”, and regard each pair of the total area and total perimeter as one sample point data in the same sample group, as shown in Figure 1, then, through the dataset composed with a variety of land use types we can measure the land use structure fractal features in the urban agglomeration space.
Therefore, this study uses A(ri) to denote the total area of type ri land, L(ri) to denote the total perimeter of type ri land, and according to Equation (1) they have the following relationship:
The fractal measure method above shows that the total perimeters of different land use types are the counts of measuring spatial fractal features by the total areas of different land use types. If the total perimeters and the total areas can satisfy Equation (2) using a statistical test of the adjusted coefficient of determination and the goodness-of-fit, it could be considered that the land use structure in the urban agglomerations have the fractal features, where D is the fractal dimension.
Meanwhile, based on the meaning of fractal dimension, D can be used to characterize the stability of morphology. The theoretical range of D should be between 1 and 2, where D = 1 represents the element is a square, D = 2 represents the element is a line, and D = 1.5 represents the status of the element is similar to Brownian motion. Xu et al. defined the stability index S of the elements based on the definition of fractal dimension [30]:
A greater stability index S means the element is more stable, and the stability derived from this relationship represents the coexistence stability in space between different land use types.
2.2. Data and Results
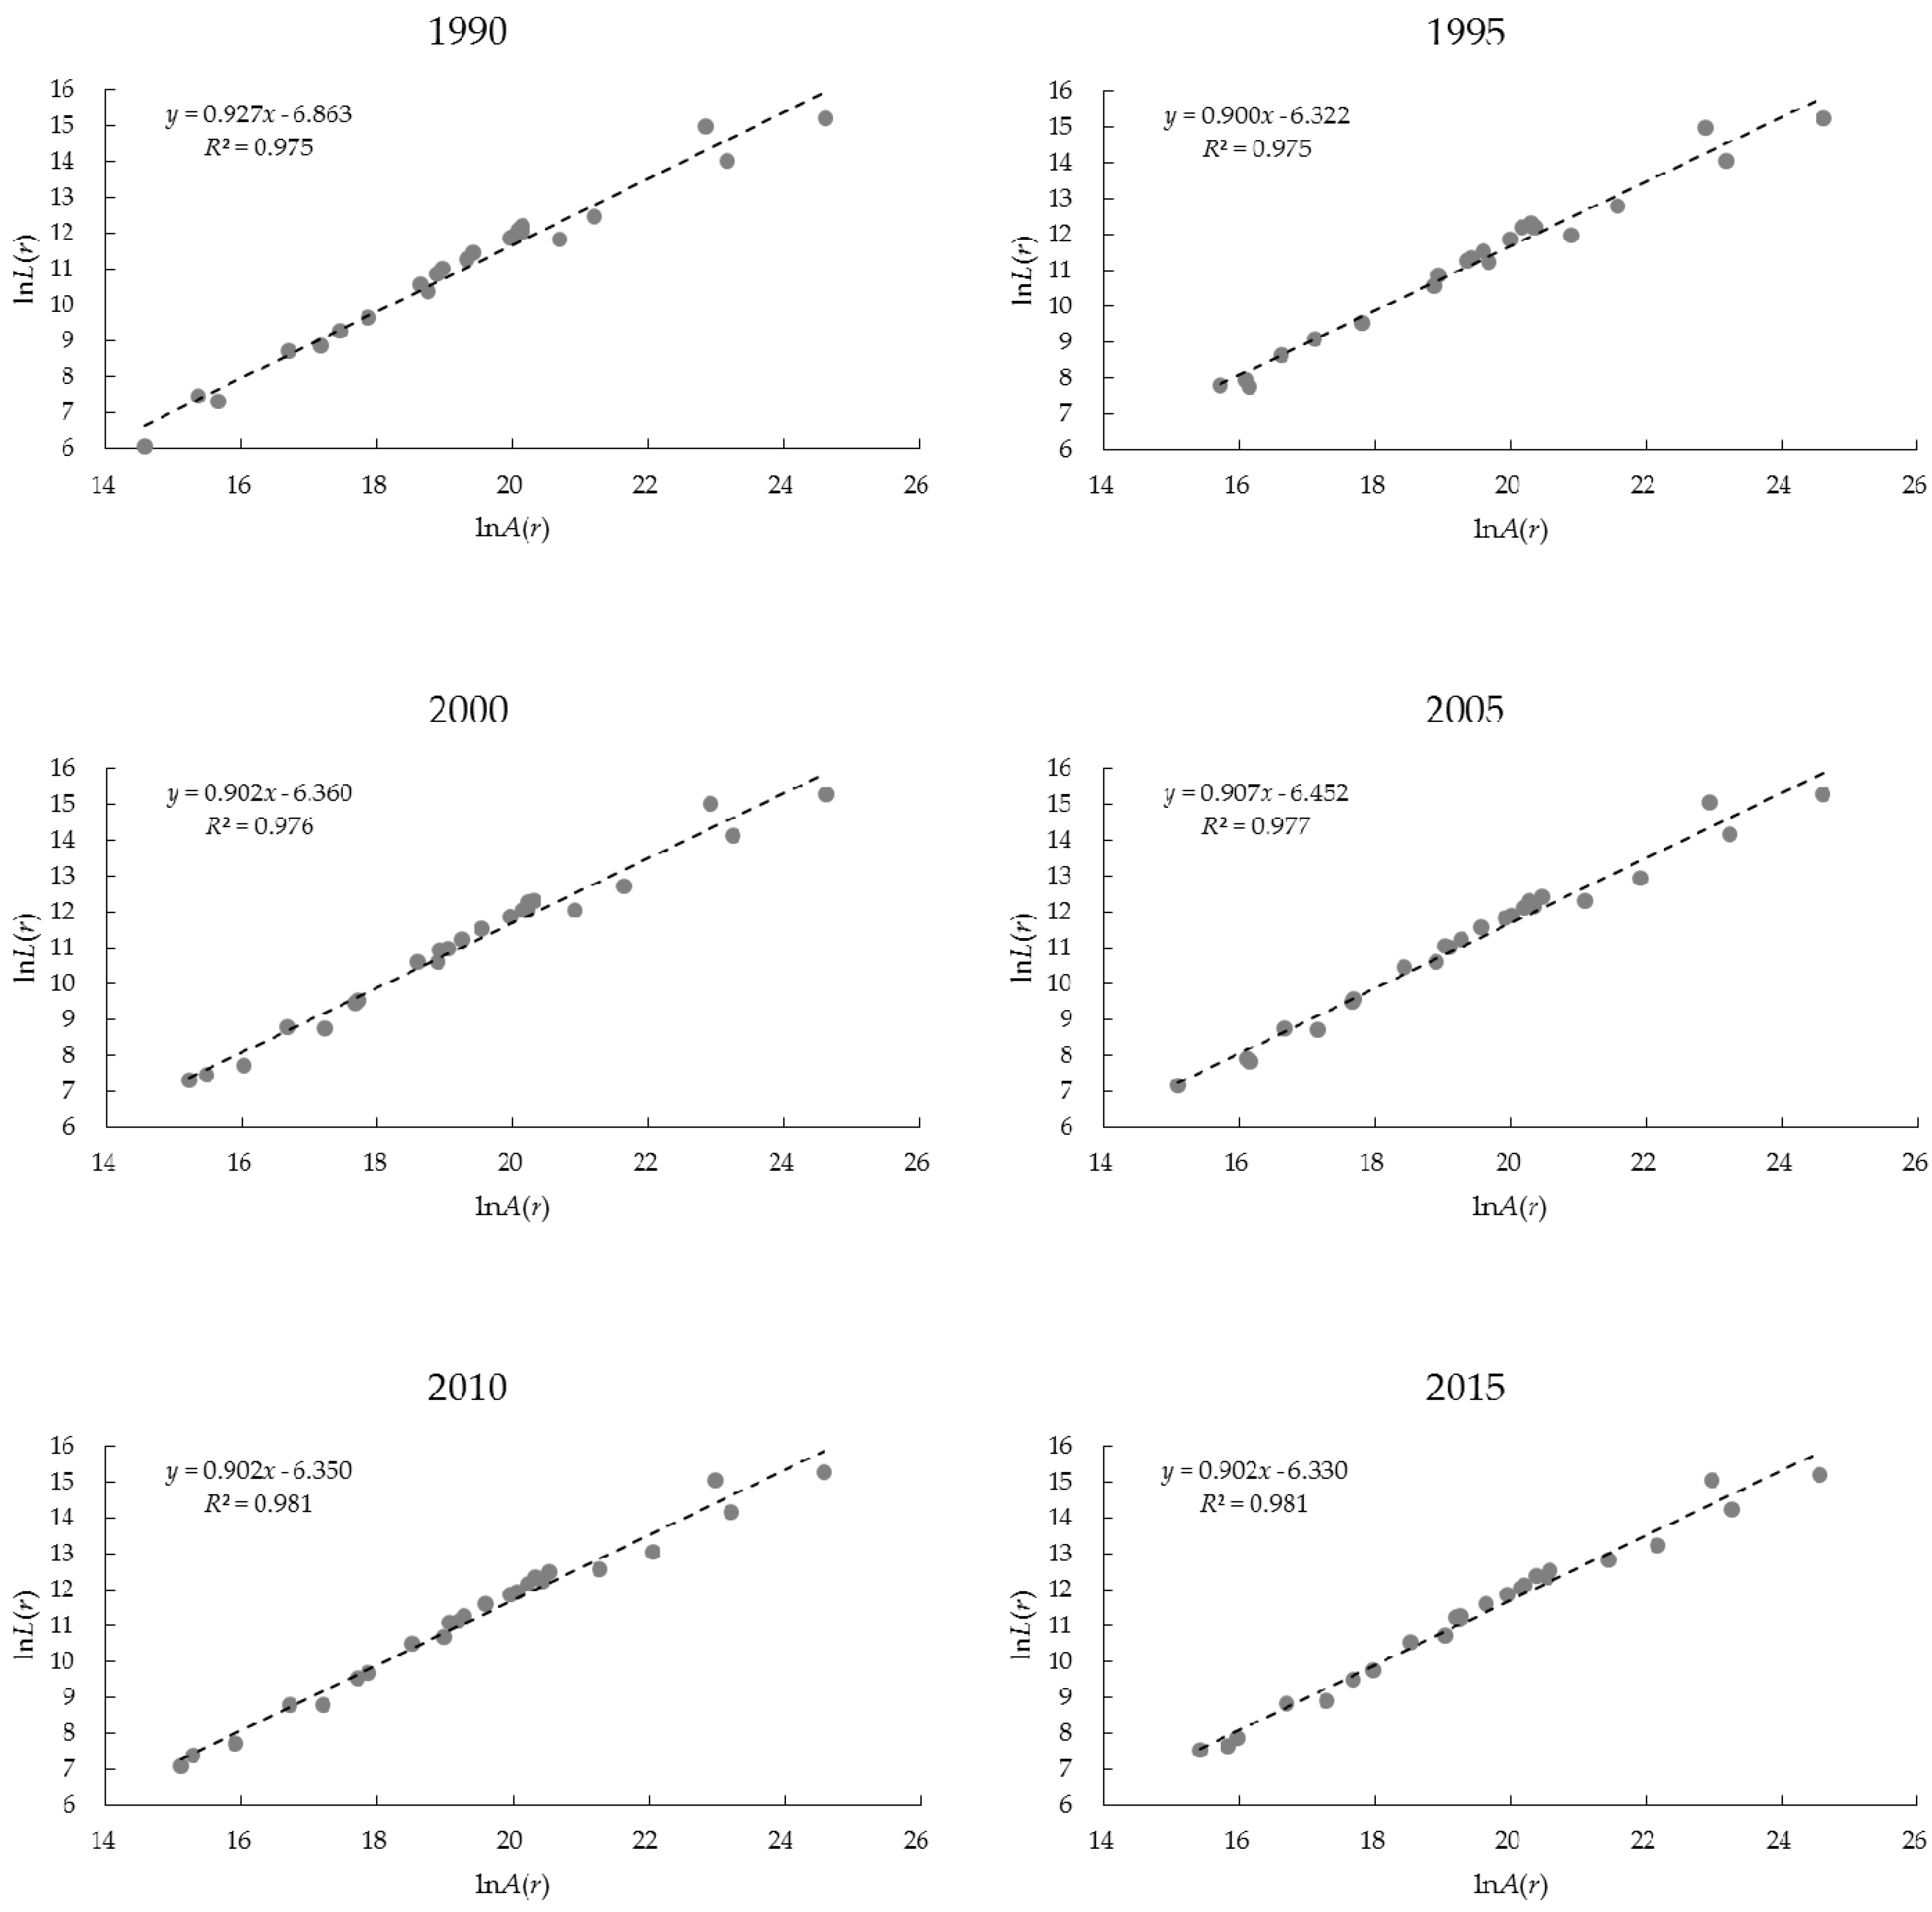
According to the measurement of fractals used in this study, we treat samples of different types of land use as one group. Based on the data from the “resources and environmental science data center, Chinese Academy of Sciences” platform [31], we apply the methods used to identify the space of urban agglomeration [32] for the recognition of study areas in 1990, 1995, 2000, 2005, 2010, and 2015. The recognition shows that there are 24 kinds of land use types within the space of Beijing–Tianjin–Hebei urban agglomeration (divided according to the second-level standard of the Resources and Environmental Science Data Center, Chinese Academy of Sciences). We determined the sequence of the total area of each land use type in order of size and used the ruler of the fractal dimension measurement method, thus, we can obtain the corresponding perimeters, which are the corresponding quantities for measurement. The data of land use in each urban agglomeration space of 1990, 1995, 2000, 2005, 2010, and 2015 were measured and had been plotted in the coordinate graph, it can be seen that the relationship between areas and perimeters of different land use types in different periods can present a power law, which is the typical feature of the fractals of the structure of land use in urban agglomeration, thus, it can be considered that the structure of land use in the urban agglomeration space is a fractal. On this basis, to measure the stability of the structure of land use, it is necessary to calculate the spatial dimension of fractals. According to the typical fractal, the logarithm of the area and the perimeters of the space should present a good linear relation, thus, the boundary dimension should be satisfied:
where c is a constant and D is the boundary dimension.
Therefore, the fractal dimension can be solved by linear regression of the double logarithmic curves. In this case we perform the linear regression for the double logarithmic samples of each period to draw the linear change line between the two groups of logarithm variables. According to the regression effect, the goodness-of-fit R2 in each period is above 0.97, and the reliability and the complexity of the curves are relatively, moderate. The regression curves are shown in Figure 2.
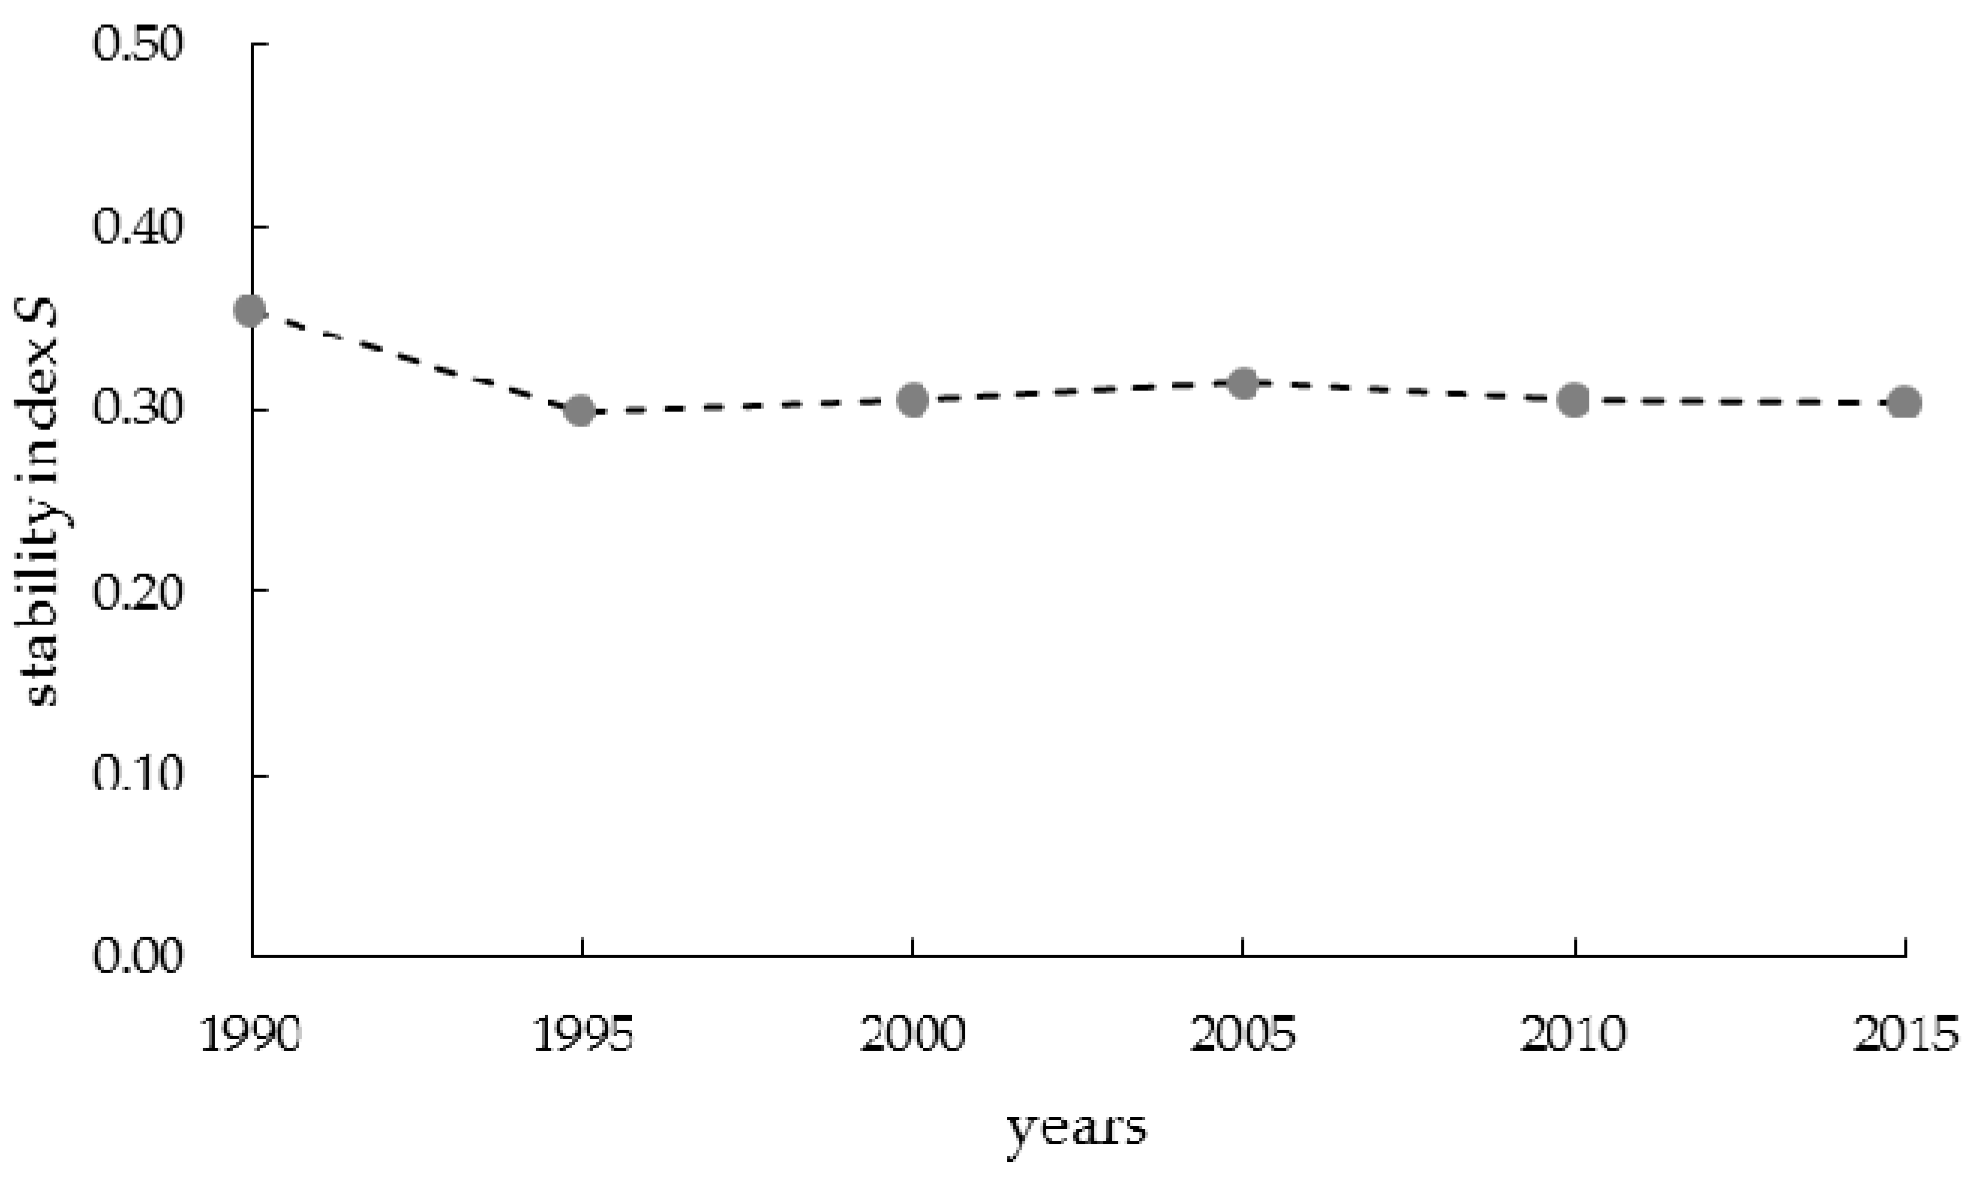
Through the analysis of the double logarithmic fitting function of the area and perimeter of each land use type, we can obtain the boundary dimension of the spatial structure of land use types in each period. According to Equation (3), the calculation formula of the elements’ stability index S, the coexistence stability in space between different land use types is calculated on the basis of obtaining the fractal dimension of the spatial structure of land use in each period. The value of S represents the stability of the elements, as shown in Table 1 and Figure 3.
From the calculation of the spatial stability index of the structure of land use, we can obtain that the stability index of the structure of land use in the urban agglomeration had a sudden drop in the early 1990s, and then remained stable. On the whole, the spatial stability of the structure of land use is maintained at a low level, indicating that the current urban agglomeration is in the state of “random movement”, which is consistent with the actual free development and actual unforced planning of urban agglomeration. This also proves the rationality of the fractal measurement for the structure of land use in the urban agglomeration space to a certain extent.
3. Prediction for the Structure of Land Use in Urban Agglomeration Space
3.1. Method
According to the measurement method for the structure of land use mentioned above, the areas and perimeters of various land use types are the basic data for measuring the stability of the spatial structure of land use. Therefore, to realize the predictive measurement of the fractal features of the structure of land use, the area and perimeter of various land use types should be predicted. On the other hand, an allometry model can establish the relationship between two kinds of measurement, by which we can obtain one predictive measurement through the gray prediction of another measurement. If every land use type can be seen as one measurement, the sum of all kinds of land use type, namely the urban agglomeration space, can be seen as the other measurement. In this research, we aim to predict the area and perimeter of each land use type. Through the gray prediction of the “entirety”, the urban agglomeration space, we can realize the predictive measurement for the “local”, each land use type, using the established allometric growth relationship between the total area of the urban agglomeration space and the area and perimeter of each land use type.
The allometry model was introduced into geography from biology, according to the following definition: the growth rate of the local relative to the entirety or another local is proportional, thus, we can obtain the general model of allometric growth as:
Equation (5) can be transformed into:
where ea is the proportionality constant and c is the allometric coefficient. Therefore, if yA is the temporal series of the total area of urban agglomeration space, xiA is the temporal series of the area of land type i, xiP is the temporal series of the perimeter of type i land, and then we can obtain the following equations separately by nonlinear regression:
where ciA is the allometric coefficient of the area of land type i and the total area of the urban agglomeration space, and ciP is the allometric coefficient of the perimeter of land type i and the total area of the urban agglomeration space.
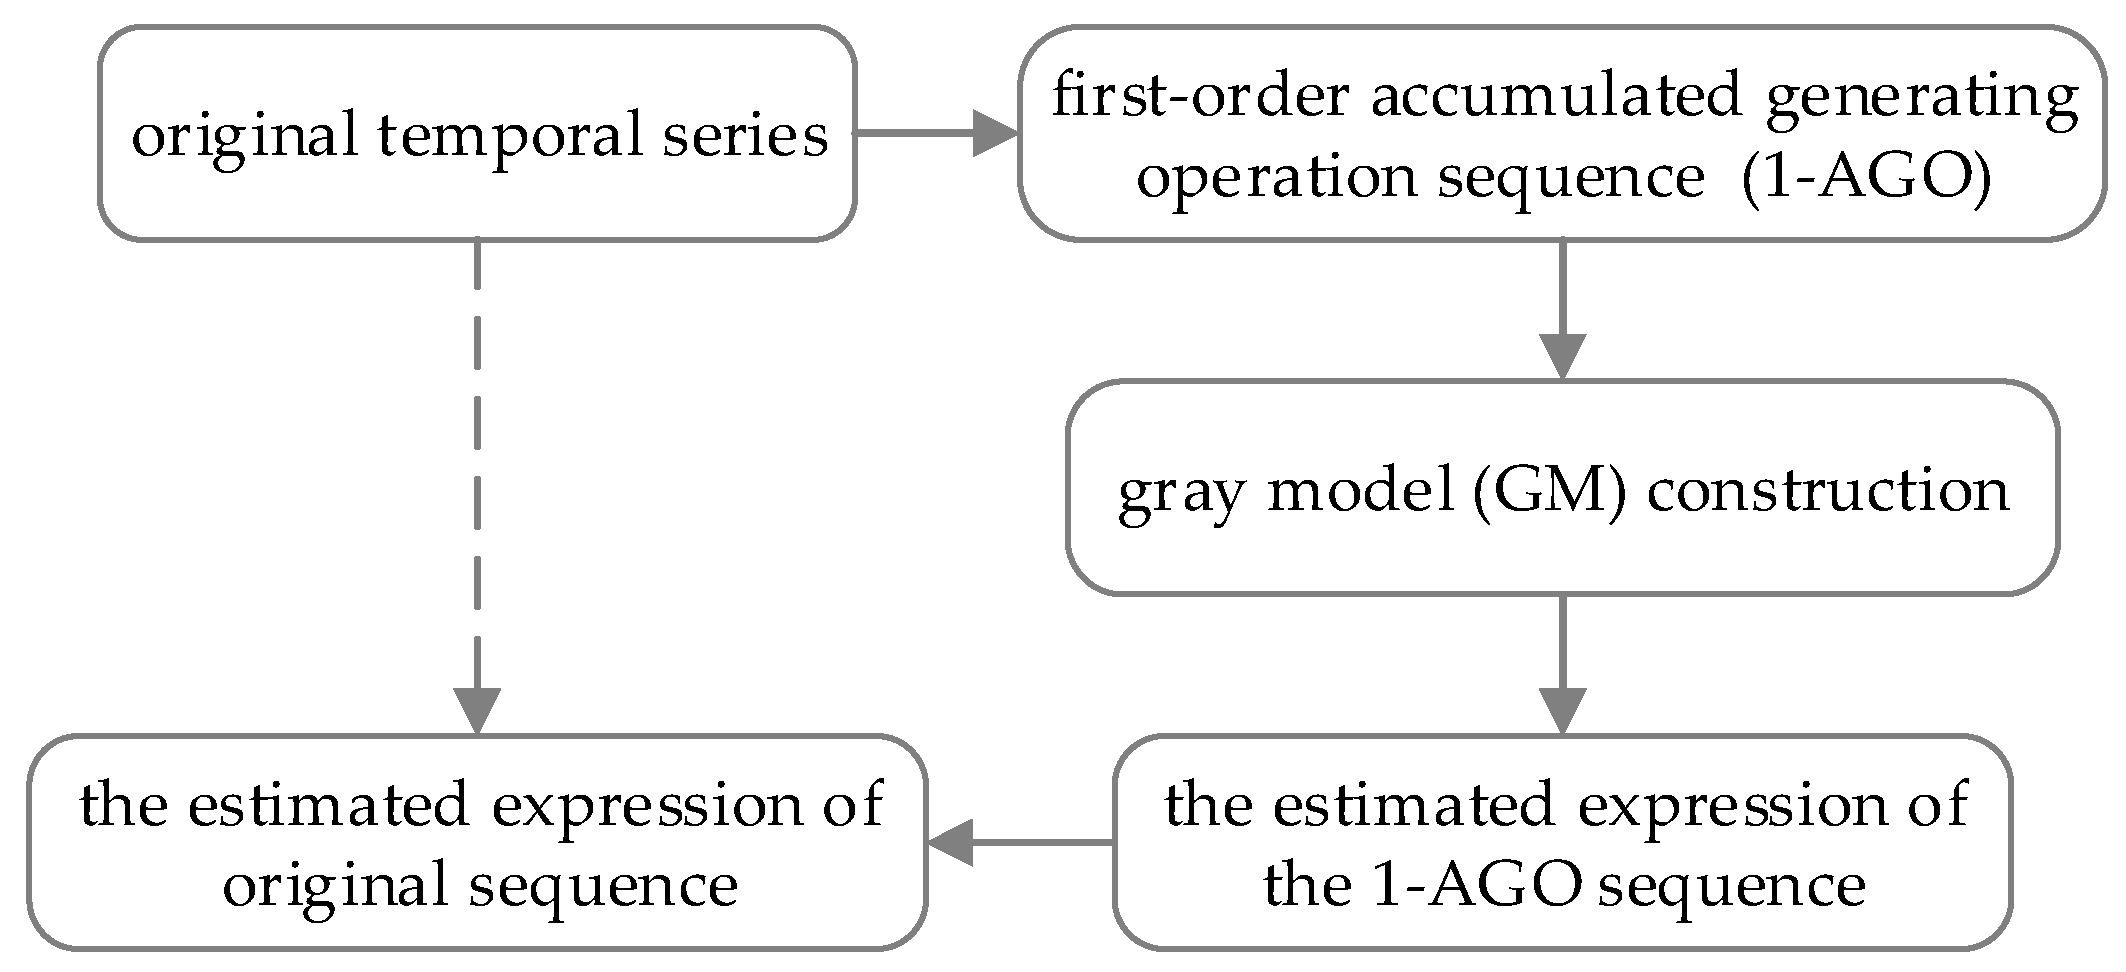
Based on establishing two kinds of allometry models, the prediction of one measurement change can be realized by gray prediction. According to the idea that, based on the predictions of the “entirety” to forecast the “local” and the established allometry model, the urban agglomeration space is the entirety in this study. Therefore, the total area of the urban agglomeration space is the prediction object chosen by gray prediction. In simple terms, gray prediction generating a regular sequence by accumulating the original temporal series data to weaken the randomness and volatility of the original sequence, and to protrude the regularity of the original sequence firstly. Following which the accumulated sequence could be modeled and the estimated expression of the accumulated sequence could be regress further to estimate the value of the original sequence, this progress can be simplified as Figure 4.
The original total area temporal series of the urban agglomeration space is known as {y(0)(1), y(0)(2), y(0)(3), …, y(0)(n)} whose length is n. The first-order accumulated generating operation (1-AGO) sequence can be generated by the original sequence and the 1-AGO sequence is {y(1)(1), y(1)(2), y(1)(3), …, y(1)(n)}, where:
The gray model constructed using the 1-AGO sequence has many forms. In this study, the most widely used gray model—the mean form GM (1, 1) model—is used as the prediction model, in which the time response of the GM (1, 1) model is solved by a differential equation:
In Equation (10), a is the development coefficient and b is the gray action quantity. The value of a and b can be estimated by the least-squares method using the known original sequence and the 1-AGO sequence. On this basis, we can obtain the estimated expression of the 1-AGO sequence by the solution of the differential equation (Equation (10)). The estimation expression of the original sequence can be obtained by generating one first-order reduced generating operation on :
As a result, we can predict the total area of the urban agglomeration space through Equation (11). Based on the allometry model established between the total area of the urban agglomeration space and the area and perimeter of each land use type, namely Equations (7) and (8), we can realize the prediction of various land use types within the urban agglomeration space. Finally, the prediction of the stability of the spatial land use structure can be achieved through the measurement method of the structure of land use in urban agglomeration space.
3.2. Data and Results
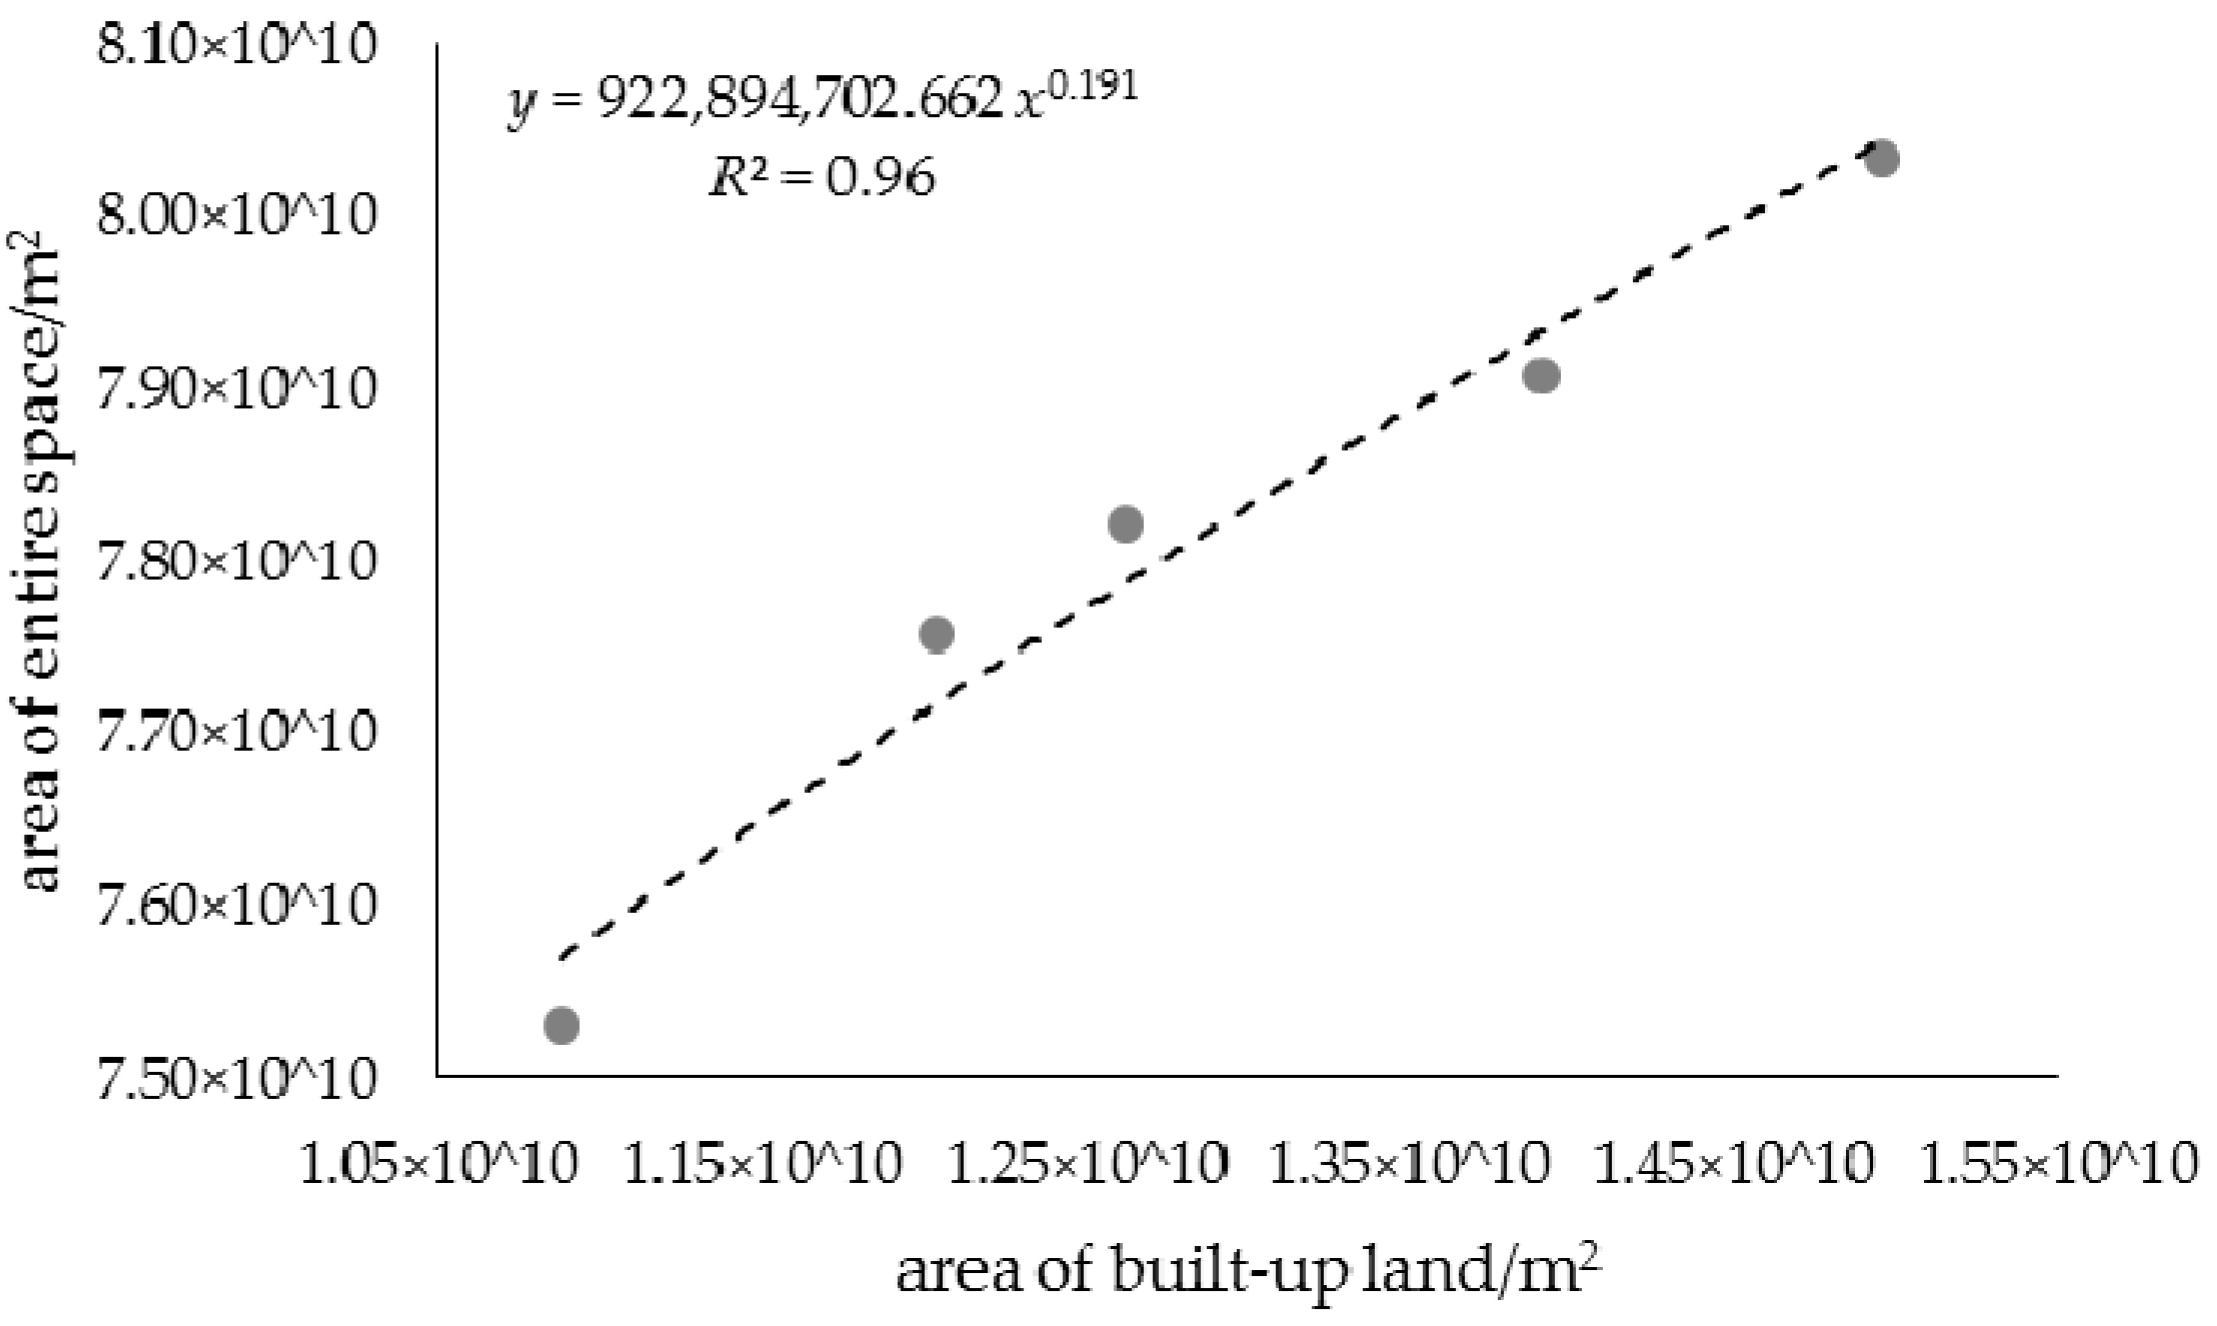
Based on the gray prediction method for various land use types in the urban agglomeration space on the basis of the allometry model, this case took the identified urban agglomeration space in 1990, 1995, 2000, 1995, 2010, and 2015 (as the control group) as study areas. First, the allometry models between the total area of the urban agglomeration space and the area and perimeter of each land use type were established, and the required data are obtained by the same way as the data in Section 2. The area and perimeter of each land use type were matched with the total area of the urban agglomeration space by temporal series and were plotted on different coordinates as the sample points of different groups with different land use types. Then, the power function fitting was applied to the corresponding sample points of various land use types to draw the power law curves between different “local” and “entirety” variable pairs. According to the fitting effect, both goodness-of-fit R2 are above 0.94, and the reliability and the complexity of the curves are moderate, relatively. The fitting curves are shown in Figure 5 and Figure 6 (for reasons of brevity, only the built-up land divided according to the first-level standard is used as an example).
It can be seen from the fitting results and the function that the change of the two sample points groups are both in accordance with the power law. It is indicated that the relationship between the total area of the urban agglomeration space and the area and perimeter of built-up land can present an allometric growth relationship; that is:
The allometric coefficients are 0.191 and 0.360.
Based on establishing the relationship between the “entirety” and the “local”, this case further predicted the change of the total area of the urban agglomeration space by gray prediction. The original total area temporal series of the urban agglomeration space is {75,308,293,669, 77,583,545,808, 78,212,536,933, 79,077,344,520, 80,341,676,686} whose length is 5. The 1-AGO sequence was generated from the original sequence and the 1-AGO sequence is {75,308,293,669, 152,891,839,478, 231,104,376,411, 310,181,720,931, 390,523,397,618}. The mean form GM (1, 1) model was constructed using the 1-AGO sequence and the value was estimated by the least-squares method using the known original sequence and the 1-AGO sequence that a = −0.012 and b = 76,111,535,540.611.
Based on the above, the estimated expression of 1-AGO sequence was obtained from the mean form GM (1, 1) model:
The prediction formula of the total area temporal series of the urban agglomeration space is obtained:
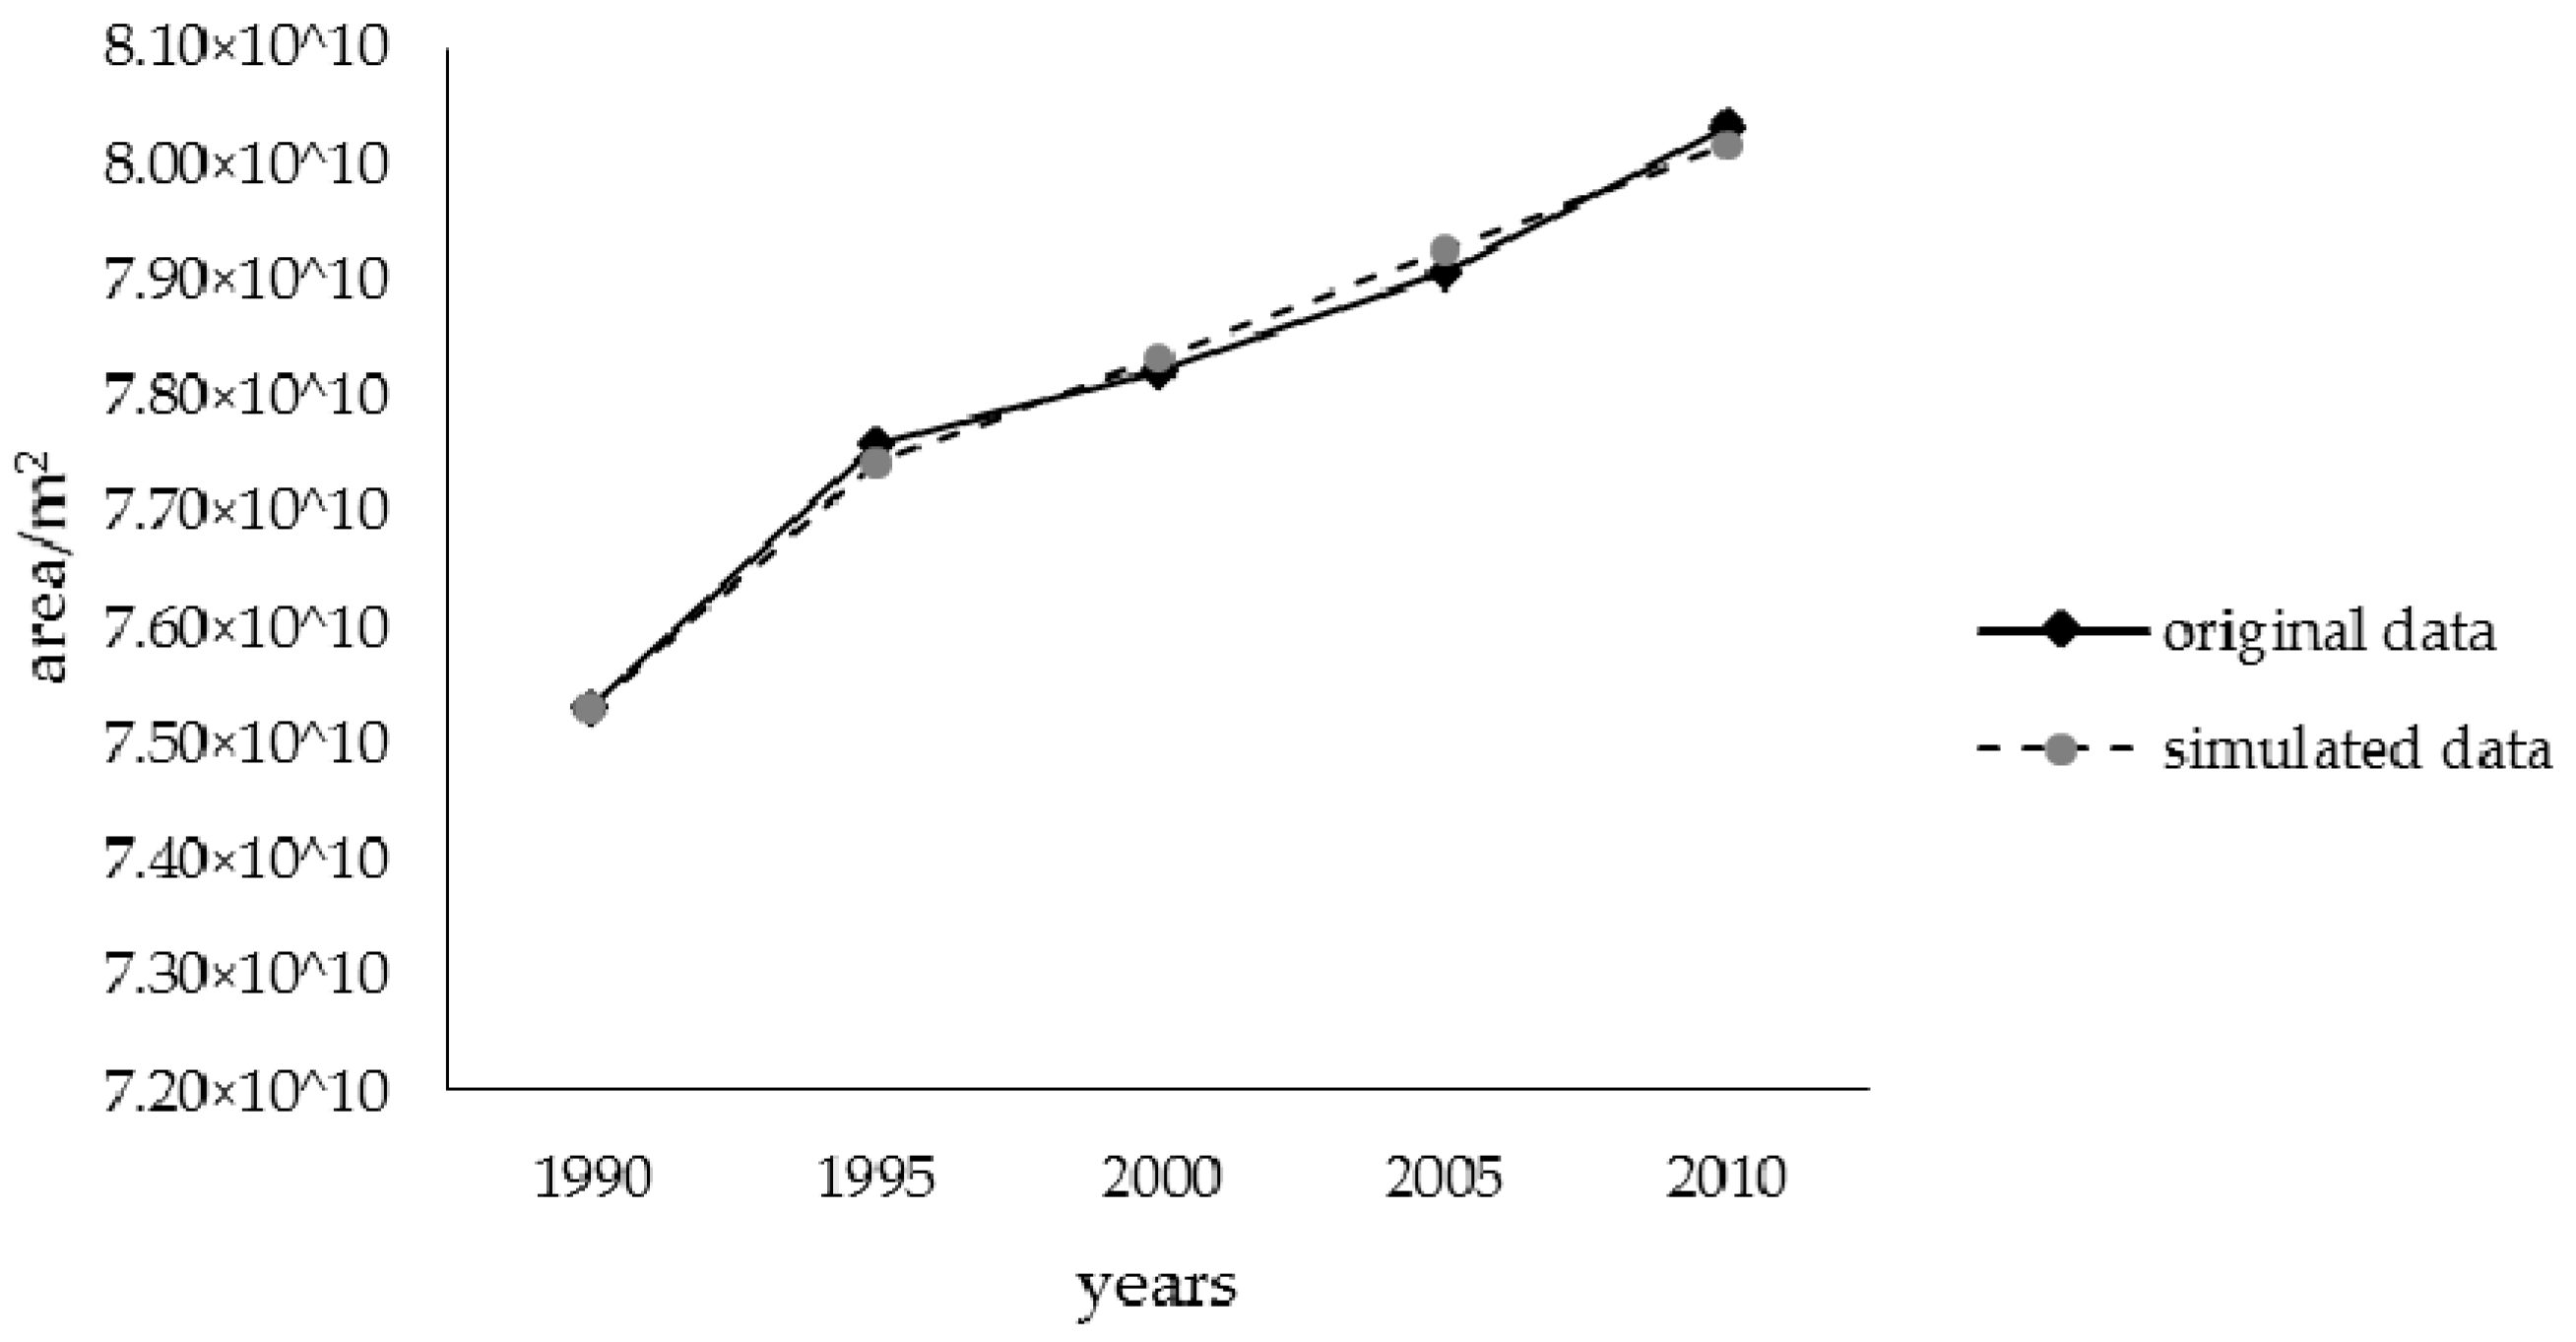
It is estimated that the average relative error is 0.195%. The reliability and complexity of the curve are relatively moderate. At the same time, this case also predicted the total area of urban agglomeration space for three periods in the future through the prediction of Equation (15) of the total area temporal series of the urban agglomeration space. The data for both simulation and prediction and the results of the simulation and prediction are listed in Table 2 and shown in Figure 7.
It can be seen from the simulation or prediction results that the relative errors of the results remain low, and the simulation sequence is basically coincident with the original sequence. The simulation results are better.
On the basis of the gray prediction for the total area of the urban agglomeration space, in this case we calculated the predicted value of the area and perimeter of the built-up land in the three future periods through the allometric relationship between the “entirety” and “local”, the total area of the urban agglomeration space, and the area and perimeter of the built-up land, which were established before the prediction, namely Equations (12) and (13). At the same time, this case repeated the steps above and predicted the area and perimeter of each land use type divided according to the first-level standard of the Resources and Environmental Science Data Center, Chinese Academy of Sciences in the three future periods. The predicted data is shown in Table 3 and Table 4.
As a summary, the areas of all kinds of land use type are increasing, which is related to the growth of the urban agglomeration space as a whole. The simulation results of areas and perimeters of various land use types in 2015 show that the relative errors between the predicted value and the control value remain low and the simulation effects are better. Therefore, it is reasonable to believe that the predicted values of the areas and perimeters of various land use types in the future three periods can meet the requirements of forecasting the land use status in urban agglomeration space.
Finally, this case used the prediction results of various land use types in urban agglomeration to achieve the predictive measurement for the spatial structure of land use and its stability in the three future periods through the measurement method for the fractal of the structure of land use. The predicted results of spatial fractal dimension and stability index are shown in Table 5.
According to the fitting effect of the relationship curve of the predicted areas or predicted perimeters of all land types, the goodness-of-fit R2 are both above 0.96. The reliability and complexity of the curve are relatively moderate. It can be seen from the calculation of the spatial stability index of the structure of land use that the stability index of the structure of land use remained stable (because the types of structure of land use were divided according to a different standard level, the stability index cannot be compared with the results in Section 2.2), but, at a low level. This indicates that all kinds of land in the urban agglomeration space will remain in a state of disorder.
In conclusion, this case has demonstrated the connection between “entirety” and “local” based on the establishment of the allometry model, and has realized the prediction for the “local” from the prediction for the “entirety”. Finally, the prediction of the basic land use data needed for the measurement of the structure of land use in the urban agglomeration space is realized, based on which the predictive measurement of the structure of land use and its stability in the urban agglomeration space has been realized.
4. Conclusions
From the perspective of the structure of land use in urban agglomeration space, this research realized the measurement of the structure of land use by establishing a fractal measure method for the relationship between different land use types (not for each land use type, separately). The spatial fractal dimension has been used to describe the development momentum of various types of land in space as the structural stability. The measurement of the structure of land use in urban agglomeration in 1990, 1995, 2000, 2005, 2010, and 2015 has been realized and the feasibility of this method has been verified by taking the Beijing–Tianjin–Hebei urban agglomeration as the study area.
Second, this study realized the prediction or simulation of the total area of urban agglomeration space by constructing and applying the gray prediction model on temporal series. The prediction of the structure of land use has been realized by further utilizing the constructed allometric relationship. Finally, the simulation or predictive measurement of the structure of land use in the Beijing–Tianjin–Hebei urban agglomeration has been achieved and the feasibility of this method has been verified. The methods used in this paper have the following innovative value:
- (1)
- The perspective used in this study for measuring the fractal is different from the traditional measurement method used in previous studies that separately analyzed the fractal feature of different land use types. The method proposed in this study can obtain the measurement of the fractal feature and the fractal measure of the relationship between different land use types by grouping different types of land as one overall sample collection, which can recap some innovations and reference values for the relative predictive measure of the land use structure in space from the field of fractals.
- (2)
- The prediction method used in this paper regards the development and evolution of land use in urban agglomeration space as a black box that does not need to be detected, which is different from the traditional measurement methods used in previous studies that rely on complex transformation rules by subjective abstraction. Our approach applies the gray prediction method and the allometry model to realize the prediction of the “local” through the prediction of the “entirety”. This can avoid the incompleteness and subjectivity in the mining of the complex evolution law, such as the selections of factors and judgment criteria, and can avoid using reductionism. The approach obtains the predictive fractal measurement on the structure of land use with higher efficiency by only needing to predict the “entirety” instead of repeating the same predictions for each type of land separately. It can provide some innovative reference for the improvement of the land use development goals or related regulatory policies.
Although, of course, this paper implements the measurement and prediction of the structure of land use in urban agglomeration space, the application directions of the measurement results still require further excavation. In addition, constrained by the lack of original sequence data, the accuracy of the prediction results can be further improved.
Acknowledgments
This research was supported by the Fund for Scientific Research in the Public Interest, Ministry of Land and Resources, China (201511010-07).
Author Contributions
Fei Liu and Xinqi Zheng conceived and designed the experiments; Fei Liu performed the experiments, analyzed the data and wrote the paper; Qing Huang contributed the editing of language.
Conflicts of Interest
The authors declare no conflict of interest.
References
- Guo, S. Urban Land Use Structure and Land Use Efficiency in Hercynian Urban Agglomeration. Econ. Geogr. 2017, 37, 170–175, 180. [Google Scholar]
- Veldkamp, A.; Fresco, L.O. CLUE: A conceptual model to study the conversion of land use and its effects. Ecol. Model. 1996, 85, 253–270. [Google Scholar] [CrossRef]
- Verburg, P.H.; Soepboer, W.; Veldkamp, A.; Limpiada, R.; Espaldon, V.; Mastura, S.S.A. Modeling the spatial dynamics of regional land use: The CLUE-S Model. Environ. Manag. 2002, 30, 391–405. [Google Scholar] [CrossRef] [PubMed]
- McConnell, W.J. Agent-Based Models of Land-Use and Land-Cover Change. Available online: http://citeseerx.ist.psu.edu/viewdoc/download?doi=10.1.1.125.9851&rep=rep1&type=pdf (accessed on 4 December 2017).
- Manson, S.M. Agent-based modeling and genetic programming for modeling land change in the Southern Yucatan Peninsular Region of Mexico. Agric. Ecosyst. Environ. 2005, 111, 47–62. [Google Scholar] [CrossRef]
- Aspinall, R. Modeling land use change with generalized linear models: A multi-model analysis of change between 1860 and 2000 in Gallatin Valley, Montana. J. Environ. Manag. 2004, 72, 91–103. [Google Scholar] [CrossRef] [PubMed]
- He, C.; Shi, P.; Chen, J.; Li, X.; Pan, Y.; Li, J.; Li, Y.; Li, J. Developing land use scenario dynamics model by the integration of system dynamics model and cellular automata model. Sci. China Ser. D Earth Sci. 2005, 48, 1979–1989. [Google Scholar] [CrossRef]
- Huang, B.; Xie, C.; Tay, R.; Wu, B. Land-use-change modeling using unbalanced support-vector machines. Environ. Plan. B Plan. Des. 2009, 36, 398–416. [Google Scholar] [CrossRef]
- Liu, J.; Kuang, W.; Zhang, Z.; Xu, X.; Qin, Y.; Ning, J.; Zhou, W.; Zhang, S.; Li, R.; Yan, C.; et al. Spatiotemporal characteristics, patterns, and causes of land-use changes in China since the late 1980s. J. Geogr. Sci. 2014, 24, 195–210. [Google Scholar] [CrossRef]
- Liu, D.; Zheng, X.; Zhang, C.; Wang, H. A new temporal–spatial dynamics method of simulating land-use change. Ecol. Model. 2017, 350, 1–10. [Google Scholar] [CrossRef]
- Deal, B.; Pan, H.; Zhuang, Y. Modeling Land-Use Change in Complex Urban Environments. In Reference Module in Earth Systems and Environmental Sciences; Elsevier: New York, NY, USA, 2017. [Google Scholar]
- Mandelbrot, B. How long is the coast of Britain? Statistical self-similarity and fractional dimension. Science 1967, 156, 636–638. [Google Scholar] [CrossRef] [PubMed]
- Batty, M.; Longley, P.A. Fractal-based description of urban form. Environ. Plan. B 1987, 14, 123–134. [Google Scholar] [CrossRef]
- Batty, M.; Longley, P.A. Fractal Cities: A Geometry of Form and Function; Academic Press: London, UK, 1994. [Google Scholar]
- Batty, M. Fractals: New ways at looking at cities. Nature 1995, 377, 574. [Google Scholar] [CrossRef]
- Liu, J.; Chen, Y. Fractal dimensions of spatial structure of an urban system and the methods of their determination. Geogr. Res. 1999, 18, 171–172. [Google Scholar]
- Chen, Y.; Luo, J. A tentative theoretical interpretation of the fractal dimension of urban form. Urban Dev. Stud. 2006, 13, 35–40. [Google Scholar]
- White, R.; Engelen, G. Cellular Dynamics and GIS: Modelling spatial complexity. Geogr. Syst. 1994, 1, 237–253. [Google Scholar]
- Zhao, H.; Wang, D.; Tan, X. A study on fractal characteristics of Shenyang’s urban form and spatial structure. Planners 2007, 2, 81–83. (In Chinese) [Google Scholar]
- Zhu, X.; Cai, Y. Fractal analysis of land use in China. Sci. Geogr. Sin. 2005, 25, 671–677. (In Chinese) [Google Scholar]
- Sun, D.; Zhao, C.; Wei, H.; Peng, D. Based on fractal dimension model for land use change of Tailan River Basin. J. Soil Water Conserv. 2010, 24, 218–222. [Google Scholar]
- Wang, D.; Yuan, C.; Zhou, W.; Zhang, Y. A case study on Xianfeng County, Hubei province: Land use scene pattern features based on fractal theory. Resour. Ind. 2012, 6, 148–153. (In Chinese) [Google Scholar]
- Zhao, K.; Feng, Y.; Han, G. Calculating the area of urban-rural construction land based on the human-earth harmonious fractal relations. City Plan. Rev. 2011, 7, 20–23. (In Chinese) [Google Scholar]
- Liu, S.; Yang, Y.; Wu, L. Grey System Theory and Its Application, 7th ed.; Science Press: Beijing, China, 2014. (In Chinese) [Google Scholar]
- Wang, H.T.; Guo, W.D.; Li, H. Improvement of Grey Prediction Model GM (1, 1) Based on RAGA and Its Application in Land Use Change Forecasting of HuLin City; Destech Publications, Inc.: Lancaster, PA, USA, 2014. [Google Scholar]
- Wang, R.; Zhang, R.; Chen, Y. Forecast of urban and rural construction land based on the multiple regression analysis and gray model in Kangle Country. J. Gansu Agric. Univ. 2012, 47, 134–139. (In Chinese) [Google Scholar]
- Chen, F.; Sun, P.; Liu, X.; Zhang, X. Dynamic change prediction of the cultivated land in Lanzhou city based on the Gray Model (1, 1). Hunan Agric. Sci. 2009, 3, 110–112. (In Chinese) [Google Scholar]
- Beckmann, M.J.; McPherson, J. City size distributions in a central place hierarchy: An alternative approach. J. Reg. Sci. 1970, 10, 25–33. [Google Scholar] [CrossRef]
- Chen, Y. Fractal City System: Scaling · Symmetry · Spatial Complexity; Science Press: Beijing, China, 2008. (In Chinese) [Google Scholar]
- Xu, J.; Ai, N.S.; Jin, J. A fractal study on the mosaic structure of the landscape of northwest China: Taking the drainage area of Heihe River as an example. Arid Zone Res. 2001, 18, 426–436. (In Chinese) [Google Scholar]
- Resources and Environmental Science Data Center, Chinese Academy of Sciences. Available online: http://www.resdc.cn (accessed on 28 December 2017).
- Liu, F.; Zheng, X.; Huang, Q. Identification of the physical space of urban systems based on fractal analysis. Prog. Geogr. 2017, 36, 677–684. (In Chinese) [Google Scholar]
Figure 1.
Schematic diagram of sampling the spatial features of land use types.

Figure 2.
Curve of the double logarithmic fitting function of the area and perimeter of land use type in the urban agglomeration space in each period.
Figure 2.
Curve of the double logarithmic fitting function of the area and perimeter of land use type in the urban agglomeration space in each period.

Figure 3.
Diagram of stability index in the urban agglomeration space in each period.

Figure 4.
Schematic diagram of gray prediction.

Figure 5.
Relationship between the area of built-up land and the area of the entire space.

Figure 6.
Relationship between the perimeter of built-up land and the area of the entire space.
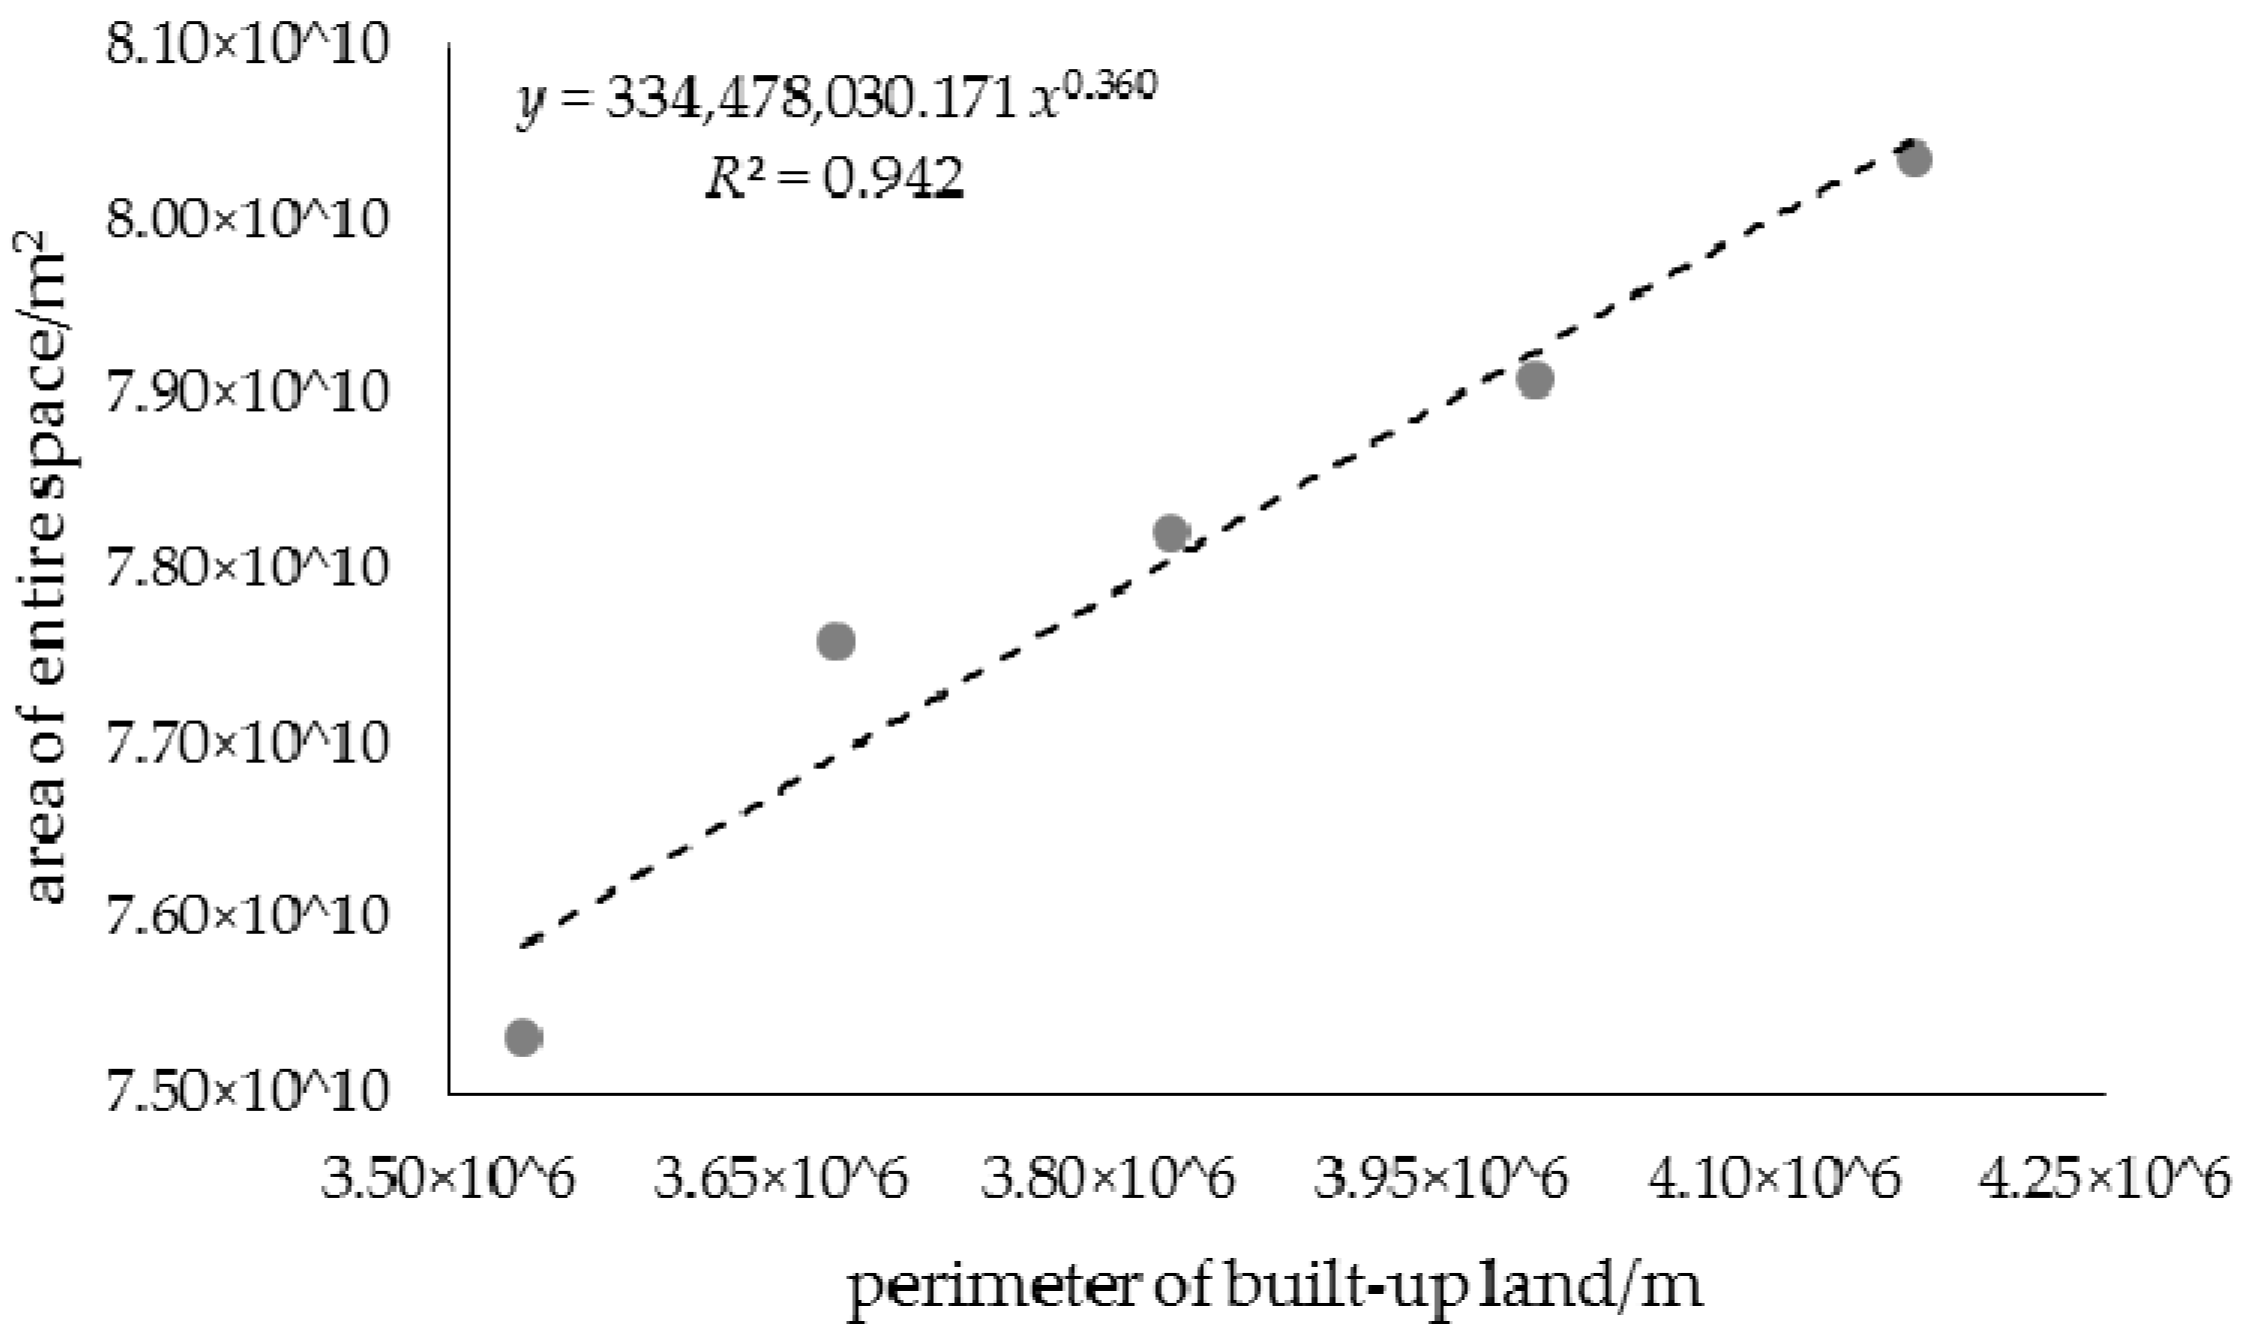
Figure 7.
Comparison between the original sequence and the simulated sequence of the area of the entire space.
Figure 7.
Comparison between the original sequence and the simulated sequence of the area of the entire space.

Table 1.
Boundary dimension and stability index in the urban agglomeration space in each period.
| Year | Boundary Dimension | Stability Index S |
|---|---|---|
| 1990 | 1.854 | 0.354 |
| 1995 | 1.800 | 0.300 |
| 2000 | 1.805 | 0.305 |
| 2005 | 1.814 | 0.314 |
| 2010 | 1.805 | 0.305 |
| 2015 | 1.804 | 0.304 |
Table 2.
Simulation and prediction of the area of entire space of urban agglomeration each period.
| Year | Original Area/m2 | Simulation (Prediction) Area/m2 | Residual Error/m2 | Relative Error/% |
|---|---|---|---|---|
| 1990 | 75,308,293,669 | 75,308,293,669 | - | - |
| 1995 | 77,583,545,808 | 77,435,169,842 | 148,375,966 | 0.191 |
| 2000 | 78,212,536,933 | 78,339,887,796 | −127,350,863 | −0.163 |
| 2005 | 79,077,344,520 | 79,255,176,072 | −177,831,551 | −0.225 |
| 2010 | 80,341,676,686 | 80,181,158,166 | 160,518,520 | 0.200 |
| 2015 | (80,489,246,119) | (81,117,959,023) | 628,712,903 | 0.781 |
| 2020 | - | (82,065,705,042) | - | - |
| 2025 | - | (83,024,524,103) | - | - |
Table 3.
Prediction of the area of each land use type in the space of urban agglomeration.
| First-Level Type | Control Value/m2 | Predicted Value/m2 | Relative Error/% | ||
|---|---|---|---|---|---|
| 2015 | 2015 | 2020 | 2025 | 2015 | |
| Built-up land | 15,681,730,864 | 16,099,047,598 | 17,362,973,275 | 18,726,128,928 | 2.661 |
| Cultivated land | 59,286,570,034 | 60,139,381,219 | 60,054,307,424 | 59,969,353,976 | 1.438 |
| Forestry land | 1,607,041,921 | 1,618,905,493 | 1,762,435,107 | 1,918,689,831 | 0.738 |
| Grass land | 1,393,238,489 | 1,374,197,195 | 1,402,846,262 | 1,432,092,602 | −1.367 |
| Water area | 2,291,987,657 | 2,286,443,778 | 2,404,009,889 | 2,527,621,103 | −0.242 |
| Unused land | 228,677,151 | 210,280,588 | 203,636,738 | 197,202,802 | −8.045 |
Table 4.
Prediction of the perimeter of each land use type in the space of urban agglomeration.
| First-Level Type | Control Value/m | Predicted Value/m | Relative Error/% | ||
|---|---|---|---|---|---|
| 2015 | 2015 | 2020 | 2025 | 2015 | |
| Built-up land | 4,287,521 | 4,340,524 | 4,525,789 | 4,718,962 | 1.236 |
| Cultivated land | 5,494,681 | 5,837,889 | 5,964,840 | 6,094,553 | 6.246 |
| Forestry land | 477,534 | 476,587 | 509,900 | 545,542 | −0.198 |
| Grass land | 427,690 | 428,968 | 441,962 | 455,349 | 0.299 |
| Water area | 710,355 | 720,746 | 755,799 | 792,557 | 1.463 |
| Unused land | 70,389 | 64,817 | 63,014 | 61,262 | −7.916 |
Table 5.
Boundary dimension and stability index of each land use type in the space of urban agglomeration.
Table 5.
Boundary dimension and stability index of each land use type in the space of urban agglomeration.
| Year | Boundary Dimension | Stability Index |
|---|---|---|
| 2015 | 1.638 | 0.138 |
| 2005 | 1.646 | 0.146 |
| 2010 | 1.654 | 0.154 |
© 2017 by the authors. Licensee MDPI, Basel, Switzerland. This article is an open access article distributed under the terms and conditions of the Creative Commons Attribution (CC BY) license (http://creativecommons.org/licenses/by/4.0/).
Share and Cite
MDPI and ACS Style
Liu, F.; Zheng, X.; Huang, Q. Predictive Measurement of the Structure of Land Use in an Urban Agglomeration Space. Sustainability 2018, 10, 65. https://doi.org/10.3390/su10010065
AMA Style
Liu F, Zheng X, Huang Q. Predictive Measurement of the Structure of Land Use in an Urban Agglomeration Space. Sustainability. 2018; 10(1):65. https://doi.org/10.3390/su10010065
Chicago/Turabian StyleLiu, Fei, Xinqi Zheng, and Qing Huang. 2018. "Predictive Measurement of the Structure of Land Use in an Urban Agglomeration Space" Sustainability 10, no. 1: 65. https://doi.org/10.3390/su10010065
Note that from the first issue of 2016, this journal uses article numbers instead of page numbers. See further details here.