Wet Deposition of Trace Metals at a Typical Urban Site in Southwestern China: Fluxes, Sources and Contributions to Aquatic Environments

Abstract
:1. Introduction
2. Methods
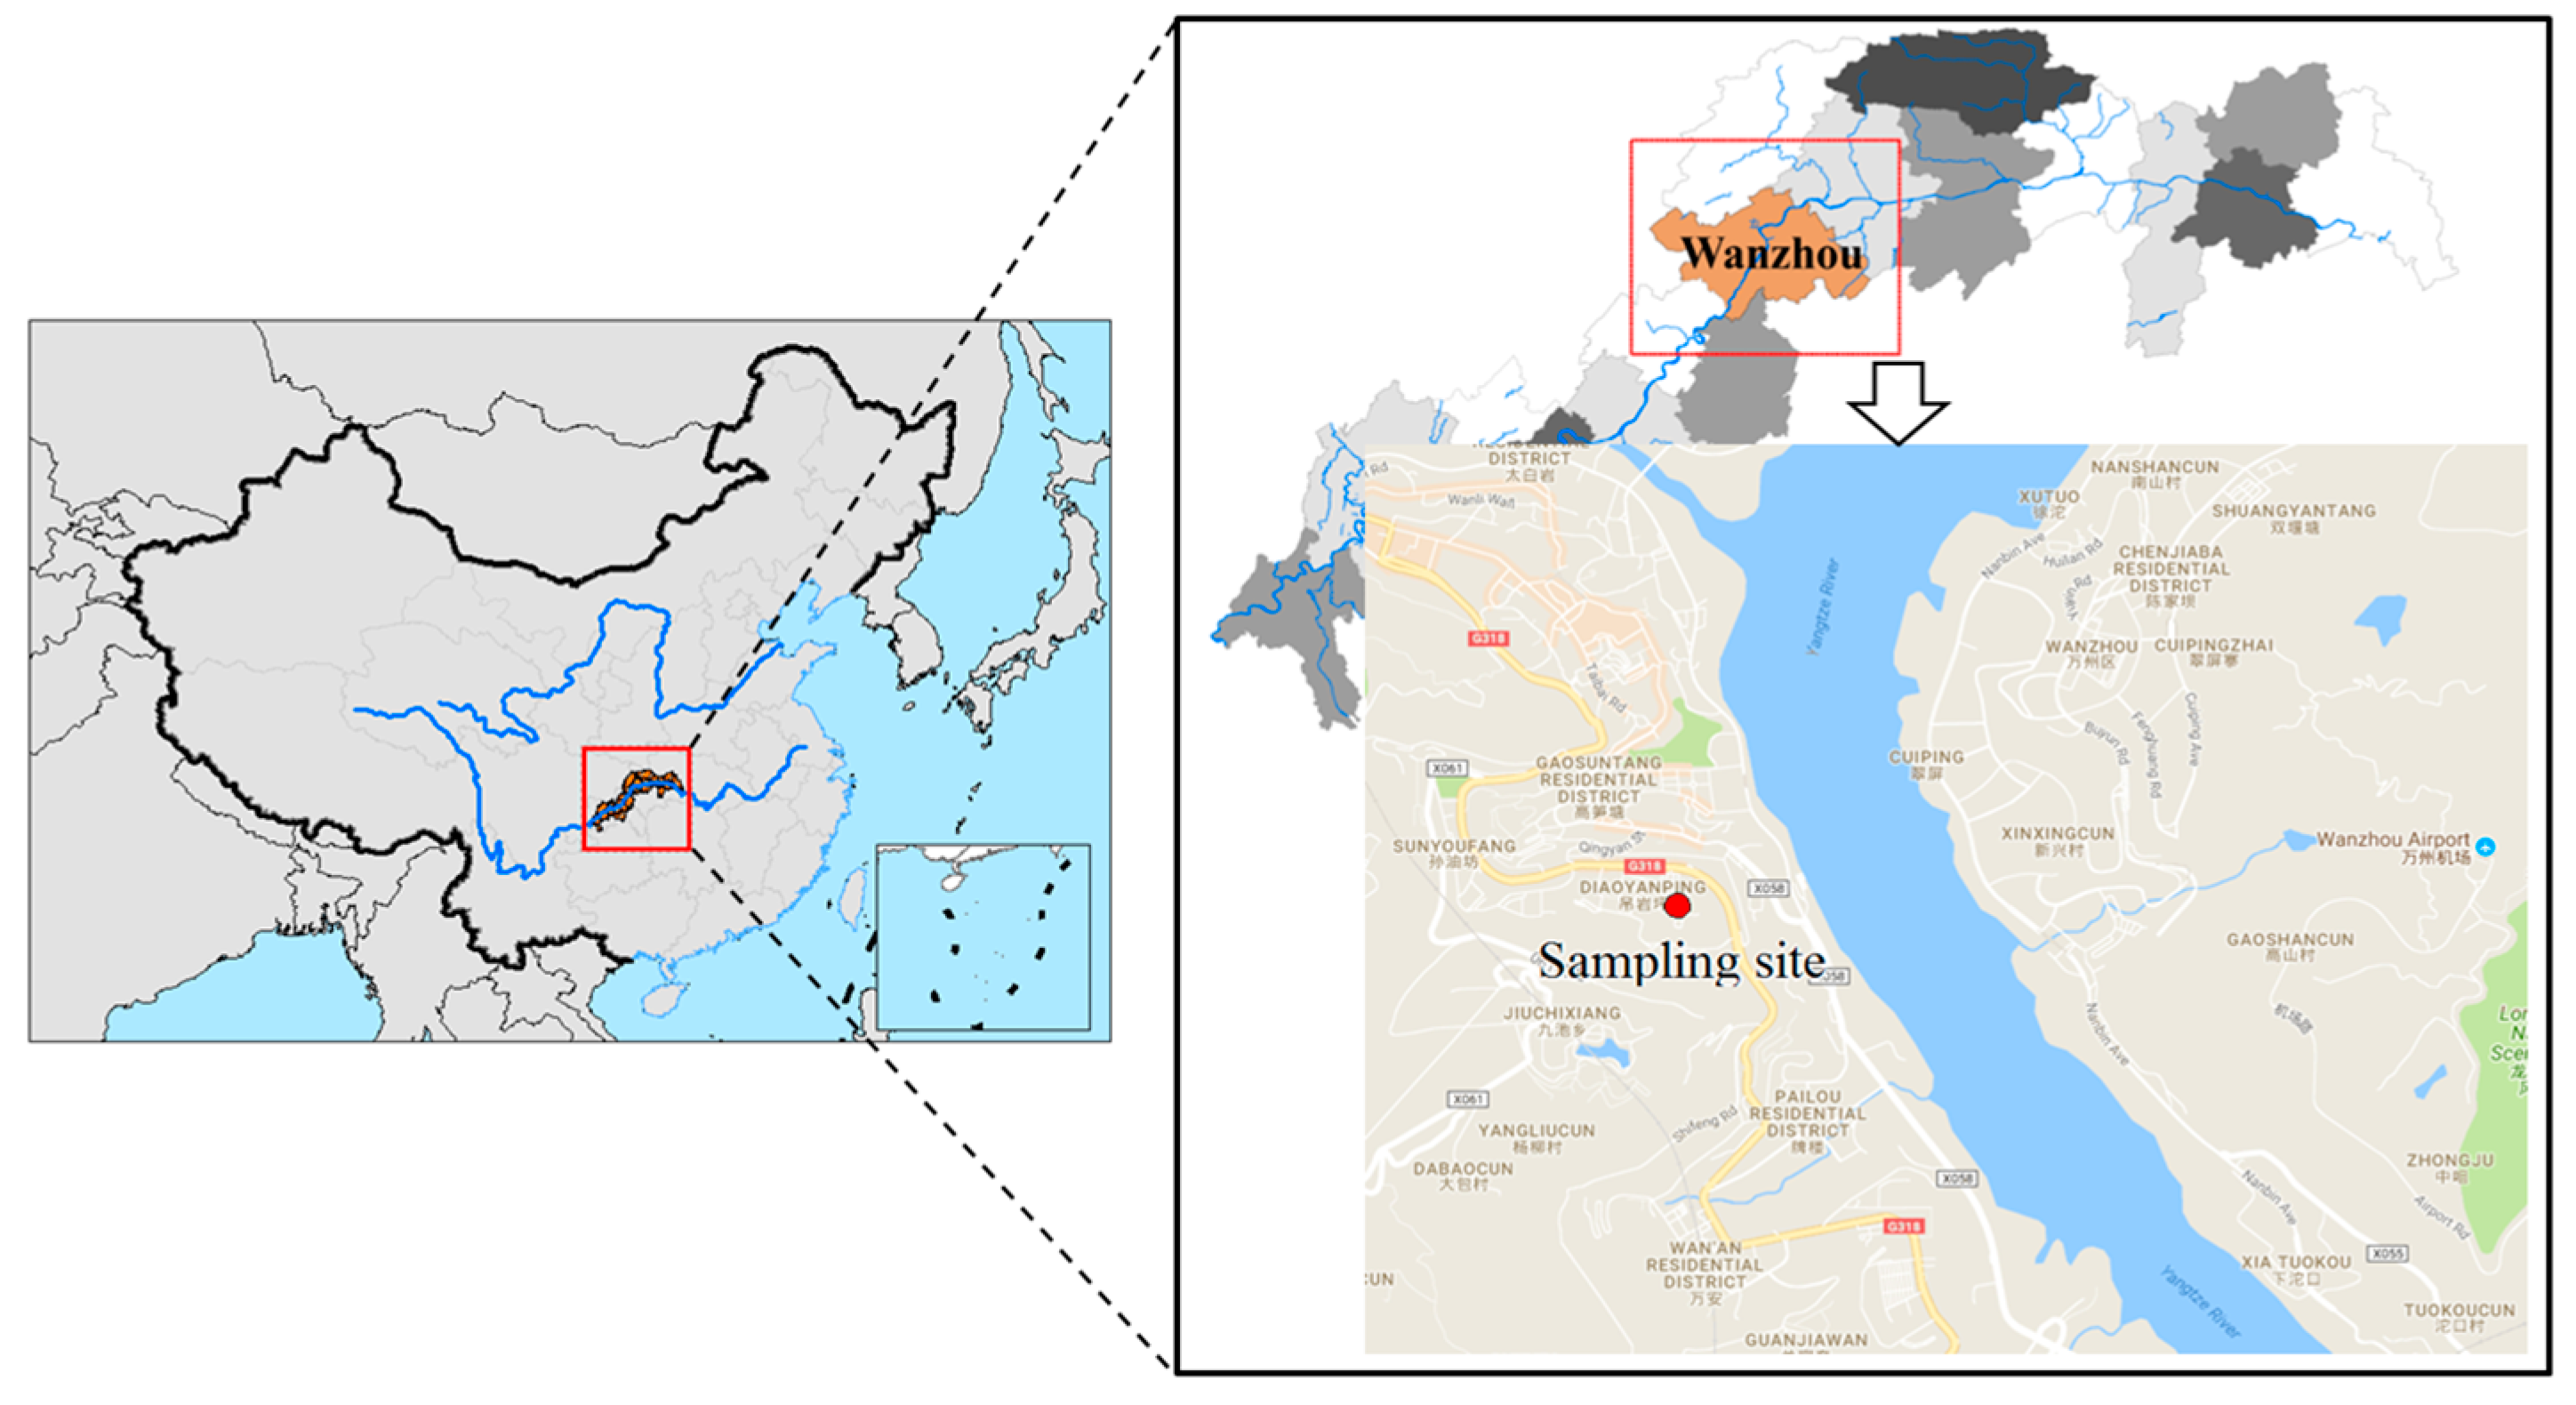
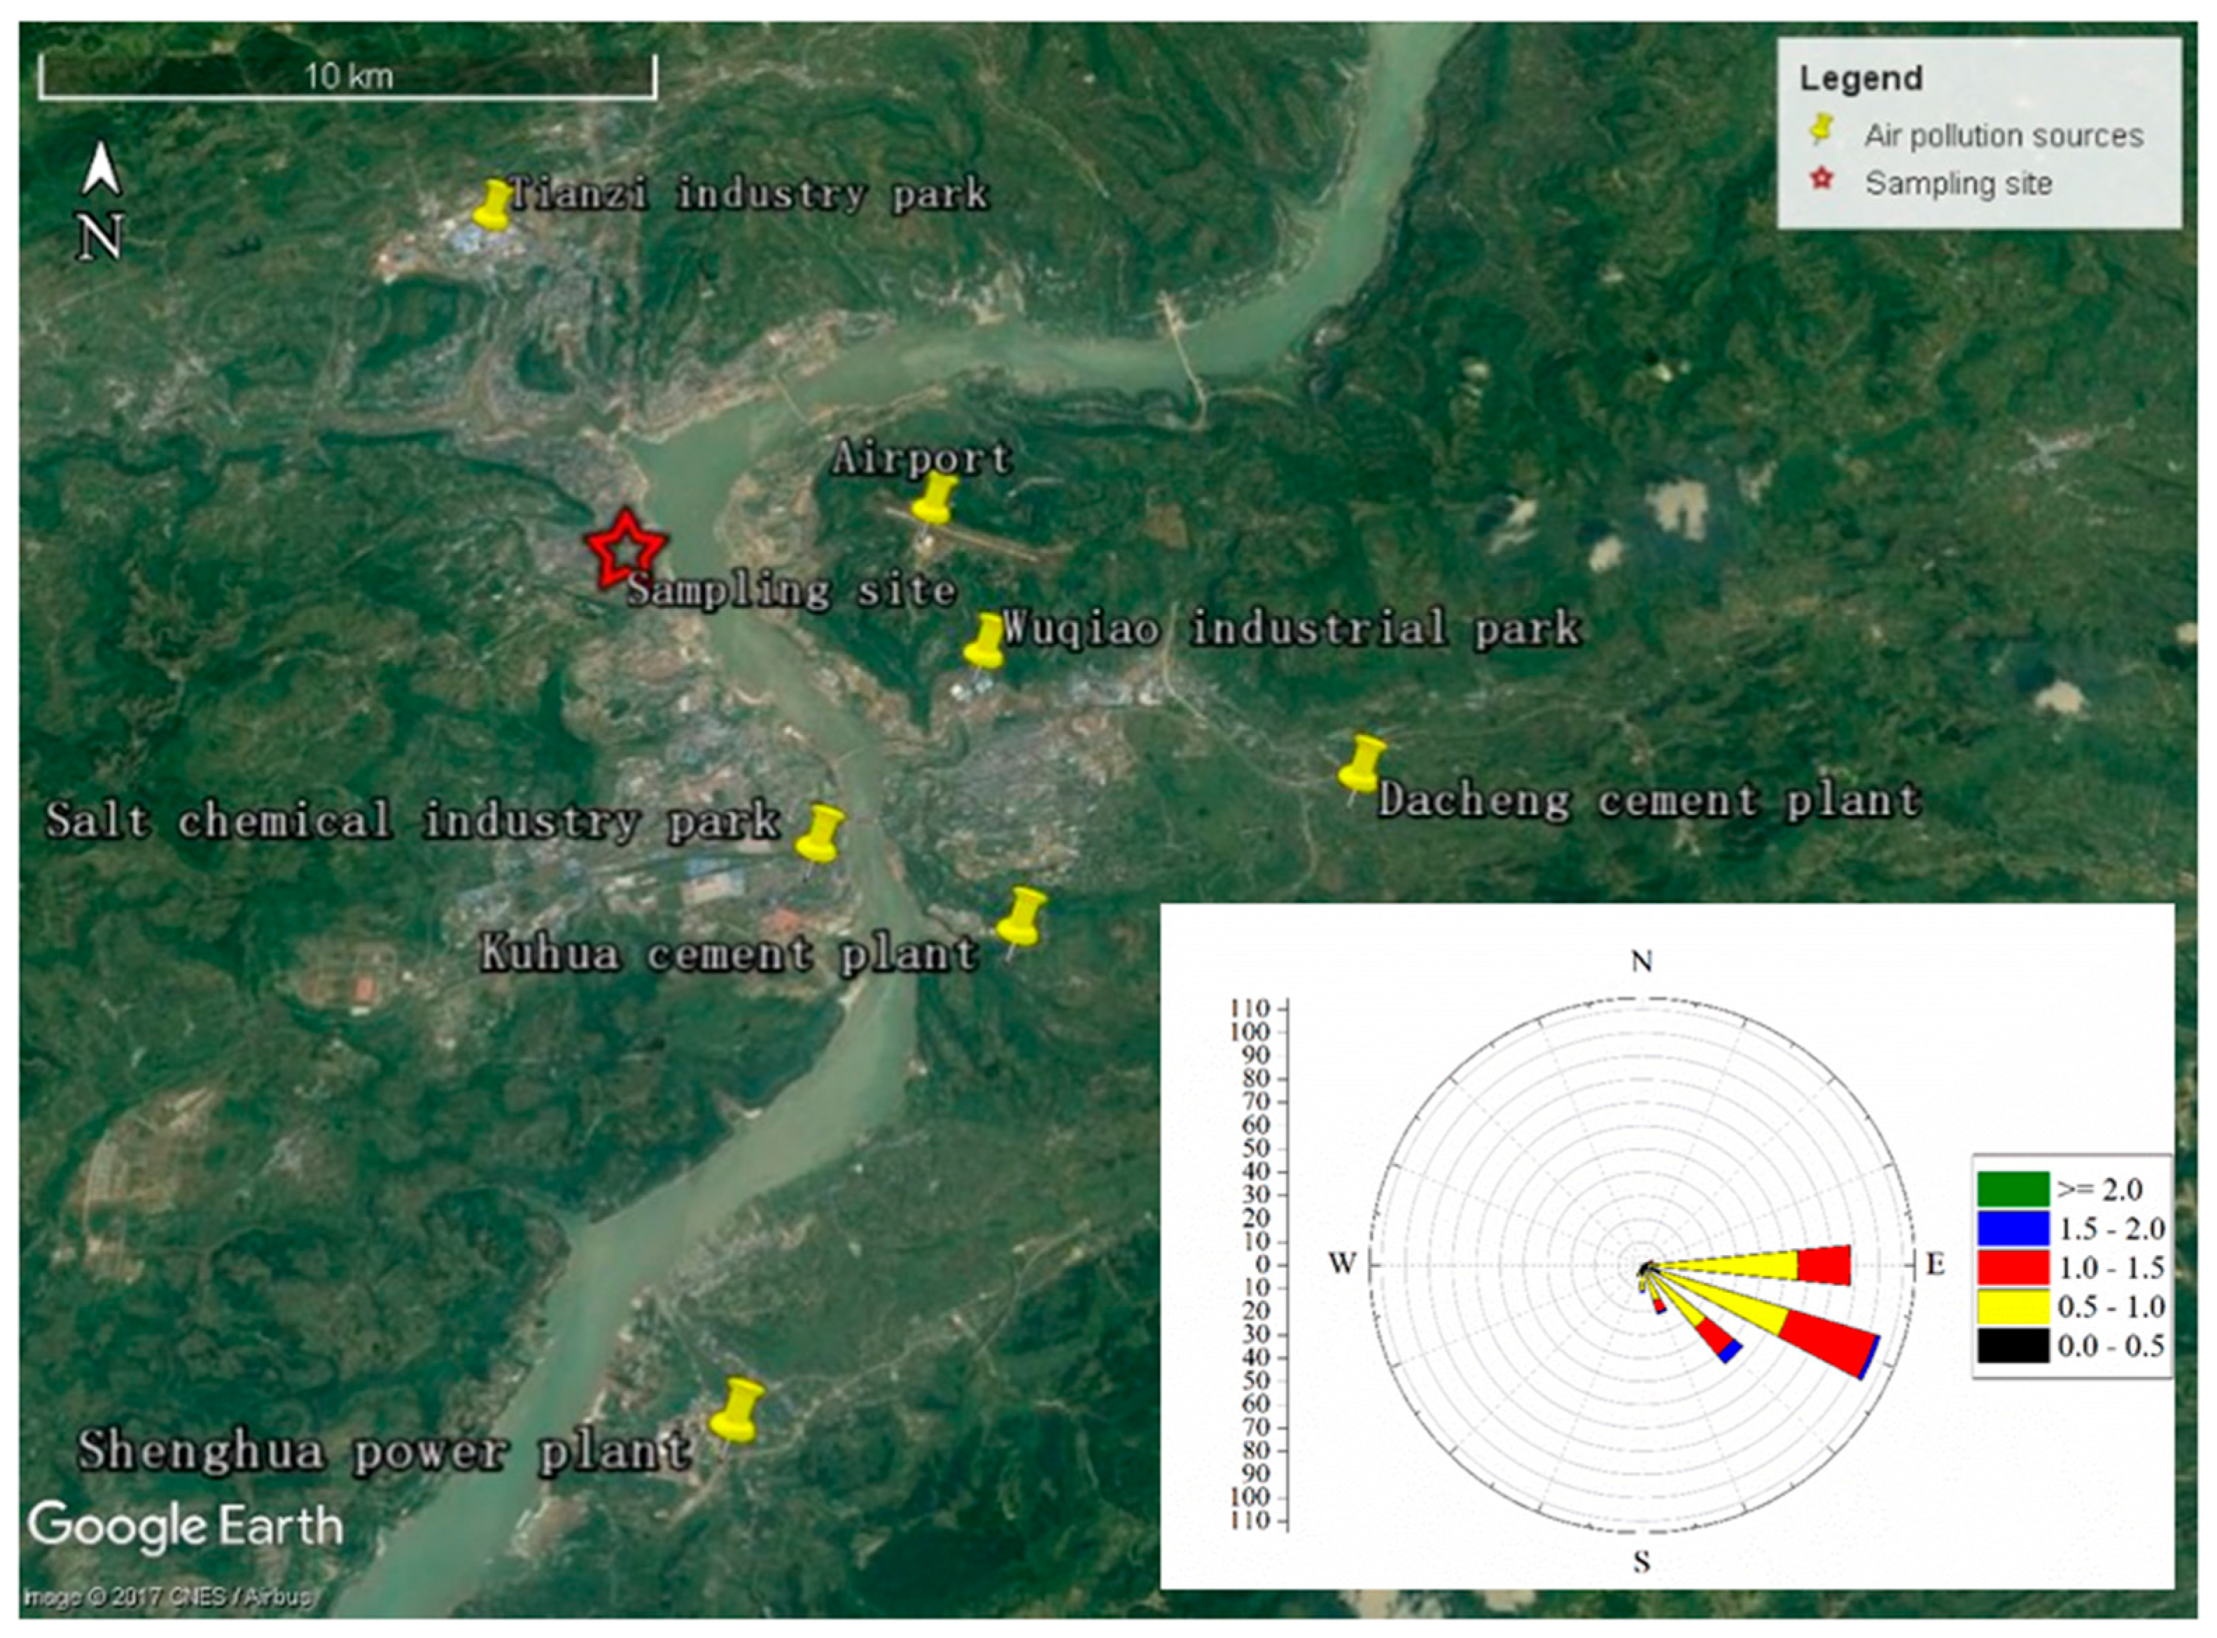
2.1. Sampling Site
2.2. Sampling and Analysis
2.3. Data Analysis
3. Results and Discussion
3.1. TM Characteristics in AWD
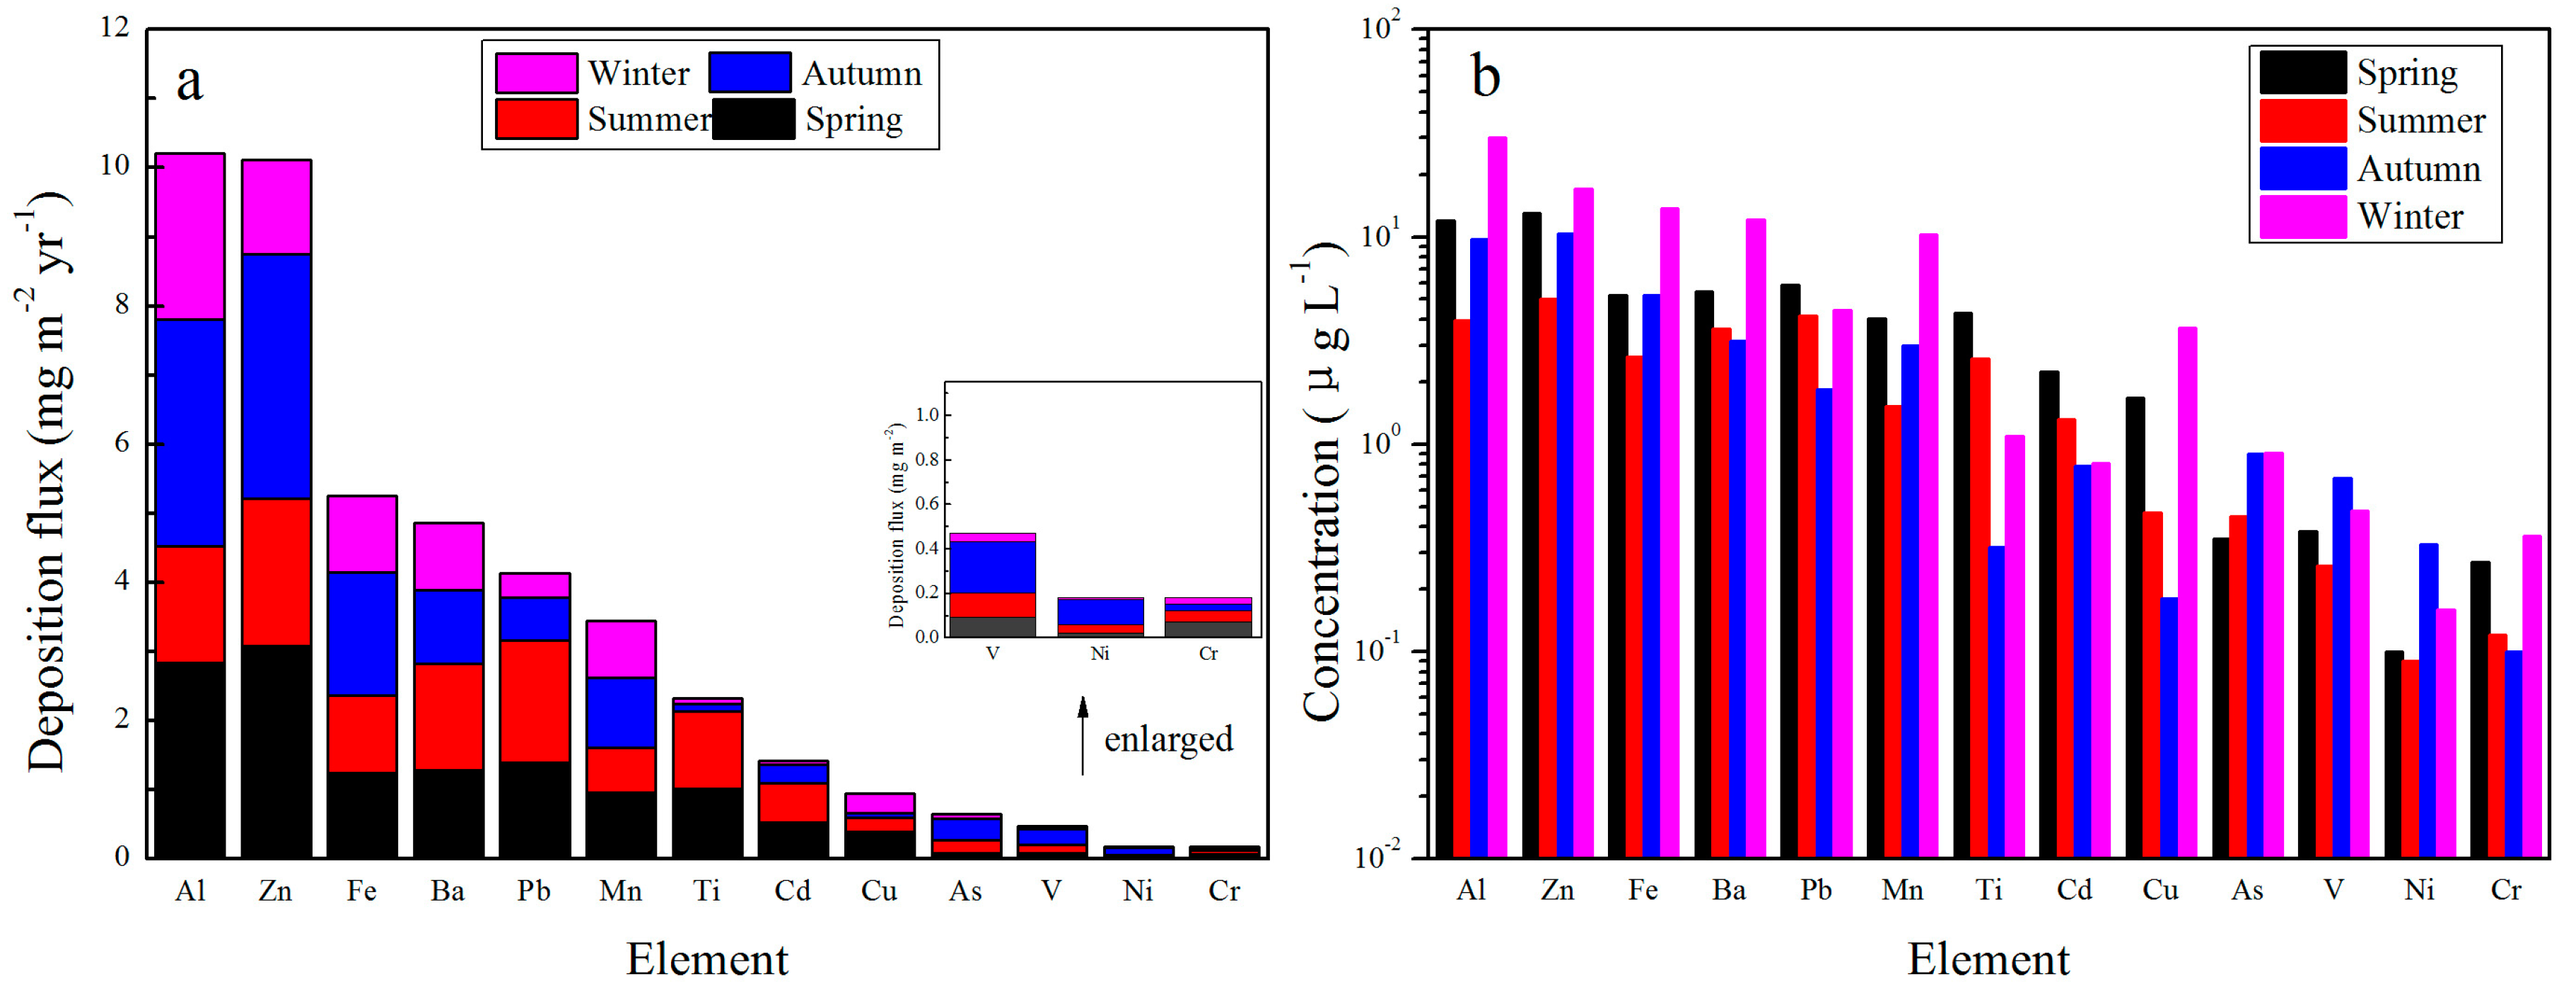
3.1.1. Concentrations and Fluxes
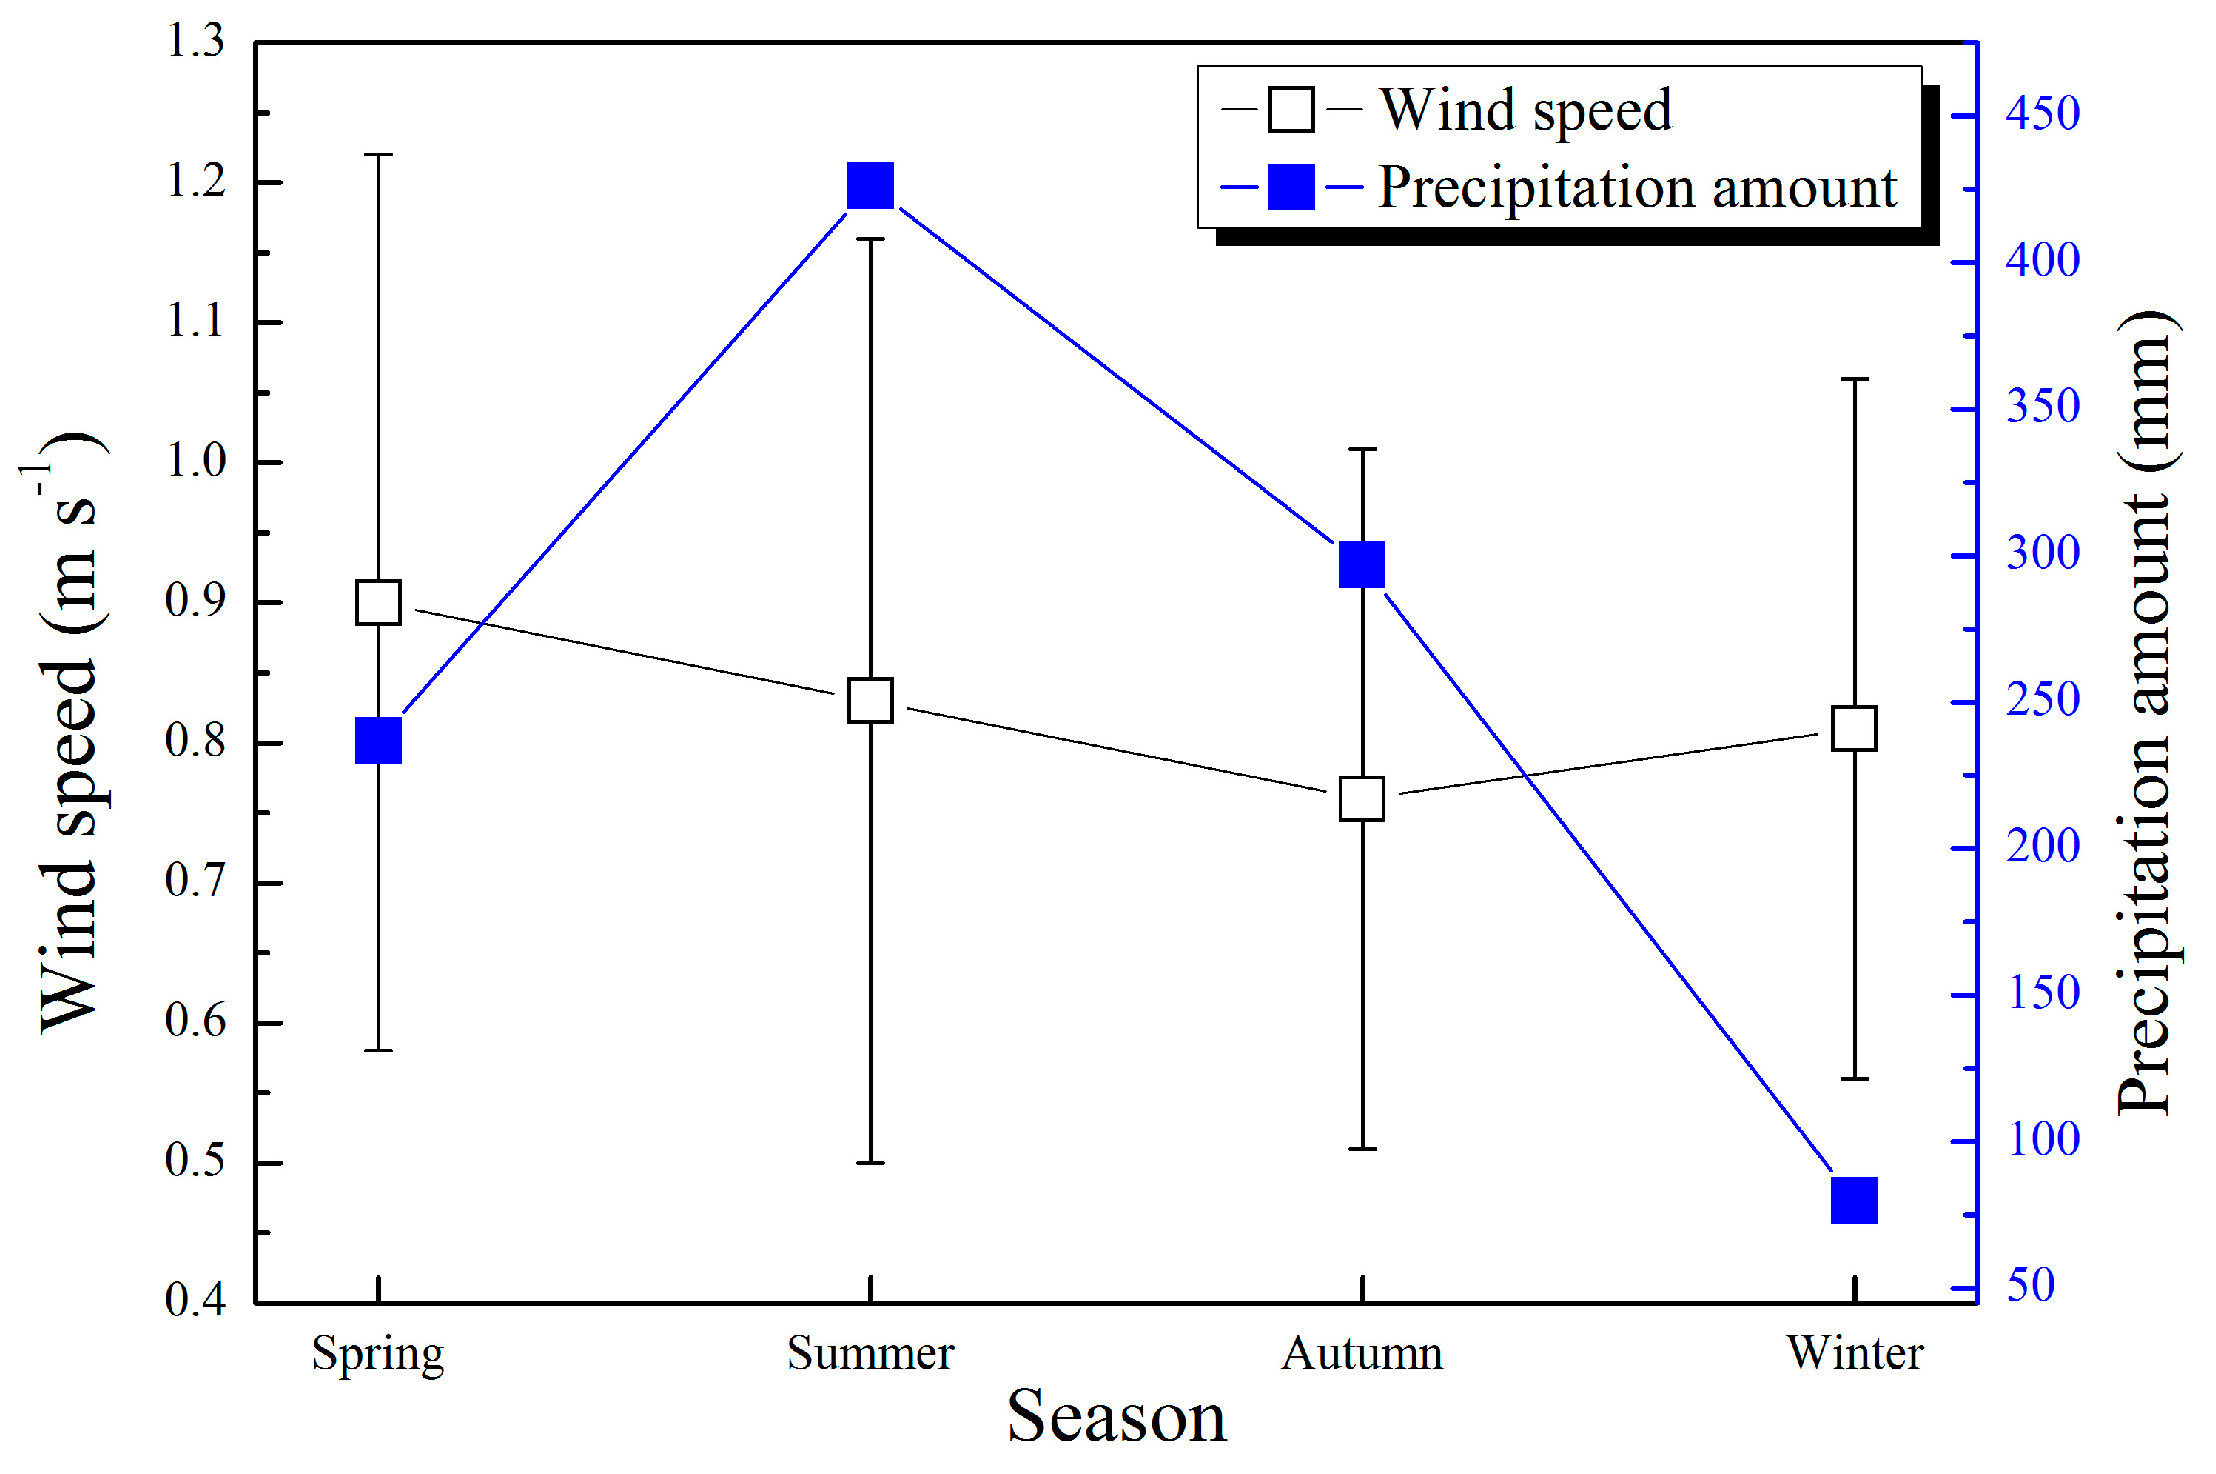
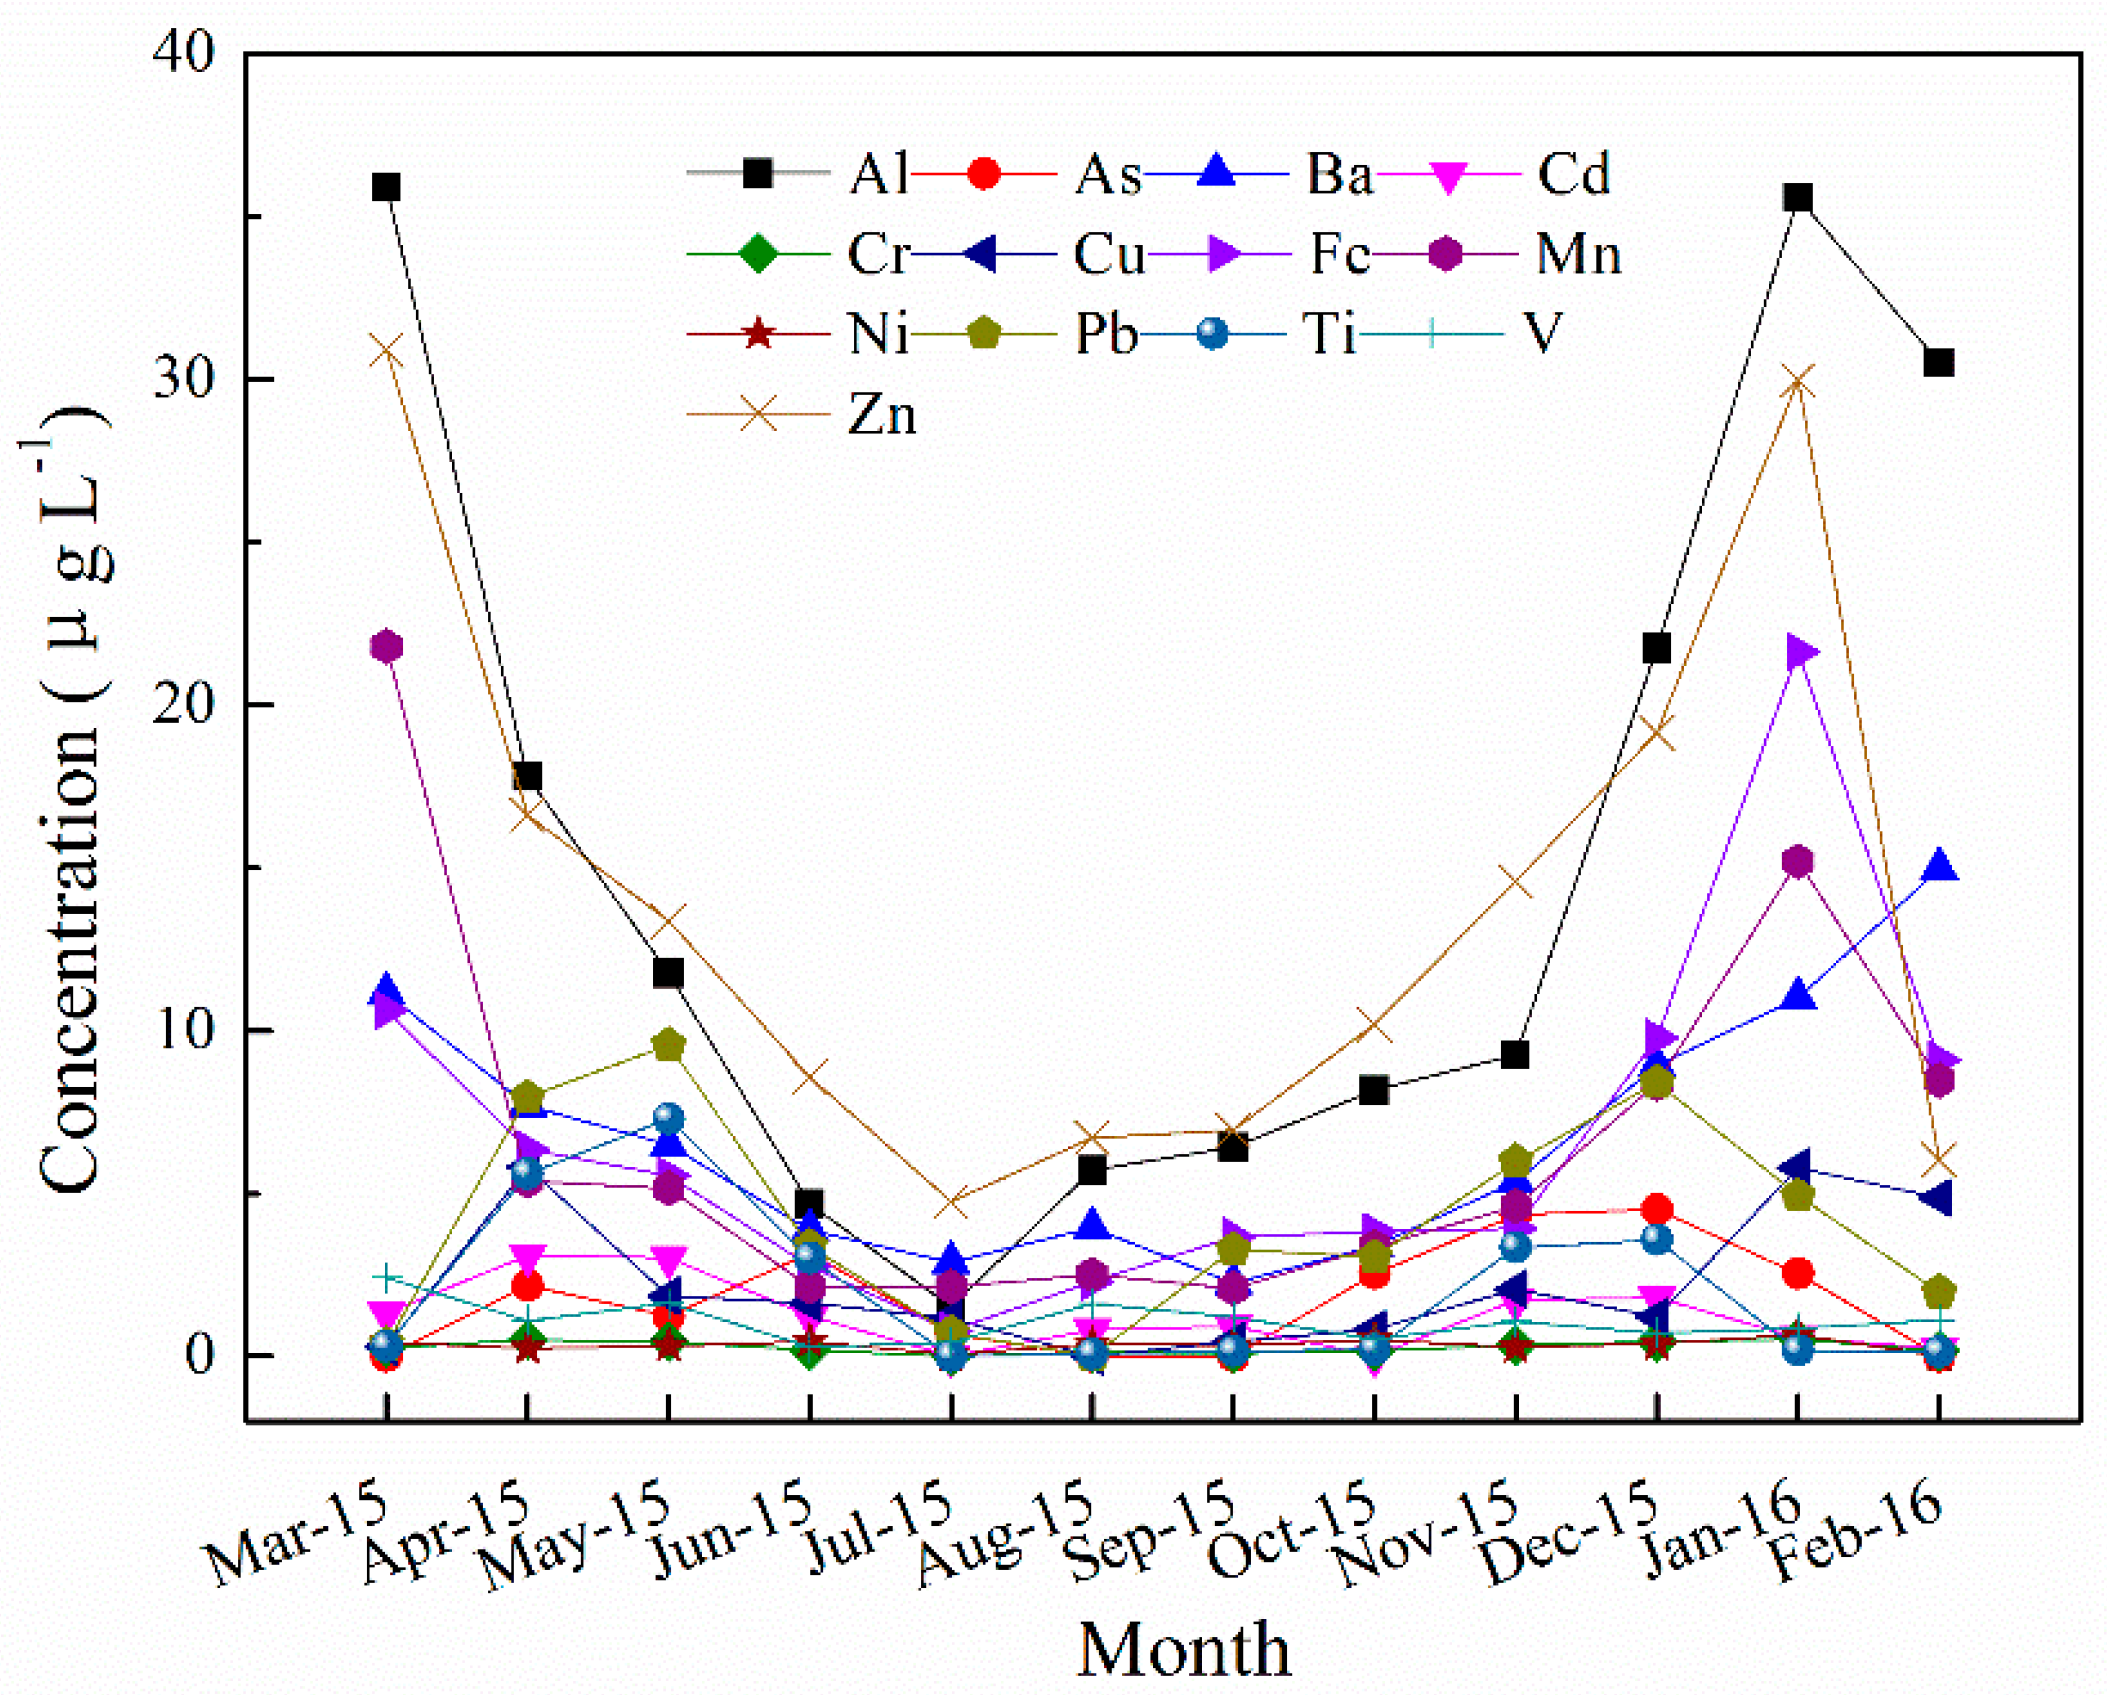
3.1.2. Seasonal Variability
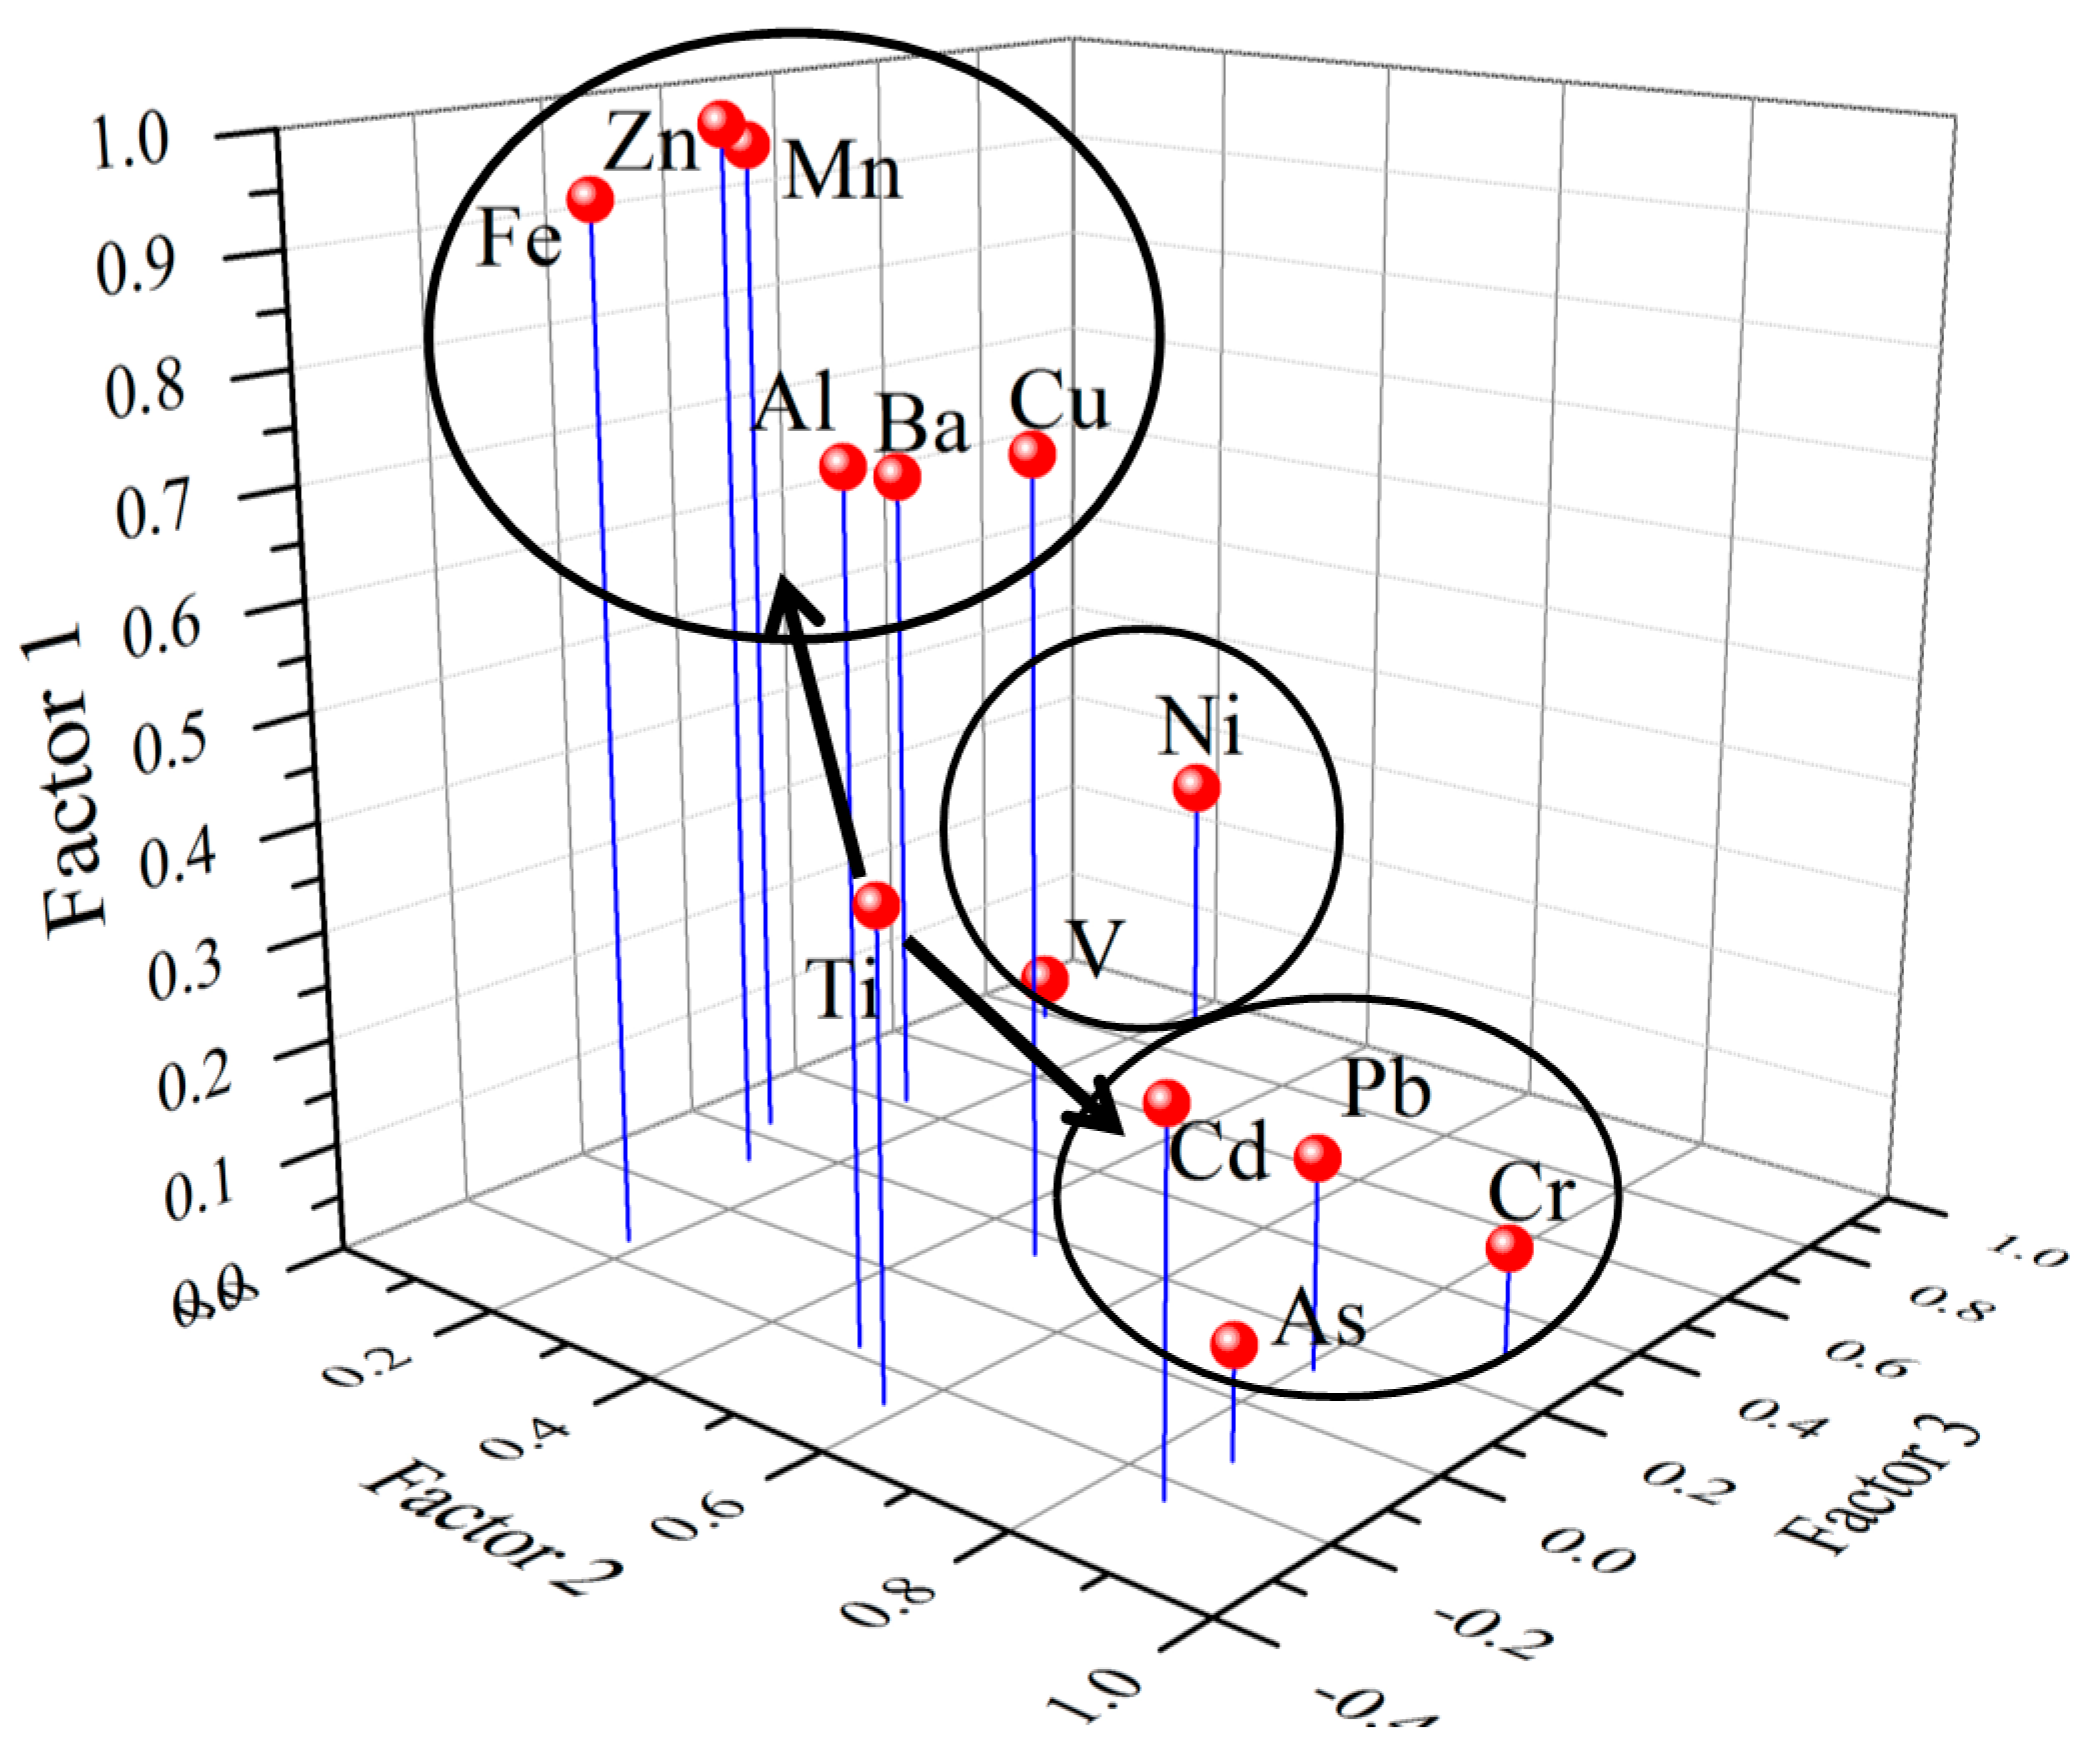
3.2. Principal Component Analysis
3.3. Potential Effects of Precipitation TMs on the TGR
4. Conclusions
Acknowledgments
Author Contributions
Conflicts of Interest
References
- Morabito, E.; Contini, D.; Belosi, F.; Stortini, A.M.; Manodori, L.; Gambaro, A. Atmospheric deposition of inorganic elements and organic compounds at the inlets of the Venice Lagoon. Adv. Meteorol. 2014, 2014. [Google Scholar] [CrossRef]
- Gambaro, A.; Radaelli, M.; Piazza, R.; Stortini, A.M.; Contini, D.; Belosi, F.; Zangrando, R.; Cescon, P. Organic micropollutants in wet and dry depositions in the Venice Lagoon. Chemosphere 2009, 76, 1017–1022. [Google Scholar] [CrossRef] [PubMed] [Green Version]
- Peirson, D.H.; Cawse, P.A.; Salmon, L.; Cambray, R.S. Trace elements in the atmospheric environment. Nature 1973, 241, 252–256. [Google Scholar] [CrossRef]
- Pan, Y.P.; Wang, Y.S. Atmospheric wet and dry deposition of trace elements at 10 sites in Northern China. Atmos. Chem. Phys. 2015, 15, 951–972. [Google Scholar] [CrossRef]
- Huang, S.; Tu, J.; Liu, H.; Hua, M.; Liao, Q.; Feng, J.; Weng, Z.; Huang, G. Multivariate analysis of trace element concentrations in atmospheric deposition in the Yangtze River Delta, East China. Atmos. Environ. 2009, 43, 5781–5790. [Google Scholar] [CrossRef]
- Amodio, M.; Catino, S.; Dambruoso, P.R.; de Gennaro, G.; Di Gilio, A.; Giungato, P.; Laiola, E.; Marzocca, A.; Mazzone, A.; Sardaro, A.; et al. Atmospheric Deposition: Sampling Procedures, Analytical Methods, and Main Recent Findings from the Scientific Literature. Adv. Meteorol. 2014, 2014. [Google Scholar] [CrossRef]
- Fang, G.C.; Huang, C.S. Atmospheric particulate and metallic elements (Zn, Ni, Cu, Cd and Pb) size distribution at three characteristic sampling sites. Environ. Forensics 2011, 12, 191–199. [Google Scholar] [CrossRef]
- Zhu, J.; Wang, Q.; Yu, H.; Li, M.; He, N. Heavy metal deposition through rainfall in Chinese natural terrestrial ecosystems, Evidences from national-scale network monitoring. Chemosphere 2016, 164, 128–133. [Google Scholar] [CrossRef] [PubMed]
- Bacardit, M.; Camarero, L. Atmospherically deposited major and trace elements in the winter snowpack along a gradient of altitude in the Central Pyrenees, The seasonal record of long-range fluxes over SW Europe. Atmos. Environ. 2010, 44, 582–595. [Google Scholar] [CrossRef]
- McConnell, J.R.; Edwards, R. Coal burning leaves toxic heavy metal legacy in the Arctic. Proc. Natl. Acad. Sci. USA 2008, 105, 12140–12144. [Google Scholar] [CrossRef] [PubMed]
- Al-Khashman, O.A.; Jaradat, A.Q.; Salameh, E. Five-year monitoring study of chemical characteristics of wet atmospheric precipitation in the southern region of Jordan. Environ. Monit. Assess. 2013, 185, 5715–5727. [Google Scholar] [CrossRef] [PubMed]
- Yang, F.; Tan, J.; Shi, Z.B.; Cai, Y.; He, K.; Ma, Y.; Duan, F.; Okuda, T.; Tanaka, S.; Chen, G. Five-year record of atmospheric precipitation chemistry in urban Beijing, China. Atmos. Chem. Phys. 2012, 12, 2025–2035. [Google Scholar] [CrossRef] [Green Version]
- Duan, L.; Yu, Q.; Zhang, Q.; Wang, Z.F.; Pan, Y.P.; Larssen, T.; Tang, J.; Mulder, J. Acid deposition in Asia, Emissions, deposition, and ecosystem effects. Atmos. Environ. 2016, 146, 55–69. [Google Scholar] [CrossRef]
- Andren, A.W.; Lindberg, S.E. Atmospheric input and origin of selected elements in Walker Branch Watershed, Oak Ridge, Tennessee. Water Air Soil Pollut. 1977, 8, 199–215. [Google Scholar] [CrossRef]
- Aas, W.; Pfaffhuber, K.A.; Nizzetto, P.B. Heavy Metals and POP Measurements; 2014 NO-2027; Norwegian Institute for Air Research: Kjeller, Norway, 2016; pp. 5–6. [Google Scholar]
- Lamb, D.; Bowersox, V. The national atmospheric deposition program, an overview. Atmos. Environ. 2000, 34, 1661–1663. [Google Scholar] [CrossRef]
- Wan, D.; Song, L.; Yang, J.; Jin, Z.; Zhan, C.; Mao, X.; Liu, D.; Shao, Y. Increasing heavy metals in the background atmosphere of central North China since the 1980s, Evidence from a 200-year lake sediment record. Atmos. Environ. 2016, 138, 183–190. [Google Scholar] [CrossRef]
- Xing, J.; Song, J.; Yuan, H.; Wang, Q.; Li, X.; Li, N.; Duan, L.; Qu, B. Atmospheric wet deposition of dissolved trace elements to Jiaozhou Bay, North China, Fluxes, sources and potential effects on aquatic environment. Chemosphere 2017, 174, 428–436. [Google Scholar] [CrossRef] [PubMed]
- Tripathee, L.; Kang, S.; Huang, J.; Sharma, C.M.; Sillanpää, M.; Guo, J.; Paudyal, R. Concentrations of trace elements in wet deposition over the central Himalayas, Nepal. Atmos. Environ. 2014, 95, 231–238. [Google Scholar] [CrossRef]
- Ye, C.; Li, S.; Zhang, Y.; Zhang, Q. Assessing soil heavy metal pollution in the water-level-fluctuation zone of the Three Gorges Reservoir, China. J. Hazard. Mater. 2011, 191, 366–372. [Google Scholar] [CrossRef] [PubMed]
- Zhu, Y.; Yang, Y.; Liu, M.; Zhang, M.; Wang, J. Concentration, distribution, source, and risk assessment of PAHs and heavy metals in surface water from the Three Gorges Reservoir, China. Hum. Ecol. Risk Assess. 2015, 21, 1593–1607. [Google Scholar] [CrossRef]
- Yi, Y.; Yang, Z.; Zhang, S. Ecological risk assessment of heavy metals in sediment and human health risk assessment of heavy metals in fishes in the middle and lower reaches of the Yangtze River basin. Environ. Pollut. 2011, 159, 2575–2585. [Google Scholar] [CrossRef] [PubMed]
- Zhang, L.; Huang, Y.; Liu, Y.; Yang, F.; Lan, G.; Fu, C.; Wang, J. Characteristics of Carbonaceous Species in PM2.5 in Wanzhou in the Hinterland of the Three Gorges Reservoir of Northeast Chongqing, China. Atmosphere 2015, 6, 534–546. [Google Scholar]
- Heimbürger, L.E.; Migon, C.; Cossa, D. Impact of atmospheric deposition of anthropogenic and natural trace metals on Northwestern Mediterranean surface waters, A box model assessment. Environ. Pollut. 2011, 159, 1629–1634. [Google Scholar] [CrossRef] [PubMed]
- Zhao, X.; Gao, B.; Xu, D.; Gao, L.; Yin, S. Heavy metal pollution in sediments of the largest reservoir (Three Gorges Reservoir) in China, a review. Environ. Sci. Pollut. Res. 2017, 24, 20844–20858. [Google Scholar] [CrossRef] [PubMed]
- Fu, L.; Zhang, L.; Yu, J.; Zhou, C.; Haffner, D.G. Water stratification and its relevance to growth of algal community at backwater area in Three Gorges Reservoir. Chin. J. Environ. Eng. 2015, 9, 2265–2271. (In Chinese) [Google Scholar]
- Guo, X.W.; Li, Z.P.; Liu, Q.F. Analysis of runoff characteristics at Three Gorges Project dam site. Yangtze River 2008, 39, 96–98. (In Chinese) [Google Scholar]
- Peng, Y.L.; Wang, Y.M.; Qin, C.Q.; Wang, D.Y. Concentrations and deposition fluxes of heavy metals in precipitation in core urban areas, Chongqing. Environ. Sci. 2014, 35, 2490–2496. (In Chinese) [Google Scholar]
- Guo, J.; Kang, S.; Huang, J.; Sillanpää, M.; Niu, H.; Sun, X.; He, Y.; Wang, S.; Tripathee, L. Trace elements and rare earth elements in wet deposition of Lijiang, Mt. Yulong region, southeastern edge of the Tibetan Plateau. J. Environ. Sci. 2017, 52, 18–28. [Google Scholar]
- Cong, Z.; Kang, S.; Zhang, Y.; Gao, S.; Wang, Z.; Liu, B.; Wan, X. New insights into trace element wet deposition in the Himalayas, Amounts, seasonal patterns, and implications. Environ. Sci. Pollut. Res. 2015, 22, 2735–2744. [Google Scholar] [CrossRef] [PubMed]
- Muezzinoglu, A.; Cizmecioglu, S.C. Deposition of heavy metals in a Mediterranean climate area. Atmos. Res. 2006, 81, 1–16. [Google Scholar] [CrossRef]
- Sakata, M.; Asakura, K. Factors contributing to seasonal variations in wet deposition fluxes of trace elements at sites along Japan Sea coast. Atmos. Environ. 2009, 43, 3867–3875. [Google Scholar] [CrossRef]
- Gao, Y.; Hao, Z.; Yang, T.; He, N.; Tian, J.; Wen, X. Wash effect of atmospheric trace metals wet deposition and its source characteristic in subtropical watershed in China. Environ. Sci. Pollut. Res. 2016, 23, 20388–20401. [Google Scholar] [CrossRef] [PubMed]
- Fu, C.; Guo, J.; Pan, J.; Qi, J.; Zhou, W. Potential ecological risk assessment of heavy metal pollution in sediments of the Yangtze River within the Wanzhou section, China. Biol. Trace Elem. Res. 2009, 129, 270–277. [Google Scholar] [CrossRef] [PubMed]
- Ma, Y.; Qin, Y.; Zheng, B.; Zhao, Y.; Zhang, L.; Yang, C.; Shi, Y.; Wen, Q. Three Gorges Reservoir, metal pollution in surface water and suspended particulate matter on different reservoir operation periods. Environ. Earth Sci. 2016, 75, 1413. [Google Scholar] [CrossRef]
- Cheng, H.; Liang, A.; Zhi, Z. Heavy metals sedimentation risk assessment and sources analysis accompanied by typical rural water level fluctuating zone in the Three Gorges Reservoir Area. Environ. Earth Sci. 2017, 76, 418. [Google Scholar] [CrossRef]
- Liu, Y.Z.; Xiao, T.F.; Ning, Z.P.; Jia, Y.L.; Li, H.J.; Yang, F.; Jiang, T.; Sun, M. Cadmium and selected heavy metals in soils of Jianping area in Wushan county, the Three Gorges Region, distribution and source recognition. Environ. Sci. 2013, 34, 2390–2398. (In Chinese) [Google Scholar]
- Tang, J.; Xiao, T.; Wang, S.; Lei, J.; Zhang, M.; Gong, Y.; Li, H.; Ning, Z.; He, L. High cadmium concentrations in areas with endemic fluorosis, A serious hidden toxin? Chemosphere 2009, 76, 300–305. [Google Scholar] [CrossRef] [PubMed]
- González, L.T.; Longoria Rodríguez, F.E.; Sánchez-Domínguez, M.; Cavazosb, V.; Leyva-Porrasc, C.; Silva-Vidaurrib, L.G.; Acuña, K.A.; Kharissova, B.I.; Chiue, J.F.V.; Barbosaa, J.M.A. Determination of trace metals in TSP and PM2.5 materials collected in the Metropolitan Area of Monterrey, Mexico, A characterization study by XPS, ICP-AES and SEM-EDS. Atmos. Res. 2017, 196, 8–22. [Google Scholar]
- Gao, J.; Tian, H.; Cheng, K.; Lu, L.; Wang, Y.; Wu, Y.; Zhu, C.; Liu, K.; Zhou, J.; Liu, X.; et al. Seasonal and spatial variation of trace elements in multi-size airborne particulate matters of Beijing, China, Mass concentration, enrichment characteristics, source apportionment, chemical speciation and bioavailability. Atmos. Environ. 2014, 99, 257–265. [Google Scholar] [CrossRef]
- Olowoyo, J.O.; Mugihisa, L.L.; Busa, N.G. Trace Metals in Soil and Plants around a Cement Factory in Pretoria, South Africa. Pol. J. Environ. Stud. 2015, 24, 2087–2093. [Google Scholar] [CrossRef]
- Fernández-Olmo, I.; Puente, M.; Montecalvo, L.; Irabien, A. Source contribution to the bulk atmospheric deposition of minor and trace elements in a Northern Spanish coastal urban area. Atmos. Res. 2014, 145–146, 80–91. [Google Scholar]
- Ezeh, G.C.; Obioh, I.B.; Asubioji, O.I. Trace metals and source identification of air-borne particulate matter pollution in a Nigerian Megacity. J. Environ. Anal. Toxicol. 2017, 7. [Google Scholar] [CrossRef]
- Cesari, D.; Genga, A.; Ielpo, P.; Siciliano, M.; Mascolo, G.; Grasso, F.M.; Contini, D. Source apportionment of PM2.5 in the harbour–industrial area of Brindisi (Italy): Identification and estimation of the contribution of in-port ship emissions. Sci. Total Environ. 2014, 497–498, 392–400. [Google Scholar] [CrossRef] [PubMed]


| Ele. | Min. | Max. | VWM Con. | SD | CV | Dep. Flux |
|---|---|---|---|---|---|---|
| Al | 0.38 | 78.32 | 9.44 | 14.43 | 1.14 | 10.22 |
| As | 0.06 | 7.08 | 0.61 | 1.90 | 0.69 | 0.66 |
| Ba | 0.20 | 31.67 | 4.49 | 4.85 | 0.82 | 4.86 |
| Cd | <DL | 4.27 | 1.32 | 1.63 | 0.99 | 1.43 |
| Cr | <DL | 1.68 | 0.16 | 0.29 | 0.88 | 0.18 |
| Cu | <DL | 25.61 | 0.88 | 3.60 | 1.40 | 0.95 |
| Fe | 0.26 | 42.32 | 4.85 | 6.70 | 1.17 | 5.25 |
| Mn | 0.64 | 37.92 | 3.18 | 6.95 | 1.26 | 3.44 |
| Ni | <DL | 2.69 | 0.17 | 0.44 | 1.22 | 0.18 |
| Pb | 0.12 | 15.46 | 3.82 | 5.15 | 0.95 | 4.14 |
| Ti | <DL | 9.17 | 2.15 | 4.09 | 1.35 | 2.33 |
| V | <DL | 3.17 | 0.44 | 0.73 | 0.65 | 0.47 |
| Zn | 0.49 | 96.81 | 9.34 | 13.13 | 1.03 | 10.11 |
| Wanzhou | Chongqing, China [28] | Lijiang, China [29] | Northern China [4] | Mt. Qomolangma [30] | Izmir, Turkey [31] | Noshiro, Japan [32] | |||||||
|---|---|---|---|---|---|---|---|---|---|---|---|---|---|
| Urban | Urban | Urban | Mixed 10 sites | Remote | Urban | Remote | |||||||
| 2015–2016 | 2011–2012 | 2012 | 2007–2010 | 2009–2010 | 2003–2004 | 2003–2005 | |||||||
| VWM | Fluxes | VMW | Fluxes | Mean | Fluxes | Fluxes | VMW | Fluxes | Mean | Fluxes | VMW | Fluxes | |
| Precipitation (mm) | 1082.5 | 797.4 | 660.0 | 400.0–800.0 | 286.0 | 1730 | |||||||
| Al | 9.44 | 10.22 | 113.8 | 27.11 | 45.0–120.0 | 2.92 | 0.85 | ||||||
| Zn | 9.34 | 10.11 | 95.64 | 76.26 | 7.62 | 3.64 | 22.0–90.0 | 0.47 | 0.13 | 186.4 | 45.40 | ||
| Fe | 4.85 | 5.25 | 91.59 | 73.03 | 31.39 | 11.87 | 60.0–149.0 | 4.55 | 1.30 | ||||
| Ba | 4.49 | 4.86 | 3.44 | 0.84 | |||||||||
| Pb | 3.82 | 4.14 | 37.94 | 30.25 | 1.93 | 1.12 | 5.0–27.5 | 0.04 | 0.010 | 7.00 | 3.80 | 5.20 | 9.00 |
| Mn | 3.18 | 3.44 | 13.76 | 10.97 | 3.41 | 1.67 | 8.0–19.0 | 0.59 | 0.168 | 4.60 | 8.00 | ||
| Ti | 2.15 | 2.33 | 1.08 | 0.40 | |||||||||
| Cd | 1.32 | 1.43 | 0.55 | 0.44 | 0.08 | 0.04 | 0.18–0.31 | 0.005 | 0.002 | 3.10 | 1.30 | 0.17 | 0.30 |
| Cu | 0.88 | 0.95 | 16.31 | 13.00 | 0.59 | 0.24 | 1.8–3.8 | 0.06 | 0.017 | 19.70 | 10.00 | 1.40 | 2.30 |
| As | 0.61 | 0.66 | 5.65 | 4.50 | 0.42 | 0.25 | 1.0–2.1 | 0.04 | 0.012 | 0.68 | 1.20 | ||
| V | 0.44 | 0.47 | 1.98 | 1.58 | 1.51 | 0.26 | 0.4–0.9 | 0.02 | 0.007 | 0.45 | 0.78 | ||
| Ni | 0.17 | 0.18 | 2.79 | 2.22 | 0.24 | 0.09 | 0.5–2.0 | 0.15 | 0.042 | 7.40 | 4.90 | 0.50 | 0.86 |
| Cr | 0.16 | 0.18 | 3.63 | 2.90 | 0.31 | 0.14 | 0.3–0.7 | 0.06 | 0.016 | 17.20 | 5.80 | 0.24 | 0.41 |
| TMs | Enrichment Concentration (ΔC)/μg m−3 | Average TM Concentrations of the TGR (C)/μg m−3 | Contribution of Wet Deposition to Surface TM Concentrations (ΔC/C)/% |
|---|---|---|---|
| As | 1.03 | 2100 | 0.05 |
| Cd | 2.23 | 200 | 1.12 |
| Cr | 0.28 | 500 | 0.06 |
| Ni | 0.29 | 1300 | 0.02 |
| Pb | 6.48 | 70 | 9.25 |
© 2017 by the authors. Licensee MDPI, Basel, Switzerland. This article is an open access article distributed under the terms and conditions of the Creative Commons Attribution (CC BY) license (http://creativecommons.org/licenses/by/4.0/).
Share and Cite
Zhang, L.; Gao, M.; Cui, J.; Yang, F.; Wang, H.; Fu, C.; Huang, Y. Wet Deposition of Trace Metals at a Typical Urban Site in Southwestern China: Fluxes, Sources and Contributions to Aquatic Environments. Sustainability 2018, 10, 69. https://doi.org/10.3390/su10010069
Zhang L, Gao M, Cui J, Yang F, Wang H, Fu C, Huang Y. Wet Deposition of Trace Metals at a Typical Urban Site in Southwestern China: Fluxes, Sources and Contributions to Aquatic Environments. Sustainability. 2018; 10(1):69. https://doi.org/10.3390/su10010069
Chicago/Turabian StyleZhang, Liuyi, Min Gao, Jian Cui, Fumo Yang, Huanbo Wang, Chuan Fu, and Yimin Huang. 2018. "Wet Deposition of Trace Metals at a Typical Urban Site in Southwestern China: Fluxes, Sources and Contributions to Aquatic Environments" Sustainability 10, no. 1: 69. https://doi.org/10.3390/su10010069