Article

Evaluation of Hydraulic Retention Time on Treatment of Coffee Processing Wastewater (CPWW) in EGSB Bioreactor

by
Abumalé Cruz-Salomón
1,*,
Edna Ríos-Valdovinos
1,*,
Francisco Pola-Albores
2,
Selene Lagunas-Rivera
3,
Rocío Meza-Gordillo
4 and
Víctor M. Ruíz-Valdiviezo
4
1
Faculty of Engineering, University of Science and Arts of Chiapas, Libramiento Norte Poniente No. 1150, Lajas Maciel, Tuxtla Gutiérrez C.P. 29039, Mexico
2
Center for Research and Technological Development in Renewal Energies, University of Science and Arts of Chiapas, Libramiento Norte Poniente 1150, Lajas Maciel, Tuxtla Gutiérrez C.P. 29039, Mexico
3
Professor CONACYT, Department of Chemical and Biochemistry Engineering, National Institute of Technology of Mexico-Tuxtla Gutiérrez Institute of Technology, Carretera Panamericana Km 1080, Tuxtla Gutiérrez C.P. 29050, Mexico
4
Department of Chemical and Biochemistry Engineering, National Institute of Technology of Mexico-Tuxtla Gutiérrez Institute of Technology, Carretera Panamericana Km 1080, Tuxtla Gutiérrez C.P. 29050, Mexico
*
Authors to whom correspondence should be addressed.
Sustainability 2018, 10(1), 83; https://doi.org/10.3390/su10010083
Submission received: 11 December 2017 / Revised: 23 December 2017 / Accepted: 23 December 2017 / Published: 30 December 2017

Abstract

:
The coffee processing agro-industry generates large quantities of wastewater requiring systematic treatment prior to disposal. For this reason, the aim of this study was to evaluate the hydraulic retention times (HRT) in treatment of coffee processing wastewater (CPWW) using a laboratory scale Expanded Granular Sludge Bed (EGSB) bioreactor at different HRT (3 to 9 days). The EGSB was evaluated in mesophilic condition (26 ± 2 °C) with an average pH of 7.5 ± 0.2 to determine the chemical oxygen demand (COD) removal efficiency. According to the results, the COD removal efficiency increases from 94 to 98% when the HRT increase from 3 to 9 days; the α factor remained stable (0.98) throughout the evolution of the bioreactor. The HRT´s between 7–9 days generated effluents capable to be dischargeable into water bodies with a permitted COD concentration according to World Health Organization (WHO) and Official Mexican Environmental Regulations permissible limits. Results evidenced that the HRT of 9 days was the one that greater COD removal generated, so the EGSB bioreactor can be a sustainable alternative to solve the environmental problems, compared to other conventional methods to CPWW treatment.

1. Introduction

Coffee, which belongs to the genus Coffea of rubiaceae family, is one of the most popular beverages consumed throughout the world. Mexico ranks ninth in the world in coffee production with 2.4 × 10³ Ton year−1. Both varieties of coffee Arabica (Coffea arabica) and Robusta (Coffea canephora) are cultivated mainly in the hilly tracts of the Sierra Madre del Sur and Sierra Madre Oriental mountain, being the state of Chiapas is one of the major and famous coffee producing region within Mexico with a contribution of 36.9% (74,538 Ton year−1) [1,2].
This region has a number of small-scale coffee processing industries situated along the banks of rivers and/or streams to reduce production costs. The coffee is processed either by wet or dry method (Figure 1). Wet method of processing results in a coffee of superior quality compared to the dry method. Presently in Mexico, small-scale industries use the wet method to process around 86–90% of coffee [3].
The process by wet method begins by bringing the coffee cherries to a reservoir. From here on the cherries are transported by gravity to the de-pulping machines. In Chiapas, the transport to the de-pulping machines is brought forth by water and gravity. In the de-pulping machines, the cherries are de-pulped (process in which the pulp and the outer skin are removed) and selected based on their size. Nevertheless, a slimy layer around the coffee bean with a varying thickness of 0.5 to 2 mm remains, which will be later eliminated in the fermentation.
In the fermentation process, the grains remain between 12 and 36 h, depending on the temperature, altitude, the thickness of the mucilage layer and the concentration of enzymes. The mucilage layer is fermented through a combination of microbial activity.
The process is finished after the grains are washed to eliminate the last remnants of decomposed mucilage. Afterwards, the grains in pergamino state are dried.
The wet method to coffee processing produces a very high load of polluted wastewater (CPWW is obtained from de-pulping, generated in the pulp removal process of coffee cherries, which represent more than 50% of the water used in the whole process [4]; and of the washing process which is generated after the fermentation of the coffee bean [5]); this is the reason why coffee processing industries are one of the significant consumers of water. They produce large amounts of wastewater (between 8–10 L of CPWW are generated for each kilogram of coffee produced). The CPWW generated from this agro-industry presents an acid pH (3–5); additionally, it contains high concentrations of organic matter (1185–32,459 mg L−1 as COD, 3450–12,100 mg L−1 as biochemical oxygen demand (BOD5), 7000–10,900 mg L−1 as total suspended solids (TSS)), nutrients (4.4–70 mg L−1 as phosphorus, 37–279 mg L−1 as nitrogen) and suspended matter [6,7,8]. In addition to these compounds, the CPWW contains other chemicals such as phenols (10–2904.7 mg L−1) and tannins (0.05–23 mg L−1) that are converted into recalcitrant compounds [9,10,11]. Thus, considering the volume generated and the pollutants released through the wastewater, the coffee processing agro-industry represents one of the main contributors to the severe water pollution problems (as presented in a conceptual model Figure 2). Despite the severe pollution problems, it was found that none of the coffee processing agro-industries (small-scale) have any effluent treatment plants. They directly discharge untreated colored and acidic effluent into the nearby water bodies, streams and open land [12].
Furthermore, in the literature, it has been found that the CPWW is very harmful for surrounding water bodies and aquatic life if discharged directly into the surface waters [13,14,15] as well as in human health (causing many severe health problems, such as dizziness, eye, ear and skin irritation, stomach pain, nausea and breathing problems) of all the residents of nearby areas [16].
Several anaerobic processes have been developed in order to treat CPWW. The diagram presented below (Figure 3) gives an indication of the classification of methods applied. Even when the EGSB bioreactors do not appear in the diagram, many researchers, including this research group, have done a lot of studies about it as the flow pattern, kinetics, toxicity inhibition, start up, optimization and operation characteristics, so that the HRT is one of the most important factors for the control of this kind of anaerobic bioreactor, because it affects some factors such as the hydrogen transfer, the anaerobic digestion processes and even can produce the cell washing phenomenon. Bringing as a result the decrease in the percentage of COD removal and accumulation of volatile fatty acids (VFA) in EGSB bioreactor, this because of the short contact time between the biomass and the substrate resulting from the decrease in HRT [18].
It has been found that this type of bioreactor is an excellent system for treating the high organic load wastewater but it does not remove the nutrients (N and P). However, in spite of the EGSB bioreactor has the capacity to treat high organic load wastewater, there is not literature that reports about the use of EGSB bioreactors in treating CPWW; For this reason, the aim of this research was to study the EGSB bioreactor to evaluate the HRT in the CPWW treatment.

2. Materials and Methods

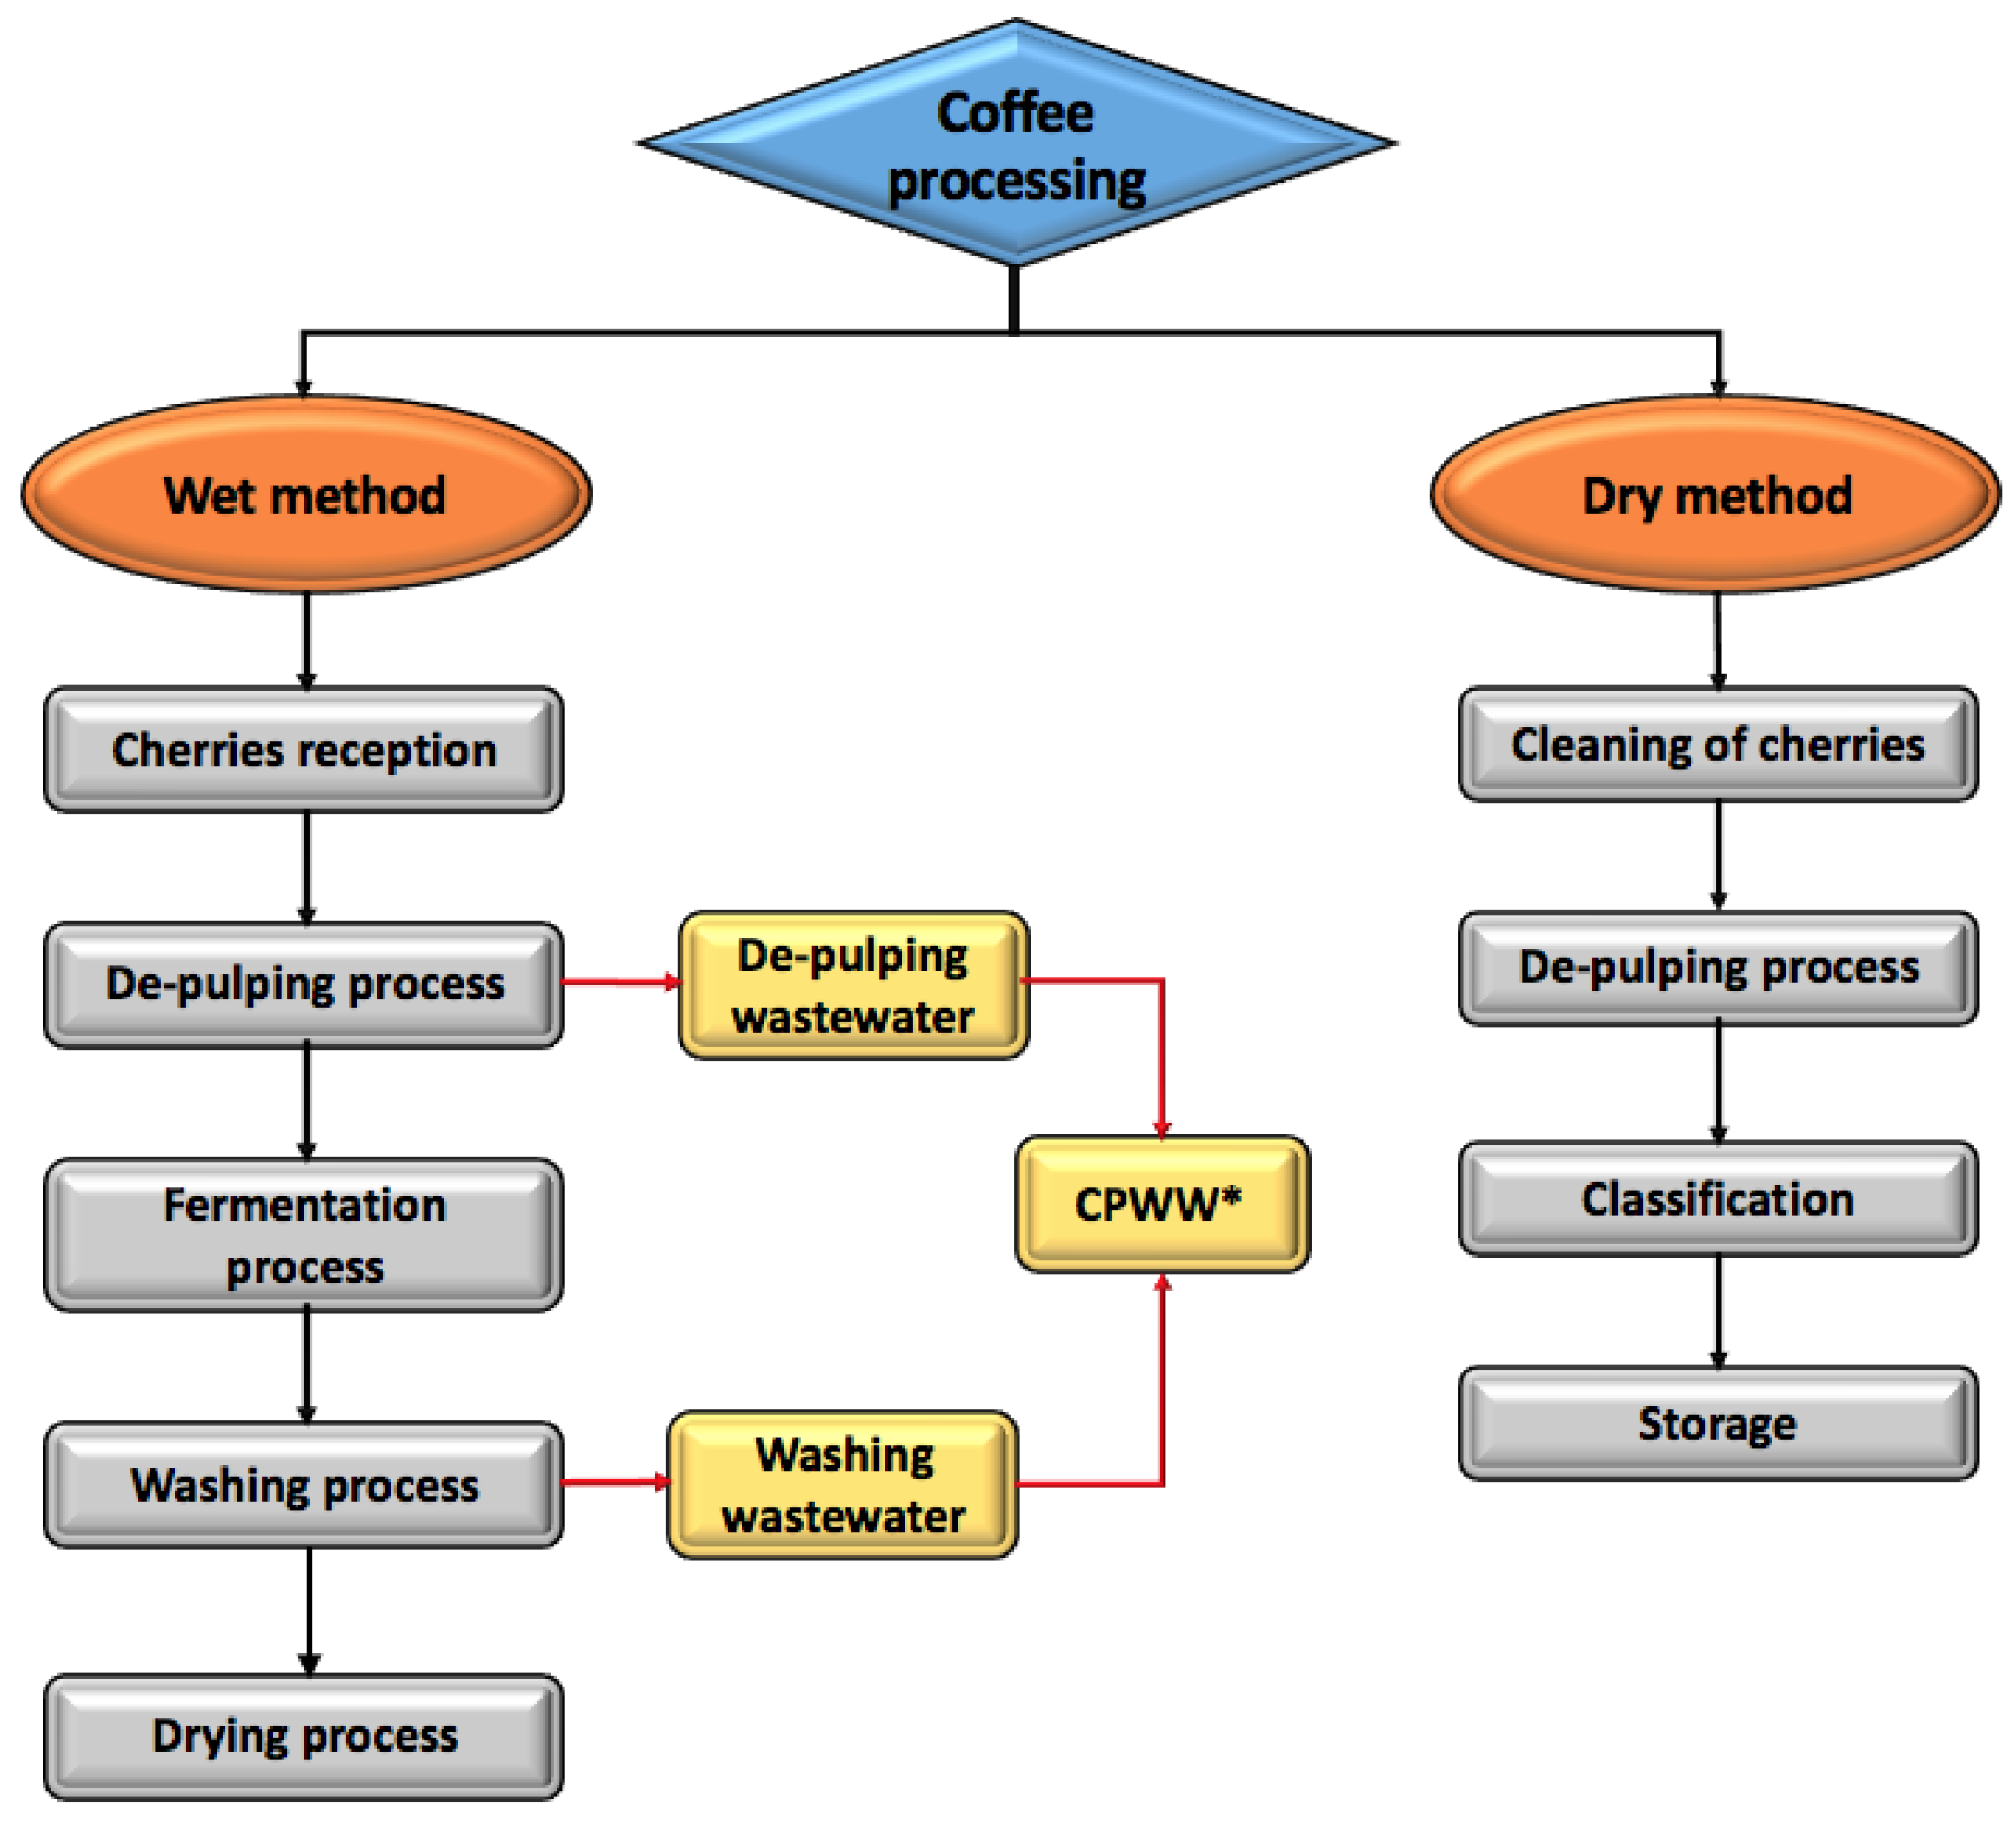
2.1. CPWW Characterization

The coffee processing wastewater was obtained from a producing coffee farm from Chiapas, Mexico. The samples were stored at −20 °C until they were used.
The CPWW characterization was realized according to the Standard Methods for Examination of Water and Wastewater [19], in order to determine pH, chemical oxygen demand (COD), biochemical oxygen demand (BOD5), total solids (TS), total volatile solids (TVS), sedimented solids, color, turbidity, acidity, alkalinity, total nitrogen, total phosphorus and sulfates. The total organic carbon (TOC) was determined using the method by Walkley and Black [20] and density was measured using a viscometer (Anton Paar SVM 300)(Anton Paar, Graz, Austria). All the tests were analyzed in triplicate.

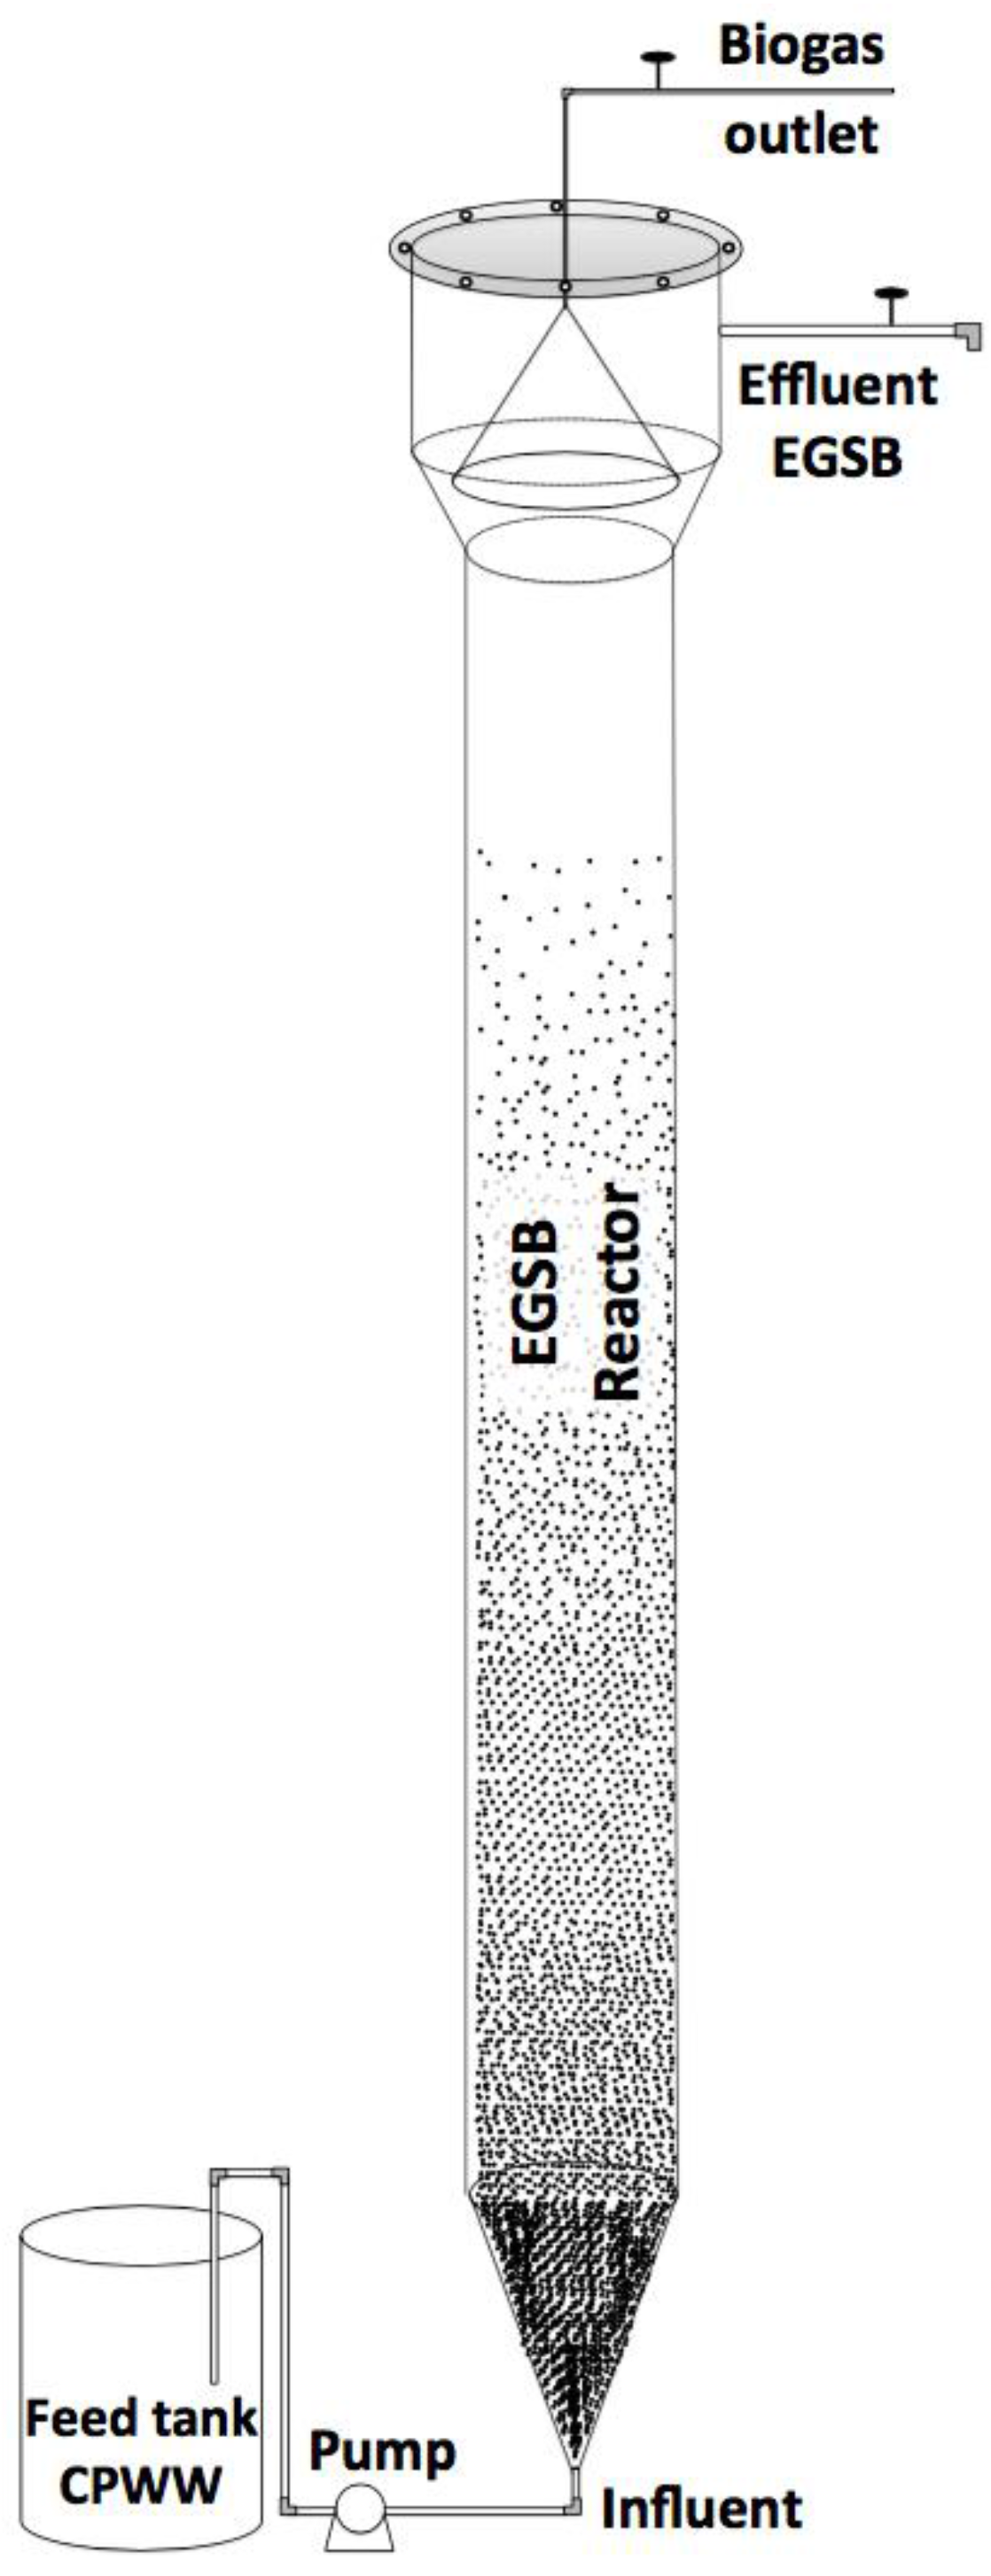
2.2. Bioreactor Set up and Operation

This study employed an EGSB bioreactor, it was made in fiberglass with 3.3 L working volume and a 15.8 height/diameter ratio. Figure 4 shows the schematic diagram bioreactor. It was inoculated with 1000 mL (30% of bioreactor working volume) of mesophilic inoculum (spherical in shape (∅, c. 0.5–1 mm) and a grey-green color with a content of TS of 49.75 g L−1 and TVS of 29.5 g L−1). The EGSB was operated at seven different HRT of 3 to 9 days and organic loading rate (OLR) of 4 to 1.5 kg COD m−3day−1. It was automatically fed using a peristaltic pump (Master Flex model 7534-04) (Cole-Parmer, Vernon Hills, IL, USA) connected to a tank of 1.5 L that stored the CPWW and the influent was buffered with NaHCO3.
The HRT was calculated by following Equation (1).
H R T = V Q
where Q is the flow rate (m3 day−1) and V is the total volume of the bioreactor (m3).

2.3. Effluent Analyses

Samples from bioreactors effluents were routinely taken for COD, pH and temperature measurement according to Standard Methods for Examination of Water and Wastewater [19]. The alkalinity factor index (α) was obtained according to the following procedure [21]: 10 mL of sample was taken and acidified with 0.1N HCl to a pH of 5.75. The required HCl (V1) is corresponded to the part alkalinity (PA). Subsequently, this sample was brought to pH 4.3 (V2) corresponding to intermediate alkalinity (IA) and the total alkalinity is the sum of both (TA = PA + IA). The α index was calculated by the following Equation (2).
α = P A T A
The VFA (meq L−1) was determinate according to Iñiguez-Covarrubias and Camacho-López [22]. The COD removal in the EGSB bioreactor refers to the difference between the influent concentration (Cinf) and the effluent concentration (Ceff). Thus, the COD removal rate (Rr) is expressed by the following Equation (3).
R r ( % ) = C i n f C e f f C i n f × 100
This equation can also be used to calculate the efficiency of the reactors in regards to other nutrients.

3. Results and Discussion

3.1. CPWW Physicochemical Characterization

Table 1 shows the physicochemical composition of CPWW. The majority of the values found for coffee pulp were similar to those reported by other authors [12,15,16,23,24]. The acidic pH is due to the presence of organic acids in berry skin and pulp. According to the findings of Hue et al. [23], they reported that the pH ranged from 3.5 to 4.5 in wastewater from the coffee fruits processing. The CPWW contained appreciable amounts of suspended, dissolved and total solids. The higher amount of suspended solids present in CPWW might be due to the presence of pectin, protein and sugars, which are biodegradable in nature. The concentrations of these organics vary with quantity of water used for processing of coffee berries [15,24].
Various researchers reported high pollution from wet processing [6,12,16,24]. As a result, the polluting potential of the coffee processing factories is enormous as shown by the BOD5 and COD content of coffee effluent reaching up to 37,944 and 45,955 mg L−1 respectively, this high level of BOD5 and COD in the CPWW might be due to the presence of high amount of organic substances and to the slowly degrading compounds present. The CPWW contained considerable amounts of nitrogen (700 mg L−1) and phosphorus (36.43 mg L−1), which might be due to the presence of pectin, protein and sugars in coffee berries.
It was evident from Table 1 that the wastewater was heavily polluted with high organic load, nutrients and suspended matter. Organic load was measured in terms of COD and BOD5 and nutrients in the term of phosphorus and nitrogen. Comparing values of pH, BOD5, COD, phosphorus and nitrogen for the CPWW with World Health Organization (WHO) [25] and Official Mexican Environmental Regulations [26] permissible limits for discharging of effluent purpose (Table 1). The values of pH, BOD, COD, phosphorus and nitrogen were 3.95, 37,944 mg L−1, 45,955 mg L−1, 36.43 mg L−1 and 700 mg L−1, respectively; it was found that the concentration of all these parameters were very high. If this CPWW were directly discharged to the water bodies without prior treatment it could produce a serious environmental pollution impact. Among these impacts are anoxia, eutrophication, death of aquatic life and many severe human health problems (like dizziness, eye, ear and skin irritation, stomach pain, nausea and breathing problems) as was reported by Haddis and Devi [16] and Padmapriya et al. [27].

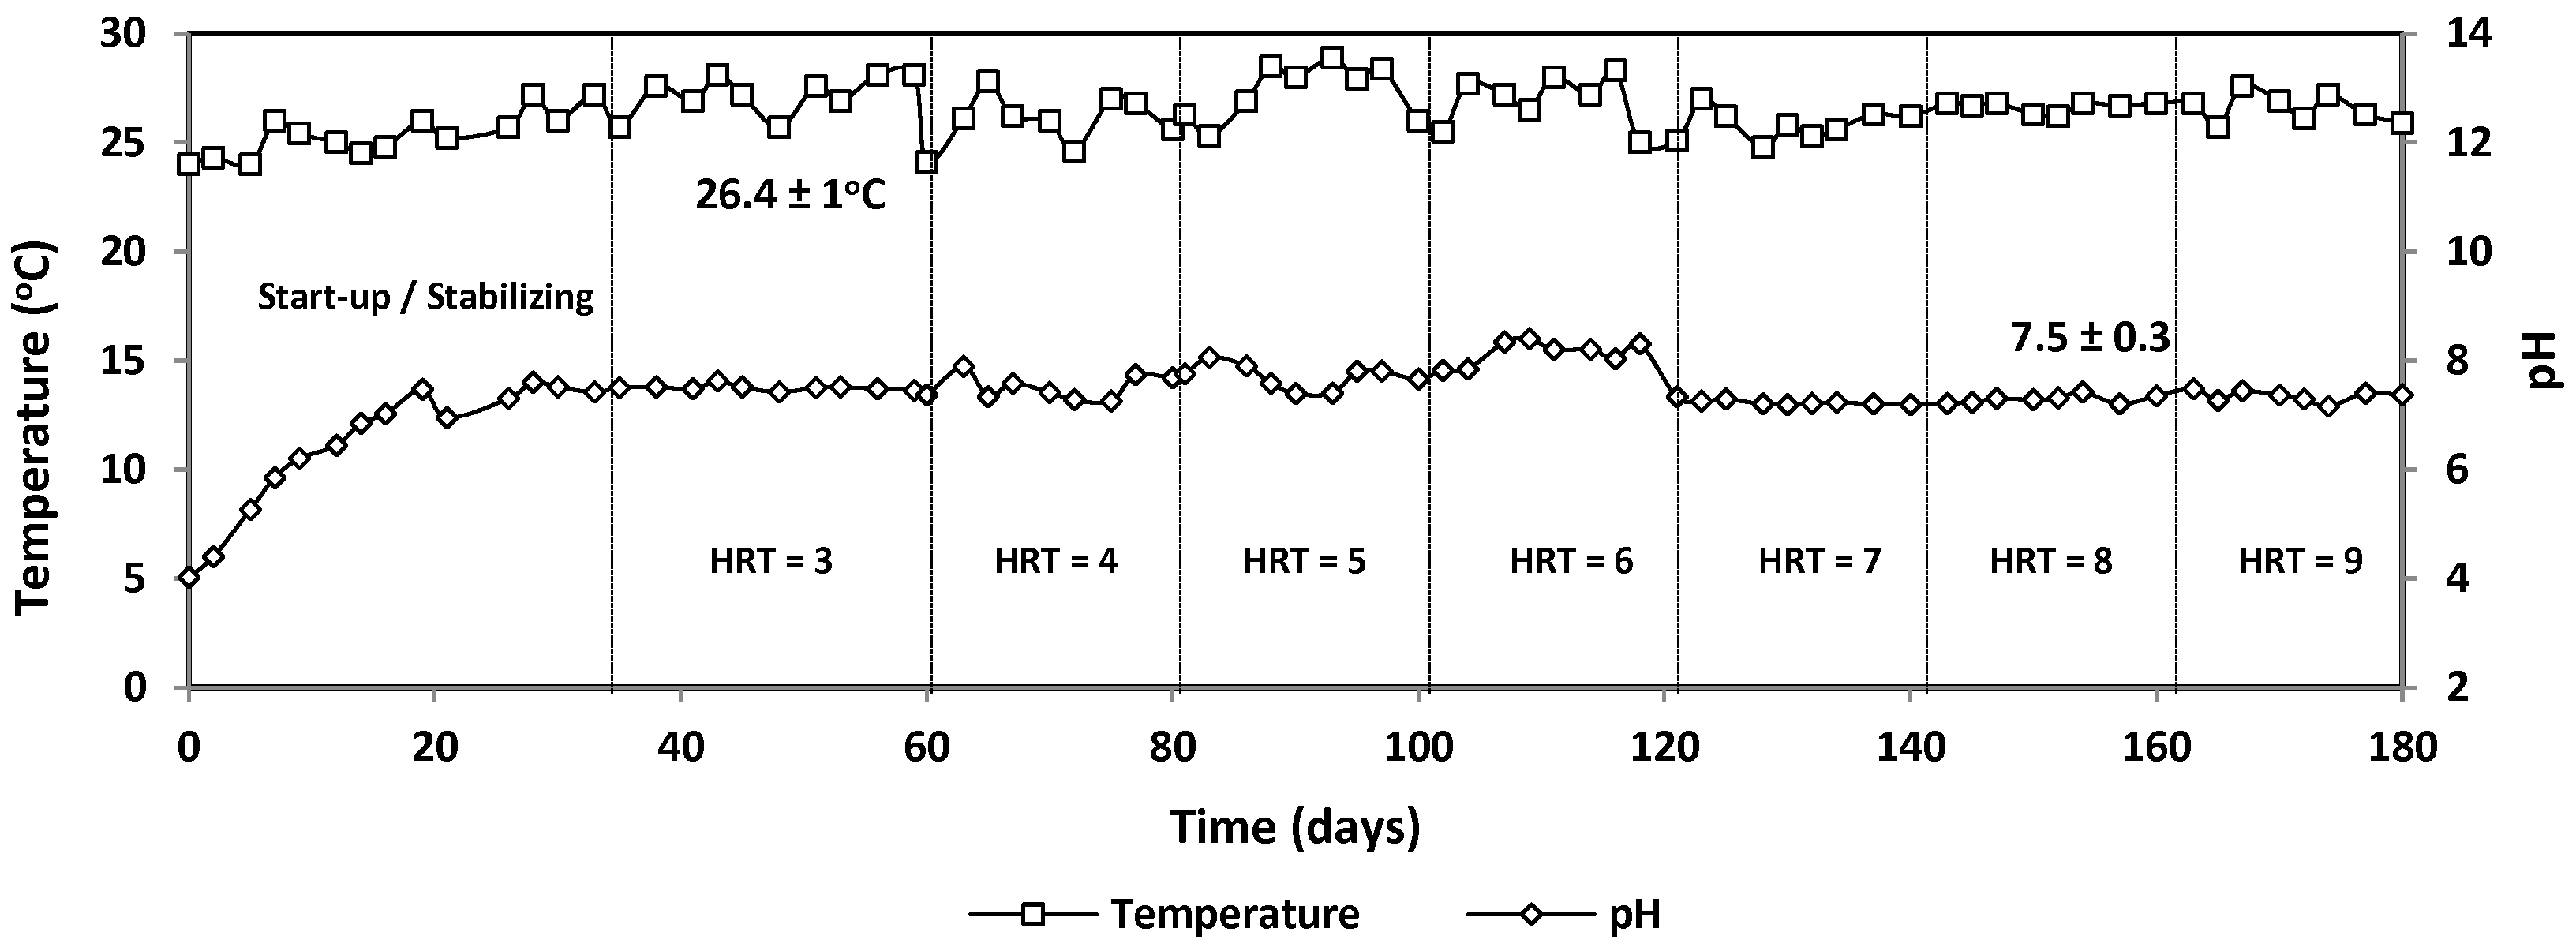
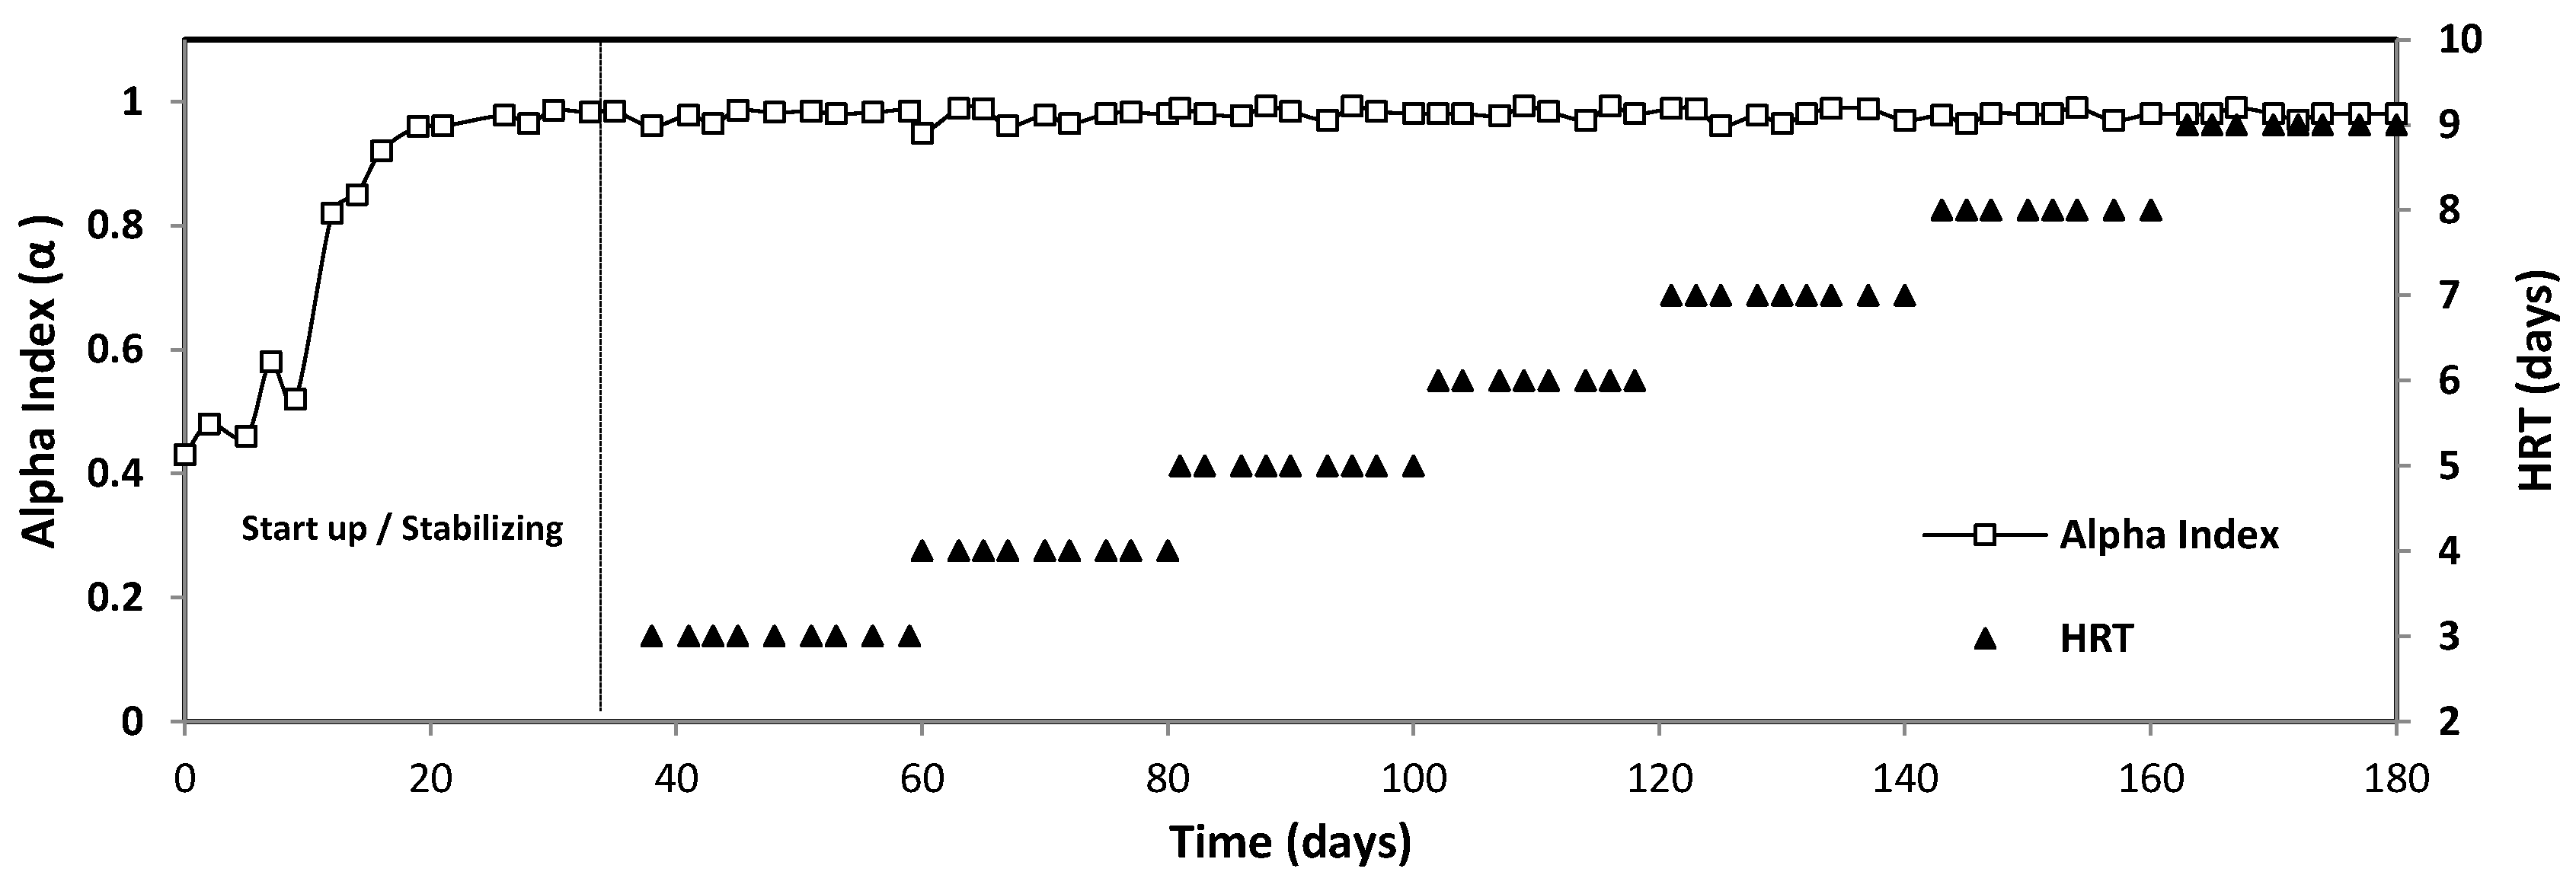
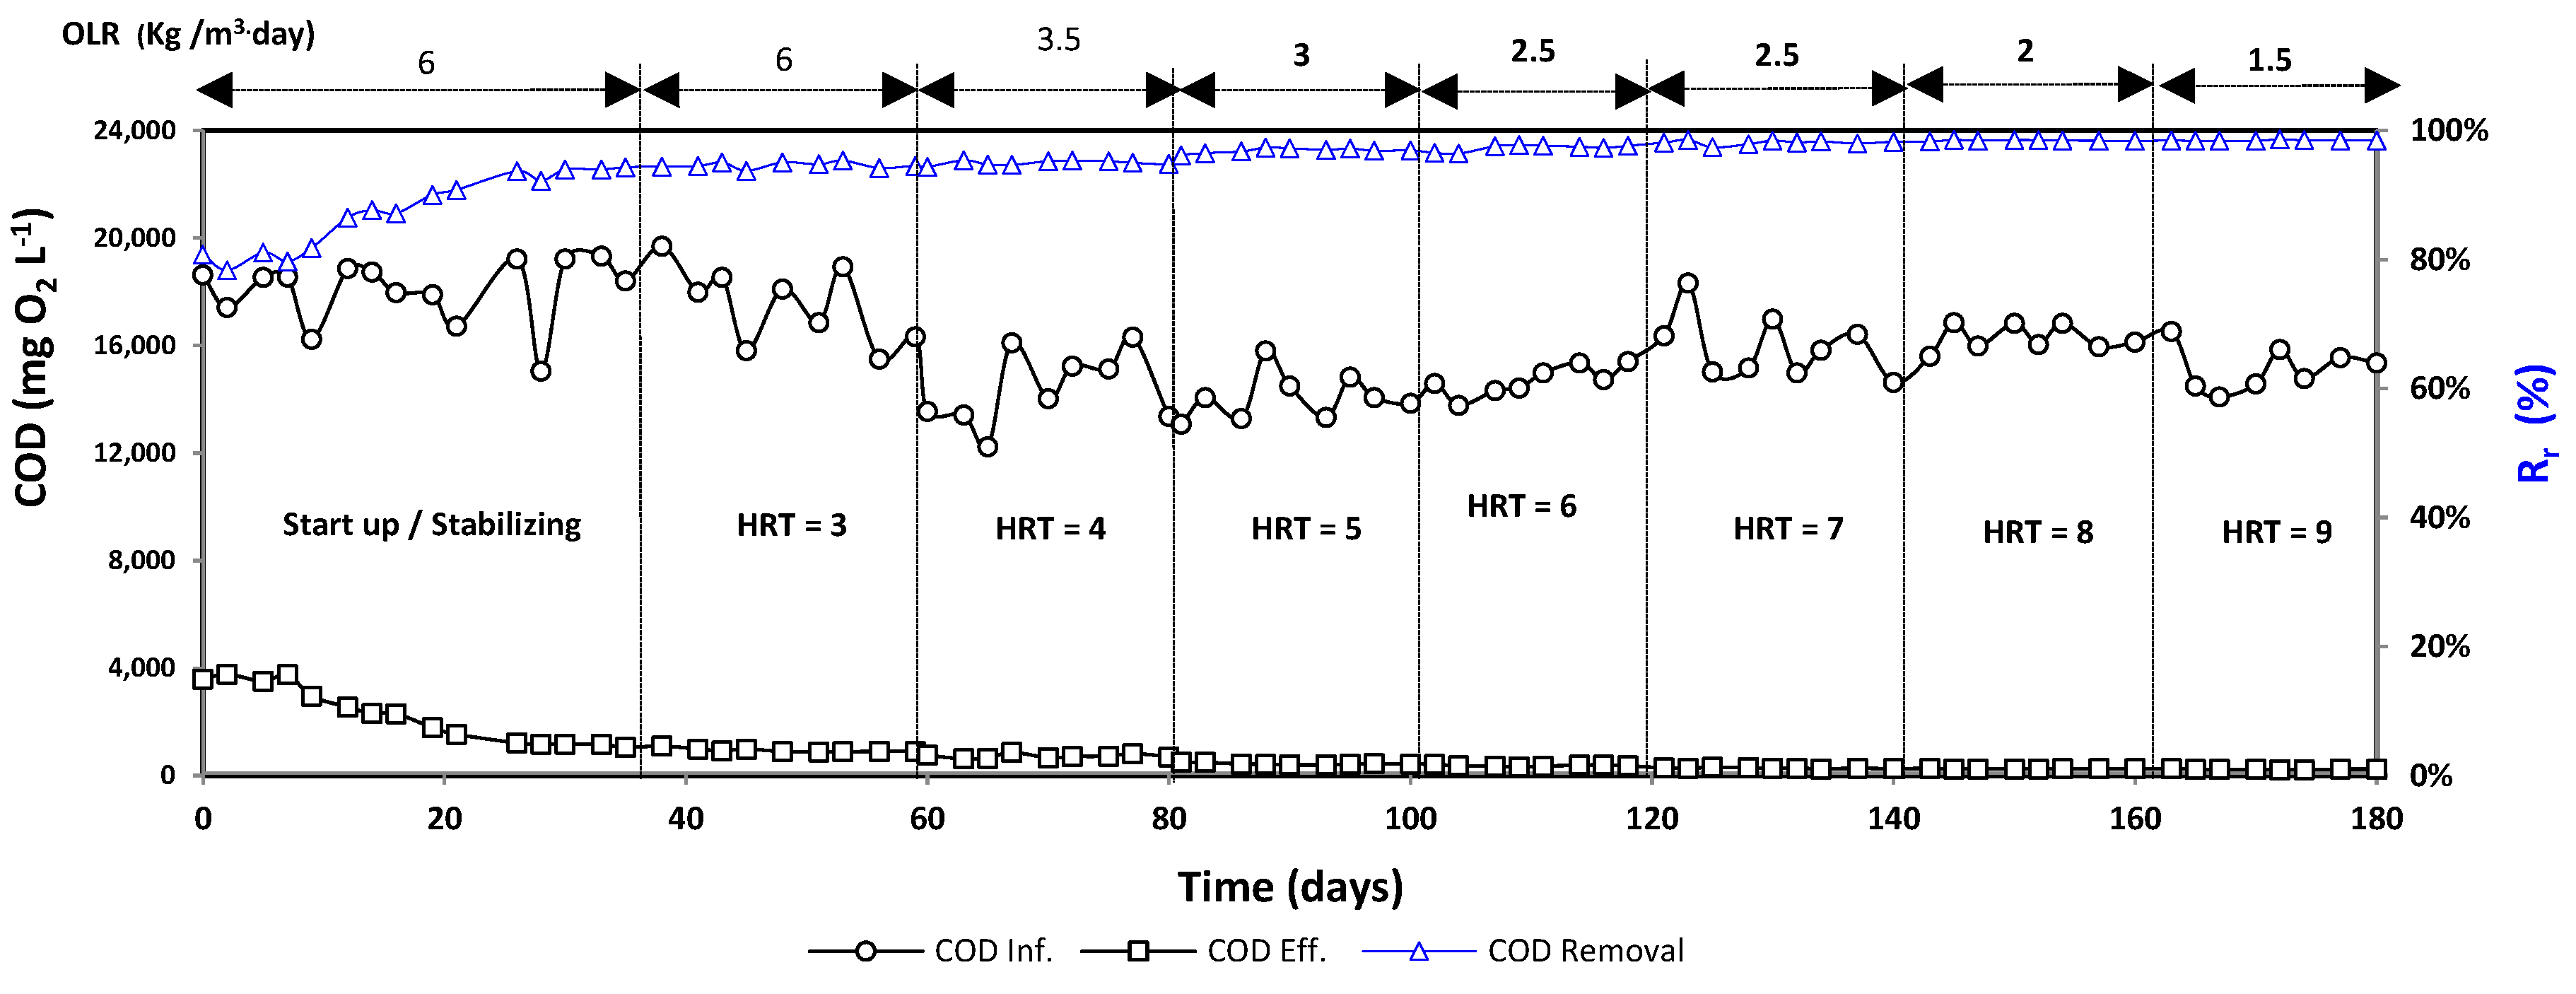
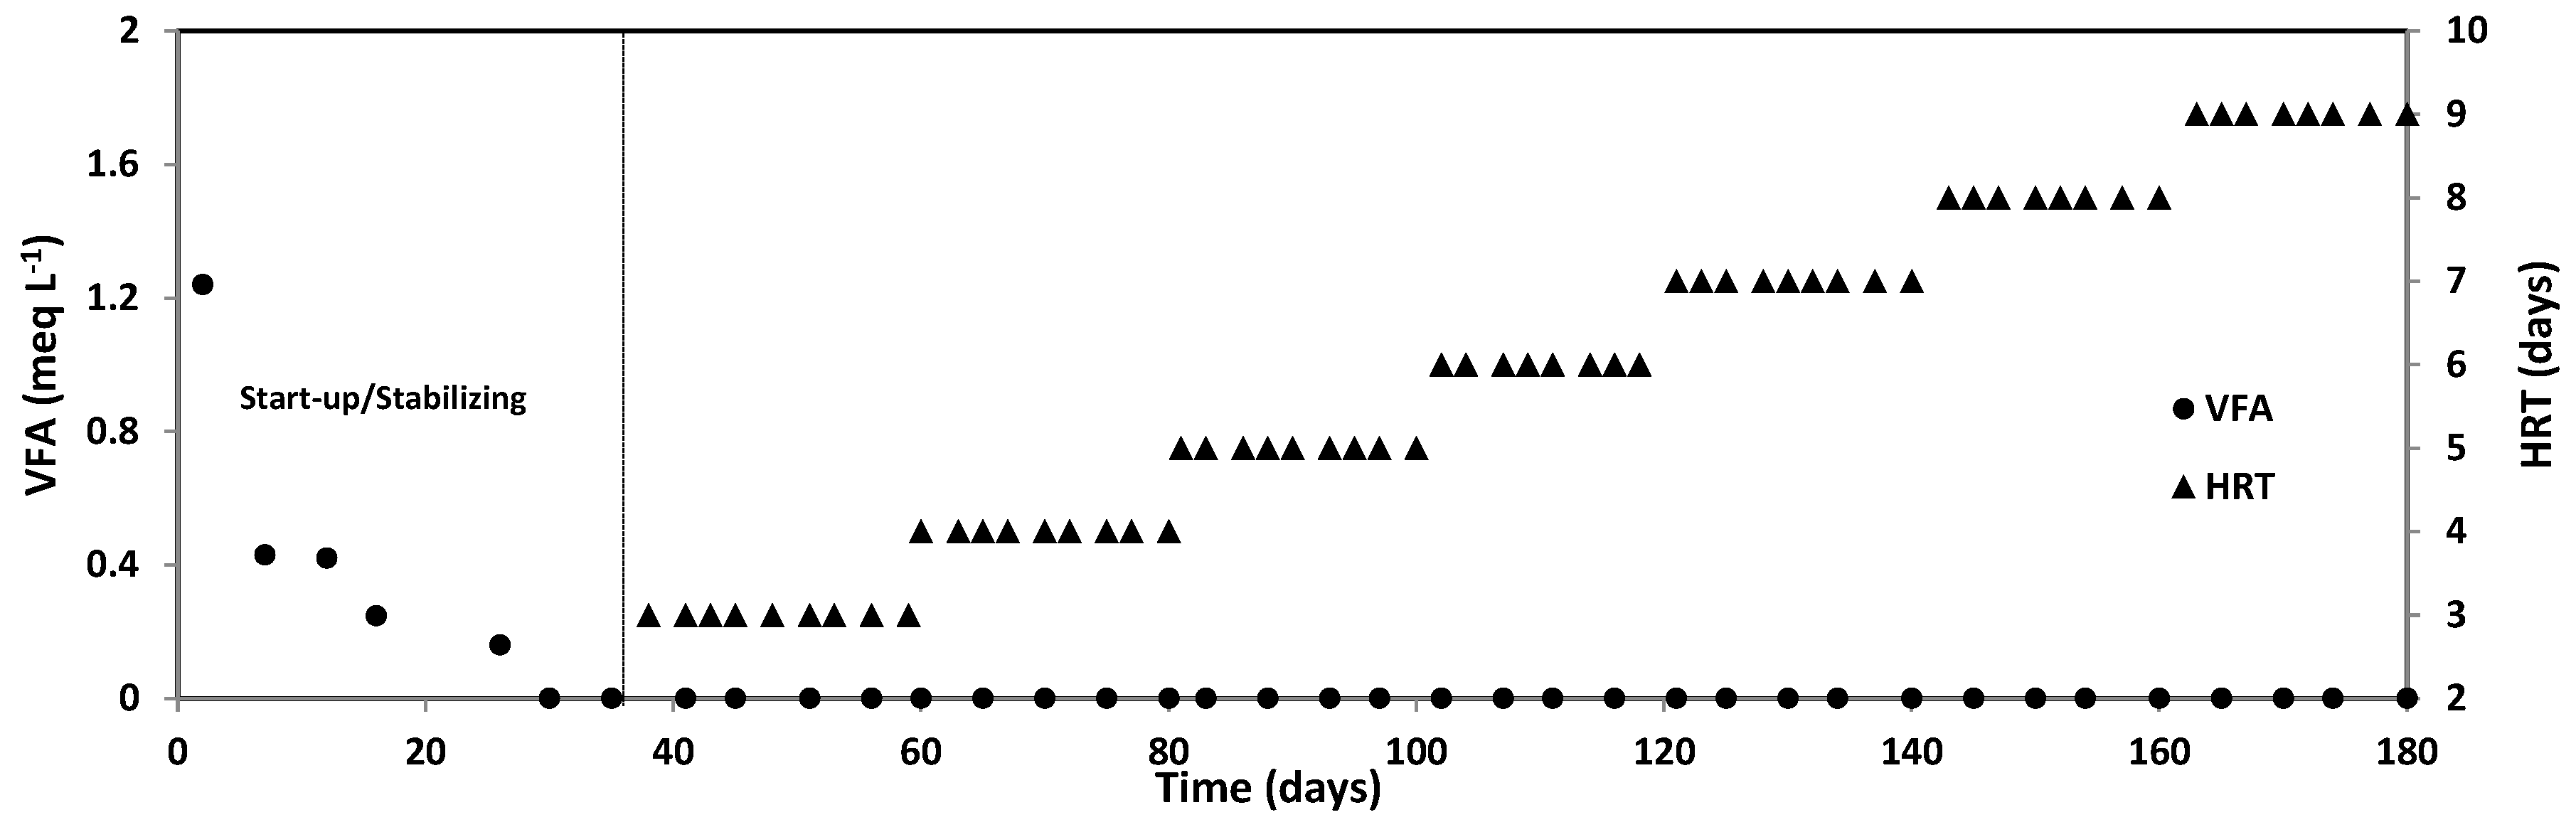
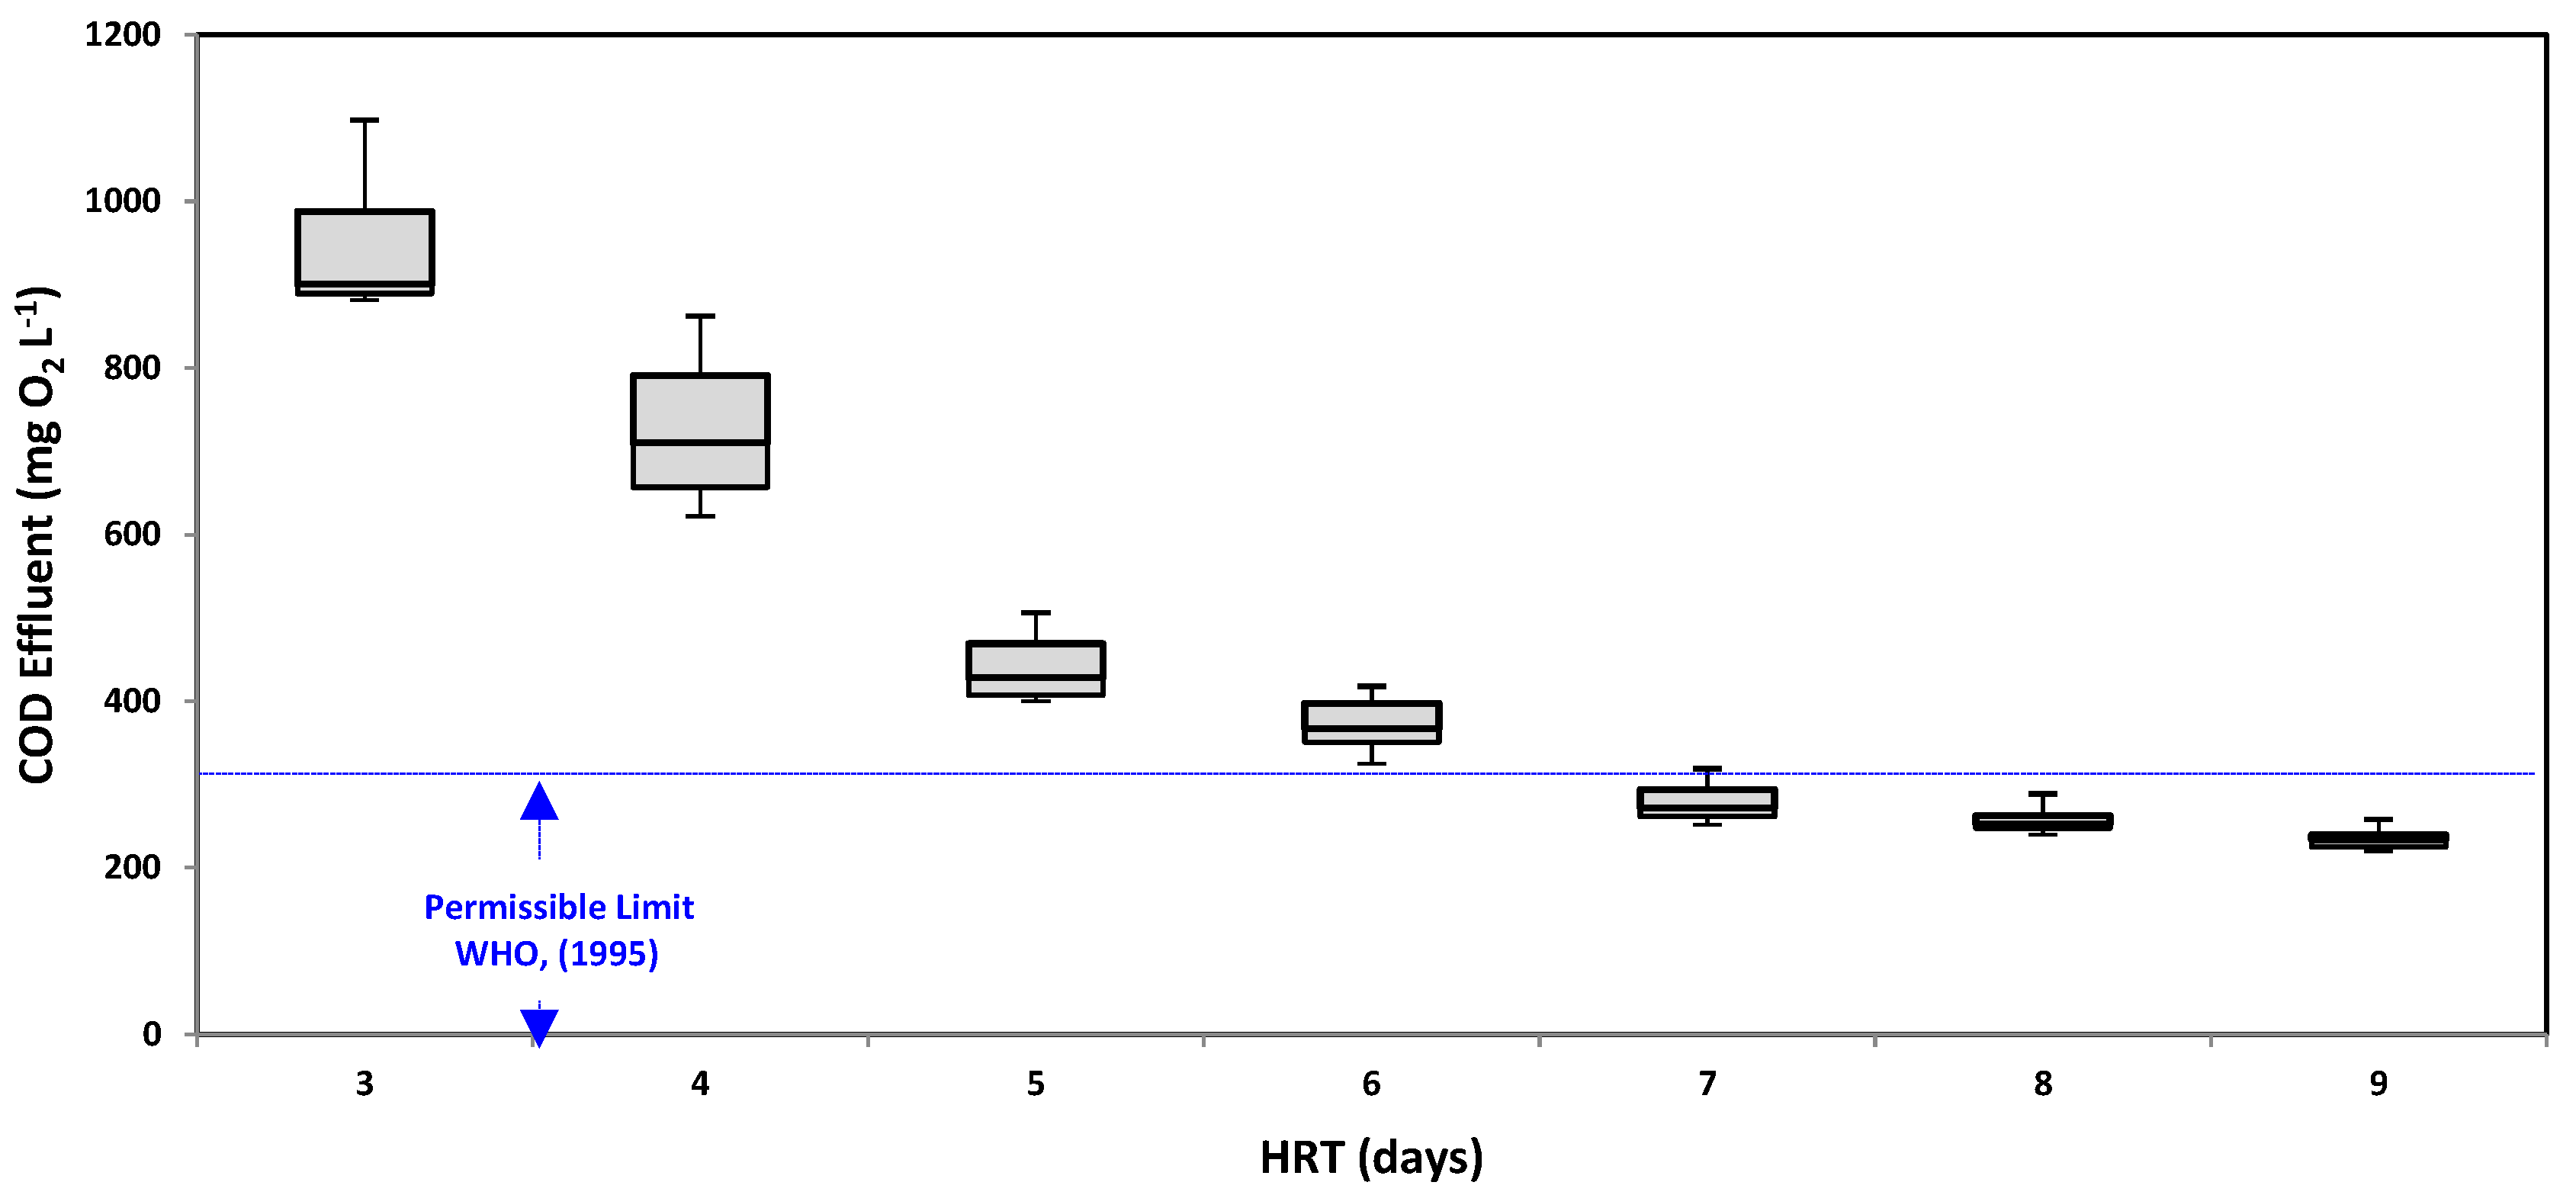
3.2. Reactor Operation Analysis

The EGSB bioreactor was operated over 180 days at mesophilic condition. The average temperature of the influents was 21.3 ± 0.5 °C. Figure 5 shows the temperature and pH profile of the effluents from the EGSB bioreactor in at different HRT. The pH is an essential factor to control during anaerobic digestion. The methanogens microorganisms have optimum growth in the pH range between 6.8 and 7.6 [28,29], although stability may be achieved in the formation of methane over a wider pH range (6.0–8.0). Values below 6.0 and above 8.3 should be avoided, as they can inhibit the methanogens microorganisms [30]. The pH levels were generally stable (pH 7.2–7.8) throughout the evaluation (HRT from 3 to 9 days). According to Rittmann and McCarty [29], a pH between 6.5–8.2 is not detrimental to anaerobic processes. In this study, it can be assumed that the bacteria adapted well to the HRT change and were not adversely affected by its increment.
An aspect related to pH is the α index. This index indicates the buffering capacity of the system to any abrupt pH change in the bioreactor; therefore, to carry out a continuous monitoring of anaerobic processes, and even to make decisions, the alpha index is a better option, for this reason some authors have suggested that the larger the α index value the better the buffering capacity of the system. Jenkins et al. [21] recommended that the alpha index values should be larger than 0.5 during start-up and reaching stable conditions in the system with values greater to 0.7 (as a rule of thumb).
As it can be seen in Figure 6, the α index reached an average value optimal during the start-up of 0.59 ± 0.16, after the third week of the start-up stage the bioreactor reached stability with an α index of 0.98 ± 0.01, which indicates a good performance of the bioreactor in the different HRT evaluated.
One of the main problems of the anaerobic biological degradation of this type of wastewater is the high content of easily fermentable organic matter. Organic matter compounds cause a fast acidification of the wastewater that results in a high production of VFA and, therefore, it is necessary to monitor the content of VFA for the good performance of the anaerobic bioreactor [31,32]. The increase of VFA in the effluents implies that the acidogenic bacteria produce more VFA than what can be utilized by the acetogenic and methanogenic bacteria. This pH decreases could affect the bioreactor performance [33]. However, in this study the EGSB bioreactor does not present accumulation of VFAs (Figure 7) although the HRT was changed 3 to 9 days. The bioreactor presented a good buffering capacity (α index above to 0.7) maintaining a pH near to 7.5.
The COD removal rate and average concentrations of COD in the influent and effluent of the EGSB bioreactor are shown in Figure 8. As it can be seen, the COD removal rate at 3 and 4 days HRT was around 94%. In addition, there is a slight increase at 5 and 6 days HRT (average 97%) and this was increase further (average 98%) at a HRT of 7, 8 and 9 days. This indicates that COD removal rate became more efficient and less variable with the HRT increase. However, the best HRT was 9 days.
In Figure 9, it can be observed that the HRT 9 days is the optimum value, because from this HRT the bioreactor effluent lies below with the maximum permissible limit (300 mg L−1) and they could be discharged to a surface water in accordance to reported by WHO and Official Mexican Environmental Regulations. Although there is no statistically significant difference with HRT 8 and 7 days, the HRT = 7 days allowing a greater volume of CPWW treatment and thus reducing operating costs.

4. Conclusions

Anaerobic digestion of CPWW was carried out in an EGSB bioreactor. The bioreactor was operated at 26 °C for 180 days. OLR was diminished step by step from 6 to 1.5 kg COD m−3day−1 while HRT was increased from 3 to 9 days. The bioreactor exhibited high efficiency in treating of CPWW with a COD removal of 98% was achieved at HRT greater than 7 days and OLR less than 2.5 kg COD m−3day−1. These effluents meet the maximum permissible limit established by the WHO and Official Mexican Environmental Regulations.
The EGSB bioreactor was stable in terms of pH, VFAs and α index during all the operation time, so the EGSB bioreactor can be an efficient and sustainable alternative for CPWW treatment compared to other conventional methods.

Acknowledgments

The authors are grateful for the access granted to the research facilities of the Faculty of Environmental Engineering and the Center for Research and Technological Development in Renewable Energies of the University of Sciences and Arts of Chiapas. As well as the Polo Tecnológico Nacional para el Desarrollo de Investigación y Pruebas Analíticas en Biocombustibles of Tecnológico Nacional de México/Instituto Tecnológico de Tuxtla Gutiérrez.

Author Contributions

Abumalé Cruz-Salomón and Edna Ríos-Valdovinos conceived and designed the experiment and all authors were involved in analyzing the data; Abumalé Cruz-Salomón performed the experiments and analyzed all the samples; Edna Ríos-Valdovinos, Francisco Pola-Albores, Rocío Meza-Gordillo and Selene Lagunas-Rivera contributed reagents/materials/analysis tools; Víctor M. Ruíz-Valdiviezo contributed with the adapted inoculum, all authors were involved and contributed to writing the paper.

Conflicts of Interest

The authors declare no conflict of interest.

References

  1. United States Department of Agriculture, Foreign Agricultural Service (USDA, FAS). Mexico Coffee Annual. Available online: https://gain.fas.usda.gov/Recent%20GAIN%20Publications/Coffee%20Annual_Mexico%20City_Mexico_5-18-2015.pdf (accessed on 7 February 2017).
  2. Producción Agrícola. Available online: https://www.gob.mx/siap/acciones-y-programas/produccion-agricola-33119 (accessed on 7 February 2017).
  3. Murthy, N.K.V.; Chandru, B.T.; Antonette, D.S. Report on IEI’s Rural Electricity and Water Supply Utility (REWSU) Project with Special Reference to the Utility at Mavinakere; International Energy Initiative: Bangalore, India, 2003; Available online: http://www.iei-asia.org/ieiblr-rewsureport.pdf (accessed on 7 February 2017).
  4. Devi, R.; Singh, V.; Kumar, A. COD and BOD reduction from coffee processing wastewater using Avacado peel carbón. Bioresour. Technol. 2008, 99, 1853–1860. [Google Scholar] [CrossRef] [PubMed]
  5. Rodríguez, S.; Pérez, R.M.; Fernández, M. Estudio de la biodegradabilidad anaerobia de las aguas residuales del beneficio húmedo del café. Interciencia 2000, 25, 386–390. [Google Scholar]
  6. Cruz-Salomón, A.; Ríos-Valdovinos, E.; Pola-Albores, F.; Meza-Gordillo, R.; Lagunas-Rivera, S.; Ruíz-Valdiviezo, V.M. Anaerobic treatment of agro-industrial wastewater for COD removal in expanded granular sludge bed bioreactor. Biofuel Res. J. 2017, 16, 715–720. [Google Scholar] [CrossRef]
  7. Siu, Y.; Mejia, G.; Mejia-Saavedra, J.; Pohlan, J.; Sokolov, M. Heavy metals in wet method coffee processing wastewater in Soconusco, Chiapas, Mexico. Bull. Environ. Contam. Toxicol. 2007, 78, 400–404. [Google Scholar] [CrossRef] [PubMed]
  8. Rossmann, M.; Teixeira de Matos, A.; Carneiro Abreu, E.; Fonseca e Silva, F.; Carraro Borges, A. Performance of constructed wetlands in the treatment of aerated coffee processing wastewater: Removal of nutrients and phenolic compounds. Ecol. Eng. 2012, 49, 264–269. [Google Scholar] [CrossRef]
  9. Bello-Mendoza, R.; Castillo-Rivera, M.F. Start-up of an anaerobic hybrid UASB filter reactor treating wastewater from a coffee processing plant. J. Anaerobe Environ. Microbiol. 1998, 4, 219–225. [Google Scholar] [CrossRef] [PubMed]
  10. Calvert, K.C. The treatment of Coffee Wastewater, The Biogas Option—A Review and Preliminary Report of Ongoing Research; Coffee Research Report (50); Coffee Industry Corporation Ltd.: Kainantu, Papua New Guinea, 1997. [Google Scholar]
  11. Von Enden, J.C. Best Practices at Wet Processing Pay Financial Benefits to Farmers and Processors. Available online: http://venden.de/pdfs/Wet_Processing_V2.pdf (accessed on 9 February 2017).
  12. Yemane, D.T.; Beyene, A.H.; Addis, T.W.; Gebresilassie, A.T. Effect of Coffee Processing Plant Effluent on the Physicochemical Properties of Receiving Water Bodies, Jimma Zone Ethiopia. Am. J. Environ. Prot. 2015, 4, 83–90. [Google Scholar] [CrossRef]
  13. Deepa, G.B.; Chanakya, H.N.; de Alwis, A.A.P.; Manjunath, G.R.; Devi, V. Overcoming pollution of lakes and water bodies due to coffee pulping activities with appropriate technology solutions. In Proceedings of the Symposium on Conservation, Restoration and Management of Aquatic Ecosystems, Bangalore, India, 9–13 December 2002. [Google Scholar]
  14. Enden, J.C.; Calvert, K.C. Limit Environmental Damage by Basic Knowledge of Coffee Waste Waters. Available online: http://www.venden.de/pdfs/Coffee_Waste_Water_tretamentV4.pdf (accessed on 9 February 2017).
  15. Selvamurugan, M.; Doraisamy, P.; Maheswari, M.; Nandakumar, N.B. High rate anaerobic treatment of coffee processing wastewater using upflow anaerobic hybrid reactor. Iran. J. Environ. Health Sci. Eng. 2010, 7, 129–136. [Google Scholar]
  16. Haddis, A.; Devi, R. Effect of effluent generated from coffee processing plant on the water bodies and human health in its vicinity. J. Hazard. Mater. 2008, 152, 259–262. [Google Scholar] [CrossRef] [PubMed]
  17. Elliott, M.; de Jonge, V.N. The management of nutrients and potential eutrophication in estuaries and other restricted water bodies. Hydrobiologia 2002, 475, 513–524. [Google Scholar] [CrossRef]
  18. Nadais, H.; Capela, I.; Arroja, L.; Duarte, A. Effect of organic, hydraulic and fat shocks on the performance of UASB reactor with intermittent operation. Water Sci. Technol. 2001, 44, 49–56. [Google Scholar] [PubMed]
  19. American Public Health Association (APHA). Standard Methods for the Examination of Water and Wastewater, 20th ed.; American Public Health Association/American Water Works Association/Water Environment Federation: Washington, DC, USA, 2005. [Google Scholar]
  20. Walkley, A.; Black, I. An examination of the Degtjareff method for determining organic carbon in soils: Effect of variations in digestion conditions and of inorganic soil constituents. Soil Sci. 2006, 63, 251–263. [Google Scholar] [CrossRef]
  21. Jenkins, S.R.; Morgan, J.M.; Sawyer, C.L. Measuring anaerobic sludge digestion and growth by simple alkalimetric titration. J. Water Pollut. Control Fed. 1983, 55, 448–453. [Google Scholar]
  22. Iñiguez-Covarrubias, G.; Camacho-López, A. Evaluation of an Upflow Anaerobic Sludge Blanket Reactor (UASB) with Changes in the Upflow Velocity. Ing. Investig. Technol. 2011, 12, 199–208. [Google Scholar]
  23. Hue, N.V.; Bittenbender, H.C.; Ortiz-Escober, M.E. Managing coffee processing water in Hawaii. J. Hawaii. Pac. Agric. 2006, 13, 15–21. [Google Scholar]
  24. Shanmukhappa, D.R.; Ananda Alwar, R.P.; Srinivasan, C.S. Water pollution by coffee processing units and its abatement. Indian Coffee 1998, 10, 3–9. [Google Scholar]
  25. WHO. Guideline for Discharge of Industrial Effluent Characteristics; WHO: Geneva, Switzerland, 1995; Volume 3, pp. 231–236. [Google Scholar]
  26. Maximum Permissible Limits of Pollutants in Wastewater Discharges into National Waters and Goods. NOM-001-ECOL. 1996. Available online: http://dof.gob.mx/nota_detalle.php?codigo=4863829&fecha=06/01/1997 (accessed on 30 December 2017).
  27. Padmapriya, R.; Tharian, J.A.; Thirunalasundari, T. Treatment of coffee effluent by Moringa oleifera seed. Int. J. Curr. Microbiol. App. Sci. 2015, 4, 288–295. [Google Scholar]
  28. Cruz-Salomón, A.; Meza-Gordillo, R.; Rosales-Quintero, A.; Ventura-Canseco, C.; Lagunas-Rivera, S.; Carrasco-Cervantes, J. Biogas production from a native beverage vinasse using a modified UASB biorreactor. Fuel 2017, 198, 170–174. [Google Scholar] [CrossRef]
  29. Rittmann, B.E.; McCarty, P.L. Environmental Biotechnology: Principles and Applications; McGraw-Hill International: New York, NY, USA, 2007. [Google Scholar]
  30. Chernicharo, C.A.L. Anaerobic Reactors, Biological Wastewater Treatment Series; IWA Publication: London, UK, 2007; Volume 4. [Google Scholar]
  31. Buzzini, A.P.; Pires, E.C. Evaluation of an Upflow Anaerobic Sludge Blanket Reactor with Partial Recirculation of Effluent Used to Treat Wastewaters from Pulp and Paper Plants. Bioresour. Technol. 2007, 98, 1838–1848. [Google Scholar] [CrossRef] [PubMed]
  32. Somasiri, W.; Xiu-Fen, L.; Wen-Quan, R.; Jian, C. Evaluation of the efficacy of upflow anaerobic sludge blanket reactor in removal of colour and reduction of COD in real textile wastewater. Bioresour. Technol. 2008, 99, 3692–3699. [Google Scholar] [CrossRef] [PubMed]
  33. Anderson, K.; Sallis, P.J.; Uyanik, S. Anaerobic treatment processes. In Handbook of Water and Wastewater Microbiology; Mara, D., Horan, N., Eds.; Academic Press: London, UK, 2003; Chapter 24; pp. 391–426. [Google Scholar]
Figure 1. General diagram of the coffee processing. * Coffee processing wastewater.
Sustainability 10 00083 g001
Figure 2. A conceptual model of the environmental pollution impact causing by the disposing untreated coffee processing wastewater to the nearby rivers adapted from Elliott & de Jonge [17].
Sustainability 10 00083 g002
Figure 3. Diagram of CPWW treatment systems applied.
Sustainability 10 00083 g003
Figure 4. Schematic diagram of EGSB bioreactor.
Sustainability 10 00083 g004
Figure 5. Monitoring of pH and temperature in the effluents of EGSB bioreactors, the temperatures shown are the media values with their standard deviations.
Sustainability 10 00083 g005
Figure 6. Behavior of the α index during the operation of the EGSB bioreactor.
Sustainability 10 00083 g006
Figure 7. Monitoring of VFA in the effluents of EGSB bioreactors.
Sustainability 10 00083 g007
Figure 8. Changes in COD the influent and effluent during the experimental period and COD removal rate (%).
Sustainability 10 00083 g008
Figure 9. HRT Optimization.
Sustainability 10 00083 g009
Table 1. Physicochemical characterization of CPWW.
ParameterValuesPermissible Limits
WHONOM-001-ECOL-1996 *
pH3.956.5–8.55–10
Color (Pt-Co)17,966.7--
Turbidity (NTU)1481.75-
Density (g mL−1)1.1075--
Alkalinity (mg CaCO3 L−1)ND--
Acidity (mg CaCO3 L−1)3360--
COD (mgO2 L1)45,955300-
BOD5 (mgO2 L1)37,944100150
BOD5/COD ratio0.82--
Sedimented solids (mL L−1)380-2
TS (mg L−1)19,593650-
TSS (mg L−1)-200125
TVS (mg L1)8208--
TOC (mg L1)11,400--
Phosphorus (mg L−1)36.43-30
Phosphate (mg L−1)-5-
Nitrogen (mg L−1)700-60
Nitrate (mg L−1)-5-
Total sulfate (mg L1)10250-
ND = not detected, * water discharged in rivers.

