1. Introduction
The carob tree (
Ceratonia siliqua L.) is an evergreen shrub or tree native to the Mediterranean region, which is cultivated for animal and human consumption. In recent years, its commercial value has increased due to the use of its fruits as raw material in food, pharmaceutical, cosmetic and biofuel industries [
1,
2]. The environmental role of carob pod tree is also attracting attention since it can be used in reforestation actions to revalorize marginal lands, as a substitute for drought sensitive species and as carbon dioxide sinks to mitigate global warming effects [
3,
4].
Carob tree offers the advantage of growing in poor and unfertile soils in the Mediterranean region and in the other parts of the world and do not require much water for irrigation. Therefore, carob tree plantations could help to compensate the expanding land desertification in these areas [
5]. The annual production of carob pods ranges from 374,800 to 441,000 tons with an average productivity of 2000–3500 Kg/ha, depending on the growing region and farming practices, being Spain, Italy and Portugal the main producers [
6,
7].
The two main carob pod constituents are pod skins (90% by weight) and seeds (10% by weight). Carob pod has a high amount of total sugar content (48–56%), which mainly consists of sucrose, glucose, fructose and maltose in variable proportions and approximately 18% of cellulose and hemicellulose. Carob seeds are extremely hard and contain 30–40% by weight of galactomannan, a polysaccharide molecule composed by mannose and galactose sugar units, also known as carob bean gum, which is mostly used in the food industry to obtain a high quality, nutritious and superb tasting fodder for horses, cattle and goats [
8].
The development of an environmental friendly chemical industry has promoted that both industry and research focus their effort on the exploitation of biomass sources, which opens a new way for the revalorization of carob pod among other biomass sources [
9,
10]. Carob tree is a sugar-rich biomass which may theoretically be ideal for biofuel production carob [
11]. Several studies have delved into the production of ethanol from carob pod, showing its technical and economical competitiveness compared with other traditional crops [
12,
13,
14]. Other works have also assessed the use of this dryland forest crop for the efficient production of biohydrogen [
15]. Thus, carob tree could represent an alternative and renewable source of bioenergy
On the other hand, carob tree products include anti-nutrients such as trypsin inhibitors and phytic acid with promising applications in assorted fields. To this regard, phytic acid is well known as antioxidant that can be used both for biomedicine purposes and as an important food preservative [
1].
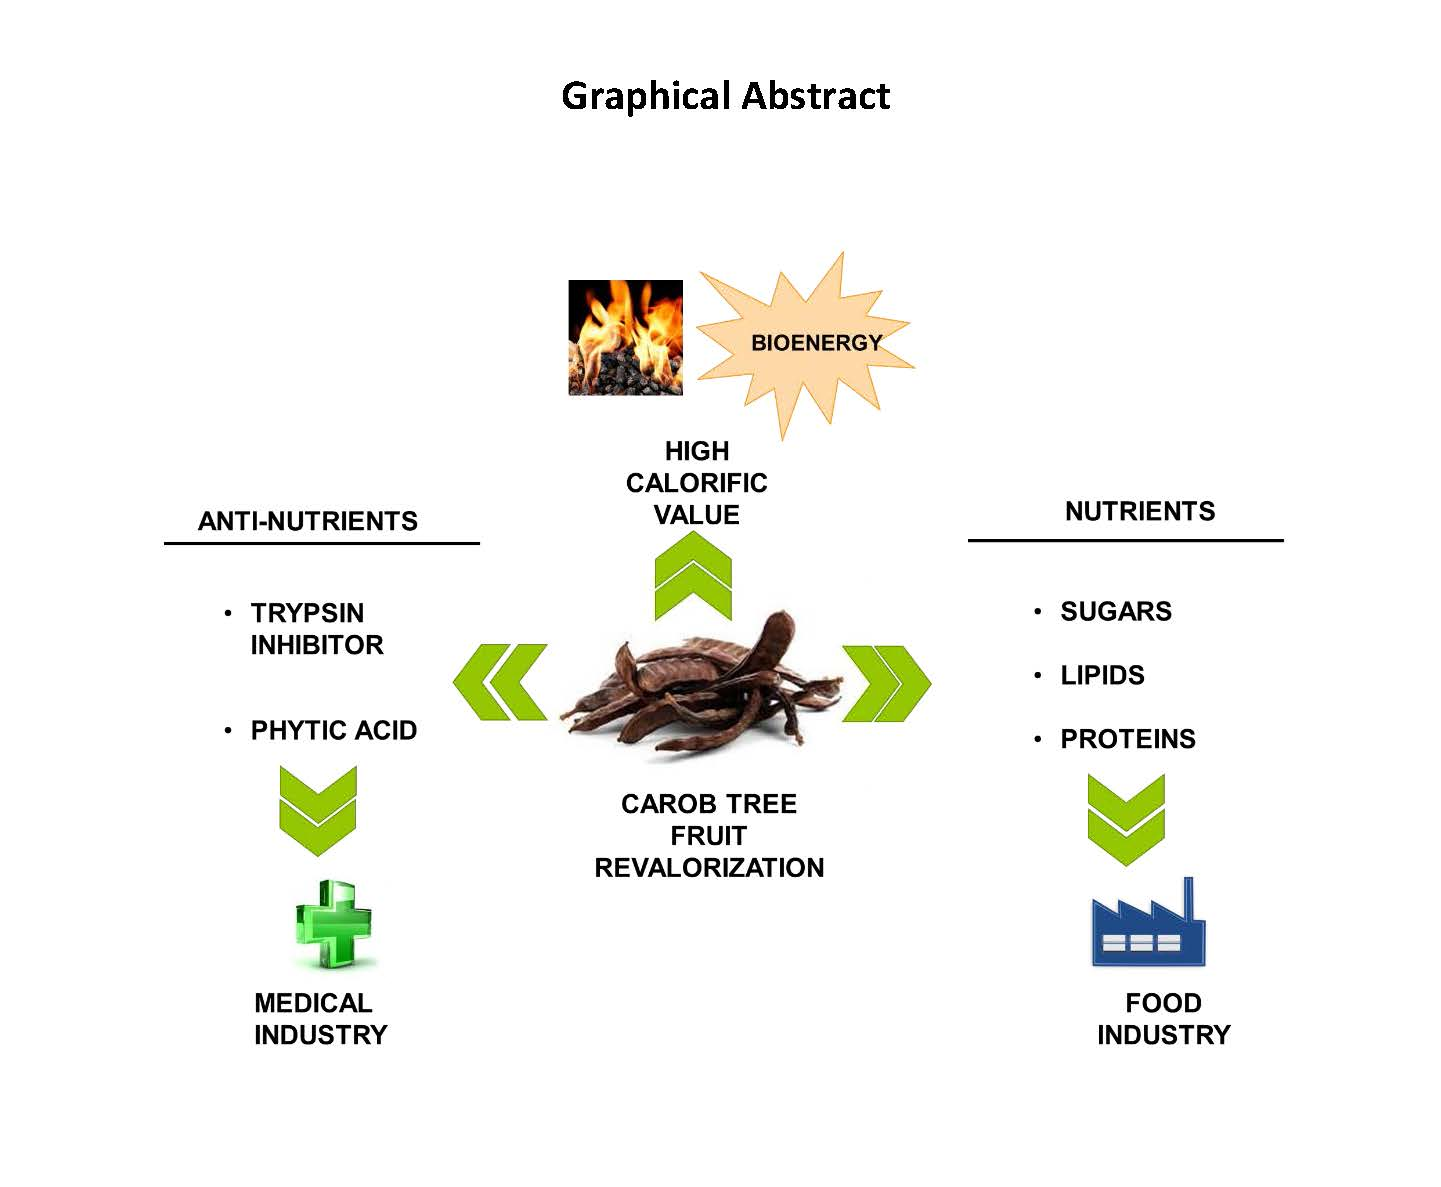
The aim of this work is to characterize Algerian Ceratonia siliqua L. products, such as pod, pulp, seed and leaves, specifically in terms of nutrient and anti-nutrient content, exploring its potential for food-related process applications. This information provides a good basis for the future study of the relationship between anti-nutritional factors and the protein digestibility of carob tree products. Other important parameters such as moisture, ash and caloric values were also analyzed. In addition, an integral approach for the valorization of Algerian carob tree products is presented in this work based on the thorough analysis performed, including processes for the separation of the respective compounds.
2. Materials and Methods
2.1. Samples
Samples of carob (pod and leaves) were collected from the region of Tazmalt in northern Algeria, where Carob tree (Ceratonia siliqua L.) naturally grows. The samples were harvested during September 2011. The seeds were removed from 1 kg of carob pod to obtain pulp sample, and another kg of carob pod was milled with the seeds to obtain pod sample. All pod, pulp, seed and leave samples were ground with a crusher (IKA®, A 11 basic, Staufen, Germany) and passed through a 500-µm sieve before analyses.
2.2. Fractionation of Proteins
The fractionation of protein was performed according to the Osborne method [
16] with some modifications. Defatted wheat flour (0.5 g) was sequentially extracted by this method. Albumin-globulin extraction was done by using a 0.5 M NaCl (10 mL) aqueous solution for 30 min at 4 °C, this step being repeated three times, and then by centrifugation at 20,000 ×
g for 15 min. All supernatants (albumin + globulin extracts) were transferred and diluted with 0.5 M NaCl in a volumetric flask up to 50 mL. The solid waste was extracted with a 70%
v/
v (10 mL) ethanol solution in the same conditions mentioned above for recovering gliadin. The total soluble glutenin was recovered by solvent extraction using a 50%
v/
v solution of 1-propanol and 1%
v/
v dithiothreitol from the solid residue after gliadin extraction. The content of insoluble glutenin was calculated as the difference between content of total protein and sum of albumin + globulin, gliadin and soluble glutenin. Protein content was calculated, in each fraction, from the nitrogen content determined by an elemental nitrogen analyzer Model TOC-V CSH SHIMADZU. The results are given as percentage of dry weight.
2.3. In Vitro Protein Digestibility
Defatted samples (0.3 g) were incubated (37 °C, 3 h) with pepsin in 0.1 N HCl followed by inactivation with 1 N NaOH. Incubation was continued (24 h, 37 °C) with trypsin and α-chymotrypsin in potassium phosphate buffer, pH 8.0, followed by inactivation with trichloroacetic acid (TCA). Zero-time control was maintained by inactivating the enzyme before addition of substrate. The inactivated reaction mixtures were centrifuged and the supernatant was collected. The residue was washed with 10%
v/
v TCA solution and centrifuged. The combined supernatant was extracted with diethyl ether twice and the ether layer was discarded by aspiration. The aqueous layer was then heated for 15 min with a boiling water bath to remove traces of ether. Nitrogen (N) was determined to calculate protein in the digest using an elemental nitrogen analyzer Model TOC-V CSH SHIMADZU and the in vitro Protein Digestibility (IVPD) was calculated as follows [
17]:
2.4. Trypsin Inhibitory Factor
One gram of sample was digested with sodium hydroxide 0.1 M at room temperature and pH between 9.5 and 9.8. This suspension was diluted to the point that the inhibition of trypsin was 40 to 60%. One milliliter of diluted sample was mixed with equal amount of distilled water and 2 mL of trypsin solution (20 mg/L of 0.01 MHCl), and the mixture was incubated at 37 °C for 10 min. After incubation, 5 mL of benzyl-DL-arginine-para-nitroanilide (BAPNA) solution were added and mixed at 37 °C for 10 minutes. The reaction was stopped by adding 1 mL of 30%
v/
v acetic acid solution. After centrifugation, the absorbance of the solution was measured at 410 nm using a SHIMADZU UV-1650PC UV-VIS spectrophotometer [
18]. Trypsine inhibitor activity (TIA) was calculated as:
where D is the dilution factor, A1 is the change in absorbance (pure trypsin and sample extract) and S is the sample weight (g).
2.5. Phytic Acid Determination
Finely grounded sample (1.4 g) was extracted with 50 mL of 3% TCA solution and centrifuged at 3000 rpm for 10 min. Twenty milliliters of the clear solution were mixed with 4 mL of FeCl
3 (5.8 g dissolved in 1 L of 3% TCA solution) and heated in a boiling water bath for 45 min. The precipitated formed was washed three times with hot distilled water, 3% TCA solution and 0.15 N NaOH solution, respectively, and then was dissolved in 1.3 N HNO
3 and diluted to 100 mL with 0.3 M KSCN solution. The absorbance of the sample was measured at 480 nm using a SHIMADZU UV-1650PC UV-VIS spectrophotometer and was compared with standards prepared using Fe(NO
3)
3 dissolved in 0.3 M KSCN [
18].
2.6. Sugar Analysis
The sugars were extracted with water at room temperature according to Biner et al. [
19] with slight modifications. Ten grams of ground dried pods were mixed with 40 mL of water, homogenized using a macerator and centrifuged at 6000 rpm for 30 min at room temperature. The supernatant was filtered with filter paper and 2.5 mL of filtrate was mixed with 7.5 mL of acetonitrile. The mixture was filtered through a 0.45 micropore membrane. Quantification and identification of the different sugars were performed by ion chromatography with PAD detector using a Metrosep Carb 1–150 column and 80 mM NaOH as mobile phase. The chromatographic system used is ion chromatography with PAD detector (Metrohm, FL, USA).
Individual sugars were quantified by comparison with external standards of pure fructose, glucose and sucrose (Sigma-Aldrich, St. Louis, MO, USA). Calibration curves were constructed for all standard sugar solutions.
2.7. Proximate Analysis
The contents of moisture, ash and crude lipid (Soxhlet extraction) were determined according to the AOAC (1990) procedures [
20]. The total N and crude protein (N × 6.25) content of the samples were determined by using combustion N analysis (AOAC, 1997, N analyzer Flash EA
® 1122; Thermo Scientific, West Palm Beach, FL, USA) with EDTA as standard [
21].
2.8. Calorific Values
The calorific value was calculated according to the following expression [
22]:
2.9. Statistical Analyses
All analytical measurements were done in triplicate. Values were averaged and given with standard deviation (±SD). Data were subjected to one-way analysis of variance (ANOVA, F-test). Significance of mean differences was determined. Significance was accepted at p ≤ 0.05. Superscripts a, b, c, d throughout the text are related to statistical tests performed by ANOVA. For a given parameter, the values that not share the same letter are significantly different.
3. Results and Discussion
3.1. Chemical Composition of Carob Tree Products
Moisture, ash, total protein, fat, and carbohydrate profile of the sample are shown in
Table 1. As can be seen, moisture percentage and ash content range from 8.4 to 9.5% and 2.6 to 7.3%, respectively. It is worth noting that the maximum amount of ash was found in the leaves. These results are in line with previous findings on carob powder [
23].
The results also show that the carob pod is a low fat fruit rich in carbohydrates, which is in good agreement with the results showed in previous studies [
19,
21]. Most of the sugar amount is present in the pulp and the pod. As pod consists of pulp and seeds, the amount of sugar in the pod should be higher than in the pulp. The seed contains the maximum amount of protein and the minimum amount of sugar. The carob pod could be interesting as food because it is known that legume carbohydrates reduce cholesterol and increase blood glucose levels [
22].
No significant differences (
p > 0.05) were observed between the calorific value of carob pod and pulp [
22]. The lowest calorific value was found in the seeds. Regarding the type of sugar in the carob pod (
Table 2), the highest amount of sugar corresponds to sucrose. Much lower amounts of glucose and fructose were founded, and fructose was not found in the seeds analyzed. Total sugars in
Table 1 and
Table 2 include the total amount of sucrose, glucose, fructose and remaining sugars present in the sample.
3.2. Fractionation and In Vitro Protein Digestibility
The total protein of carob was fractionated based on solubility of each product into albumins + globulins, gliadins, soluble and insoluble glutenins. The results obtained after the fractionation of the protein are shown in
Table 3. The protein fraction with the lowest value was albumin + globulin, being gliadin and insoluble glutenin the major storage proteins.
Protein digestibility is a nutritional parameter that evaluates the use of a protein s ource. This is influenced by several factors such as phenolic compounds, inhibitors of protein, and heat treatment [
24].
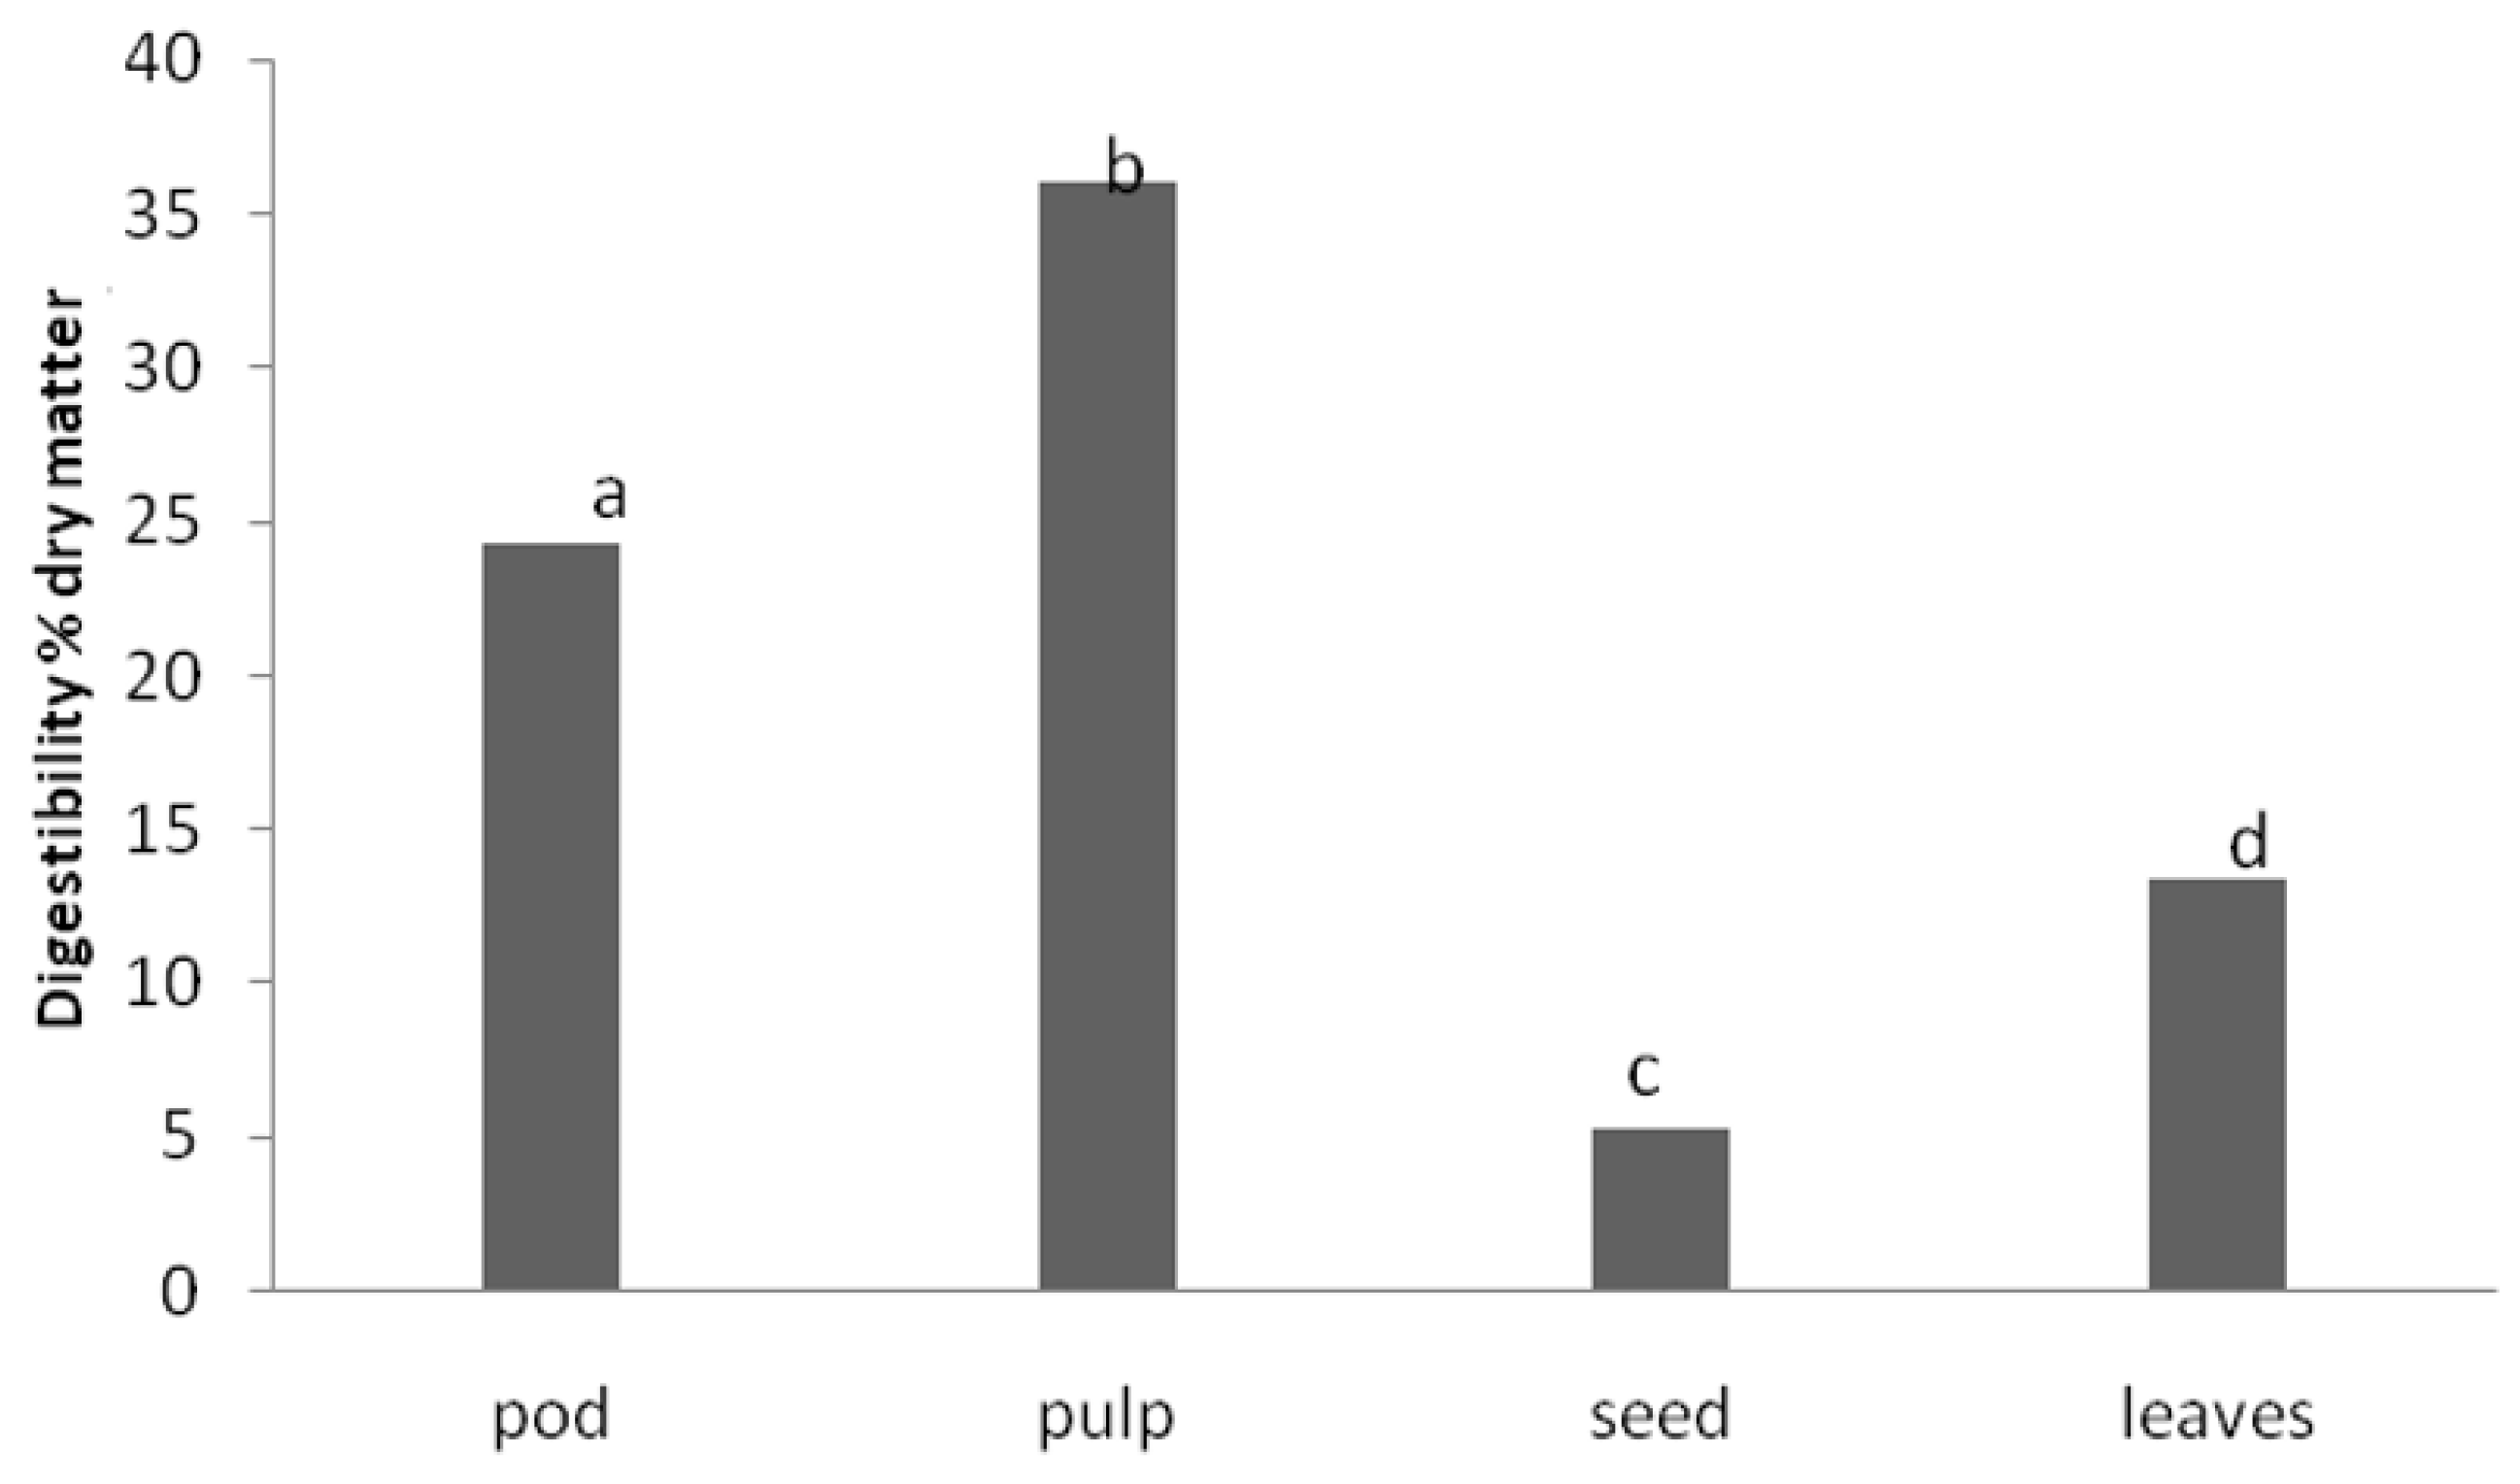
Figure 1 shows the results obtained in this study for carob tree products.
There were significant differences (p < 0.05) in IVPD between the different samples tested. The highest digestibility value belongs to the carob pulp. It should also be highlighted that the seeds, which are the products of carob with the highest content in crude protein, showed the lowest digestibility value.
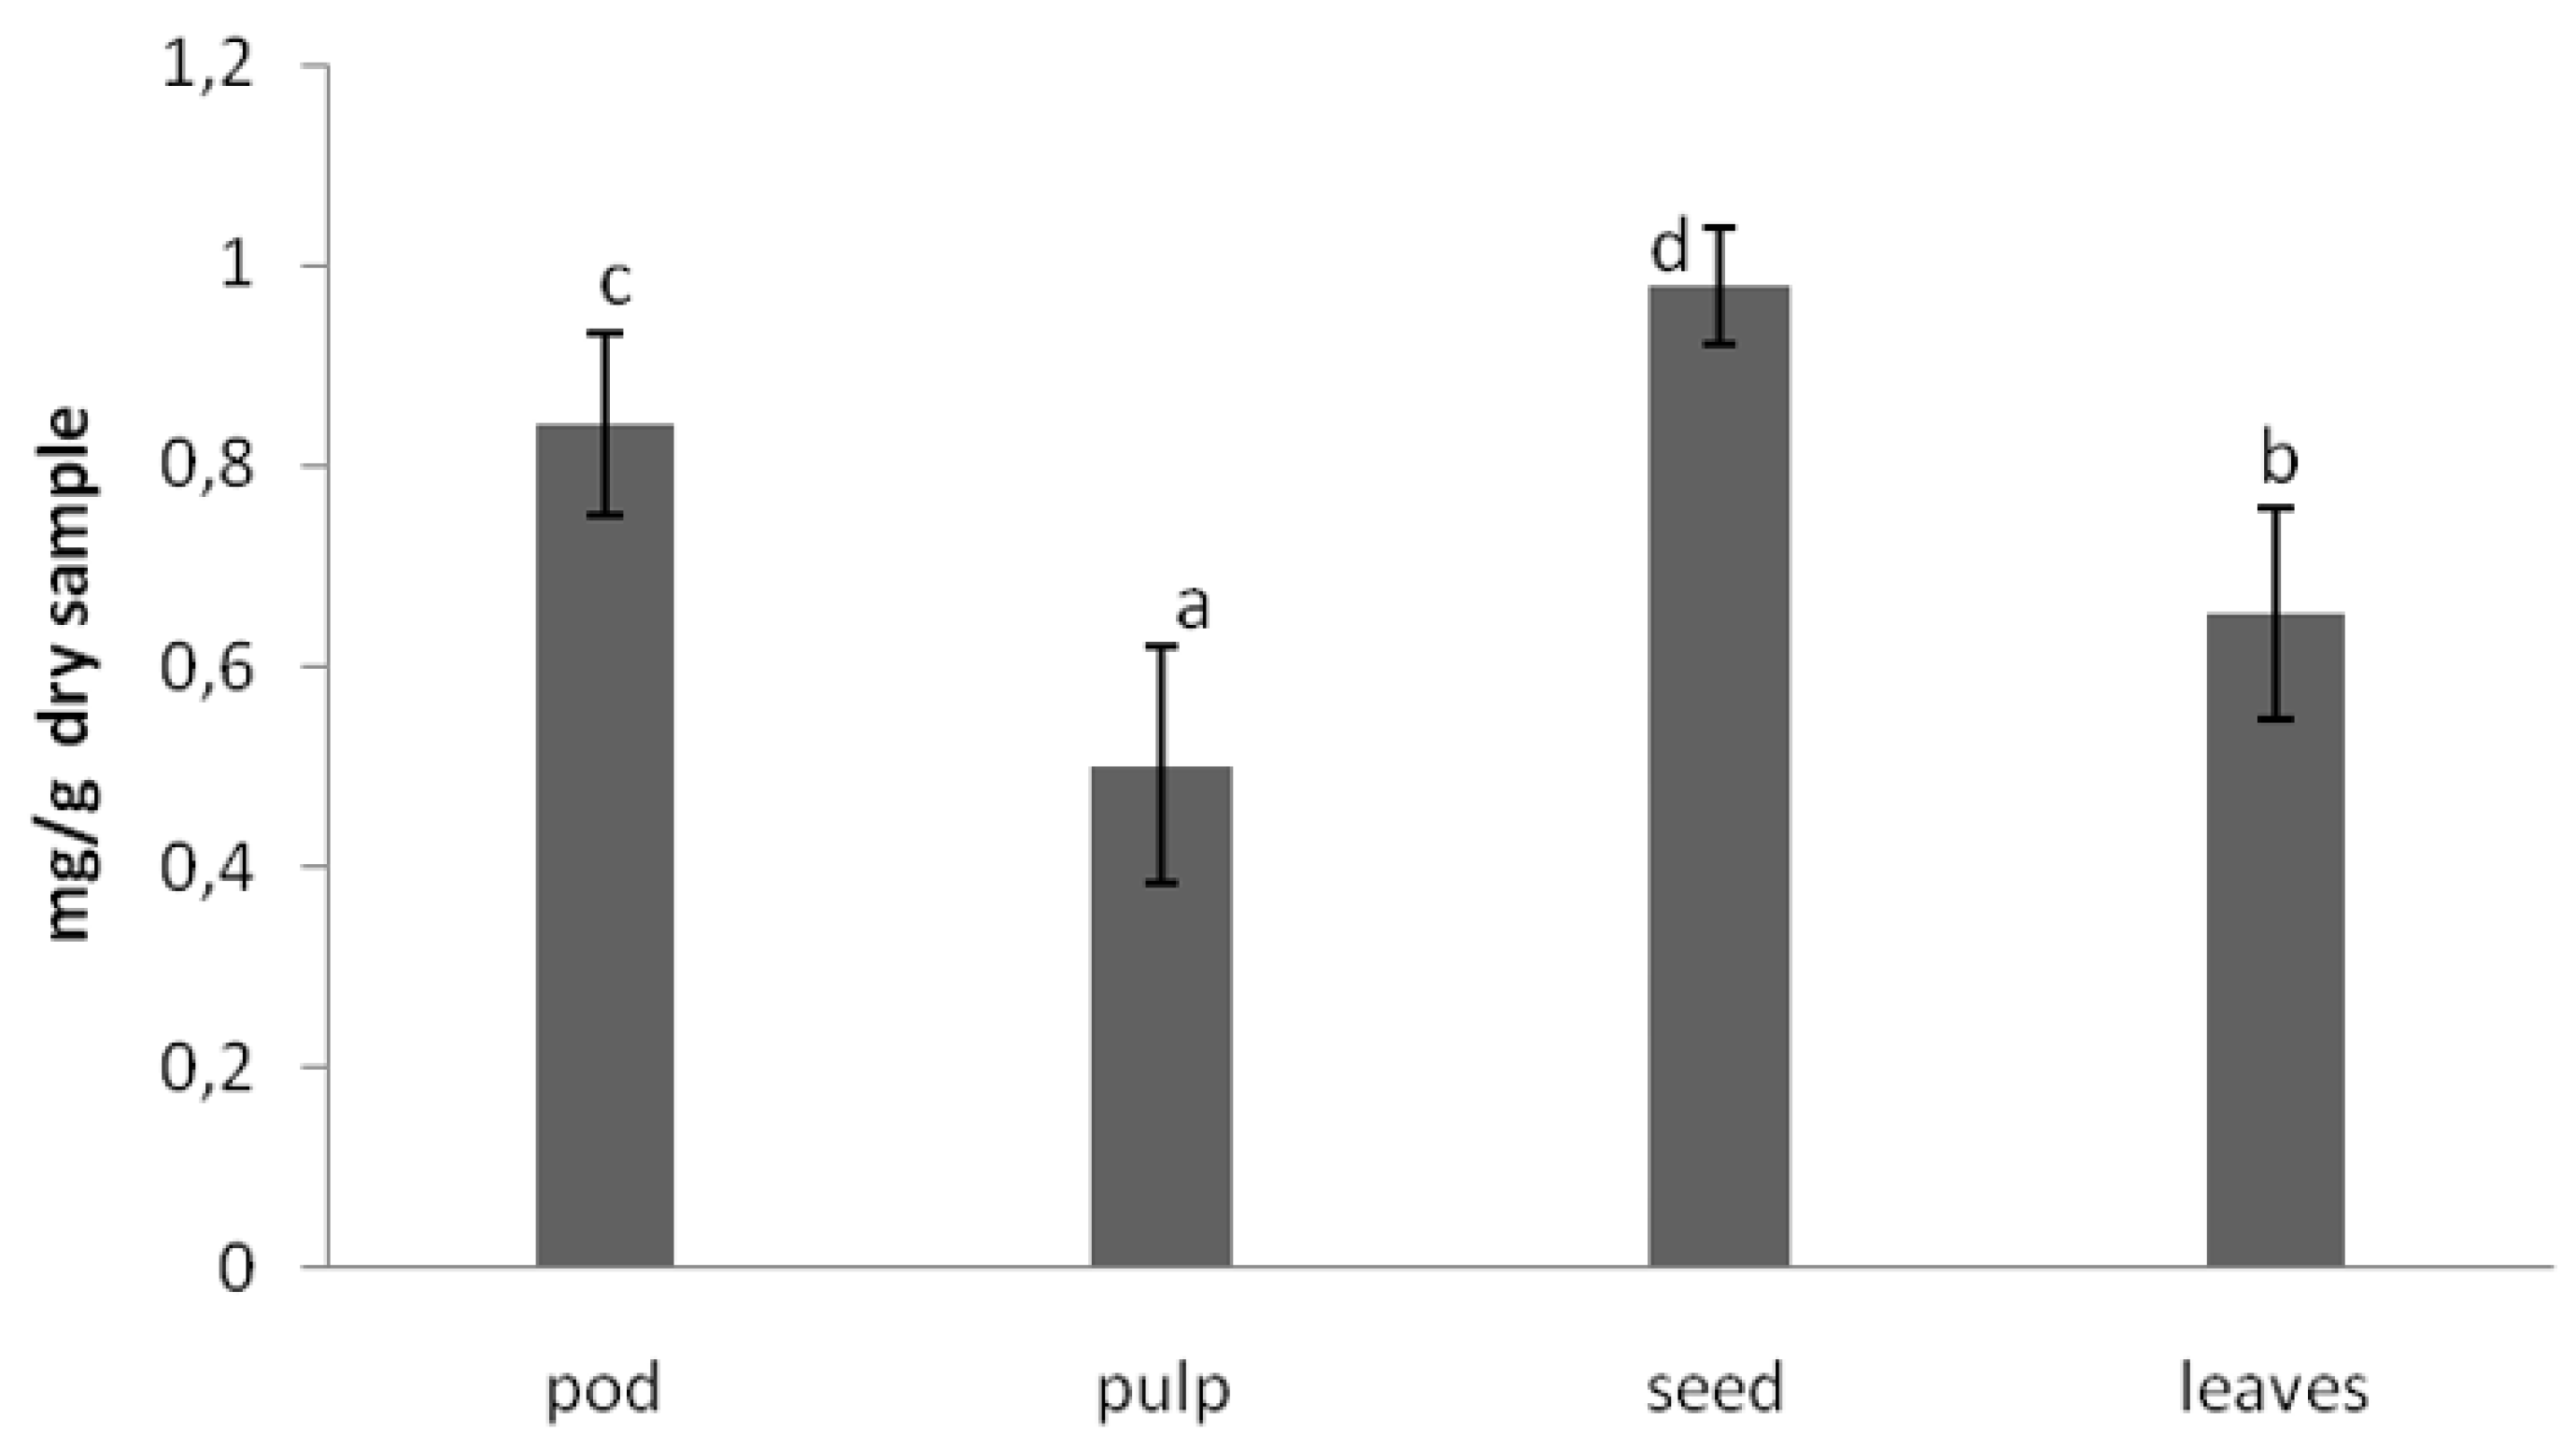
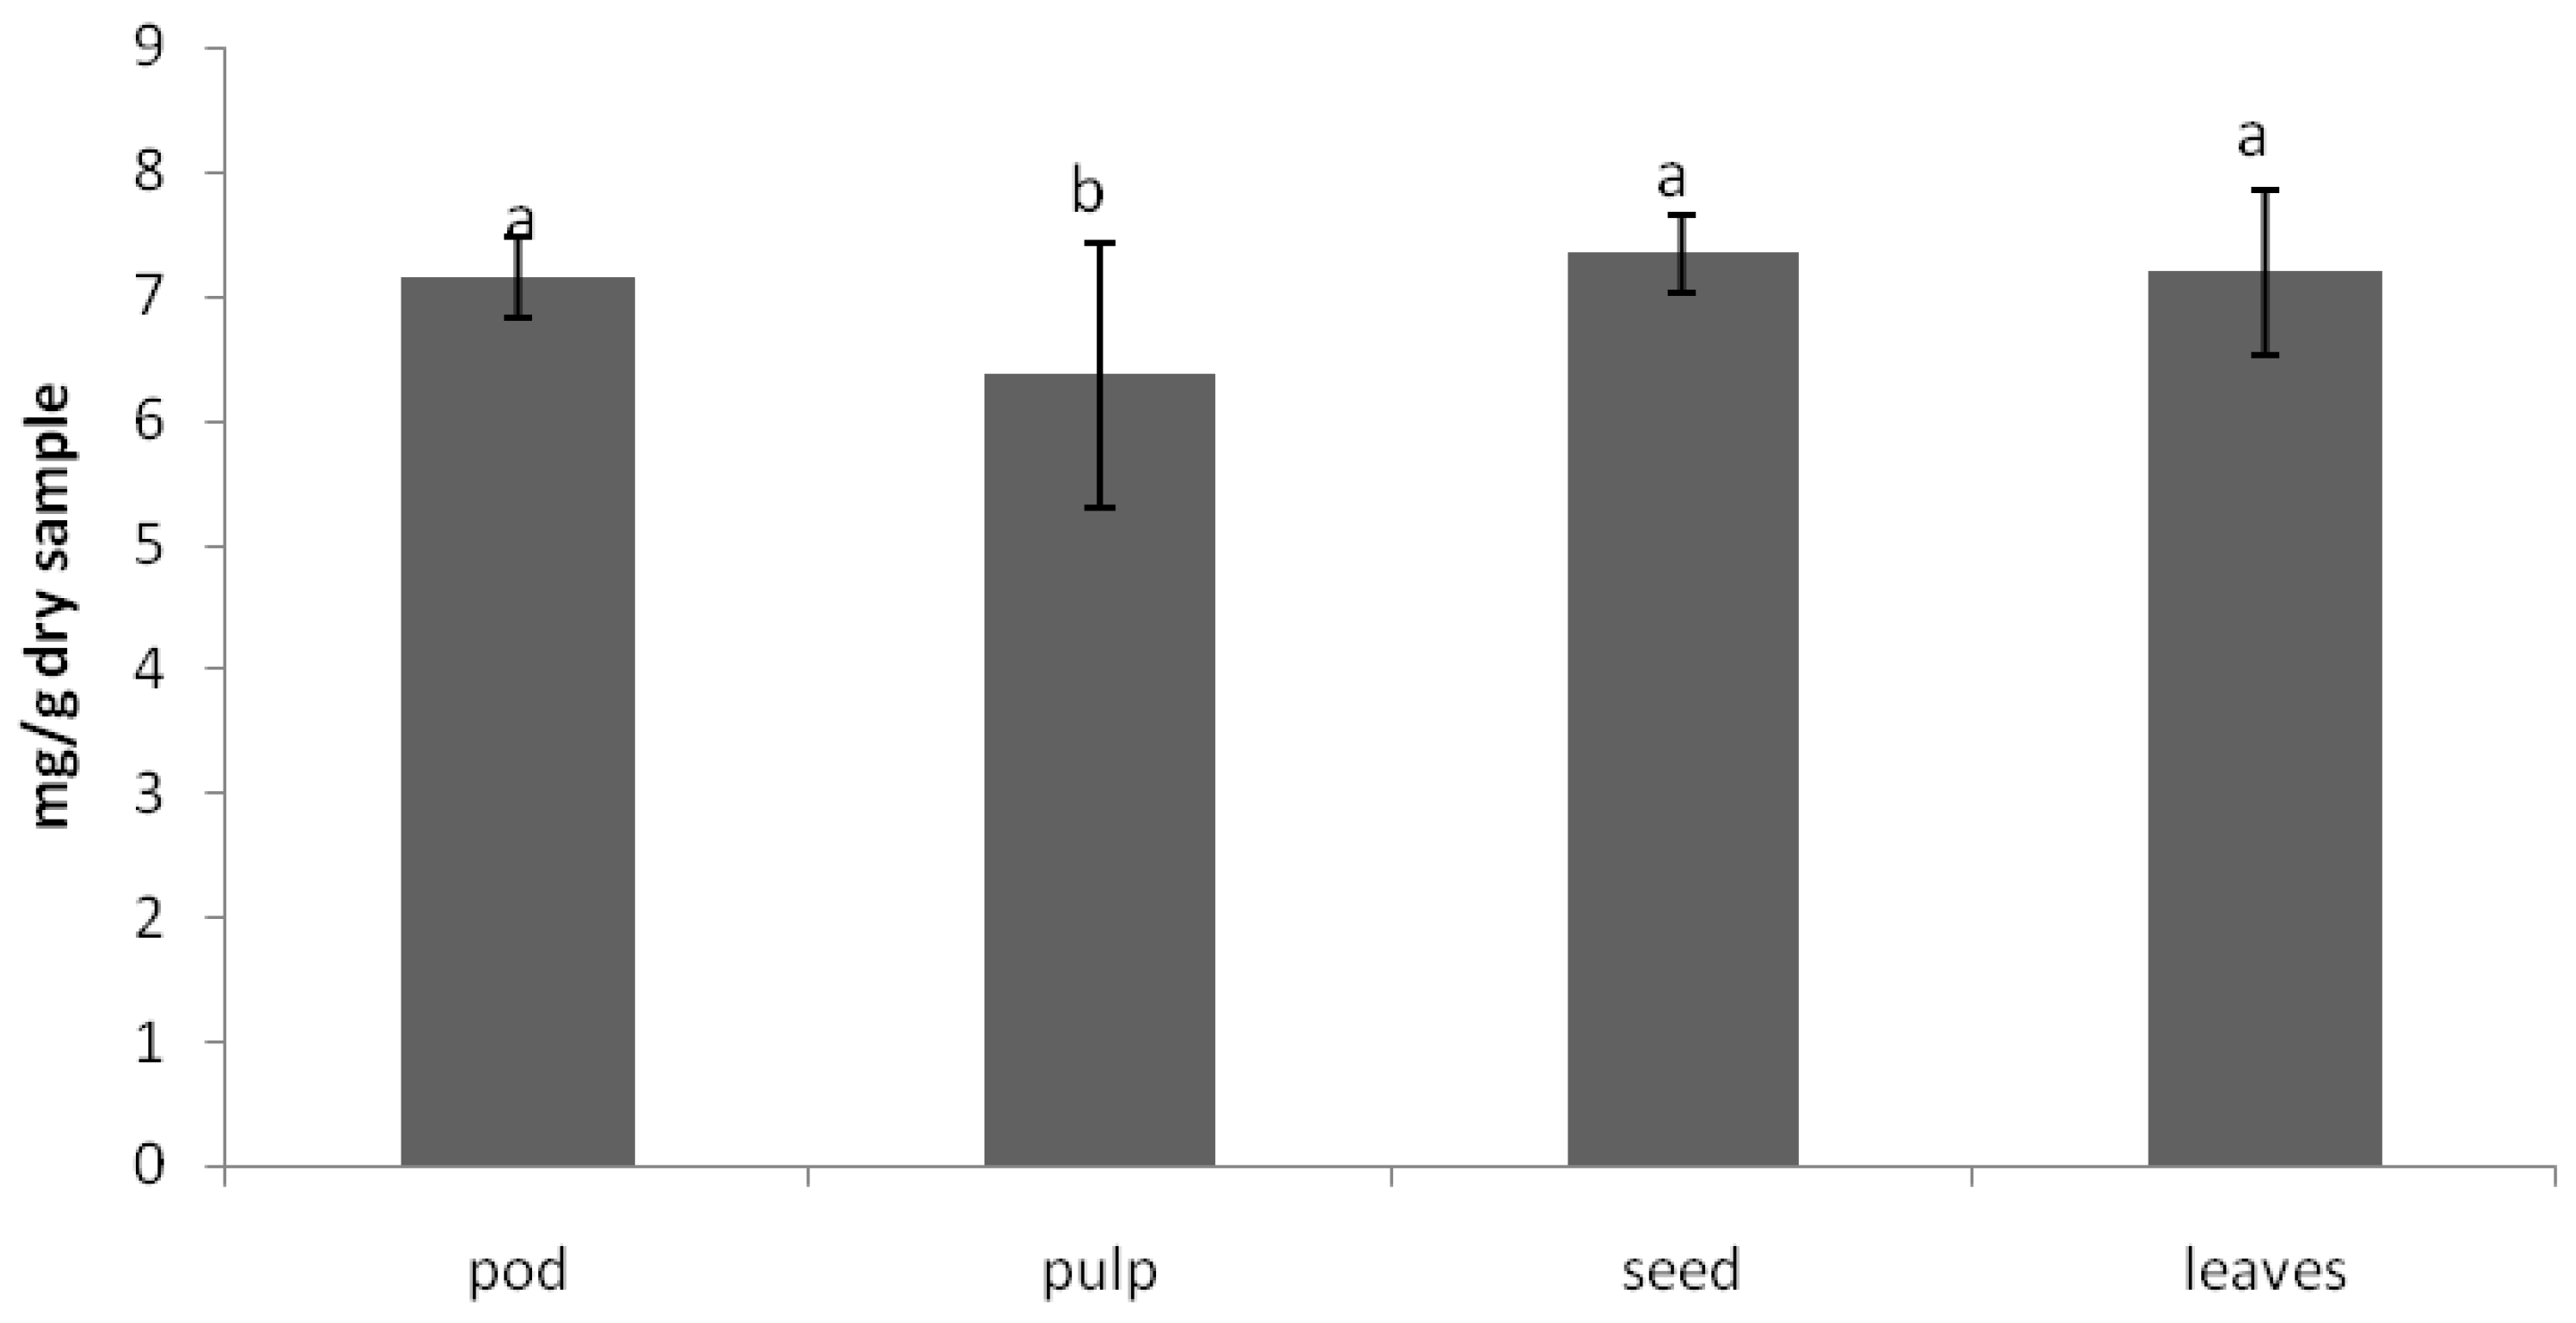
3.3. Secondary Metabolites Analysis
The anti-nutritional composition of the carob products was analyzed in terms of trypsin inhibitory factor, which measure protease inhibitors. Protease inhibitors decrease the performance of these enzymes, having as a result lower protein digestibility. The other important factor is the phytic acid content, which has strong affinity for binding ions such as calcium and zinc, avoiding its absorption in the intestine and preventing various metabolic processes from being adversely affected. The values obtained for these anti-nutritional factors [
18] in carob tree products are shown in
Figure 2 and
Figure 3, respectively.
As can be observed in
Figure 2, the trypsin inhibitory factor was lower in the pulp. The in vitro protein digestibility was also higher in the pulp. The phytic acid content was lower in the pulp than in the seeds and leaves. Leaving aside the leaves, the nutrient power of the carob tree is concentrated in the pulp. The seeds display the highest amount of the sum of anti-nutritional factors (proteins inhibitor and phytic acid).
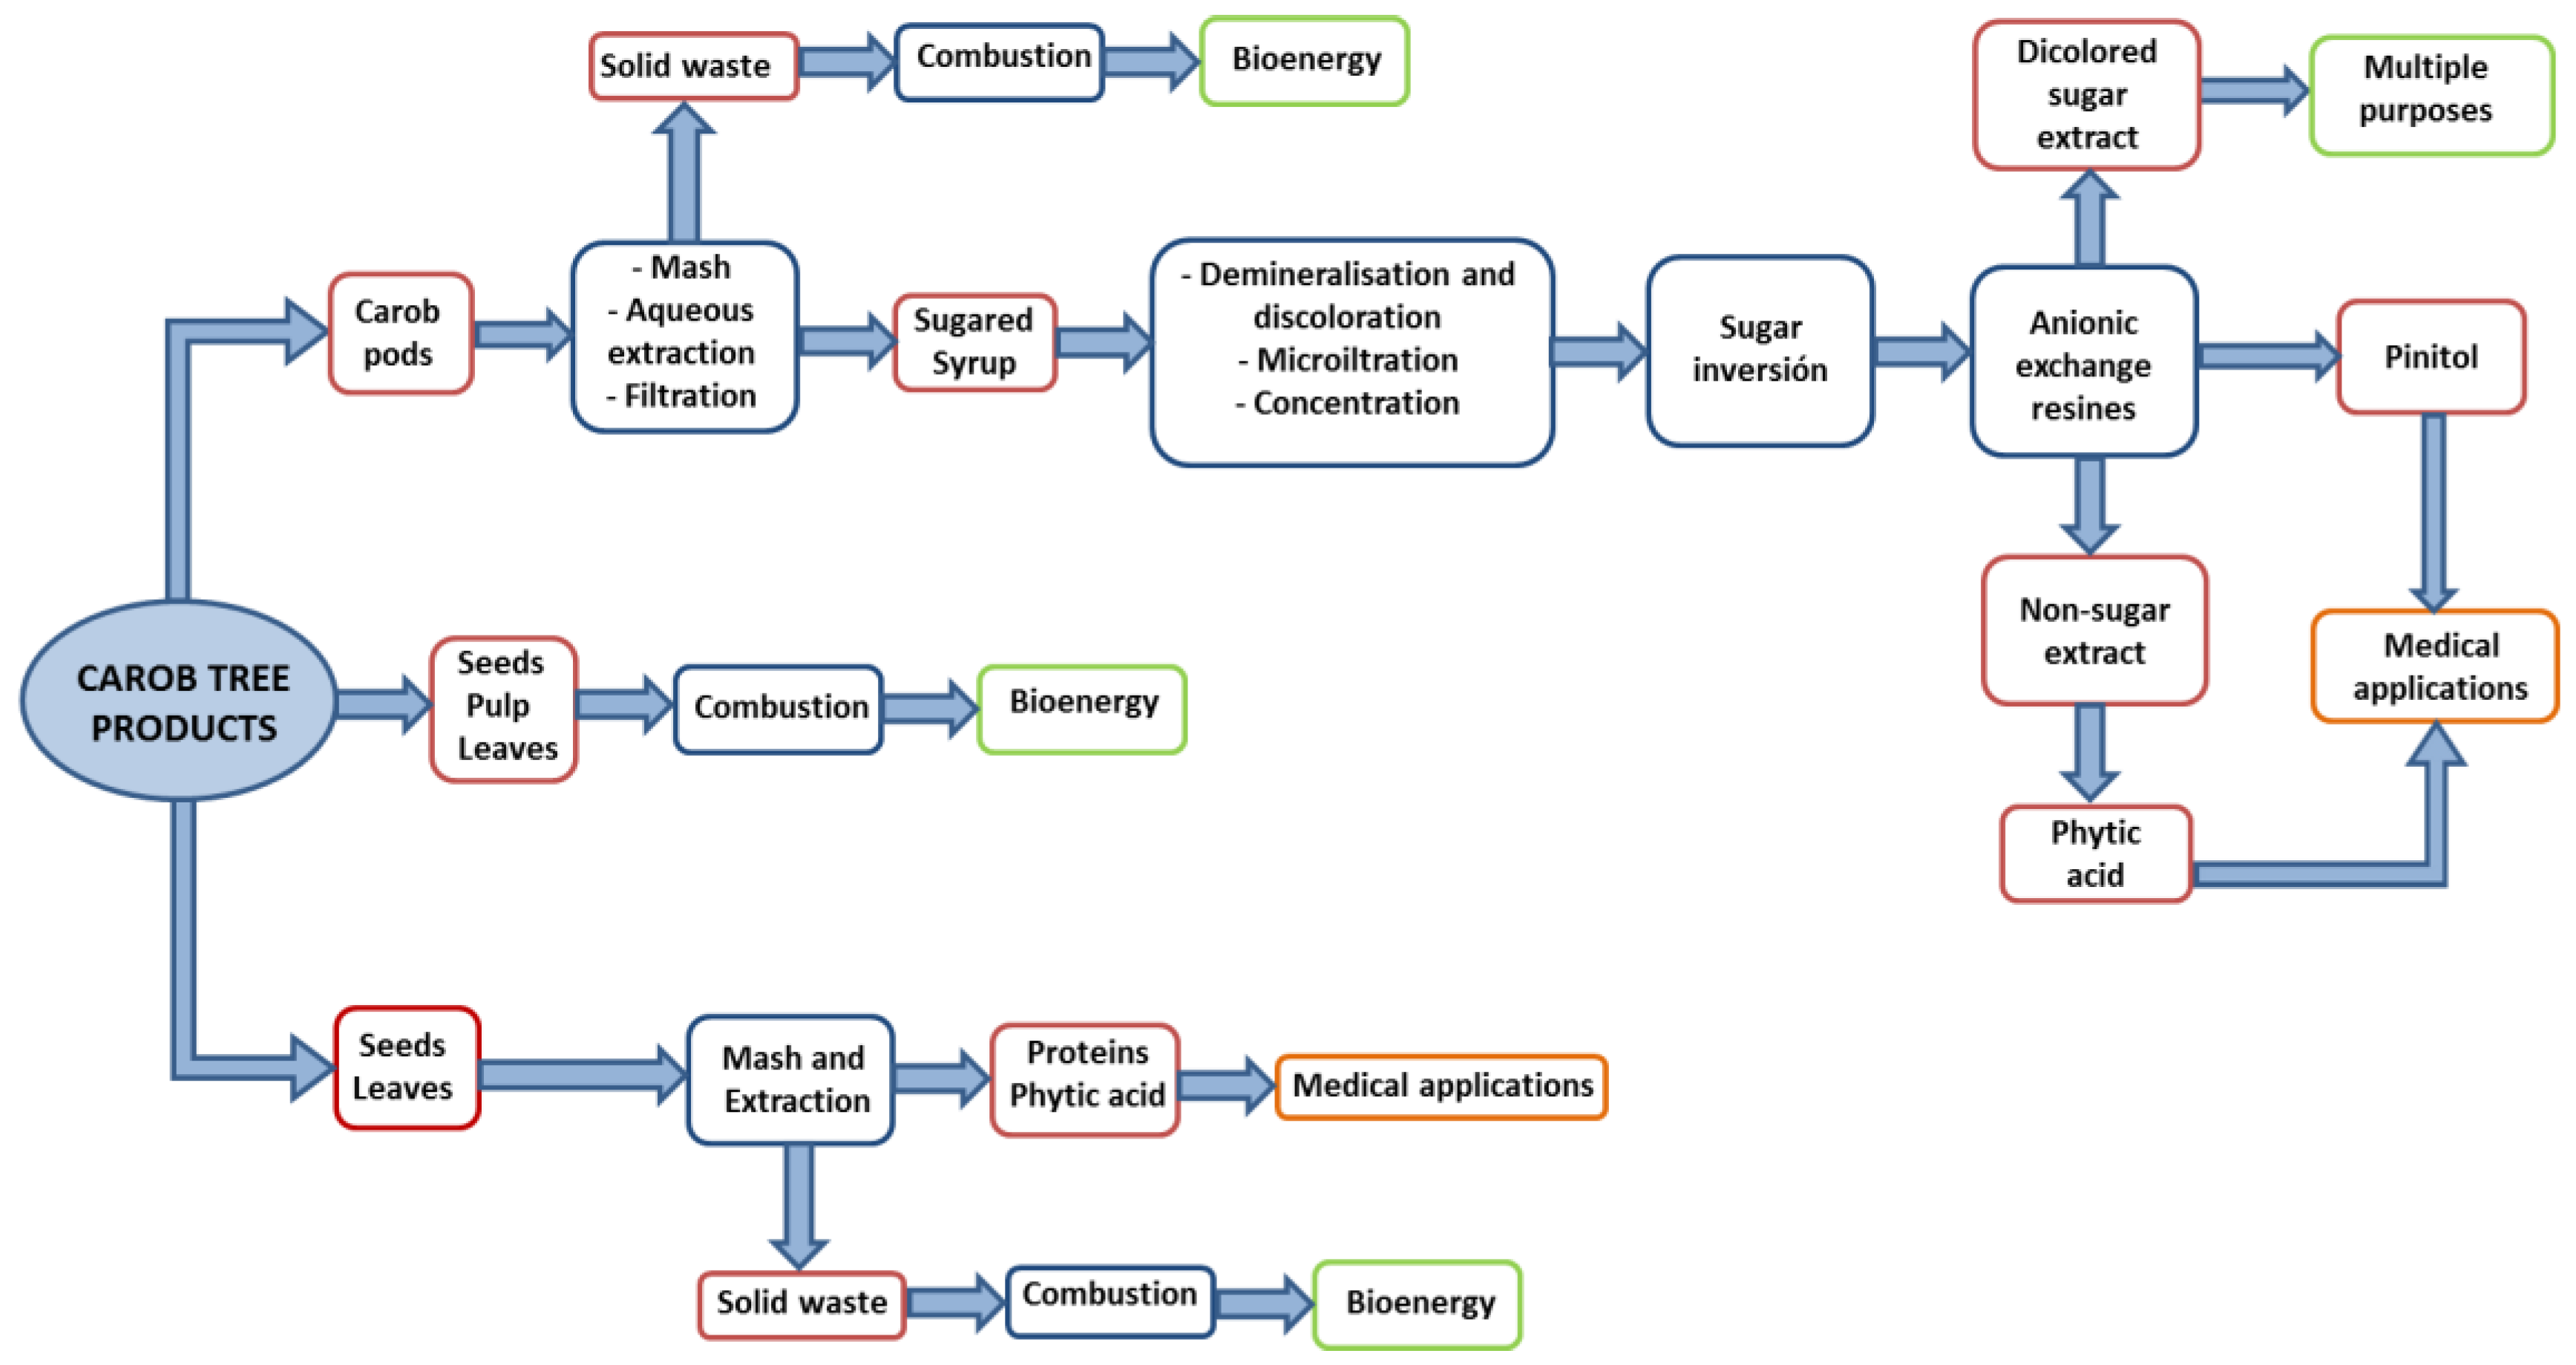
3.4. Valorization Process
Figure 4 shows an integral proposal for the full utilization of carob tree products. This approach includes proposed processes for the separation of the individual compounds analyzed before. As previously commented, the characterization of Algerian carob tree products shows a wide range of possibilities to valorize this natural material. For example, the carob pod contains low fat and high percentage of carbohydrates. These carbohydrates have many health benefits and could be used as human food product. Regarding the content of proteins, their digestibility must be taken into account to calculate the available amount of this type of nutrients. Since pods contain 4.0% protein with a digestibility rate of 24.8%, the available amount of proteins is almost 1%. For the case of the pulp, available proteins accounts for 1.05%, and 0.93% for seeds and 0.88% for leaves. The highest amount of anti-nutrients such as trypsin inhibitor and phytic acid are present in the seed and leaves and thus the pulp offers the highest nutritional power among the carob tree products. Another interesting use of the anti-nutrient found in the seeds and leaves could be in medical applications, since it has been demonstrated that they exhibit a promising potential to prevent or treat cancer, circulatory diseases and infections. Phytic acid is well known as antioxidant that can form complexes with metals and prevent colon cancer [
25]. It could also be used in the food industry, since the antioxidant (Fe
3+-chelating) properties of phytic acid make this compound a unique and versatile food preservative by, for example, inhibiting the oxidation of ascorbic acid stabilizes and by preventing the peroxidation and hydrolysis of fats and oils [
26]. Finally, the high calorific values mainly of the pod and the pulp make possible their use as biomass for bioenergy production.
Focusing on carob pods, which would include a higher number of separation steps, they would need to be firstly subject to an aqueous extraction stage. The resulting sugar extract would then be filtered and afterward it would undergo demineralization and discoloration processes through ionic and/or cationic exchange resins. The product obtained would be then micro-filtered and concentrated, and the resulting syrup would go through the process of sugar inversion (conversion of sucrose into glucose plus fructose) by enzymes or cationic exchange resins. The non-sugar fraction (phytic acid and water-soluble polyphenols), pinitol and the discolored sugary extract (glucose and fructose) would be sequentially separated through an exchange column, preferably an ionic exchange column.
Phytic acid would remain in the non-sugar fraction resulting from the first separation step, and it could be separated in the last separation column by controlling the elution time or in an additional column of different composition.
The content of polyphenols in dry pulp is 18%
w/
w. The fraction of water insoluble polyphenols could be separated by the hot extraction (75–100 °C) of the residue after the first extraction (see
Figure 4). The resulting solution would then be cooled and the precipitate obtained would have approximately a content of 90%
w/
w in polyphenols. Water soluble polyphenols are separated from phytic acid in the last separation column. Alternative separation processes could be used for the separation of pinitol, such as extraction with organic solvents, ionic liquids or supercritical fluids to simplify the overall process.
4. Conclusions
In this work, the nutrient and anti-nutrient contents of Algerian carob tree products (Ceratonia siliqua L.) (pod, pulp, seed and leaves) were analyzed. The pulp contains a high amount of carbohydrates, mainly sucrose. The protein and the phytic acid were mainly concentrated in the seeds and leaves. The low protein digestibility of the seeds and leaves is mainly due to its high content in anti-nutritional factors. Based on these results, the food application of carob pod involves the use of the pulp. The quantification of the secondary metabolites, namely trypsin inhibitory factor and phytic acid, has been reported for the first time in this study. The high content of these secondary metabolites in carob tree product could open new bio-medical applications since these compounds have been shown to have the potential for the treatment and prevention of cancer, infection and circulatory diseases. Finally, an integral approach was proposed for the full utilization of carob tree products.


