Gardener Well-Being along Social and Biophysical Landscape Gradients
by
 ,
,
Monika H. Egerer
1,* ,
,
Stacy M. Philpott
1,
Peter Bichier
1,
Shalene Jha
2,
Heidi Liere
3 and
Brenda B. Lin
4 1
Environmental Studies Department, University of California, Santa Cruz, Santa Cruz, CA 95064, USA
2
Integrative Biology Department, University of Texas at Austin, Austin, TX 78712, USA
3
Biology Department, Reed College, Portland, OR 97202, USA
4
CSIRO Land and Water Flagship, Aspendale, VIC 3195, Australia
*
Author to whom correspondence should be addressed.
Sustainability 2018, 10(1), 96; https://doi.org/10.3390/su10010096
Submission received: 13 December 2017
/
Revised: 27 December 2017
/
Accepted: 30 December 2017
/
Published: 2 January 2018
(This article belongs to the Special Issue Defining and Assessing Landscape and Urban Sustainability: Linking Spatial Patterns, Ecosystems Services, and Human Wellbeing)
Abstract
:Increasing human populations are challenging cities to grow sustainably while maintaining green spaces that deliver ecosystem services and well-being benefits. Community gardens are green spaces that provide food, community, and health benefits, but gardens often are non-permanent due to development and green space loss. Thus, investigating their significance and benefit across urban regions is critical for research and policy alike. This study investigated the role of community gardens in providing human well-being benefits across three counties in the California Central Coast—a region undergoing massive urban transformation in the last century. We measured how multiple aspects of self-reported gardener well-being varied in relation to the social opportunities of surrounding neighborhoods and the biophysical features of the landscapes in which the gardens were embedded. The results document improvements in gardener well-being through gardening across social and biophysical gradients. Gardeners are motivated by diverse reasons, varying from gardening in order to connect to nature, to gardening for improved food access, or to enhance time spent with family. Community gardens are therefore important for supporting many well-being benefits. Policies to maintain and protect gardens should prioritize neighborhoods with needs for connecting to nature and enhancing social interaction within the community.
1. Introduction
Population growth, the increased density of built infrastructure, and the reduction of vegetation cover are extending regional urbanization across landscapes [1]. The decrease of natural habitats in urban areas can result in the deterioration of human well-being due to the loss of ecosystem services, including regulating (e.g., climate regulation), provisioning (e.g., food), and cultural services (e.g., recreation), among others [2]. Urban people often live in environments with low biodiversity, food insecurity, and social alienation due to urbanization. In response, urban planners are carefully considering how to integrate green spaces so that cities can grow sustainably and to support the benefits to society provided by these spaces [3].
Increasing green space availability dually supports the biophysical functioning and sociocultural services of city landscapes to improve environmental sustainability. Green spaces can, for example, reduce surface and air temperatures [4] and thereby reduce urban heat island effects [5]. At the same time, resident exposure to the natural environment through active engagements such as gardening, for example, can reduce the stress and anxiety associated with urban life and provide mental health benefits [6,7]. Moreover, urban green spaces can provide physical health benefits through increased physical activity which can lower the risk of cardiovascular disease [8] and type 2 diabetes [9], and exposure to the outdoors that can also boost immunoregulation [10,11] and lower mortality risk [8]. Therefore, urban green spaces contribute to physical, mental, and social dimensions of human well-being [12].
The multiple benefits of green spaces should make these areas more attractive and amenable to visitation by urban residents, especially in built environments with high levels of impervious cover [13]. Moreover, they may provide an important space for individuals to obtain these benefits who lack access to private green spaces of their own [13,14]. Unfortunately, often urban residents who have little to no access to private green spaces also suffer from a deficit of public green spaces [15]. These residents may be the most disadvantaged in terms of social and economic opportunity within the population [15,16,17,18,19]. Thus, access to urban vegetation is highly influenced by socioeconomic factors [20,21], and improving green space availability and access across social advantage gradients may be the key to promoting both well-being and environmental justice in cities [22].
Community gardens are a popular green space where urban residents grow fruits, vegetables, and flowers either individually in allotments, or in collective schemes [23,24]. Gardens can increase fresh food access [25], support mental and physical health [26,27,28], and build community cohesion and social networks [29,30] through outdoor recreation. While the social benefits of community gardens are well documented through specific place-based case studies [23,31,32,33], we still lack information about how community gardens provide well-being benefits to people across urban areas and socio-environmental gradients. We know less about how these gradients influence gardeners’ use of, and experience within, community gardens, and the importance of community gardens for green space well-being benefits to users. Moreover, it is not known if time spent in gardens is a function of landscape surroundings or social opportunity. This is necessary information because there are growing concerns that, as with other green spaces, the benefits of community garden access and participation are not equitably distributed among urban residents [34,35]. Depending on social and biophysical neighborhood context, some gardens may be considered ‘vital urban spaces’ for residents if they indeed provide nearby green space to those who generally lack access [36]. Therefore, it is important for urban policy and planning to consider where and how gardens are allocated and used in city landscapes to promote the benefits associated with gardening as well as equity among communities.
The present study examines garden use and the well-being benefits derived within community gardens along social and biophysical landscape gradients. The goal of the research is to investigate how self-reported garden use and well-being benefits vary in relation to the social opportunities (e.g., in housing, education, and environmental quality) of the neighborhoods and biophysical features (e.g., urban form, and natural land cover) of the landscapes in which the gardens are embedded. Specifically, we investigate whether (1) time spent in gardens is related to neighborhood social opportunity or surrounding landscape biophysical features, and (2) there is a relationship between the derived well-being benefits from gardens and the neighborhood’s social and biophysical features across multiple study regions.
2. Materials and Methods
2.1. Study System
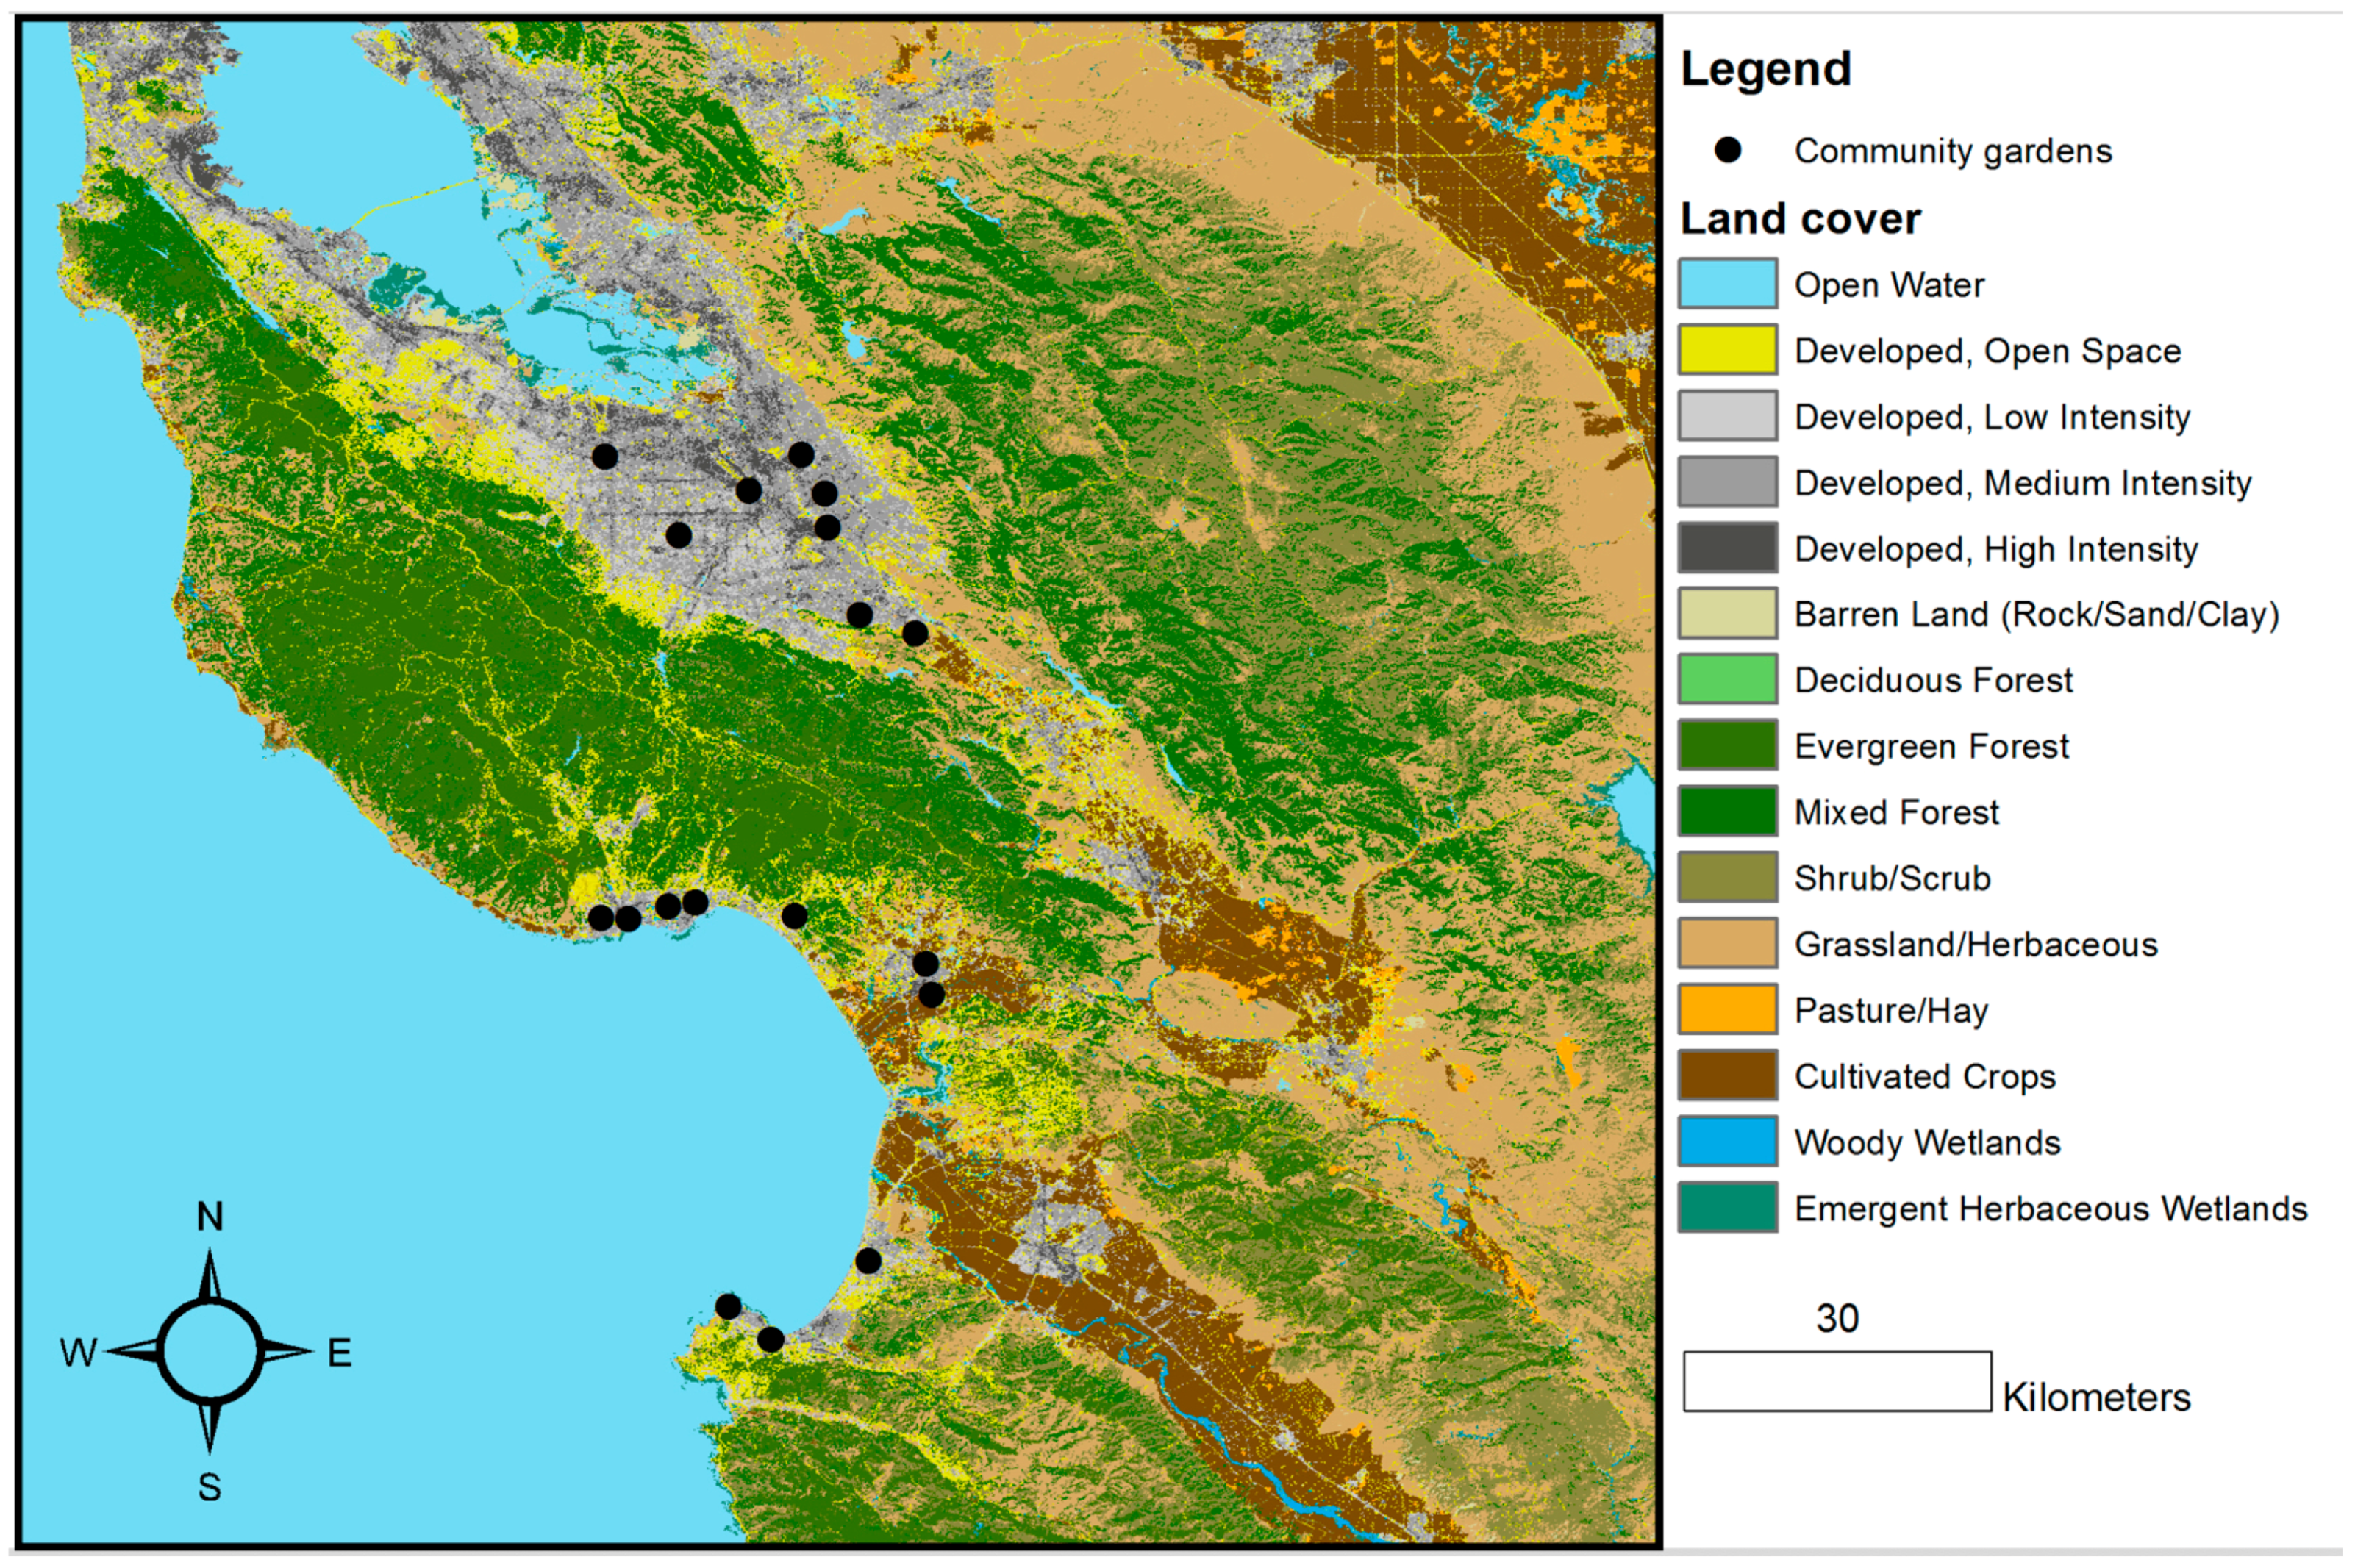
We conducted this investigation across three counties in the California Central Coast, a region of great biophysical complexity, rapid urban population growth, high levels of human diversity, and substantial levels of socioeconomic inequality [37]. The Central Coast region is increasing in density of built infrastructure to accommodate population growth but remains among the most unaffordable urban areas in the USA [38]. Community gardens are a desired green space for residents with limited access to the natural environment; however, availability can be limited due to long waitlists [39]. We worked in 18 of the region’s urban community allotment gardens during the 2017 summer growing season in the Monterey (36.2400° N, 121.3100° W), Santa Clara (37.3600° N, 121.9700° W), and Santa Cruz (37.0300° N, 122.0100° W) counties, in California, USA (Figure 1). The gardens were 405 to 8134 m2 in size, 2 to 39 years in age, separated from one another by >2 km, and were surrounded by a mix of natural, agricultural, open green space, and impervious land cover (Figure S1). The 18 gardens were selected because they were all managed in an allotment style where households cultivate individual plots within the garden and because they are relatively well supported by local organizations or by the city government.
The neighborhoods around the gardens varied in terms of biophysical features and sociodemographics due to different histories of urban development and demographic change. Santa Cruz County is a leading producer of strawberries and leafy greens. Yet, many of the workers that pick these fruits and vegetables live in food insecure neighborhoods [40]. Southern Monterey County is known for its maritime industry, US Pacific Naval forces, and tourism, which have brought cultural diversity and economic affluence, as well as socioeconomic hardship, to the region [41]. Santa Clara County has transformed over the past half century from the “Valley of Heart’s Delight”—an orchard landscape tended to by Asian and European immigrants—to “Silicon Valley”—an impervious landscape of growing socioeconomic disparity [42]. Across the region, community gardening supports thousands of urban gardeners, many of whom use gardens as an opportunity to grow organic food, be in the outdoors, and build community [39]. Here, we focused on garden use and the well-being benefits derived, as self-reported by a portion of these gardeners in a subset of the region’s gardens.
2.2. Neighborhood Biophysical and Social Opportunity Data
We used landscape biophysical data from the US Geological Survey’s National Land Cover Database (NLCD) [43]. Within 5 km buffers surrounding each garden, we calculated the percentage of land cover types by dividing the area of each type within a buffer by the total area in each buffer using spatial statistics tools in ArcGIS (v. 10.1) [44]. We created four land cover categories: (1) natural land cover (combined deciduous forest [NLCD land cover class # 41, evergreen forest # 42, mixed forest # 43, shrub/scrub # 52, and grassland/herbaceous); (2) urban land cover (combined low built development intensity # 22, medium built development intensity # 23, and high built development intensity # 24); (3) open land cover (developed open green space like parks and recreational spaces # 21); and (4) agriculture land cover (combined pasture/hay # 81, and cultivated crops # 82) (please see [45] for descriptions of land cover classes). The categories describe the main forms of land cover in the region, provide a way to analyze broad landscape-scale patterns, and also incorporate finer-scale urban landscape heterogeneity (i.e., presence of green space) [46].
We collected neighborhood socioeconomic and sociodemographic information for the census tracts surrounding gardens from the Regional Opportunity Index (ROI) [47], an index that assesses the relative well-being of people and places for census tracts in California. The ROI uses data from the American Community Survey [48] and other data sources to create “place domains” calculated from two or more indicators that describe a neighborhood’s relative assets in education, the economy, housing, human health/environment, and civic life. For this study, we used five place domains that capture the social characteristics, specifically the social opportunities, of garden neighborhoods: economic, housing, health/environment, education, and civic opportunities (Table 1).
2.3. Community Gardener Data
We used survey questionnaires in each of the gardens to collect information about garden use by gardeners and the benefits of gardening to gardeners’ well-being, including consumptive and non-consumptive benefits. To measure garden-derived well-being benefits, we used qualitative methods for well-being analyses that may offer further insight into garden-derived benefits [23,26] than numerical measures [49]. Using qualitative semi-structured questions, we asked gardeners if and how community gardening has a positive impact on their or their family’s well-being. The question format was open-ended to allow gardeners to elaborate. To measure garden use, we asked gardeners how many hours they spend per week gardening. In addition, to validate the social and spatial scale of the analysis, we asked how far away gardeners live from the garden. We surveyed between 6–14 gardeners per site, which represented between 9.5% and 65% of the gardener population in a site, the lowest estimated at 10 of 105 gardeners. The surveys were given in English (n = 142), Spanish (n = 38), Korean (n = 1), and Bosnian (n = 1), and were either read out loud by the researcher in person (n = 150) or via phone (n = 2), filled out by the gardener themselves (n = 27), or read out loud to the gardener by another gardener (n = 3).
2.4. Data Analysis
For the analysis, we first reviewed all open-ended responses for gardening well-being benefits. Guided by the gardener responses, we then selected codes that were informed by the cultural services defined by the Millennium Ecosystem Service Assessment [50] as well as peer reviewed literature on the social benefits of community gardening. The codes included food, community, family, physical health, mental health, learning and knowledge, sharing with others, and connecting to nature (Table S1). Because the survey allowed for an open-ended answer, each response could have multiple codes. All responses were able to be coded by the selected codes. Coding was performed using Dedoose qualitative software [51].
We used multivariate techniques to parse out how the variation in responses may be explained by biophysical landscape and social neighborhood features. We used a non-metric multidimensional scaling model (NMDS) to explore how gardens clustered in the relative abundance, or frequency, of coded benefits that they provide to gardeners. Here, the dependent variables were the total number of well-being codes in each category summed for all gardeners sampled from each garden. The explanatory variables were (1) the biophysical features of the landscape, and (2) the ROI social opportunity domains for each garden site. We created three distance matrices to do an ordination analysis using Bray–Curtis dissimilarity for the well-being response matrix, and Euclidian distance for the landscape and neighborhood matrices. First, we used the vegdist function and the metaMDS function with the vegan package [52] in the R computing environment [53] to calculate the Bray–Curtis distance among gardens in the frequency of their well-being responses. Second, we created two matrices, one for biophysical features and one for ROI domains of garden neighborhoods, using the envfit function in the picante package in R [53]. Well-being data were transformed, scaled, and constrained to two axes with all well-being codes for each site, and then fit with biophysical landscape features and neighborhood social opportunity domains (including all variables). This illustrated where the gardens were situated relative to the well-being benefits reported by gardeners and the biophysical and social opportunity characteristics surrounding them. To determine whether biophysical features and social opportunity were significant drivers of garden clustering, we conducted analysis of variance using distance matrices (ADONIS) tests using the adonis function in vegan [52]. We conducted separate analyses for the biophysical features that were significantly correlated (i.e., urban, natural, open). In addition, we conducted an Analysis of Similarity (ANOSIM) test using the anosim function in vegan to determine whether there were statistical differences in responses among gardens in the three counties in the region (Monterey, Santa Clara, and Santa Cruz), fitting county as a categorical predictor variable to the model.
We tabulated the average number of hours that gardeners spent in each garden. We then used generalized linear regression models (GLMs) to examine the relationships between time spent in the garden, urbanization, and ROI domains. The dependent variables were mean hours spent in gardens and the explanatory variables were percent of urban land cover and agricultural land cover at 5 km (square root transformed) and four non-correlated ROI domains (economic, housing, health/environment, and civic engagement). Because the percent of natural and open land cover correlated with urban land cover, we only included the percent of urban land cover in the model. Using a model selection approach based on Akaike’s information criterion (AICc), we identified the best model fit with a Gaussian error structure (as all explanatory variables were normally distributed) using the glmulti package and function [54] in R. If models did not differ from one another by >2 AIC points, we averaged the models and took the conditional model fit. We confirmed that residuals from the best fit models conformed to conditions of normality using Shapiro–Wilk tests. We visualized significant predictors of garden use with the visreg package [55] in R.
3. Results
A total of 182 gardeners were surveyed in the 18 gardens. Urban land cover around gardens was generally greater in San Jose County than in Monterey and Santa Cruz Counties, which were surrounded by more natural, open (e.g., urban parks and green spaces), and agricultural land cover (Table 2; Table S2). The ROI domains were quite variable across neighborhoods in the counties. Generally, natural and open land cover tended to be associated with higher health and environmental quality (neighborhood healthcare access and health of the environment) and civic life (neighborhood social and political stability) social opportunity domains. Agriculture land cover around gardens tended to be associated with better housing opportunities (neighborhood availability of affordable housing). Urban land cover and education opportunities (neighborhood provision of educational needs and education quality) were not associated with other biophysical or social opportunity gradients, respectively.
3.1. Self-Reported Well-Being
Fresh organic food was the most frequently cited contribution to gardener well-being across gardeners (58.2%), followed by mental health (36.3%), connection to nature (23.1%), family (20.9%), physical health (19.8%), hobby (17.0%), personal satisfaction (14.8%), sharing (13.7%), learning and knowledge (12.6%), community (12.1%), and culture (6.6%). The NMDS, constructed from a well-being distance matrix, revealed that well-being responses fell along the gradients in neighborhood biophysical features and social opportunity domains (Figure 2). Reported well-being benefits were neither significantly different between (ADONIS model: F = 0.84, R2 = 0.10, p = 0.61) nor within the three counties (ANOSIM model: Global R: 0.04; p = 0.349). Biophysical features and social opportunity domains were not statistically significant in the analysis of variance tests for predicting certain well-being outcomes (Table 3); however, we display how well-being benefits varied along social and biophysical landscape gradients in Figure 2 and qualitatively describe general trends.
One major axis along which well-being responses tended to vary was land cover in the surrounding landscape; however, not all types of responses varied. For example, in gardens surrounded by more natural and open (i.e., green space) land cover, gardeners more frequently cited connection to nature as a benefit to their well-being. In the words of the gardeners: “It is very peaceful and relaxing. Gets you back in touch with nature”; and “because I get to be in a magical place surrounded by birds and hawks. To be in nature just to be”. Gardeners in these landscapes also more frequently stated personal satisfaction was an important benefit. As one gardener said: “it has given me an outlet to be productive”. Another gardener further specified: “I like being outside. I make suggestions to others, I like being helpful”. Finally, these gardeners cited mental health benefits associated with nature connection and described gardening as a means to “relax, decompress, and think the day over, almost like walking through the forest—very therapeutic”. In contrast, gardeners in neighborhoods surrounded by more urban land cover in the landscape tended to cite family time and connection in the context of growing food. In the words of gardeners: “spending my time with my children and teaching them gardening”; and, “my older daughter likes to come and help. I like spending time with her and showing her how to garden”. While some gardeners in gardens surrounded by more urban land cover said that gardening is “a part of our family tradition”, others stated that “as a family we have a new found appreciation of the hard work that goes into growing our own food”.
Another major axis along which well-being responses tended to fall was social opportunity. Gardeners in neighborhoods of greater education opportunity tended to cite community benefits and sharing. For example, a gardener in one of these neighborhoods stated: “I’ve met like-minded people here and community members who I wouldn’t have met otherwise”. Another gardener further emphasized the unique social community of community gardens: “Community is the biggest thing—there’s a sense of community that you don’t find in other places”. Gardeners in neighborhoods of greater housing opportunity, but also of more agricultural land cover more frequently cited physical health benefits. For example, one gardener voiced that gardening is “good physical exercise for me, getting out in the fresh air, makes me feel happier”.
Some well-being responses were not associated with biophysical landscape features or social opportunity. In particular, the well-being benefits of food production that were frequently reported by gardeners in all sites did not vary depending on land cover surroundings or neighborhood opportunity. Moreover, many gardeners brought up cultural benefits but were not more or less likely from one type of biophysical landscape or a certain spot along social opportunity gradients. “Talking to people from different ethnicities, learning about culturally appropriate foods”, was expressed by one gardener in this group, while another shared that the garden improves their well-being because they are “surrounded by a nice place with flowers and people from my country”. Cultural benefits tended to be associated with other well-being benefits, like learning and knowledge. As said by one gardener in this group: “I don’t want to lose my habits and ways from my original land”.
3.2. Self-Reported Garden Use
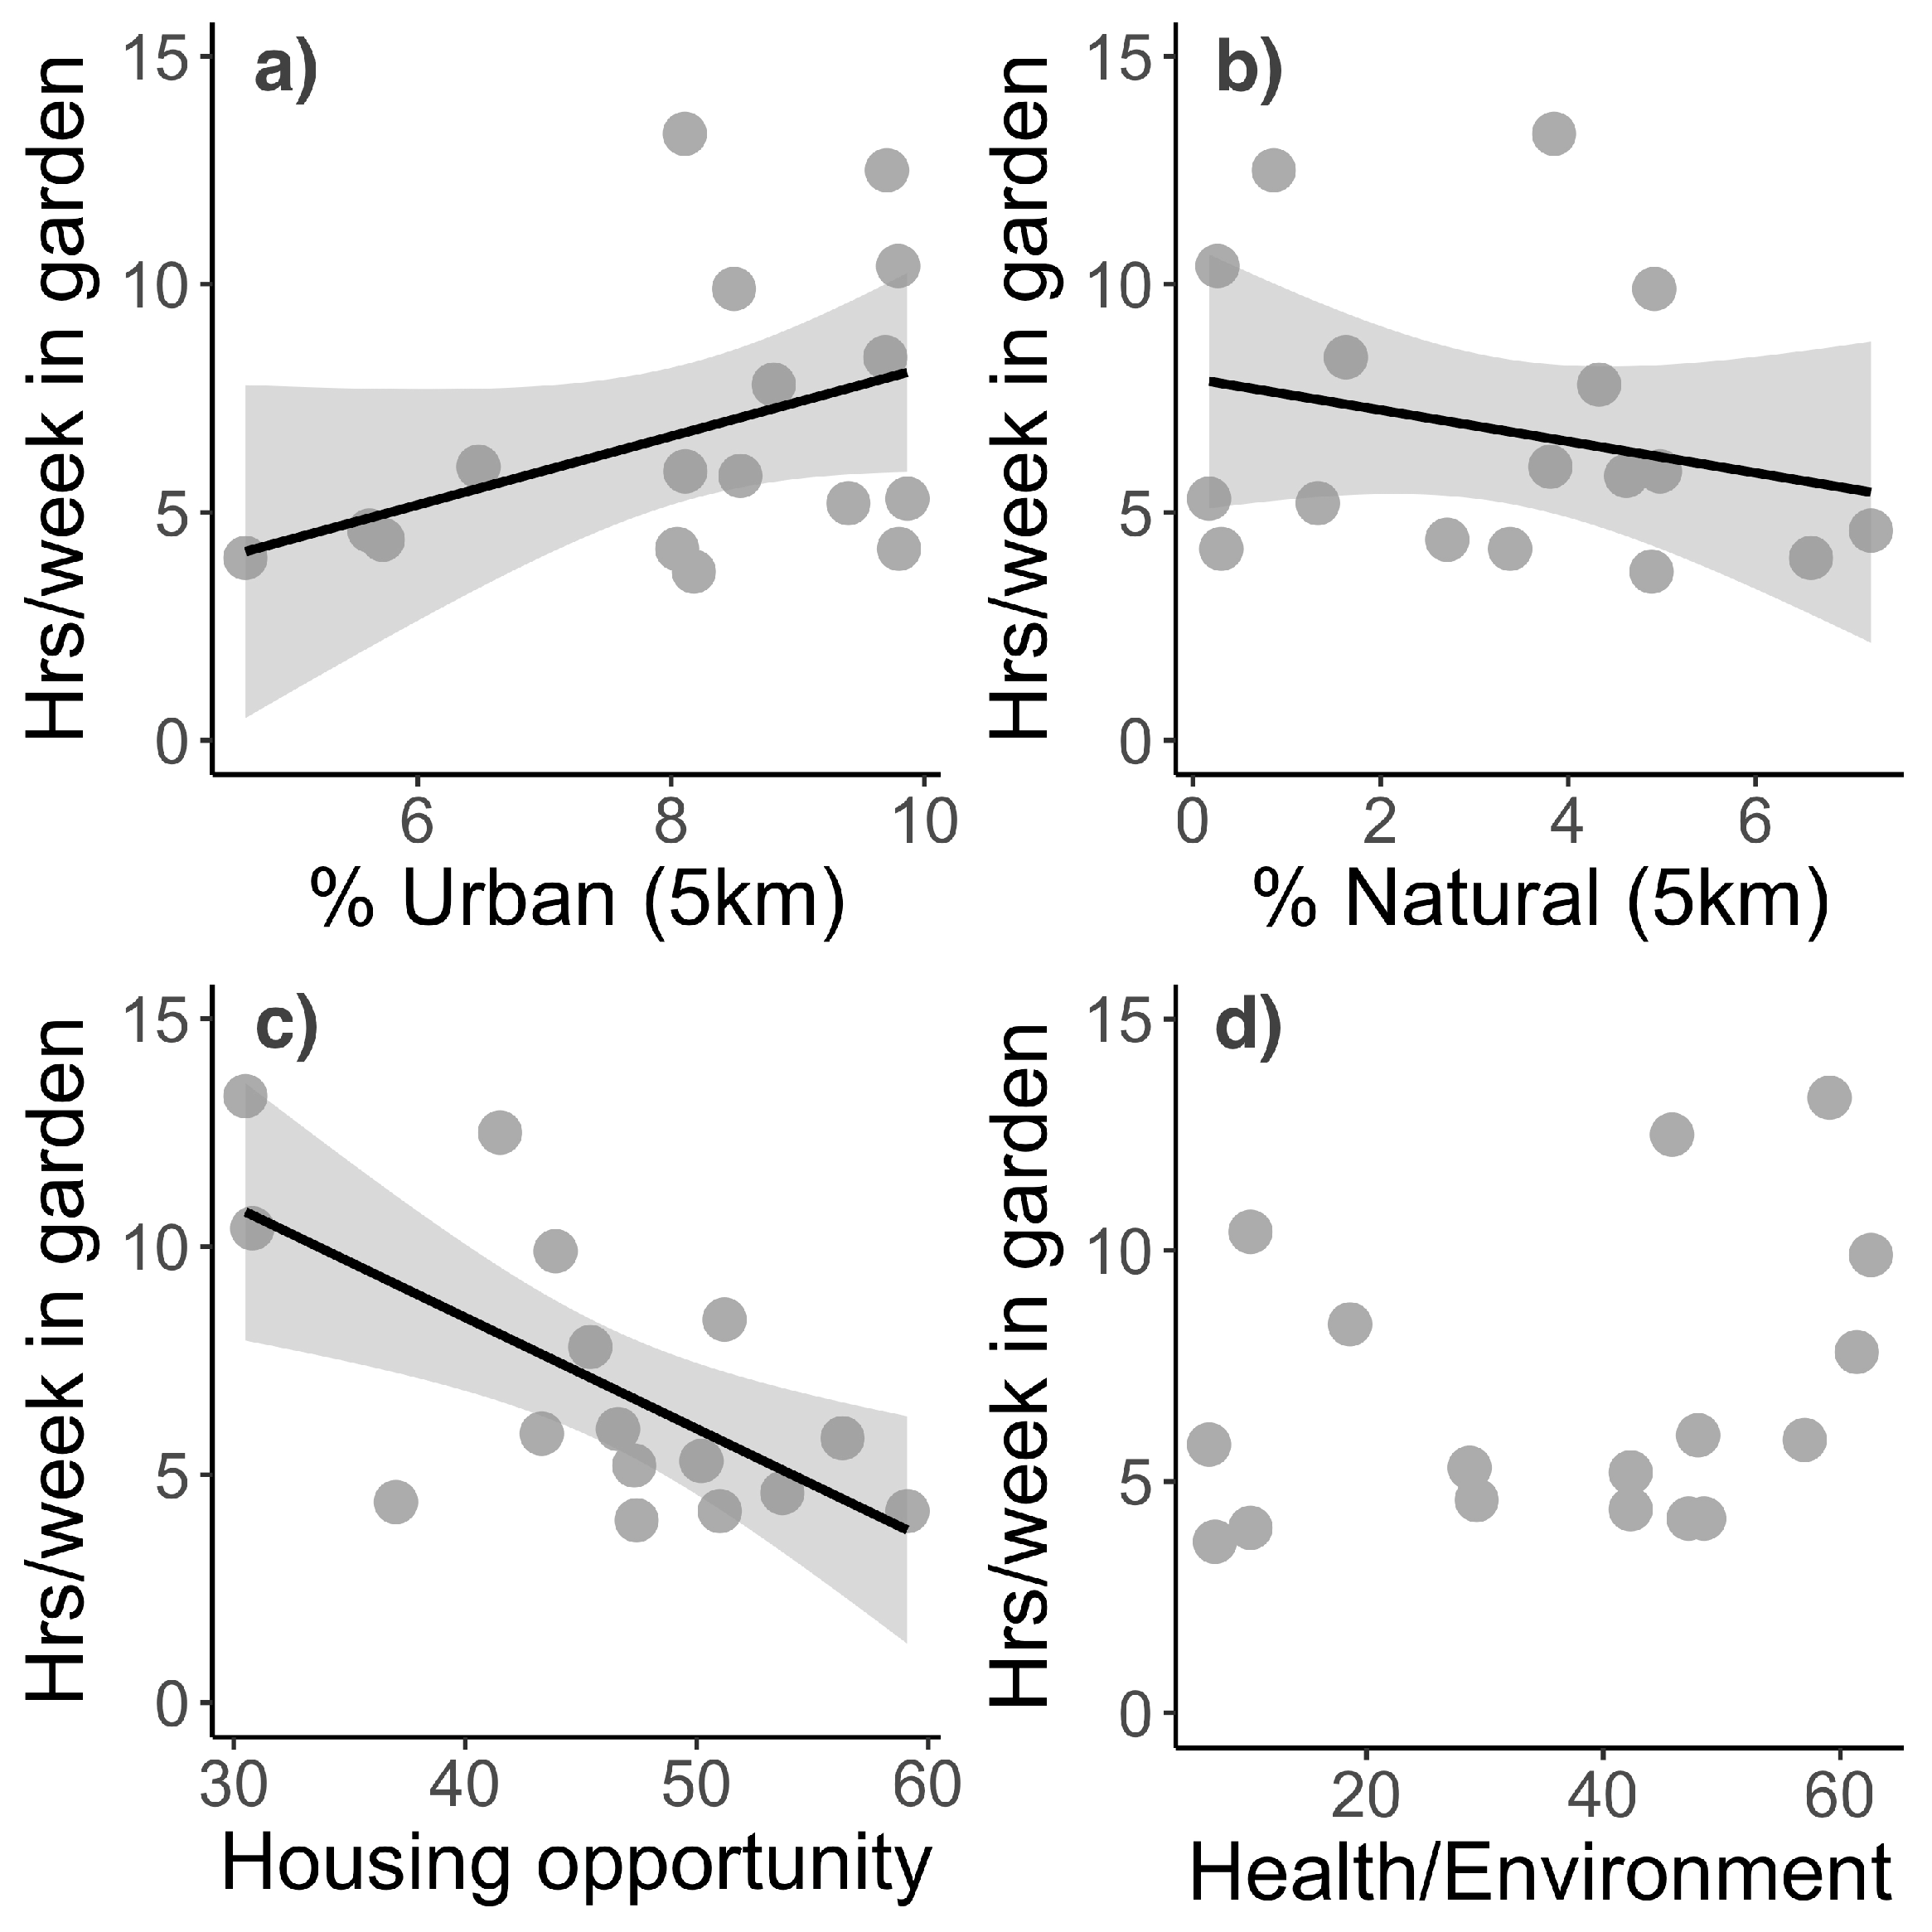
The number of hours that gardeners spent in gardens varied with biophysical landscape features and neighborhood social opportunity. The model that best predicted mean garden use included urban land cover and housing opportunity (AICc = 78.72, df = 4). Gardeners spent on average 6.8 h per week at their community gardens, but gardeners spent more time in gardens surrounded by urban land cover (Figure 3a; p = 0.07) and in neighborhoods of lower housing opportunity (Figure 3c; p = 0.004). Gardening hours generally declined in gardens surrounded by more natural land cover (Figure 3b). Yet, gardening hours did not vary in relation to the health/environmental quality of neighborhoods (Figure 3d) despite that differences in well-being benefits reported tended to fall along this axis. A majority of gardeners lived within 1.5 km (42.4%) or within 16 km (86.3%) of their community gardens, affirming the use of 5 km as a buffer in which to analyze landscape features and to use the ROI domains based on US census tract data.
4. Discussion
Our investigation into community garden use and benefits shows the importance of urban gardens in the provision of well-being benefits across a range of biophysical landscape and social contexts within the Central Coast of California. We show that urban gardens can play different roles for supporting community members’ well-being and that garden use also correlates with levels of urbanization in the surrounding landscape as well as housing and environmental availability in the surrounding region. These results support the common view that community gardens are essential urban green spaces in rapidly urbanizing landscapes. They are also important for supporting ecosystem services such as enhanced resident well-being and increased provisioning of food products (i.e., provisioning services) to gardeners [25,56], in addition to a suite of other less tangible cultural services to their users [23,28,32].
Fresh organic food production was stated as the primary benefit of urban gardening (58%) and, unsurprisingly, this was consistent across counties and gardeners as the primary activity of an urban garden. The importance of food for all gardeners in this system is clearly evidenced by food’s location in the middle of the ordination plot (Figure 2) and furthers the argument that community gardening can increase fruit and vegetable provision [25,26]. However, a number of other notable benefits were highlighted such as mental health, connection to nature, family, and physical health. Many of these benefits relate to and are being investigated within the current research on the benefits of urban green space [7,57]. Thus, gardeners do not only identify their time in the garden as a time for food production, but they report a variety of ways in which they gain additional benefits. This is evident in the multifaceted ways in which gardeners perceive well-being improvement through their survey responses. Similar to community garden literature in other regions, the responses especially illuminate how these green spaces are important for social relations by facilitating interactions among family and friends [33,58], cultural heritage values by growing culturally significant food plants [59], and educational values by providing a space to share and teach agricultural knowledge [26,60].
Although well-being benefits are not spatially confined to a county, particular types of well-being benefits tend to be situated along social advantage domains and landscape gradients. This suggests that gardens provide specific services to groups of people in relation to their urban experience, and that this in turn may be informed by the social and biophysical amenities that people experience in their neighborhoods. In our study, we show that people who are surrounded by greater urban and less natural land cover tend to spend more time in the gardens, whereas those that have more natural land cover surrounding them tend to spend less time in the gardens. This interesting finding suggests that gardeners’ use of garden space is either consciously or unconsciously mediated by the availability of landscape-level natural land cover. Moreover, because more urban areas in this region are also associated with lower social opportunities and therefore likely worse well-being, our findings suggest that gardeners in these areas may have a greater need for well-being benefits and thus use gardens more.
Based on self-identified well-being benefits and garden use behavior, we see that at one end of the spectrum there are gardeners that tend to live in more natural landscapes and choose green spaces like community gardens in which to spend their free time. Many state that they glean benefits from gardens, including personal satisfaction, mental health, and connecting with nature. Community gardening builds relations between humans and nature, develops nature appreciation, and expands environmental awareness [61]. In addition, previous studies also demonstrate that individuals with higher reported connections to nature spend more time in both private and public urban green spaces [62] and that nature orientation can affect multiple aspects of people’s green space visitation behavior [15]. Interestingly, however, we found that these gardeners actually reportedly spent less time in these gardens compared to gardens in more urban landscapes. While these gardeners may nonetheless have a higher preference for or access to natural landscapes in which to live and recreate, less reported time in gardens may be because gardeners’ time is spread across many public and private green spaces in their surroundings, rather than concentrated within gardens.
At the other end of the spectrum, there are gardeners who live in more urban areas with less access to public green spaces, natural land cover, and private green space. These neighborhoods also generally have less access to social opportunities relative to more natural landscapes, suggesting that these residents also have worse well-being to begin with. In these areas, community gardens are potentially the only access urban residents have to green space and to receiving the ecosystem services and human well-being benefits in a built landscape. It therefore makes sense that gardeners who spend more time in their community gardens also live in areas with more urban cover and less housing opportunity. This indicates that surveyed gardeners are likely more limited in access to urban green space (both public and private) because of fewer and smaller private yards or reduced open green space based on densification and housing costs. Here, gardeners living in these urban areas with relatively poor well-being may have a greater need for the well-being benefits derived from gardens, and consequently visit and spend more time in these gardens. As voiced by one gardener in a garden in a dense urban context, one key benefit to the garden is “access to land now that we live in an apartment—land that we can play and experiment with”. Shown here, gardeners in these neighborhoods indicated that they appreciate and use their gardens as a green space (i.e., for its biophysical or natural features) but also a space to connect with family and as spaces for learning and knowledge exchange. This suggests that these spaces are vital and unique for social and community relationships and thus social well-being. This finding supports conclusions that green spaces in urban situations where vegetation and common areas are sparse, are critical for mediating social contact and cohesion among residents through frequent visitation and use [36]. Thus, community gardens in more densely built landscapes with little private green space are likely to be more multifunctional in their uses and diverse in their impacts on well-being.
Gardens are important spaces for community and education. Gardens can provide safe areas for community building and cultural exchange by incorporating cultural events for socializing [63]. Moreover, these are important places to pass on and foster knowledge of ecological systems and skills such as food production to future generations [60,64]. Our research supports these findings, as some gardeners highlighted the importance of these areas for “family” interactions, tradition, and knowledge learning. Krasny and Tidball [60] place learning in community gardens as a form of civic ecology education based on intergenerational community engagement and environmental stewardship. Our results are evidence of these linkages with many gardeners stating that community and sharing are key well-being responses along the education opportunity domain gradient. This suggests that those gardeners that live in more educated neighborhoods use gardens to further develop their own and others’ education through knowledge exchange in a communal environment. These gardeners envision gardens as spaces to share ideas and grow food as a community, and may put more emphasis on—and get more benefits from—the community gardens as a collective endeavor.
In this study, we investigated the self-reported use of community gardens and well-being benefits derived by gardeners from community gardening across biophysical and social opportunity gradients, and show that gardener responses tend to vary in relation to their neighborhood biophysical and social context. Yet our analysis is limited to the scale of the gardener and to the scale of census tract data, meaning that our results may not be generalizable to all gardeners within a garden (particularly where we accessed only a small number of the garden population) or to other populations as we did not use quantitative well-being metrics. Moreover, while a majority of surveys were given orally by the research team (78%), using different techniques (e.g., other gardeners’ language assistance) to increase our sampling effort to, for example, non-English speakers may introduce a conservative sampling bias in our results. In addition, we only surveyed garden plot holders to answer how gardeners use and benefit from community gardening, yet future work could access non-gardeners in the neighborhood to explore how garden presence in an area may have spillover benefits by improving the broader community well-being of many other residents [65,66].
5. Conclusions
The greater California Central Coast region continues to grow in population, increase in the density of structures in the built environment, and is one of the most inequitable urban regions in the United States [38,67]. Urban consolidation and expansion threatens both private and public green space access for urban residents and the ecosystem services they provide [68], especially for socially disadvantaged groups who are already vulnerable to economic pressures [69,70]. Therefore, urban policies and planning need to carefully consider the benefit that green spaces such as community gardens provide to people, especially given our findings that this benefit and overall garden use may be driven by social and biophysical surroundings. Community gardens are high quality green spaces, especially in more urban areas, that provide multiple ecosystem services and have the potential to enhance human well-being across multiple aspects. Policies and planning with an eye for sustaining these benefits need to maintain the presence and longevity of community gardens in cities [71]. This is particularly evident for—but not limited to—those neighborhoods most vulnerable to green space loss where community engagement and connection to nature could be most vital.
Supplementary Materials
The following are available online at www.mdpi.com/2071-1050/10/1/96/s1. Supplementary material will be published online alongside the manuscript, including Figure S1 and Tables S1 and S2. Figure S1: Land cover matrix around community gardens, Table S1: Well-being codes and their descriptors, Table S2: Landscape features and ROI values for all 25 community gardens.
Acknowledgments
We thank the community gardeners for their time and responses, and the garden organizations that hosted our research: Aptos Community Garden, City of San Jose Parks and Recreation, City of Santa Cruz Parks and Recreation, Live Oak Green Grange Community Garden, Mesa Verde Gardens, Mid-County Senior Center, Middlebury Institute of International Studies, and Pacific Grove Community Garden. This research was made possible through field and lab assistance from Y. Byun, H. Cohen, Z. Jordan, T. Milz, C. Sanchez, and J. Tan. We thank two reviewers for providing helpful feedback on the manuscript. This work was financially supported by the National Institute of Food and Agriculture, United States Department of Agriculture [grant 2016-67019-25185 to S.M.P., S.J., H.L., and B.B.L.]; the National Science Foundation Graduate Research Fellowship Program [grant 2016-174835 to M.H.E.]; and the Environmental Studies Department at the University of California, Santa Cruz.
Author Contributions
All authors conceived of and designed the study; M.H.E., S.M.P., and P.B. performed the data collection; M.H.E. analyzed the data; M.H.E. and B.B.L. wrote the paper. All authors provided feedback on the paper.
Conflicts of Interest
The authors declare no conflict of interest. The founding sponsors had no role in the design of the study; in the collection, analyses, or interpretation of data; in the writing of the manuscript, and in the decision to publish the results. All gardeners gave their informed consent for inclusion before they participated in the study. The study was conducted in accordance with the University of California-Santa Cruz (UCSC) Office of Research Compliance Administration. The research was exempted from Institutional Review Board under #HS2569. The UCSC operates under a Federalwide Assurance approved by the DHHS Office for Human Research Protections, FWA00002797.
References
- Grimm, N.B.; Faeth, S.H.; Golubiewski, N.E.; Redman, C.L.; Wu, J.; Bai, X.; Briggs, J.M. Global change and the ecology of cities. Science 2008, 319, 756–760. [Google Scholar] [CrossRef] [PubMed]
- Stocker, T.F.; Qin, D.; Plattner, G.-K.; Alexander, L.V.; Allen, S.K.; Bindoff, N.L.; Bréon, F.-M.; Church, J.A.; Cubasch, U.; Emori, S.; et al. Technical Summary. In Climate Change 2013: The Physical Science Basis; Contribution of Working Group I to the Fifth Assessment Report of the Intergovernmental Panel on Climate Change; Cambridge University Press: Cambridge, UK, 2013; pp. 33–115. [Google Scholar] [CrossRef]
- Kleerekoper, L.; Van Esch, M.; Salcedo, T.B. How to make a city climate-proof, addressing the urban heat island effect. Resour. Conserv. Recycl. 2012, 64, 30–38. [Google Scholar] [CrossRef]
- Gill, S.E.; Handley, J.F.; Ennos, A.R.; Pauleit, S. Adapting cities for climate change: The role of the green infrastructure. Built Environ. 2007, 33, 115–133. [Google Scholar] [CrossRef]
- Alexandri, E.; Jones, P. Temperature decreases in an urban canyon due to green walls and green roofs in diverse climates. Build. Environ. 2008, 43, 480–493. [Google Scholar] [CrossRef]
- Hartig, T.; Mitchell, R.; de Vries, S.; Frumkin, H. Nature and health. Annu. Rev. Public Health 2014, 35, 207–228. [Google Scholar] [CrossRef] [PubMed]
- Lee, A.C.K.; Maheswaran, R. The health benefits of urban green spaces: A review of the evidence. J. Public Health 2011, 33, 212–222. [Google Scholar] [CrossRef] [PubMed]
- Mitchell, R.; Popham, F. Effect of exposure to natural environment on health inequalities: An observational population study. Lancet 2008, 372, 1655–1660. [Google Scholar] [CrossRef]
- Jennings, V.; Gaither, C.J. Approaching environmental health disparities and green spaces: An ecosystem services perspective. Int. J. Environ. Res. Public Health 2015, 12, 1952–1968. [Google Scholar] [CrossRef] [PubMed]
- Rook, G.A. Regulation of the immune system by biodiversity from the natural environment: An ecosystem service essential to health. Proc. Natl. Acad. Sci. USA 2013, 110, 18360–18367. [Google Scholar] [CrossRef] [PubMed]
- Hanski, I.; Von Hertzen, L.; Fyhrquist, N.; Koskinen, K.; Torppa, K.; Laatikainen, T.; Karisola, P. Environmental biodiversity, human microbiota, and allergy are interrelated. Proc. Natl. Acad. Sci. USA 2012, 109, 8334–8339. [Google Scholar] [CrossRef] [PubMed]
- World Health Organization. Wellbeing Measures in Primary Health Care/The Depcare Project: Report on a WHO Meeting, Stockholm, Sweden, 12–13 February 1998. Available online: http://www.euro.who.int/__data/assets/pdf_file/0016/130750/E60246.pdf (accessed on 30 November 2017).
- Arnberger, A.; Allex, B.; Eder, R.; Ebenberger, M.; Wanka, A.; Kolland, F.; Wallner, P.; Hutter, H.P. Elderly resident’s uses of and preferences for urban green spaces during heat periods. Urban For. Urban Green. 2017, 21, 102–115. [Google Scholar] [CrossRef]
- Mees, H.L.P.; Driessen, P.P.J.; Runhaar, H.A.C. “Cool” governance of a “hot” climate issue: Public and private responsibilities for the protection of vulnerable citizens against extreme heat. Reg. Environ. Chang. 2015, 15, 1065–1079. [Google Scholar] [CrossRef]
- Lin, B.B.; Meyers, J.; Barnett, G. Understanding the potential loss and inequities of green space distribution with urban densification. Urban For. Urban Green. 2015, 14, 952–958. [Google Scholar] [CrossRef]
- Pauleit, S.; Ennos, R.; Golding, Y. Modeling the environmental impacts of urban land use and land cover change—A study in Merseyside, UK. Landsc. Urban Plan. 2005, 71, 295–310. [Google Scholar] [CrossRef]
- Heynen, N.; Perkins, H.A.; Roy, P. The political ecology of uneven urban green space: The impact of political economy on race and ethnicity in producing environmental inquality in MIlwaukee. Urban Aff. Rev. 2006, 42, 3–25. [Google Scholar] [CrossRef]
- Wen, M.; Zhang, X.; Croft, J.B. Spatial disparities in the distribution of parks and green spaces in the USA. Annu. Behav. Med. 2013, 45, 18–27. [Google Scholar] [CrossRef] [PubMed]
- Boone, C.G.; Buckley, G.L.; Grove, J.M.; Sister, C. Parks and people: An environmental justice inquiry in Baltimore, Maryland. Ann. Am. Assoc. Geogr. 2009, 99, 767–787. [Google Scholar] [CrossRef]
- Tooke, T.R.; Klinkenberg, B.; Coops, N.C. A geographical approach to identifying vegetation-related environmental equity in Canadian cities. Environ. Plan. B Plan. Des. 2010, 37, 1040–1056. [Google Scholar] [CrossRef]
- Astell-burt, T.; Feng, X.; Mavoa, S.; Badland, H.M.; Giles-corti, B. Do low-income neighbourhoods have the least green space? A cross-sectional study of Australia’s most populous cities. BMC Public Health 2014, 14, 19–21. [Google Scholar] [CrossRef] [PubMed] [Green Version]
- Jennings, V.; Floyd, M.F.; Shanahan, D.; Coutts, C.; Sinykin, A. Emerging issues in urban ecology: Implications for research, social justice, human health, and well-being. Popul. Environ. 2017, 39, 69–86. [Google Scholar] [CrossRef]
- Kingsley, J.Y.; Townsend, M.; Henderson-Wilson, C. Cultivating health and wellbeing: Members’ perceptions of the health benefits of a Port Melbourne community garden. Leis. Stud. 2009, 28, 207–219. [Google Scholar] [CrossRef]
- Guitart, D.; Pickering, C.; Byrne, J. Past results and future directions in urban community gardens research. Urban For. Urban Green. 2012, 11, 364–373. [Google Scholar] [CrossRef]
- Alaimo, K.; Packnett, E.; Miles, R.A.; Kruger, D.J. Fruit and vegetable intake among urban community gardeners. J. Nutr. Educ. Behav. 2008, 40, 94–101. [Google Scholar] [CrossRef] [PubMed]
- Wakefield, S.; Yeudall, F.; Taron, C.; Reynolds, J.; Skinner, A. Growing urban health: Community gardening in South-East Toronto. Health Promot. Int. 2007, 22, 92–101. [Google Scholar] [CrossRef] [PubMed]
- Armstrong, D. A survey of community gardens in upstate New York: Implications for health promotion and community development. Health Place 2000, 6, 319–327. [Google Scholar] [CrossRef]
- Wood, C.J.; Pretty, J.; Griffin, M. A case—Control study of the health and well-being benefits of allotment gardening. J. Public Health 2016, 38, e336–e344. [Google Scholar] [CrossRef] [PubMed]
- Kingsley, J.Y.; Townsend, M. “Dig In” to social capital: Community gardens as mechanisms for growing urban social connectedness. Urban Policy Res. 2006, 24, 525–537. [Google Scholar] [CrossRef]
- Glover, T.D.; Parry, D.C.; Shinew, K.J. Building relationships, accessing resources: Mobilizing social capital in community garden contexts. J. Leis. Res. 2005, 37, 450–474. [Google Scholar]
- Bell, S.; Fox-Kämper, R.; Keshavarz, N.; Benson, M.; Caputo, S.; Noori, S.; Voigt, A. Urban Allotment Gardens in Europe; Routledge: London, UK, 2016. [Google Scholar]
- Beilin, R.; Hunter, A. Co-constructing the sustainable city: How indicators help us “grow” more than just food in community gardens. Local Environ. 2011, 16, 523–538. [Google Scholar] [CrossRef]
- Teig, E.; Amulya, J.; Bardwell, L.; Buchenau, M.; Marshall, J.A.; Litt, J.S. Collective efficacy in Denver, Colorado: Strengthening neighborhoods and health through community gardens. Health Place 2009, 15, 1115–1122. [Google Scholar] [CrossRef] [PubMed]
- Cohen, N.; Reynolds, K. Resource needs for a socially just and sustainable urban agriculture system: Lessons from New York City. Renew. Agric. Food Syst. 2014, 30, 103–114. [Google Scholar] [CrossRef]
- Reynolds, K.; Cohen, N. Beyond the Kale: Urban Agriculture and Social Justice Activism in New York City; University of Georgia Press: Athens, GA, USA, 2016; Volume 28. [Google Scholar]
- Sullivan, W.C.; Kuo, F.E.; DePooter, S.F. The fruit of urban nature: Vital neighborhood spaces. Environ. Behav. 2004, 36, 678–700. [Google Scholar] [CrossRef]
- McWilliams, C. California: The Great Exception; University of California Press: Berkeley, CA, USA, 1999. [Google Scholar]
- Greenberg, M.; McKay, S. No Place Like Home; University of California, Santa Cruz: Santa Cruz, CA, USA, 2017; Available online: http://noplacelikehomeucsc.org/en/ (accessed on 1 December 2017).
- Parks, Recreation & Neighborhood Services, C. of S.J. Community Garden Plots. Available online: http://www.sanjoseca.gov/index.aspx?NID=599 (accessed on 5 November 2017).
- Brown, S.; Getz, C. Farmworker food insecurity and the production of hunger in California. In Cultivating Food Justice: Race, Class, and Sustainability (Food, Health, and the Environment); Alkon, A.H., Agyeman, J., Eds.; The MIT Press: Cambridge, MA, USA, 2011; pp. 121–146. [Google Scholar]
- Norkunas, M.K. The Politics of Public Memory: Tourism, History, and Ethnicity in Monterey, California; SUNY Press: Albany, NY, USA, 1993. [Google Scholar]
- Pellow, D.N.; Park, L.S.-H. The Silicon Valley of Dreams: Environmental Injustice, Immigrant Workers, and the High-Tech Global Economy; NYU Press: New York, NY, USA, 2002; ISBN 0814768172. [Google Scholar]
- Jin, S.; Yang, L.; Danielson, P.; Homer, C.; Fry, J.; Xian, G. A comprehensive change detection method for updating the National Land Cover Database to circa 2011. Remote Sens. Environ. 2013, 132, 159–175. [Google Scholar] [CrossRef]
- Environmental Systems Research Institute. ESRI ArcGIS Desktop: Release 10; Environmental Systems Research Institute: Redlands, CA, USA, 2010. [Google Scholar]
- Homer, C.G.; Dewitz, J.A.; Yang, L.; Jin, S.; Danielson, P.; Xian, G.; Coulston, J.; Herold, N.D.; Wickham, J.D.; Megown, K. Completion of the 2011 National Land Cover Database for the conterminous United States-Representing a decade of land cover change information. Photogramm. Eng. Remote Sens. 2015, 81, 345–354. [Google Scholar] [CrossRef]
- Cadenasso, M.L.; Pickett, S.T.A.; Schwarz, K.; Cadenassol, M.L.; Pickett, S.T.A.; Schwarz, K. Spatial heterogeneity in urban ecosystems: Reconceptualizing land cover and a framework for classification. Front. Ecol. Environ. 2007, 5, 80–88. [Google Scholar] [CrossRef]
- Center for Regional Change. Regional Opportunity Index; Center for Regional Change: Davis, CA, USA, 2015. [Google Scholar]
- United States Census Bureau. American Community Survey Data; United States Census Bureau: Suitland, MD, USA, 2014. Available online: http://factfinder.census.gov (accessed on 2 January 2018).
- Power, A.; Smyth, K. Heritage, health and place: The legacies of local community-based heritage conservation on social wellbeing. Health Place 2016, 39, 160–167. [Google Scholar] [CrossRef] [PubMed] [Green Version]
- Millennium Ecosystem Assessment. Ecosystems and Human Well-Being: Synthesis; Millennium Ecosystem Assessment: Washington, DC, USA, 2005; Volume 5. [Google Scholar]
- Lieber, E.; Weisner, T.; Taylor, J. Dedoose Software; Sociocultural Research Consultants: California, CA, USA, 2011. [Google Scholar]
- Oksanen, J. Multivariate Analysis of Ecological Communities in R; Vegan Tutorial; University Oulu: Oulu, Finland, 2015; pp. 1–40. [Google Scholar] [CrossRef]
- R Team. R Development Core Team. RA Lang. Environ. Stat. Comput. 2013, 55, 275–286. [Google Scholar]
- Calcagno, V.; Mazancourt, C. De glmulti: An R Package for easy automated model selection with (generalized) linear models. J. Stat. Softw. 2010, 34, 1–29. [Google Scholar] [CrossRef]
- Breheny, P.; Burchett, W. Visualizing Regression Models Using Visreg. 2012. Available online: http://myweb.uiowa.edu/pbreheny/publications/visreg.pdf (accessed on 13 November 2017).
- Algert, S.J.; Baameur, A.; Renvall, M.J. Vegetable output and cost savings of community gardens in San Jose, California. J. Acad. Nutr. Diet. 2014, 114, 1072–1076. [Google Scholar] [CrossRef] [PubMed]
- Tzoulas, K.; Korpela, K.; Venn, S.; Yli-pelkonen, V.; Ka, A.; Niemela, J.; James, P. Promoting ecosystem and human health in urban areas using green infrastructure: A literature review. Landsc. Urban Plan. 2007, 81, 167–178. [Google Scholar] [CrossRef]
- Firth, C.; Maye, D.; Pearson, D. Developing “community” in community gardens. Local Environ. 2011, 16, 555–568. [Google Scholar] [CrossRef]
- Gichunge, C.; Kidwaro, F. Utamu wa Afrika (the sweet taste of Africa): The vegetable garden as part of resettled African refugees’ food environment. Nutr. Diet. 2014, 71, 270–275. [Google Scholar] [CrossRef]
- Krasny, M.E.; Tidball, K.G. Community gardens as contexts for science, stewardship, and civic action learning. Cities Environ. 2009, 2, 1–18. [Google Scholar] [CrossRef]
- Okvat, H.A.; Zautra, A.J. Community gardening: A parsimonious path to individual, community, and environmental resilience. Am. J. Community Psychol. 2011, 47, 374–387. [Google Scholar] [CrossRef] [PubMed]
- Lin, B.B.; Gaston, K.J.; Fuller, R.A.; Wu, D.; Bush, R.; Shanahan, D.F. How green is your garden?: Urban form and socio-demographic factors influence yard vegetation, visitation, and ecosystem service benefits. Landsc. Urban Plan. 2017, 157, 239–246. [Google Scholar] [CrossRef]
- Saldivar-Tanaka, L.; Krasny, M.E. Culturing community development, neighborhood open space, and civic agriculture: The case of Latino community gardens in New York City. Agric. Hum. Values 2004, 21, 399–412. [Google Scholar] [CrossRef]
- Baker, L.E. Tending cultural landscapes and food citizenship in Toronto’s community gardens. Geogr. Rev. 2004, 94, 305–325. [Google Scholar] [CrossRef]
- Campbell, L.; Wiesen, A. Restorative Commons: Creating Health and Well-Being through Urban Landscapes; Department of Agriculture, Forest Service, Northern Research Station: Newtown Square, PA, USA, 2011. [Google Scholar]
- Blunsdon, B.; Davern, M. Measuring wellness through interdisciplinary community development: Linking the physical, economic and social environment. J. Community Pract. 2007, 15, 217–238. [Google Scholar] [CrossRef]
- Florida, R. The New Urban Crisis: How Our Cities Are Increasing Inequality, Deepening Segregation, and Failing the Middle Class—And What We Can Do about It; Basic Books: New York, NY, USA, 2017. [Google Scholar]
- Eigenbrod, F.; Bell, V.A.; Davies, H.N.; Heinemeyer, A.; Armsworth, P.R.; Gaston, K.J. The impact of projected increases in urbanization on ecosystem services. Proc. R. Soc. B Biol. Sci. 2011. [Google Scholar] [CrossRef] [PubMed]
- Flocks, J.; Escobedo, F.; Wade, J.S.; Varela, S.; Wald, C. Environmental justice implications of urban tree cover in Miami-Dade County, Florida. Environ. Justics 2011, 4, 125–134. [Google Scholar] [CrossRef]
- Jenerette, G.D.; Harlan, S.L.; Stefanov, W.L.; Martin, C.A. Ecosystem services and urban heat riskscape moderation: Water, green spaces, and social inequality in Phoenix, USA. Ecol. Appl. 2011, 21, 2637–2651. [Google Scholar] [CrossRef] [PubMed]
- Middle, I.; Dzidic, P.; Buckley, A.; Bennett, D.; Tye, M.; Jones, R. Integrating community gardens into public parks: An innovative approach for providing ecosystem services in urban areas. Urban For. Urban Green. 2012, 13, 638–645. [Google Scholar] [CrossRef]
Figure 1.
The community gardens studied across three counties (Santa Clara, Santa Cruz, and Monterey) in the Central Coast of California.
Figure 1.
The community gardens studied across three counties (Santa Clara, Santa Cruz, and Monterey) in the Central Coast of California.

Figure 2.
A non-metric multidimensional scaling model (NMDS) plot of community gardener self-reported responses to how community gardening impacts their well-being. In pink, well-being benefit responses; in blue, overlaid biophysical features of the landscapes surrounding the gardens (% land cover within 5 km); in orange, overlaid social opportunities (ROI values) of the neighborhoods surrounding the gardens. Biophysical landscape and social opportunity vectors (the arrows) are scaled by their positive correlation to well-being responses, with prediction strength increasing with arrow length.
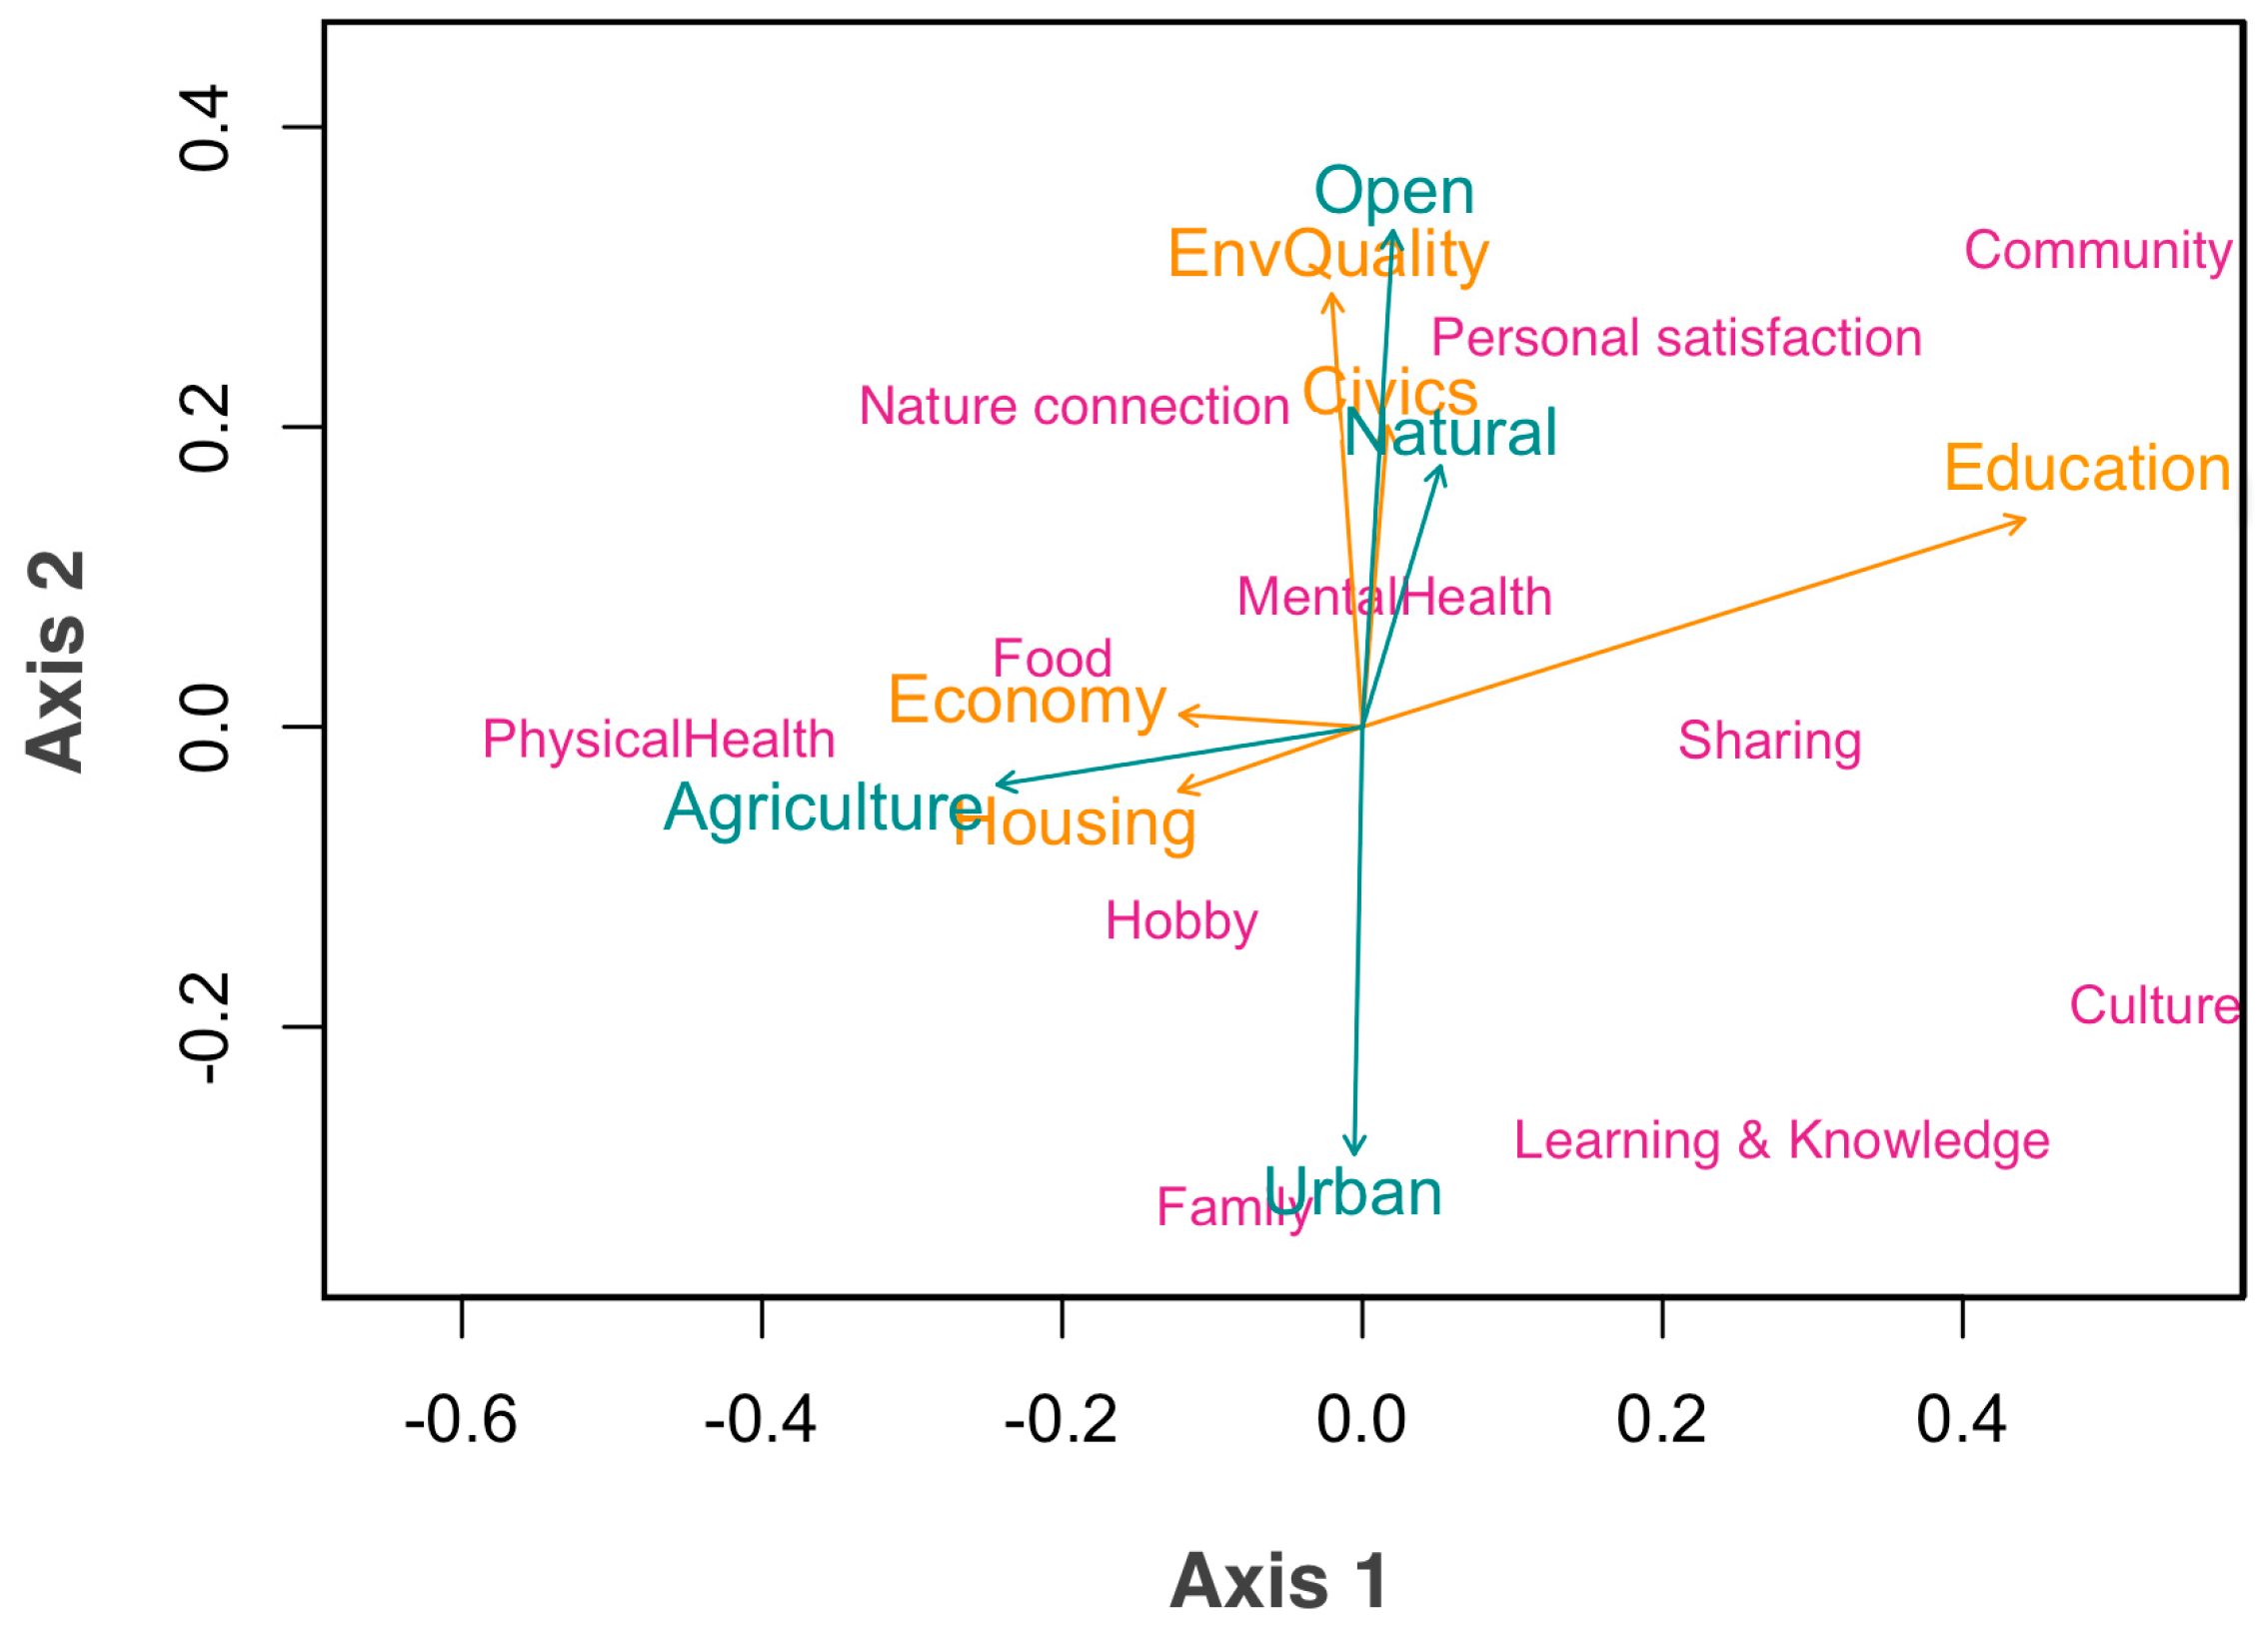
Figure 3.
Garden use measured by hours per week spent in the garden during summer (May–October) in relation to landscape biophysical features (a,b) and neighborhood social opportunity (c,d). Gray circles represent mean values for community garden sites, and black lines represent generalized linear regressions fit to the data distribution. Gray shaded areas are 95% confidence bands. Urban and natural land cover percentages were arcsin transformed to meet assumptions of normality. Greater housing opportunity indicates greater availability of sufficient and affordable housing in a neighborhood. Greater health and environment opportunity describes greater access to healthcare amenities and better health or quality of the physical environment in a neighborhood.


Table 1.
Description of the Regional Opportunity Index (ROI) used for the analysis of the social landscape, the neighborhood attributes that they assess, and the American Community Survey (ACS) data (among other data sources) used as indicators.
Table 1.
Description of the Regional Opportunity Index (ROI) used for the analysis of the social landscape, the neighborhood attributes that they assess, and the American Community Survey (ACS) data (among other data sources) used as indicators.
| Opportunity Domain | Neighborhood Assessment | ACS Indicators |
|---|---|---|
| Economy | Neighborhood job and business climate | Job Availability (#), Job Quality (%), Job Growth (%), Bank Accessibility (#), Business Growth (%) |
| Housing | Neighborhood availability of sufficient and affordable housing | Housing Adequacy (%), Housing Affordability (ratio) |
| Health/environmental quality | Neighborhood health care access and health of the environment | Prenatal Care (%), Distance to Supermarket (%), Health Care Availability (#), Air Quality (PM2.5) |
| Civic life | Neighborhood social and political stability | Neighborhood Stability (%), US Citizenship (%) |
| Education | Neighborhood provision of educational needs and education quality | High School Graduation Rate (%), UC/CSU Eligibility (%), Teacher Experience (%), High School Discipline Rate (%) |
Table 2.
Minimum, maximum, and mean with standard deviation values for the biophysical landscape features (at 5 km) and neighborhood social opportunity measured via the ROI across the community garden sites in this study. See Table S2 for all values for each community garden.
Table 2.
Minimum, maximum, and mean with standard deviation values for the biophysical landscape features (at 5 km) and neighborhood social opportunity measured via the ROI across the community garden sites in this study. See Table S2 for all values for each community garden.
| Measure | % Natural | % Open | % Urban | % Agriculture | Education | Economy | Housing | Health/Environmental Quality | Civic Life |
|---|---|---|---|---|---|---|---|---|---|
| Min | 0.0 | 5.4 | 12.0 | 0.0 | 38.3 | 10.6 | 30.5 | 6.7 | 69.7 |
| Max | 52.3 | 19.7 | 94.4 | 37.0 | 64.0 | 21.8 | 59.1 | 62.6 | 90.9 |
| Mean | 15.8 | 12.5 | 50.2 | 4.7 | 51.1 | 15.5 | 45.6 | 38.1 | 80.0 |
| SD | 15.0 | 4.6 | 32.0 | 11.3 | 7.8 | 2.7 | 7.9 | 20.2 | 6.8 |
Table 3.
Results from the analysis of variance models predicting the well-being matrix. Environmental matrices (social and biophysical) are calculated by Euclidean distance.
Table 3.
Results from the analysis of variance models predicting the well-being matrix. Environmental matrices (social and biophysical) are calculated by Euclidean distance.
| Social Opportunity | Df | Sum of Sqs | Mean Sqs | F | R2 | p |
|---|---|---|---|---|---|---|
| Education | 1 | 0.07 | 0.07 | 1.06 | 0.06 | 0.40 |
| Housing | 1 | 0.05 | 0.05 | 0.72 | 0.04 | 0.68 |
| Health/Environmental quality | 1 | 0.03 | 0.02 | 0.36 | 0.02 | 0.92 |
| Civic life | 1 | 0.09 | 0.09 | 1.33 | 0.08 | 0.26 |
| Biophysical Landscape | ||||||
| Urban | 1 | 0.08 | 0.08 | 1.23 | 0.07 | 0.27 |
| Agriculture | 1 | 0.12 | 0.12 | 1.96 | 0.11 | 0.06 |
| Open | 1 | 0.10 | 0.10 | 1.57 | 0.09 | 0.15 |
| Natural | 1 | 0.08 | 0.08 | 1.20 | 0.07 | 0.33 |
© 2018 by the authors. Licensee MDPI, Basel, Switzerland. This article is an open access article distributed under the terms and conditions of the Creative Commons Attribution (CC BY) license (http://creativecommons.org/licenses/by/4.0/).
Share and Cite
MDPI and ACS Style
Egerer, M.H.; Philpott, S.M.; Bichier, P.; Jha, S.; Liere, H.; Lin, B.B. Gardener Well-Being along Social and Biophysical Landscape Gradients. Sustainability 2018, 10, 96. https://doi.org/10.3390/su10010096
AMA Style
Egerer MH, Philpott SM, Bichier P, Jha S, Liere H, Lin BB. Gardener Well-Being along Social and Biophysical Landscape Gradients. Sustainability. 2018; 10(1):96. https://doi.org/10.3390/su10010096
Chicago/Turabian StyleEgerer, Monika H., Stacy M. Philpott, Peter Bichier, Shalene Jha, Heidi Liere, and Brenda B. Lin. 2018. "Gardener Well-Being along Social and Biophysical Landscape Gradients" Sustainability 10, no. 1: 96. https://doi.org/10.3390/su10010096
Note that from the first issue of 2016, this journal uses article numbers instead of page numbers. See further details here.