Article

A Needs-Driven, Multi-Objective Approach to Allocate Urban Ecosystem Services from 10,000 Trees

1
Oak Ridge Institute for Science and Education (ORISE) Research Participant, US Environmental Protection Agency, 109 T.W. Alexander Drive, Research Triangle Park, NC 27711, USA
2
Association of Schools of Public Health (ASPH) Environmental Fellow, US Environmental Protection Agency, 109 T.W. Alexander Drive, Research Triangle Park, NC 27711, USA
3
Student Services Contractor, US Environmental Protection Agency, 109 T.W. Alexander Drive, Research Triangle Park, NC 27711, USA
4
Office of Research and Development, US Environmental Protection Agency, 109 T.W. Alexander Drive, Research Triangle Park, NC 27711, USA
*
Author to whom correspondence should be addressed.
Sustainability 2018, 10(12), 4488; https://doi.org/10.3390/su10124488
Submission received: 2 November 2018 / Revised: 20 November 2018 / Accepted: 25 November 2018 / Published: 29 November 2018
(This article belongs to the Collection Sustainable Built Environment)

Abstract

:
Urban areas face challenges including vehicular emissions, stormwater runoff, and sedentary lifestyles. Communities recognize the value of trees in mitigating these challenges by absorbing pollution and enhancing walkability. However, siting trees to optimize multiple benefits requires a systems approach that may cross sectors of management and expertise. We present a spatially-explicit method to optimize tree planting in Durham, NC, a rapidly growing urban area with an aging tree stock. Using GIS data and a ranking approach, we explored where Durham could augment its current stock of willow oaks through its plans to install 10,000 mid-sized deciduous trees. Data included high-resolution landcover metrics developed by the U.S. Environmental Protection Agency (EPA), demographics from the U.S. Census, an attributed roads dataset licensed to the EPA, and sidewalk information from the City of Durham. Census block groups (CBGs) were ranked for tree planting according to single and multiple objectives including stormwater reduction, emissions buffering, walkability, and protection of vulnerable populations. Prioritizing tree planting based on single objectives led to four sets of locations with limited geographic overlap. Prioritizing tree planting based on multiple objectives tended to favor historically disadvantaged CBGs. The four-objective strategy met the largest proportion of estimated regional need. Based on this analysis, the City of Durham has implemented a seven-year plan to plant 10,000 trees in priority neighborhoods. This analysis also found that any strategy which included the protection of vulnerable populations generated more benefits than others.

1. Introduction

Since the publication of the Millennium Ecosystem Assessment [1], the concept of ecosystem services has increasingly been incorporated in land management and land use planning [2]. Not only can the value of ecosystem outputs be estimated, but features of ecosystems can often be expanded or managed to substitute for built infrastructure that would otherwise be required [3,4]. Communities are becoming aware that vegetation-based “green” infrastructure provides environmental benefits, such as cleaner air and water, and can do so at substantial cost savings when compared with traditional “gray” infrastructure and technology approaches [4,5].
In today’s resource-constrained environment, communities are challenged to design solutions that contribute to multiple objectives while achieving their principal goals. In addition to budgetary limitations, the urban setting often lacks adequate space [6] to allocate to natural, managed or simulated ecological features for the services that they produce. Therefore, a greater return on investment may be facilitated by placing urban green infrastructure in areas of the greatest local need, where need is determined by both the mitigation of environmental hazards and the provision of services to vulnerable and underserved populations. The effectiveness of generating services where need exists can then be assessed using both single- and multiple-objective designs.
In contrast to conventional infrastructure and technologies, multiple benefits can be generated by a single green infrastructure installation. Curbside trees may be planted to provide the primary benefit of shade for pedestrians, but also produce myriad positive externalities, or co-benefits. These include flood hazard mitigation due to stormwater absorption, respiratory health improvements from the filtration of air pollutants, and mental health improvements through increased opportunity to engage with nature [5,7]. The ecosystem services framework is inherently interdisciplinary; urban ecosystems can provide multiple environmental as well as social services [8]. However, it is difficult to aggregate and evaluate trade-offs among multiple, disparate services to estimate benefits. We developed a screening-level methodology to quantify a proposed action (urban tree planting) in terms of multiple community needs. We then applied this methodology to a specific community (Durham, NC, USA), providing a multi-year, high-resolution management plan for maximizing benefits from the proposed action.

1.1. Approach

Green infrastructure is often deployed based on its ability to provide ecosystem services; however, the potential beneficiaries of those services must be explicitly considered. For example, if a tree casts a shadow but no one walks beneath it, can it be said to have generated a shading ecosystem service? Given the competition for resources and space in urban settings, strategic investments in green infrastructure require not only accounting for the multiple services potentially generated, but also the intensity of need where those services could be provided.
Our method is based on the supposition of a fixed quantity of potential ecosystem services provision (here represented by a pre-determined number of trees), where the actualization of their benefits (and thus their value) is solely a function of where they are located. For each of four potential benefits, we developed a metric of intensity of need by areal unit. The unit we used is the census block group (CBG); these are later aggregated to neighborhoods for better recognition by Durham city officials. However, any appropriate unit (block, catchment, etc.) may be used. For each metric reflecting intensity of need for a benefit, we ranked CBGs for sequentially ordered planting; the scores for each CBG were retained for calculating benefits provision in the evaluation stage. A glossary of abbreviations used in this paper is included as an Appendix A.
To evaluate the relative benefits provided by each planting scenario, we developed a metric of “fractional benefits provision” (FBP) which relates the benefits provided by a tree planting scenario to the maximum potential benefits which could be provided if tree planting resources were unlimited. That is, we estimate benefits provision under the City’s pre-condition of limited resources (i.e., 10,000 trees) in relation to the maximum potential benefit for the study area. Multiple planting strategies targeted ecosystem services either singly or in combinations. We hypothesized that (1) there is significant geographic variability in the intensity of need for different ecosystem services; (2) planting strategies developed to maximize the provision of a single benefit will fail to maximize the provision of co-benefits; and (3) multi-objective designs that consider several benefits simultaneously will generate greater total benefits than single-objective designs.

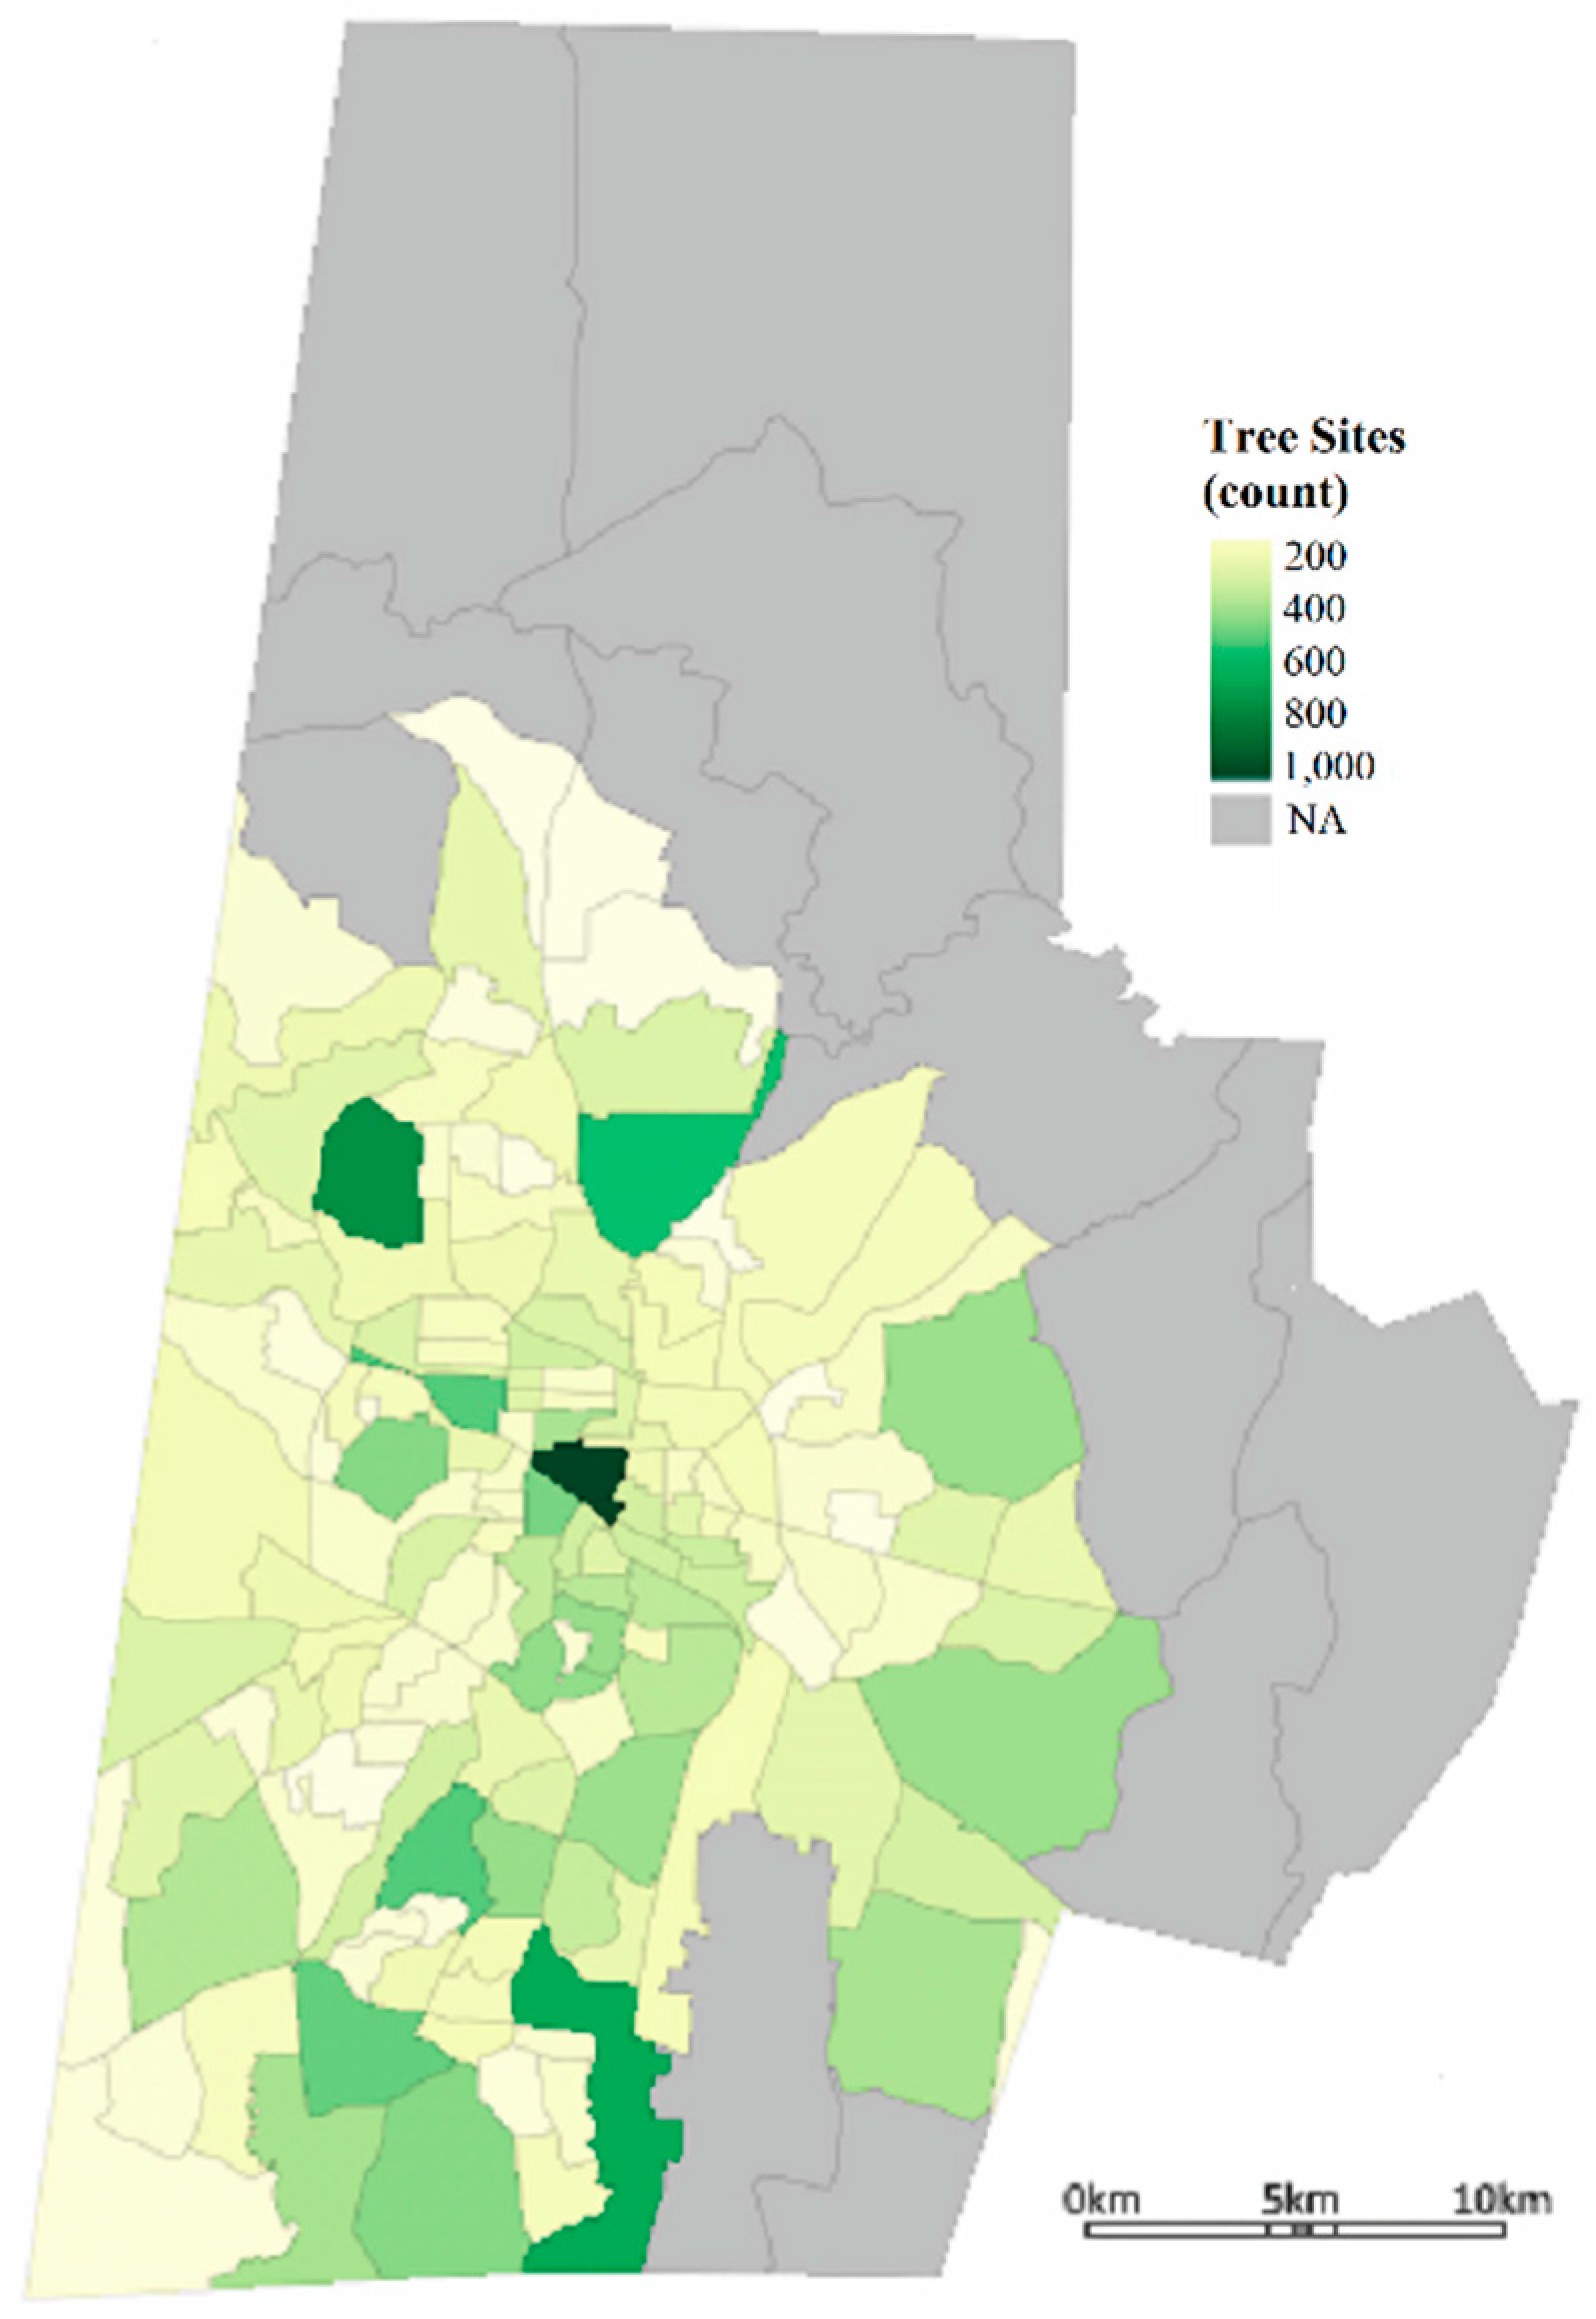
1.2. Case Study: Durham, NC

Located in the central Piedmont region of North Carolina, Durham County has a population of approximately 270,000 (964 people per square mile) [9]. More than 30% of the population is living below twice the poverty level. Low-income populations suffer disproportionate health and social vulnerabilities, in part due to inequitable distributions of public assets and risks [10,11]. The study area also faces stormwater and vehicular emissions challenges. The county is divided into two major water basins, with the Neuse to the north and the Cape Fear to the south. Due to stormwater runoff from areas including the City of Durham, both of the receiving reservoirs (Falls Lake and Jordan Lake) are impaired for nitrogen and phosphorus [12,13]. Durham has implemented a greenhouse gas and criteria air pollutant action plan which cites vehicular emissions as 39% of community greenhouse gas emissions and outlines future reduction targets [14]. Further, the current Durham urban forest is at a critical stage due to impending die-off of about 13,000 trees planted during the 1930s [15,16].
As part of the Trees Across Durham initiative, the City of Durham is dedicated to increasing its tree stock by 1500 trees per year between 2019 and 2026. The projected cost of this effort by the end of 2026 is estimated at 1.1 to 1.25 million U.S. dollars (Alexander Johnson, City of Durham, pers. comm.). This is a substantial outlay for a medium-sized city, and yet it will not fund new trees for all neighborhoods. The Durham Urban Forestry Department requested our assistance to develop a methodologically sound prioritization plan for siting the 10,000 trees along neighborhood rights of way to maximize potential societal benefits.
Durham is also a featured community in the EPA’s EnviroAtlas, an online decision support tool designed to help users identify and map the benefits nature provides to people [17]. The EnviroAtlas community component provides ecosystem services and demographic data summarized by CBG, with environmental metrics based on one-meter resolution land cover data. These resources provided the spatial scale needed to evaluate the tree planting strategies of our study.

1.3. Problem Formulation

Like many communities, Durham is confronted with an aging stock of urban street trees—in this case, primarily willow oaks (Quercus phellos). Their large size and senescent state are beginning to cause significant upkeep and infrastructure expenditures, mostly due to falling limbs and root intrusion. Although there is an increasing awareness of the services provided by urban trees, their drawbacks often prevail in the public mind. Further, the benefits of trees cannot be viewed in isolation, as the targeting of any one ecosystem service can affect the provision of other services [18]. For example, a tree species like Serviceberry (Amelanchier arborea) may be chosen for the aesthetic quality of its bark and flowers, and urban foragers may enjoy co-benefits from collecting its small edible fruits [19]. Any tree management strategy should account for multiple anticipated values.
An integrated strategy for tree planting looks beyond economic costs to health and other social benefits. Some ecosystem services can translate to costs averted; others are less tangible and more subjective. In either case, the nature and magnitude of the actual costs and benefits are highly dependent on location and on the beneficiaries of the services. Therefore, our methodology factored in the location of urban trees with respect to environmental stressors and vulnerable populations. We used the placement of urban trees to demonstrate how our approach yields an increase in benefits provision.

2. Methods

Our study area is the 143 CBGs within the Durham County portion of the Durham community featured in US EPA’s EnviroAtlas. We constructed our analysis according to the stated preference of the Durham Urban Forestry Department to augment the current stock of willow oaks with 10,000 deciduous trees suitable to the urban landscape. While the provision of ecosystem services is species-dependent, we chose to model all trees uniformly according to the phenology of the red maple (Acer rubrum), a representative mid-sized broadleaf tree for the region [20]. The selection of a medium-sized tree is consistent with the desire to reduce the risks of larger trees while maximizing the provision of ecosystem services. We chose a single species because we are primarily exploring the impacts of multiple placement strategies, rather than trying to match species to site. However, multiple species should be selected to avoid pest infestation and other risks of a monoculture [20]. Species selection will be determined on a case-by-case basis by the Durham Urban Forestry Department according to environmental, aesthetic, and economic considerations.
We conducted a semi-quantitative analysis of the benefits of alternate tree-placement strategies based on the trees’ potential for providing multiple ecosystem services. To determine the number of trees that might be placed in each CBG, we first calculated the number of eligible sites for tree planting (Figure 1). We identified these within public rights of way where the City and County of Durham have jurisdiction and responsibility to manage roadside trees. We defined rights of way as 30-foot buffer zones along all road edges. While 30 feet is wider than most legal rights of way, this width reflects mature canopy cover. We then restricted candidate planting sites using the one-meter land cover data [21]; we included bare soil and herbaceous cover types and excluded existing tree cover, impervious surface, and water. We quantified potential tree planting sites per CBG using the maximum number of non-overlapping 30 ft2 candidate areas, assuming one new tree per site.
We selected four common urban objectives that may be achieved through tree planting. Two address the mitigation of hazards—stormwater runoff and traffic emissions—identified as local issues of concern. Two involve social factors that affect the realized benefits of ecosystem services. These objectives are to prioritize vulnerable populations and enhance the pedestrian environment. Greenery is a venue and stimulus for healthful behaviors including physical activity, social interaction, and engagement with nature [22]. In urban and natural areas, this quality is a key aspect of cultural, recreational, and aesthetic ecosystem services [1]. Each of the four objectives considered exposure pathways and was evaluated in isolation and combined to form multi-objective cases which demonstrate how multiple benefits can be optimized by a single action.

2.1. Single-Objective Cases

Our stormwater objective is based on the capacity of urban trees to absorb rainfall and polluted runoff [23,24]. While species type, rainfall amount, soil quality and saturation, and other variables affect this capacity, it has been well documented that land use plays a major role in stormwater quantity and quality [25,26]. A sensitivity analysis of the stormwater runoff parameters in US EPA’s widely-used SWMM model showed that the model was most responsive to impervious land cover [27]. Therefore, we targeted the strategic planting of trees based on the percent impervious land cover in each CBG. We used the EnviroAtlas percent impervious surface metric, summarized by CBG [21], as a measure of intensity of need for our stormwater metric.
Our road emissions objective targets the mitigation of vehicular air pollution by urban street trees. The effectiveness of near-road tree buffers is dependent on species as well as local factors including temperature, precipitation, wind speed and direction, and design of the built environment [28]. Nevertheless, leaf stomata readily absorb gaseous pollutants [29], while a continuous tree buffer can loft and dilute airborne pollutant flow [30]. We focused on nitrogen dioxide (NO2), a US EPA-labeled criteria pollutant that has been linked to significant public health issues such as childhood asthma and cardio-vascular disease [20,31]. To identify the biggest potential source of vehicular air emissions, we categorized the roads within our study area for each of the 143 CBGs based on speed and fleet (truck) mix (Table 1). Analyses were conducted in ArcGIS 10.2 [32] using the NAVTEQ road database for the U.S. [33].
We defined a road in the same manner as Watkins and Baldauf [34], who make no distinction among street, collector, arterial, highway, expressway, toll-way, parkway or freeway. Since roads are characteristically classified based on these functions, not speed or fleet mix, the typical US Department of Transportation road classifications are not sufficient as metrics for potential source emissions. According to EPA’s MOBILE6 and newer MOVES vehicle emissions models, NO2 emissions vary by driving speed and vehicle type [35,36]. Speed affects NO2 emissions in a parabolic fashion; both the Victoria Transport Policy Institute and the US Federal Highway Administration show that lower and higher driving speeds result in higher NO2 emissions than mid-range driving speeds [37,38].
Roads with speed limits in the lower emissions range (31–44 mph) were ranked lower than roads with speed limits outside this range, and roads designated as truck routes were ranked higher than non-truck routes. The rank of the road (from 1 for low-emissions, speed-limited roads not designated as truck routes, to 4 for high-emissions speed-limited roads designated as truck routes) was multiplied by total road length within each CBG, and the resulting value used as the needs metric for road emissions.
While reducing air emissions across the study area is a worthwhile environmental goal, greater human health and well-being benefits can be realized by targeting populations most vulnerable to air pollution. Studies have shown that young, old, and low-income populations are especially vulnerable to illness and disease caused by air pollution [11,39]. For this study, we identified vulnerable populations based on age, income, and population density to maximize tree planting in block groups with the highest concentrations of vulnerable populations using 2010 US Census data obtained through EnviroAtlas [21]. The population vulnerability metric was calculated as the product of population density, the percent of young and old (less than five and greater than 64 years of age), and the percent with income below twice the poverty level.
Inactivity-related health issues, such as obesity and diabetes, have reached epidemic levels in the US and are the leading risk factors for heart-related disease [40,41]. Recent studies have revealed that decisions about parks and natural environments affect people’s physical and mental health [42,43]. Tree cover has been shown to provide health benefits directly by reducing the urban heat island effect [44], thus improving conditions for walking. Street trees have been linked to walking behavior also through improved pedestrian safety [45] and aesthetics [46,47]; in addition, they may facilitate healthful social interaction [48]. Land use mix and street network patterns are strongly linked to pedestrian activity [43,49]. Trails, sidewalks and street crossings are additional features of walkable environments, improving access to jobs and resources such as food and healthcare, while promoting healthy outdoor activity [50]. For these reasons, we developed a walkability metric for health. We ranked each CBG based on road speed and sidewalk availability, with the logic that increasing tree cover along walkable roads will promote pedestrian use.
The walkability metric is the ratio of sidewalk length to category 1 (low-speed) road length, multiplied by the percentage of category 1 road length. Sidewalk GIS data were obtained from the Durham City and County Planning Departments. Roads data derived from NAVTEQ [33]; these two spatial datasets were merged and segmented by US Census 2010 CBG polygons for the study area using ArcGIS 10.2 [32]. As with the other need-based metrics, higher values denoted higher need and CBG priority rank. We underscore that we prioritized roads that were already walkable, based on traffic and sidewalk characteristics, to enhance shading, safety, and aesthetics.
Each of these four single-objective case (SOC) metrics failed the Shapiro-Wilk test for normality at 95% confidence; these results were confirmed visually using Q-Q plots. Therefore, each metric was standardized to a value between 0 and 1 using non-parametric methods, according to the range of non-standardized metric values. All metrics apart from the road emissions metric were skewed right, with the population vulnerability and walkability distributions approximating power-law distributions (Figure 2). The population vulnerability and walkability distributions also exhibited high kurtosis, while the road emissions and stormwater distributions exhibited very low kurtosis.
We assessed possible correlation among the metrics using both a linear model and the non-parametric Spearman’s rank correlation test. The r-squared value of the linear model relating road emissions to walkability was 0.22, and below 0.03 for all other relationships. The Spearman’s ρ (range −1 to +1) relating emissions to walkability was 0.43, between 0.22 and 0.28 for population vulnerability to walkability and stormwater to walkability, respectively, and below an absolute value of 0.16 for all other relationships. The two most strongly correlated SOC metrics (road emissions and walkability) exhibited limited geographical overlap (Figure 3a,d). While both metrics are road-based, the emissions metric incorporates high-speed roads and truck routes, whereas the walkability metric includes low- to medium-speed roads without regard for truck designation.

2.2. Multiple-Objective Cases

The SOCs target one benefit while potentially accruing the added value of other benefits. The multi-objective cases (MOCs) seek to incorporate multiple benefits by intentionally accounting for them in the decision-making context. We developed six 2-objective cases (MOC2s), four 3-objective cases (MOC3s), and one 4-objective case (MOC4).
We prioritized CBGs for tree planting based on the generation of intentional co-benefits (ICB). For each MOC, we calculated the ICB generation by CBG as the product of the singular benefits (SB) metrics under consideration. For example, the ICB value by CBG for the MOC2 considering stormwater and walkability was calculated as the product of the SB for stormwater and the SB for walkability. For MOC4, the ICB value by CBG was calculated as the product of all four SB values (See Supplementary Materials).

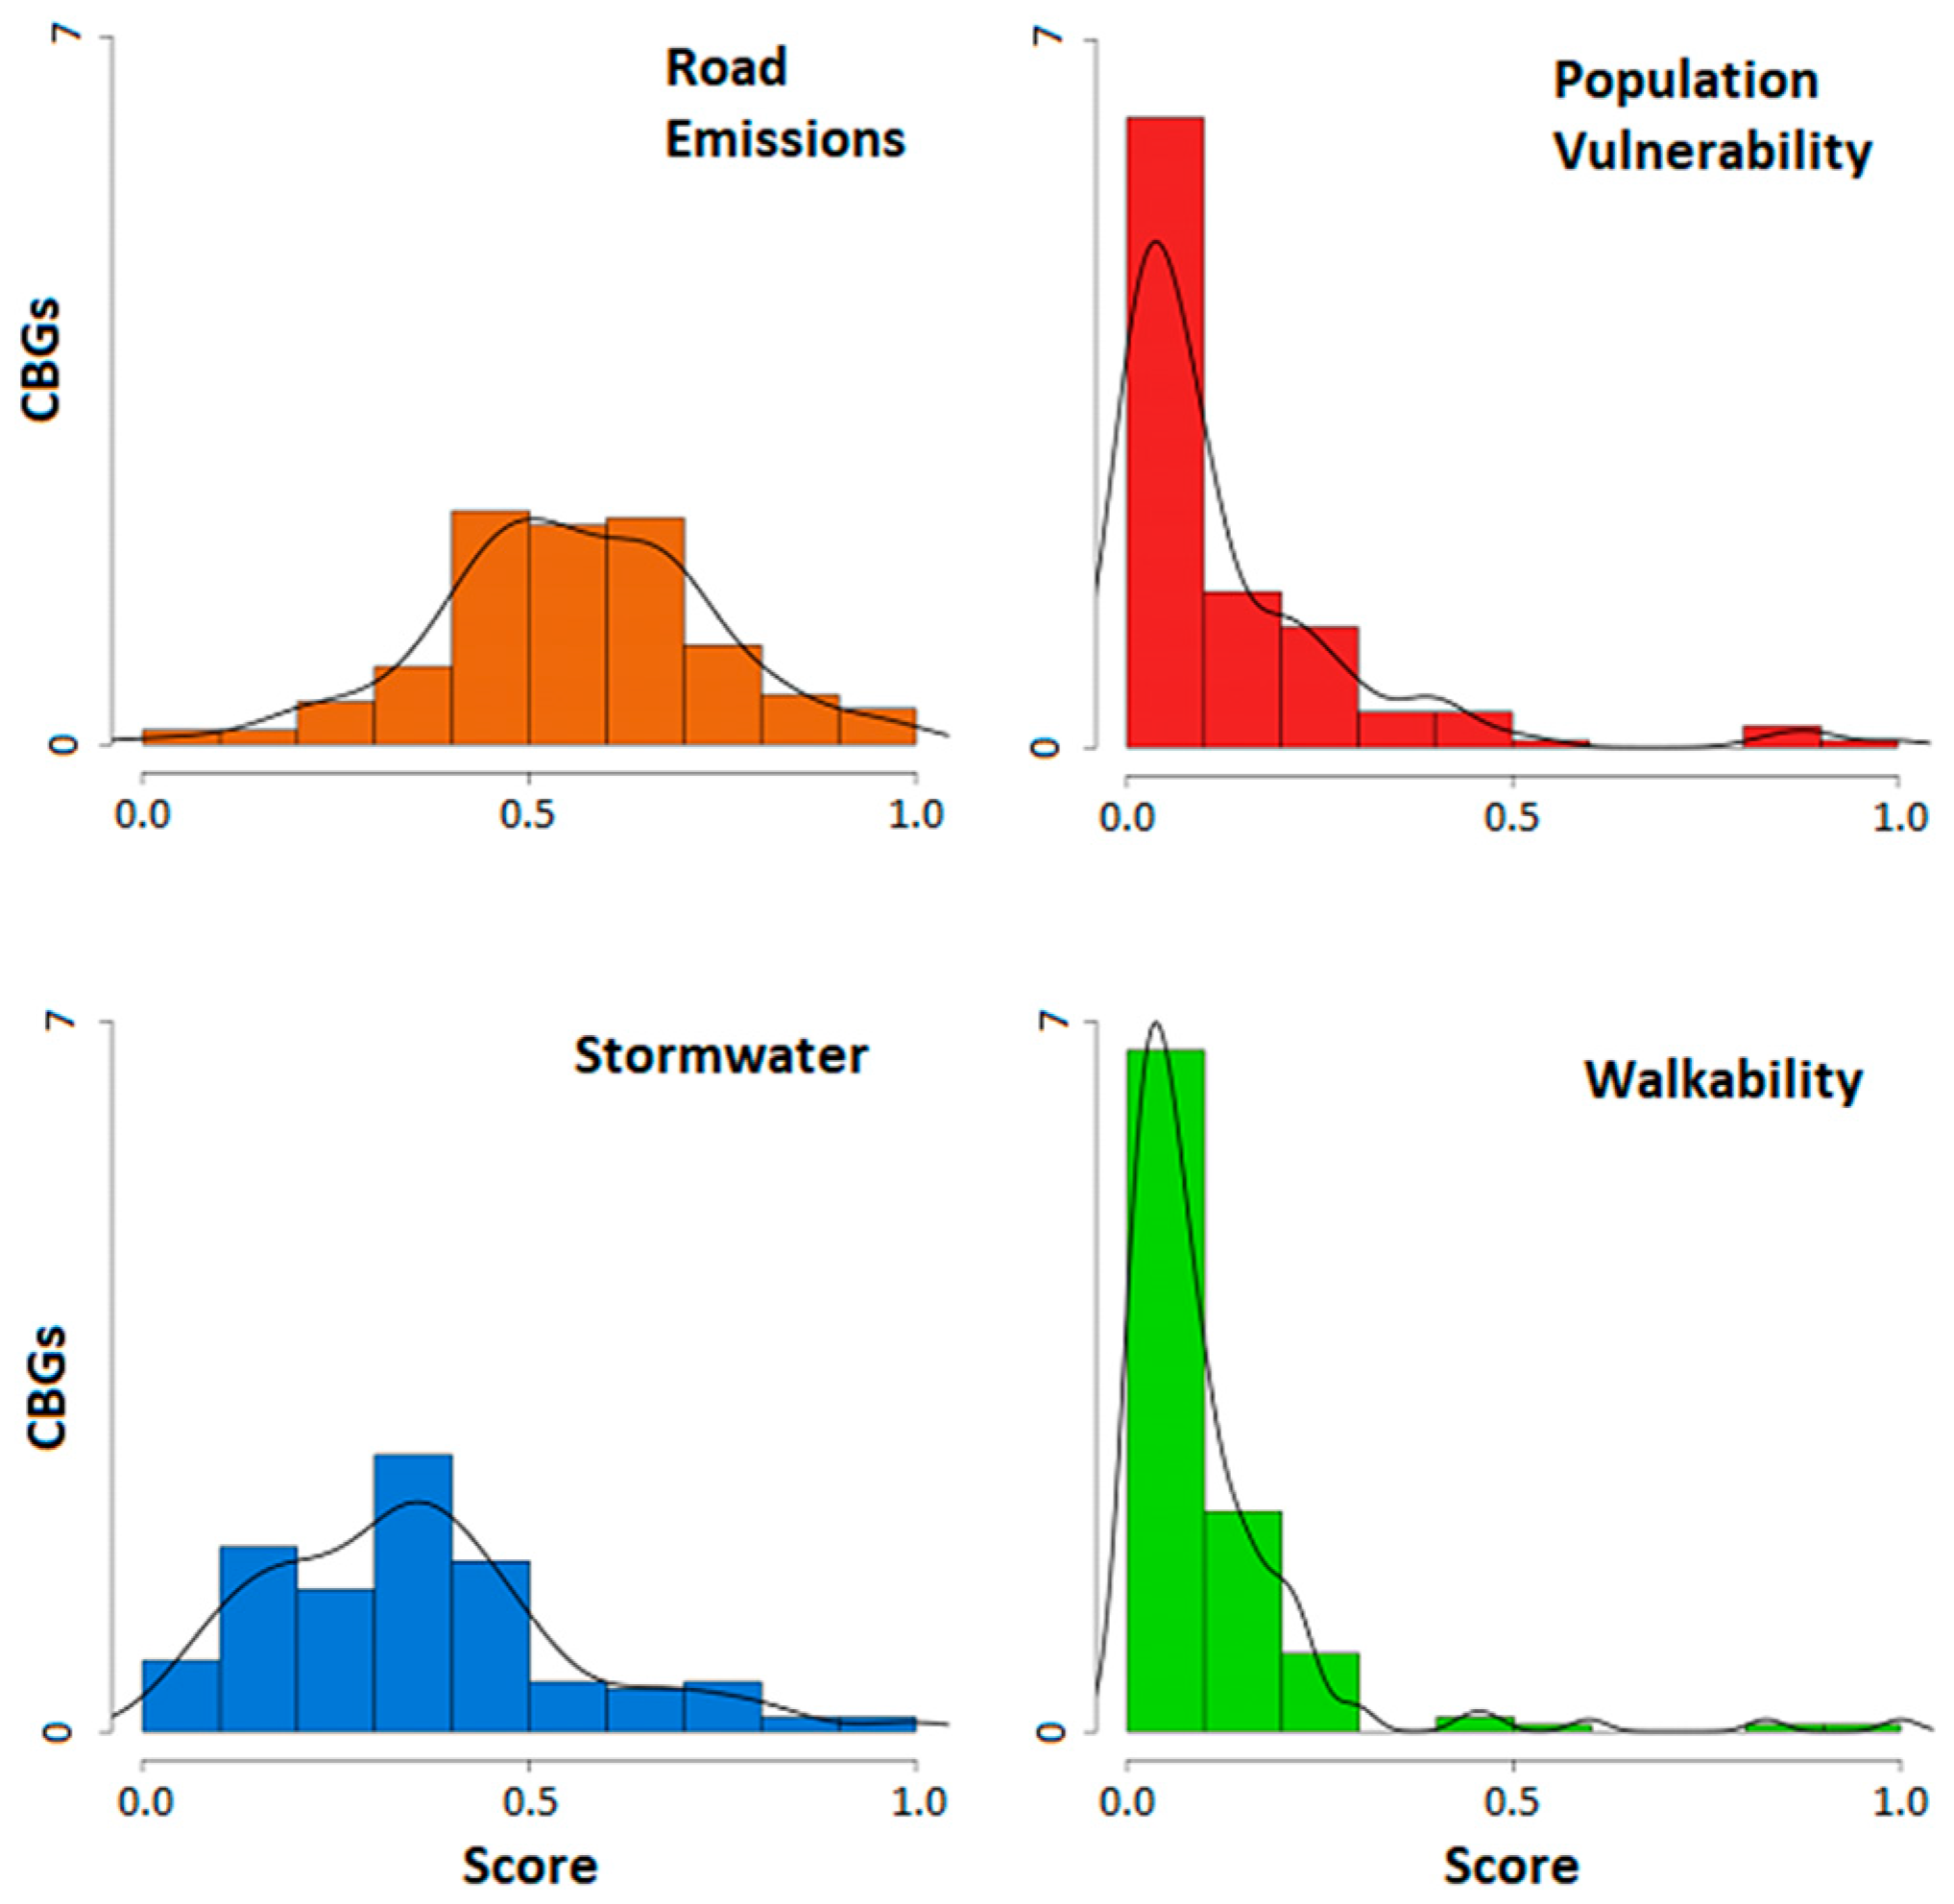
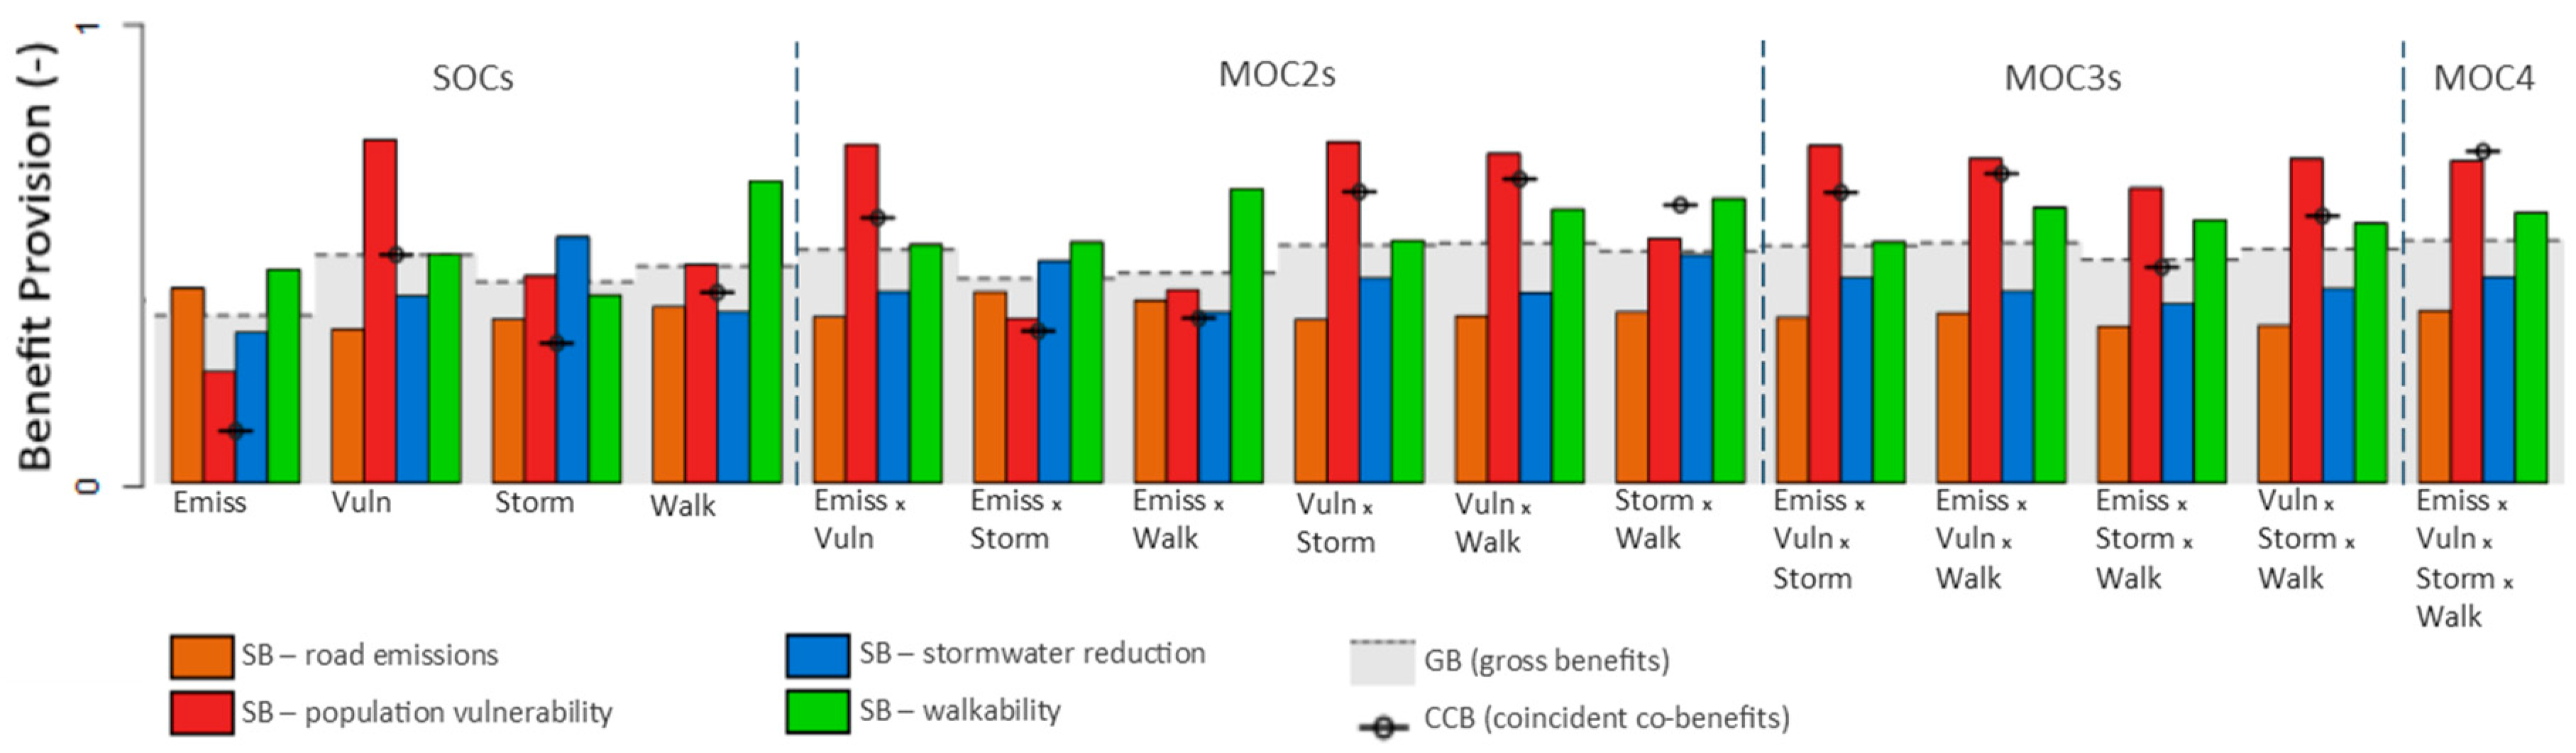
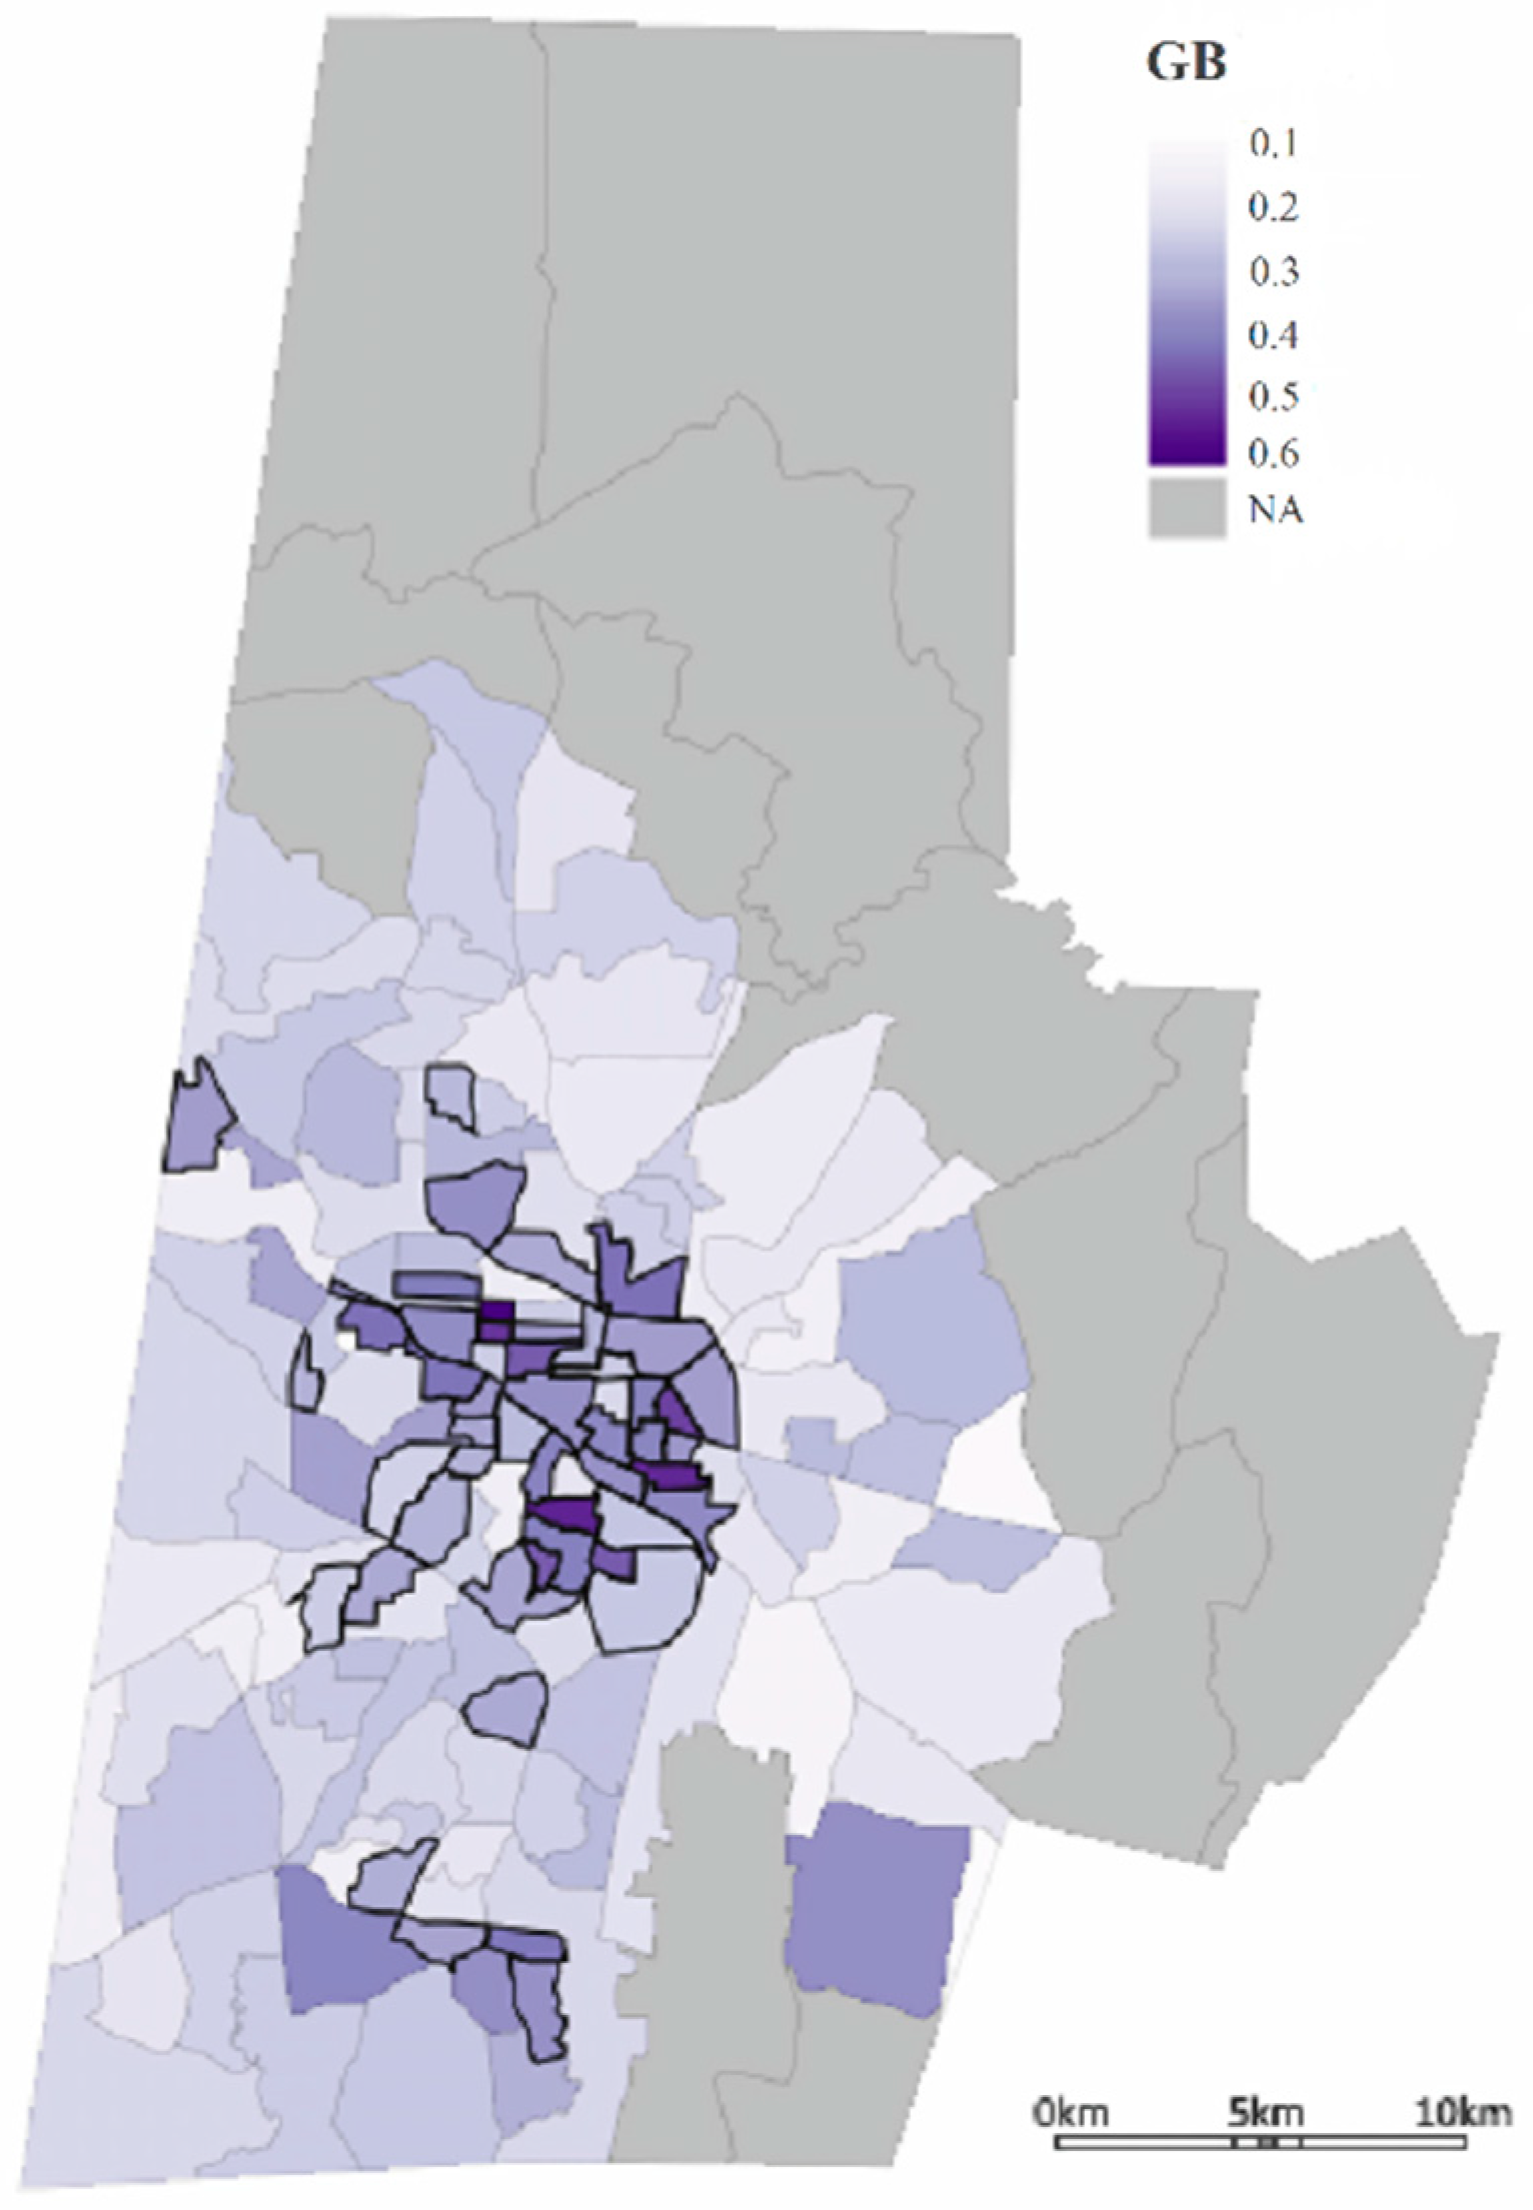
2.3. Benefits Calculation

Trees were distributed into eligible planting sites by ranking CBGs according to SB for SOCs and ICB for MOCs, with a higher score indicating a higher priority. Beginning with 10,000 trees and the highest-ranking CBG in the target objective, we filled CBGs until all 10,000 trees were depleted for each case. We assessed the effectiveness of each case according to FBP, defined as the ratio of benefits generated by the distribution of 10,000 trees relative to the maximum benefits which could be generated if all candidate tree sites could be filled. First, we calculated the potential benefits provision for each SB by CBG as the product of the total number of candidate tree sites and the SB score for that CBG. The maximum benefits provision for each SB is the sum of potential benefits provided across all 143 CBGs. The FBP for each SB is the ratio of the sum of potential benefits provision for all CBGs that can be filled with trees to the maximum benefit provision for all 143 CBGs in Durham:
FBP ( SB ) =   i = 1 n CBG ( SB ) i   ×   CBG ( trees ) i i = 1 143 CBG ( SB ) i   ×   CBG ( trees ) i
where CBG(SB) is the SB value of a CBG, CBG(trees) is the number of candidate tree sites within a CBG, and n is the number of CBGs that could be filled with trees when the CBGs were prioritized for each case. Using the same method, we also calculated the FBP of gross benefits (GB), with GB being defined as the sum of all four SBs per CBG.
While GB allowed us to assess the accumulation of benefits, we also calculated the capacity of each case to generate coincident co-benefits (CCB), whether through intentional planning or as an incidental byproduct. For each CBG, CCB was calculated as the product of all SBs (in the same manner as ICB was calculated for MOC4). Then the FBP of CCB was calculated for each SOC and MOC:
FBP ( CCB ) =   i = 1 n CBG ( CCB ) i   ×   CBG ( trees ) i i = 1 143 CBG ( CCB ) i   ×   CBG ( trees ) i
where CBG(CCB) is the CCB value of a CBG. By assessing estimated benefits provision as a fraction of maximum benefits provision, we could directly compare the provision of singular, gross, and coincident benefits across all 14 SOCs and MOCs.

3. Results

The road emissions SOC case generated the lowest GB and CCB provision, followed by the stormwater SOC (Figure 4). Prioritizing according to either of these objectives resulted in widely dispersed target CBGs with no apparent pattern (Figure 3). The population vulnerability SOC nearly maximized the provision of SB for this objective and resulted in the highest GB provision of any SOC. The target CBGs were less widely dispersed, with a distinct clustering around historically disadvantaged communities east of downtown Durham, as well as a spur leading southwest from the city center along a major highway. GB and CCB provision in the walkability SOC was nearly as high as in the population vulnerability SOC, with a very tight clustering of target CBGs around downtown Durham and near the two major universities—Duke University to the west of downtown and North Carolina Central University to the south.
The metrics that were distributed closer to a normal distribution resulted in less efficient resource allocation. For example, the FBP for road emissions reduction was between about 37% and 47% depending on whether the objective was targeted or not. This compares unfavorably with the FBP for population vulnerability, which increased from about 27% to 83% when it was targeted. While exclusive consideration of road emissions captured only 40% of maximum GB across Durham, exclusive consideration of population vulnerability captured more than 55%. In fact, even the simultaneous consideration of all objectives in MOC4 captured only slightly more GB at 59%.
The MOC2s generally resulted in slightly higher GB provision. However, two of the MOC2s (road emissions × stormwater; road emissions × walkability) generated lower GB than the SOCs of population vulnerability and walkability. MOC2s that included road emissions tended to underperform MOC2s that did not, and MOC2s that included population vulnerability tended to outperform MOC2s that did not.
No MOC3 substantially outperformed the three highest-performing MOC2s (population vulnerability × stormwater; population vulnerability × walkability; and stormwater × walkability). Conversely, the lowest performing MOC3 (road emissions × stormwater × walkability) underperformed every MOC2 that included population vulnerability in the provision of both GB and CCB, and even underperformed the MOC2 which included only stormwater and walkability.
GB provision also did not substantially increase in MOC4. The spatial pattern of MOC4 (Figure 5) largely matched that of the overlapping areas of the SOCs of population vulnerability and walkability, with concentrations in the downtown area, around the two major universities, and along the spur to the southwest of downtown. While GB provision was similar across all high-performing scenarios, CCB generation improved substantially in MOC4, and tended to be higher in MOC3s than MOC2s or SOCs.
In response to the City’s request for tree-planting site recommendations, we proposed MOC4 because it generated the greatest GB and CCB. We agglomerated the highest-priority CBGs under MOC4 into eight civic neighborhoods. Then, we ranked those eight neighborhoods according to the relative calculated needs of their constituent CBGs. Within each neighborhood we identified walkable street lengths with minimal or no street-side tree cover, using estimates provided in EnviroAtlas [51], which we verified using Google Street View. Our management plan based on this analysis is in Supplementary Materials.

4. Discussion

We present a methodology for maximizing the provision of benefits by an ecosystem services enhancement strategy through simultaneous consideration of multiple need-based objectives. In this use case, we demonstrated that the capture of CCB is enhanced when multiple objectives are considered explicitly and simultaneously [52]. However, we also found that prioritizing the consideration of vulnerable populations, a social objective, yields the most benefits singly and when combined with one or two other objectives.
Contrary to our original hypothesis, the maximization of GB and CCB were approximated by targeting just one strategic objective, where the data representing that objective were strongly skewed and highly kurtotic. Where simultaneous consideration of multiple benefits is not possible or is too computationally expensive, GB provision may be significantly improved by focusing on a single objective with geographically concentrated benefits. In Durham, the single objectives that exhibited greater nonnormality and resulted in more efficient GB generation contained a social component—demographics in the population vulnerability objective and built infrastructure in the walkability objective. In some cases, there were location tradeoffs between objectives. For example, the CBG with the second highest need for stormwater reduction (southeast corner of Figure 4c) was not covered by MOC4, nor in our recommendation to the City of Durham, because the other ecosystem services provisioned there were minimal.
Much research has focused on the potential benefits of urban trees, quantifying the potential ecosystem services they provide in terms of ecological production functions [5,7]. We extended this paradigm to estimate the actual benefits of those potential services through calculating intensity of need for those services across neighborhoods. For example, while trees may buffer vehicular air pollution in any context, the benefits of this service to pedestrians are much greater for a row of trees planted along a highly-traveled neighborhood street than along a sparsely populated highway. Strategic placement within the landscape is required to maximize actual benefits.
We recognize that monetization has been the primary method of comparing dissimilar environmental states [2]. Many resources have been developed to this end, such as the U.S. Environmental Protection Agency’s BenMAP tool, which estimates the economic impacts of changes in air pollution on human health, and the USDA Forest Service’s i-Tree suite, which includes a method to monetize selected benefits of urban forests [53,54]. However, some of the outcomes that communities care most about (e.g., social cohesion, quality of place, health and well-being) do not lend themselves to monetization [2]. In fact, in its assessment of our prioritization scheme, the Durham management team focused on health outcomes and service to historically disadvantaged communities, and was indifferent to the monetization of benefits. Nevertheless, non-monetized benefits are typically under-represented in cost-benefit analyses.
The consideration of multiple measures of what people “value,” known as multi-criteria decision analysis (MCDA), has advanced into areas such as landscape planning in part through the inclusion of ecosystem services indicators [55]. Fontana, Radtke et al. [56] used MCDA to evaluate landscape design alternatives for their ability to produce multiple services, while other studies applied multi-objective algorithms to optimize ecosystem services for watershed management and agricultural production [57]. Similarly, our methodology quantifies in non-monetary terms the extent to which a proposed management action provides a suite of ecosystem services addressing expressed needs across a community. This functional, practical screening-level approach allows the direct comparison of four dissimilar but complementary SBs, as well as evaluation of GB and CCB provision according to incidental or intentional inclusion, respectively, of multiple objectives.

Limitations and Areas for Further Development

Our study constructed fourteen single- and multi-objective cases to develop metrics for ranking and evaluating the intensity of needs in each CBG. We focused on issues of concern to the study community, quantifying need using readily available geospatial data [58]. We recognize that estimating an actual outcome for each objective met would require sector-specific modeling. For instance, a stormwater pollutant loading model would be required to calculate N or P load reduced; or an air emissions model would be required to calculate NO2 reductions from tree planting. While numerous tools for scenario modeling of this type are available (e.g., USDA i-Tree suite), quantification of biophysical outputs is beyond the scope of this study. Indeed, part of the appeal of assessing ecosystem services provision in terms of intensity of need for services, as opposed to biophysical drivers, is the ease of calculation from readily-available data. Therefore, for each objective described in our study, we considered only the major characteristic(s) of sector-specific models and literature, and created a simplified metric that reflected the primary documented driver(s) of the objective. Nevertheless, spatially explicit estimation of the value of realized benefits (e.g., monetary value or health outcomes) depends on biophysical outputs which are not addressed here. Nor are trade-offs between or synergies among ecosystem services directly accounted for in a physically meaningful way [59]. Also, though our model explores potential benefits of trees in a spatial dimension, we ignore temporality which is increasingly appreciated as an essential component in a holistic accounting of ecosystem services [60]. For example, it will take years for the full benefits from newly planted trees to be realized; this ecosystem benefit curve could also be explored. Further, because a policy action was predetermined in our case (i.e., the planting of 10,000 trees over seven years by the Durham Urban Forestry Department), we did not explore the potential effects of alternative policy scenarios, a tool which has been previously used to highlight the benefits of alternative regulatory actions [61].

5. Conclusions

Urban stakeholders have a variety of interests, including stormwater management, air pollution reduction, population fitness, and equity. By including this suite of needs, our method aims to further the goals of multiple stakeholders and raise awareness of urban tree benefits. We show how explicit consideration of multiple benefits simultaneously optimizes the capture of co-benefits, as compared with the incidental capture of co-benefits achieved in single-objective cases. We also show that, in this study area, the exclusive consideration of population vulnerability nearly maximizes the capture of gross benefits. This finding is likely because the distribution of vulnerable populations is highly nonuniform.
The utility and practicality of our approach was underscored by its adoption by the City of Durham. The strategic use of green infrastructure to support societal needs, particularly the disproportionate needs of the most vulnerable populations, is also one feasible means to address the U.N. Sustainable Development Goals [62]. As this case study is a rare practical application of trade-off theory in an urban setting [55,58], it may be appropriate for inclusion in a compendium of ecosystem services management applications [58]. Since our method relies exclusively on publicly available data and is not computationally complex, its application to a variety of other localities would be straightforward. Further, the prioritization strategy outlined here for evaluating multiple ecosystem services could be adapted to other urban land use decisions.

Supplementary Materials

The following are available online at https://www.mdpi.com/2071-1050/10/12/4488/s1.

Author Contributions

Conceptualization, R.A., A.A. and T.M.; Methodology, A.A., T.M. and C.R.; Software, A.T. and D.B.; Validation, A.T.; Formal Analysis, A.A., A.T. and D.B.; Investigation, D.B.; Resources, R.A.; Data Curation, R.A.; Writing-Original Draft Preparation, A.A., T.M., A.P. and R.A.; Writing-Review & Editing, R.A., L.J. and A.T.; Visualization, A.T. and D.B.; Supervision, R.A. and L.J.; Project Administration, R.A. and L.J.; Funding Acquisition, R.A. and L.J.

Funding

This research received no external funding.

Conflicts of Interest

The authors declare no conflict of interest.

Disclaimer

This research article has been reviewed and approved by the National Health and Environmental Effects Research Laboratory, U.S. Environmental Protection Agency. Approval does not signify that the contents reflect the views and policies of the Agency, nor does the mention of trade names of commercial products constitute endorsement or recommendation for use.

Appendix A Summary of Abbreviations

AbbreviationNameDescription
CBGCensus block groupGeographic unit of organization
CCBCoincident co-benefitsProduct of all SB scores
FBPFractional benefit provisionRatio of actual benefits to potential benefits
GBGross benefitsSum of all SB scores
ICBIntentional co-benefitsBenefits from multiple metrics
MOCMulti-objective casePrioritization schemes using ICB scores
SBSingular benefitsBenefits from a single metric
SOCSingle-objective casePrioritization schemes using SB scores

References

  1. Millennium Ecosystem Assessment. Ecosystems and Human Well-Being: Synthesis; Island Press: Washington, DC, USA, 2005. [Google Scholar]
  2. Viglizzo, E.F.; Paruelo, J.M.; Laterra, P.; Jobbagy, E.G. Ecosystem service evaluation to support land-use policy. Agric. Ecosyst. Environ. 2012, 154, 78–84. [Google Scholar] [CrossRef]
  3. Chichilnisky, G.; Heal, G. Economic returns from the biosphere. Nature 1998, 391, 629–630. [Google Scholar] [CrossRef]
  4. Honey-Rosés, J.; DSchneider, W.; Brozović, N. Changing Ecosystem Service Values Following Technological Change. Environ. Manag. 2014, 53, 1146–1157. [Google Scholar] [CrossRef] [PubMed]
  5. Nowak, D.; Crane, D.; Stevens, J.; Hoehn, R.; Walton, J.; Bond, J. A ground-based method of assessing urban forest structure and ecosystem services. Arboric. Urban For. 2008, 34, 347–358. [Google Scholar]
  6. Bengston, D.N.; Fletcher, J.O.; Nelson, K.C. Public policies for managing urban growth and protecting open space: Policy instruments and lessons learned in the United States. Landsc. Urban Plan. 2004, 69, 271–286. [Google Scholar] [CrossRef]
  7. McPherson, G.; Simpson, J.; Peper, P.; Maco, S.; Xiao, Q. Municipal forest benefits and costs in five US cities. J. For. 2005, 103, 411–416. [Google Scholar]
  8. Daniel, T.; Muhar, A.; Arnberger, A.; Aznar, O.; Boyd, J.; Chan, K.; Costanza, R.; Elmqvist, T.; Flint, C.; Gobster, P.; et al. Contributions of Cultural Services to the Ecosystem Services Agenda. Proc. Natl. Acad. Sci. USA 2012, 109, 8812–8819. [Google Scholar] [CrossRef] [PubMed]
  9. US Census Bureau. State and County Quick Facts. 2012. Available online: http://quickfacts.census.gov/qfd/states/37/37063.html (accessed on 23 June 2014).
  10. Marmot, M.; Friel, S.; Bell, R.; Houweling, T.A.J.; Taylor, S.; on behalf of the Commission on Social Determinants of Health. Closing the gap in a generation: Health equity through action on the social determinants of health. Lancet 2008, 372, 1661–1669. [Google Scholar] [CrossRef]
  11. Landry, S.M.; Chakraborty, J. Street Trees and Equity: Evaluating the Spatial Distribution of an Urban Amenity. Environ. Plan. A Econ. Space 2009, 41, 2651–2670. [Google Scholar] [CrossRef]
  12. Durham County. Neuse River Basin Nutrient Sensitive Waters Management Strategy: Stormwater Plan. 2007. Available online: http://www.dconc.gov/home/showdocument?id=1190 (accessed on 2 October 2015).
  13. Durham County. Jordan Lake Stage 1 Adaptive Management Program. 2009. Available online: www.dconc.gov/home/showdocument?id=1186 (accessed on 2 October 2015).
  14. [ICLEI] Local Governments for Stability. City of Durham & Durham County Greenhouse Gas and Criteria Air Pollutant Emissions Inventory and Local Action Plan for Emission Reductions; ICLEI Energy Services: Toronto, ON, Canada, 2007. [Google Scholar]
  15. Durham City-County Environmental Affairs Board. Recommendations for Sustaining a Healthy Urban Forest in Durham, NC; Durham City-Council Environmental Affairs Board: Durham, NC, USA, 2015.
  16. Wise, J. Durham Tree Canopy at ‘Critical Juncture’; The News & Observer Publishing Company: Raleigh, NC, USA, 2015. [Google Scholar]
  17. Pickard, B.; Daniel, J.; Mehaffey, M.; Jackson, L.; Neale, A. EnviroAtlas: A new geospatial tool to foster ecosystem services science and resource management. Ecosyst. Serv. 2015, 14, 45–55. [Google Scholar] [CrossRef] [Green Version]
  18. Rodríguez, J.P.; Beard, T.D.; Bennett, E.M.; Cumming, G.S.; Cork, S.J.; Agard, J.; Dobson, A.P.; Peterson, G.D. Trade-offs across space, time, and ecosystem services. Ecol. Soc. 2006, 11, 28. [Google Scholar] [CrossRef]
  19. Bassuk, N.; Curtis, D.F.; Marranca, B.Z.; Neal, B. Recommended Urban Trees: Site Assessment and Tree Selection for Stress Tolerance; Urban Horticulture Institute: Ithica, NY, USA, 2009. [Google Scholar]
  20. McPherson, E.G.; Simpson, J.R.; Peper, P.J.; Gardner, S.L.; Vargas, K.E.; Maco, S.E.; Xiao, Q. Piedmont Community Tree Guide: Benefits, Costs, and Strategic Planting; Center for Urban Forest Research: Davis, CA, USA, 2006. [Google Scholar]
  21. U.S. Environmental Protection Agency. EnviroAtlas Tool. 2013. Available online: www.epa.gov/enviroatlas (accessed on 1 November 2018).
  22. Jackson, L.E.; Daniel, J.; McCorkle, B.; Sears, A.; Bush, K.F. Linking ecosystem services and human health: The Eco-Health Relationship Browser. Int. J. Public Health 2013, 58, 747–755. [Google Scholar] [CrossRef] [PubMed]
  23. Sanders, R.A. Urban vegetation impacts on the hydrology of Dayton, Ohio. Urban Ecol. 1986, 9, 361–376. [Google Scholar] [CrossRef]
  24. Xiao, Q.; McPherson, E.G. Surface water storage capacity of twenty tree species in Davis, California. J. Environ. Qual. 2016, 45, 188–198. [Google Scholar] [CrossRef] [PubMed]
  25. Tsihrintzis, V.; Hamid, R. Urban stormwater quantity/quality modeling using the SCS method and empirical equations. J. Am. Water Resour. Assoc. 1997, 33, 163–176. [Google Scholar] [CrossRef]
  26. Goonetille, A.; Thomas, E.; Ginn, S.; Gilbert, D. Understanding the Role of Land Use in Urban Stormwater Quality Management. J. Environ. Manag. 2005, 74, 31–42. [Google Scholar] [CrossRef] [PubMed] [Green Version]
  27. Barco, J.; Wong, K.M.; Stenstrom, M.K. Automatic calibration of the US EPA SWMM model for a large urban catchment. J. Hydraul. Eng. 2008, 134, 466–474. [Google Scholar] [CrossRef]
  28. Baldauf, R. Roadside vegetation design characteristics that can improve local, near-road air quality. Transp. Res. Part D 2017, 52, 354–361. [Google Scholar] [CrossRef] [PubMed]
  29. Hosker, R.P., Jr.; Lindberg, S.E. Review: Atmospheric deposition and plant assimilation of gases and particles. Atmos. Environ. 1982, 16, 889–910. [Google Scholar] [CrossRef]
  30. Hagler, G.S.W.; Tang, W.; Freeman, M.J.; Heist, D.K.; Perry, S.G.; Vette, A.F. Model evalaution of roadside barrier impact on near-road air pollution. Atmos. Environ. 2011, 45, 2522–2530. [Google Scholar] [CrossRef]
  31. Lovasi, G.; Quinn, J.; Neckerman, K.; Perzanowski, M.; Rundle, A. Children Living in Areas with More Street Trees Have Lower Prevalence of Asthma. J. Epidemiol. Community Health 2008, 62, 647–649. [Google Scholar] [CrossRef] [PubMed]
  32. ESRI. ArcGIS Desktop: Release 10.2; Environmental Systems Research Institute: Redlands, CA, USA, 2014. [Google Scholar]
  33. NAVTEQ. NAVTEQ’s NAVSTREETS Street Data Reference Manual v4.4; NOKIA: Chicago, IL, USA, 2012; Available online: http://data-content.ptvgroup.com/en/products/geodata/navstreetstm-from-here/ (accessed on 15 April 2015).
  34. Watkins, N.; Baldauf, R. Near-Road NO2 Monitoring Technical Assistance Document; U.S. Environmental Protection Agency: Research Triangle Park, NC, USA, 2012. [Google Scholar]
  35. (EPA) U.S. Environmental Protection Agency. User’s Guide to MOBILE6.1 and MOBILE6.2: Mobile Source Emission Factor Model; U.S. EPA National Vehicle and Fuel Emissions Laboratory: Ann Arbor, MI, USA, 2002.
  36. (EPA) U.S. Environmental Protection Agency. Using MOVES to Prepare Emissions Inventories in State Implementation Plans and Transportation Conformity: Technical Guidance for MOVES 2010; EPA-420-B-12-028; U.S. Environmental Protection Agency: Washington, DC, USA, 2012.
  37. (DOT) U.S. Department of Transportion, Federal Highway Administration. Multi-Pollutant Emissions Benefits of Transportation Strategies-FHWA. 2007. Available online: http://www.fhwa.dot.gov/environment/air_quality/conformity/research/mpe_benefits/ (accessed on 9 October 2015).
  38. Victoria Transport Policy Institute. Transportation Cost and Benefit Analysis II—Air Pollution Costs. 2011. Available online: http://healthpolicy.ucla.edu/Documents/Newsroom%20PDF/tca0510.pdf (accessed on 26 November 2018).
  39. Morello-Frosch, R.; Shenassa, E. The environmental riskscape” and social inequality: Implications for explaining maternal and child health disparities. Environ. Health Perspect. 2006, 114, 1150–1153. [Google Scholar] [CrossRef] [PubMed]
  40. Barnes, A.S. The epidemic of obesity and diabetes: Trends and treatments. Tex. Heart Inst. J. 2011, 38, 142. [Google Scholar] [PubMed]
  41. U.S. Centers for Disease Control and Prevention. Summary Health Statistics for US Adults: National Health Interview Survey; National Center for Health Statistics: Hyattsville, MD, USA, 2012.
  42. Brownson, R.; Baker, E.; Housemann, R.; Brennan, L.; Bacak, S. Environmental and policy determinants of physical activity in the United States. Am. J. Public Health 2001, 91, 1995–2003. [Google Scholar] [CrossRef] [PubMed]
  43. Wells, N.; Evans, G.; Yang, Y. Environments and health: Planning decisions as public-health decisions. J. Arch. Plan. Res. 2010, 27, 124–143. [Google Scholar]
  44. Zhou, W.; Qian, Y.; Li, X.; Li, W.; Han, L. Relationships between land cover and the surface urban heat island: Seasonal variability and effects of spatial and thematic resolution of land cover data on predicting land surface temperatures. Landsc. Ecol. 2014, 29, 153–167. [Google Scholar] [CrossRef]
  45. Naderi, J. Landscape design in clear zone: Effect of landscape variables on pedestrian health and driver safety. Transp. Res. Rec. J. Transp. Res. Board 2003, 1851, 119–130. [Google Scholar] [CrossRef]
  46. Adams, M.A.; Sallis, J.F.; Kerr, J.; Conway, T.L.; Saelens, B.E.; Frank, L.D.; Norman, G.J.; Cain, K.L. Neighborhood environment profiles related to physical activity and weight status: A latent profile analysis. Prev. Med. 2011, 52, 326–331. [Google Scholar] [CrossRef] [PubMed] [Green Version]
  47. Humpel, N.; Marshall, A.L.; Leslie, E.; Bauman, A.; Owen, N. Changes in Neighborhood Walking Are Related to Changes in Perceptions of Environmental Attributes. Ann. Behav. Med. 2004, 27, 60–67. [Google Scholar] [CrossRef] [PubMed]
  48. Kuo, F.E.; Sullivan, W.C.; Coley, R.L.; Brunson, L. Fertile ground for community: Inner-city neighborhood common spaces. Am. J. Community Psychol. 1998, 26, 823–851. [Google Scholar] [CrossRef]
  49. Bell, J.F.; Wilson, J.S.; Liu, G.C. Neighborhood greenness and 2-year changes in body mass index of children and youth. Am. J. Prev. Med. 2008, 35, 547–553. [Google Scholar] [CrossRef] [PubMed]
  50. (DOT) U.S. Department of Transportion, Federal Highway Administration. A Resident’s Guide for Creating Safe and Walkable Communities. 2008. Available online: http://safety.fhwa.dot.gov/ped_bike/ped_cmnity/ped_walkguide/residents_guide2014_final.pdf (accessed on 9 October 2015).
  51. [EPA] U.S. Environmental Protection Agency. EnviroAtlas—Durham, NC—Estimated Percent Tree Cover along Walkable Roads. 2015. Available online: https://edg.epa.gov/metadata/rest/document?id=%7BF341A26B-4972-4C6B-B675-9B5E02F4F25F%7D (accessed on 3 August 2018).
  52. Foley, J.A.; DeFries, R.; Asner, G.P.; Barford, C.; Bonan, G.; Carpenter, S.R.; Chapin, F.S.; Coe, M.T.; Daily, G.C.; Gibbs, H.K.; et al. Global consequences of land use. Science 2005, 309, 570–574. [Google Scholar] [CrossRef] [PubMed]
  53. (EPA) U.S. Environmental Protection Agency. BenMap Tool. 2017. Available online: https://www.epa.gov/benmap (accessed on 26 November 2018).
  54. (USDA) U.S. Department of Agriculture, Forest Service. iTree Suite of Tools for Assessing and Managing Urban Forests. 2014. Available online: www.itreetools.org (accessed on 15 April 2015).
  55. Langemeyer, J.; Gómez-Baggethun, E.; Haase, D.; Scheuer, S.; Elmqvist, T. Bridging the gap between ecosystem service assessments and land-use planning through Multi-Criteria Decision Analysis (MCDA). Environ. Sci. Policy 2016, 62, 45–56. [Google Scholar] [CrossRef]
  56. Fontana, V.; Radtke, A.; Fedrigotti, V.B.; Tappeiner, U.; Tasser, E.; Zerbe, S.; Buchholz, T. Comparing land-use alternatives: Using the ecosystem services concept to define a multi-criteria decision analysis. Ecol. Econ. 2013, 93, 128–136. [Google Scholar] [CrossRef]
  57. Bekele, E.G.; Nicklow, J.W. Multiobjective management of ecosystem services by integrative watershed modeling and evolutionary algorithms. Water Resour. Res. 2005, 41. [Google Scholar] [CrossRef] [Green Version]
  58. Crossman, N.D.; Burkhard, B.; Nedkov, S.; Willemen, L.; Petz, K.; Palomo, I.; Drakou, E.G.; Martín-Lopez, B.; McPhearson, T.; Boyanova, K.; et al. A blueprint for mapping and modelling ecosystem services. Ecosyst. Serv. 2013, 4, 4–14. [Google Scholar] [CrossRef]
  59. Turkelboom, F.; Thoonen, M.; Jacobs, S.; Berry, P. Ecosystem service trade-offs and synergies. Ecol. Soc. 2015, 21. [Google Scholar] [CrossRef]
  60. Burkhart, B.; Crossman, N.; Nedkov, S.; Petz, K.; Alkemade, R. Mapping and modeling ecosystem services for science, policy and practice. Ecosyst. Serv. 2013, 4, 1–3. [Google Scholar] [CrossRef]
  61. Albert, C.; Galler, C.; Hermes, J.; Neuendorf, F.; von Haaren, C.; Lovett, A. Applying ecosystem services indicators in landscape planning and management: The ES-in-Planning framework. Ecol. Indic. 2016, 61, 100–113. [Google Scholar] [CrossRef]
  62. Cochran, F.; Daniel, J.; Jackson, J.; Neale, A. Earth observation-based ecosystem services indicators for national and subnational reporting of the Sustainable Development Goals. Remote Sens. Environ. 2019. in review. [Google Scholar]
Figure 1. Estimated sites available to planting of new trees along road rights of way in Durham County, NC. Census block groups where one-meter landcover data are not available are shaded in grey.
Sustainability 10 04488 g001
Figure 2. Distribution of standardized scores of each singular benefit (SB) metric.
Sustainability 10 04488 g002
Figure 3. Choropleths of single objective case results (a) road emissions, (b) population vulnerability, (c) stormwater, and (d) walkability, with census block groups targeted for tree planting outlined in black.
Sustainability 10 04488 g003
Figure 4. Benefits provisioned by each single- and multi-objective case. SOCs are identified by the singular benefit (SB) used to define them (Emiss = road emissions; Vuln = population vulnerability; Storm = stormwater reduction; Walk = walkability), and MOCs are identified by the set of metrics used to define them. Colored bars represent the fractional benefit provision (FBP) for each SB. The grey bars represent FBP for gross benefits (GB). The black hashed circle represents the FBP for coincident co-benefits (CCB).
Sustainability 10 04488 g004
Figure 5. Choropleth of gross benefits (GB) provision, with census block groups targeted for tree planting according to MOC4 outlined in black.
Sustainability 10 04488 g005
Table 1. Road classification according to speed category and presence of high-emissions traffic (i.e, trucks), with 1 having the lowest emissions and 4 the highest emissions.
Road ClassificationSpeed CategoryTruck Route
12 (31–44 mph)No
22 (31–44 mph)Yes
31 or 3 (0–30 or 45+ mph)No
41 or 3 (0–30 or 45+ mph)Yes

