Adapting Bioretention Construction Details to Local Practices in Finland


Bioeconomy Research Unit, Häme University of Applied Sciences (HAMK), Lepaantie 129, FI-14610 Lepaa, Finland
Sustainability 2018, 10(2), 276; https://doi.org/10.3390/su10020276
Submission received: 18 October 2017
/
Revised: 18 January 2018
/
Accepted: 19 January 2018
/
Published: 23 January 2018
(This article belongs to the Section Sustainable Urban and Rural Development)
Abstract
:Bioretention is a method of storm water management that includes several processes following the natural hydrological cycle. Bioretention, or variations of it, include rain gardens and bioswales, infiltrates, filtrates, evapotranspirates, and help to store and manage storm water run-off. A bioretention cell retains water, removes pollutants, and provides water elements for urban green areas. Although bioretention is a promising method for multifunctional storm water management, its construction details should not be copied from other climatic areas. A direct application may dismiss local conditions, materials, and construction practices. This study aimed to adapt construction details for bioretention to Finnish local practices and conditions and to formulate bioretention constructions that balance water, soil, and vegetation. First, construction details were reviewed, then local adaptations were applied, and finally, the application and two variations of growing media in two construction depths were tested in a test field in Southern Finland. Sandy growing media allowed the efficient retention of water during the first year, but failed to provide vital growth. The use of topsoil and compost in the growing media improved growth, but held high electrical conductivity after infiltration. All the experimental cells in the test field showed activity during the melting periods, both during winter and spring. If bioretention plays a multifunctional role in urban design and engineered ecology, the design parameters should not only focus on storm water quantity, but also on quality management and vegetation growth.
1. Introduction
Urbanization, particularly urban densification, has increased the proportion of impermeable surfaces to precipitation. Precipitation and surface runoff have fewer possibilities to infiltrate, and the natural water cycle is disturbed. Furthermore, climate change has transformed local conditions so that annual precipitation has remained at the average level while heavy precipitation events have intensified [1]. The increase of impermeable surfaces and climate change mean that cities must study and apply new approaches to storm water management.
Sustainable urban drainage (SUDS), and other related concepts such as low impact development (LID) and water sensitive urban design (WSUD) have focused on this new type of storm water management [2]. SUDS applies to urban design, amenities, community enhancement, and vegetation as well as conventional quality and quantity management. Best management practices of these concepts enhance the visible water surface, detention, and slow infiltration after a rain event. Moreover, SUDS provides the possibility to enhance community-based activities, public participation, and the proportion of urban green.
Bioretention is one of the best management practices in SUDS. It is a method that seeks to infiltrate, retain, and filtrate storm water through a surface basin, constructed soil layers, and vegetation. This construction mimics the natural water cycle and is designed to reduce runoff volume, delay peak flow, and improve water quality. Vegetation has an essential role in bioretention as the root system improves infiltration while shoots and foliage promote interception and evapotranspiration. Although bioretention was developed to address storm water management, it also functions as an architectural element in urban design and creates a diverse habitat for green infrastructure in urban environments.
The urban environment generally provides harsh conditions for vegetation. The built environment is efficiently drained to keep surfaces dry and to prevent pools. The construction of built-up areas in Finland is based on frost and moisture protection by earthworks and introduces frost-resistant mineral soils, anti-capillary gravel, subsurface drainages, and thermal insulation plates [3]. These practices make very dry growing conditions for plants as the water is drained away. Dry growing conditions exist next to buildings, but are also near driveways, parking lots, patios, and walls. Simultaneously, the requirements for growing remain unchanged. Vegetation requires water, soil, nutrients, light, and a suitable temperature for growing. Water and nutrient stress are considered to be the most common problems in urban vegetation [4,5].
Concurrently, both a water surplus and drought affects urban vegetation. The solution for this challenge is not simple, as the quantity of water is not distributed evenly, but occurs as single large events. Vegetation, with the exception of wetland plants that endure anaerobic conditions, drown in standing water [6]. Furthermore, general drainage in the built-up environment increases the drought between rain events. These problems, along with uneven distribution of water, might be partly solved with vegetation integrated storm water management practices such as bioretention.
The multifunctional nature of bioretention is interesting for the idea of sustainable and compact cities. The applications of bioretention such as bioswales and raingardens, function on several scales and sites, form urban spaces, serve as a functional part of storm water management, and offer a platform for social activities in a neighborhood. Thereby, bioretention has a multi-functional nature that promotes the efficient use of space in dense cities and is an appropriate design element for urban areas.
This study aimed to develop construction details for bioretention that are applicable to Finnish conditions. These local conditions include a cold climate with an annual precipitation of 680 mm, and construction practices are based on efficient drainage and frost protection. The application of bioretention aims to include the sustainable use of materials and vital vegetation for a balanced approach between water, soil, and vegetation. The research questions were:
- (1)
- How should bioretention be constructed in a Finnish context in general? And specifically:What kind of growing media provides both sufficient storm water management and suitable growing conditions for vegetation?
- (2)
- How does this construction function during the first year for: (a) storm water quantity management; and (b) vegetation growth?
This study was undertaken in three phases to answer these questions. First, a brief review on the construction details identified the essential elements, materials, and functions in bioretention. Second, the possible variations in the construction details were defined in a Finnish context. Third, these variations were applied in a test field. A comparison of two different construction depths and two different mixtures of growing media answered the first question on a mesocosm scale (surface area of 5 m × 5 m). The answer for the second research question relied on monitoring the function in the test field after both construction, during the first winter, and after irrigating the cells to simulate a heavy rain event. Furthermore, the growth of the plant community was observed by the change in vegetation cover. This paper reports on the construction details and the results of the test field functioning after the implementation phase from a test field where different growing media and construction depths were monitored together with vegetation cover in comparable conditions.
2. Bioretention
2.1. Appearance
The appearance of a bioretention cell may vary from sharp edged planters next to streets to free forms of raingardens. In any case, bioretention is located in the low parts of the topography, forming a vegetated depression. Specifically, vegetation provides the possibility of integrating bioretention in urban design. Multi-layered vegetation evapotranspirates efficiently, but it is also a design element to make enclosures, frame the views, form a gradient, rhythm, barriers, and foci [7]. In general, SUDS are multi-functional in nature, meaning that they integrate storm water quality and quantity management to amenity and biodiversity goals in an urban context.
Echols and Pennypacker [8] classified the utility goals and the amenity goals of storm water management. Although they identified these goals for all types of storm water management practices, the amenity goals—like education, recreation, safety, public relations, and aesthetics—can be specifically applied to bioretention. Later, Backhaus and Fryd [9] developed criteria to evaluate the visual appearance and aesthetics of storm water projects that concentrated on the choices made during the design process. Infiltration causes a challenge when assessing bioretention and its amenity or aesthetics [8]. Infiltrated water is not visible, therefore, the connection to water is visible mainly through the existence of vegetation.
2.2. Functions and Processes in a Bioretention Cell
As stated by Davis et al. [10], the functions of bioretention follow flow and mass balance. The flow balance includes the inflow and outflow of the amount of water as well as the processes that function within a bioretention cell such as vegetation evapotranspiration. Within a bioretention cell, two main processes for quantity management occur: retention and infiltration. The main elements of water retention are the ponding area and pore volume in the construction layers. This storage provides retention capacity for the entire structure. At the bottom of the construction layers, water infiltrates into the subsoil and continues as baseflow or percolates to groundwater. The infiltration depends on the quality of the subsoil. Subsoils with fine components only allow for slow infiltration. In some cases, for example, close to building foundations or areas at risk of groundwater problems, the details of the construction layers may prevent complete infiltration in situ, and the drainage layer may instead convey the water to further sites for infiltration.
Quality control relies on different treatment and accumulation processes. Filtration, sedimentation, adsorption, plant uptake, and microbial degradation remove and degrade pollutants that are dissolved into storm water run-off from urban surfaces. The urban run-off may contain suspended solids, heavy metals, nutrients, hydrocarbons, and pathogens as the most common pollutants. The bioretention construction and its materials can be modified against the known pollutants to improve the capacity for pollutant removal.
The ecological functions and processes in bioretention have been receiving increased attention. Levin and Mehring [11] studied how bioretention systems restored man-made ecosystems to maintain biodiversity, provide wildlife habitats and corridors, and pollination services. This maintains the idea of viewing the biota of bioretention cells as dynamic and successional living units.
2.3. Construction Details
The bioretention design details use several soil layers with several functions. Performance is dependent on the construction including vegetation [12,13,14,15], ponding depth [16,17,18], the soil media composition [19,20,21], use of geotextiles [22], and media depth [16,21]. The main layers in bioretention provide filtration, retention, infiltration, and growing conditions for vegetation. Figure 1 presents a schematic diagram of bioretention that follows the most commonly used construction layers.
There are several disciplines studying bioretention, and therefore the approach to bioretention vary from technical water engineering for quantity or quality concerns to urban biodiversity studies. Figure 2 summarizes some of the multidisciplinary research concerning details in different construction layers in general and in cold climates. Construction details for cold climate focus on limitations of nutrient removal [23], dimensioning [24], material specifications [12,25,26], and the functioning of coarse [12,24,26,27] and fine grained growing media [28,29]. The aim of this summary was to provide the necessary knowledge for practical implementation, and to stress the balance between water, soil, and vegetation.
Laboratory experiments tend to use multiple soil layers and materials [14,32] and often lack vegetation, while field experiments are based on simplified construction layers with vegetation, but might lack the possibility of comparability [12,19]. The main concern regarding the balanced vegetation, soil, and water approach seems to be the growing media that functions as an interface between the vegetation growth and water infiltration [31]. The growing media should infiltrate the efficiently runoff volume for the needs of water quantity management, but for vegetation growth, it should hold water for later use in dry periods. Furthermore, storm water quality management generates contrasting aims in growing media and its nutrient content. A bioretention cell should not leach nutrients as they are needed for growth. The proportion of clay and organic matter are the key parameters for a balanced approach in growing media [22].
Organic matter forms through an amendment of compost or peat, and therefore decomposes over time. Decomposition subsequently causes the leaching of nutrients and pollutants. At the same time, organic matter is an important carbon source for micro-organisms that support bioretention functions and provide water holding capacity for the growing media. As Ewing [20] determined, some ambiguity exists in the guidelines defining the proportion of organic matter, but it is not always clear if the guidelines define the proportion of organic matter either by volume or by mass.
Organic matter is a topic that also varies in the recommendations for the use of topsoil in growing media. The use of topsoil aims to include local materials and the possibility of adding biologically active soil to the growing media. However, the detailed specifications for topsoil are impossible to describe as the qualities vary from site to site and from one country to another.
The hydraulic performance and retention time can be adjusted by the clay content. Too high a proportion of clay reduces soil permeability and soil pore size, which reduces the retention capacity of the whole system. Additionally, the high clay content causes surface cracking during dry weather, and these cracks provide a bypass for the treatment layers as the first run-off gathers in the ponding areas.
Vegetation plays an essential role in bioretention, although the growing conditions vary significantly between drought and standing water. Bioretention is not intended to be used as a wetland, and the bioretention cells are too dry for many wetland plants. Bioretention is designed to receive runoff, and therefore the vegetation must be able to withstand brief periods of inundation. Dryness depends on the water volume that it receives, how quickly the garden drains, and how frequently it rains. Rain gardens are wet only during and immediately after rain events [30].
Paus and Braskerud [12] divided planting strategies into two main approaches. The first is a traditional park design with a high maintenance requirement, and the second is a natural design adapted to local conditions. This kind of classification addresses the idea of new ecosystems that are human-built, modified, or engineered patches within the urban matrix [11]. A bioretention cell and its vegetation should provide hardy and long-lived vegetation for the urban environment.
3. Materials and Methods of Experimental Test Field in Lepaa, Finland
We developed two bioretention construction details to be implemented and compared in a test field. These two variations differ in the specification of growing media and total construction depth (Figure 3). One of the main objectives was to arrange conditions that allowed the practical construction challenges to meet and provide sufficient space for establishing vegetation communities.
3.1. Finnish Conditions
Climatic conditions in Finland are typical of cold climates. Due to the Gulfstream, the temperatures in Finland are higher than the geographical location would indicate. Monthly averages range from −9.3 °C in January to 15.6 °C in July. Annual precipitation ranges between 500 and 650 mm. Snow covers the southwest corner of the country for three to four months, whereas the northern parts are covered for seven months [33]. The frost line in clay soils reaches a maximum of 100 cm in Southern Finland, but on average stays below 40 cm [34].
The impact of climate change will increase the average temperature 1.5–2 times faster in Finland than the global average [35]. In the future, temperatures—especially in the winter—are expected to increase, prolonging the growing season, and more rain instead of snow is expected [1]. The period for snow coverage will shorten and the frost in soil will decrease. The probability of heavy rainfall will increase throughout the seasons, and by the end of this century, only Northern Finland will have snow coverage [36].
New developments concentrate on a few city regions in Southern Finland, and 90% of housing production was located in the 14 biggest city regions in the country in 2015 [37]. As the new developments in the growth centers already occupy moraine and gravel soils, the ongoing housing construction is forced to move towards clay soils. This defines the foundation requirements for buildings, but also for landscaping and provides possibilities for infiltration.
Aggregates constitute the basis for construction materials such as concrete and asphalt, which are used for groundwork and as drainage elements for streets, roads, and buildings. They are also an essential part of landscape construction in green areas. Finnish aggregates originate from bedrock, ridge formations, and recycled materials. In certain areas, like the province Uusimaa where the growing metropolitan areas are located, nearly all ridge-based aggregates are already used for other purposes or are important for ground water resources. This means that aggregates need to be based on bedrock or be transported from a distance outside the province [38].
The use of peat and peat production in Finland differs from Central European practices and values as peat production and use has been traditionally used for 125 years. The main proportion of peat production is used for energy and about 10% is used for horticulture, landscaping, and other purposes. As a growing media or amendment, peat provides good value for its water holding capacity and is a sterile source of organic matter [39]. However, peat production affects the environment in terms of changes to the landscape, watershed qualities, dust emissions, and noise. The use of peat is also being discussed in light of carbon emissions and its potential as a renewable resource. Recent dichotomy in the debate concentrates on the effect to the political economy, the economic potential of peat land resources, the effects of peat production for water systems, and national energy self-sufficiency.
3.2. Development of Construction Details and Growing Media to Local Conditions
There have been a few bioretention studies in Finland that have adjusted our development of construction variations. Sänkiaho and Sillanpää [32] concentrated on the retention of pollutants in different construction layers across different seasons in a field of lysimeters. They used a mixture of sand and soil in a 1:1 ratio for growing media that was one of several layers at a 195 cm construction depth. The result of this study stressed, among other things, the role of vegetation if construction layers included fines, as the vegetation seemed to improve infiltration.
Bioretention is also studied in Finland at the field scale for snow piling and melting area [40] and street side [41,42]. The total construction depths in these experiments were 100 and 125 cm. However, the qualities of the growing media were not the focus of these studies, although construction included vegetation.
In this study, an alternative construction depth was brought to the test field (Figure 3). The total depth affects construction costs, the volume of materials, and their required transportation to and from a site. On the other hand, too shallow a construction would be impeded by frost that would complicate the infiltration during winter and springtime melting. In fact, the construction depth affects the use of materials, construction practices, and hydraulic functions during the cold season, and possibly vegetation growth.
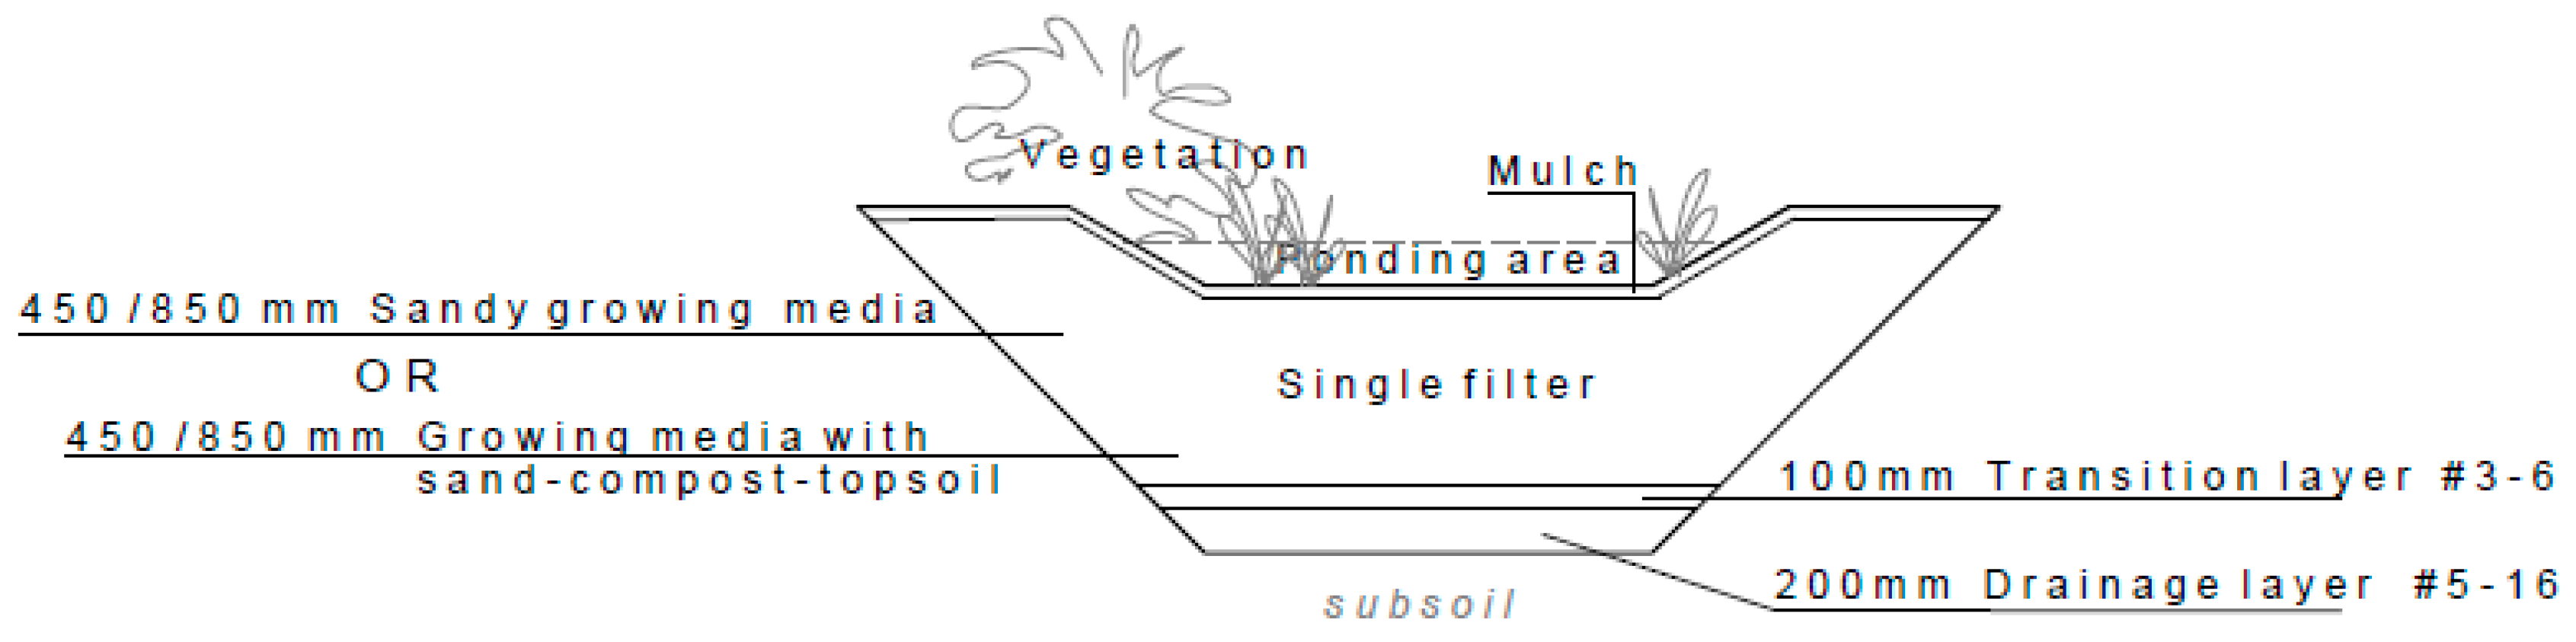
The development of construction details in this study followed Hsieh [20] who proposed single media structures. This construction combined the growing media and filter layers, and had several advantages both practically and for maintenance. For landscape construction, several thin layers are difficult to create with an excavator and difficult to control for project management. The two variations in this study followed the idea of single filter construction. Under the single filter media, a transition layer was used instead of a geotextile, as fines have been found to clog geotextiles. In practice, replacing a clogged geotextile is not difficult, but would disturb vegetation and even require regular replanting. For that reason, geotextiles were not used in this experiment (Figure 3).
The drainage and transition layer materials used a grain size commonly available in Finland. However, the growing media in the single filter layer had to be developed and mixed from different sources. For growing media recommendations, there are two different main paths, as presented in Figure 2. It was not clear which path to use for the Finnish application as studies in cold climate have followed both paths. The experiments already completed in Finland aimed to control quality, and the vegetation or growing media was not the main concern. To this end, two different growing media were identified and used in the test field. The specifications for the growing media are described in Figure 4. A local soil supplier mixed the sandy growing media (growing media A) to follow the path of engineered sandy soil presented in Figure 2. This specification is repeatable and commercially available, but based on sandy soils that are either or are becoming rare near the growth centers in Finland. The organic matter originated from a non-commercial pile of composted tree bark that included earthworms. Typically, organic matter originates from peatlands in Finland, but in this study, peat was not used due to its controversial nature and uncertain future of regulation. The proportion of organic matter was measured and growing media A included 2.2% of organic matter by mass.
The other mixture (growing media B) was mixed at the site from local components. The mixture was created by the volume of earthwork buckets following typical on-site construction practices. The final mixture included, by volume, one-quarter sand #0–8, one-quarter fine sand #0–0.6, one-quarter leaf compost, and one-quarter topsoil from a nearby agricultural field. The proportion of fine sand was added to the final mixture, as the local sand #0–8 is meant for construction purposes and is low in fines. The leaf compost was well composted, but included some bigger tree pieces and plastic trash that were removed before installation. To collect the topsoil, the topmost surface of the site was peeled, but the proportion of topsoil still included weed roots along with earthworms. This final sand-compost-topsoil mixture included 5.3% organic matter by mass. The difference between the grain sizes of the growing media is shown in Figure 4. The figure also includes the distribution in grain size from another local study that used the same approach for sandy growing media. That study determined that the soil they used was too low in fine particles for vegetation growth [43].
Numerous possibilities exist for arranging the plant combination for bioretention. In this study, various plant species were not monitored separately, but rather in the form of a plant community. In order to keep the research design clear, the same plant combination was planted on all cells with growing media. Two criteria were created for the plant selection. First, the combination had to have structural diversity with several canopy layers. This criterion enabled the use of the bioretention as an element in urban design to form spaces, edges, and barriers (Table 1). Second, the combination had to be created from a variety of species to provide species diversity. The plant selection was based on a study that tested the tolerance of some plant species for short interval flooding [43], and from that study Alnus glutinosa, Betula pubescens, Lythrum salicaria, Picea mariana, Rhododendron canadense, and Salix purpurea ‘Gracilis’ were used in this plant combination.
3.3. Test Field
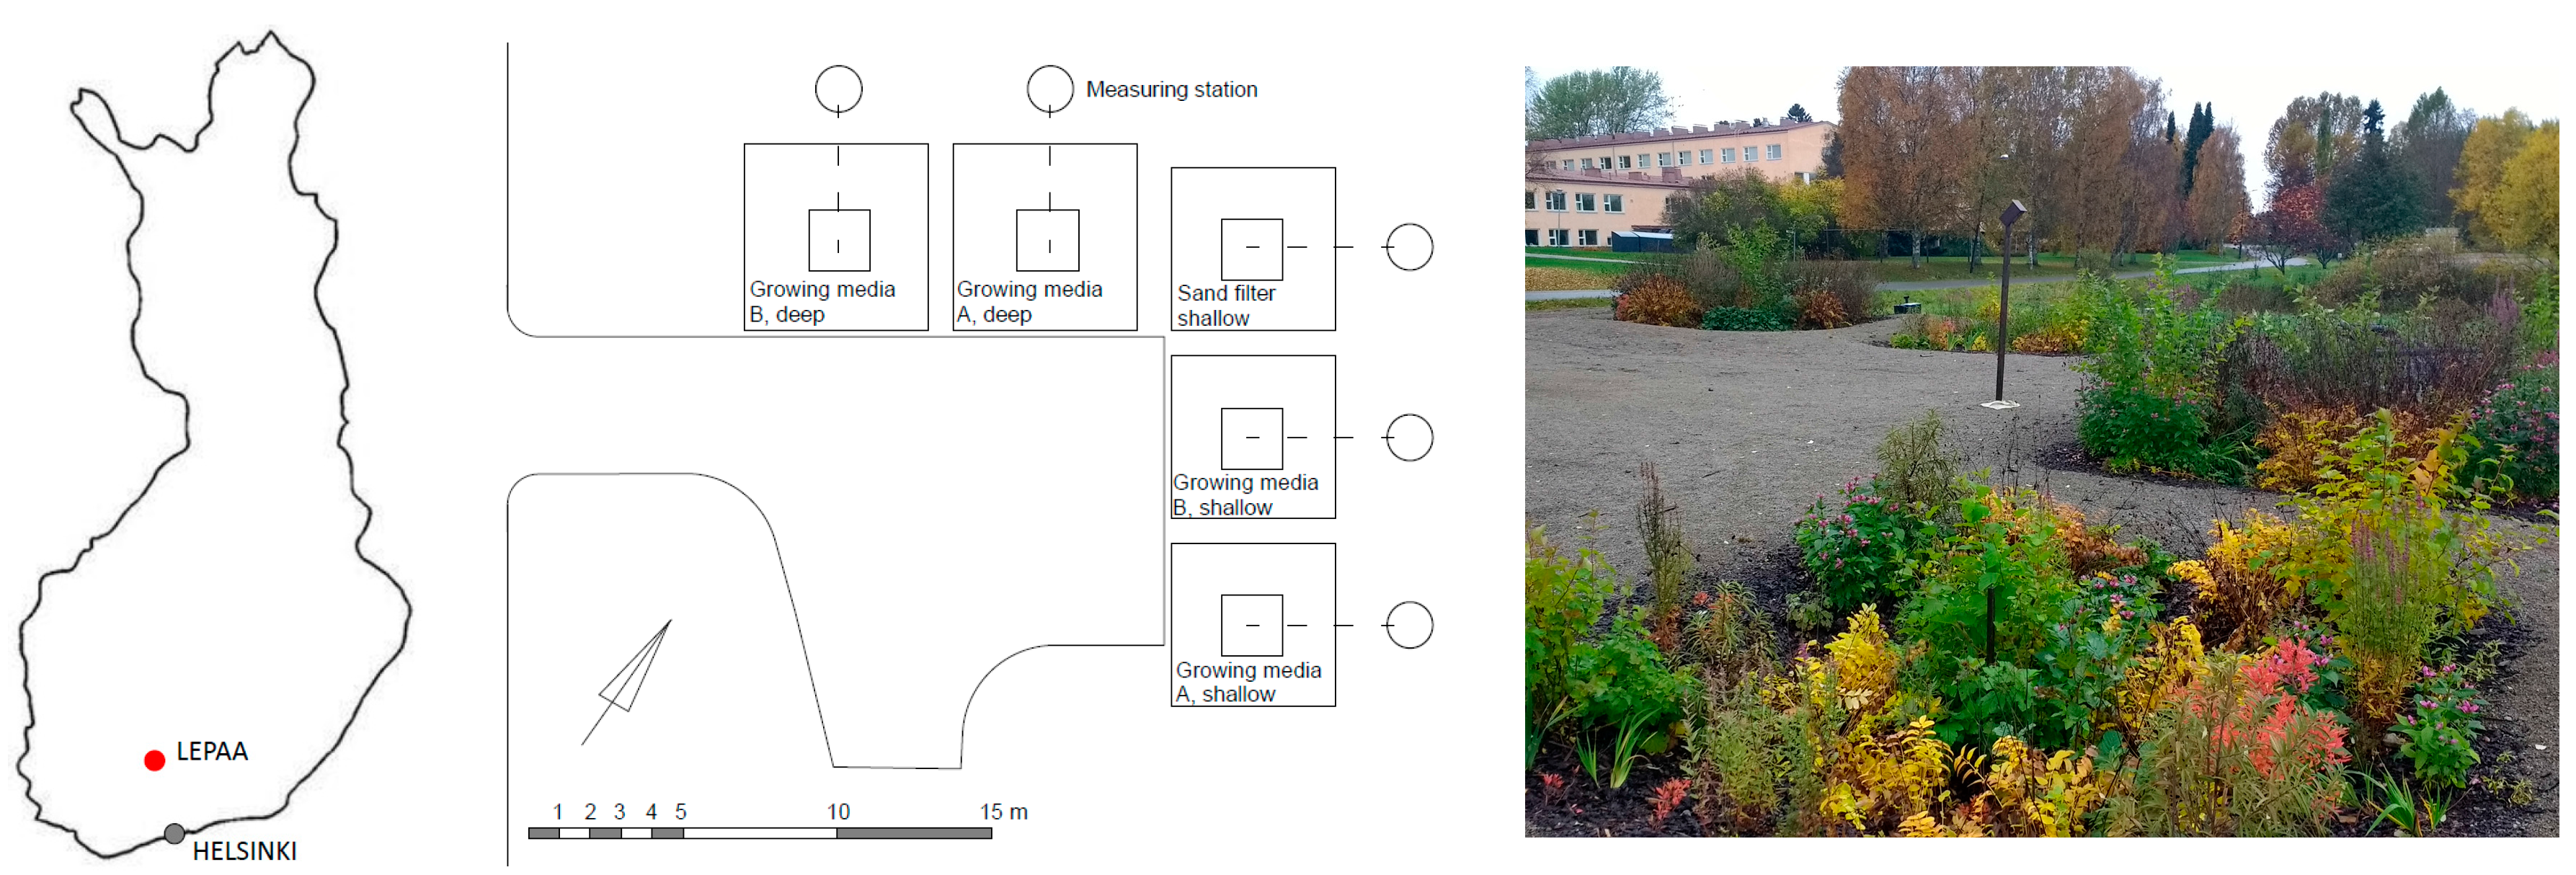
The test field was located outdoors and received local weather conditions such as evapotranspiration, natural precipitation in local actual conditions, temperature, and infiltration. It included five separate cells with two different construction depths. This enables a research design with a control cell and two soil mixtures with two construction depths at 800 cm or 1200 cm. All the cells were located below the surface level to prevent atypical frost from the side. Each cell was isolated from the surrounding ground with a rubber layer to collect the infiltrated water. A drainage pipe collected the water at the bottom of every cell and channeled it to the measuring station. Measuring stations and their data services were provided by EHP Technique Ltd. (Oulu, Finland) Surface levelling around the cells prevented natural surface runoff into the cells, although runoff could be artificially organized through irrigation. In addition, the closest weather station of the Finnish Meteorological Institute was 100 m away from the test field. This meant that both the input and output of the water amount was continually measured in the experimental cells.
The bottom size of all cells was 2 m × 2 m. The surface size varied around 5 m × 5 m as the edge slopes followed a tilt of 1:1 and two different depths were used. The used edge slope followed local implementation practices. The ponding area covered the same area as the bottom of the cell, where the elevation of overflow allowed a ponding depth of 20 cm. All the cells had the same vegetation combination on the surface. The control cell was a sand filter without vegetation. The test field layout and the location of experimental cells are presented in Figure 5.
3.4. Test Field Experiments
3.4.1. Heavy Rain Simulations
The event-based hydrological functioning of the cells in the test field was measured during and after simulated heavy rain events that were executed by irrigation. This method allowed the study of the functioning of the constructions in extreme events as scheduled, to help expedite the research process.
All the cells received identical irrigation at the end of the first growing season. In this first year, the heavy rain simulations emulated 5.5 mm of heavy rain in 30 min, which may be repeated every second year. Here, we assumed that the runoff was collected from an impervious area of 227 m2 that corresponded to 1250 L of irrigation for every cell. The assumed impervious area was approximately the same area of private garden roof areas and driveway or public parking areas in a residential area.
This irrigation procedure was repeated once a day for three days in two sequential weeks. During this time period, there was no precipitation; consequently, the irrigated water was the only water volume the cells received. The irrigated water volume was measured with a water meter and outflow ran continuously through the automatic measuring stations. Measuring stations saved the data of discharge (L/s), conductivity (µS/cm), and temperature (°C) every 10 min. The irrigation start time was recorded to study the delay between the water input and the beginning of the outflow in different cells.
In the first year, the irrigated water for the heavy rain simulations came from a nearby stream, and the electrical conductivity was measured before every irrigation session. The used water quality was not typical of storm water in urban areas. However, the change in electrical conductivity between the input and outflow provided a general overview on the quality management.
3.4.2. Functioning During Winter
The last heavy rain simulation took place at the beginning of October, and after that, the test field was not irrigated and was prepared for winter 2016–2017. During the winter period, the test field received only natural precipitation. The snow coverage and temperature data were provided by the Finnish Meteorological Institute and the frost depth data by the Finnish Environmental Institute. The frost depth data originated from the Pälkäne station (that is located 30 km north of the test field) and did not precisely describe the detailed situation in the cells. However, it described the general frost situation for the winter.
The automatic measuring station monitored the outflow of the cells during the whole wintertime and especially during the melting period. Water volumes were relatively low as only the natural rainfall stood on the cells.
3.4.3. Green Coverage
The plant material came from local nurseries in May 2016. All the root systems were washed and plants were replanted into the growing media used in the experiment. After replanting, the plants were grown in a greenhouse to ensure a functioning root system. Plants were planted into experimental cells at the beginning of June 2016.
The growth of vegetation was mapped and estimated by photographs and visual observation. The photos were imported to a CAD-based program and then scaled by the stakes defining the bottom area of the cells. Then, the green coverage of the cells was drawn, measured, and presented as a proportion of the total area. The green cover included all parts of growing vegetation in the bottom area of the cells, and was not separated by plant species. On that account, the monitoring concentrated on plant communities and their coping with different soil mixtures.
4. Results
These results concentrated on the monitoring and functioning of the cells after the construction phase; describing the initial performance of bioretention cells in the establishing phase. This timeframe excluded the possibility of discussing compaction, clogging, and change in hydraulic conductivity processes, as well as the long-term role of vegetation. However, these results compared construction depths and growing media in local conditions, their impact on bioretention retention capacity for event-based precipitation and wintertime functioning, and the change in the green coverage of the vegetation immediately after the construction phase.
4.1. Heavy Rain Simulations
The results of heavy rain simulations were based on six irrigation sets and the outflow patterns in a time series to evaluate lag time and volume reduction. The starting point of outflow after irrigation varied most between growing media B and the sand filter. The lag time in the sand filter was on average 22 min, whereas growing media A in a shallow cell was 70 min, and in a deep cell was 127 min. The lag time in growing media B was in a shallow cell was 30 min, and in a deep cell was 37 min. This delay corresponded with the cell’s capacity to postpone the beginning of outflow as one component in a site scale storm water management.
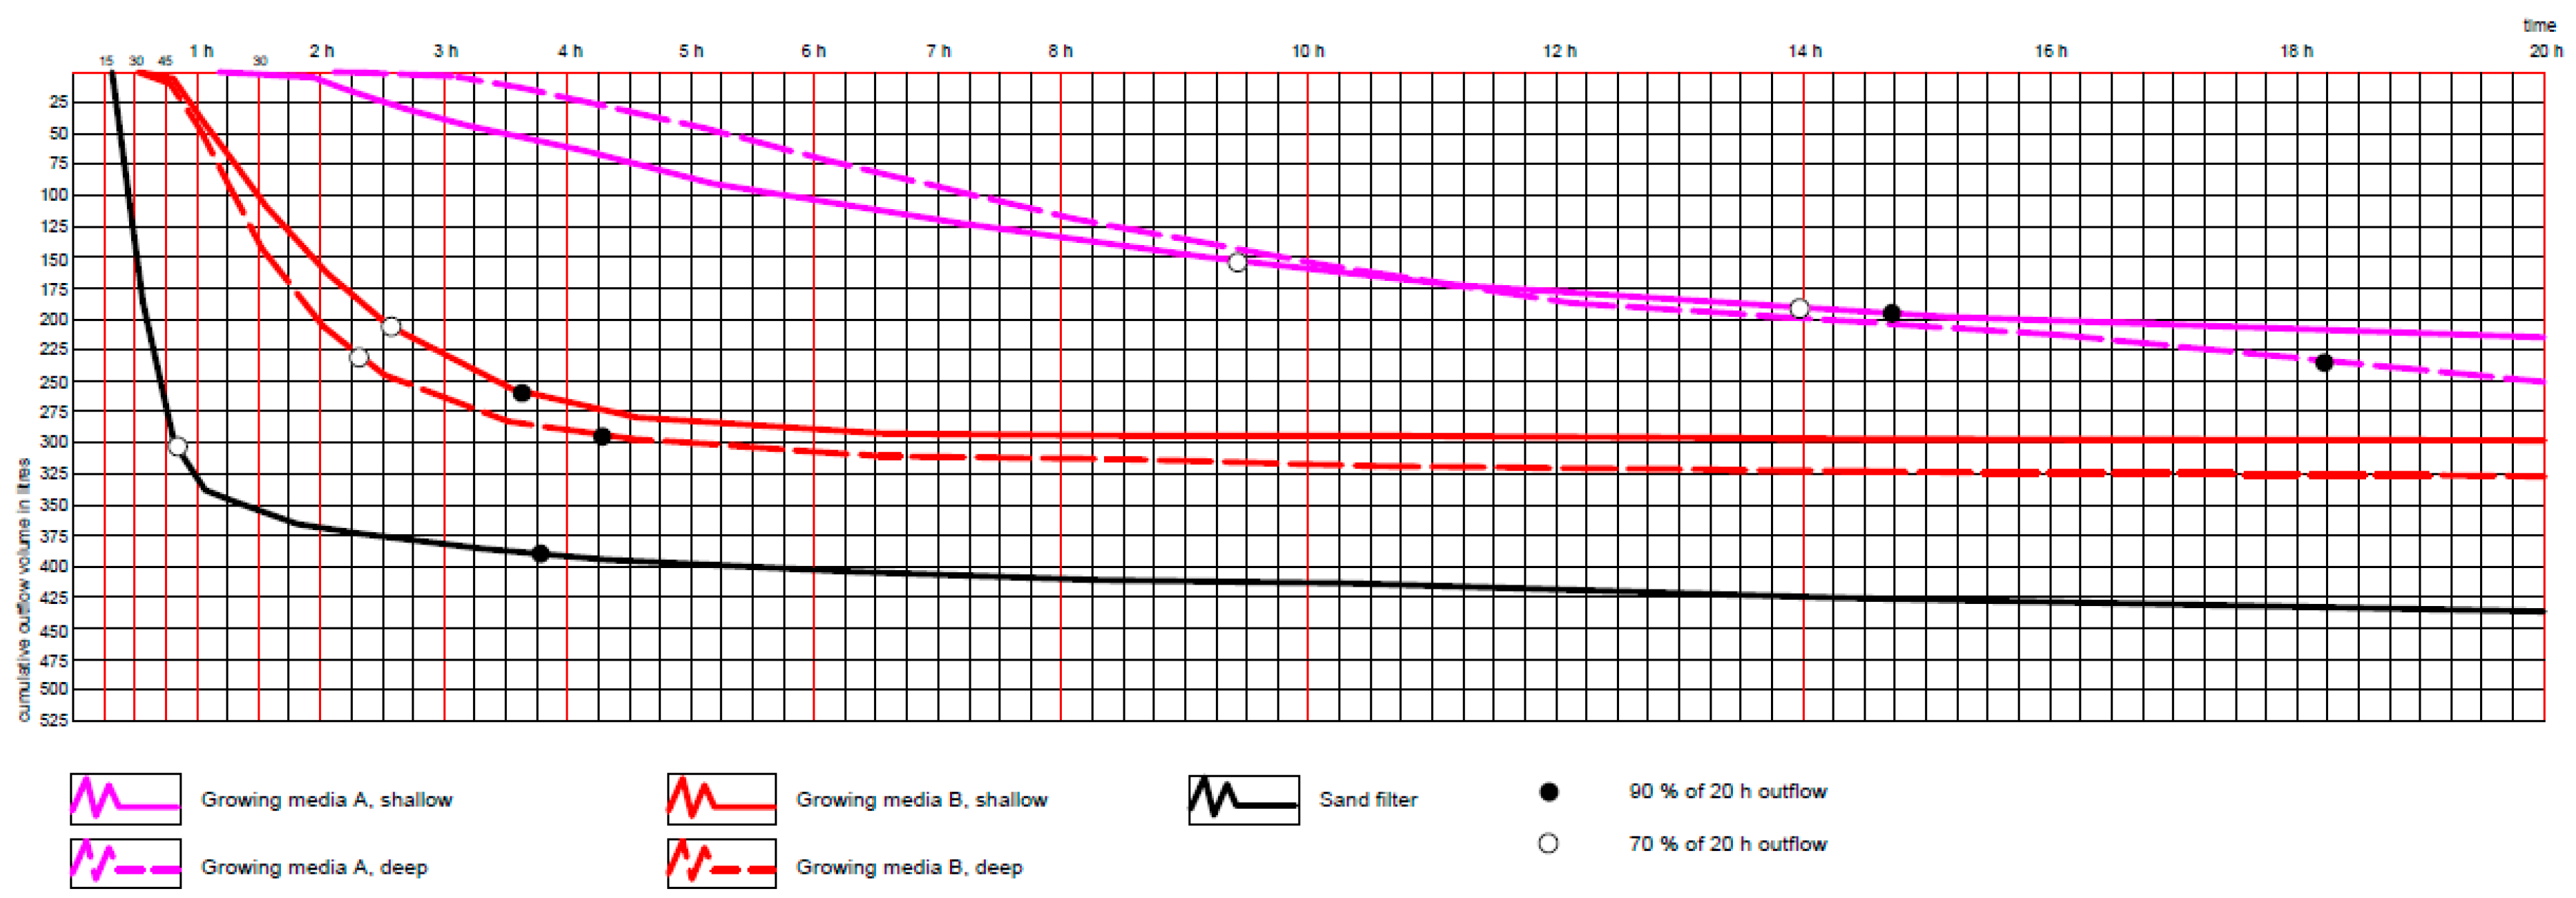
The outflow pattern is presented in Figure 6. There, the shape of the outflow curve was different for the two types of growing media, and the depth of construction appeared to make no clear difference. The sand filter was the first cell to allow outflow, and the outflow continued rapidly so that 90% of the 20 h outflow volume was realized in less than four hours after the beginning of irrigation. The cells with growing media B roughly followed the same timeline allowing for 20 h outflow, but the total volume was 100 L lower and the beginning of the outflow was more gradual. The longest water holding was seen in both cells of growing media A. The cell with shallow growing media A allowed notable outflow after only two hours, and in the deep cell, after three hours. An apparent difference between the two types of growing media relied on the point in time when they allowed 90%, or even 70%, of the 20 h outflow volume (Figure 6).
Unexpectedly, growing media B showed better water holding capacity in the shallow cell than in the deep cell. However, the shape of these curves and the total water volume retained in cells was similar. Notably, these simulations occurred after the construction phase and at the end of the first growing season, and therefore the structures were not yet established.
The main differences between the cells were on the outflow curves in the first 8–10 h. Two hours after the beginning of irrigation, the cells with growing media A had not started to outflow, but the sand filter had outflowed 86% and the cells with growing media B had outflowed less than 70% of the 20 h outflow. Five hours after irrigation started, growing media B and the sand filter had already allowed more than 90% of the 20 h outflow, but growing media A was still in the early stage of the outflow pattern.
Volume reduction was monitored for 20 h after the irrigations. Reduced outflow volume was measured from the bottom of the cells as no overflow existed. As the total volume of input water was 1250 L for every cell, the sand filter held 65%, the shallow growing media A held 83%, the deep growing media A held 78%, the shallow growing media B held 77%, and the deep growing media B held 74% of the water. The major outflow occurred during the first four to six hours for the sand filter and growing media B. However, growing media A allowed outflow still after 14.
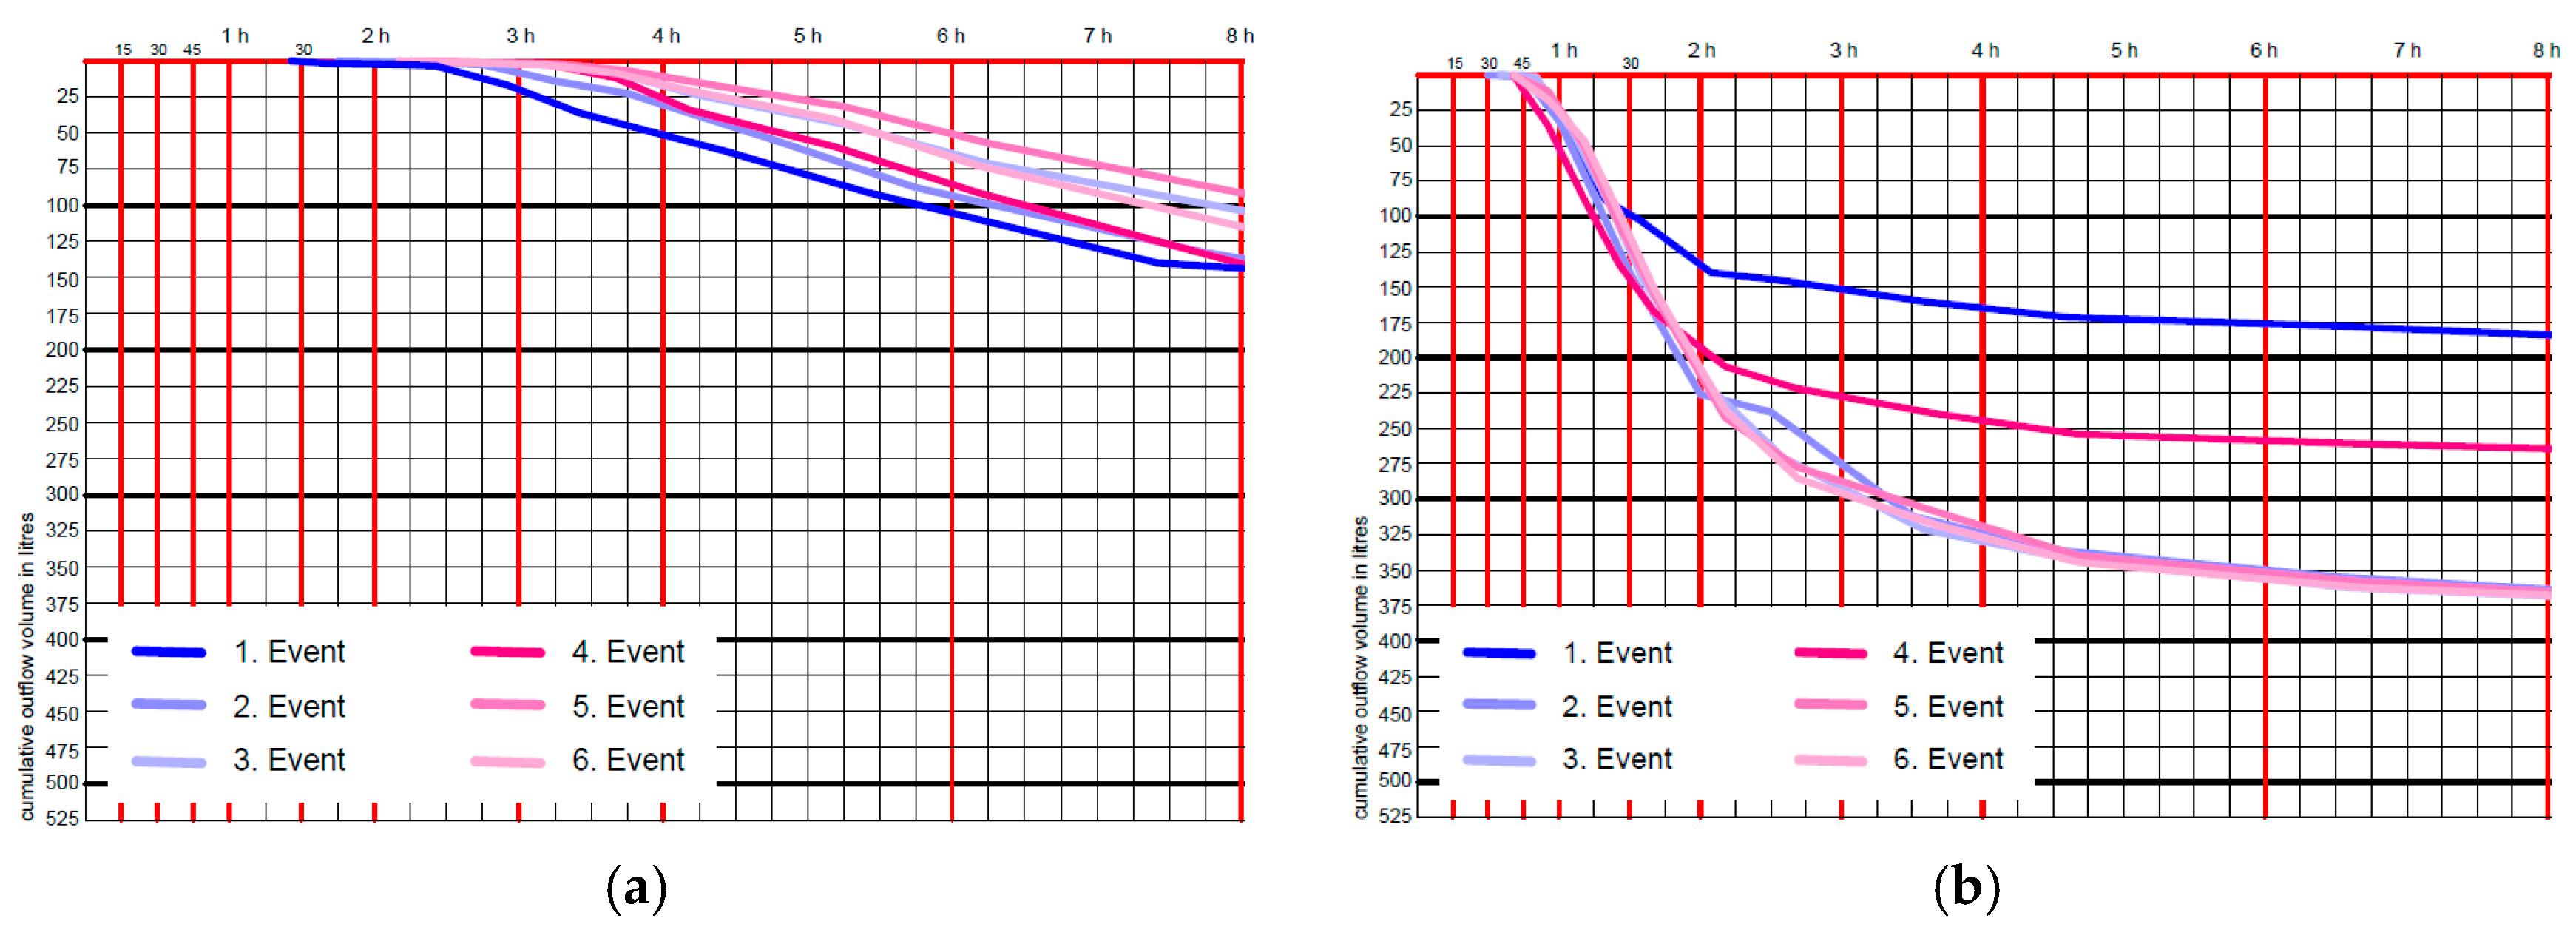
The differences between the repeated single simulations within certain growing media showed a change in the outflow pattern in saturated and non-saturated conditions. Figure 7 presents the outflow patterns for eight hours after irrigation. The three first irrigations (blue lines) occurred on consecutive days and the second set of irrigations (red lines) occurred the next week. Between these irrigations, there was no precipitation. The first outflow curve showed a higher water holding capacity than the second and third. This demonstrated that growing media B allowed more outflow when its structure was saturated. However, this cell appeared to hold water relatively well in non-saturated conditions, even if the construction was completely saturated in the previous week. In contrast, the outflow curves of growing media A did not vary between single simulations.
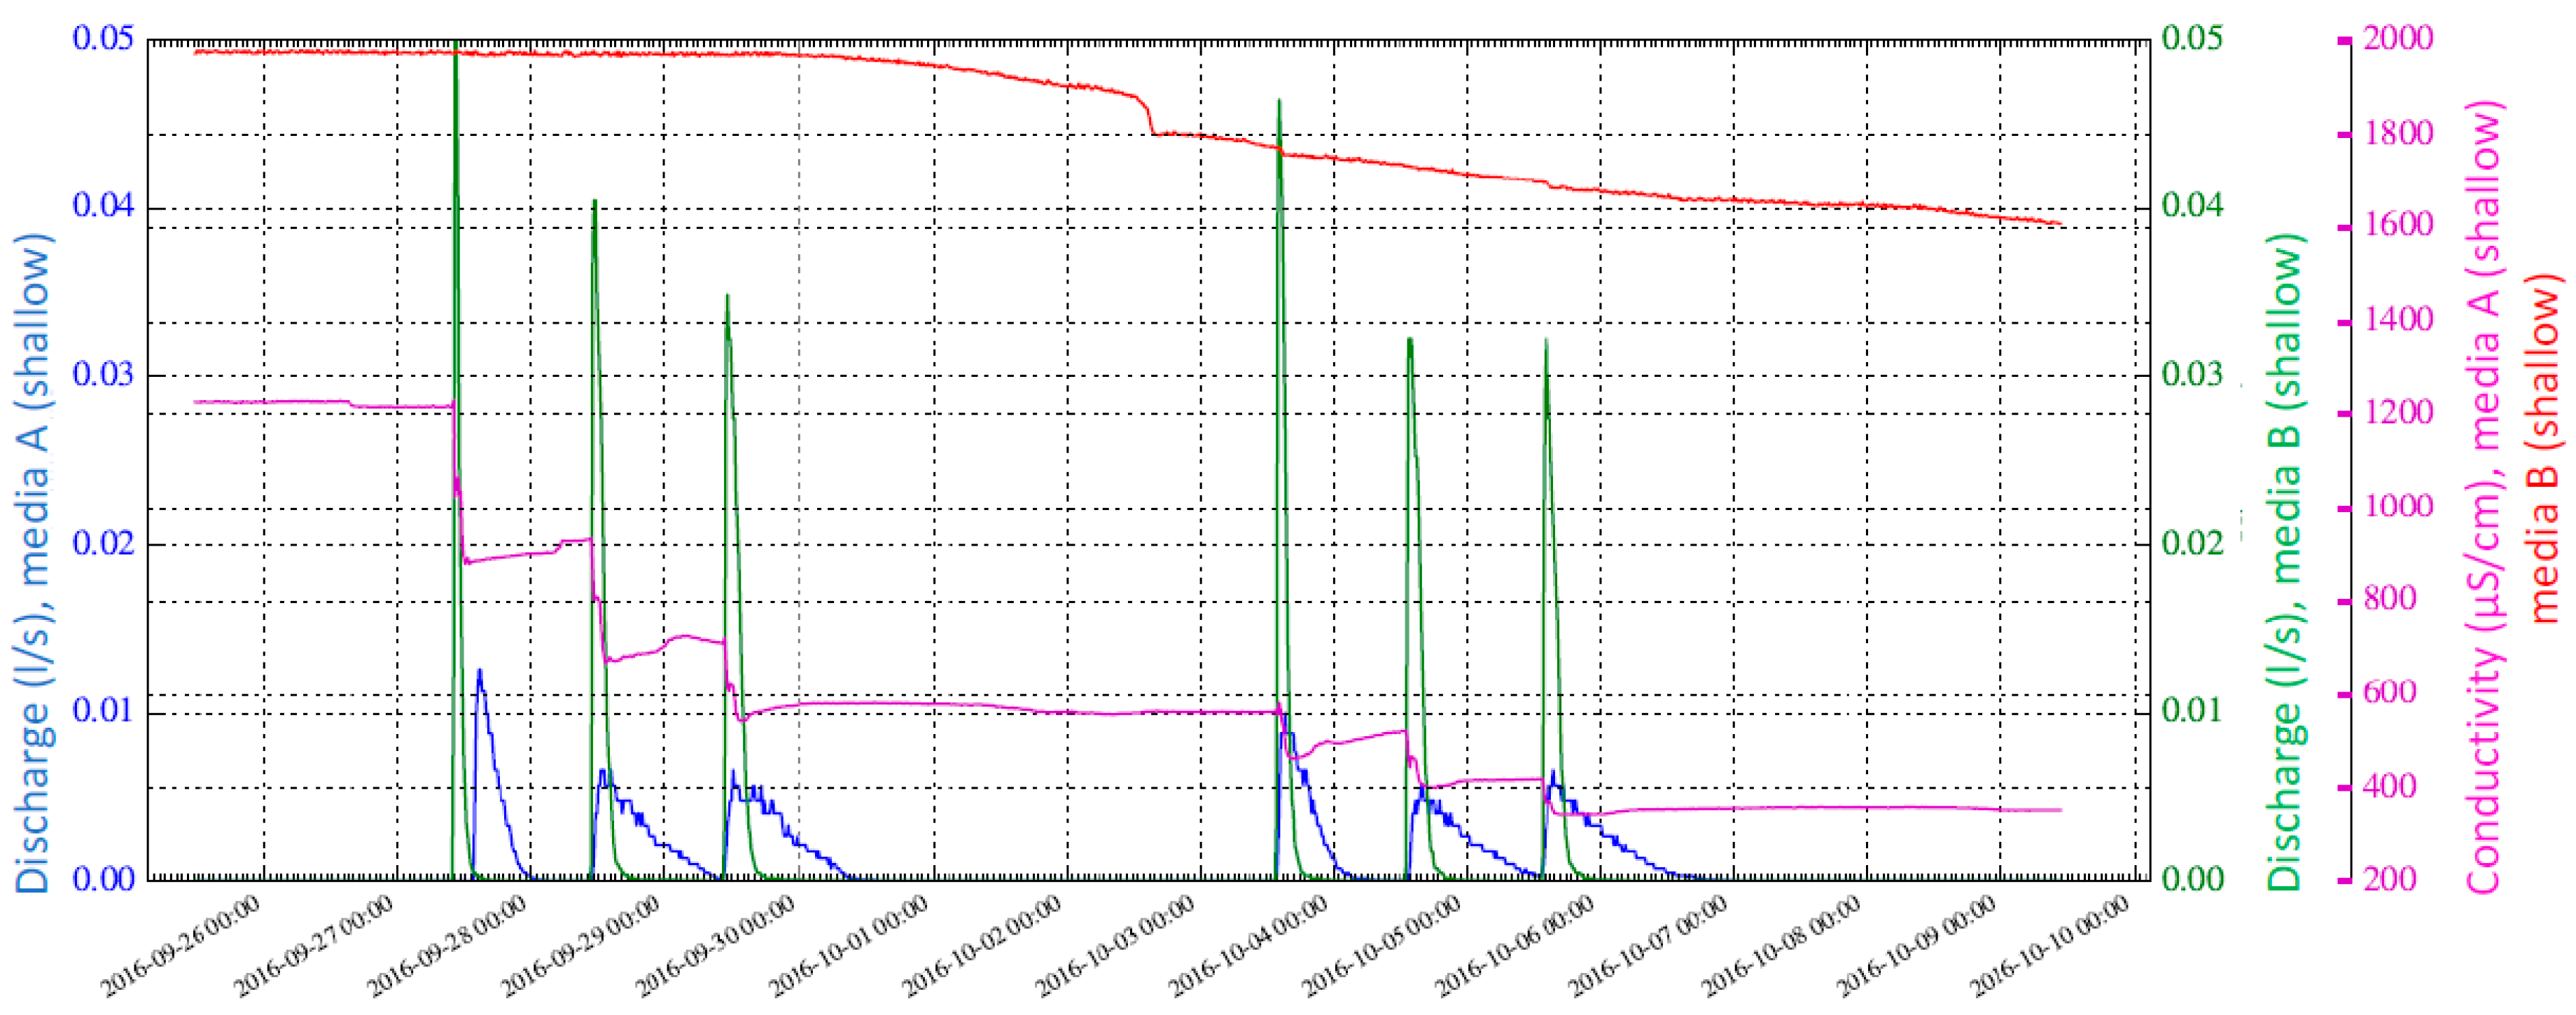
The effects of the type of growing media on the quality of the outflowing water were examined generally by electrical conductivity. These repeated irrigations demonstrated the media’s capacity to retain nutrients. The electrical conductivity of the irrigated water varied between 121 and 125 µS/cm. Growing media A had low organic matter and nutrient content, and its discharge conductivity charge decreased after every irrigation (Figure 8). Notably, cells with growing media A were fertilized during the growing season due to the needs of the vegetation. Although the starting level of conductivity in growing media A was lower than in growing media B, the leaching seemed to be higher in growing media A. Growing media B had a more delayed and gentle change in conductivity rates after heavy rain simulations.
4.2. Functioning in Cold Conditions
Actual cold weather conditions in the test field provided a framework to monitor the cells’ functioning during freezing and melting in the winter of 2016–2017. Compared to the average, this winter had an early start and a late end at the test field site. Table 2 shows that on average, there was less precipitation and temperatures were higher than in 1981–2010 [32].
The last heavy rain simulation occurred at the beginning of October and after that, only natural precipitation reached the cells. Freezing conditions began at the beginning of November and the ground was covered with snow shortly afterwards. However, during the winter season there were two warm periods when the snow coverage melted before the freezing conditions continued. These two periods, in addition to the melting period in spring, provided the possibility to study the cells’ outflow patterns after the construction phase.
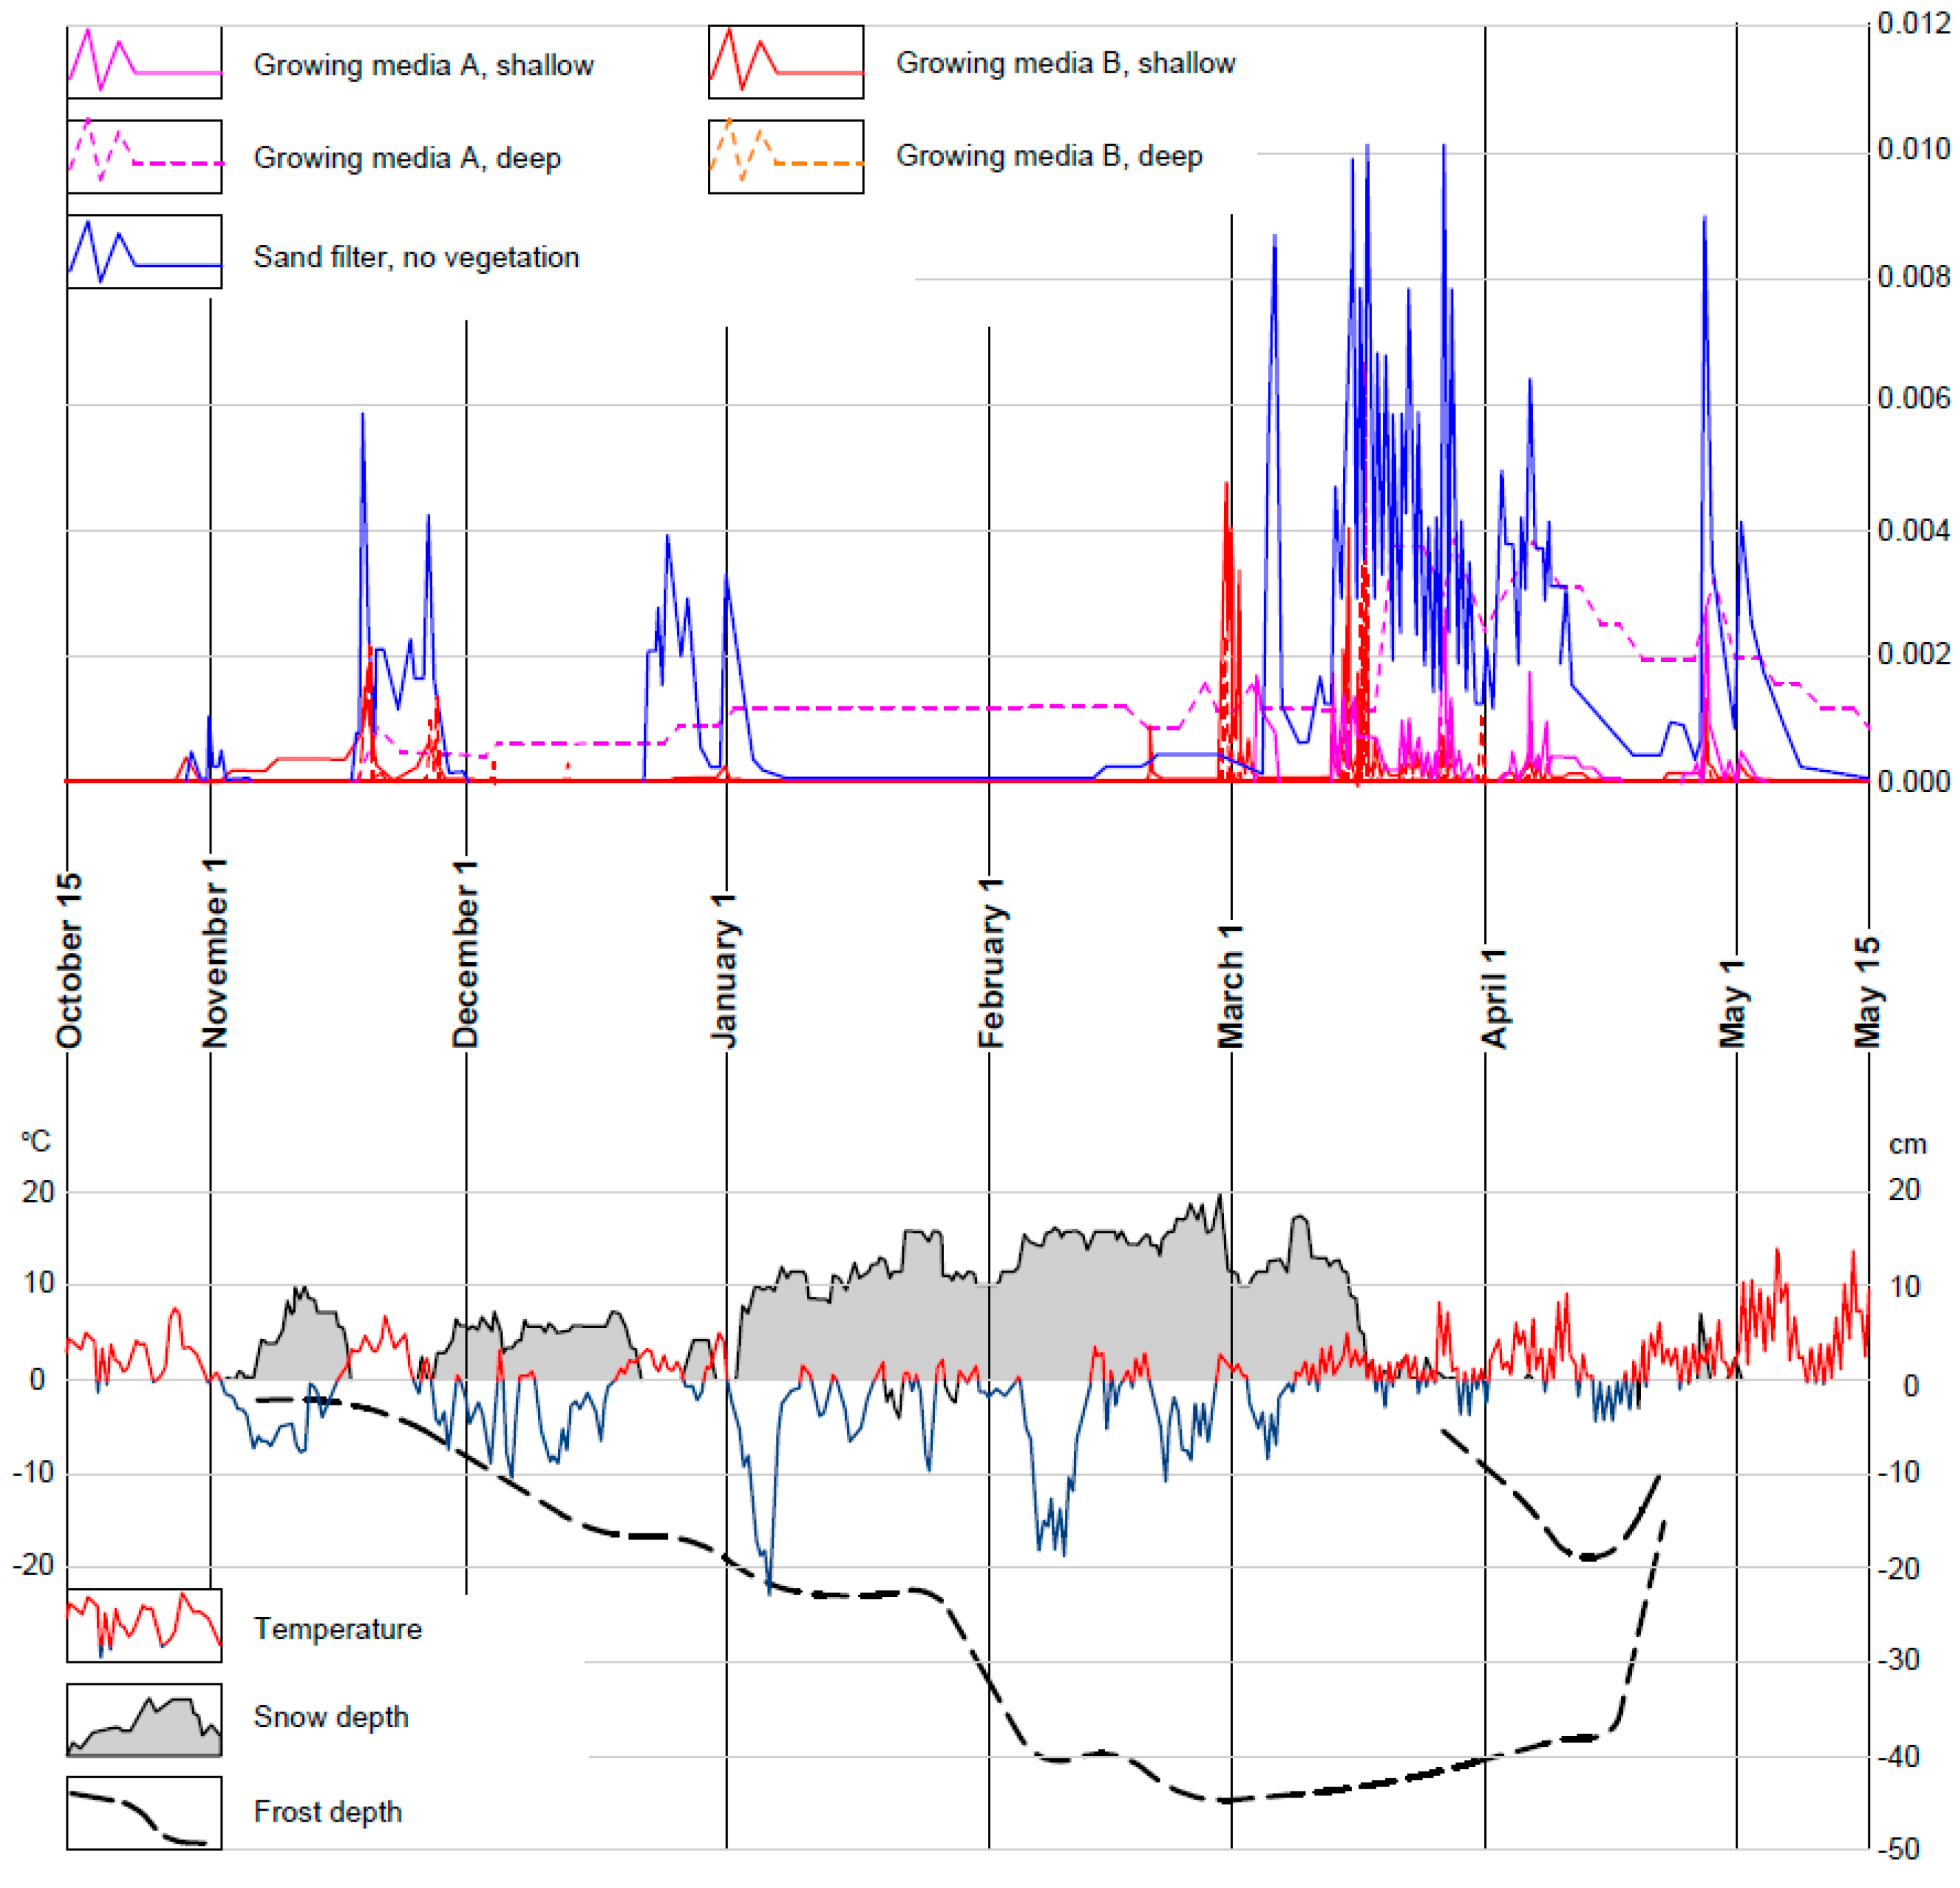
The first melting period took place in mid-November when the frost depth reached a few centimeters. Outflow curves during that melting period showed that all the cells discharged to some extent. The second melting period happened in the second half of December, and the frost line at that time was more than 15 cm. This second melting period showed discharge activity mainly in the sand filter. However, this does not signify that the others were not active, but rather that there was no infiltrated water to discharge (Figure 9).
On average, the temperature rose to above zero in March and snow melted by mid-March. All the cells showed some levels of discharge before the snow melted even while frost remained in the ground. The sand filter showed the highest recharge during the winter. Growing media A had a high capacity to retain water in winter. The recharge pattern in growing media B was interesting as it appeared to have some outflow activity during the mid-winter melting periods and outflow was relatively early in spring when compared to growing media A.
4.3. Green Coverage
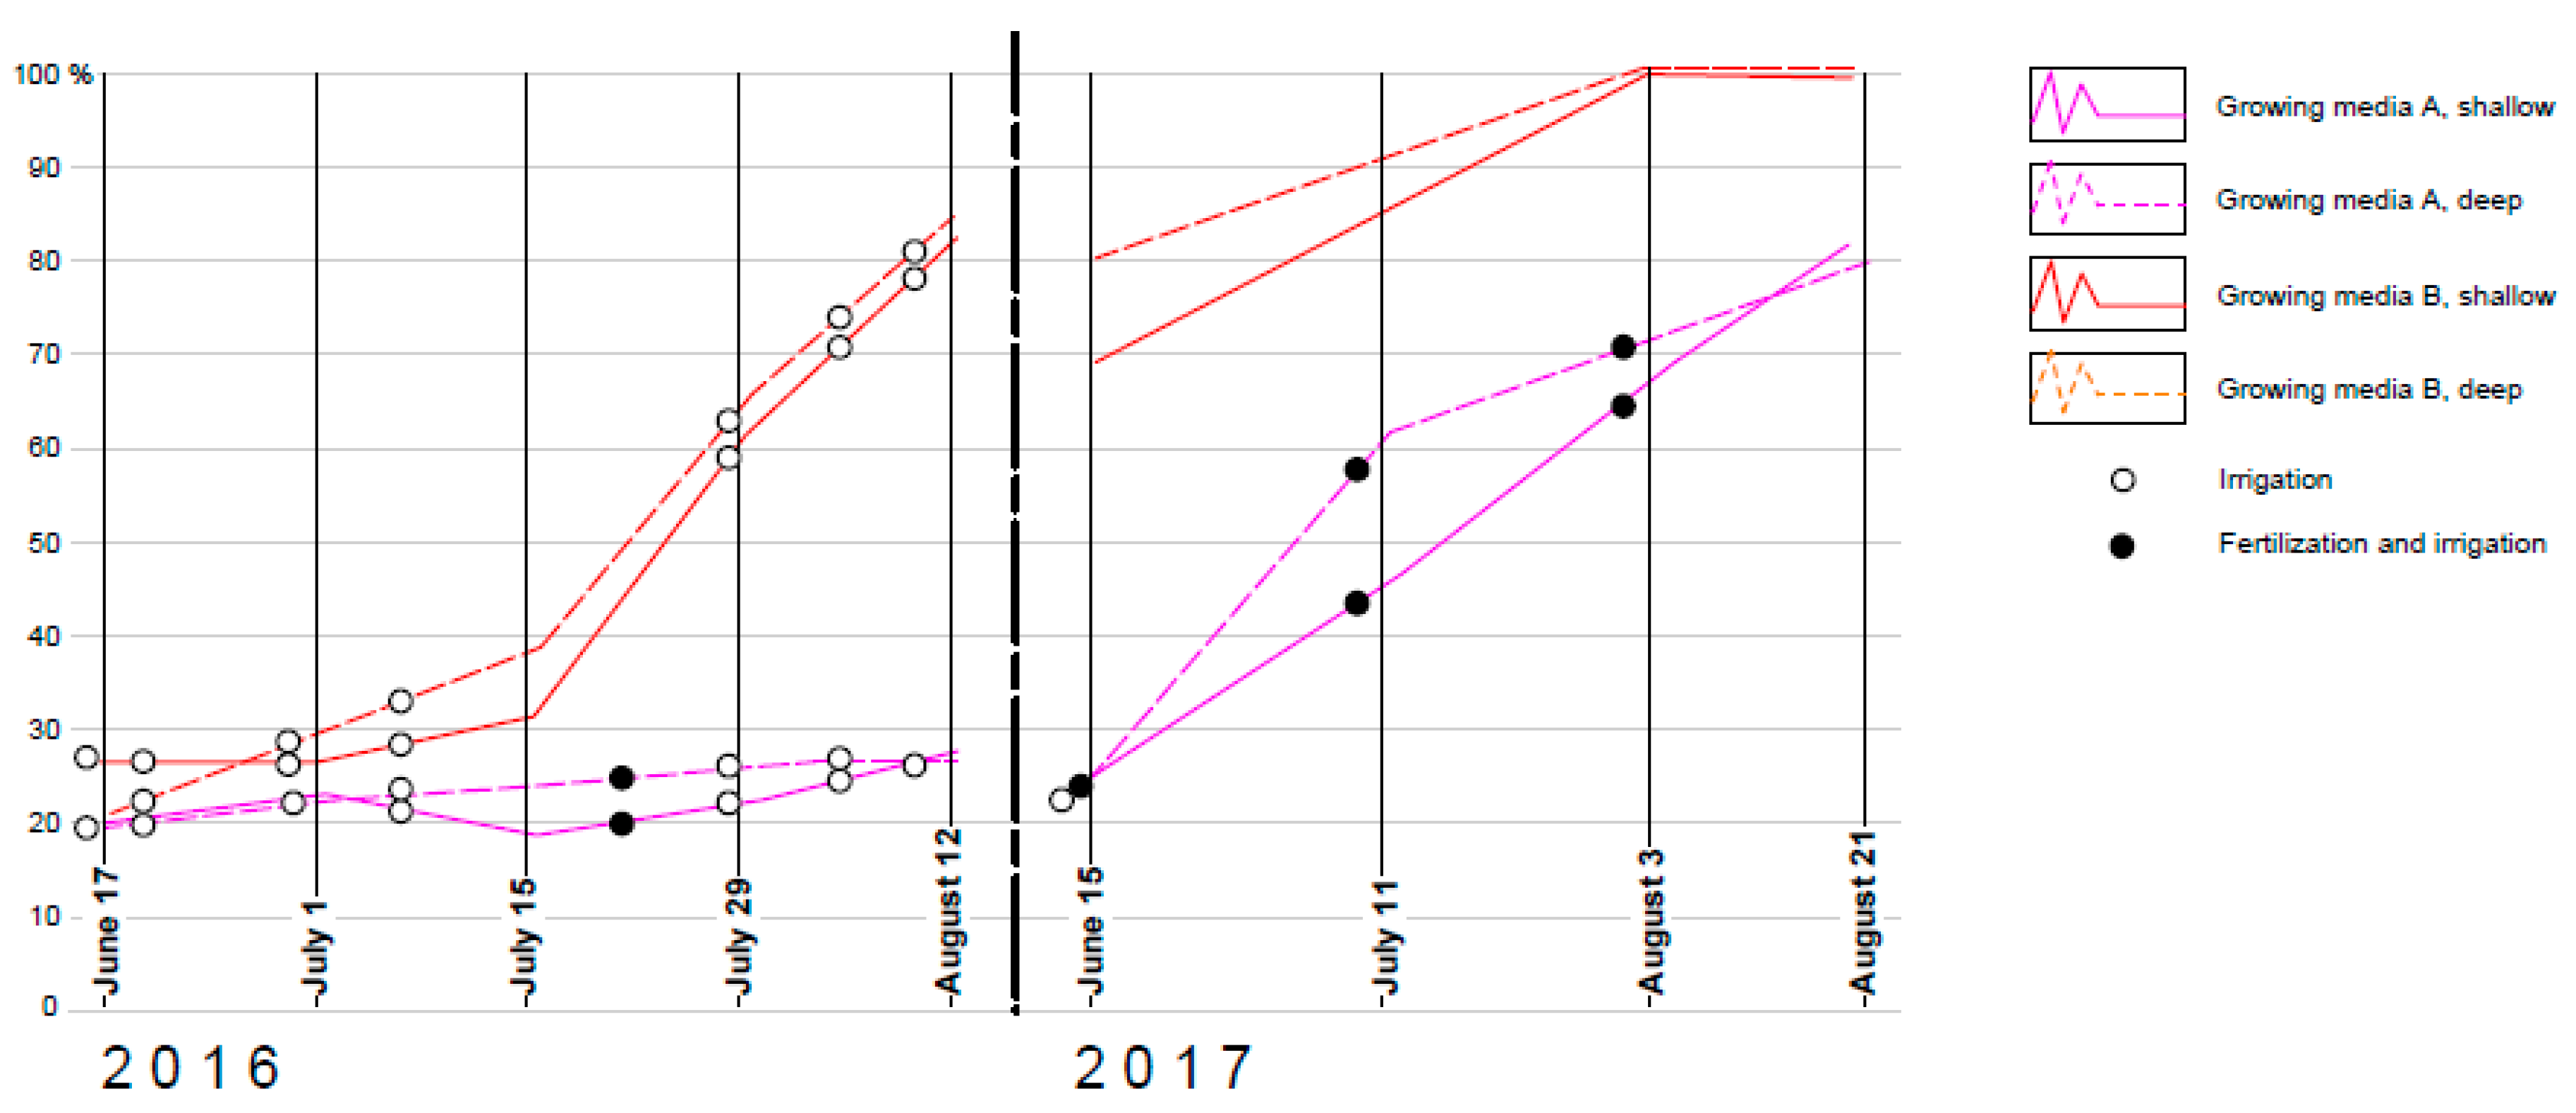
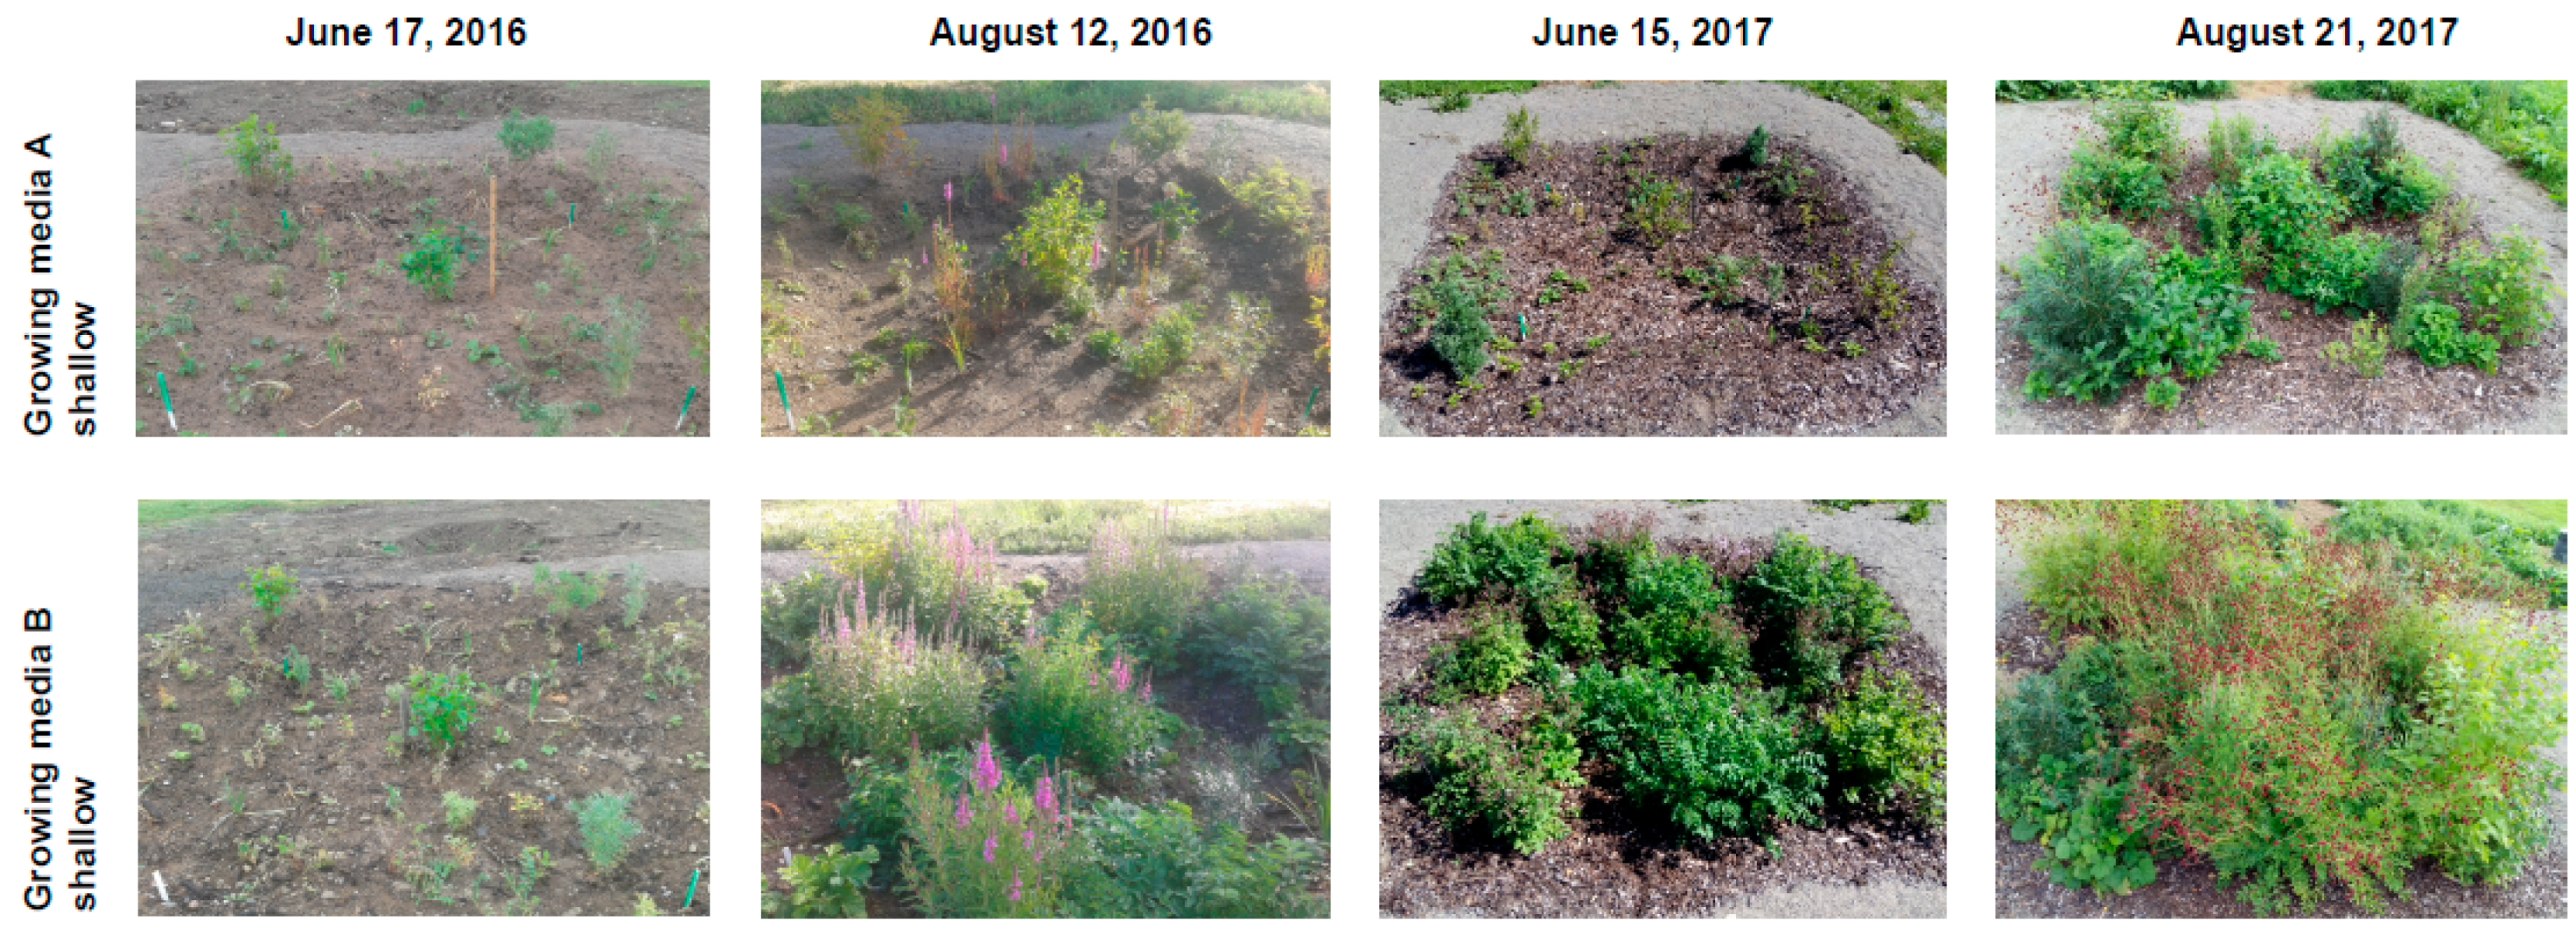
The development in vegetation cover showed notable differences between growing media A and B, even though cells with growing media A received additional fertilizers to maintain growth. All cells received good maintenance including weeding, pruning, and irrigation if needed, and these maintenance practices were similarly implemented across all cells. Growing medium A provided extremely weak growth at the beginning of the growing season, and had to be fertilized. After all, the difference between growing media A and B remained at the end of the first and at the end of the second growing season (Figure 10).
The construction depth only had a minor effect on vegetation cover, whereas the quality of growing media seemed to define the growth (Figure 11). Poor vegetation coverage in growing media A was compensated with fertilizers during the growing seasons to form the basis for a multilayered vegetation combination.
5. Discussion
Urbanization and the growing proportion of impermeable surfaces increases urban run-off. Bioretention is one of the best management practices that can be used to address storm water management by combining water, soil, and vegetation. This integrative nature of bioretention is important in dense cities where the efficient use of space is important. However, the bioretention construction details can vary widely depending on different interests, disciplines, and locations. This study aimed to balance quantity, quality, and amenity when adapting bioretention construction to local practices. This knowledge addresses a contemporary interest in storm water management, especially for creating guidelines and instructions for Finland.
This study first outlined the bioretention schematic construction details based on local conditions, and then compared some possible lines of development in a test field on a mesocosm scale. The schematic construction used the idea of single filter media to keep the number of construction layers simple and to ensure good growing conditions for vegetation. The test field phase compared sandy and sand-compost-topsoil mixtures for growing media alongside two construction depths with a simple sand filter as a control. In this study, the comparison focused on the first year after construction and the first two growing seasons. Heavy rain simulations and observation on the change in green coverage demonstrated that the optimal solution for managing storm water was not optimal for vegetation.
The proportion of fines and organic matter in the growing media defines the construction’s infiltration and water holding capacity. The content of fines in growing media A provided bioretention that prominently delayed peak-flow after rain events, but failed to support vegetation growth without fertilizers. This result supports the suspicions of Bratieres et al. [44] about the recommended filtration media without any added organic matter. Our study found it important to provide organic matter to fulfill the needs of the vegetation, which is important for bioretention systems that are designed to serve as an urban design element with a multi-layered canopy structure.
Heavy rain simulations compared cells under different precipitation conditions. A single irrigation simulating a heavy rain was followed with event-based monitoring, and a set of events showed the differences in repeated events. The main result of the heavy rain simulations showed the different water holding capacities and outflows in cells in the 20 h after irrigation. Growing medium A appeared to hold water the most efficiently before starting to recharge, and for the entire 20-h period. As Hsieh et al. [20] concluded, we demonstrated that hydraulic functioning can be different even when the media components were similar. Growing media B had better water holding capacity in the shallow cell than in the deep one. As this media was mixed on site in buckets of the excavator, it revealed the accuracy of practical implementation work.
However, vegetation growth was poor in growing media A in the first year, although these cells received extra maintenance to promote acceptable vegetation growth. If bioretention is considered as a multifunctional urban design element and not only for storm water management, the vegetation needs to be considered as an essential factor in the construction details. Here, growing media A failed to support good quality vegetation growth even with ongoing irrigation and fertilizers during the first year. The maintenance supporting the establishment of root system during the few first years may change the situation for upcoming growing seasons. This approach followed the idea of engineered and man-made biodiversity discussed by Levin and Mehring [11].
Although these results describe bioretention cells just after the construction phase, it needs to concentrate in future on the plant communities. Growing conditions may change thoroughly because of the growing media specifications, but also by runoff volume. This affects the survival of single plant species, and therefore direct planting design to use vegetation communities with several species rather than monocultural plantings. In particular, the idea of the dynamic planting concept may provide tools for bioretention as it builds on change (death and spread) in plantings, and therefore has potential to adapt changing conditions in bioretention cell.
Continuous monitoring of cells during the winter months in 2016–2017 indicated prominent activity during the melting periods during the winter, and during the spring melting. This observation indicated activity in the first winter, and should be further studied in upcoming years, together with frost type, and plant growth and mortality.
Our study demonstrated how construction details can be developed based on concrete local construction practices. The first-year functioning for storm water quality and quantity alongside the provision of a vegetative environment is essential in the context of rapid urbanization. However, the expected lifespan of a bioretention cell is 15 years and thus long term research is needed.
6. Conclusions
Construction details of bioretention should be modified to follow local construction practices and sustainable use of materials. However, it is essential to define first for what main purpose the adaptation serves: stormwater management, vegetation coverage or both. Growing media specifications, especially the content of fines and organic matter, is the choice that effects the vegetation growth. The specifications of growing media seem to concern designers and landscapers in detailed scale. Simultaneously this specification is the smallest component of the whole urban green network and storm water management.
Acknowledgments
This study was financially supported through Maiju and Yrjö Rikala’s Garden Foundation and Helsinki Metropolitan Region Urban Research Program (KatuMetro).
Conflicts of Interest
The authors declare no conflict of interest. The founding sponsors had no role in the design of the study; in the collection, analyses, or interpretation of data; in the writing of the manuscript, and in the decision to publish the results.
References
- Jylhä, K.; Ruosteenoja, K.; Räisänen, J.; Fronzek, S. Ilmasto. In Miten Väistämättömään Ilmastonmuutokseen Voidaan Varautua?—Yhteenveto Suomalaisesta Sopeutumistutkimuksesta eri Toimialoilla; Ruuhela, R., Ed.; Ministry of Agriculture and Forestry: Tampere, Finland, 2012; pp. 16–23. [Google Scholar]
- Novotny, V.; Ahern, J.; Brown, P. Water Centric Sustainable Communities, Planning, Retrofitting, and Building the Next Urban Environment; John Wiley & Sons: Hoboken, NJ, USA, 2010. [Google Scholar]
- RIL 261 Routasuojaus—Rakennukset ja Infrarakenteet; Suomen Rakennusinsinöörien Liitto RIL ry: Helsinki, Finland, 2013.
- Beatty, R.A.; Heckman, C.T. Survey of urban tree programs in the United States. Urban Ecol. 1981, 5, 81–102. [Google Scholar] [CrossRef]
- Iakovoglou, V.; Thompson, J.; Burras, L.; Kipper, R. Factors related to tree growth across urban-rural gradients in the Midwest, USA. Urban Ecosyst. 2001, 5, 71–85. [Google Scholar] [CrossRef]
- Keddy, P. Wetland Ecology, Principles and Concervation; Cambridge University Press: Cambridge, UK, 2010. [Google Scholar]
- Dee, C. Form and Fabric in Landscape Architecture: A Visual Introduction; Spon Press: London, UK, 2001. [Google Scholar]
- Echols, S.; Pennypacker, E. From Stormwater Management to Artful Rainwater Design. Landsc. J. 2008, 27, 268–290. [Google Scholar] [CrossRef]
- Backhaus, A.; Fryd, O. The aesthetic performance of urban landscape-based stormwater management systems: A review of twenty projects in Northern Europe. J. Landsc. Archit. 2013, 8, 52–63. [Google Scholar] [CrossRef]
- Davis, A.P.; Traver, R.G.; Hunt, W.F. Improving Urban Stormwater Quality: Applying Fundamental Principles. J. Contemp. Water Res. Educ. 2010, 146, 3–10. [Google Scholar] [CrossRef]
- Levin, L.A.; Mehring, A.S. Optimization of bioretention systems through application of ecological theory. Wiley Interdiscip. Rev. 2015, 2, 259–270. [Google Scholar] [CrossRef]
- Paus, K.H.; Braskerud, B.C. Suggestions for Designing and Constructing Bioretention Cells for a Nordic Climate forslag til dimensjonering og utforming av regnbed for nordiske forhold. VATTEN J. Water Manag. Res. 2014, 70, 139–150. [Google Scholar]
- Lucas, W.C.; Greenway, M. A Study of Hydraulic dynamics in vegetated and non-vegetated bioretention mesocosms. In Proceedings of the International Conference on HydroScience and Engineering, Philadelphia, PA, USA, 10–13 September 2006. [Google Scholar]
- Le Coustumer, S.; Fletcher, T.D.; Deletic, A.; Barraud, S.; Poelsma, P. The influence of design parameters on clogging of stormwater biofilters: A large-scale column study. Water Res. 2012, 46, 6743–6752. [Google Scholar] [CrossRef] [PubMed]
- Xu, S.; Liu, L.L.; Sayer, E.J. Variability of above-ground litter inputs alters soil physicochemical and biological processes: A meta-analysis of litterfall-manipulation experiments. Biogeosciences 2013, 10, 7423–7433. [Google Scholar] [CrossRef] [Green Version]
- Liu, J.; Sample, D.; Bell, C.; Guan, Y. Review and Research Needs of Bioretention Used for the Treatment of Urban Stormwater. Water 2014, 6, 1069–1099. [Google Scholar] [CrossRef]
- Clar, M.; Laramore, E.; Ryan, H. Rethinking Bioretention Design Concepts. In Proceedings of the Second National Low Impact Development Conference, Wilmington, NC, USA, 12–14 March 2007; ASCE: Riston, VA, USA, 2007. [Google Scholar]
- Carpenter, D.D. Influence of Planting Soil Mix Characteristics on Bioretention Cell Design and Performance. J. Hydrol. Eng. 2010, 15, 404–416. [Google Scholar] [CrossRef]
- Somes, N.; Potter, M.; Crosby, J.; Pfitzner, M. Rain garden: Design, construction and maintenance recommendations based on a review of existing systems. In Proceedings of the Conference on Rainwater and Urban Design, Sydney, Australia, 21–23 August 2007. [Google Scholar]
- Hsieh, C.; Davis, A.P. Evaluation and Optimization of Bioretention Media for Treatment of Urban Storm Water Runoff. J. Environ. Eng. 2005, 131, 1521–1531. [Google Scholar] [CrossRef]
- Ewing, C. Assessment of International Bioretention Soil Media: Guidelines and Experiences; University of Copenhagen: Copenhagen, Denmark, 2013. [Google Scholar]
- FAWB. Guidelines for Filter Media in Biofiltration Systems (Version 3.01). 2009. Available online: http://www.monash.edu.au/fawb/products/obtain.html (accessed on 5 November 2017).
- Kratky, H.; Li, Z.; Chen, Y.; Wang, C.; Li, X.; Yu, T. A critical literature review of bioretention research for stormwater management in cold climate and future research recommendations. Front. Environ. Sci. Eng. 2017, 11, 16. [Google Scholar] [CrossRef]
- Muthanna, T.M. Bioretention as a Sustainable Stormwater Management Option in Cold Climates. Ph.D. Thesis, Norwegian University of Science and Technology, Trondheim, Norway, March 2007. [Google Scholar]
- Khan, U.; Valeo, C.; Chu, A.; He, J. A Data Driven Approach to Bioretention Cell Performance: Prediction and Design. Water 2013, 5, 13–28. [Google Scholar] [CrossRef]
- Moghadas, S.; Gustafsson, A.-M.; Viklander, P.; Marsalek, J.; Viklander, M. Laboratory study of infiltration into two frozen engineered (sandy) soils recommended for bioretention. Hydrol. Process. 2016, 30, 1251–1264. [Google Scholar] [CrossRef]
- Blecken, G.-T.; Zinger, Y.; Deletic, A.; Fletcher, T.; Hedström, A.; Viklander, M. Laboratory study on stormwater biofiltration: Nutrient and sediment removal in cold temperatures. J. Hydrol. 2010, 394, 507–514. [Google Scholar] [CrossRef]
- Khan, U.T.; Valeo, C.; Chu, A.; van Duin, B. Bioretention cell efficacy in cold climates: Part 1—Hydrologic performance. Can. J. Civ. Eng. 2012, 39, 1210–1221. [Google Scholar] [CrossRef]
- Roseen, R.M.; Ballestero, T.P.; Houle, J.J.; Avellaneda, P.; Briggs, J.; Fowler, G.; Wildey, R. Seasonal Performance Variations for Storm-Water Management Systems in Cold Climate Conditions. J. Environ. Eng. 2009, 135, 128–137. [Google Scholar] [CrossRef]
- Hunt, W.F.; Lord, W.G. Urban Waterways: Bioretention Performance, Design, Construction, and Maintenance; North Carolina Cooperative Extension Service: Raleigh, NC, USA, 2006. [Google Scholar]
- Davis, A.P.; Hunt, W.F.; Traver, R.G.; Clar, M. Bioretention Technology: Overview of Current Practice and Future Needs. J. Environ. Eng. 2009, 135, 109–117. [Google Scholar] [CrossRef]
- Sänkiaho, L.; Sillanpää, N. Stormwater-Hankkeen Loppuraportti; Aalto University: Espoo, Finland, 2012. [Google Scholar]
- Pirinen, P.; Simola, H.; Aalto, J.; Kaukoranta, J.-P.; Karlsson, P.; Ruuhela, R. Climatological Statistics of Finland 1981–2010; Finnish Meteorological Institute: Helsinki, Finland, 2012. [Google Scholar]
- Finnish Environmental Institute. Depth of Ground Frost. Available online: http://wwwi3.ymparisto.fi/i3/paasivu/ENG/Routa/Routa.htm (accessed on 16 October 2017).
- Ruosteenoja, K.; Räisänen, J.; Venäläinen, A.; Kämäräinen, M.; Pirinen, P. Terminen kasvukausi lämpenevässä ilmastossa. Terra 2016, 128, 3–15. [Google Scholar]
- Jylhä, K.; Ruosteenoja, K.; Räisänen, J.; Venäläinen, A.; Tuomenvirta, H.; Ruokolainen, L.; Saku, S.; Seitola, S. The Changing Climate in Finland: Estimates for Adaptation Studies; ACCLIM Project Report; Finnish Meteorological Institute: Helsinki, Finland, 2009. [Google Scholar]
- Vainio, T. Demand for New Dwelling Production in Finland 2015–2040; VTT Technology 247; VTT Technical Research Centre of Finland: Espoo, Finland, 2016. [Google Scholar]
- Ehrukainen, E.; Gustafsson, J.; Honkanen, M.; Härmä, P.; Jauhiainen, P.; Kuula, P.; Nenonen, K.; Pellinen, T.; Rintala, J.; Selonen, O.; et al. Development of Aggregate and Natural Stone Industries in Finland; Ministry of Employment and the Economy: Helsinki, Finland, 2015.
- Väyrynen, T.; Aaltonen, R.; Haavikko, H. Turvetuotannon Ympäristönsuojeluopas; Pohjois-Pohjanmaan ympäristökeskus: Oulu, Finland, 2008. [Google Scholar]
- Kasvio, P.; Ulvi, T.; Koskiaho, J.; Jormola, J. Kosteikkojen ja Biosuodatusalueiden Toimivuus Hulevesien Käsittelyssä—Hule-Hankkeen Loppuraportti; Finnish Environment Institute: Helsinki, Finland, 2016. [Google Scholar]
- Suihko, M. Biofiltration for Stormwater Management in Finnish Climate. Master’s Thesis, Aalto University, Espoo, Finland, 2016. [Google Scholar]
- Lehikoinen, E. Kadun Vastavalmistuneiden Huleveden Biosuodatusalueiden Toimivuus Vantaalla. Master’s Thesis, Aalto University, Espoo, Finland, 2015. [Google Scholar]
- Tahvonen, O.; Riihimäki, M.-A. Urban Vegetation for Bioretention in Cold Climates—A Short Interval Flooding Test in Finland. In Proceedings of the ECLAS Conference 2016: Bridging the Gap, Rapperswil, Switzerland, 11–14 September 2016; pp. 497–500. [Google Scholar]
- Bratieres, K.; Fletcher, T.D.; Deletic, A.; Zinger, Y. Nutrient and sediment removal by stormwater biofilters: A large-scale design optimisation study. Water Res. 2008, 42, 3930–3940. [Google Scholar] [CrossRef] [PubMed]
Figure 1.
Schematic diagram of bioretention and its construction layers, modified from Hunt and Lord [30] and Davis et al. [31].
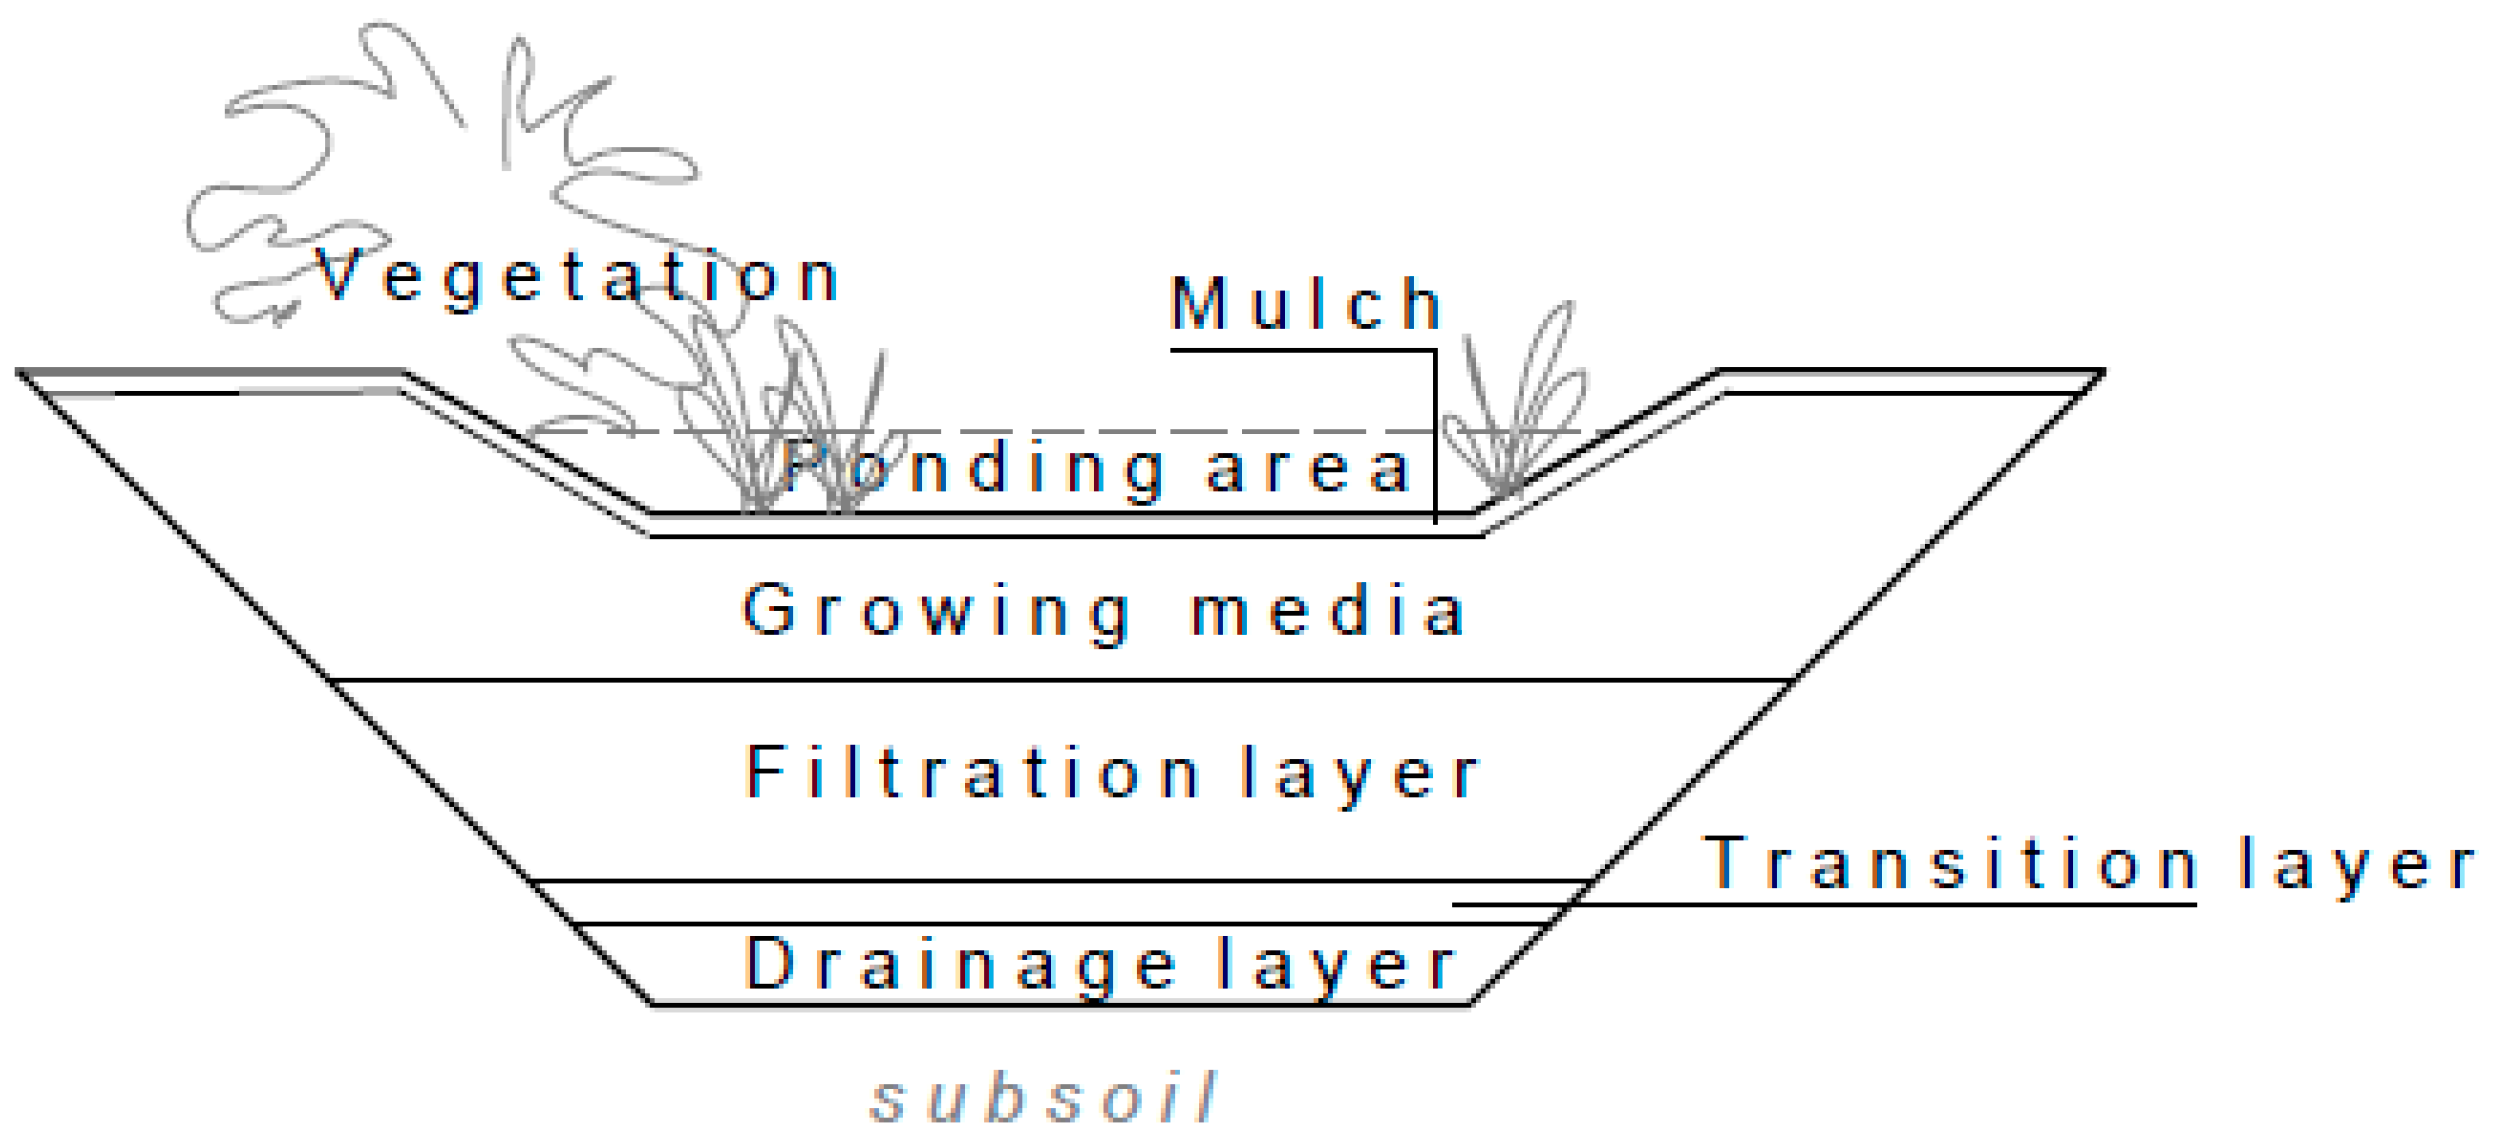
Figure 2.
Construction layers and their details in general and the specific considerations in cold climates.
Figure 2.
Construction layers and their details in general and the specific considerations in cold climates.
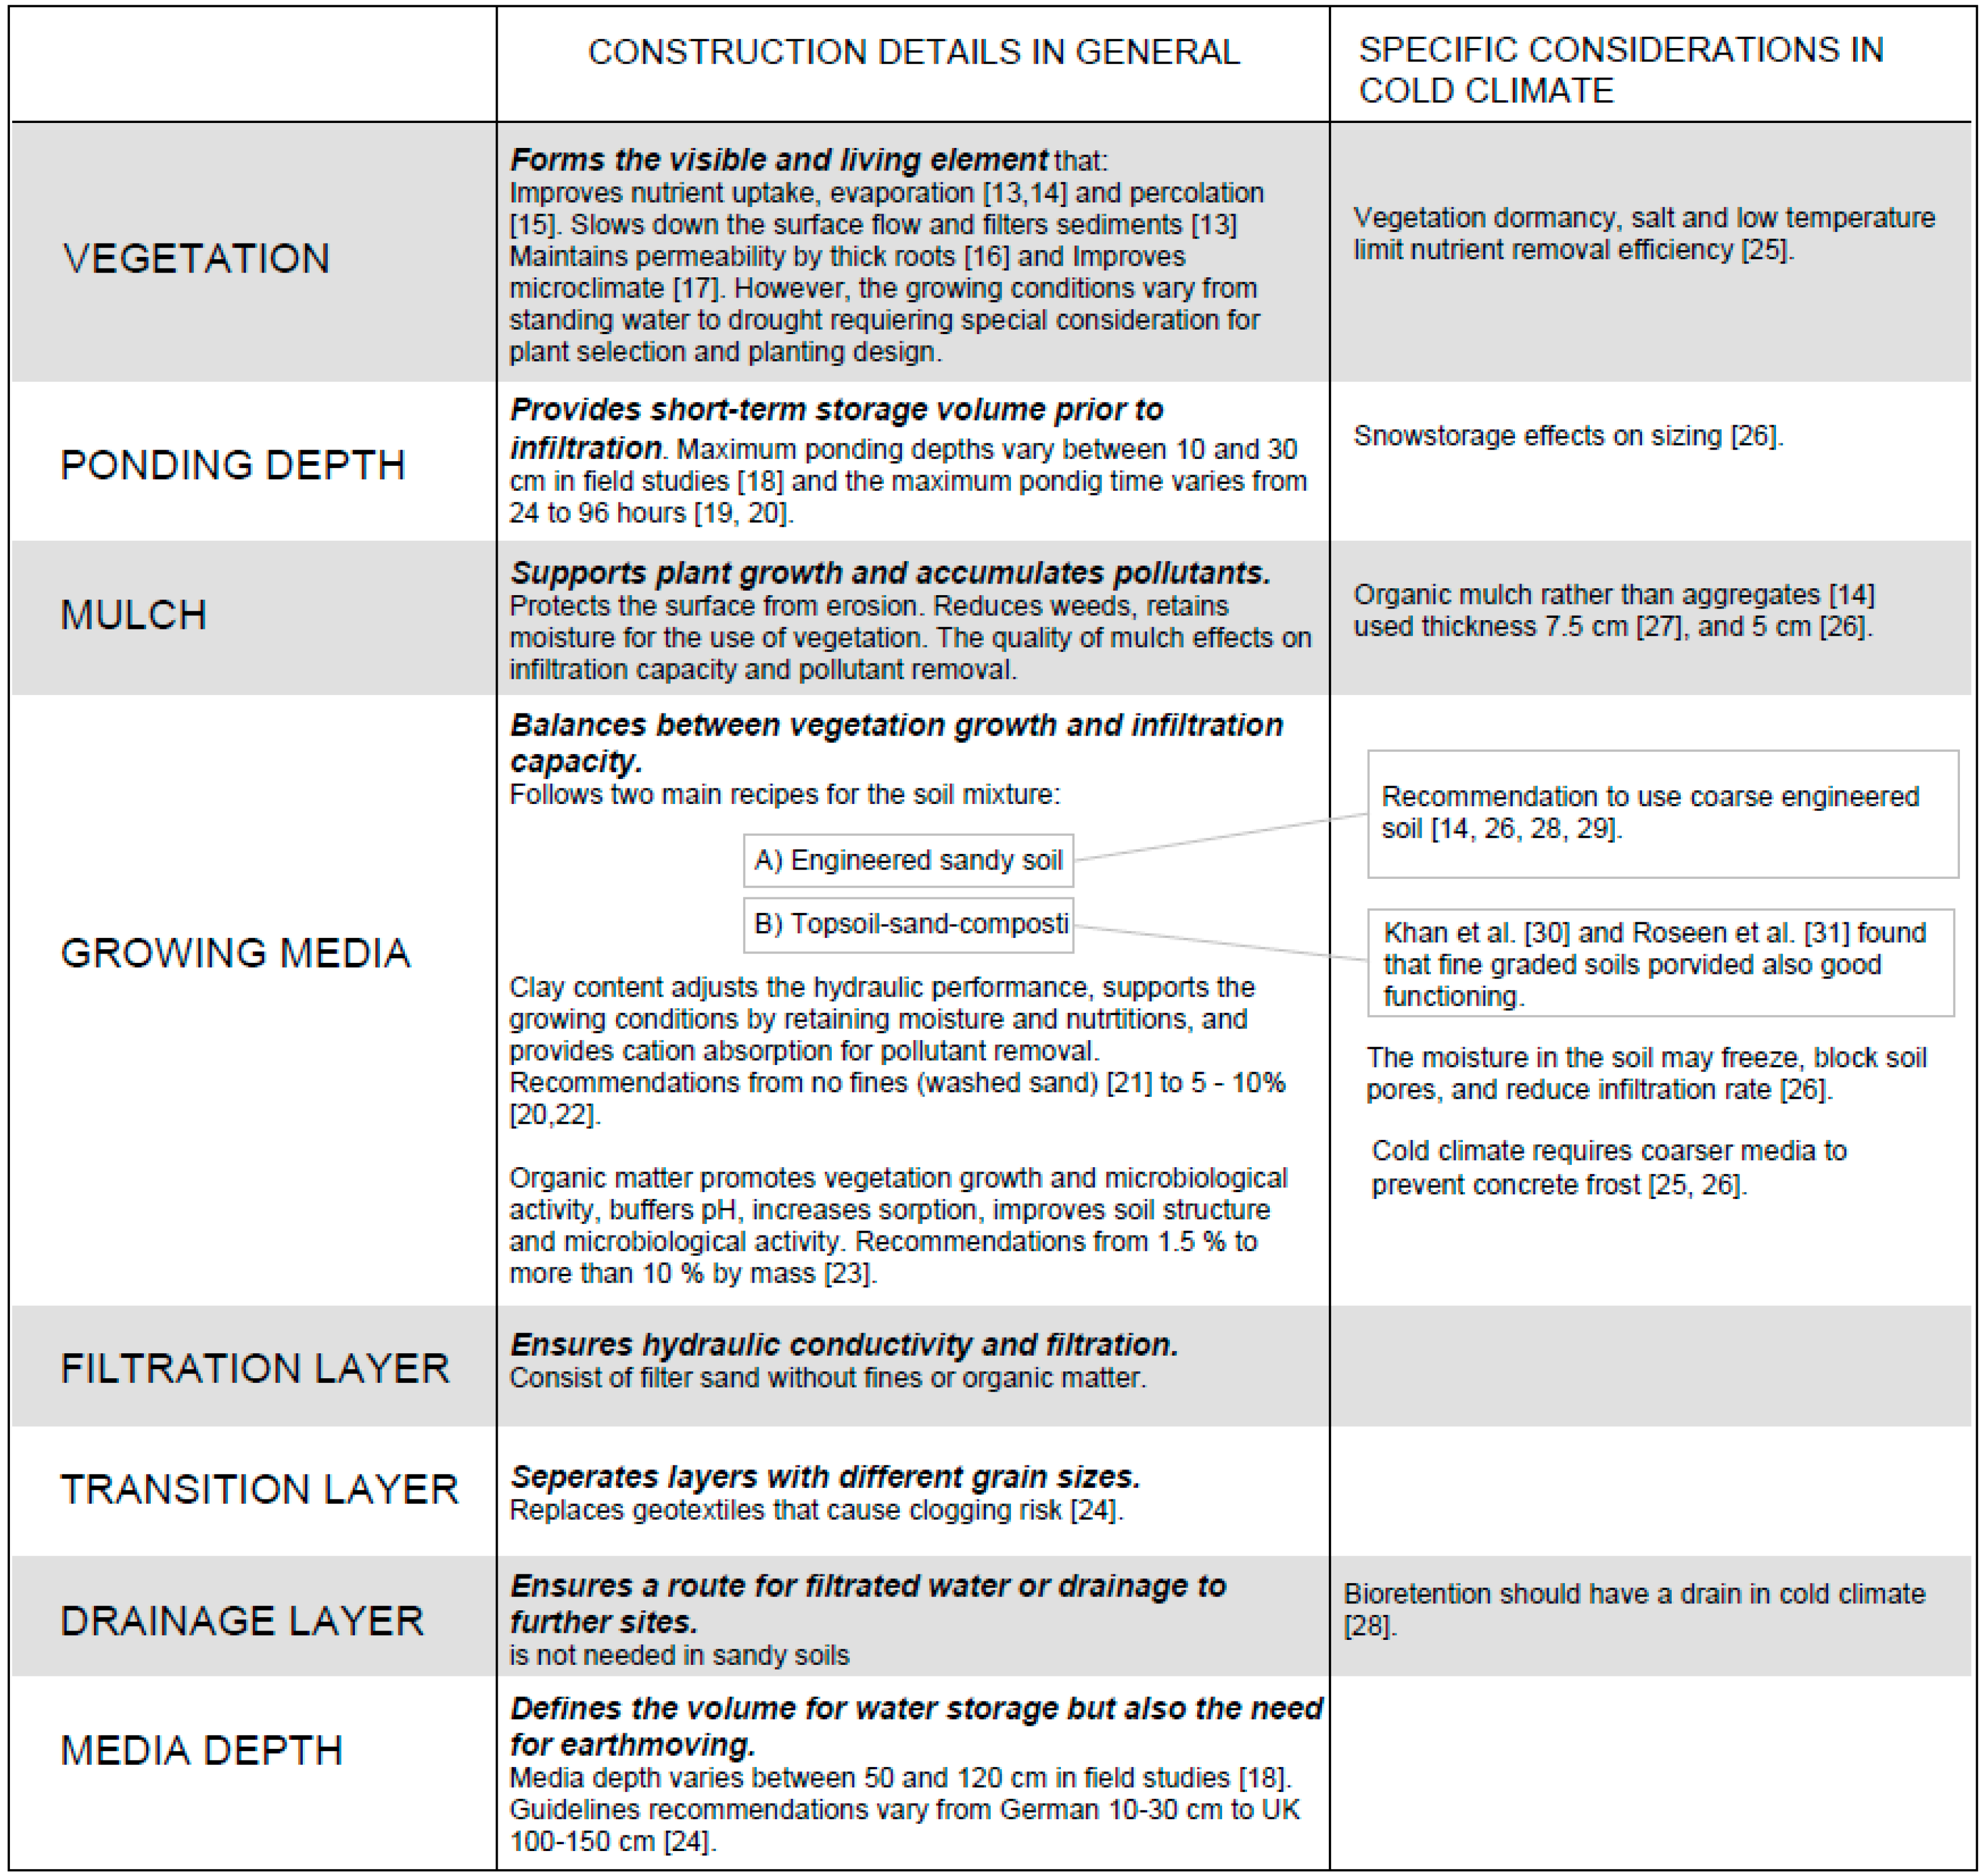
Figure 3.
The layers used in this study. Altogether, the test field contained five cells. Two cells were 120 cm deep and the other two were 80 cm deep. All of them had a 20-cm maximum ponding layer on top of these layers. The fifth cell was an 80-cm deep sand filter as the control for the research design.

Figure 4.
The grain size distribution of the growing media. Growing media A included 2.2% and growing media B included 5.3% organic matter by mass.
Figure 4.
The grain size distribution of the growing media. Growing media A included 2.2% and growing media B included 5.3% organic matter by mass.
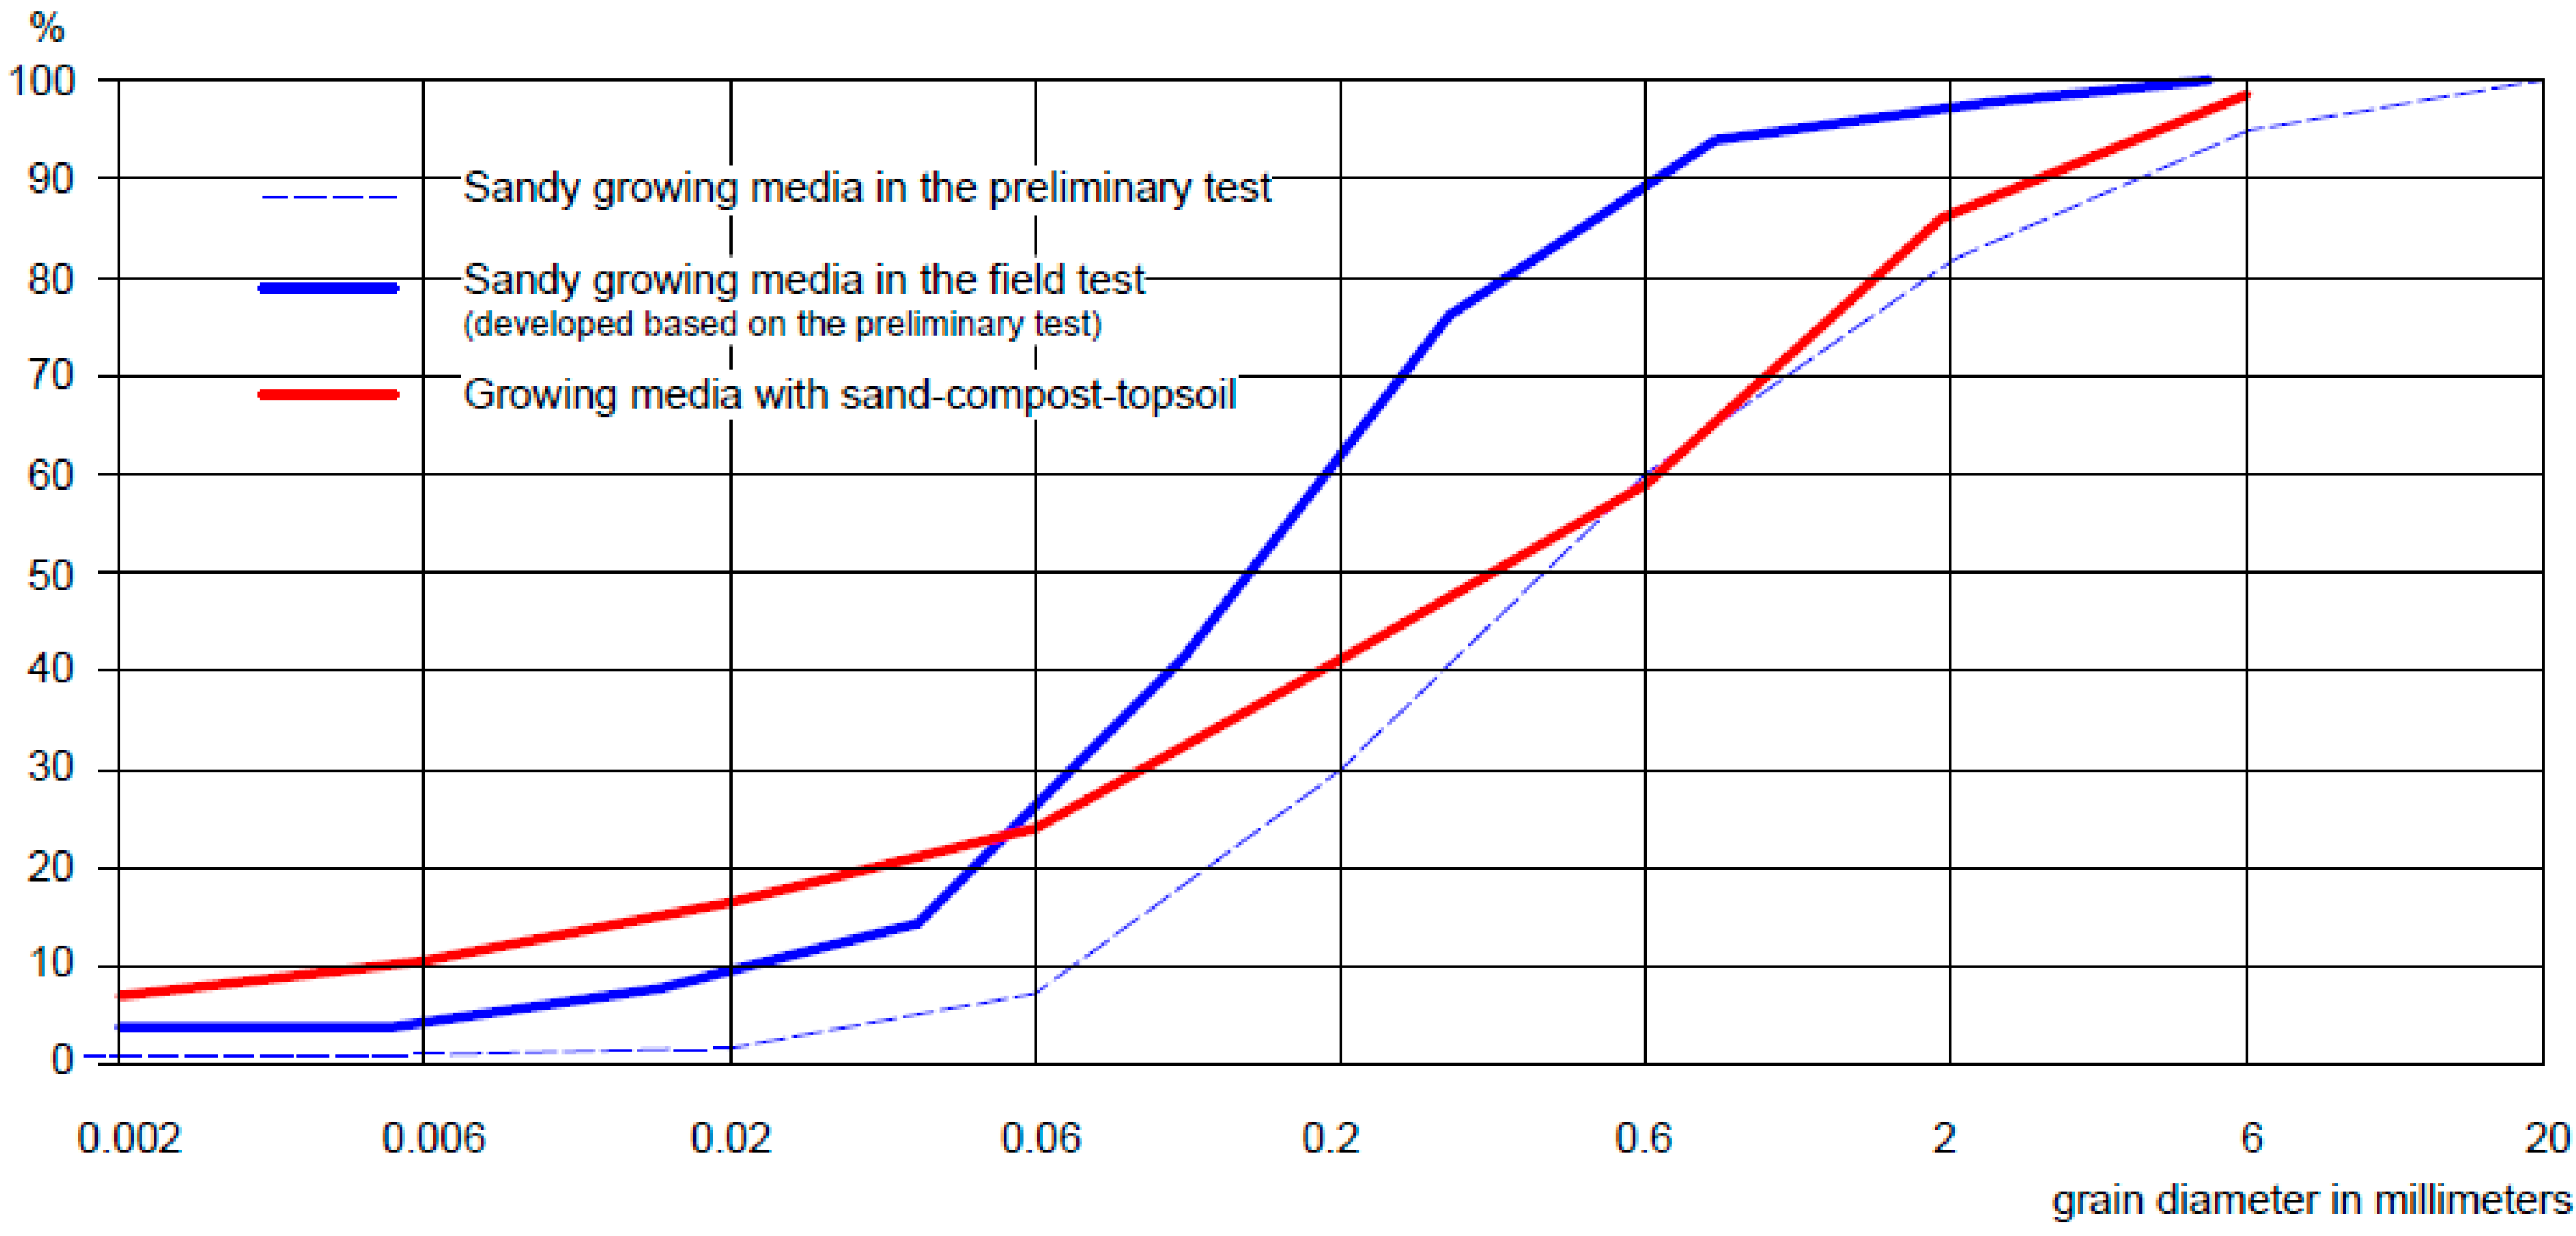
Figure 5.
The test field located on the edge of agricultural fields at the Lepaa campus, Southern Finland. Sunlight and subsoil conditions were similar for all cells.
Figure 5.
The test field located on the edge of agricultural fields at the Lepaa campus, Southern Finland. Sunlight and subsoil conditions were similar for all cells.

Figure 6.
Cumulative outflow as a function of time, averaging six separate heavy rain simulations at the end of the first growing season. The irrigated water volume was 1250 L for every construction type.
Figure 6.
Cumulative outflow as a function of time, averaging six separate heavy rain simulations at the end of the first growing season. The irrigated water volume was 1250 L for every construction type.

Figure 7.
Outflow eight hours after separate heavy rain simulations: (a) deep growing media A shows similar outflow curves during all six events; whereas (b) the outflow curves of growing media B presented different patterns between the first events in the three-day series.
Figure 7.
Outflow eight hours after separate heavy rain simulations: (a) deep growing media A shows similar outflow curves during all six events; whereas (b) the outflow curves of growing media B presented different patterns between the first events in the three-day series.

Figure 8.
The change in electrical conductivity in the outflow quality during repeated rainfall events. The conductivity of the outflow in growing media A (purple) presented a steady decline after every heavy rain simulation, whereas the change in growing media B (red) was less clear, but followed a declining trend.

Figure 9.
Functioning of cells in relation to weather conditions from mid-October to mid-May.

Figure 10.
The development of vegetation cover in shallow cells with growing media A and B. The first photos were photographed one week after planting. Growing medium A showed light growth (upper row) when compared to the media containing compost and topsoil (lower row).
Figure 10.
The development of vegetation cover in shallow cells with growing media A and B. The first photos were photographed one week after planting. Growing medium A showed light growth (upper row) when compared to the media containing compost and topsoil (lower row).

Figure 11.
The development of green coverage and maintenance practices on vegetation mix.

Table 1.
Plant combination and role of plants in structural diversity.
| Name | Type of Plant | ||
|---|---|---|---|
| Edging or Groundcover | Medium Shrubs or Tall Herbs | Small Trees or Large Trees | |
| Alnus glutinosa | × | ||
| Betula pubescens | × | ||
| Chelone obliqua | × | ||
| Geum rivale | × | ||
| Hippohaë rhamnoides | × | × | |
| Iris sibirica | × | × | |
| Lythrum salicaria | × | × | |
| Physocarpus opulifolius | × | × | |
| Picea mariana | × | × | |
| Rhododendron canadense | × | ||
| Salix purpurea 'Gracilis' | × | × | |
| Sanguisorba officinalis | × | ||
| Thalictrum aquilegifolium | × | ||
Table 2.
Monthly temperature and precipitation compared to averages in the test field area. Generally, the winter of 2016–2017 had less precipitation and more variable temperature conditions than the average.
Table 2.
Monthly temperature and precipitation compared to averages in the test field area. Generally, the winter of 2016–2017 had less precipitation and more variable temperature conditions than the average.
| Month | 10 | 11 | 12 | 1 | 2 | 3 | 4 | 5 |
|---|---|---|---|---|---|---|---|---|
| Temperature (°C) | 3.7 | −1.2 | −1.6 | −3.6 | −4.5 | 0.3 | 1.8 | 9.1 |
| Average 1981–2010 | 5 | −0.3 | −4.3 | −6.2 | −6.9 | −2.6 | 3.5 | 10.1 |
| Precipitation (mm) | 13.6 | 42.2 | 15.6 | 13.9 | 20.6 | 23.5 | 46.3 | 16 |
| Average 1981–2010 | 62 | 47 | 46 | 43 | 29 | 29 | 29 | 41 |
© 2018 by the author. Licensee MDPI, Basel, Switzerland. This article is an open access article distributed under the terms and conditions of the Creative Commons Attribution (CC BY) license (http://creativecommons.org/licenses/by/4.0/).
Share and Cite
MDPI and ACS Style
Tahvonen, O. Adapting Bioretention Construction Details to Local Practices in Finland. Sustainability 2018, 10, 276. https://doi.org/10.3390/su10020276
AMA Style
Tahvonen O. Adapting Bioretention Construction Details to Local Practices in Finland. Sustainability. 2018; 10(2):276. https://doi.org/10.3390/su10020276
Chicago/Turabian StyleTahvonen, Outi. 2018. "Adapting Bioretention Construction Details to Local Practices in Finland" Sustainability 10, no. 2: 276. https://doi.org/10.3390/su10020276
Note that from the first issue of 2016, this journal uses article numbers instead of page numbers. See further details here.