Article

Evaluating Spatial Priority of Urban Green Infrastructure for Urban Sustainability in Areas of Rapid Urbanization: A Case Study of Pukou in China

1
College of Resources and Environment, Nanjing Agricultural University, Nanjing 210095, China
2
College of Agriculture and Biotechnology, Zhejiang University, Hangzhou 310000, China
3
National and Local Joint Engineering, Research Center for Rural Land Resources Use and Consolidation, Nanjing 210095, China
4
College of Land Management, Nanjing Agricultural University, Nanjing 210095, China
*
Author to whom correspondence should be addressed.
Sustainability 2018, 10(2), 327; https://doi.org/10.3390/su10020327
Submission received: 4 December 2017 / Revised: 22 January 2018 / Accepted: 22 January 2018 / Published: 27 January 2018
(This article belongs to the Section Sustainable Urban and Rural Development)

Abstract

:
Rapid urbanization in recent decades highlights the limitations on the sustainable development of cities due to the fragmentation of restricted urban green land. The aim of this paper is to formulate a workable framework for planning and managing urban green infrastructure (UGI) for urban sustainability. This study provides a new method for modeling and analyzing UGI based on a case study of the Pukou District in Nanjing, which is a typical developing area in China. We adopt the morphological spatial pattern analysis (MSPA) method and combine it with the landscape connectivity index to identify the UGI hubs and links. In addition, the least-cost path model is employed to construct the potential UGI network in this case. We further integrate the spatial syntax model into landscape ecological principles to evaluate the spatial priority of the UGI network. The results showed that the framework proposed in this study is suitable for the green infrastructure network construction by combining the MSPA, landscape connectivity, and the space syntax methods. This framework can be used to better understand the spatial distribution and priority of the green infrastructure network for achieving urban sustainability in China.

1. Introduction

The global population will reach 8.5 billion by 2030, and the majority of the growth will occur in densely populated areas in Asian and African cities [1], where living space is already restricted, and resources are scarce. Rapid global urbanization has caused many serious ecological crises [2,3] which have severely damaged the planet. In particular, the fragmented urban habitat and reduced landscape connectivity have severely weakened the functioning of urban ecosystems and have limited sustainable urban development [4].
Maintaining green infrastructure as a source of ecosystem services is a key challenge for sustainability of urban regions. Green infrastructure (GI) can be considered to involve all natural, semi-natural, and artificial ecosystems within and between urban areas at all spatial scales. The concept of GI emphasizes the quality and quantity of urban and peri-urban green spaces, as well as their multiple functions and the importance of interconnections between them [5]. Urban green infrastructure (UGI) provides supporting services such as biodiversity conservation, and cultural services such as recreational use of the GI network by local residents. If systematically planned, developed, and maintained, GI has the potential to promote ecosystem services and urban sustainability. The GI network is mainly composed of hubs and links, which are of great significance for maintaining urban ecosystem services [6]. Hubs are areas of natural vegetation, open space, or areas known and with high ecological values, and links are the corridors connecting them. In contrast to traditional ecological protection, the construction and management of UGI can balance the ecological, social and economic benefits of the urban system and achieve sustainable development [7,8,9]. This strategy has been recognized and widely applied around the world [10,11,12]. For example, the Green Infrastructure Assessment (GIA) in Maryland (USA) was developed from the practice of smart growth and conservation in the 1990s [13]. In Korea, UGI is widely used for the low impact development (LID) of large cities such as Seoul and Busan [14].
UGI does not mean the construction of an entirely new structure but rather enhancement of the connectivity of already existing green spaces to enhance the ecological functioning of an ecosystem. Until now, most of the research on UGI networks has focused on evaluating and increasing the connectivity among UGI elements [15,16,17]. Landscape connectivity can be calculated using the integral index of connectivity (IIC) and probability of connectivity (PC), based on the graph theory [18]. The IIC and PC not only take into account the barrier effect of the landscape matrix, but also evaluate the bearing capacity of each patch. However, these indices are inadequate for extracting spatial morphological information in GI network construction because the existing structural corridors are ignored, resulting in the lack of the extraction of the cores and the corridors [19,20]. Alternatively, morphological spatial pattern analysis (MSPA), which provides a flexible approach to analyzing spatial patterns, was recently introduced to construct the UGI network [21,22,23]. MSPA targets the geometry and connectivity of image components and can automatically identify existing patches and corridors. Based on geometric concepts, this analysis will be able to map corridors and construct the links between core patches at different scales and to any type of digital images in any application field [24]. In addition, MSPA only requires data of existing land use and the MSPA software, which is convenient for planners. Given these advantages, the application of MSPA to GI analyses can provide new insights into the recognition of critical elements of network structure.
The spatial accessibility of UGI, defined as the convenience for residents at any given location to overcome the spatial impedance to reach the UGI, is one of the most important factors influencing the recreational use of the UGI. Only accessible green infrastructures can perform their natural recreation function well. Moreover, these spatial structures of UGI are closely associated with human activities. Human settlements, activities and their interactions with the surrounding environment are usually studied by using Space Syntax [25]. Space Syntax is advantageous because it can quantify the interactions between UGI elements and human behavior and optimize the spatial structure of the UGI network in terms of a series of topological variables [26,27,28,29].
The overarching goal of this paper is to delineate and prioritize the spatial structure of UGI. The study was conducted using the Pukou District in Nanjing, a very rapidly urbanizing area in China. By focusing on two major functions provided by UGI (suitable biological habitat and natural areas for residents), and taking advantage of both the morphologically-based (MSPA) and topologically-based (space syntax) analyses, we address the following questions: (1) How do we identify the hubs and links of UGI networks more accurately? (2) How do we determine the spatial priority of hubs and links in UGI when the urban space is extremely limited?

2. Materials and Methods
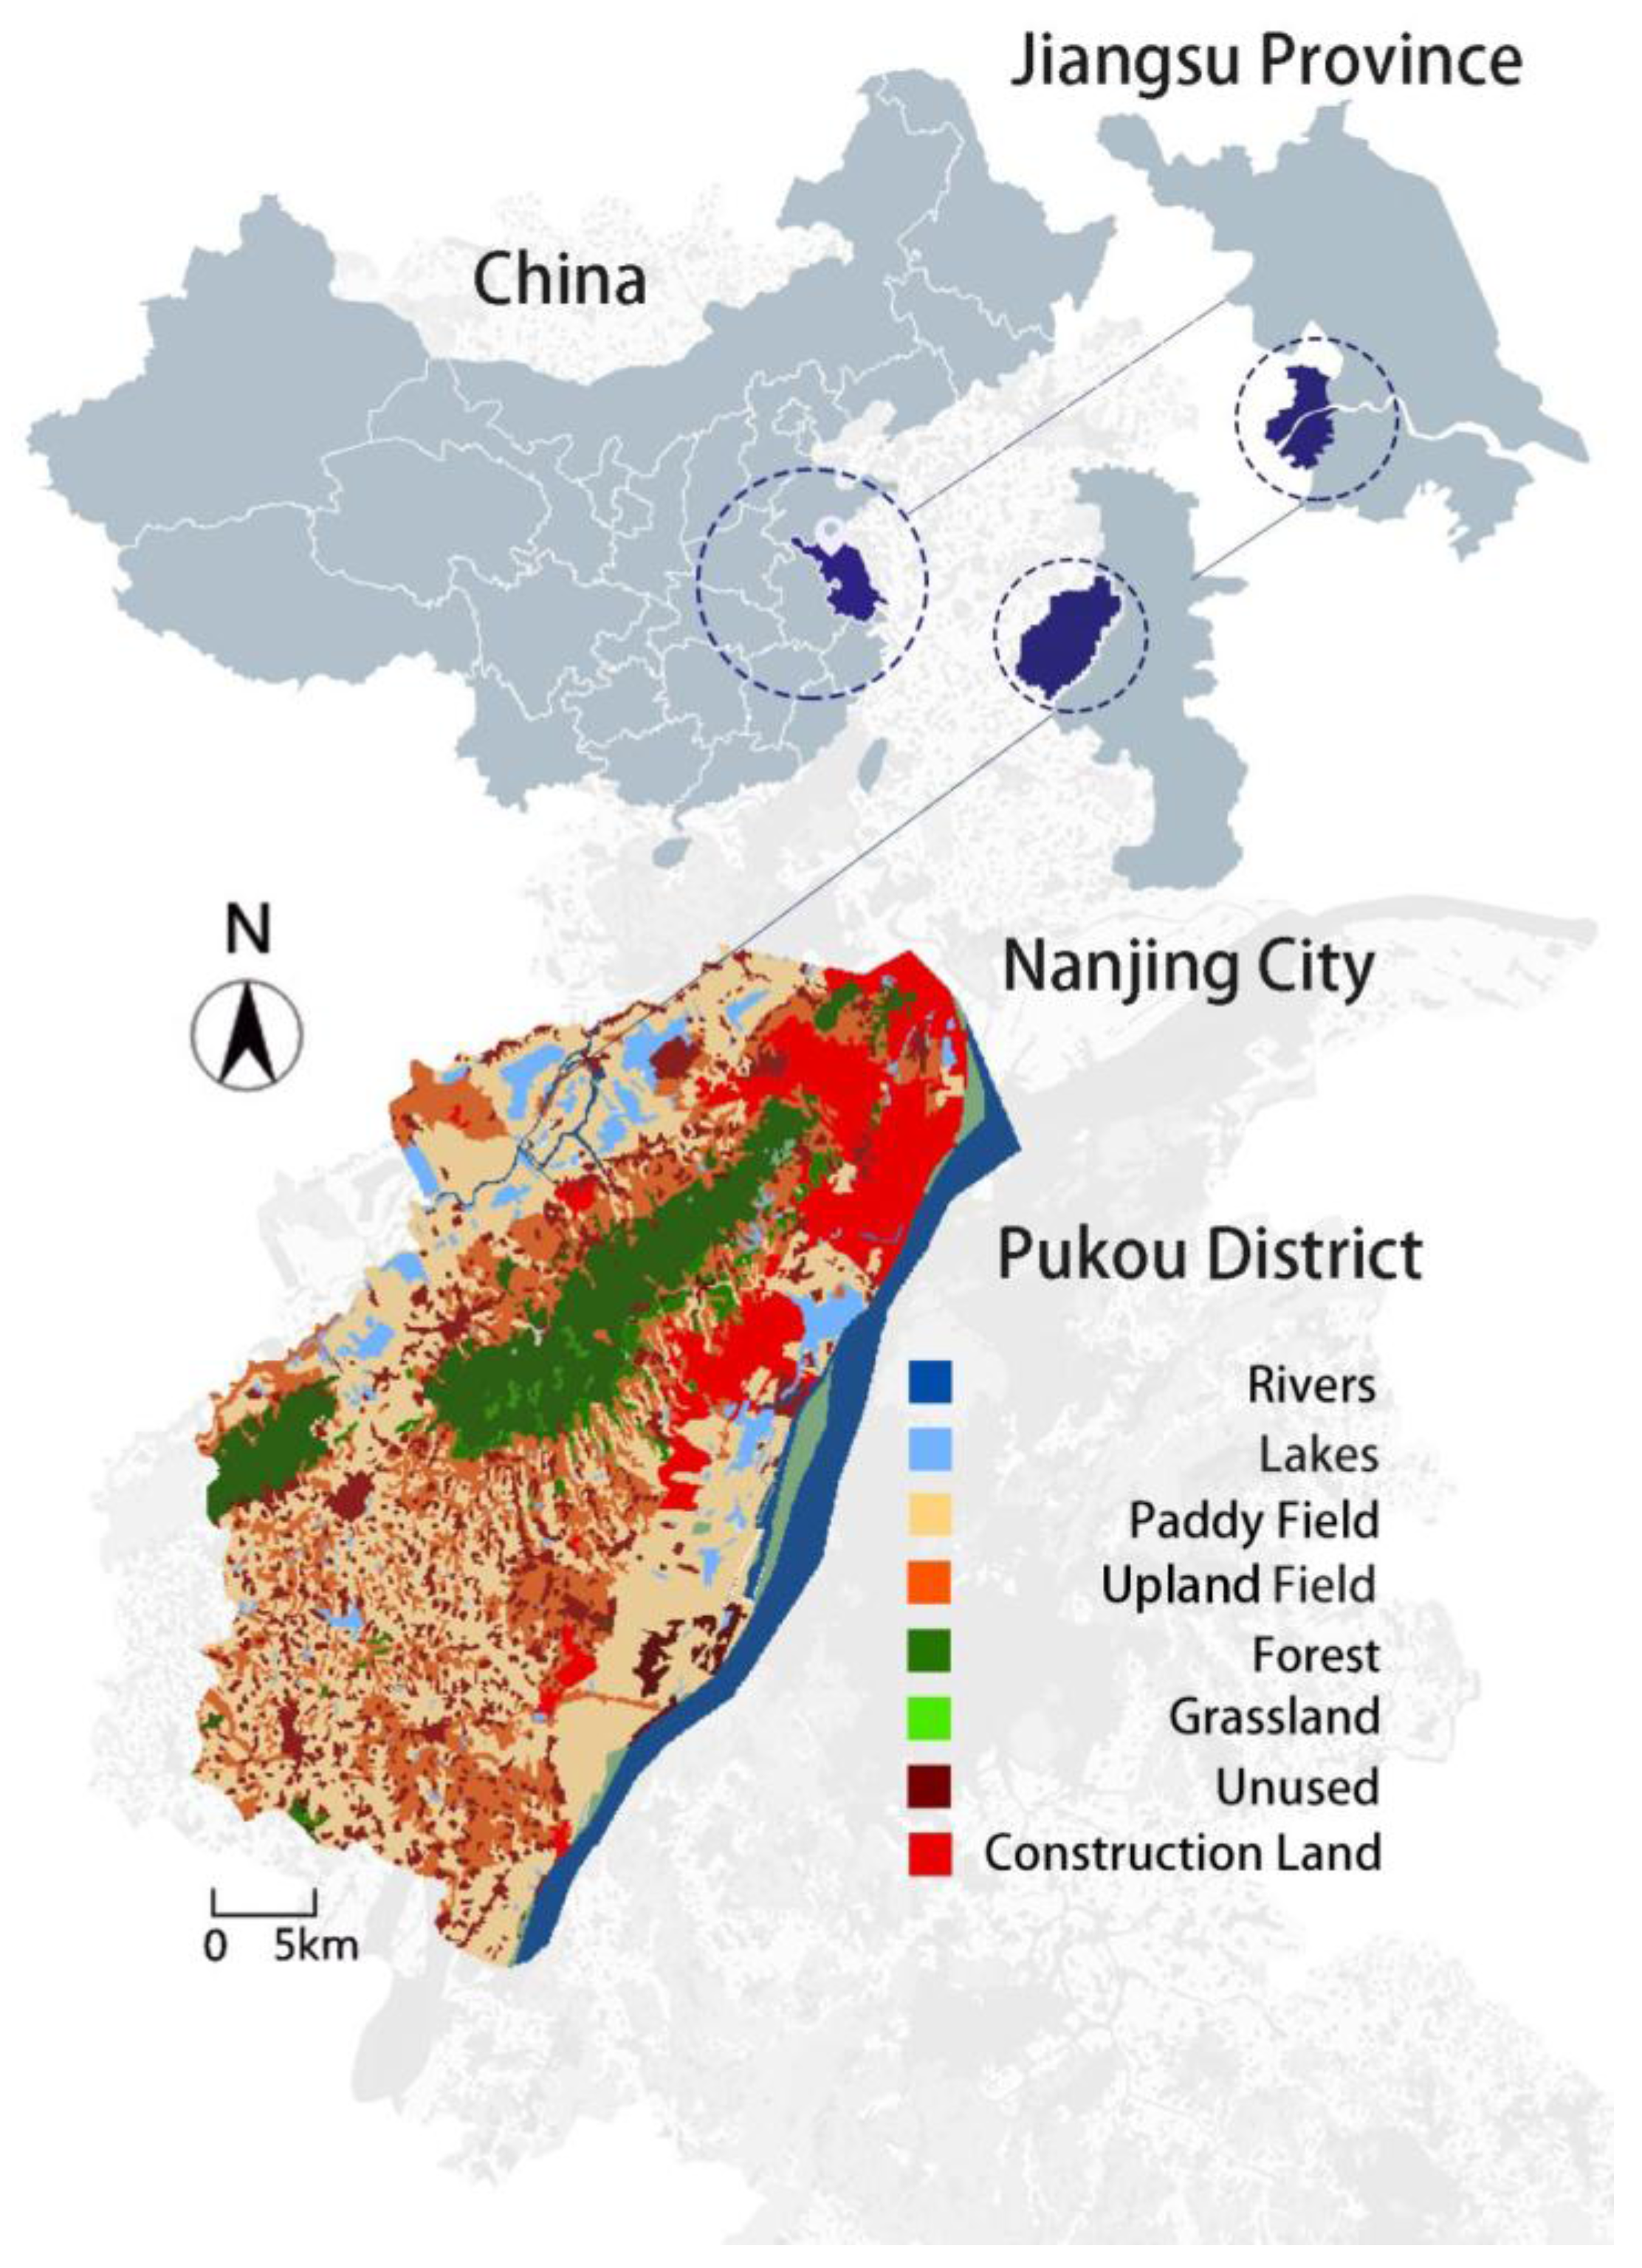
2.1. Study Area

The Pukou District (118.21° E–118.46° E, 30.51° N–32.15° N) is located in the northwest of Nanjing, China. The region covers an area of 913 km2. It is located on the northwestern edge of a hilly area between Nanjing, Zhenjiang and Yangzhou with highlands in the middle region and lowlands in the south and north (Figure 1). It has a subtropical monsoon climate with distinct wet and dry seasons. Along with rapid economic development and urban expansion, the Pukou District is increasingly facing the following contradictions and conflicts between ecological protection and economic development:
  • The green infrastructures in the Pukou District (including woodlands, agricultural lands, wetlands, etc.) have been highly fragmented due to the rapid expansion of the built-up area over the past several decades and pose great pressure on biodiversity conservation with decreased connectivity between the increasingly isolated GI patches.
  • The native plant communities were severely damaged by urban sprawl but they play an important role in biodiversity preservation.
  • The Pukou District has been a hotspot region of urban growth in Nanjing and has become more critical in coordinating the relationship between urbanization and nature conservation for achieving the goal of smart growth.
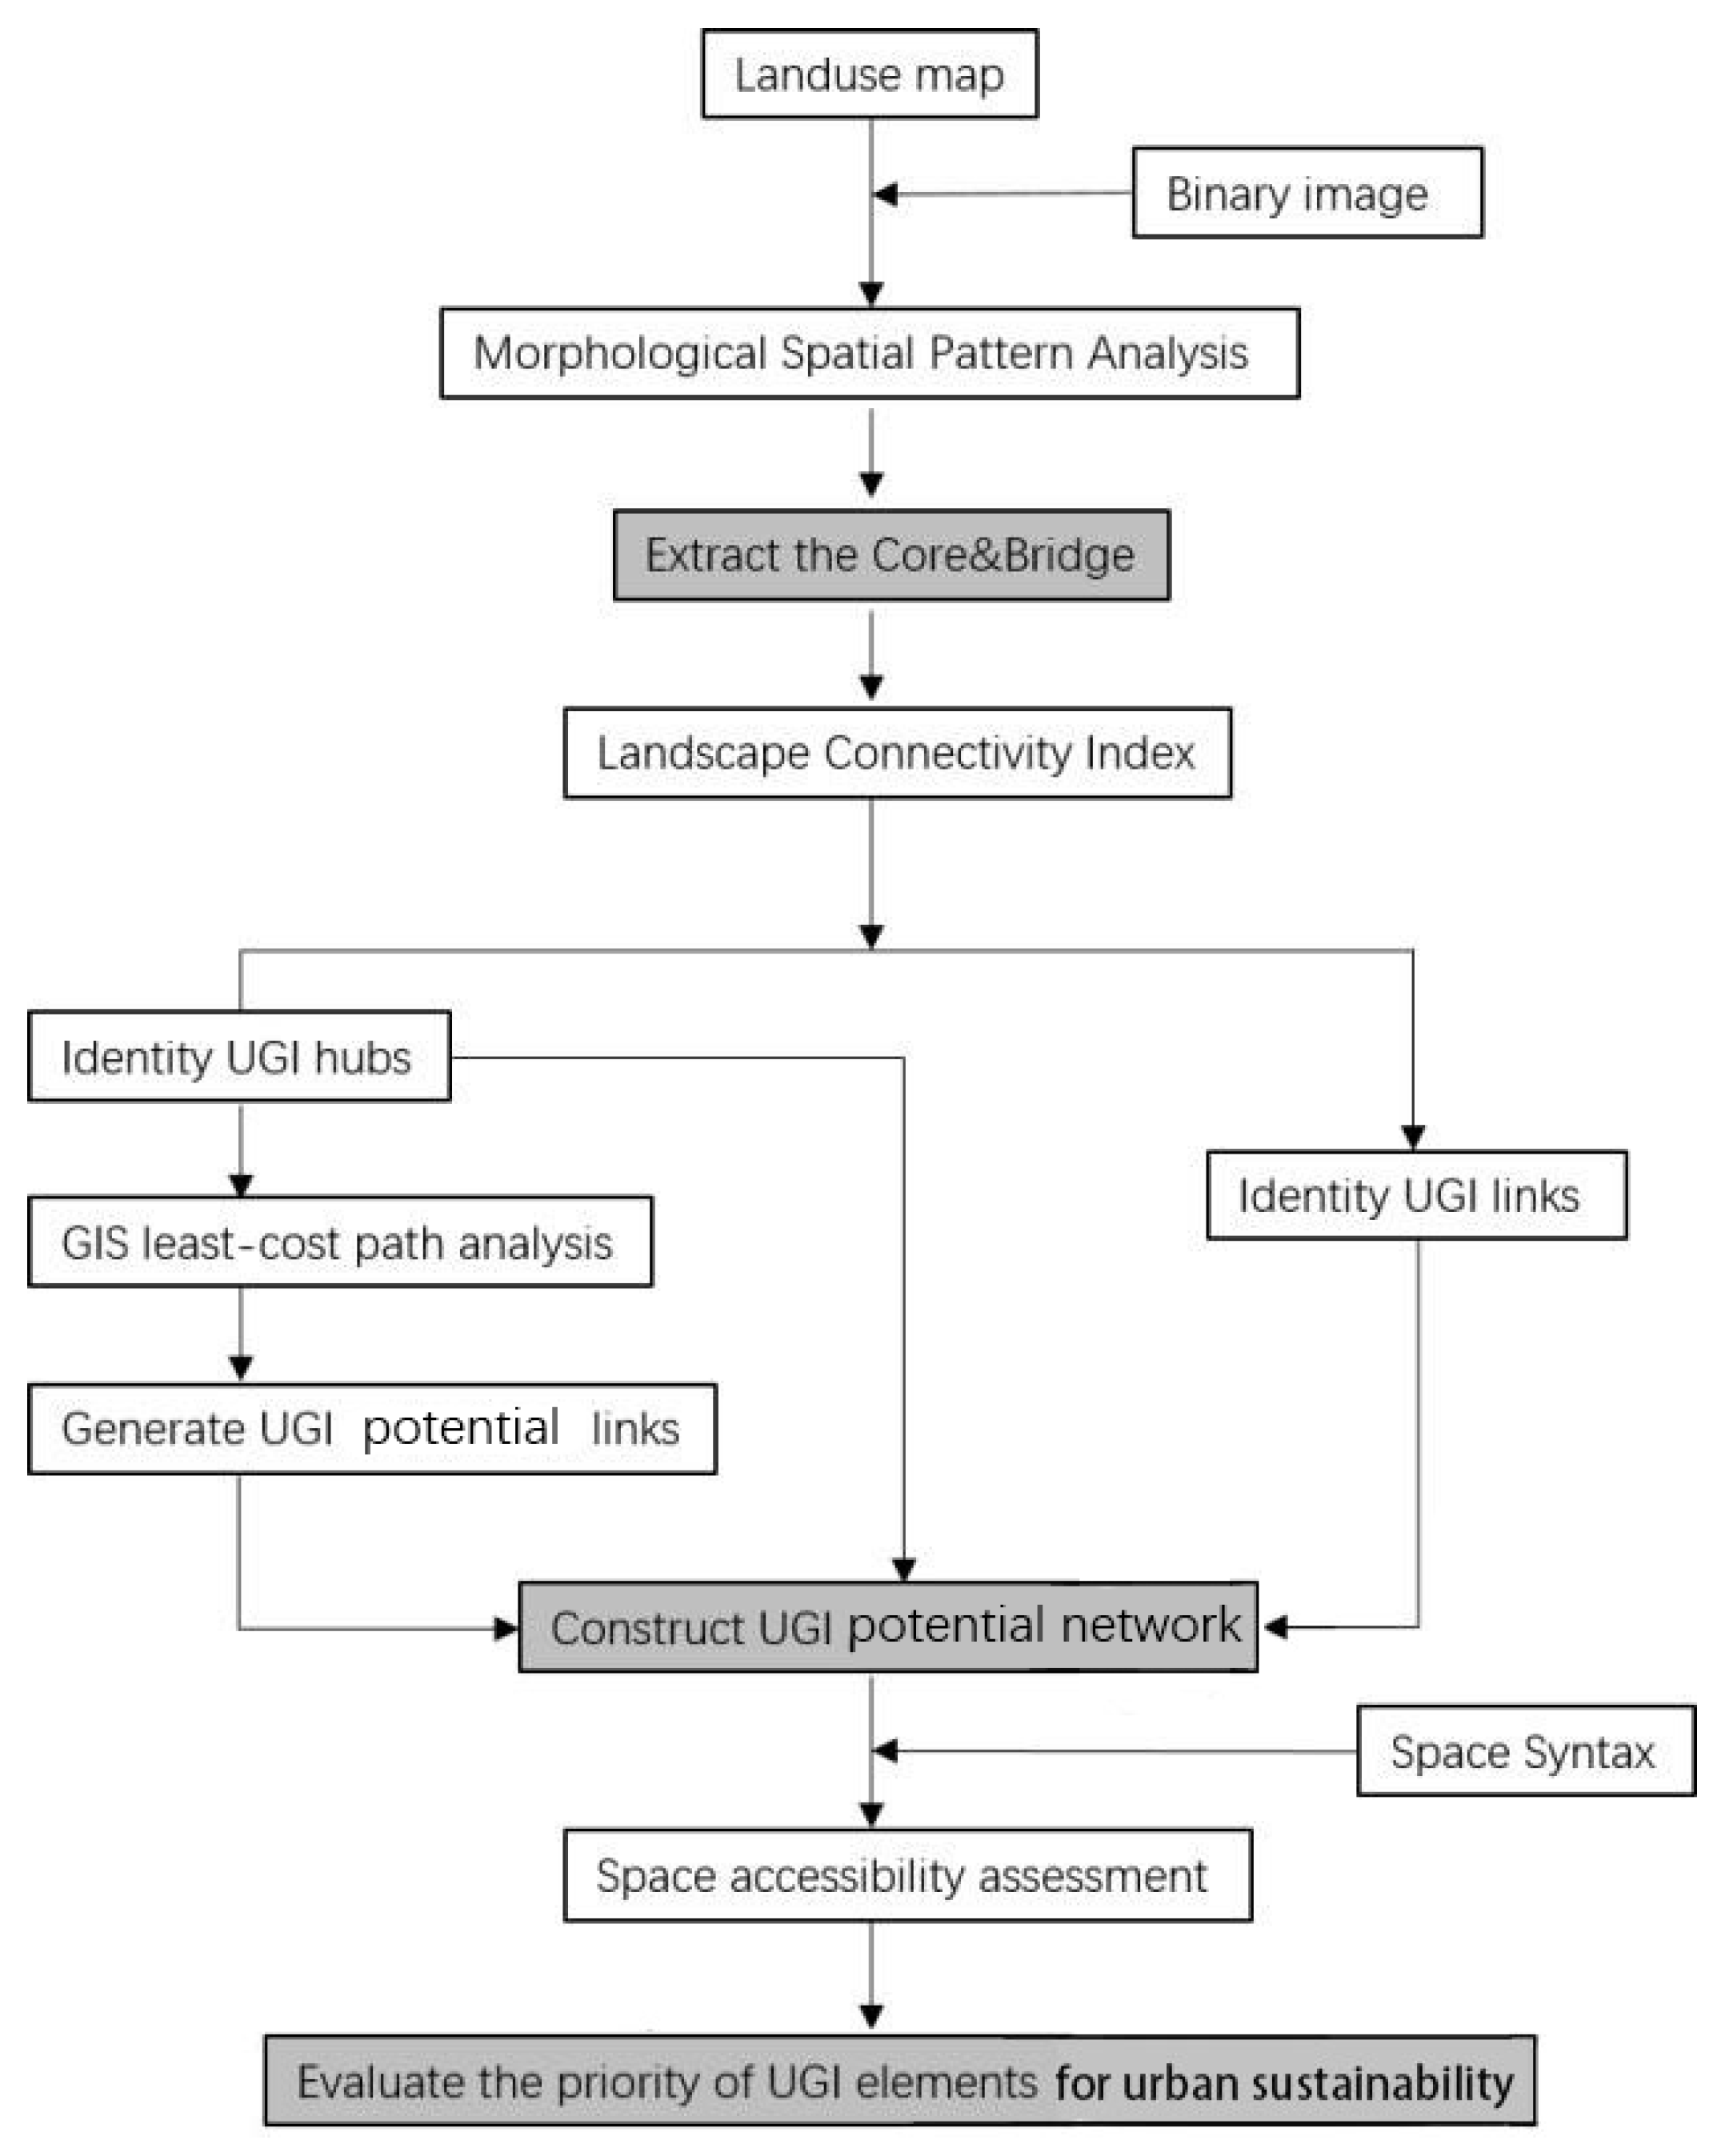
Owing to limited urban land resources, it is more important to construct the UGI network with the process of rapid urbanization. The data sources for this study include: (1) land-use map of the Pukou District in Nanjing in 2015; (2) topographical map of Pukou District; and (3) information on natural resources, including water and lakes. The urban green infrastructure includes the following land-use and land-cover types: rivers, lakes, forests and grasslands.

2.2. Method

All steps in this study are illustrated in Figure 2 and are explained in the subsequent sections: (1) extracting the UGI elements and determining the core area and bridge area in terms of MSPA; (2) identifying the UGI hubs and links by landscape connectivity; (3) adopting the least-cost path model to construct the potential UGI network; (4) evaluating the priority of network through the spatial syntax model.

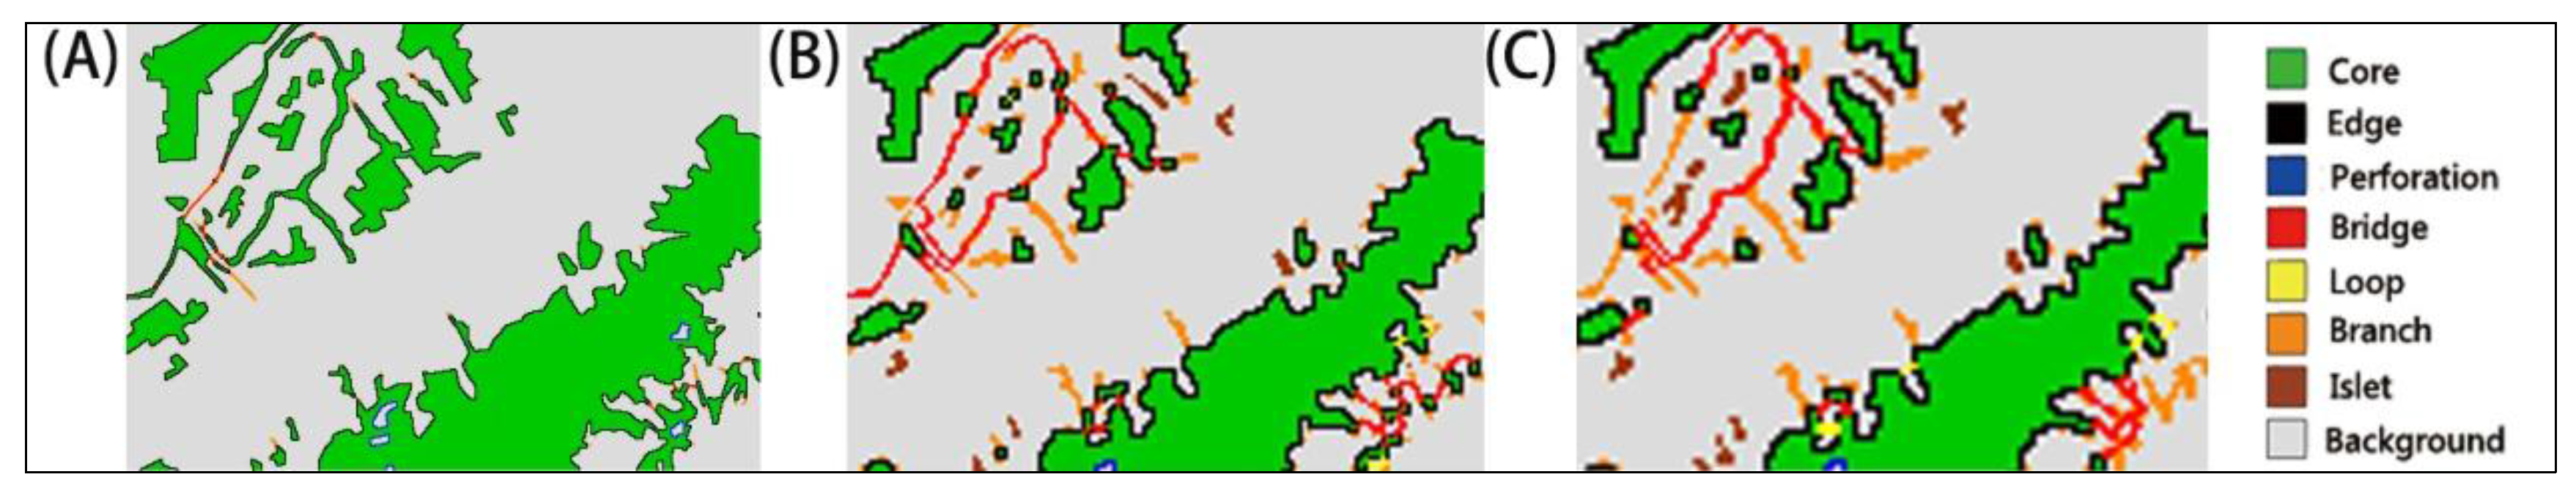
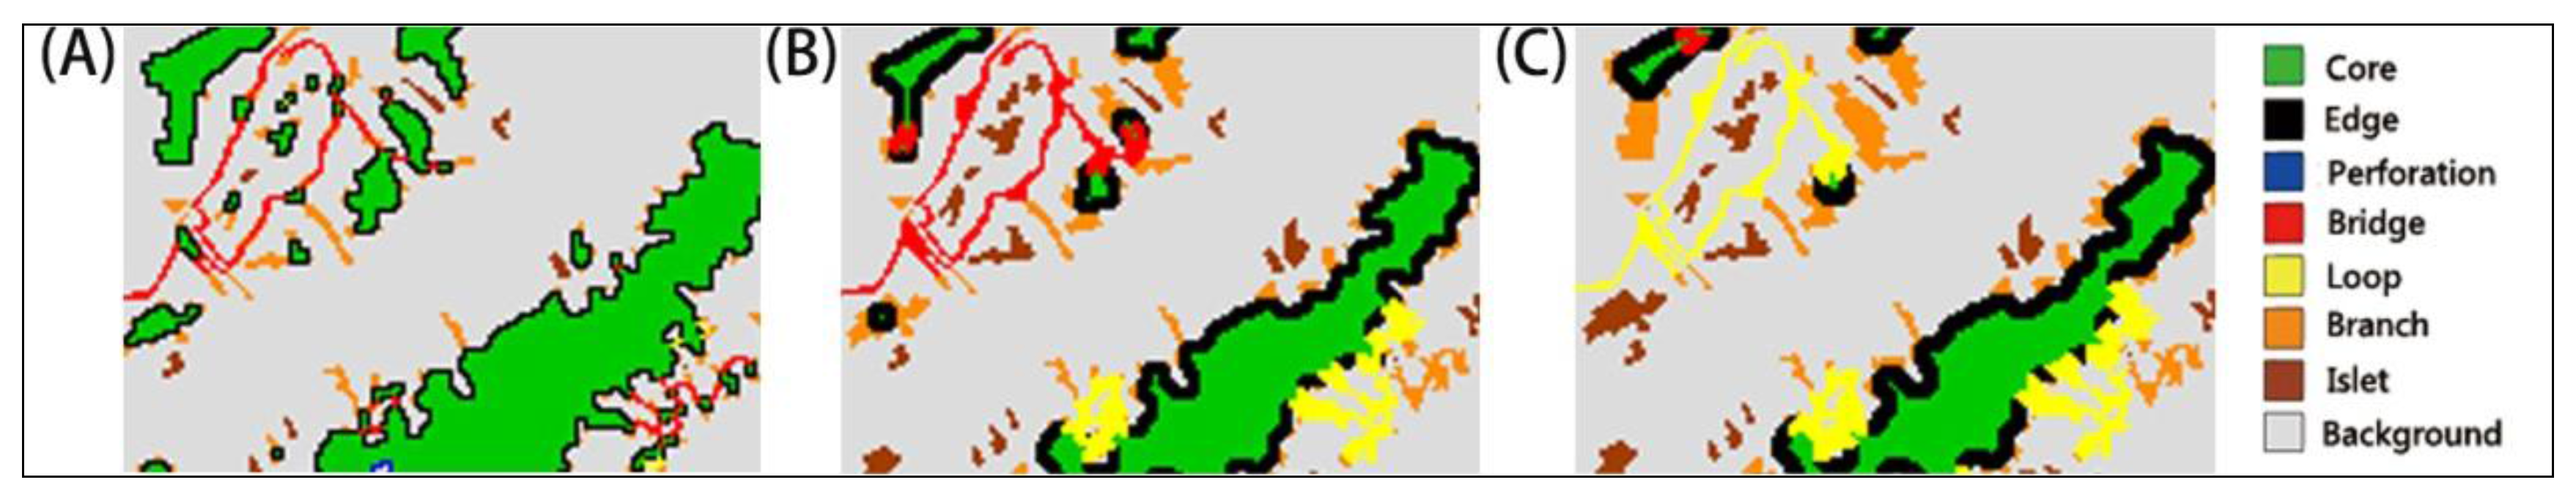
2.2.1. Phase 1: Extracting the UGI Elements

The first step of the method was to extract the UGI elements. MSPA mainly uses the Guidos Tool Box software to present the binary type image of land use and analyzes the landscape pattern by identifying the spatial position of each foreground pixel (woodland, wetland, water body, etc.). Based on the 8-connectivity analysis, the landscape was divided into seven types: core, islet, perforation, edge, bridge, loop and branch (Table 1). The core area and bridge area were extracted, which is important to maintain the connectivity of the GI network. This method has been used to analyze spatial patterns and functional connectivity of forests in forest ecology studies [30].
MSPA is very sensitive to the resolution of the land-use image (Figure 3), and varied parameter settings may result in different outputs of MSPA. When the resolution of the land-use map was set at 30 m, 87.8% of the foreground was classified as core area, with only 0.2% of the foreground classified as bridge area. With a resolution of 120 m, 58.6% of the foreground was classified as core area, while 10% of the foreground was classified as bridge area. Increasing the width of the edge increases the minimum size of the core (Figure 4). By reviewing the ecological corridor width threshold in landscape planning research [31,32], we set the pixel size and edge width to 90 m.

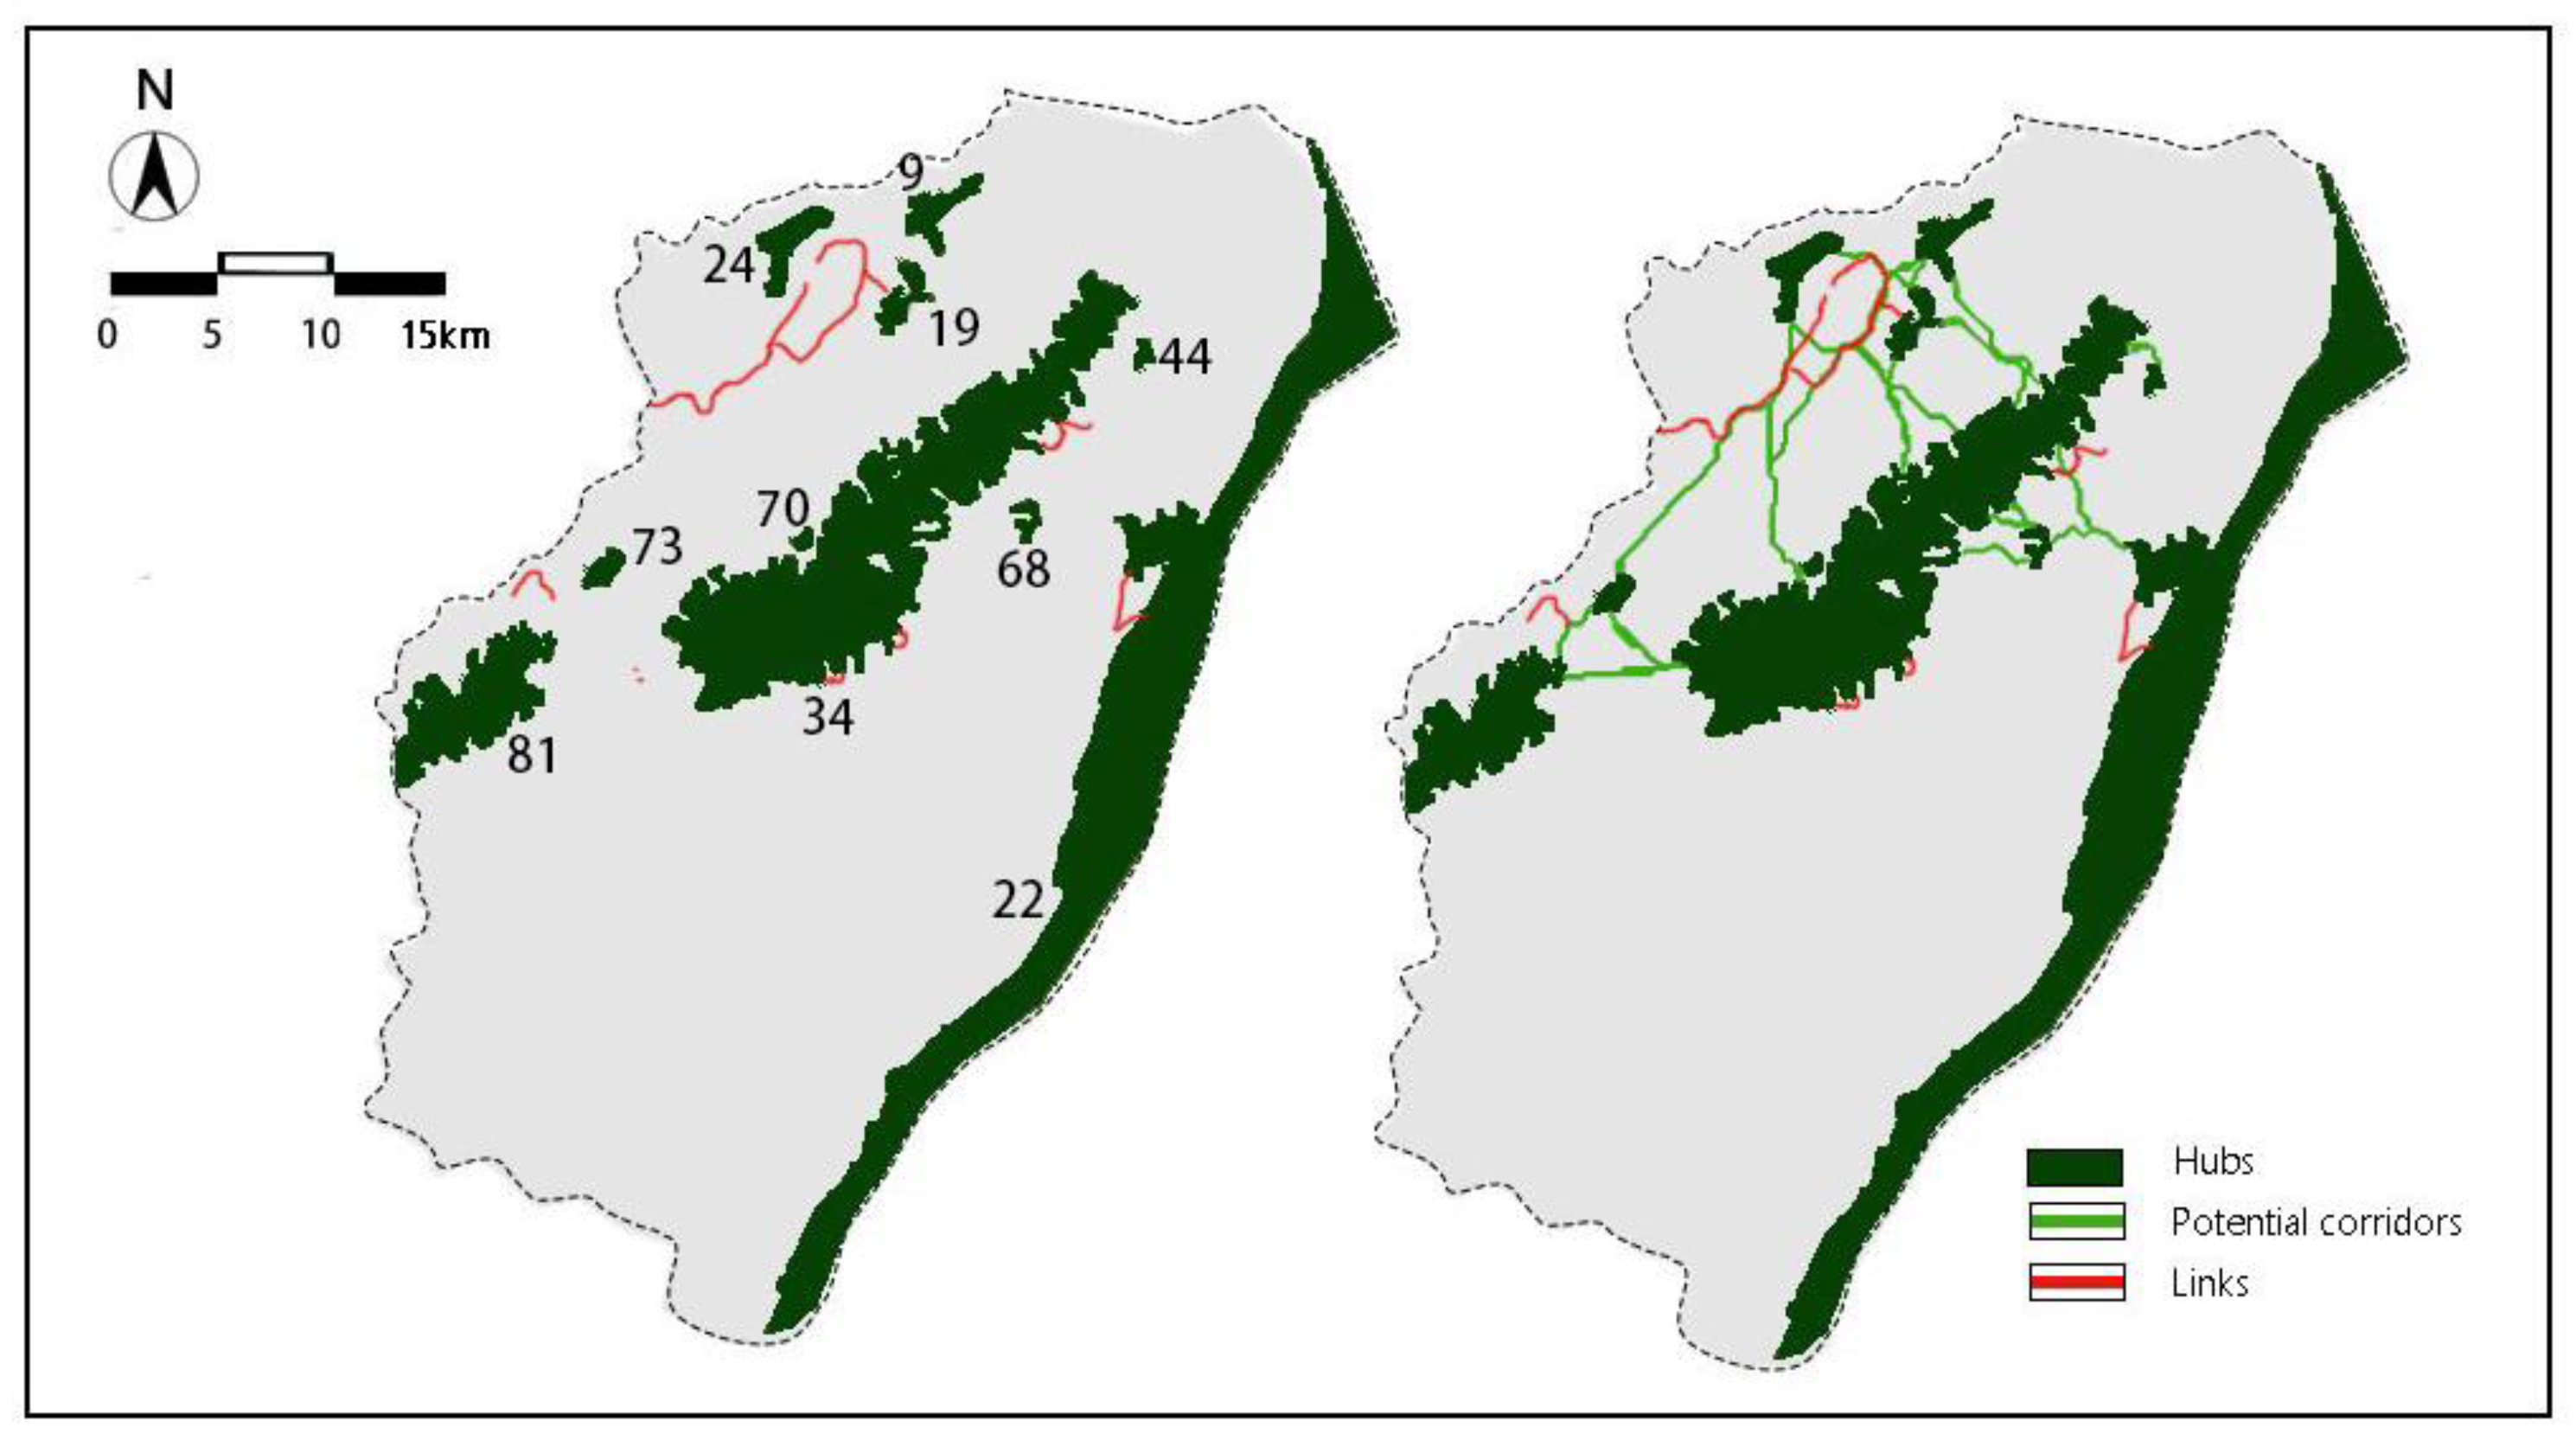
2.2.2. Phase 2: Identifying UGI Hubs and Links

The second step was to identify the UGI hubs and links. The Probability of Connectivity (PC) index was used to measure connectivity that has the richest connection model of the measures with widespread use in connectivity evaluation. The delta of PC represents the contribution of a patch to the connectivity among other patches [32]. It allows the identification and prioritization of important patches that mostly contribute to overall landscape connectivity.
They are given by the following formulas:
P C = i = 1 n j = 1 , i j n p i j * a i a j A L 2 ,   d P C ( % ) = P C P C P C x   100 %
where ai and aj represent areas of habitats i and j; and AL is the entire study area comprised of both habitat- and non-habitat patches. The strength of each link is described by Pij, which marks the probability of a direct dispersal between the patches i and j.
The migration distance threshold [33] was set to 600 m, and the probability of connectivity was 0.5 based on the Conefor software platform (Madrid, Spain) and previous research [34]. After sorting the dPC values of the core area in descending order [35], the most important 10 patches, whose dPC values were >0.6, were sorted and marked as UGI hubs. Twelve links in the bridge area, with dPC values >0.01, were considered as UGI links. The calculation of the relevant index followed the Conefor 2.6.6 User’s Manual (Conefor, Madrid, Spain).

2.2.3. Phase 3: Generating the Potential UGI Network

The least-cost path model is widely used in generating the potential UGI network [36]. Potential connectors are linear belts along the least-cost path connecting core areas. Referring to previous research [37], we established the resistance values of different land-use types and constructed a UGI network consisting of 45 potential corridors with 10 hubs and 12 links sorted by Conefor.

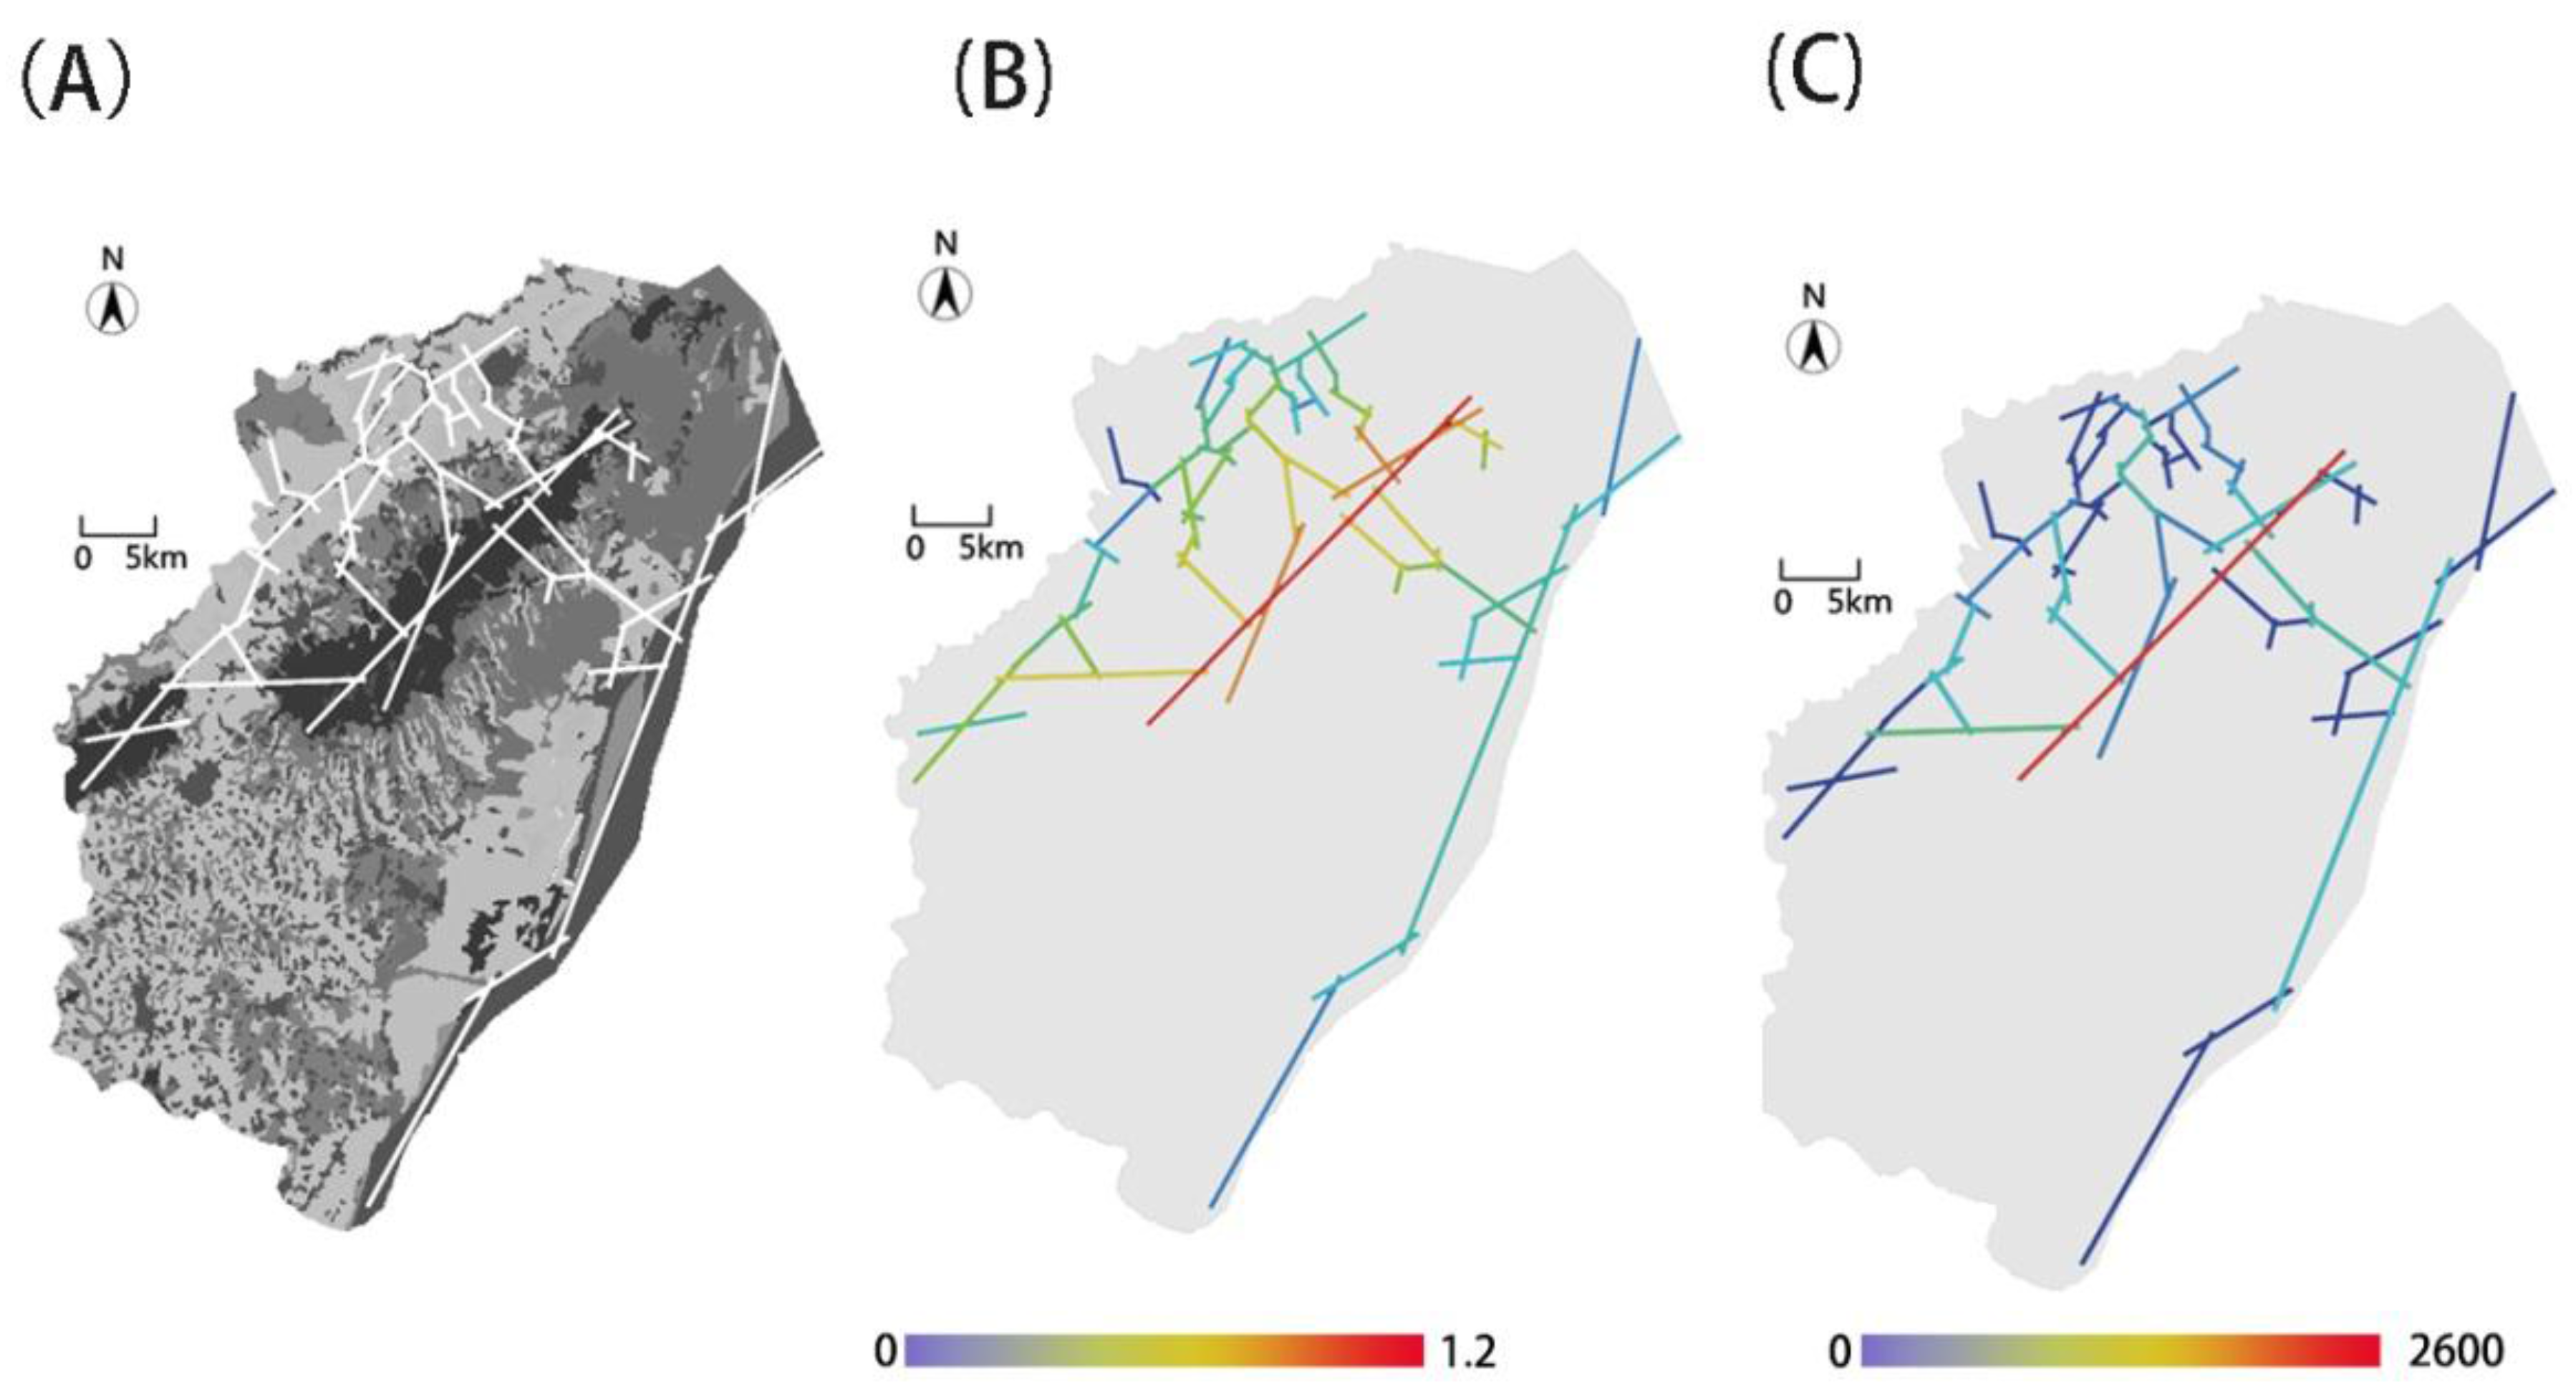
2.2.4. Phase 4: Evaluating the Priority of UGI Network Elements

Space syntax was used to analyze the UGI network to quantitatively measure spatial integration accessibility. The network was first converted to a convex space based on the “axis method”, which can be used to generalize space through straight lines according to a set of established rules, and transform the space into the system which was composed of straight lines, hence creating the axis system of the research area. In addition, syntax variables of space syntax, such as connection, control, depth, integration and choice, were used to analyze the spatial structure of GI. Two main metric variables were used in space syntax: (1) Integration (evaluating whether the UGI network is easily reachable); and (2) Choice (clarifying the spatial benefit-cost ratio of the UGI element) [38]. Integration and Choice can be used for the priority evaluation of key elements in the GI network based on space accessibility for people. The general integration and choice of the axis system were calculated in this way to determine hubs and links in this network of research area. After comparing the space syntax index of each axial, we divided the UGI elements into 3 classes by their general integration and choice index (Table 2). The first class of hubs and links should be protected with space priority. The calculation of the relevant index was applied following the Depthmath’s User’s Manual.

3. Results

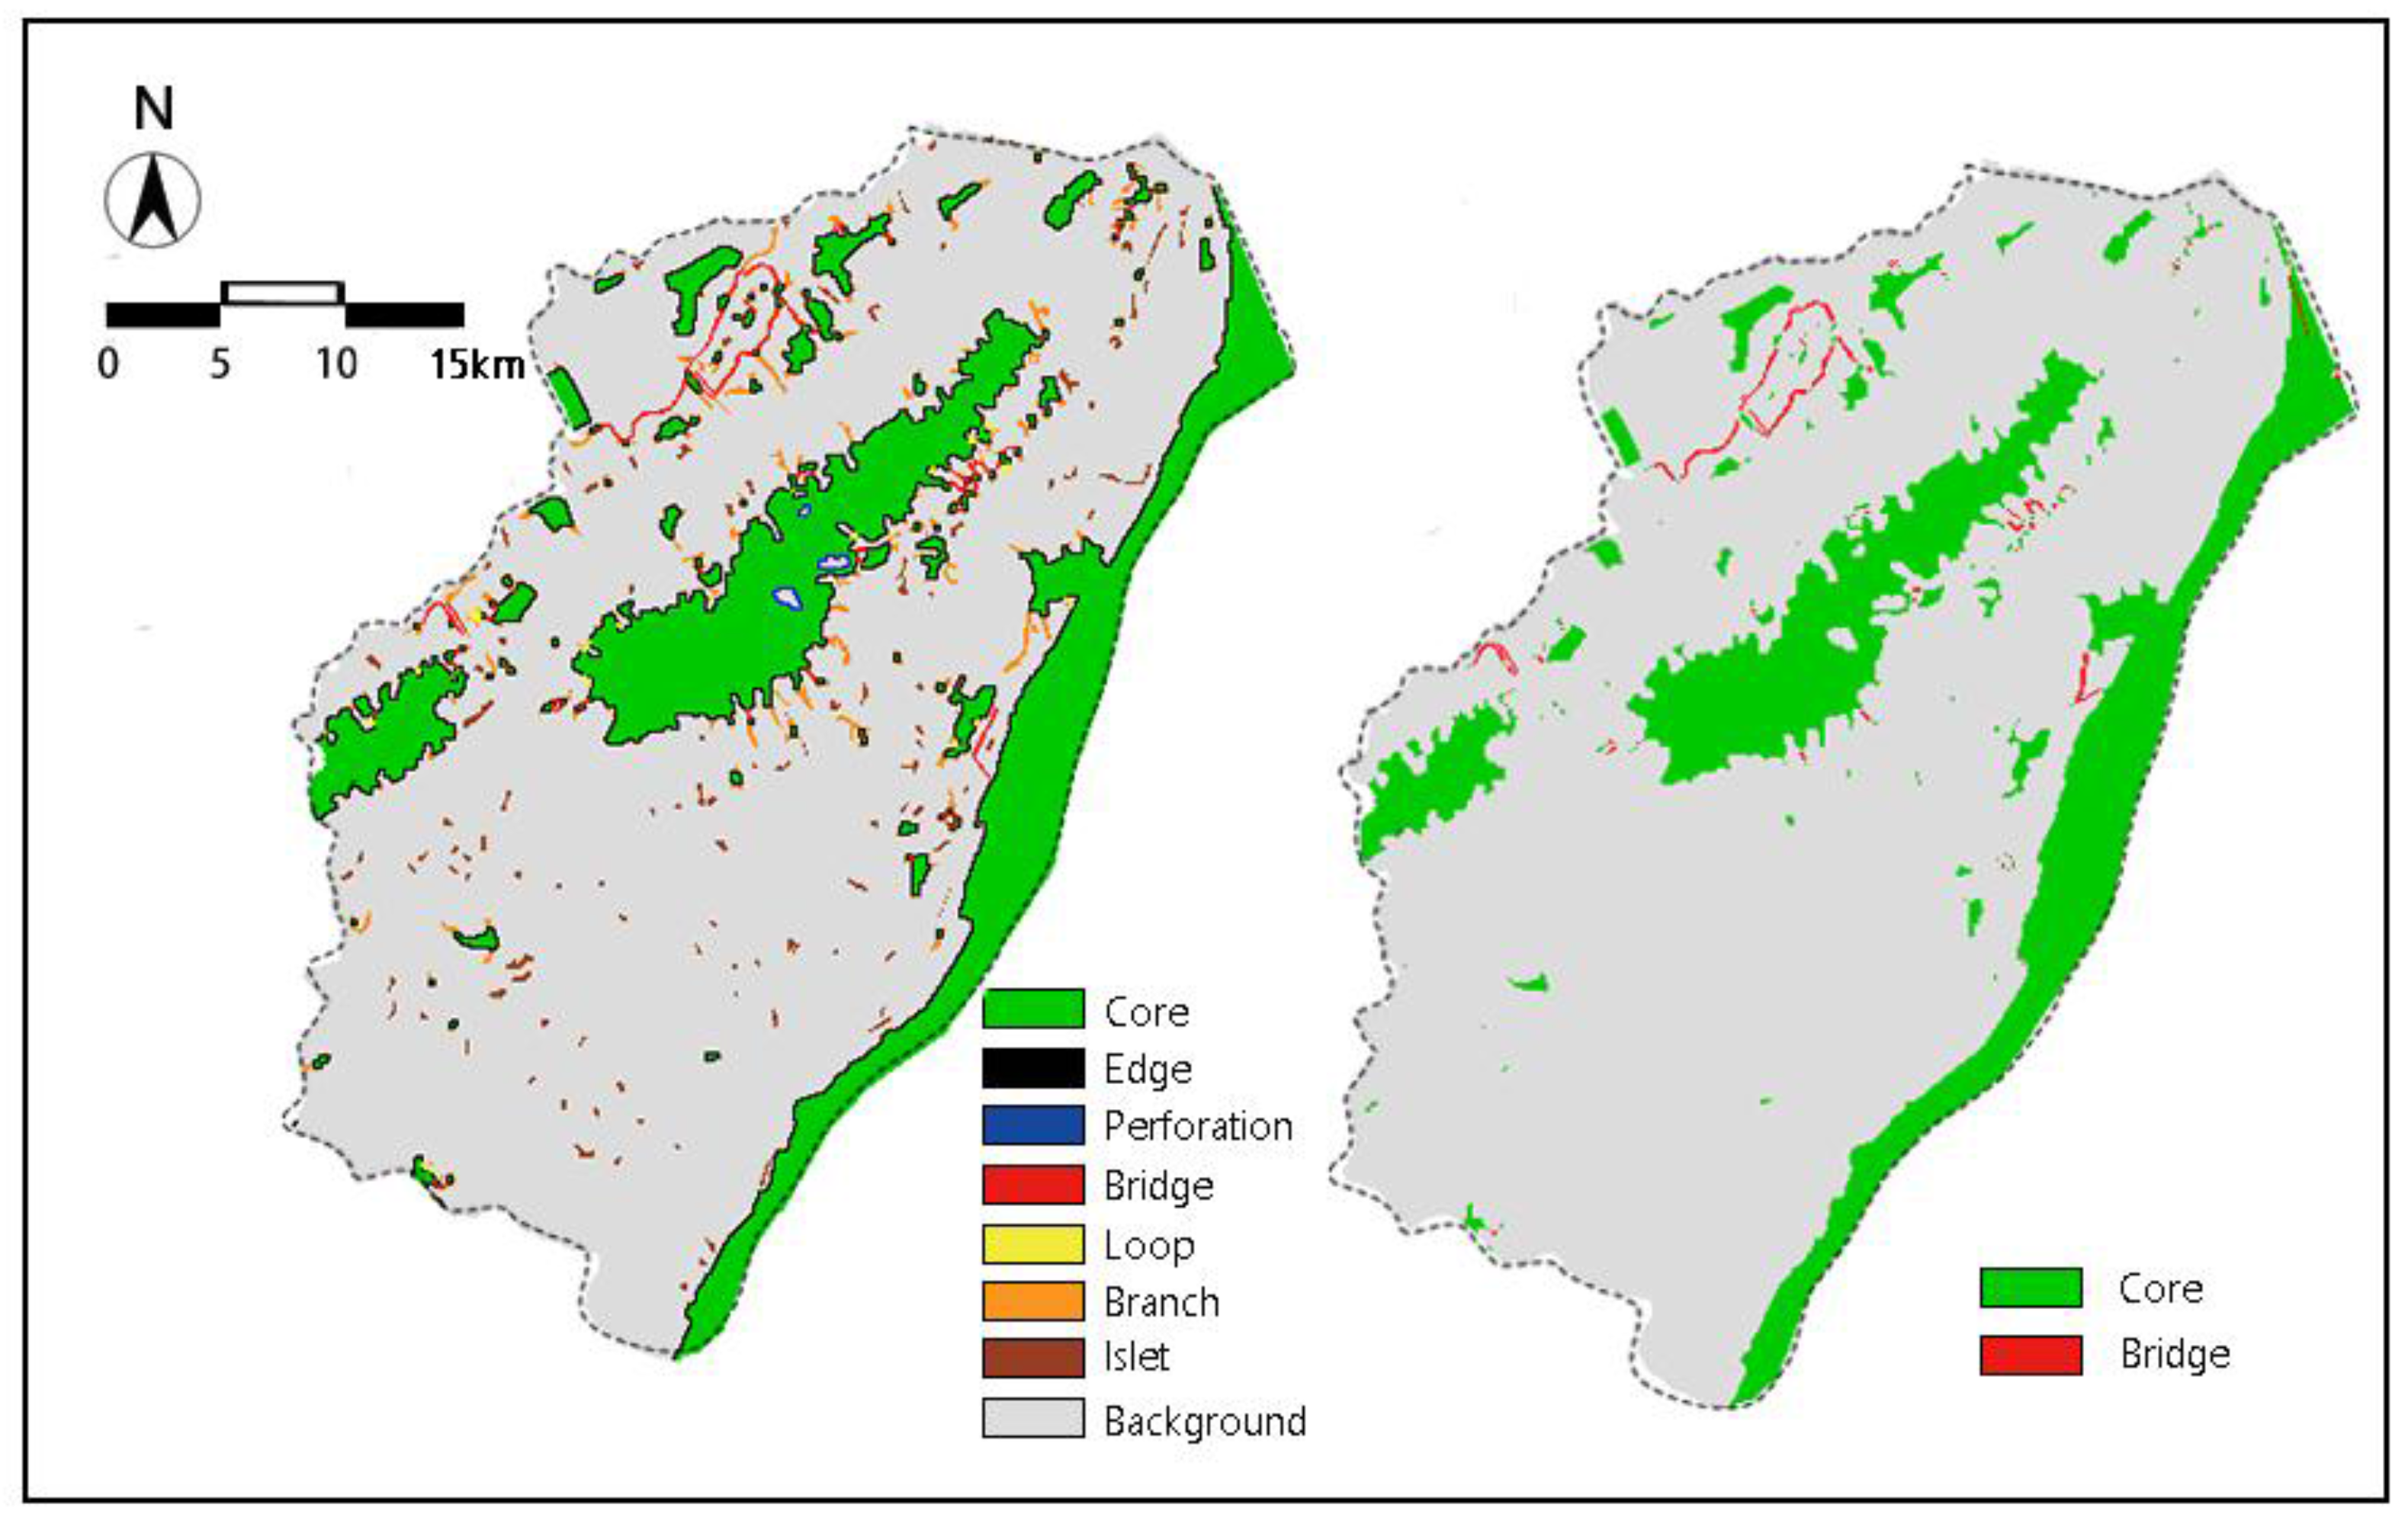
3.1. Identifying the GI Network Elements

Our results showed that MSPA can quickly identify the structural elements of the UGI, core and bridge (Figure 5). The core area covered 163.34 km2, consisting of 115 patches and covering 71.62% of the total area of green land (Table 3). The bridge area, as the structural corridor of UGI, is 4.57 km2 and occupies 2.21% of the total area of green land. The edge area is the outer part of the patch, while the perforation is the inner part, occupying 15.79% and 0.31% of the total green land, respectively. The branch area, which is essential for improving landscape connectivity and can be identified as broken corridor, occupies 5.74% of the total area of green land. The islet area occupies 3.73% of the total area of green land. The loop area is 0.91 km2, accounting for 0.61% of the total area of green land, which provides species with migrating corridor within the patch. Except for core and bridge areas, the rest of the elements of GI corresponded to MSPA classes that do not contribute to structural connectivity and are not considered in this study. The high percentage of core areas indicates that these core patches are of vital importance to preserve connectivity.

3.2. Identifying the UGI Hubsand Links

An intact hub should include core, edge and perforation. When the 115 core patches had been identified by MSPA and sorted according to their importance for the whole network, 10 with the best connectivity were selected as hubs (Table 4). Furthermore, the location or size of a green space or patch was not necessarily proportional to its role in ecological connectivity. For instance, compared to Patch 9 and Patch 24, Patch 70 was smaller, but its importance values are higher (Table 4). The geometry location of GI is also unrelated to its importance; patches located near geometric centers are not necessarily the most important patches.
The dPC value of hubs range from 0.63 to 56.89. Mountain areas (Patches 34) have the highest importance value and largest area and therefore an absolutely dominant advantage in green infrastructure (Figure 6). Despite occupying a larger area, the mountain in the north of this area have poor landscape connectivity because its connection with the UGI of other areas is cut off (Figure 6); thus, this area is not selected as the hub.

3.3. Identifying Potential Links in the UGI Network

Figure 6 shows the potential corridors calculated by least-cost path analysis based on the current land use map. According to the principle of least-cost path, we can infer that these corridors are mainly green space, though other land cover such as construction area may occur along linkages. These corridors are based on the existing land cover and GI pattern. The links in the east and south are poorly connected, especially in the east suburban area. Hubs are concentrated in the mountainous area and its surroundings. Urban sprawl leads to fragmentation of original green space and agricultural land. However, the corresponding construction of GI receives relatively little attention. Thus, due to the high resistance value of construction land, it is more difficult to maintain organism migration and biodiversity in urban areas.

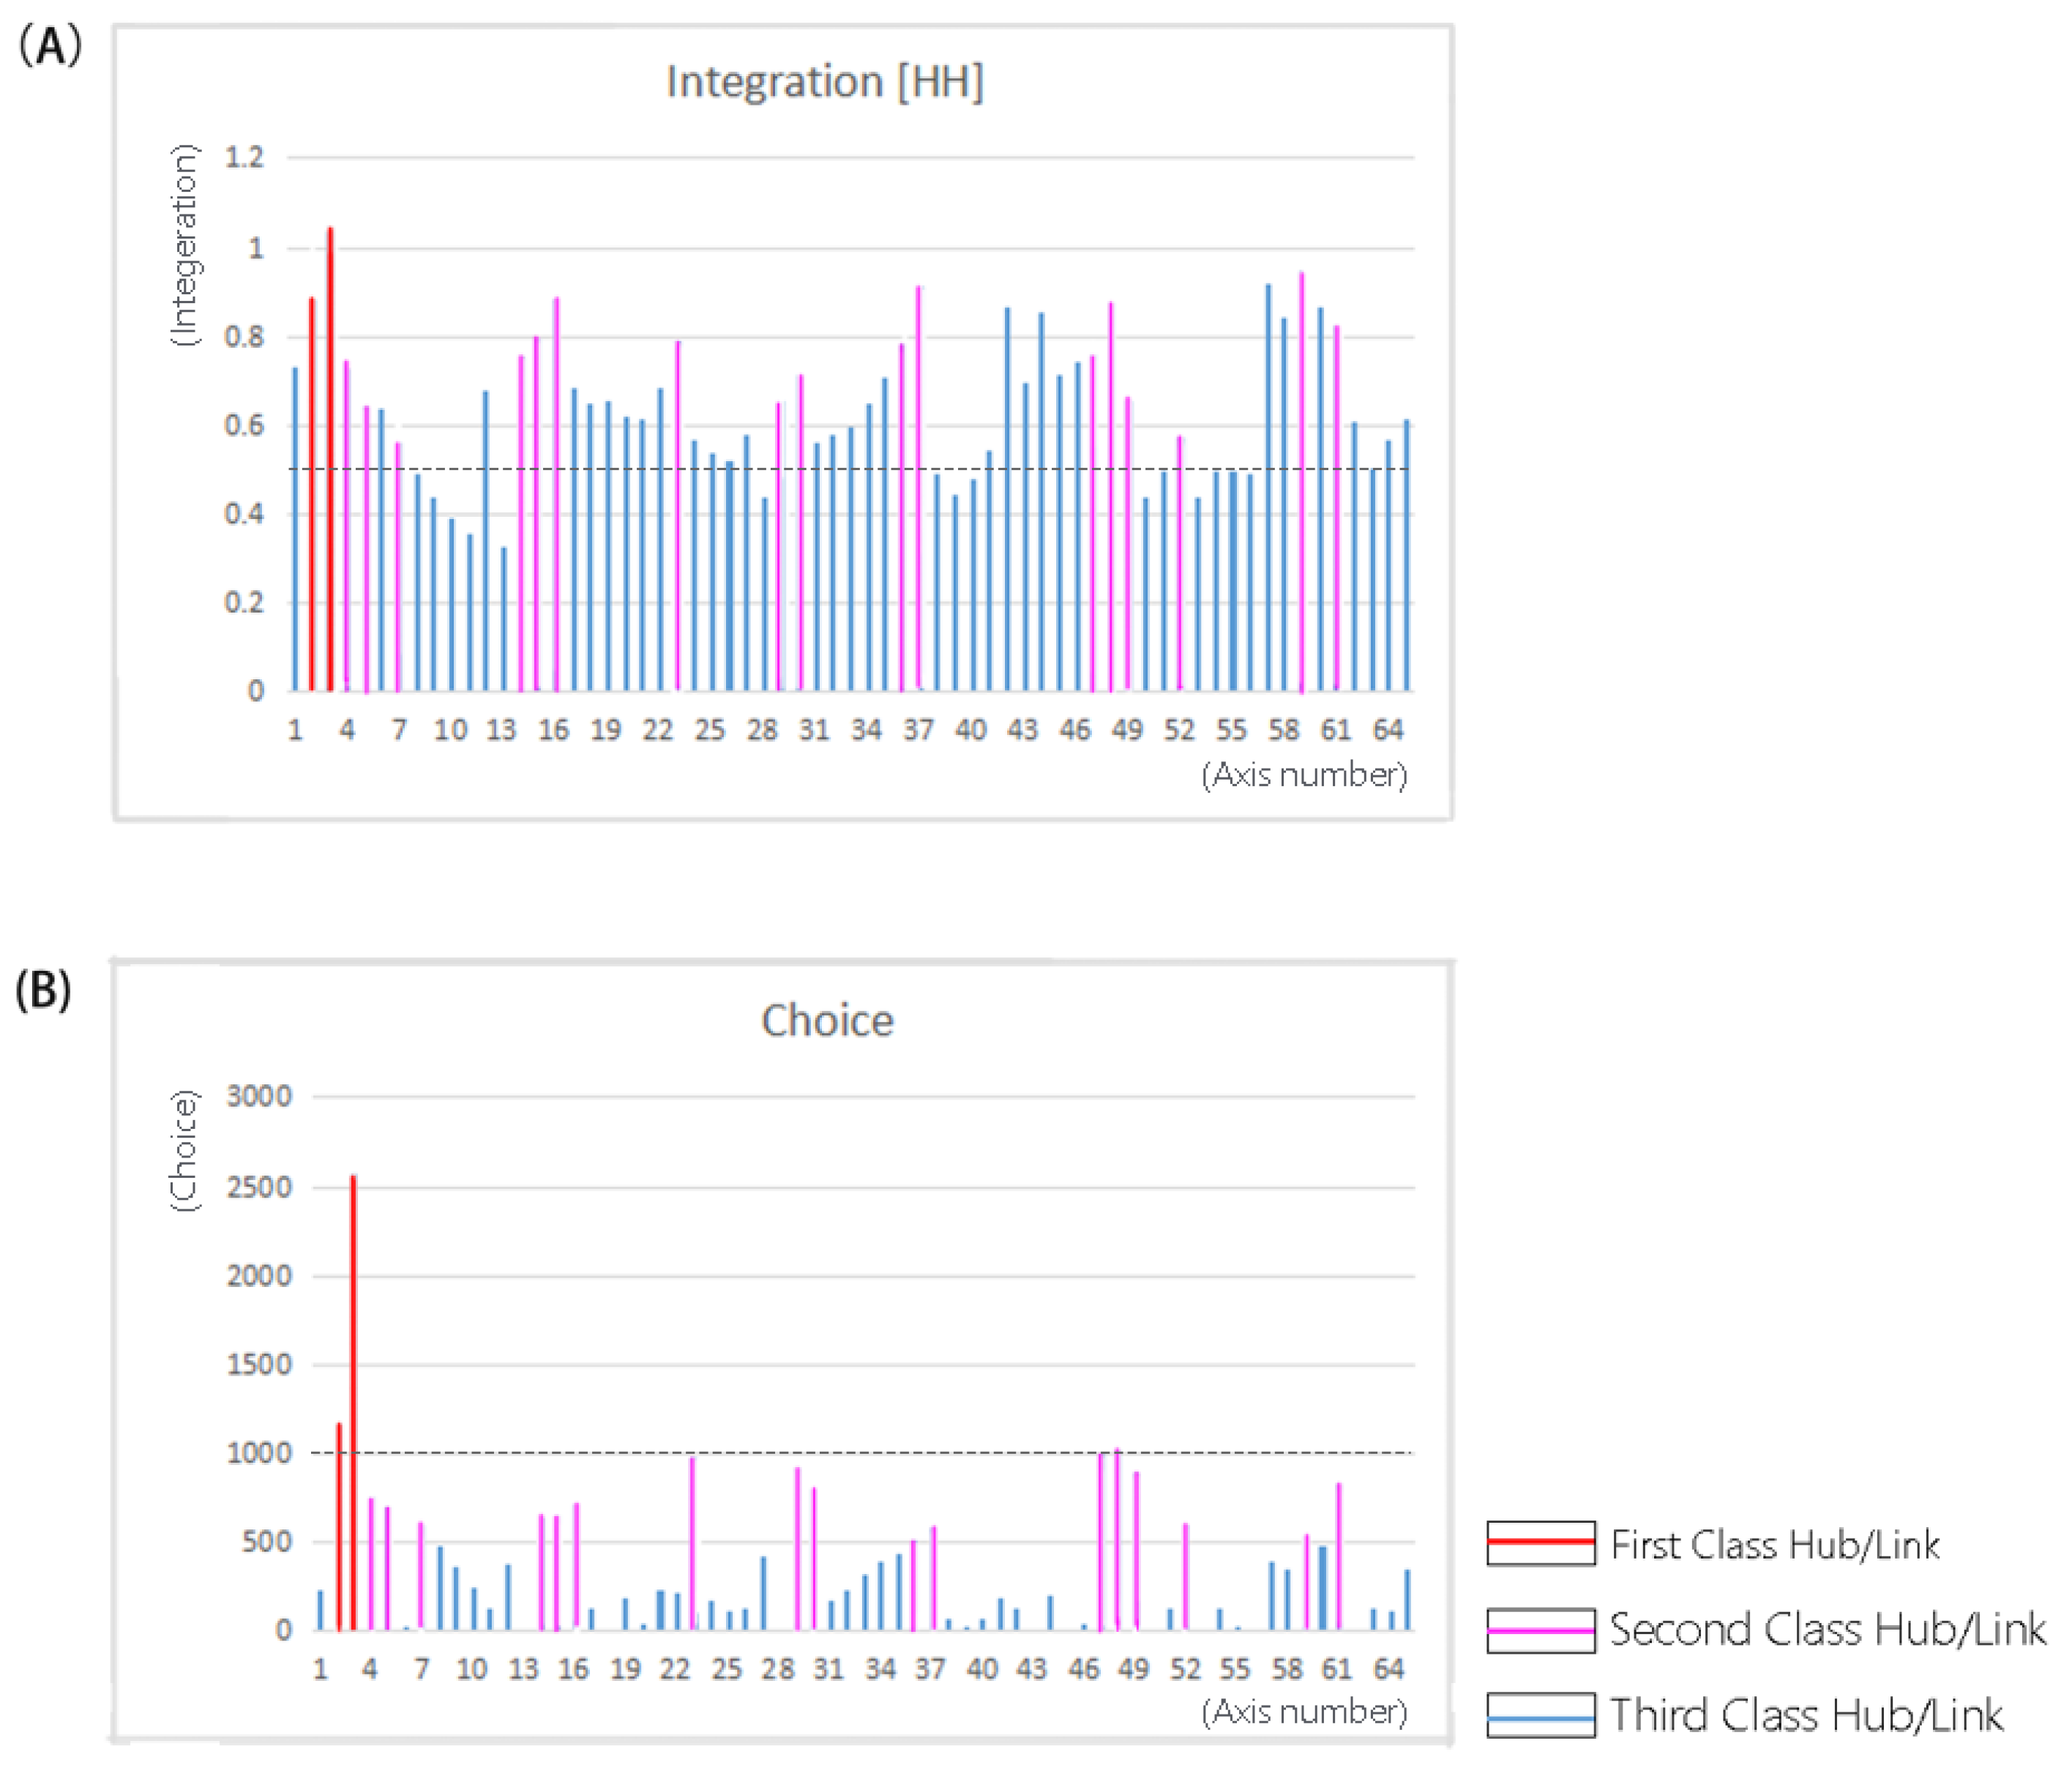
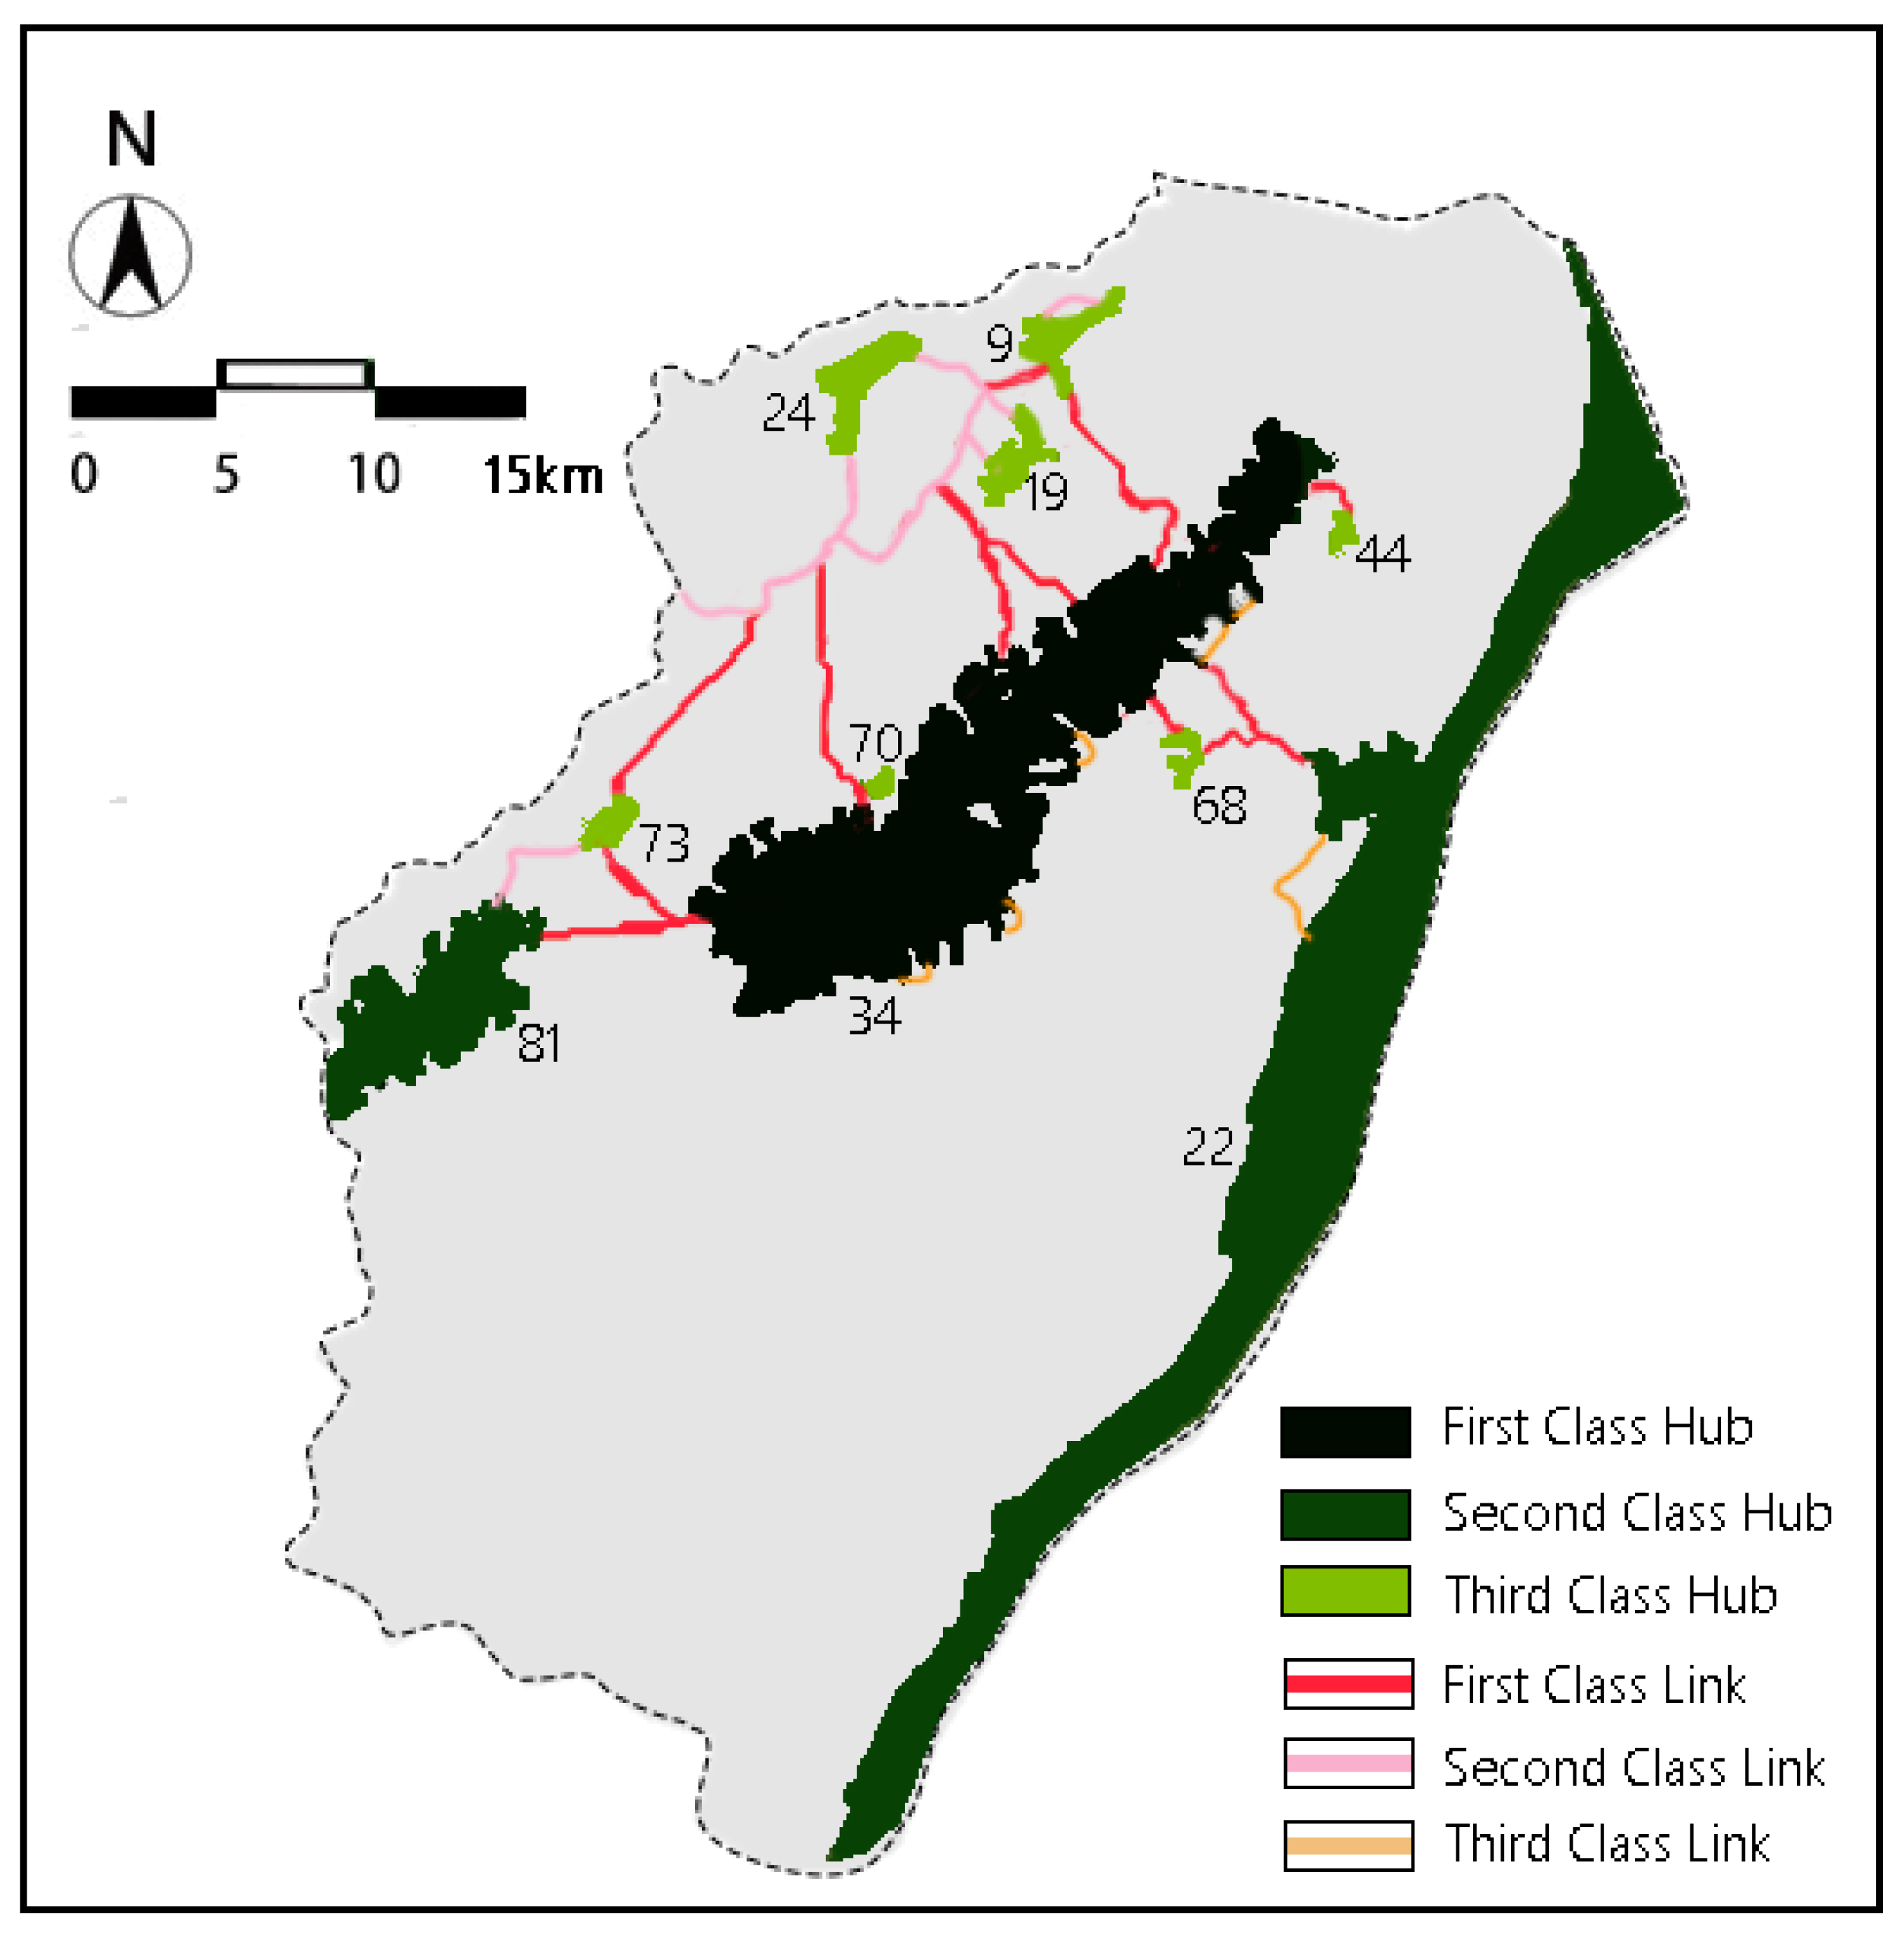
3.4. Priority Evaluation of UGI Network

According to the UGI network constructed above, the synergies among the identified hubs and connecting corridors were further analyzed based on the spatial syntax (Figure 7). In the potential UGI network model of the research area, Patch 34 connecting to Patch 22 had the highest general integration (Figure 8A). Patch 34 and its surrounding links also showed a higher choice than other patches (Figure 8B). The results suggested that Patch 34 should be highlighted as a first class hub and 12 connecting links should be regarded as first class links (Figure 9).

4. Discussion

4.1. Identifying the Current Status of UGI

By combining the analyses of MSPA (focusing on structural analysis) and dPC (taking account of structural connectivity) in this study, we identified 10 cores with higher connectivity value as hubs [39]. The 10 core patches were identified by quantitatively examining their role in maintaining landscape connectivity rather than by simply selecting the ten largest patches in the landscape. In size-based research, the small-sized green patches with a high connectivity value may be ignored. As shown in Figure 6 and Table 3, patch 19 covers a small area, but plays an important role in connecting other green patches in the UGI network. Hence, the selection criteria of hubs were improved in our study. In addition, we found that the MSPA method is very sensitive to the research scale [40]. The increasing edge width may cause the loss of core classes. Therefore, multi-scale research should receive attention in future studies. Moreover, the MSPA method has mainly been applied to extract the core area and the bridge area in previous studies [41]. Researchers should also pay attention to other landscape types such as islet, perforation and branch elements to further improve GI network connectivity (e.g., turning the branch area into a bridge area). In addition, we adopt the least-cost path analysis to delineate the potential UGI structure in this study. However, the LCP method requires basic information about the biological parameters of the target species. In this study, we focused on a broad range of mammalian species and generalized the parameters to run the LCP model [42]. More detailed biological information of the target species should be taken into consideration in future studies.

4.2. Implications and Limitation for Space Syntax

The present study utilized the “axis method” to convert the structure of UGI in Pukou district to an intuitive relationship diagram. The syntax variables such as “integration” and “choice” are used as quantitative measures to evaluate the priority of the UGI spatial structure. The results suggested that Patch 34 should be highlighted as the most important hub, and 12 connecting links should be regarded as the most important links (Figure 9). The space syntax method used in this study represents an attempt to calculate data accurately and reflects the status of the GI network and their relationship with human activities. This method could also help to reveal individual’s fitness as behavior triggers and various other strong indicators which are related to physiological, motivational and cognitive factors [43]. The space syntax method is capable of integrating human behavioral factors into UGI network construction and prioritization. However, space syntax has also some disadvantages. Criticism of the approach from a scientific viewpoint is usually raised because all axes weighted equally neglect the actual space location of distances and linear nodes of patches in the analysis [44,45].

4.3. Application Prospects for UGI Planning and Management

Evaluating the spatial priority of UGI is critical to urban planners when urban space is limited. Unlike traditional studies that are solely based on landscape pattern metrics analyses, this study proposed technical improvements for constructing and prioritizing the GI network for achieving the biodiversity conservation and human well-being enhancement goals. The combined use of the space syntax and the MSPA method provides new insights into planning GI networks. The MSPA method identifies important patches and corridors for maintaining landscape connectivity at pixel levels. Thus, the MSPA method can detect diverse landscape elements and structure at fine scales. The space syntax method reveals the spatial structure of UGI and also associates the spatial structure with the patterns of human movements, stoppage, and exchange by examining the accessibility [46,47,48]. The combined use of these methods can be applied to address the relationship between the spatial morphological feature of the GI network and human activities, and subsequently evaluate network priorities accordingly. The preceding case-study analysis discovered certain locations that should be prioritized in future UGI planning and management (Figure 9). Urban planners can take our GI priority evaluation as a reference to directly and visually decide which hubs and links are more important, especially when there is a conflict between urban construction and green infrastructure conservation. In addition, this method also provides a model for other developing cities in Asia and Africa to construct ecological security patterns and green space systems in urban areas.

4.4. Uncertainty and Future Perspectives

Effectively integrating human-related processes into urban ecology may remain one of the ultimate challenges for ecologists and urban planners in the next century [49]. In this paper, we provided a case study to construct and prioritize the GI network in the rapidly urbanizing peri-urban areas of Pukou by combining the MSPA, the PC index, the Least Cost Path model, and the Spatial Syntax. The current approach presents only a theoretically optimized GI network structure of spatially meshing nature and culture. However, the effectiveness of the constructed GI network for biodiversity conservation and nature recreation remains untested [29,38]. In future studies, the structure and prioritization of the GI network need further modifications with empirical data on biodiversity and the recreational function assessment of the GI network. Furthermore, the GI network can also be constructed and prioritized for maintaining a wider range of ecological functions [50], such as local climate regulation and runoff regulation, to support more sustainable development in the rapidly urbanizing peri-urban areas.

5. Conclusions

We adopted the morphological spatial pattern analysis (MSPA) method and combined it with the landscape connectivity index to identify the UGI hubs and links in Pukou. We also integrated the spatial syntax model to evaluate the spatial priority of the UGI network. Our study selected 10 cores with the highest connectivity value as hubs. Patch 34 should be highlighted as the most important hub, and 12 connecting links should be regarded as the most important links. Our study provides a case to show how these techniques can be adequately used to construct and prioritize the GI network for biodiversity conservation and recreational use of the UGI. The development of these techniques will have implications in using the data more efficiently for decision making. Urban planners can take our GI priority evaluation as a reference to directly and visually decide which hubs and links are more important in UGI construction. This study also provides a model for other developing cities in Asia and Africa to construct ecological security patterns and green space systems in urban areas.

Acknowledgments

This research was financially supported by the China National R & D Program “building strong ecological security patterns through elevating green infrastructure’s level of ecosystem services” (No. 2017YFC0505705), the 111 project (B17024, KYLH201602) and the National Natural Science Foundation of China (No. 51408318). We would like to thank Minjuan Zhang for her valuable advice and technical guidance.

Author Contributions

Jiaxing Wei analyzed the data and wrote the paper; Jing Qian analyzed the data; Yu Tao participated in the revision of the paper; Feng Hu participated in the revision of the paper; Weixin Ou designed the research framework and participated in the revision of the paper.

Conflicts of Interest

The authors declare no conflict of interest.

References

  1. Forman, R.T.; Wu, J. Where to put the next billion people. Nature 2016, 537, 608–611. [Google Scholar] [CrossRef] [PubMed]
  2. Andersson, E.; Barthel, S.; Borgström, S.; Colding, J.; Elmqvist, T.; Folke, C.; Gren, Å. Reconnecting cities to the biosphere: Stewardship of green infrastructure and urban ecosystem services. Ambio 2014, 43, 445–453. [Google Scholar] [CrossRef] [PubMed]
  3. Carr, M.H.; Hoctor, T.D.; Goodison, C.; Zwick, P.D.; Green, J.; Hernandez, P.; McCain, C.; Teisinger, J.; Whitney, K. Final Report: Southeastern Ecological Framework; University of Florida: Gainesville, FL, USA, 2002. [Google Scholar]
  4. McNicoll, G. ; United Nations. Department of Economic and Social Affairs: World Economic and Social Survey 2004: International Migration. Pop. Dev. Rev. 2005, 31, 183–185. [Google Scholar]
  5. Lindholm, G. The Implementation of Green Infrastructure: Relating a General Concept to Context and Site. Sustainability 2017, 9, 610. [Google Scholar] [CrossRef]
  6. Tan, Y.; Tan, L.; Zhao, X. Differentiation of Commercial Activities and Urban Structural Change in Commercial Space: Based on Changsha City. Urban Stud. 2011, 6, 5. [Google Scholar]
  7. Yu, K. Landscape ecological security patterns in biological conservation. Acta Ecol. Sin. 1998, 19, 8–15. [Google Scholar]
  8. Vierikko, K.; Elands, B.; Niemelä, J.; Andersson, E.; Buijs, A.; Fischer, L.K.; Haase, D.; Kabisch, N.; Kowarik, I.; Luz, A.C. Considering the ways biocultural diversity helps enforce the urban green infrastructure in times of urban transformation. Curr. Opin. Environ. Sustain. 2016, 22, 7–12. [Google Scholar] [CrossRef]
  9. Angelstam, P.; Khaulyak, O.; Yamelynets, T.; Mozgeris, G.; Naumov, V.; Chmielewski, T.J.; Elbakidze, M.; Manton, M.; Prots, B.; Valasiuk, S. Green infrastructure development at European Union’s eastern border: Effects of road infrastructure and forest habitat loss. J. Environ. Manag. 2017, 193, 300–311. [Google Scholar] [CrossRef] [PubMed]
  10. Sikorska, D.; Sikorski, P.; Hopkins, R.J. High Biodiversity of Green Infrastructure Does Not Contribute to Recreational Ecosystem Services. Sustainability 2017, 9, 334. [Google Scholar] [CrossRef]
  11. Hu, D.; Zong, Y.; Xu, W. Research on the Construction of Landscape Ecological Security Pattern in the New Urban Region Development based on Ecology Network Analysis. Urban Stud. 2011, 6, 8. [Google Scholar]
  12. Barau, A.S. Perceptions and contributions of households towards sustainable urban green infrastructure in Malaysia. Habitat Int. 2015, 47, 285–297. [Google Scholar] [CrossRef]
  13. Jayasooriya, V.M.; Ng, A.W.M.; Muthukumaran, S.; Perera, B.J.C. Green infrastructure practices for improvement of urban air quality. Urban For. Urban Green. 2017, 21, 34–47. [Google Scholar] [CrossRef]
  14. Kim, R. Low Impact Development and Green Infrastructure in South Korea: Trends and Future Directions. Ecol. Resil. Infrastruct. 2016, 3, 80–91. [Google Scholar] [CrossRef]
  15. Meerow, S.; Newell, J.P. Spatial planning for multifunctional green infrastructure: Growing resilience in Detroit. Landsc. Urban Plan. 2017, 159, 62–75. [Google Scholar] [CrossRef]
  16. Langemeyer, J.; Gómez-Baggethun, E.; Haase, D.; Scheuer, S.; Elmqvist, T. Bridging the gap between ecosystem service assessments and land-use planning through Multi-Criteria Decision Analysis (MCDA). Environ. Sci. Policy 2016, 62, 45–56. [Google Scholar] [CrossRef]
  17. Lookingbill, T.R.; Minor, E.S. Assessing multi-scale landscape connectivity using network analysis. Learn. Landsc. Ecol. 2017, 193–209. [Google Scholar] [CrossRef]
  18. Flynn, K.M.; Traver, R.G. Green infrastructure life cycle assessment: A bio-infiltration case study. Ecol. Eng. 2013, 55, 9–22. [Google Scholar] [CrossRef]
  19. Meier, K.; Kuusemets, V.; Luig, J.; Mander, Ü. Riparian buffer zones as elements of ecological networks: Case study on Parnassius mnemosyne distribution in Estonia. Ecol. Eng. 2005, 24, 531–537. [Google Scholar] [CrossRef]
  20. Wickham, J.D.; Riitters, K.H.; Wade, T.G.; Vogt, P. A national assessment of green infrastructure and change for the conterminous United States using morphological image processing. Landsc. Urban Plan. 2010, 94, 186–195. [Google Scholar] [CrossRef]
  21. Cook, E.A. Landscape structure indices for assessing urban ecological networks. Landsc. Urban Plan. 2002, 58, 269–280. [Google Scholar] [CrossRef]
  22. Qiu, Y.; Chang, Q.; Wang, J. A MSPA-based Planning of Urban Green Infrastructure Network—A Case of Shenzhen. Chin. Landsc. Archit. 2013, 5, 104–108. [Google Scholar]
  23. Vogt, P.; Riitters, K.H.; Estreguil, C.; Kozak, J.; Wade, T.G.; Wickham, J.D. Mapping spatial patterns with morphological image processing. Landsc. Ecol. 2007, 22, 171–177. [Google Scholar] [CrossRef]
  24. Batty, M.; Rana, S. Reformulating Space Syntax: The Automatic Definition and Generation of Axial Lines and Axial Maps; Centre for Advanced Spatial Analysis Working Paper 58; Centre for Advanced Spatial Analysis University College London: London, UK, 2002. [Google Scholar]
  25. Omer, I.; Kaplan, N. Using space syntax and agent-based approaches for modeling pedestrian volume at the urban scale. Comput. Environ. Urban Syst. 2017, 64, 57–67. [Google Scholar] [CrossRef]
  26. Mell, I.C.; Henneberry, J.; Hehl-Lange, S.; Keskin, B. To green or not to green: Establishing the economic value of green infrastructure investments in The Wicker, Sheffield. Urban For. Urban Green. 2016, 18, 257–267. [Google Scholar] [CrossRef]
  27. Chiang, Y.C.; Yang, D. City gate as key towards sustainable urban redevelopment: A case study of ancient Gungnae City within the modern city of Ji’an. Habitat Int. 2017, 67, 1–12. [Google Scholar] [CrossRef]
  28. Ratti, C. Space syntax: Some inconsistencies. Environ. Plan. B Plan. Des. 2004, 31, 487–499. [Google Scholar] [CrossRef]
  29. Chang, Q.; Liu, X.; Wu, J.; He, P. MSPA-based urban green infrastructure planning and management approach for urban sustainability: Case study of Longgang in China. J. Urban Plan. Dev. 2014, 141, A5014006. [Google Scholar] [CrossRef]
  30. Cheng, L.; Xia, N.; Jiang, P.; Zhong, L.; Pian, Y.; Duan, Y.; Huang, Q.; Li, M. Analysis of farmland fragmentation in China Modernization Demonstration Zone since “Reform and Openness”: A case study of South Jiangsu Province. Sci. Rep. 2015, 5, 11797. [Google Scholar] [CrossRef] [PubMed]
  31. Xie, M.; Gao, Y.; Jürgen, B.; Fu, C.; Tong, D. Dynamics and Temperature Regulation Function of Urban Green Connectivity. J. Urban Plan. Dev. 2014, 141, A5014008. [Google Scholar] [CrossRef]
  32. Zhu, Q.; Yu, K.; Li, D. The width of ecological corridor in landscape planning. Acta Ecol. Sin. 2005, 25, 2406–2412. [Google Scholar]
  33. Teng, M. Planning Ecological Security Patterns in Rapidly Urbanization Context: A Case Study in Wuhan, China; Huazhong Agricultural University: Wuhan, China, 2011. [Google Scholar]
  34. Landguth, E.; Hand, B.; Glassy, J.; Cushman, S.; Sawaya, M. UNICOR: A species connectivity and corridor network simulator. Ecography 2012, 35, 9–14. [Google Scholar] [CrossRef]
  35. Chen, L.; Fu, B.; Xu, J.; Gong, J. Location-weighted landscape contrast index: A scale independent approach for landscape pattern evaluation based on source-sink ecological processes. Acta Ecol. Sin. 2002, 23, 2406–2413. [Google Scholar]
  36. Xu, F.; Kong, F.; Xu, J. Developing ecological networks based on mspa and the least-cost path method: A case study in bazhong western new district. Acta Ecol. Sin. 2015, 35, 6425–6434. [Google Scholar]
  37. Knaapen, J.P.; Scheffer, M.; Harms, B. Estimating habitat isolation in landscape planning. Landsc. Urban Plan. 1992, 23, 1–16. [Google Scholar] [CrossRef]
  38. Hillier, B.; Yang, T.; Turner, A. Normalising least angle choice in Depthmap and how it opens new perspectives on the global and local analysis of city space. J. Space Syntax 2012, 3, 155–193. [Google Scholar]
  39. Velázquez, J.; Gutiérrez, J.; Hernando, A.; García-Abril, A. Evaluating landscape connectivity in fragmented habitats: Cantabrian capercaillie (Tetrao urogallus cantabricus) in northern Spain. For. Ecol. Manag. 2017, 389, 59–67. [Google Scholar] [CrossRef]
  40. Kong, F.; Yin, H.; Nakagoshi, N. Using GIS and landscape metrics in the hedonic price modeling of the amenity value of urban green space: A case study in Jinan City, China. Landsc. Urban Plan. 2007, 79, 240–252. [Google Scholar] [CrossRef]
  41. Benedict, M.A.; McMahon, E. Green Infrastructure: Linking Landscapes and Communities. Nat. Areas J. 2017, 3, 282–283. [Google Scholar]
  42. Chen, C.; Meurk, C.D.; Jia, Z.; Lv, M.; Wu, S.; Jia, J. Incorporating landscape connectivity into household pond configuration in a hilly agricultural landscape. Landsc. Ecol. Eng. 2017, 13, 189–204. [Google Scholar] [CrossRef]
  43. Hillier, B. Space Is The Machine: A Configurational Theory Of Architecture. J. Urban Design. 2007, 3, 333–335. [Google Scholar]
  44. Zhao, J.; Yu, Y.; Wang, X.; Kan, X. Economic impacts of accessibility gains: Case study of the Yangtze River Delta. Habitat Int. 2017, 66, 65–75. [Google Scholar] [CrossRef]
  45. Forman, R.T. Urban ecology principles: Are urban ecology and natural area ecology really different? Landsc. Ecol. 2016, 31, 1653–1662. [Google Scholar] [CrossRef]
  46. Roe, M.; Mell, I. Negotiating value and priorities: Evaluating the demands of green infrastructure development. J. Environ. Plan. Manag. 2013, 56, 650–673. [Google Scholar] [CrossRef]
  47. Hoerbinger, S.; Immitzer, M.; Obriejetan, M.; Rauch, H.P. GIS-based assessment of ecosystem service demand concerning green infrastructure line-side vegetation. Ecol. Eng. 2017, 10–19. [Google Scholar] [CrossRef]
  48. Bolund, P.; Hunhammar, S. Ecosystem services in urban areas. Ecol. Econ. 1999, 29, 293–301. [Google Scholar] [CrossRef]
  49. Wu, J.; Hobbs, R. Key issues and research priorities in landscape ecology: An idiosyncratic synthesis. Landsc. Ecol. 2002, 17, 355–365. [Google Scholar] [CrossRef]
  50. Costanza, R.; Groot, R.D.; Braat, L.; Kubiszewski, I.; Fioramonti, L.; Sutton, P.; Farber, S.; Grasso, M. Twenty years of ecosystem services: How far have we come and how far do we still need to go? Ecosyst. Serv. 2017, 28, 1–16. [Google Scholar] [CrossRef]
Figure 1. The research area: location and land use.
Sustainability 10 00327 g001
Figure 2. Technology roadmap.
Sustainability 10 00327 g002
Figure 3. Illustrations of MSPA for pixel size of 30 m (A); 90 m (B) 120 m (C).
Sustainability 10 00327 g003
Figure 4. Illustrations of MSPA for edge width with 1 pixel (A); 2 pixels (B); 3 pixels (C).
Sustainability 10 00327 g004
Figure 5. The core and bridge based on MSPA-type image
Sustainability 10 00327 g005
Figure 6. Main patches of study area and potential ecological network model.
Sustainability 10 00327 g006
Figure 7. The axial map (A) and the general integration value (B) and choice value (C) map of the research area (the warmer color indicates higher values, the same below).
Sustainability 10 00327 g007
Figure 8. The general integration value (A) and choice value (B) of each axis.
Sustainability 10 00327 g008
Figure 9. The UGI network planning map of Pukou District.
Sustainability 10 00327 g009
Table 1. The definition of MSPA concept and its ecological meaning [23].
ConceptEcological Meaning
CoreForeground pixels surrounded on all sides by foreground pixels and greater than the specified edge width distance from background.
IsletForeground pixels that do not contain a core. The islet is the only unconnected class. Edges and perforations surround the core, and loops, bridges and branches are connected to the core.
PerforationPixels that form the transition zone between foreground and background for interior regions of the foreground. Consider a group of foreground pixels in the shape of a doughnut. The pixels forming the inner edge would be classified as perforations, whereas those forming the outer edge would be classified as edge.
EdgePixels that form the transition zone between the foreground and background.
BridgeForeground pixels that connect two or more disjunct areas of the core.
LoopForeground pixels that connect an area of the core to itself.
BranchForeground pixels that extend from an area of the core but do not connect to another area of the core.
Table 2. The priority evaluation of UGI elements.
Choice>1000500~1000<500
General Integration
>0.5First ClassSecond ClassThird Class
<0.5Second ClassThird ClassThird Class
Table 3. Area and proportion of MSPA landscape types.
Landscape TypeArea (km2)Percentage of Total UGI Area (%)Percentage of Total Research Area (%)
Core164.3471.6218
Islet8.223.730.9
Perforation0.710.310
Edge35.6115.793.9
Bridge4.572.210.5
Loop0.910.610.1
Branch12.785.741.4
Table 4. Evaluation of landscape connectivity index of the core area.
ImportanceNodedPC
13456.89524
22244.50363
3813.667665
4192.854003
5701.468259
6681.22869
7241.021085
890.830746
9730.7061991
10440.6329749

