Article

Thermal Environmental Design in Outdoor Space Focusing on Radiation Environment Influenced by Ground Cover Material and Solar Shading, through the Examination on the Redevelopment Buildings in Front of Central Osaka Station

Department of Architecture, Kobe University, Kobe 657-8501, Japan
*
Author to whom correspondence should be addressed.
Sustainability 2018, 10(2), 337; https://doi.org/10.3390/su10020337
Submission received: 23 December 2017 / Revised: 23 January 2018 / Accepted: 27 January 2018 / Published: 29 January 2018
(This article belongs to the Special Issue Sustainability and Urban Metabolism)

Abstract

:
The outdoor open space is used for various purposes, e.g., to walk, rest, talk, meet, study, exercise, play, perform, eat, and drink. Therefore, it is desirable to provide various thermal environments according to users’ needs and their actual conditions. In this study, the radiation environment was evaluated, focusing on ground cover materials and solar radiation shading, through the examination on the redevelopment buildings in front of Central Osaka Station. The spatial distribution of solar radiation shading was calculated using ArcGIS and building shape data. Surface temperatures on the ground and wall are calculated based on the surface heat budget equation. MRT (Mean Radiant Temperature) of the human body is calculated assuming that the human body is a sphere. The most dominant factor for the radiant environment is solar radiation shielding and the next is the improvement of surface cover. It is difficult to make SET* (Standard new Effective Temperature) comfortable in the afternoon by both solar radiation shielding and improved surface cover because the air temperature is too high on a typical summer day (August). However, particularly in Rooftop Gardens and Green Garden, because the areas of shade grass and water are large, there are several places where people do not feel uncomfortable.

1. Introduction

Several studies have been conducted for the purpose of improving the quality of thermal environment and the atmosphere in the canopy area of the city. The following four priorities were pointed out by Oke [1] on planning and design of urban canopy: (1) to take full advantage of the shelter in order to ensure the safety and comfort of the pedestrians; (2) to maximize the dispersion of pollutants in order to minimize adverse effects on the entities exposed, such as people or vegetation; (3) to maximize warmth of the city in order to reduce pedestrian discomfort and the need for building space heating in winter; and (4) to maximize solar access in order to use solar energy to the maximum. The importance of solar access has also been studied by Arnfield [2] among others [3,4,5,6]. Eliasson [7] noted that the variation of surface temperatures in urban canyons can be explained by the sky view factor. Outdoor thermal comfort in urban street canyons with various shapes and directions has been studied by Ali-Toudert and Mayer [8,9], who found that shading is the key strategy to mitigate outdoor heat stress under hot summer conditions. The proportion and position of shaded areas in an open space, which depend on the position of the sun and the form of the city, were analyzed by Martinelli et al. [10]. Shading by trees greatly affects human thermal comfort, expressed as physiological equivalent temperature (PET), and has been studied by Abreu-Harbich et al. [11]. The spatial distribution of thermal conditions at the street level depends strongly on aspect ratio and street direction, as shown by Algeciras et al. [12]. Influence of trees on human thermal comfort has been quantified for a heat wave day by Lee et al. [13]. Zheng et al. [14] evaluated the influence of different vegetation species on the outdoor thermal environment using a numerical simulation. In addition, the recently proposed UTCI (Universal Thermal Climate Index) presents a more complicated heat-budget-based approach and has been increasingly used by bio-meteorological studies [15,16]. From these previous studies [1,2,3,4,5,6,7,8,9,10,11,12,13,14,15,16], solar radiation shading, lowering of surface temperature, the improvement of ventilation has been shown to be effective for the improvement of the thermal comfort in urban street canyons.
Work and leisure in outdoor spaces exert a physiological and psychological health effects on people, with reducing the energy consumed by air conditioning and lighting through the use of outdoor space rather than indoors space. In our previous study [17], the effects of solar radiation shading by trees in the open space around buildings on microclimatic development and pedestrian radiation environment were evaluated through a case study on the redevelopment buildings in front of Central Osaka Station, based on observation and calculation. Shade by buildings as well as trees was confirmed a necessity of environmental design of outdoor space, as also described in other studies [18,19,20]. Because the purpose of use is limited in offices, schools, etc., it is easy to determine the design goals of environmental performance in such spaces. On the other hand, the outdoor open space is used for various purposes, e.g., to walk, rest, talk, meet, study, exercise, play, perform, eat, and drink. Therefore, it is desirable to provide various thermal environments according to users’ needs and their actual conditions. However, air conditioning control aiming for a set temperature is not required as it is in offices and schools. More than that, there may be a desirable spatial distribution. The spatial distribution of thermal environment has been studied by Ali-Toudert and Mayer [9], Lee et al. [13], Chen et al. [21], using Mean radiant temperature as an outdoor thermal comfort index. They also pointed out that building geometry and vegetation play the most significant role in affecting thermal comfort index. In addition, Chen et al. [21] mentioned that the spatial variation of thermal environment provide implications for urban design towards the mitigation of heat stress in high-density cities.
From this point of view, the radiation environment influenced by ground cover materials and solar radiation shading was evaluated in this study. This study is the continuation of our previous study [17]. The study site and the solar radiation calculation method are also the same as [17]. The subject of this study is the calculation of surface temperature and Mean Radiant Temperature (MRT) distribution based on the surface heat budget, as different from the previous study [17]. Then, variation of the thermal environment in outdoor space is analyzed focusing on radiation environment influenced by ground cover material and solar shading, without considering other factors such as the human transpiration, wall materials, etc.

2. Outline of Study Site Characteristics and Calculation Method
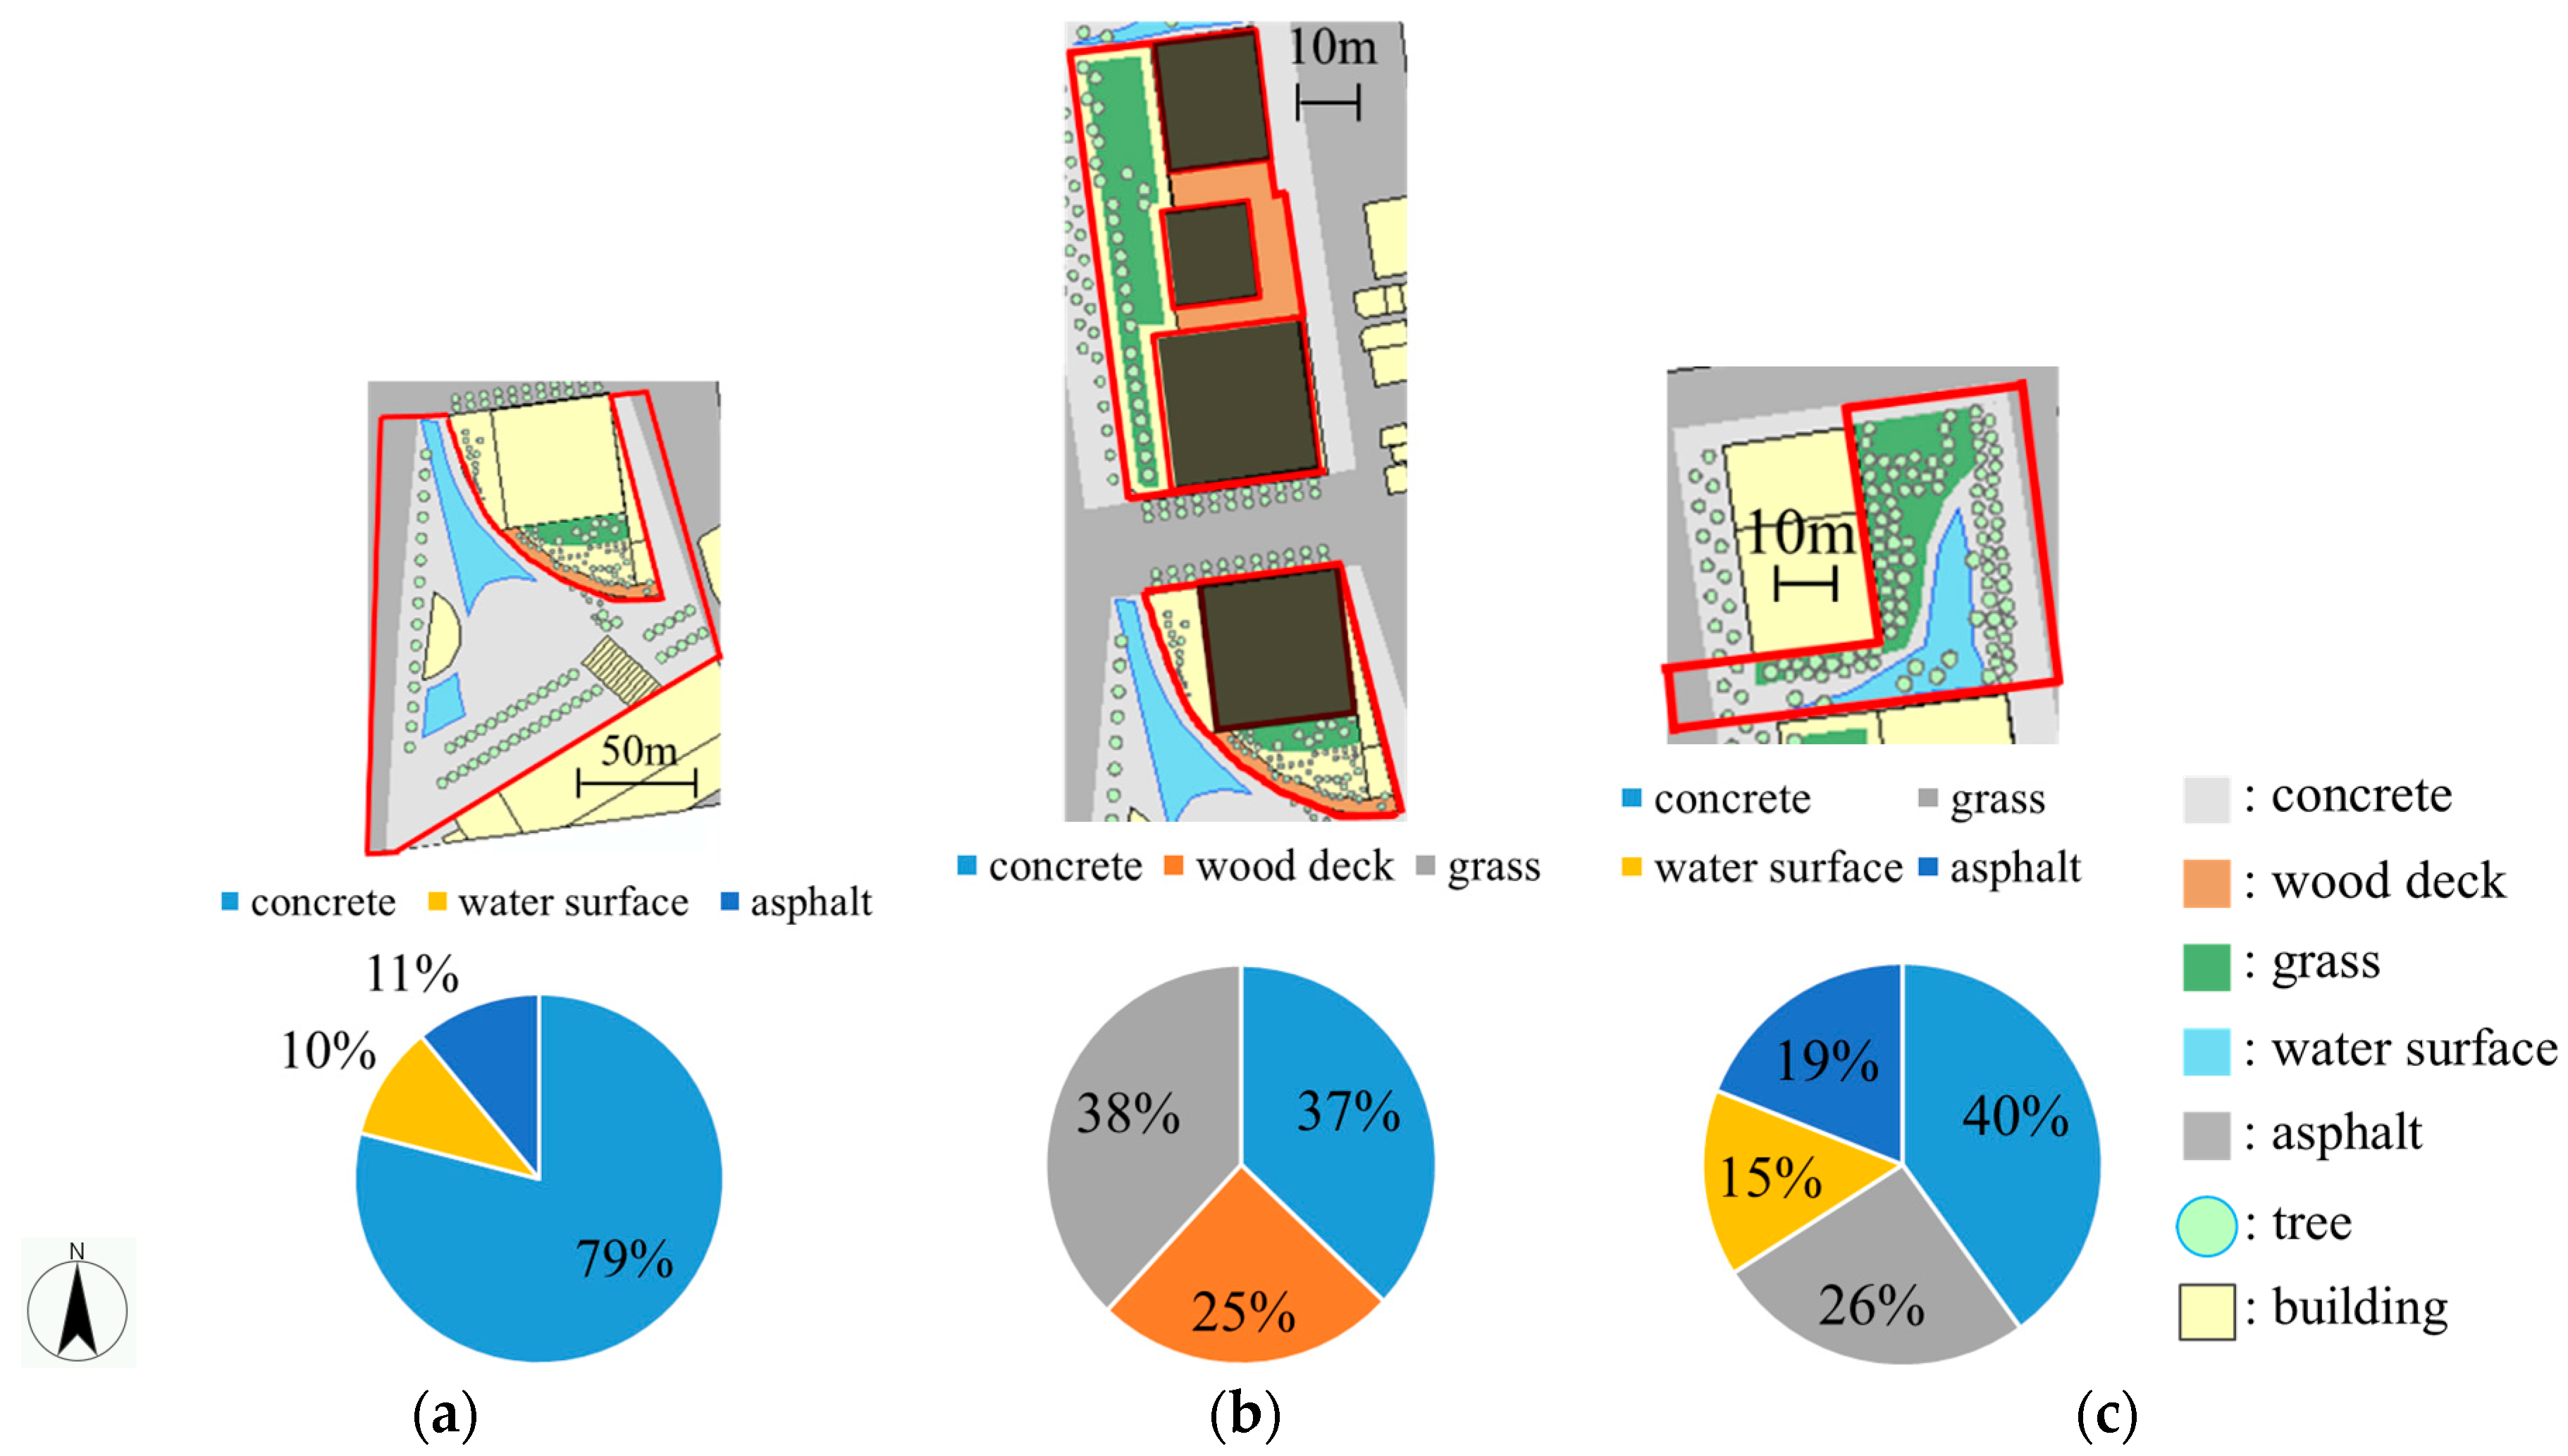
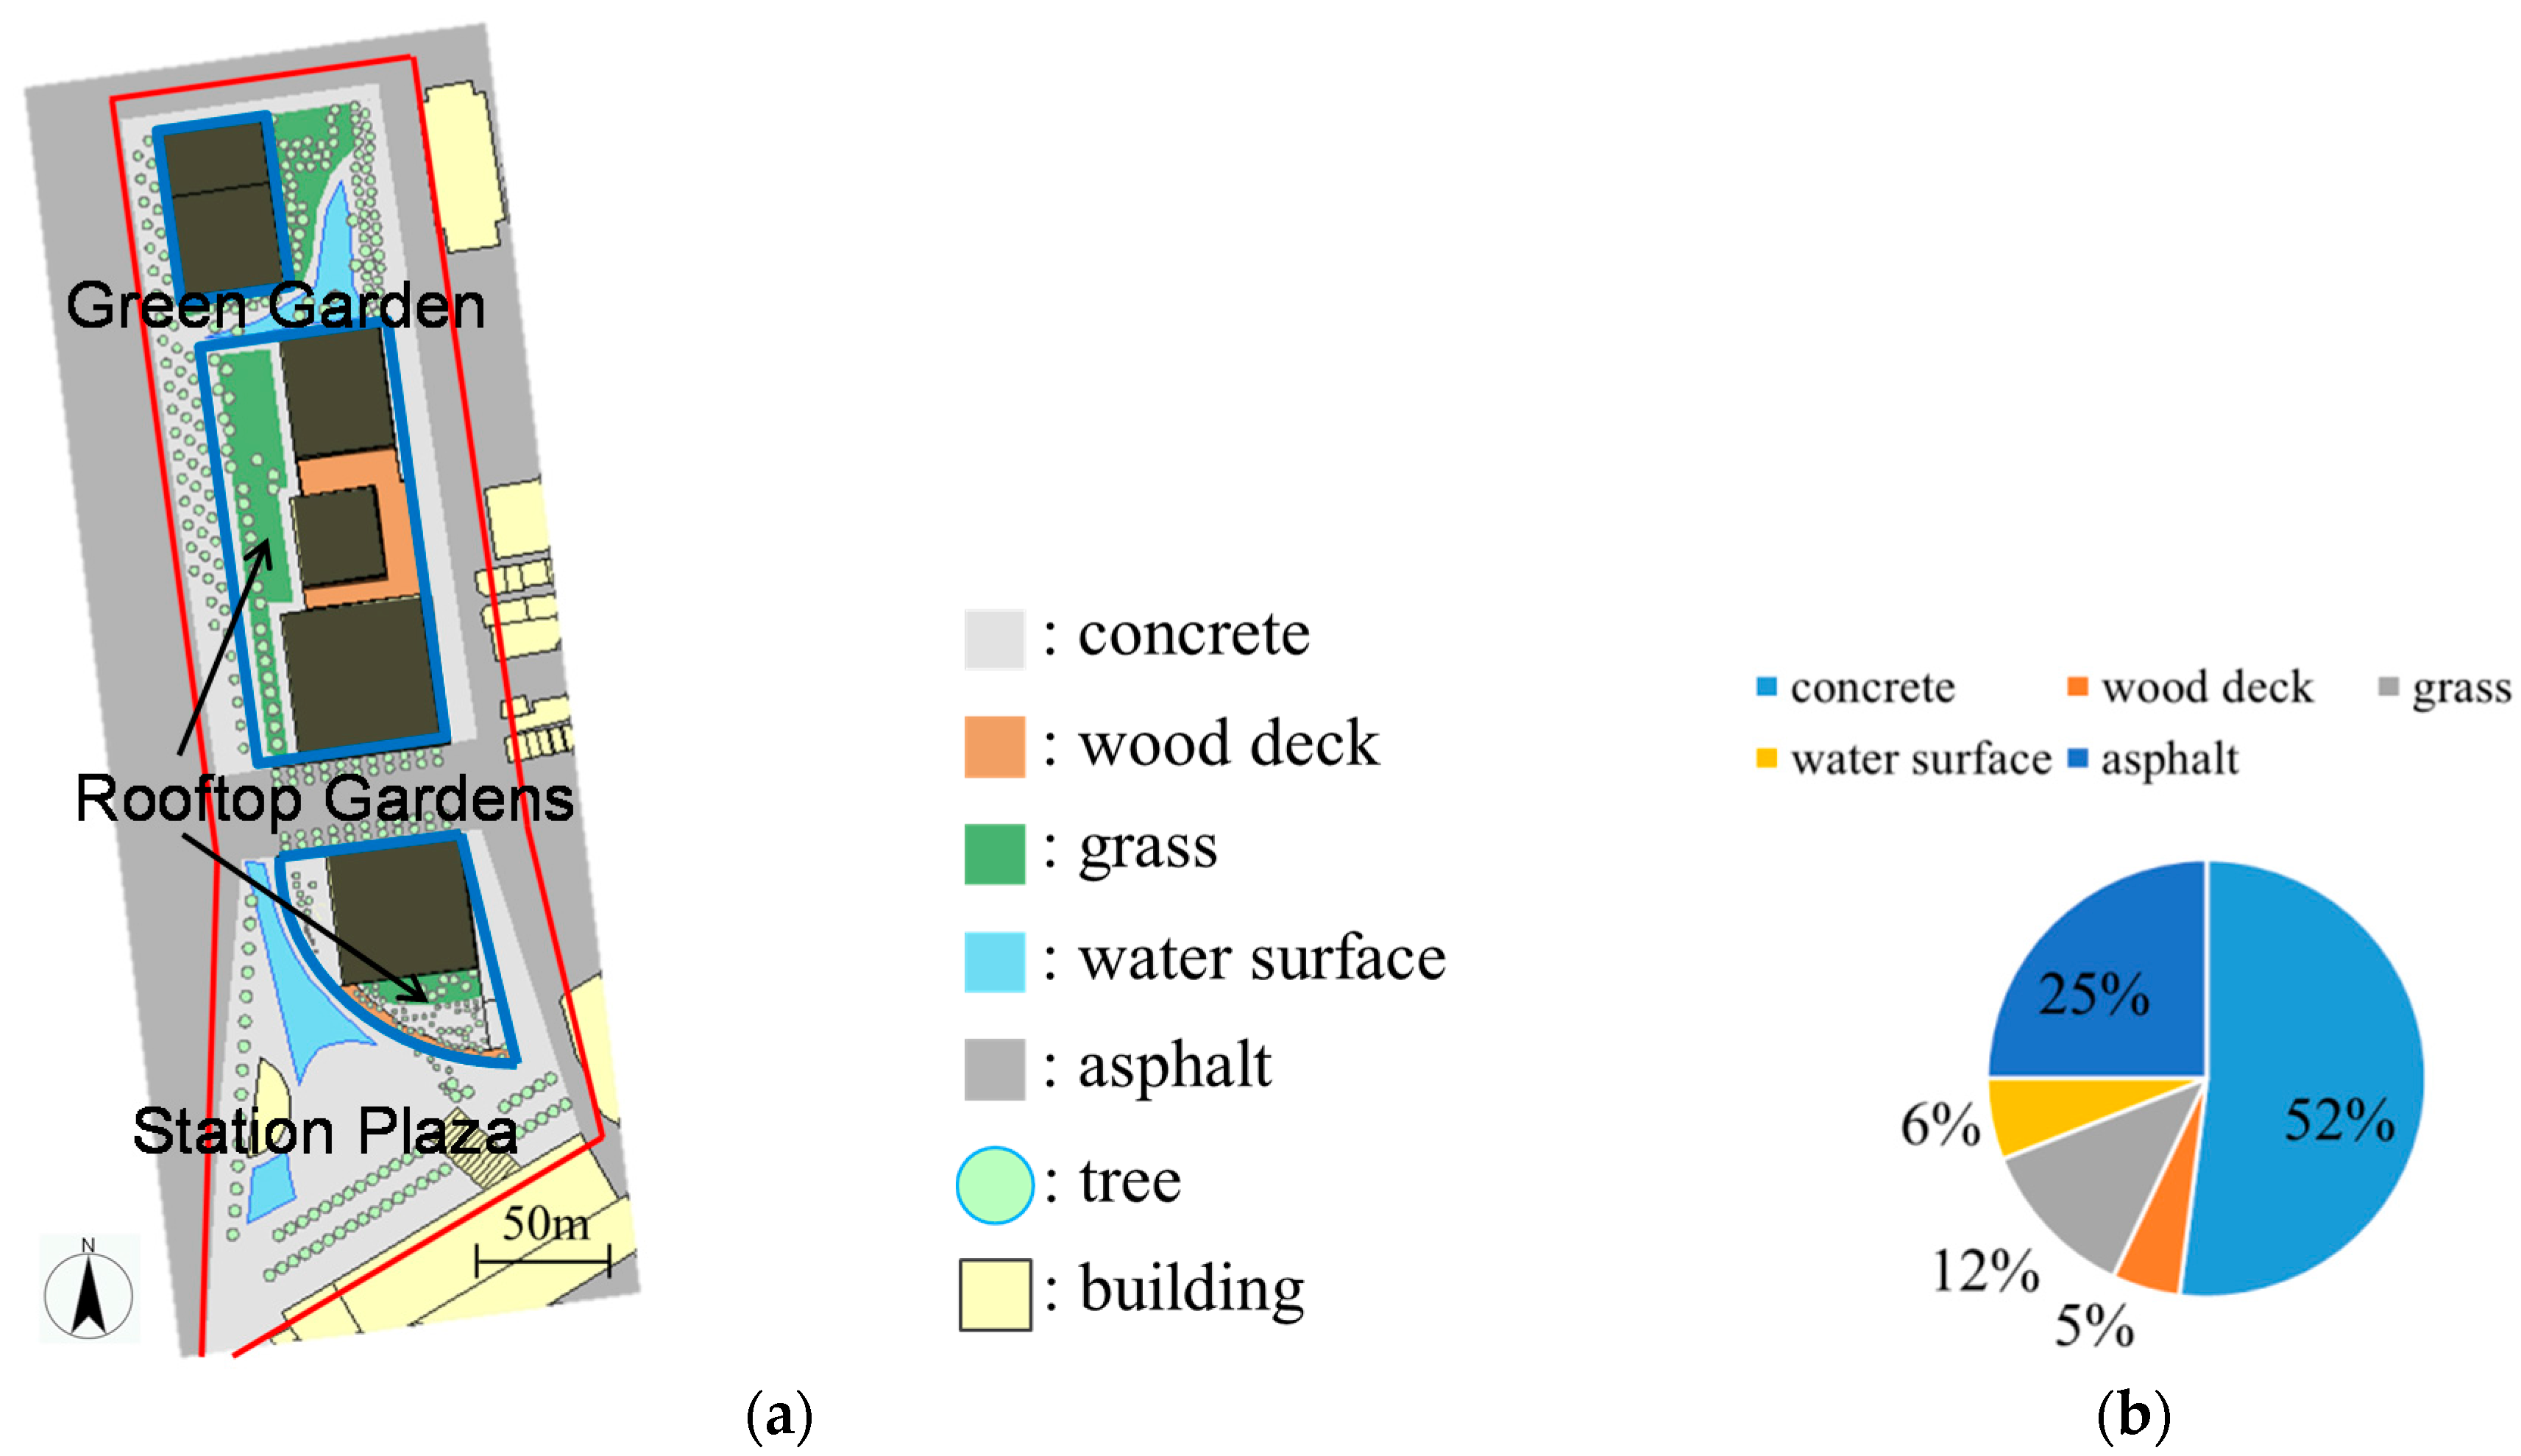
2.1. Study Site

The study site layout and the distribution of each ground cover type are shown in Figure 1 [22], where is the same as [17]. Various cover types are present in the surrounding spaces and building rooftops for outdoor thermal environment mitigation. The distribution and ratio of each ground cover type for Station Plaza, Rooftop Gardens, and Green Garden are shown in Figure 2.
Station Plaza is located in the southern part of the redevelopment building complex. There are two tall buildings near Station Plaza, one to the northeast (180 m high) and one to the south (150 m high). There is little vegetation cover, and open spaces (concrete surfaces) and water surfaces dominate. When events are held in Station Plaza, attendees can be cooled by misters.
Rooftop Gardens are located on the southern middle-rise building and the central middle-rise building. The ratios of concrete, wood deck, and grass are similar, ~30%.
Green Garden is located between the northern (174 m high) and central (154 m high) high-rise buildings. The Green Garden site features green grassy areas, water surfaces, medium-height trees, and concrete walkways.

2.2. Calculation Method

Surface temperatures on the ground and wall are calculated based on the following surface heat budget equation in each 2 m size mesh of the ground and building wall surface.
S + R = V + A + l E ,
S = ( 1 ρ ) J ,
R = R ε σ T s 4 ,
V = α c ( θ s θ a ) ,
A = λ θ z ,
l E = l β α w ( X s X a ) ,
R = σ T a 4 ( 0.526 + 0.208 P ) ,
α c = { 5.3 + 3.6 u ( u 5.0 ) 6.47 u 0.78 ( u 5.0 ) ,
where S is solar radiation [W/m2], R is infrared radiation [W/m2], V is sensible heat flux [W/m2], A is conduction heat flux [W/m2], and lE is latent heat flux [W/m2]. ρ is solar reflectance [-]. J [W/m2] is incident solar radiation which is calculated based on the spatial distribution of solar radiation using ArcGIS and building shape data, as per the method described by Takebayashi et al. [23]. R [W/m2] is calculated by Brunt’s formula (Equation (7)) using air temperature and relative humidity. ε is emissivity [-]. σ is Stefan-Boltzmann constant (=5.67 × 10⁻⁸ [W/(m2K4)]). Ts and Ta are surface and air temperature [K]. P is water vapor pressure of air [kPa]. αc is convection heat transfer coefficient [W/(m2K)] which is calculated by Jürges formula (Equation (8)) using wind velocity u [m/s]. θs and θa are surface and air temperature [°C]. λ is heat conductivity of surface material [W/(mK)]. θ [°C] is temperature in surface material which is calculated by solving an unsteady one-dimensional heat conduction equation, to take thermal mass into account. Based on the field survey and the building construction drawing, 10 cm for the thickness of the surface material (concrete, wood deck, grass, asphalt) shown in Table 1, 40 cm for the thickness of the soil under the surface material and 26 °C constant (with considering only one day cycle) for the temperature below it are set for the calculation of unsteady one-dimensional heat conduction equation. Since the influence by the wall for the human body that receives solar radiation and infrared radiation from the ground surface is not dominant when the distance is 2 m or more away from the wall, the detail examination on the wall is not needed for the spatial range in this study. 10 cm for the thickness of concrete and 26 °C constant for the temperature below it are set for the building wall, without considering the window. l is latent heat of water (=2500 [kJ/kg]). β is evaporative efficiency [-]. αw is convection moisture transfer coefficient [kg/(m2s(kg/kg’))] which is calculated by Lewis relation formula using αc and specific heat of air. Xs and Xa are air absolute humidity and surface absolute humidity [kg/kg’]. Parameters for the surface heat budget equation and heat conduction equation are shown in Table 1. Surface temperature is calculated by substituting these parameters into the above equations, under conditions air temperature, air absolute humidity, underground temperature, convection heat and moisture transfer coefficients of the function of wind velocity are set by the observation values as boundary conditions.
MRT of the human body is calculated using the following equation. The human body is assumed a sphere.
M R T = ( a Q / σ + Φ i T i 4 ) 1 4 ,
where a is solar radiation absorption ratio of the human body [-], Q is direct and sky solar radiation [W/m2], σ is Stefan–Boltzmann constant, Φ is view factor between the human body and the ground and wall surfaces, and T is surface temperature on the ground and wall which is calculated in each mesh. a is assumed to be 0.5, with considering the clothing condition in summer.
Distribution of wind velocity is calculated by CFD (Computational Fluid Dynamics) simulation by using the outdoor space model reproducing buildings, obstacles and trees, including the surroundings. The standard k-ε turbulence model (one of the RANS (Reynolds-Averaged Navier-Stokes equations) models) is selected for use in the simulation. A general purpose CFD software (STREAM, version 8, Software Cradle Co., Ltd., Osaka, Japan) is used for calculation. The Navier-Stokes equations are discretized using a finite volume method and the SIMPLE algorithm is used to handle pressure-velocity coupling. The objective area is divided into meshes according to the form of the buildings etc. Inflow boundary condition is given based on weather condition.

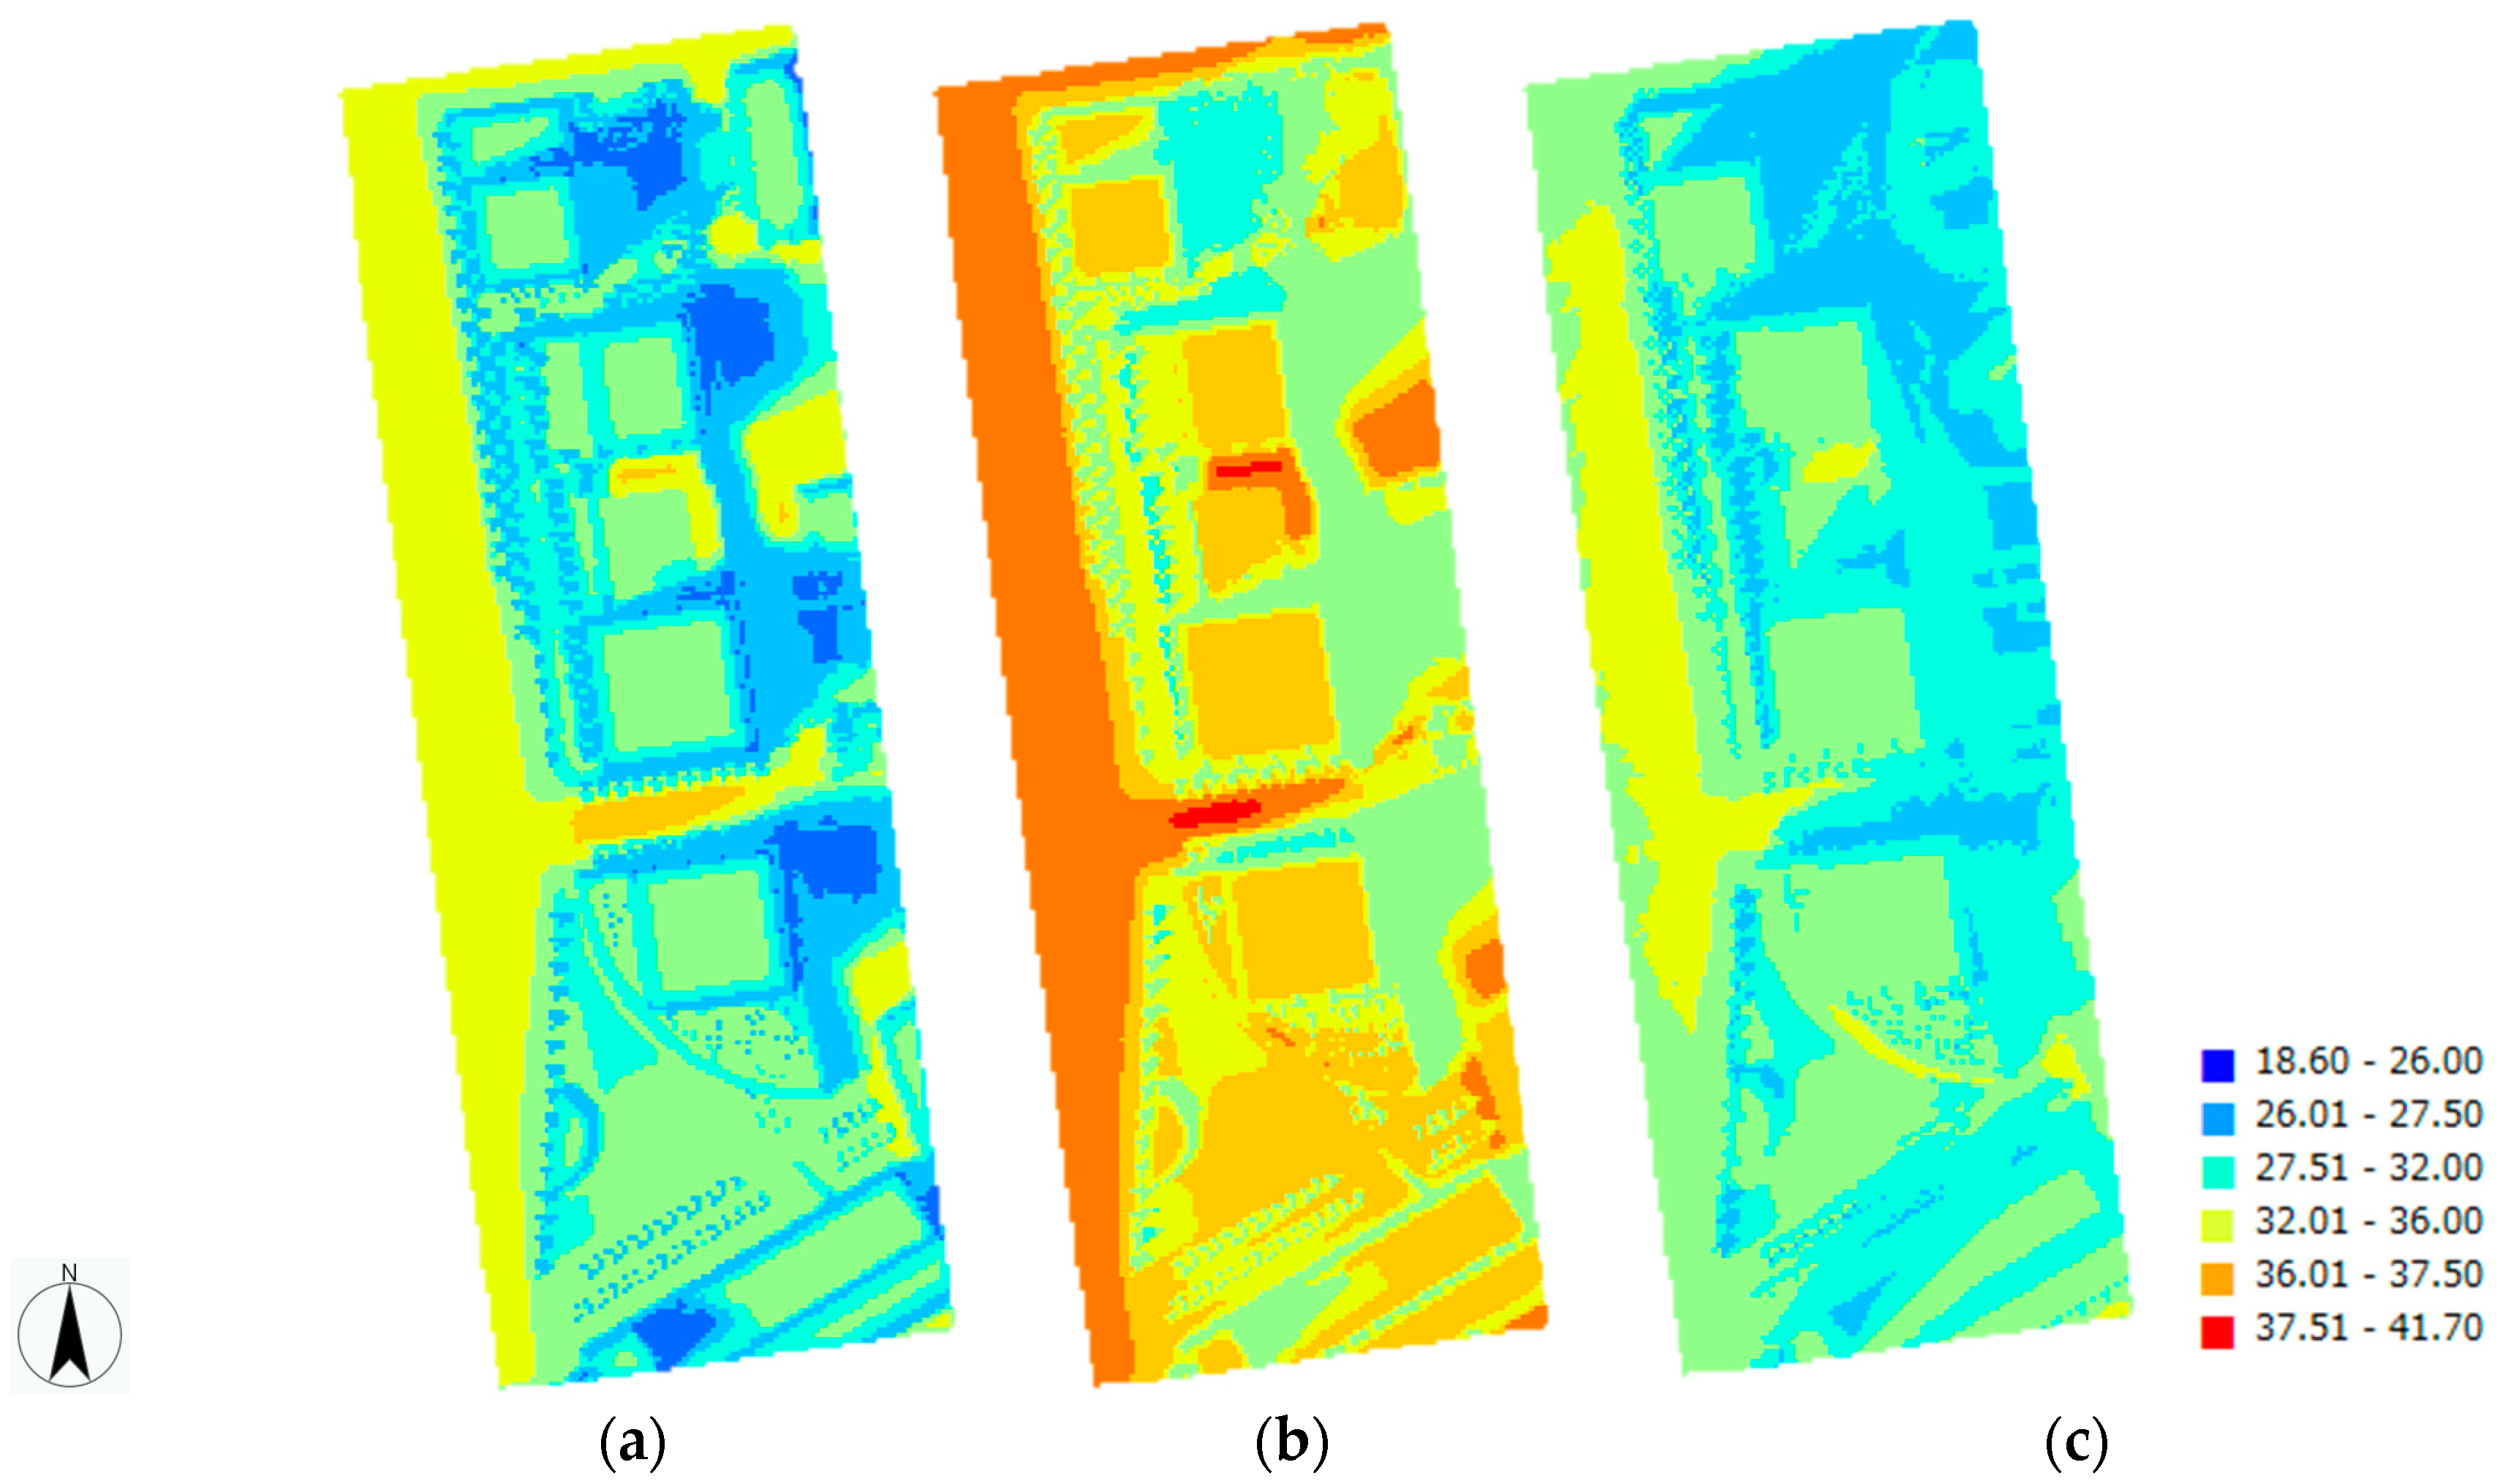
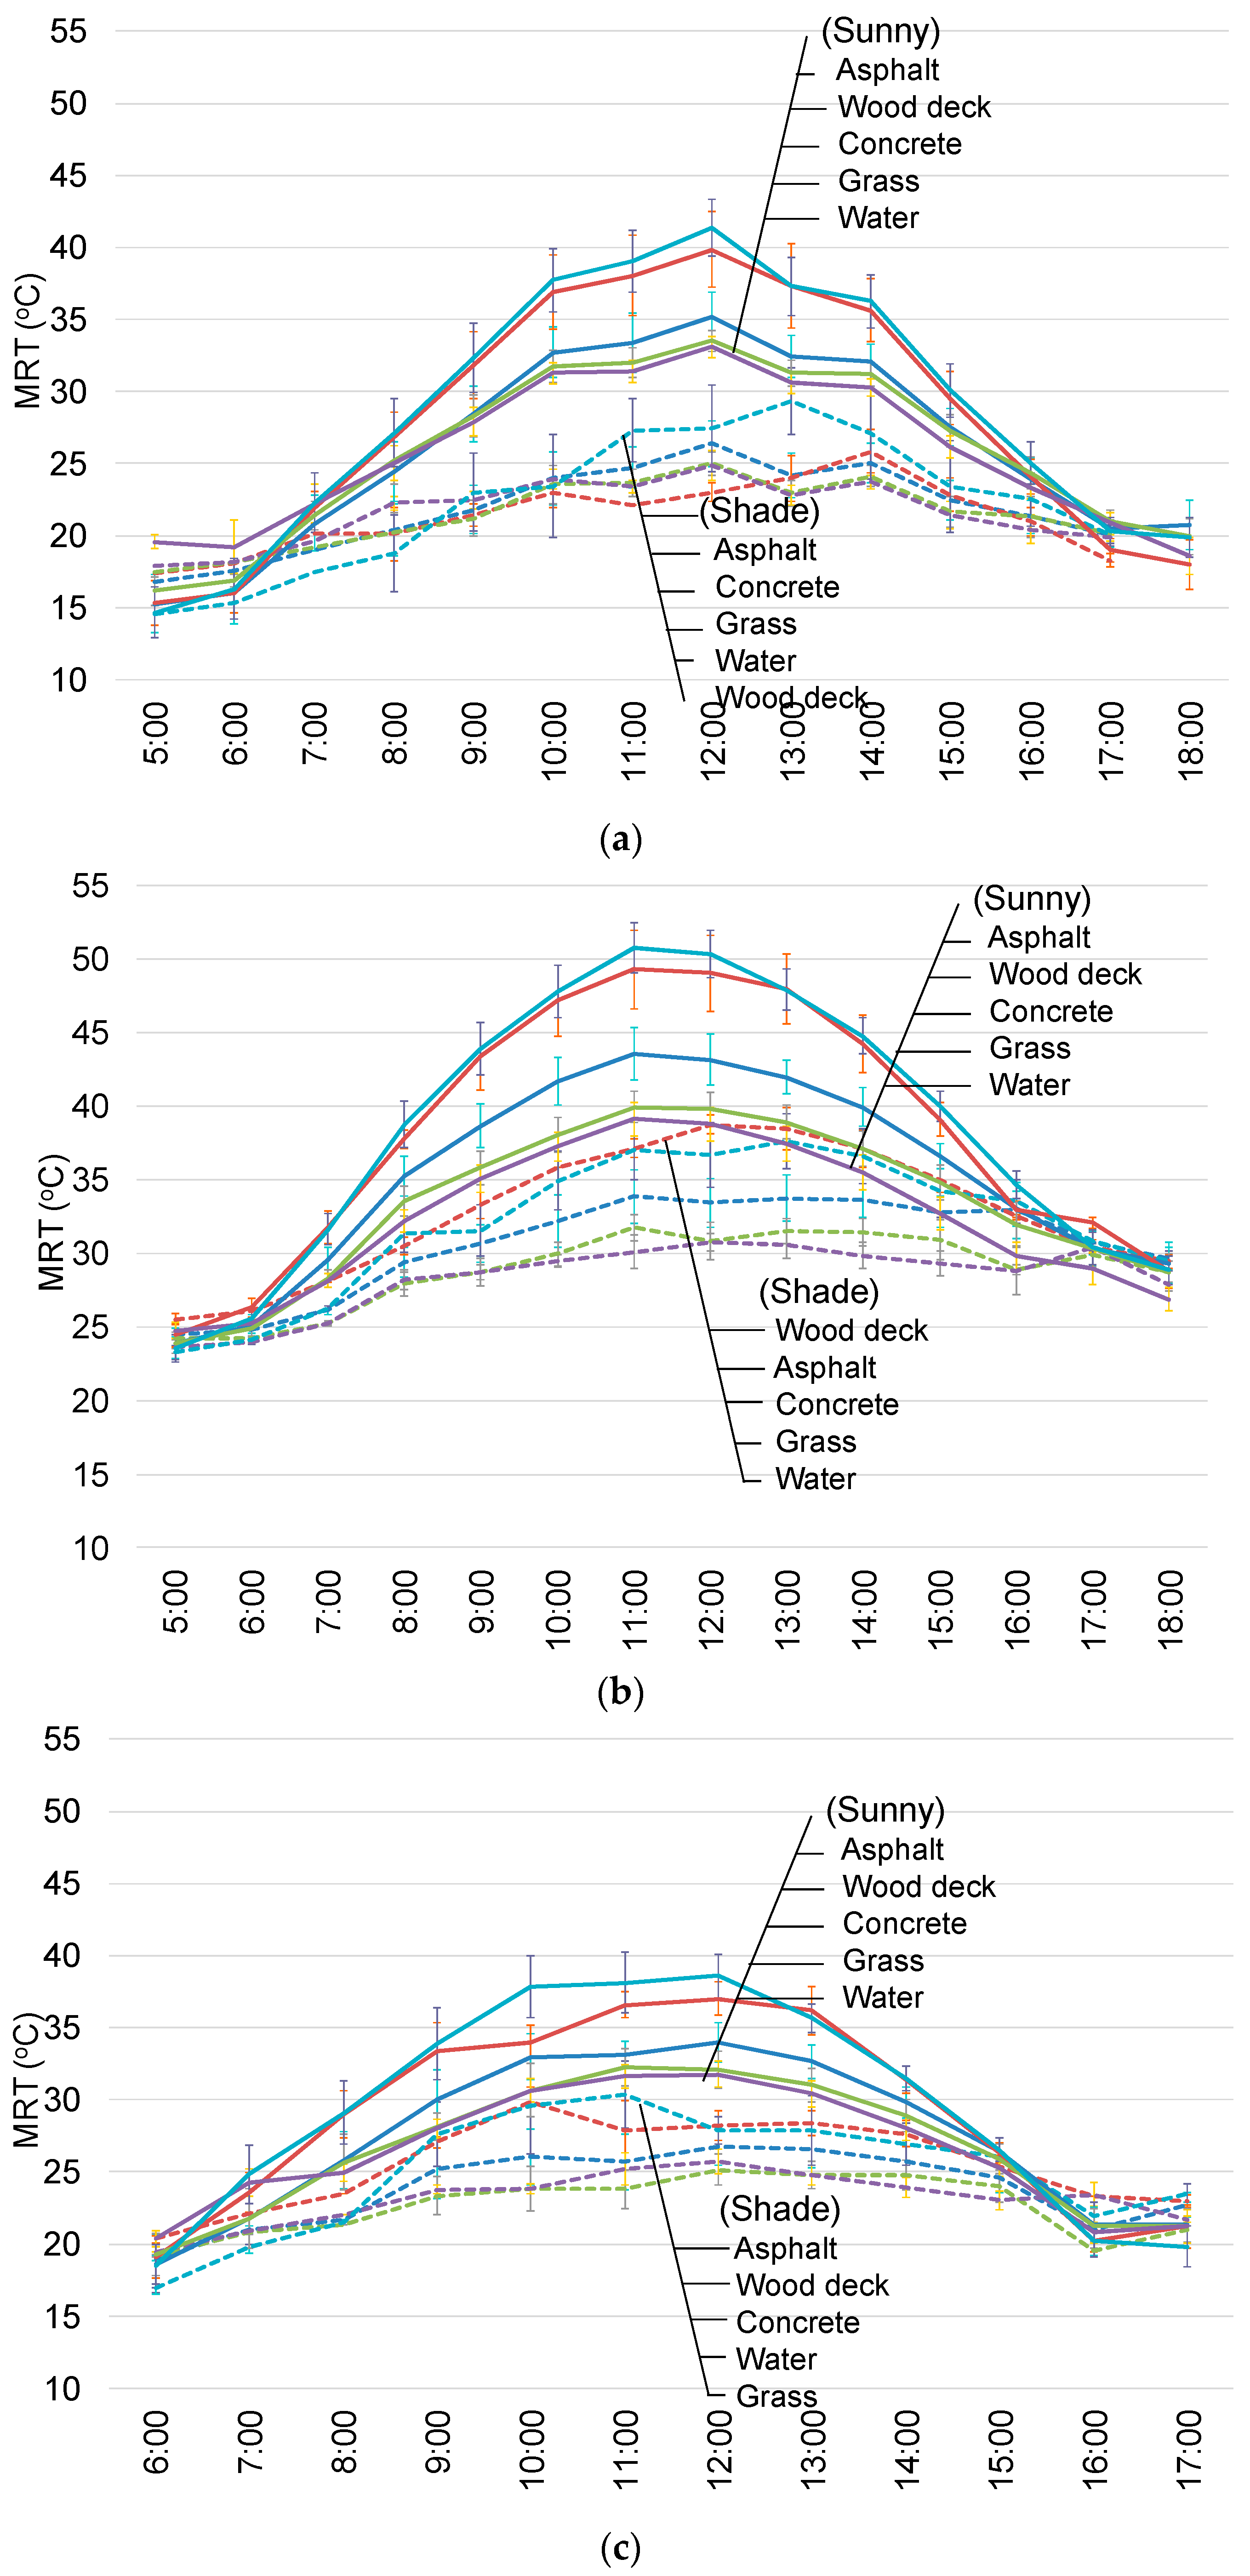
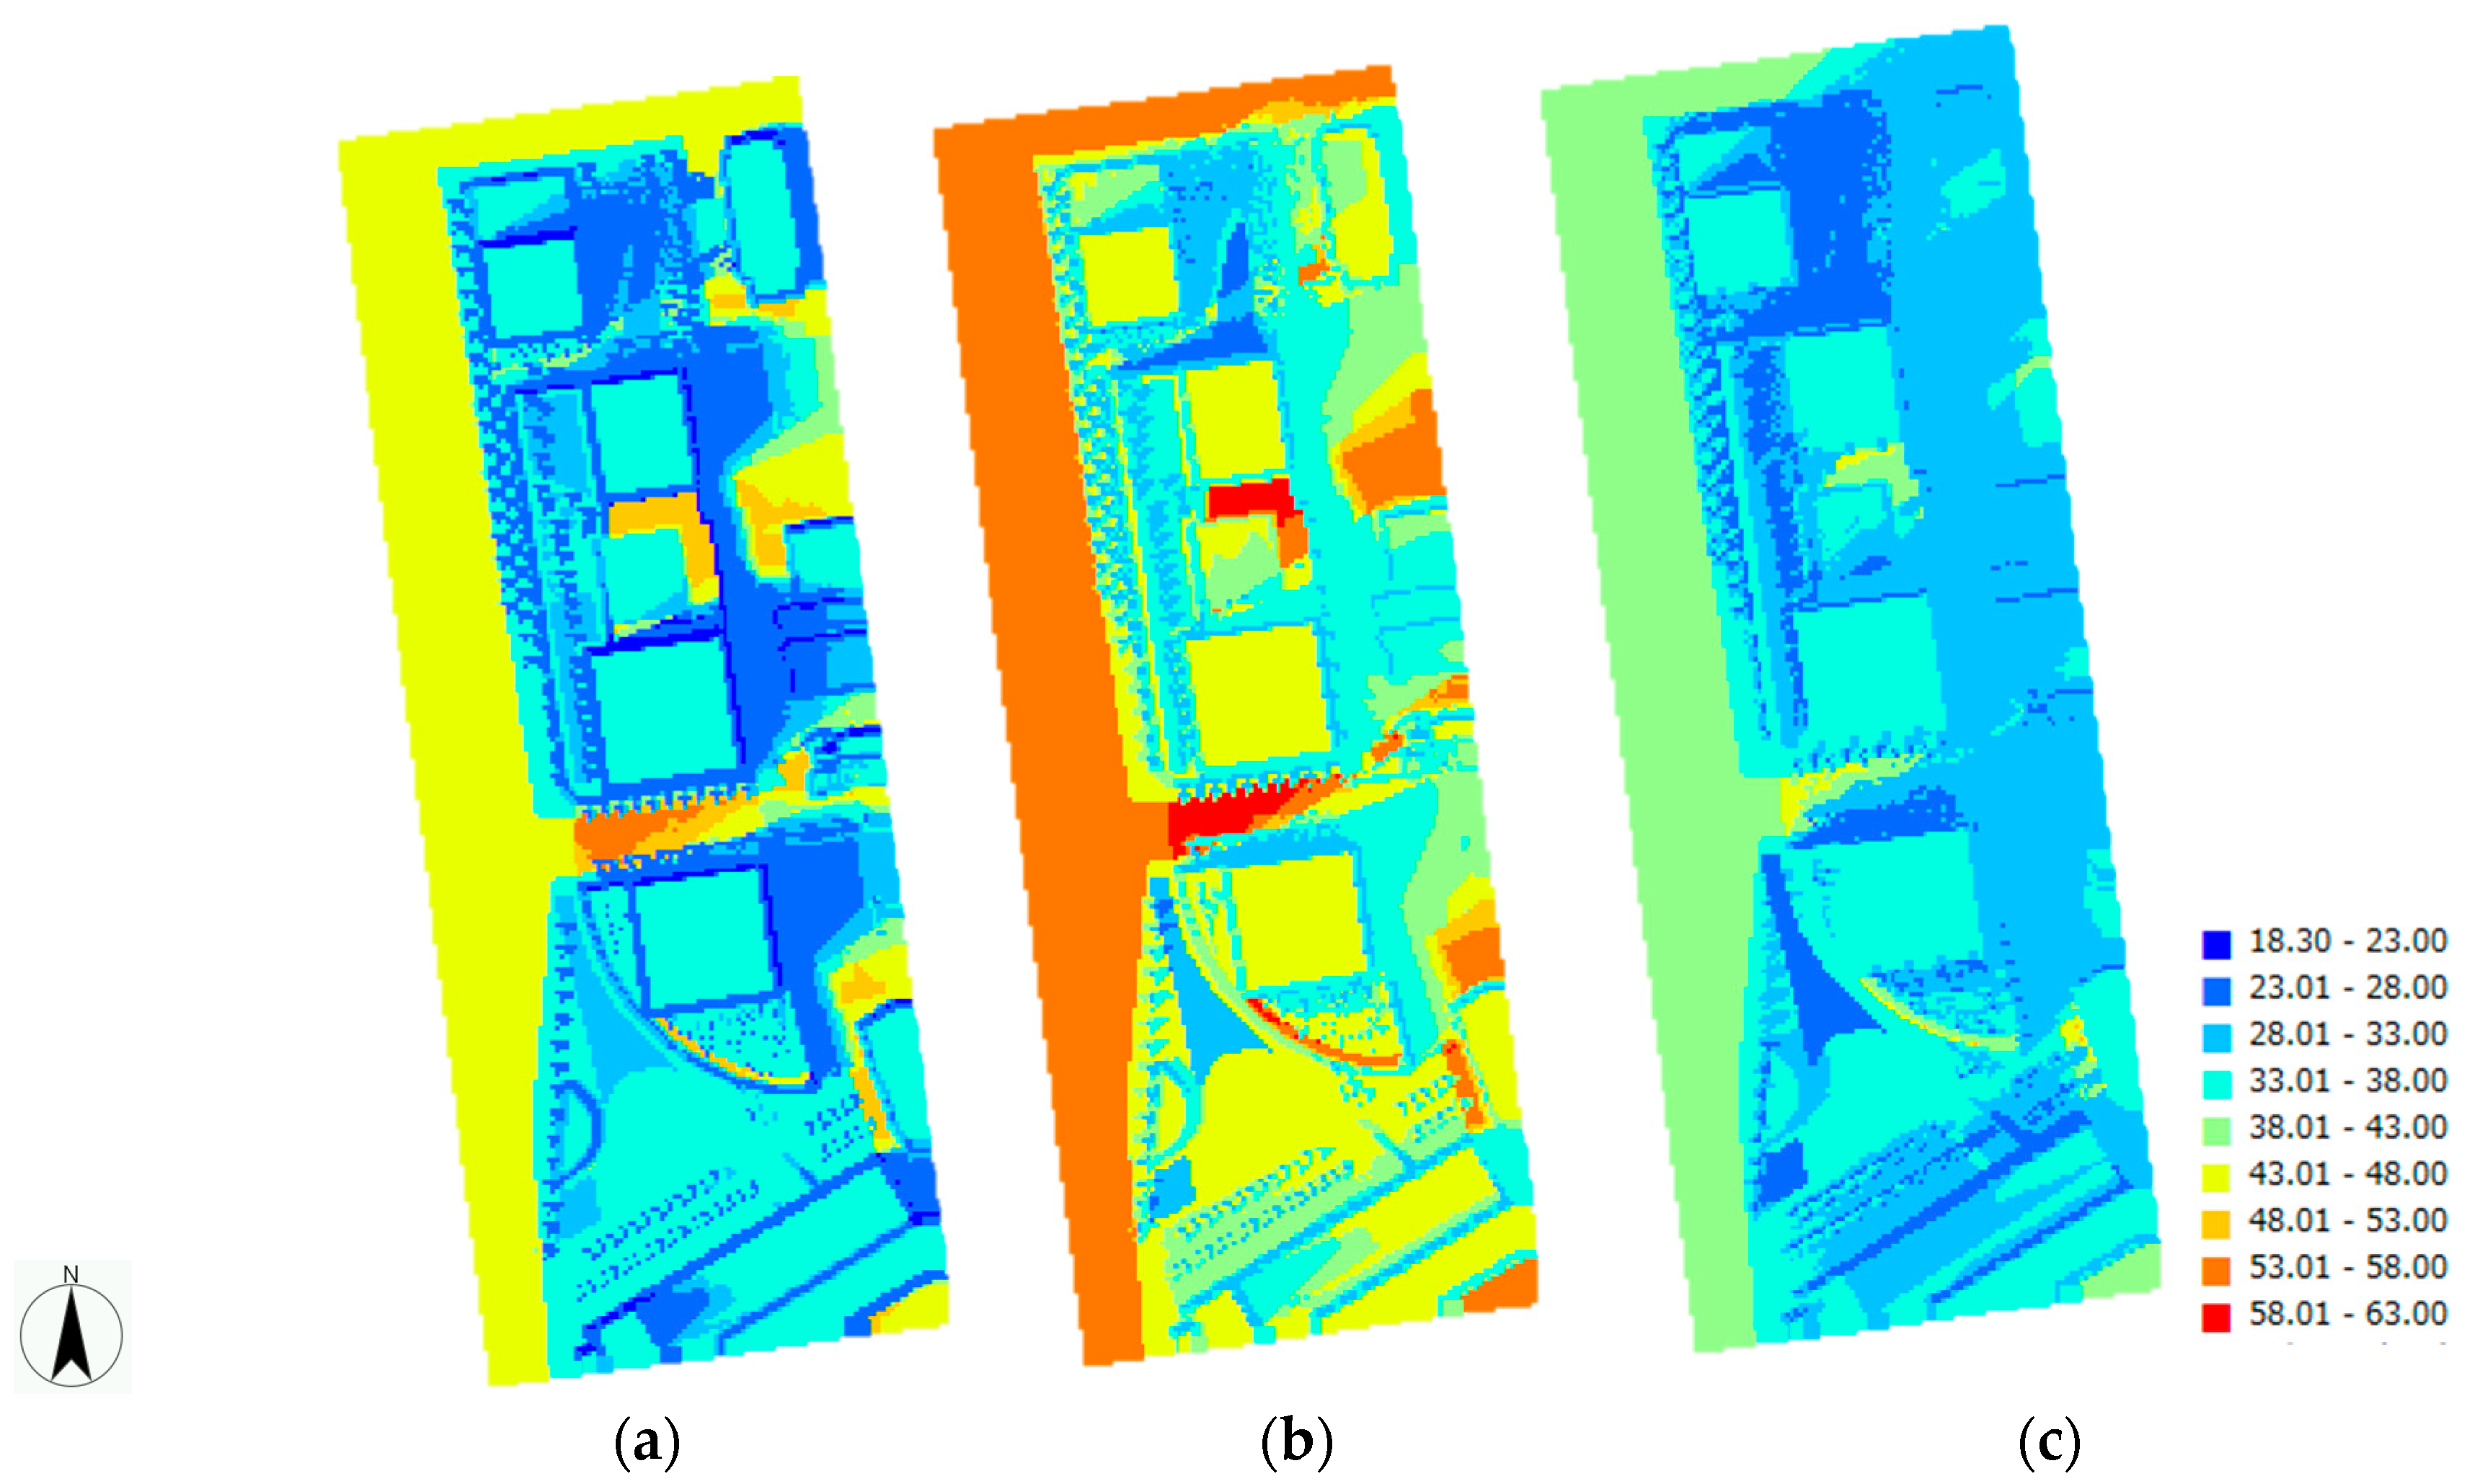
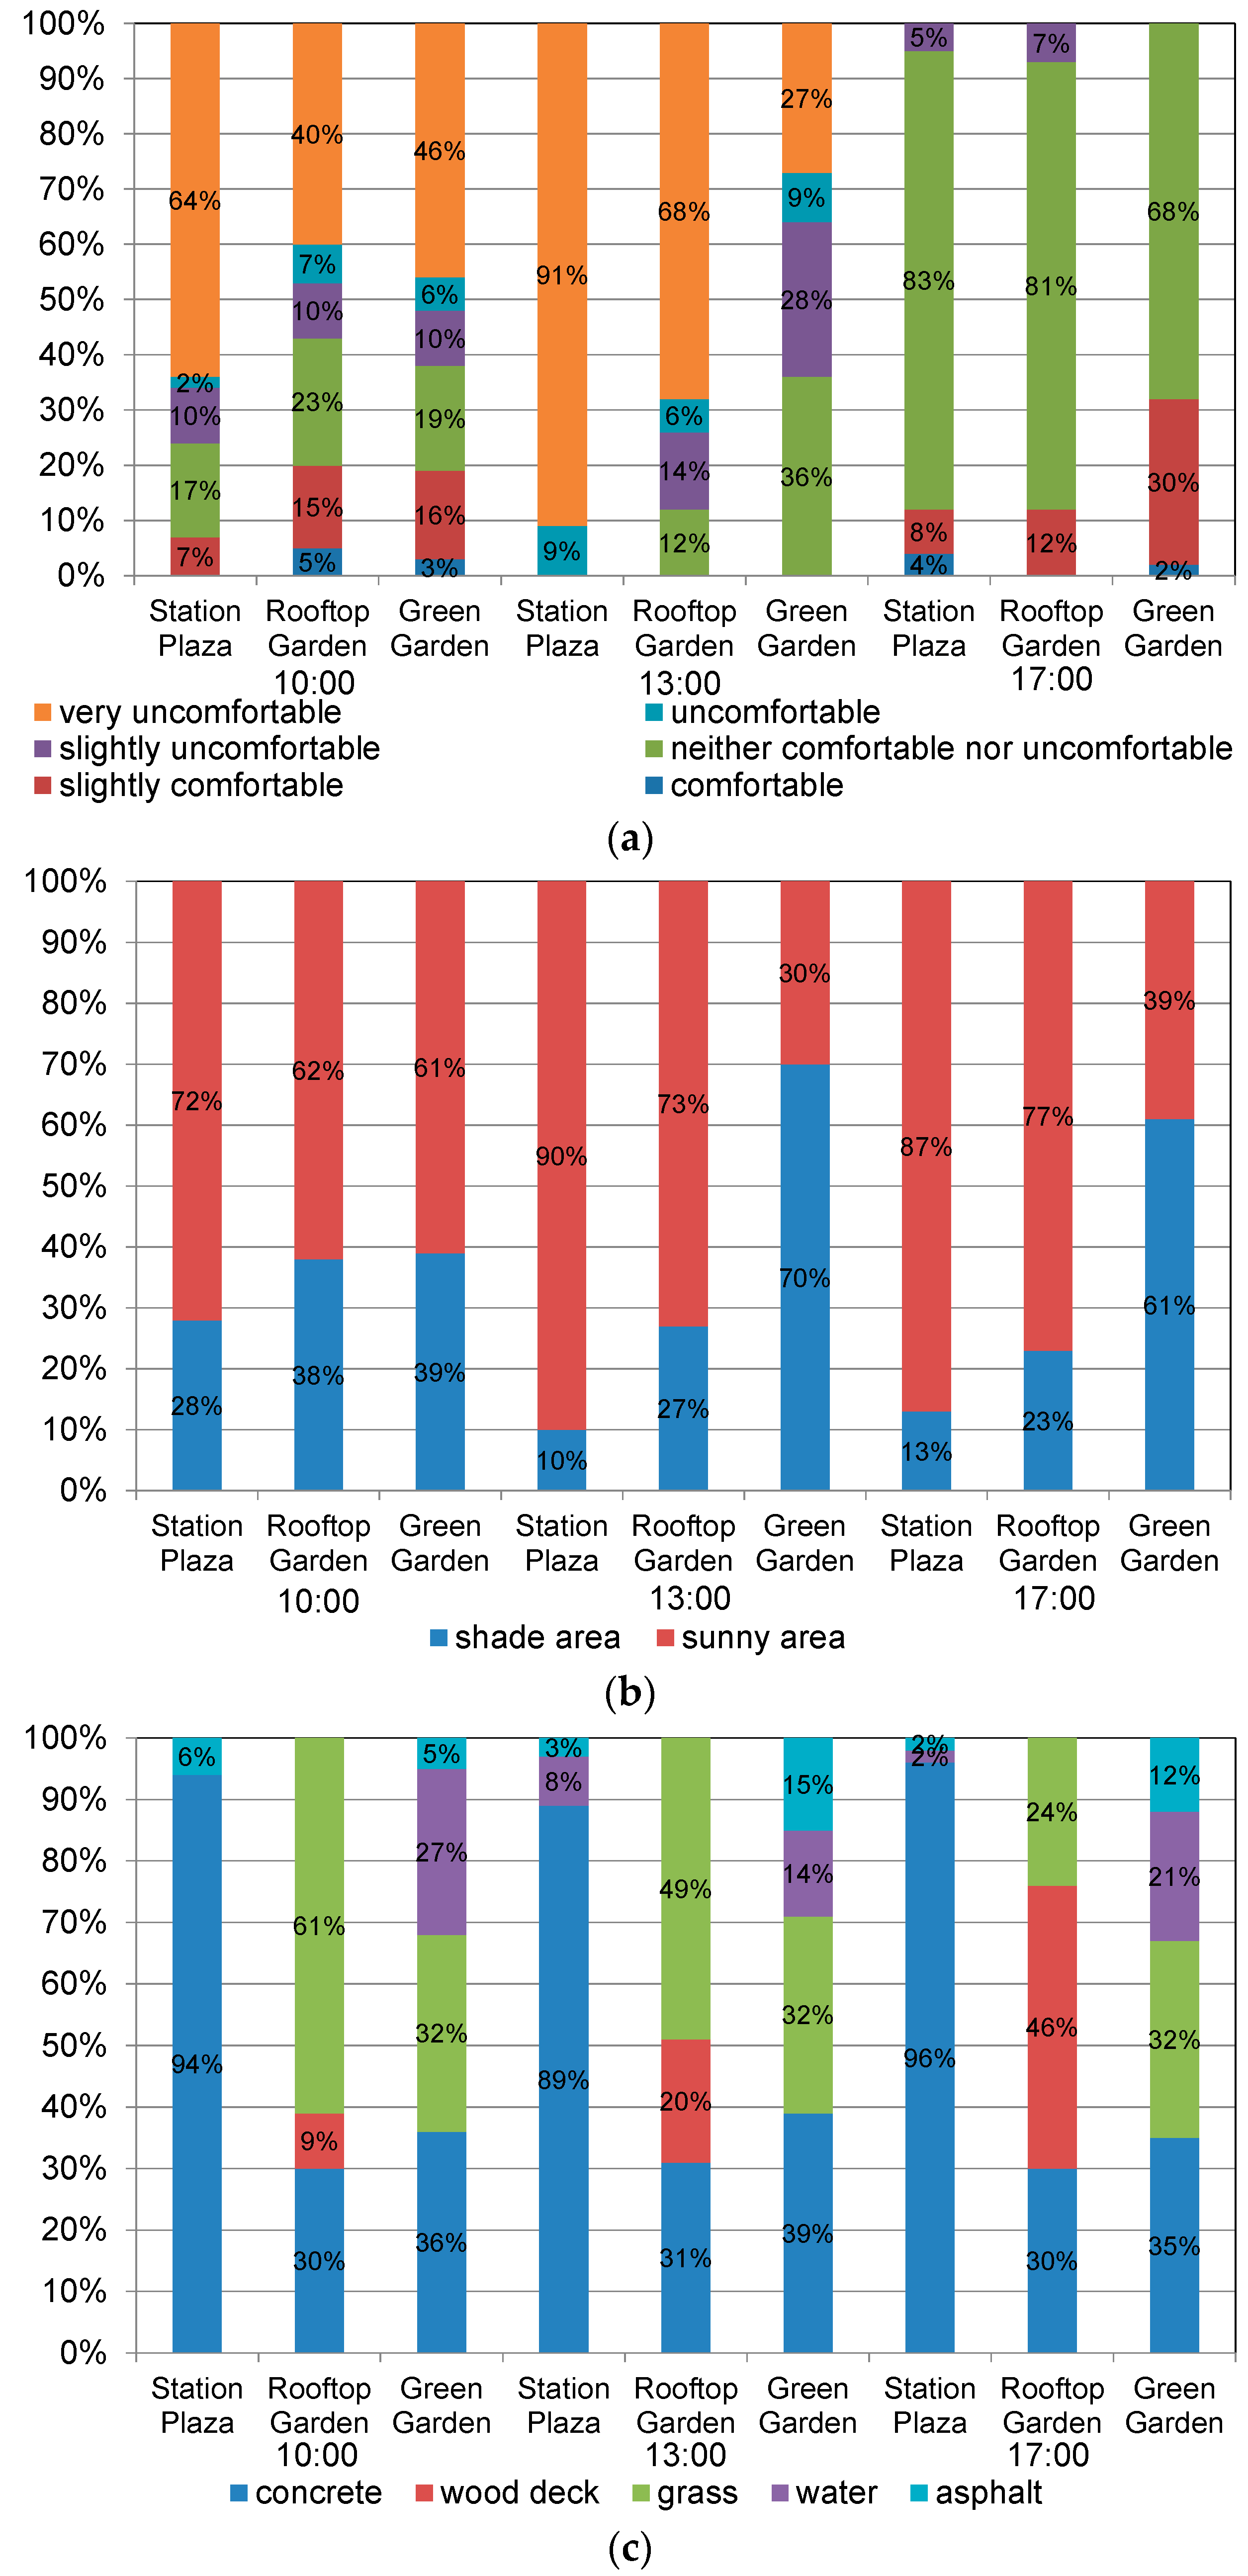
3. Calculation Results
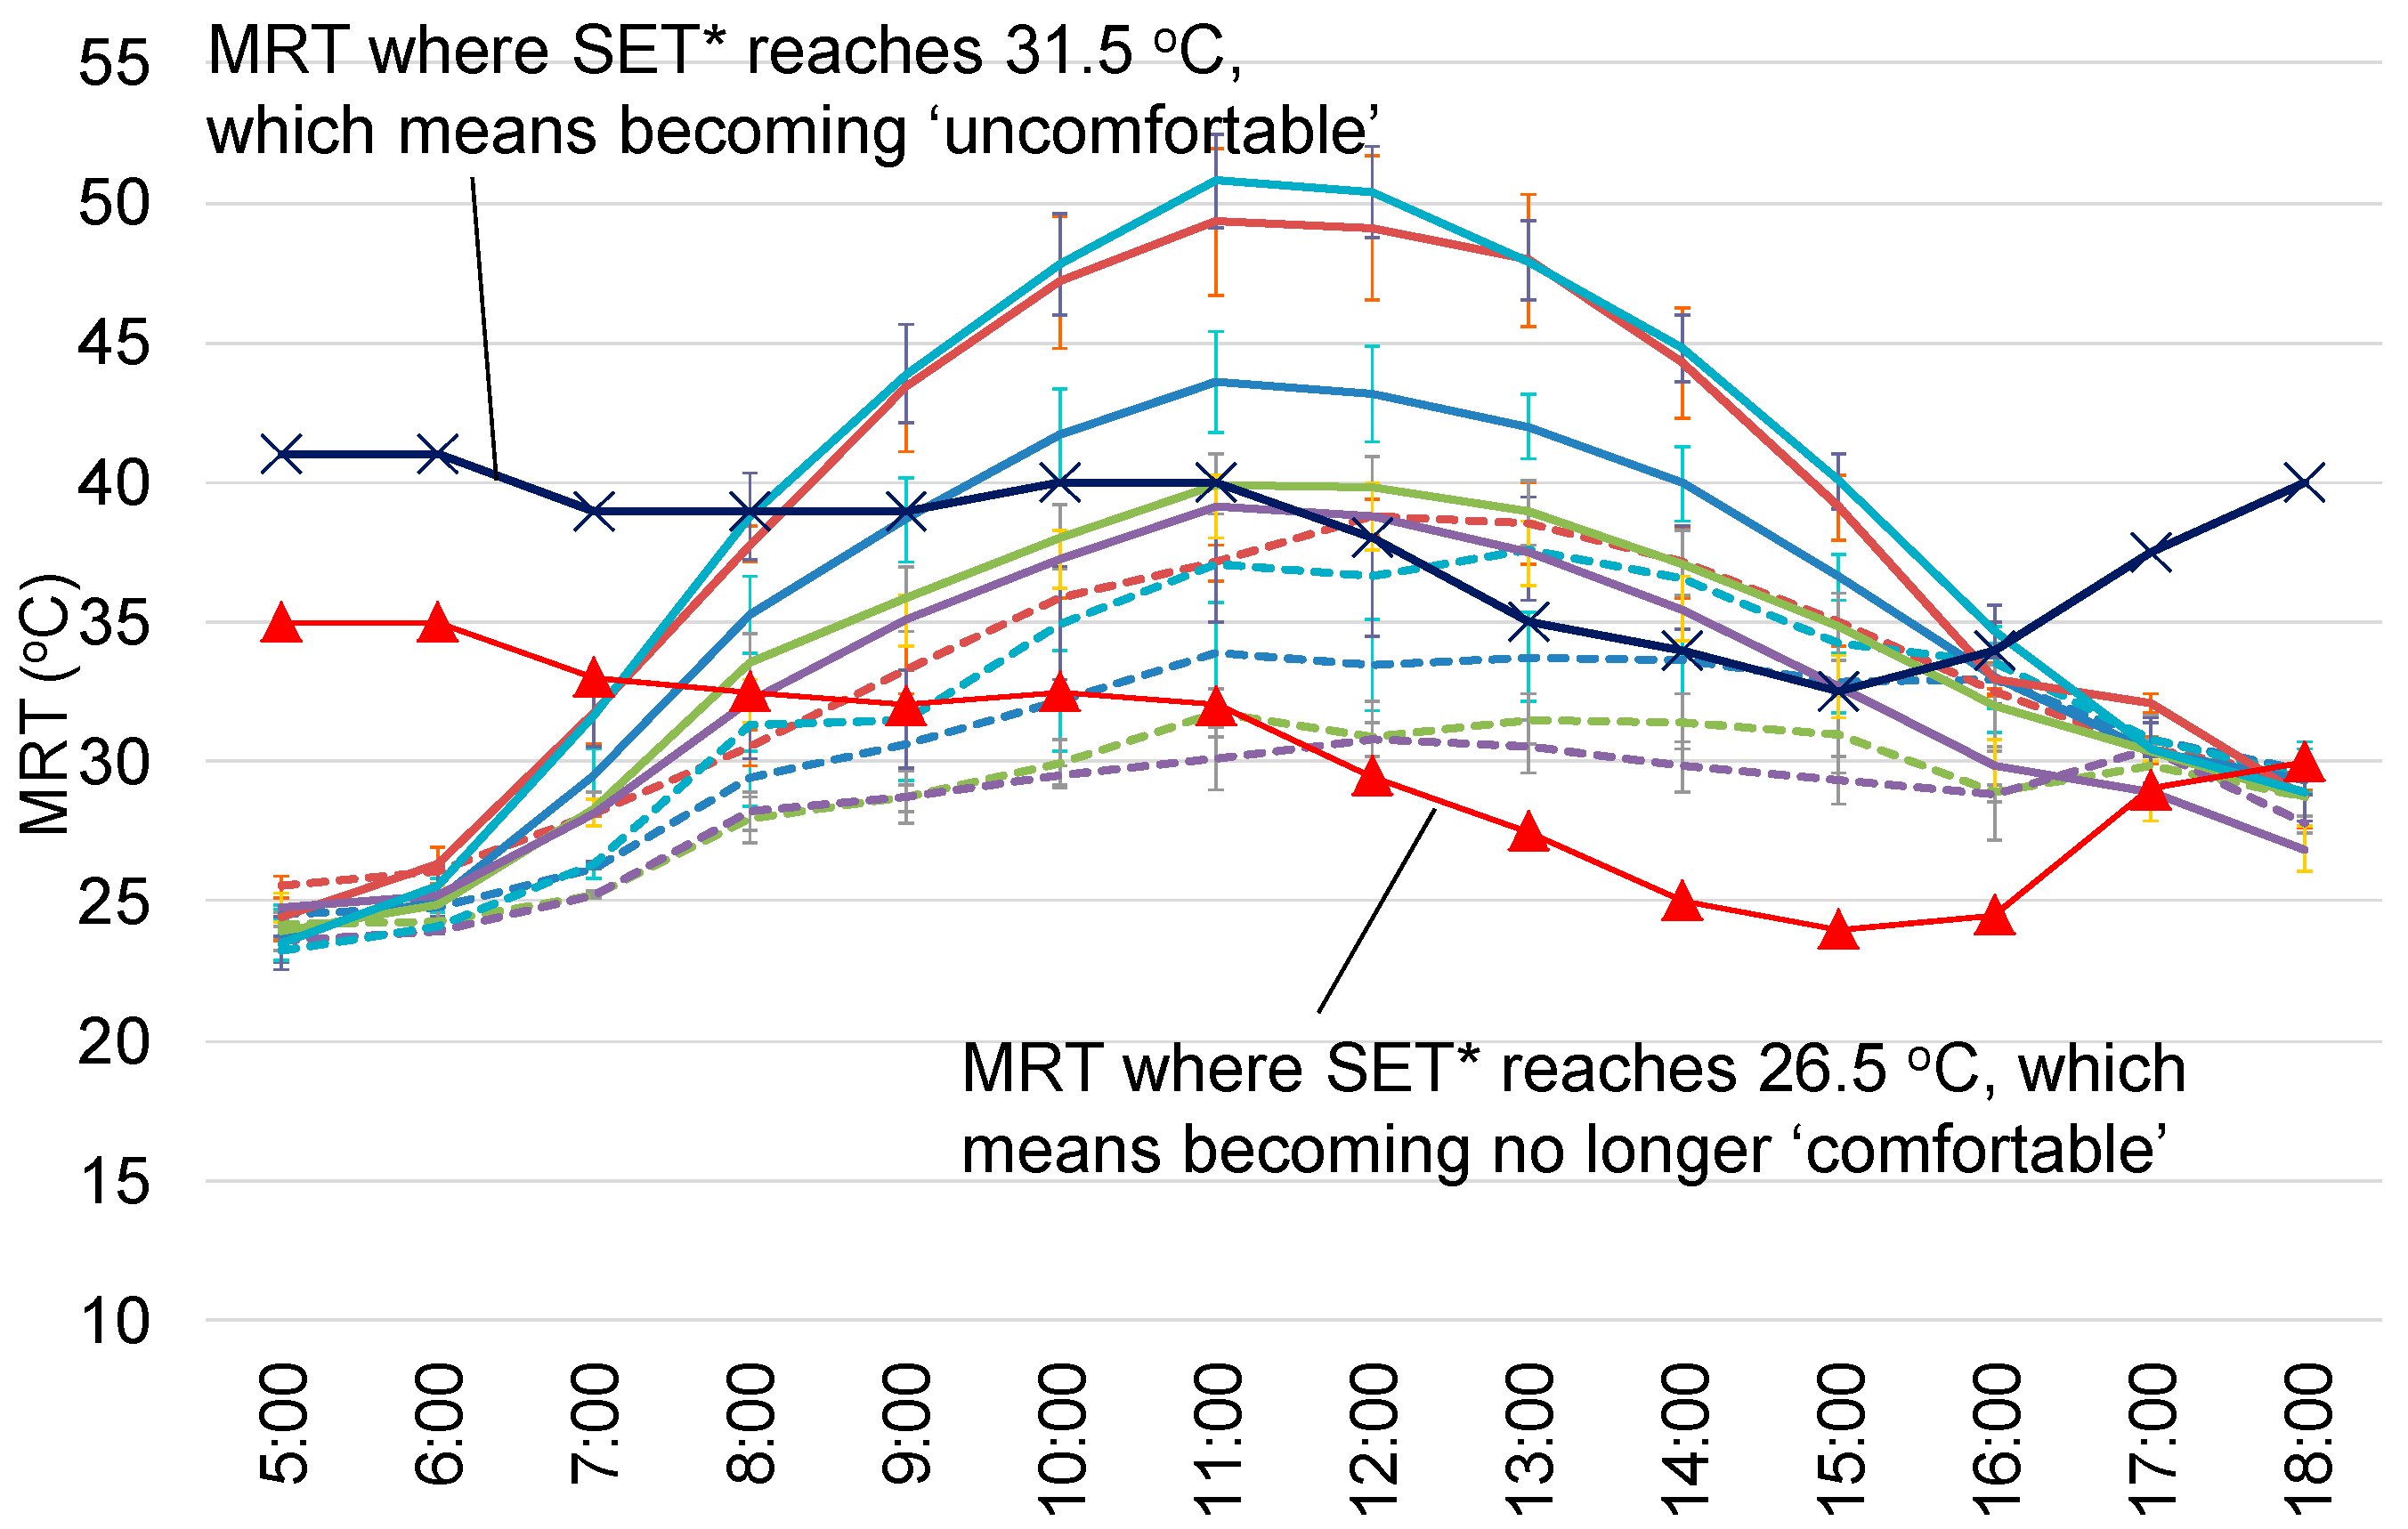
The calculation results of surface temperature distribution at 13:00 on the day of the summer solstice (21 June), a typical summer day (11 August), and the day of the autumnal equinox (23 September) are shown in Figure 3. Surface temperature is high where solar radiation reaches. It is also high where heat capacity is low, such as on a wood deck. The objective time 13:00 is selected as the time that the typical surface temperature and MRT distribution is likely to be occurred. Since the influence of solar radiation varies greatly with time, the characteristics of the spatial distribution of surface temperature and MRT should be analyzed at each time. So, temporal changes of them are considered in subsequent analyses.
The calculation results of MRT distribution at 13:00 on the day of the summer solstice, a typical summer day in August which is chosen based on meteorological measurement data and the day of the autumnal equinox are shown in Figure 4. MRT is high where solar radiation reaches, as was the case with surface temperature. MRT is low where trees are planted, such as in Green Garden.
Diurnal variations of the spatial average and standard deviation of MRT on each surface on the day of the summer solstice, a typical summer day in August, and the day of the autumnal equinox are shown in Figure 5. They are calculated for each ground cover type in sunny and shade conditions. A slightly discontinuous time change is confirmed according to the history of solar radiation gain on each surface. Diurnal variation is greater where solar radiation reaches, at any time and on any surface. Since MRT on sunny place is higher than on shade place for any ground cover type, the most dominant factor for the radiant environment is solar radiation shielding and the next is the improvement of surface cover. It seems that the history of receiving solar radiation takes precedence over the heat capacity of each surface cover material.
The MRT where SET* (Standard new Effective Temperature) reaches 31.5 °C and 26.5 °C on a typical summer day are shown in Figure 6. SET* is proposed by Gagge et al. [24], which is introduced by improving ET* (new Effective Temperature). ET* is also proposed by Gagge et al. [25], which is based on human energy balance and two-node model. SET* is used frequently both as indoor and outdoor comfort index. It is assumed that metabolic rate is 2.0 met, clothes amount is 0.6 clo, air temperature and relative humidity are obtained via observation values made at the Osaka observatory, and wind velocity is obtained via CFD (using the above-mentioned STREAM) calculation results, by using the outdoor space model reproducing buildings, obstacles and trees, including the surroundings. Then, SET* is calculated by the heat balance calculation program of human body thermo-physiological model, which has already been verified in previous studies [24,25]. Since the influence of air temperature and humidity variation on SET* is sufficiently smaller than that of MRT and wind velocity, they are set by the observation values at Osaka observatory. It is difficult to make SET* comfortable in the afternoon using solar radiation shielding and improved surface cover because the air temperature is too high on a typical summer day. However, it is easily realized via solar radiation shielding alone, even in the afternoon on the days of the summer solstice and autumnal equinox.

4. Discussion

The possibility of improving the thermal environment on a typical summer day when the thermal environment is likely to be severe needs to be discussed. The evaluation results for each region at 10:00, 13:00, and 17:00 on a typical summer day are shown in Figure 7. The relationship between SET* and thermal comfort evaluation reported by Ishii et al. [26] is as follows: comfortable < 26.5 °C < slightly comfortable < 27.5 °C < neither comfortable nor uncomfortable < 29.5 °C < slightly uncomfortable < 31.5 °C < uncomfortable < 32.5 °C < very uncomfortable. At 10:00 and 13:00, very uncomfortable situations are mitigated at shaded points in all areas. In Rooftop Gardens and Green Garden, because the areas of shade grass and water are large, there are several places where people feel ‘neither comfortable nor uncomfortable’. At 17:00, because solar radiation is low, few places exist where people feel uncomfortable and it is slightly comfortable in the areas of shade grass and water.

5. Conclusions

The radiation environment was evaluated, focusing on ground cover materials and solar radiation shading. The most dominant factor for the radiant environment is solar radiation shielding and the next is the improvement of surface cover. A comfortable thermal environment was realized via solar radiation shielding alone, even in the afternoon on the days of the summer solstice and autumnal equinox. However, it is difficult to make SET* comfortable in the afternoon by both solar radiation shielding and improved surface cover because the air temperature is too high on a typical summer day (August). At 10:00 and 13:00 on a typical summer day, very uncomfortable situations are mitigated at shaded points in all areas. Particularly in Rooftop Gardens and Green Garden, because the areas of shade grass and water are large, there are several places where people do not feel uncomfortable. Important knowledge was gained about the introduction effect as adaptation measures such as ground cover materials and solar radiation shading for urban heat island for various spaces and time.

Acknowledgments

We thank Makiko Kasahara, Shingo Tanabe and Makoto Kouyama for their cooperation with respect to our analysis.

Author Contributions

Hideki Takebayashi and Sae Kyogoku performed calculations and analysis.

Conflicts of Interest

The authors declare no conflict of interest.

References

  1. Oke, T.R. Street design and urban canopy layer climate. Energy Build. 1988, 11, 103–113. [Google Scholar] [CrossRef]
  2. Arnfield, A.J. Street design and urban canyon solar access. Energy Build. 1990, 14, 117–131. [Google Scholar] [CrossRef]
  3. Olgyay, V. Design with Climate: Bioclimatic Approach to Architectural Regionalism; Princeton University Press: Princeton, NJ, USA, 1963. [Google Scholar]
  4. Santamouris, M.; Asimakopoulos, D. Passive Cooling of Buildings; James and James: London, UK, 1996. [Google Scholar]
  5. Grosso, M.; Chiesa, G. Environmental indicators for evaluating properties. 2015; pp. 59–70. Available online: http://www.agenziaentrate.gov.it/wps/file/Nsilib/Nsi/Archivio/Agenzia+comunica/Prodotti+editoriali/Territorio+Italia/Archivio+Territorio+Italia+-+English+version/Territorio+Italia+2+2015+EN/Environmental+indicators+en/OKIndicatori+ambientali+EN.pdf (accessed on 28 January 2018). [CrossRef]
  6. Beckers, B. Solar Energy at Urban Scale; Wiley and Sons: Hoboken, NJ, USA, 2013. [Google Scholar]
  7. Eliasson, I. Urban Geometry, surface temperature and air temperature. Energy Build. 1990, 15, 141–145. [Google Scholar] [CrossRef]
  8. Ali-Toudert, F.; Mayer, H. Numerical study on the effects of aspect ratio and orientation of an urban street canyon on outdoor thermal comfort in hot and dry climate. Build. Environ. 2006, 41, 94–108. [Google Scholar] [CrossRef]
  9. Ali-Toudert, F.; Mayer, H. Effects of asymmetry, galleries, overhanging façades and vegetation on thermal comfort in urban street canyons. Sol. Energy 2007, 81, 742–754. [Google Scholar] [CrossRef]
  10. Martinelli, L.; Lin, T.P.; Matzarakis, A. Assessment of the influence of daily shadings pattern on human thermal comfort and attendance in Rome during summer period. Build. Environ. 2015, 92, 30–38. [Google Scholar] [CrossRef]
  11. Abreu-Harbich, L.V.; Labaki, L.C.; Matzarakis, A. Effect of tree planting design and tree species on human thermal comfort in the tropics. Landsc. Urban Plan. 2015, 138, 99–109. [Google Scholar] [CrossRef]
  12. Algeciras, J.A.R.; Consuegra, L.G.; Matzarakis, A. Spatial-temporal study on the effects of urban street configurations on human thermal comfort in the world heritage city of Camagüey-Cuba. Build. Environ. 2016, 101, 85–101. [Google Scholar] [CrossRef]
  13. Lee, H.; Mayer, H.; Chen, L. Contribution of trees and grasslands to the mitigation of human heat stress in a residential district of Freiburg, Southwest Germany. Landsc. Urban Plan. 2016, 148, 37–50. [Google Scholar] [CrossRef]
  14. Zheng, S.; Zhao, L.; Li, Q. Numerical simulation of the impact of different vegetation species on the outdoor thermal environment. Urban For. Urban Green. 2016, 18, 138–150. [Google Scholar] [CrossRef]
  15. Blazejczyk, K.; Epstein, Y.; Jendritzky, G.; Staiger, H.; Tinz, B. Comparison of UTCI to selected thermal indices. Int. J. Biometeorol. 2012, 56, 515–535. [Google Scholar] [CrossRef] [PubMed]
  16. Jendritzky, G.; de Dear, R.; Havenith, G. UTCI—Why another thermal index? Int. J. Biometeorol. 2012, 56, 421–428. [Google Scholar] [CrossRef] [PubMed] [Green Version]
  17. Takebayashi, H.; Kasahara, M.; Tanabe, S.; Kouyama, M. Analysis of Solar Radiation Shading Effects by Trees in the Open Space around Buildings. Sustainability 2017, 9, 1398. [Google Scholar] [CrossRef]
  18. Perini, K.; Magliocco, A. Effects of vegetation, urban density, building height, and atmospheric conditions on local temperatures and thermal comfort. Urban For. Urban Green. 2014, 13, 495–506. [Google Scholar] [CrossRef]
  19. Perini, K.; Sabbion, P. Urban Sustainability and River Restoration: Green and Blue Infrastructure; Wiley-Blackwell: Hoboken, NJ, USA, 2017. [Google Scholar]
  20. Chiesa, G.; Grosso, M. Early-design method to localize outdoor activities on microclimate criteria. In Proceedings of the International Conference on Urban Comfort and Environmental Quality, URBAN-CEQ, Genoa, Italy, 28–29 September 2017; pp. 25–29. [Google Scholar]
  21. Chen, L.; Yu, B.; Yang, F.; Mayer, H. Intra-urban differences of mean radiant temperature in different urban settings in Shanghai and implications for heat stress under heat waves: AGIS-based approach. Energy Build. 2016, 130, 829–842. [Google Scholar] [CrossRef]
  22. Grand Front Osaka. Available online: http://umeda-connect.jp/special/vol10/part01.html (accessed on 24 October 2017).
  23. Takebayashi, H.; Ishii, E.; Moriyama, M.; Sakaki, A.; Nakajima, S.; Ueda, H. Study to examine the potential for solar energy utilization based on the relationship between urban morphology and solar radiation gain on building rooftops and wall surfaces. Sol. Energy 2015, 119, 362–369. [Google Scholar] [CrossRef]
  24. Gagge, A.P.; Stolwik, J.A.J.; Nishi, Y. A standard predictive index of human responses to the thermal environment. ASHRAE Trans. 1986, 92, 709–731. [Google Scholar]
  25. Gagge, A.P.; Stolwik, J.A.J.; Nishi, Y. An effective temperature scale based on a simple model of human physiological regulatory response. ASHRAE Trans. 1971, 77, 247–257. [Google Scholar]
  26. Ishii, A.; Katayama, T.; Shiotsuki, Y.; Yoshimizu, H.; Abe, Y. Experimental study on comfort sensation of people in the outdoor environment. J. Archit. Plan. 1988, 386, 28–37. [Google Scholar] [CrossRef]
Figure 1. Study site layout. (a) Distribution and (b) ratio of each ground cover type [17]. The outline of the building is indicated by the blue frame.
Sustainability 10 00337 g001
Figure 2. Distribution and ratio of each ground cover type in (a) Station Plaza; (b) Rooftop Gardens; and (c) Green Garden [17]. The objective area is indicated by the red frame, apart from black buildings.
Sustainability 10 00337 g002
Figure 3. Calculation results of surface temperature [°C] distribution at 13:00. (a) Day of the summer solstice; (b) Typical summer day (August); (c) Day of the autumnal equinox.
Sustainability 10 00337 g003
Figure 4. Calculation results of Mean Radiant Temperature (MRT) [°C] distribution at 13:00. (a) Day of the summer solstice; (b) Typical summer day (August); (c) Day of the autumnal equinox.
Sustainability 10 00337 g004
Figure 5. Diurnal variation of the spatial average and standard deviation of MRT on each surface. (a) Day of the summer solstice; (b) Typical summer day (August); (c) Day of the autumnal equinox.
Sustainability 10 00337 g005
Figure 6. MRT where Standard new Effective Temperature (SET*) reaches 31.5 °C and 26.5 °C on a typical summer day (August).
Sustainability 10 00337 g006
Figure 7. Evaluation results for each region at 10:00, 13:00, and 17:00 on a typical summer day (August). (a) thermal comfort evaluation per SET*; (b) solar radiation shade; (c) surface cover in shade areas.
Sustainability 10 00337 g007
Table 1. Parameters for surface heat budget equation and heat conduction equation. (Solar reflectance on water surface is calculated in each incident angle).
Solar Reflectance [-]Evaporative Efficiency [-]Heat Conductivity [W/(mK)]Emissivity [-]Thermal Capacity [kJ/(m3·K)]
Concrete0.350.01.700.951934
Wood deck0.150.00.501.001130
Grass0.300.33.000.903000
Waterdepends on incident angle1.07.001.009000
Asphalt0.150.00.741.002056
Soil-0.00.62-1583

