1. Introduction
The source region of the Yellow River is an important river water conservation area and ecological barrier in China. It is a major area for alpine wildlife protection, as well as a major animal husbandry base in China. Traditional grassland animal husbandry in this region presently faces various bottlenecks, including overgrazing, grassland degradation and seasonal imbalance, which severely threatens the functional maintenance of grassland ecosystem services [
1,
2,
3]. The concurrent enhancement of wildlife protection has resulted in the rapid growth of wild herbivore populations, which has heightened the conflict for forage grass between wild herbivores and domestic animals. It has even begun to affect the local grassland ecosystem and animal husbandry. However, several questions remain unanswered regarding large wild herbivores, including their current state of protection; their population size; their distribution; their forage grass requirements; and their specific influence on grassland animal husbandry. The extent of the protection of the wild animals and the effect of the wild animals on the grassland ecosystem and local animal husbandry, remain unclear.
Currently, the two major methods for investigating the population of large wild herbivores are field surveys and remote sensing surveys. In China, field surveys have been used twice to investigate national terrestrial wild animal resources, from 1995 to 2003 and from 2011 to present [
4]. Remote sensing surveys use aircraft aerial photography to investigate large terrestrial animal resources by recording individuals. In particular, unmannered aerial vehicles (UAV) are a new means of monitoring wild animal populations and have several merits including low cost, flexible operation and high resolution. Compared to field investigations, remote sensing surveys by UAVs are characterized by less interference with animals, easier access to hard-to-reach areas and wider investigation scope [
5]. Gonzalez et al. [
6] used an unmannered aerial vehicle to capture thermal infrared images and differentiated animals, such as deer and kangaroo, on Australian grasslands based on temperature differences between animals and plants and successfully tracked and counted koala this way. Other cases of monitoring animals using UAVs involved black bears [
7], white-tailed deer [
8], reindeer [
9] and African elephants [
10]. All these cases were at the methodology level over areas less than 30 km
2. No cases using this methodology in the Qinghai-Tibet Plateau in China have been reported.
Traditional research on the forage-livestock balance has focused on calculating forage grass production, animal feed intake, forage grass utilization rate and grazing capacity [
11,
12,
13,
14,
15,
16,
17]. Thapa et al. [
18] estimated the grazing capacity of local land resources in the southern mountain areas in Nepal. Silori et al. [
19] pointed out that the increasing domestic animal population in the south of India had disturbed the habitat of large mammals in the Mudumalai Wildlife Refuge. Fan et al. [
20] considered climate change to be the main factor affecting forage grass production in the Sanjiangyuan (headwater region of the three great rivers); but different grazing pressures and patterns also affect forage grass production. Niu et al. [
21] analyzed the effects of natural and artificial factors on grassland desertification based on an estimation of net primary productivity (NPP) and the theoretical livestock capacity of grassland. Lu et al. [
22] proposed a water and land allocation model related to water-land-forage-livestock arrangement for grazing areas, and would provide a new approach for maintaining the sustainable development of grassland ecosystem as well as sustainable social and economic development in the pastoral areas. Zhang et al. [
23] estimated the forage grass production and stocking capacity of different types of grass in the Sanjiangyuan based on moderate-resolution imaging spectroradiometer (MODIS) readings of net primary production (NPP). They discovered that the Sanjiangyuan was overloaded by 6,520,000 sheep units in 2010. Cai et al. [
24] discovered that the ecological project of livestock reduction in Madoi County reversed grassland degradation in some areas. A literature review indicated that little research has been reported on the balance between forage grass and wild herbivores in grassland areas in China. Key to the estimation of this balance is an investigation of wild herbivore populations.
The present study aimed to address this issue. We investigated the population and basic status of large wild herbivores, including kiang (Equus kiang), Tibetan gazelle (Procapra picticaudata) and bharal (Pseudois nayaur) in Madoi County using UAV aerial photography technology. We estimated the forage-livestock balance including wild herbivores and domestic animals in the area and analyzed the effect of large wild herbivores and domestic animals on the maintenance of forage grass. The study is expected to inform the scientific and reasonable protection of wild animals; effective grassland utilization planning; and the health of grassland ecosystems. The study also has relevance for the construction of a national park in the source region of the Yellow River.
2. Materials and Methods
2.1. Profile of Madoi County
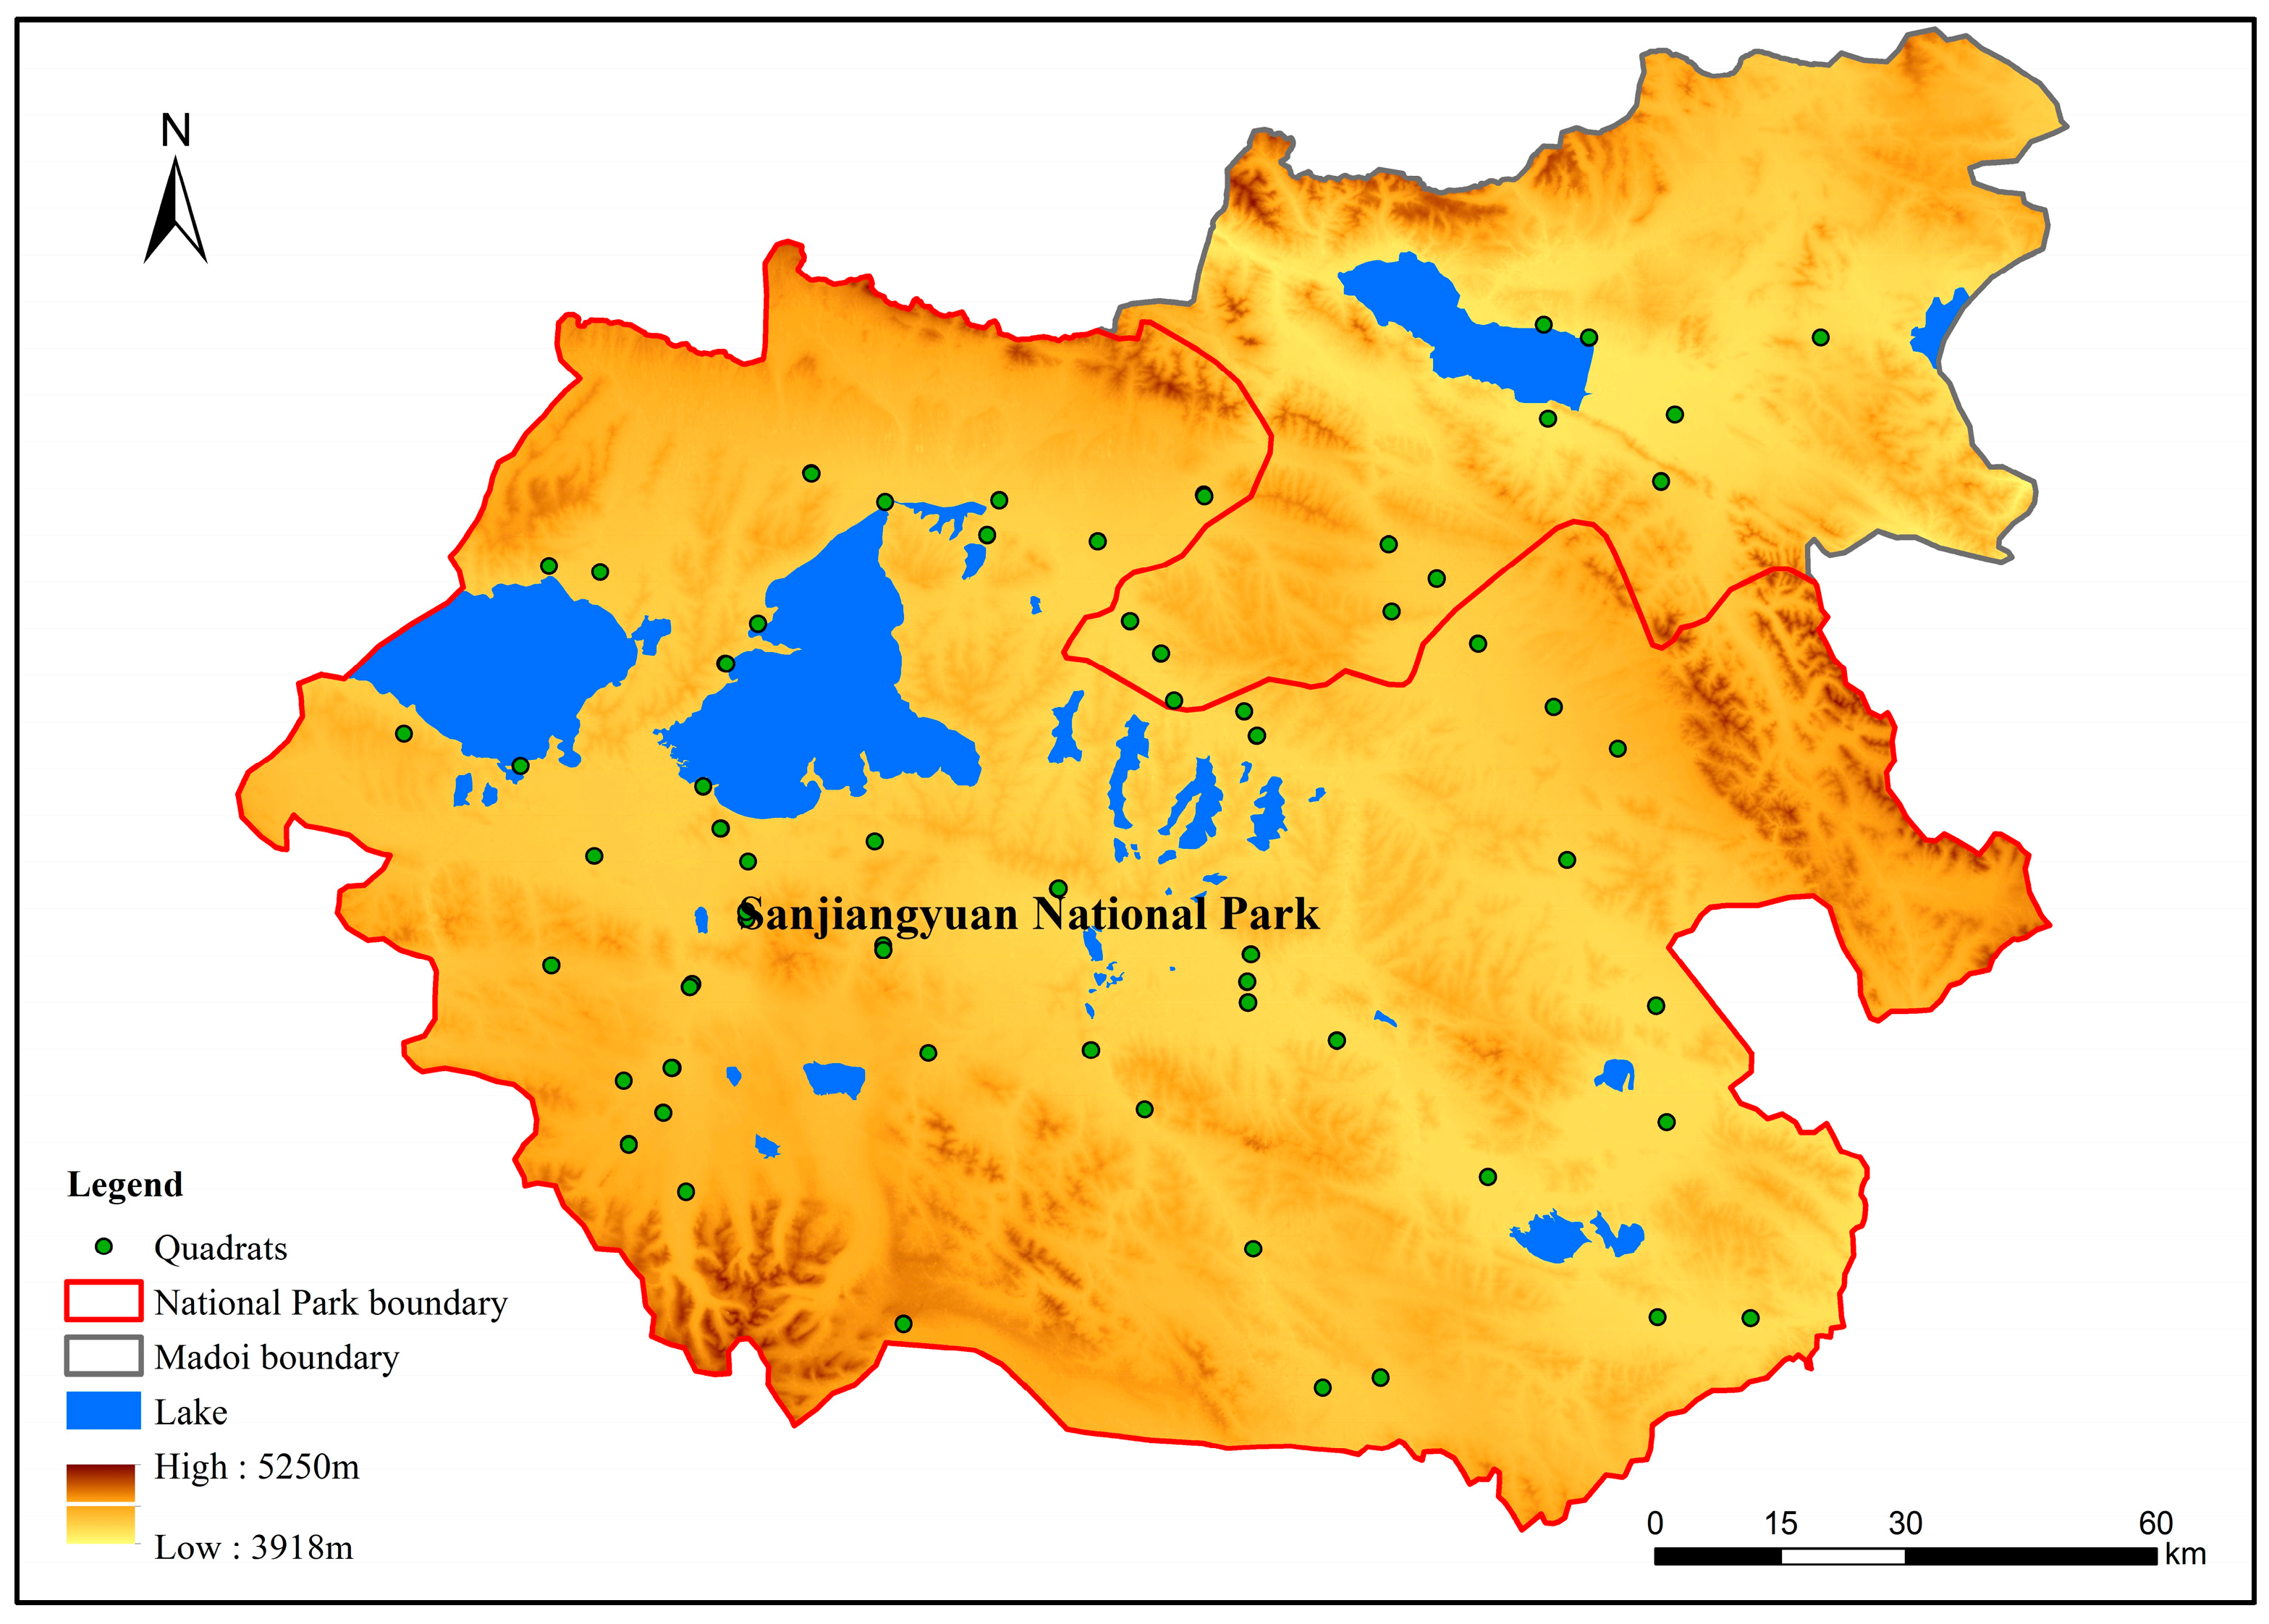
Located in the source region of the Yellow River, Madoi County forms a part of the Tibetan Autonomous Prefecture of Golog. It is located in the south of Qinghai Province and the north of the Bayan Har Mountains. It is between 96°50′ and 99°20′ E longitude and between 33°50′ and 35°40′ N latitude. The total area is 25,300 km2. The county, situated in a high plain area, has an average elevation of 4200 m. Grasslands account for approximately 88% of the total vegetation. Described as a typical plateau continental climate, the annual average temperature is −4 °C and the annual average precipitation is 418 mm. There are a total of more than 4000 rivers and lakes. The county has the reputation of being the “source of the Yellow River” and the “county of thousands of lakes”. It has rich resources with over 50 species of wild animals, such as kiangs, bharals and black-necked cranes.
Animal husbandry in the county has been rapidly increasing since the establishment of the People’s Republic of China and the population of domestic animals has since doubled. Due to the effect of human activities and climate change, the ecosystem in Madoi County has been severely degraded over the last 30 years. Pasture degradation and desertification are linked and water loss and soil erosion are severe in the region. Ecosystem degradation is most severe in the Sanjiangyuan area. To protect the integrity and uniqueness of the ecosystem in the Sanjiangyuan area, the Sanjiangyuan National Park was built in 2016. The park is located in Madoi County (
Figure 1) and accounts for approximately 78.1% of the total area of the county [
25].
2.2. UAV Survey
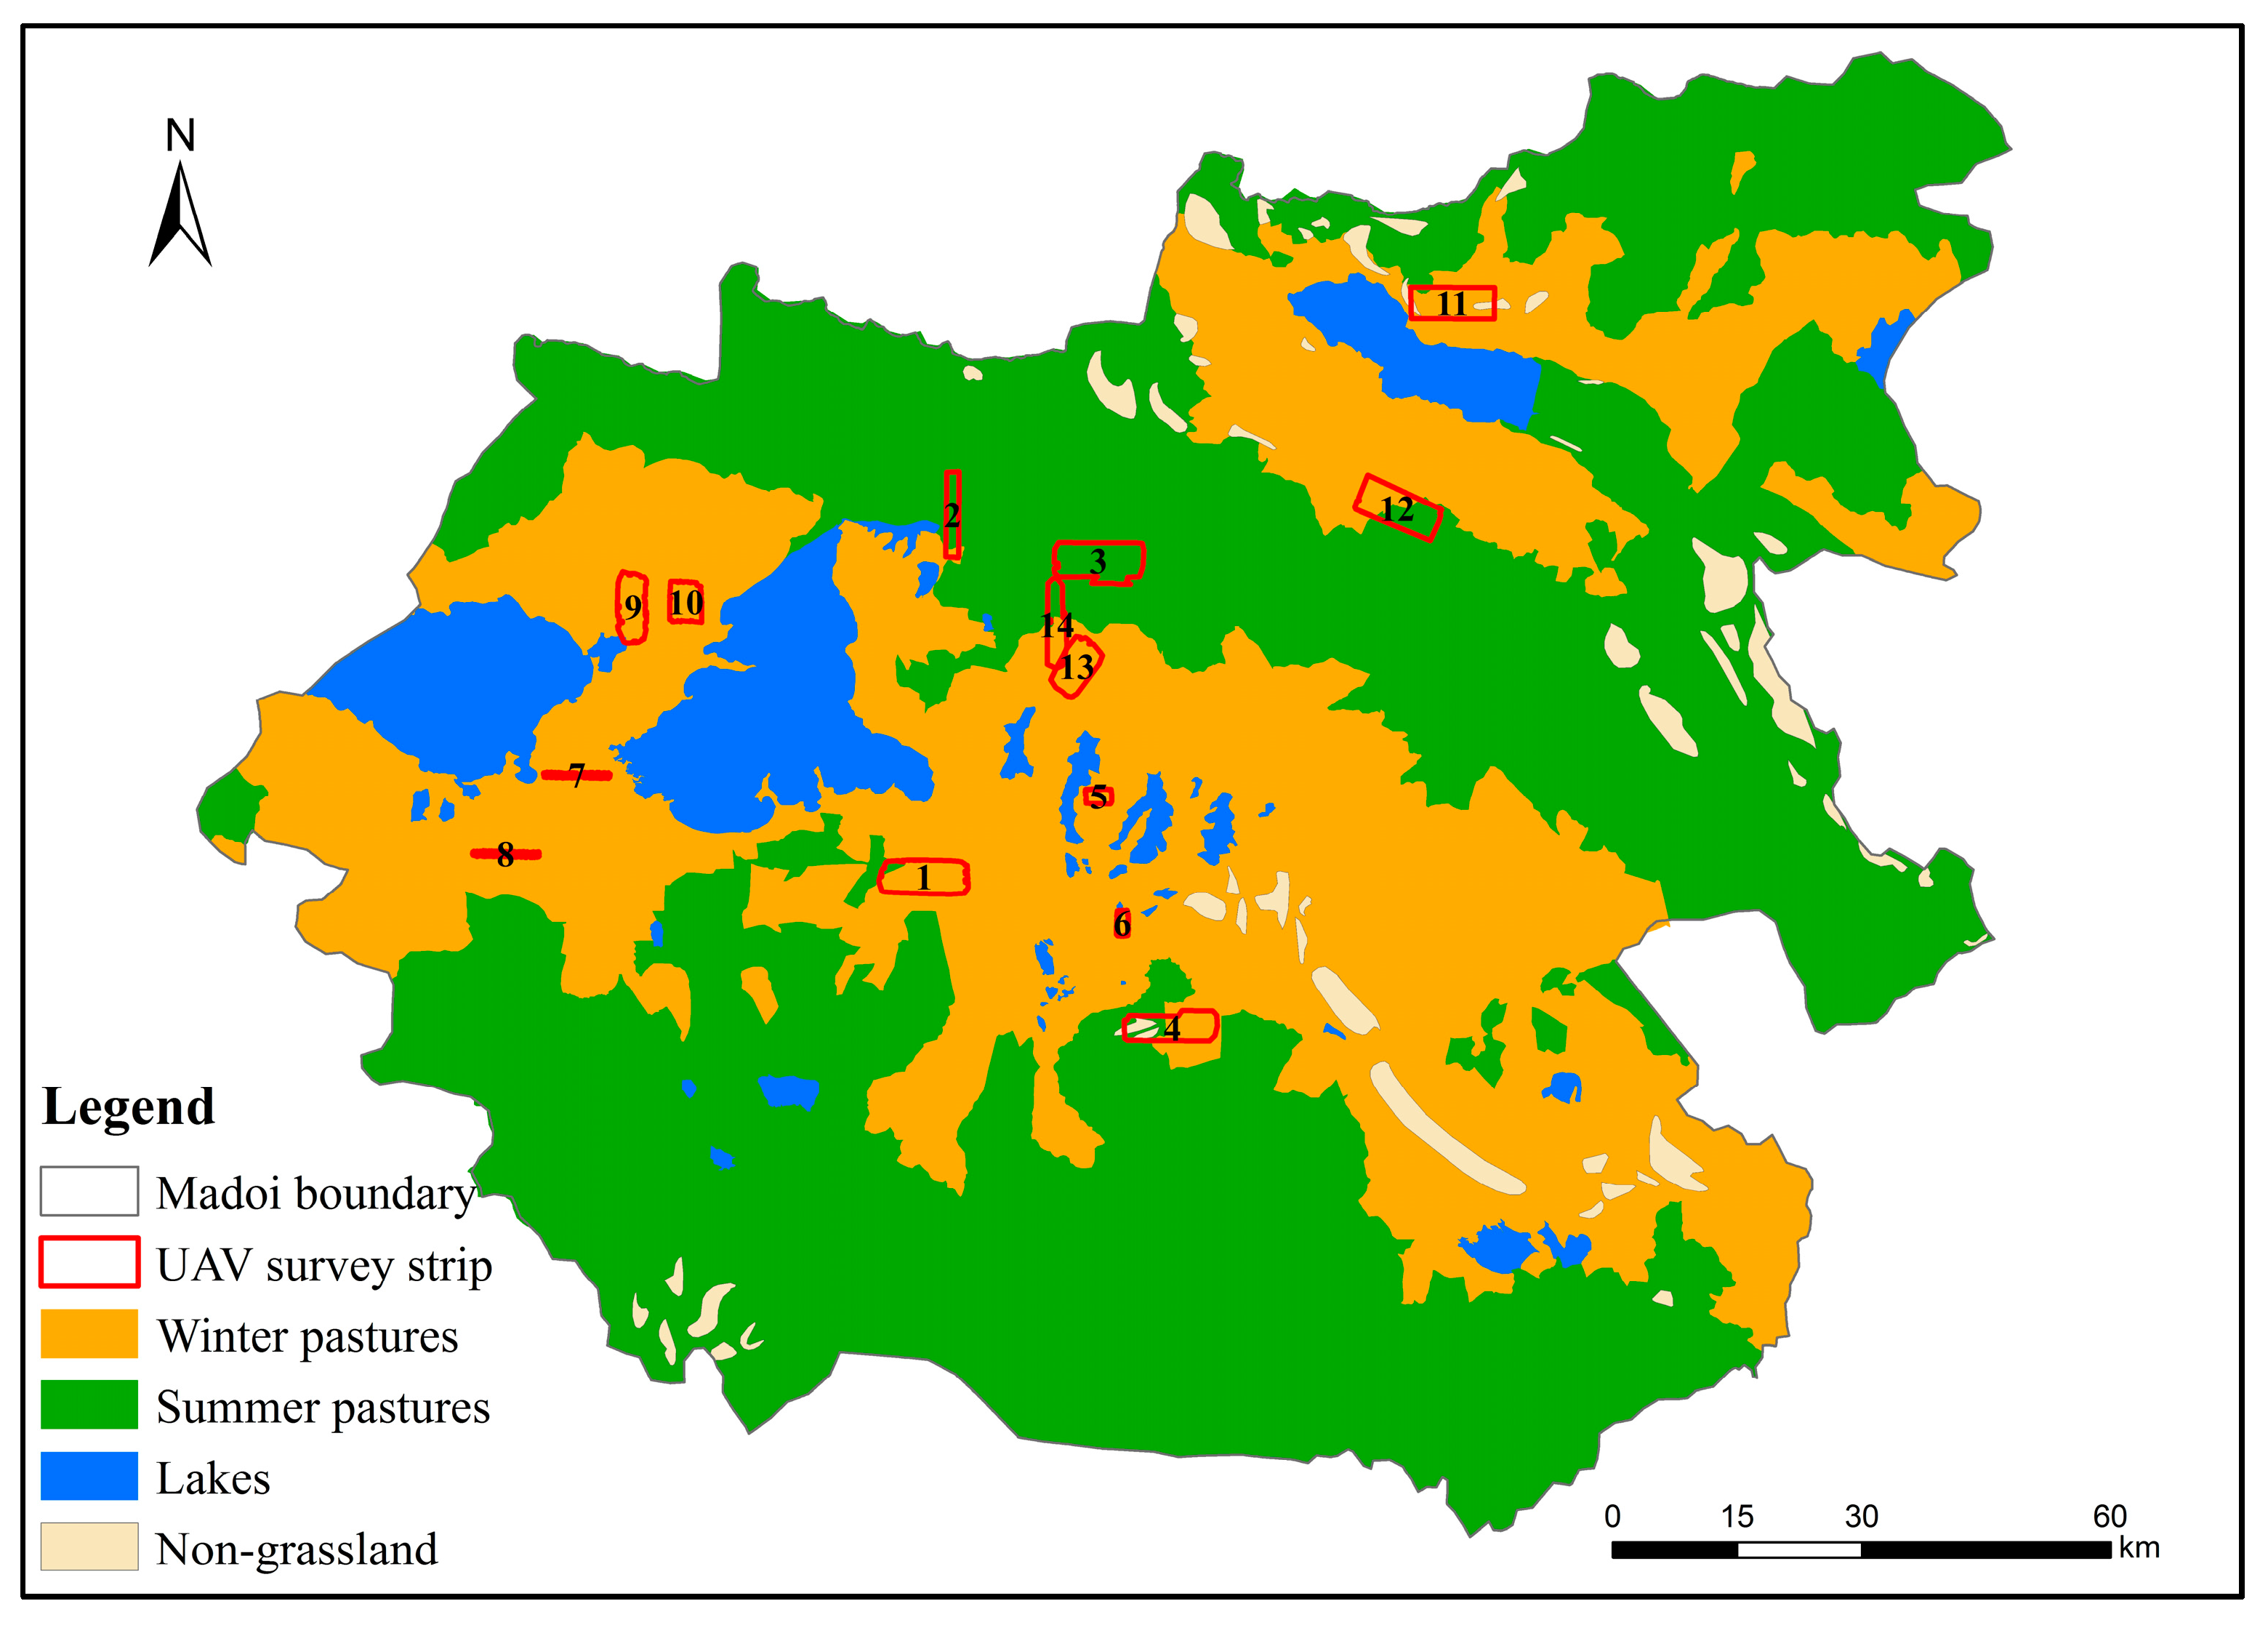
We attempted to take into consideration all relevant factors, such as the terrain, land use/coverage and vegetation types, in the determination of the survey sample strips. We used a systematic sampling method to select evenly distributed sample strips in Madoi County. A total of two UAV surveys in a summer and winter season were respectively conducted, both of which were compatible with the relevant administrative specifications.
The UAV survey in the summer season of 2016 used two self-developed UAV models. Specifically, the fuel-powered UAV with two cameras flew seven sorties at a speed of 108 km/h and the electricity-powered UAVs with two cameras flew two sorties at a speed of 72 km/h. The flight height was approximately 700 m. At this height, the transect width was about 1.2 km. The photographic resolution was between 15 cm and 18.5 cm per pixel. A total of 23,810 images were captured. The UAV survey in the winter season of 2017 used self-developed electric UAV and F1000-model electric UAV with one camera. There were a total of 14 effective sorties. The capturing height was between 200 m and 350 m. At this height, the transect width was about 500 m. The photographic resolution was between 4 cm and 7 cm per pixel. A total of 23,784 images were captured. The aerial photography direction and side overlap of the two surveys were 80% and 60%, respectively.
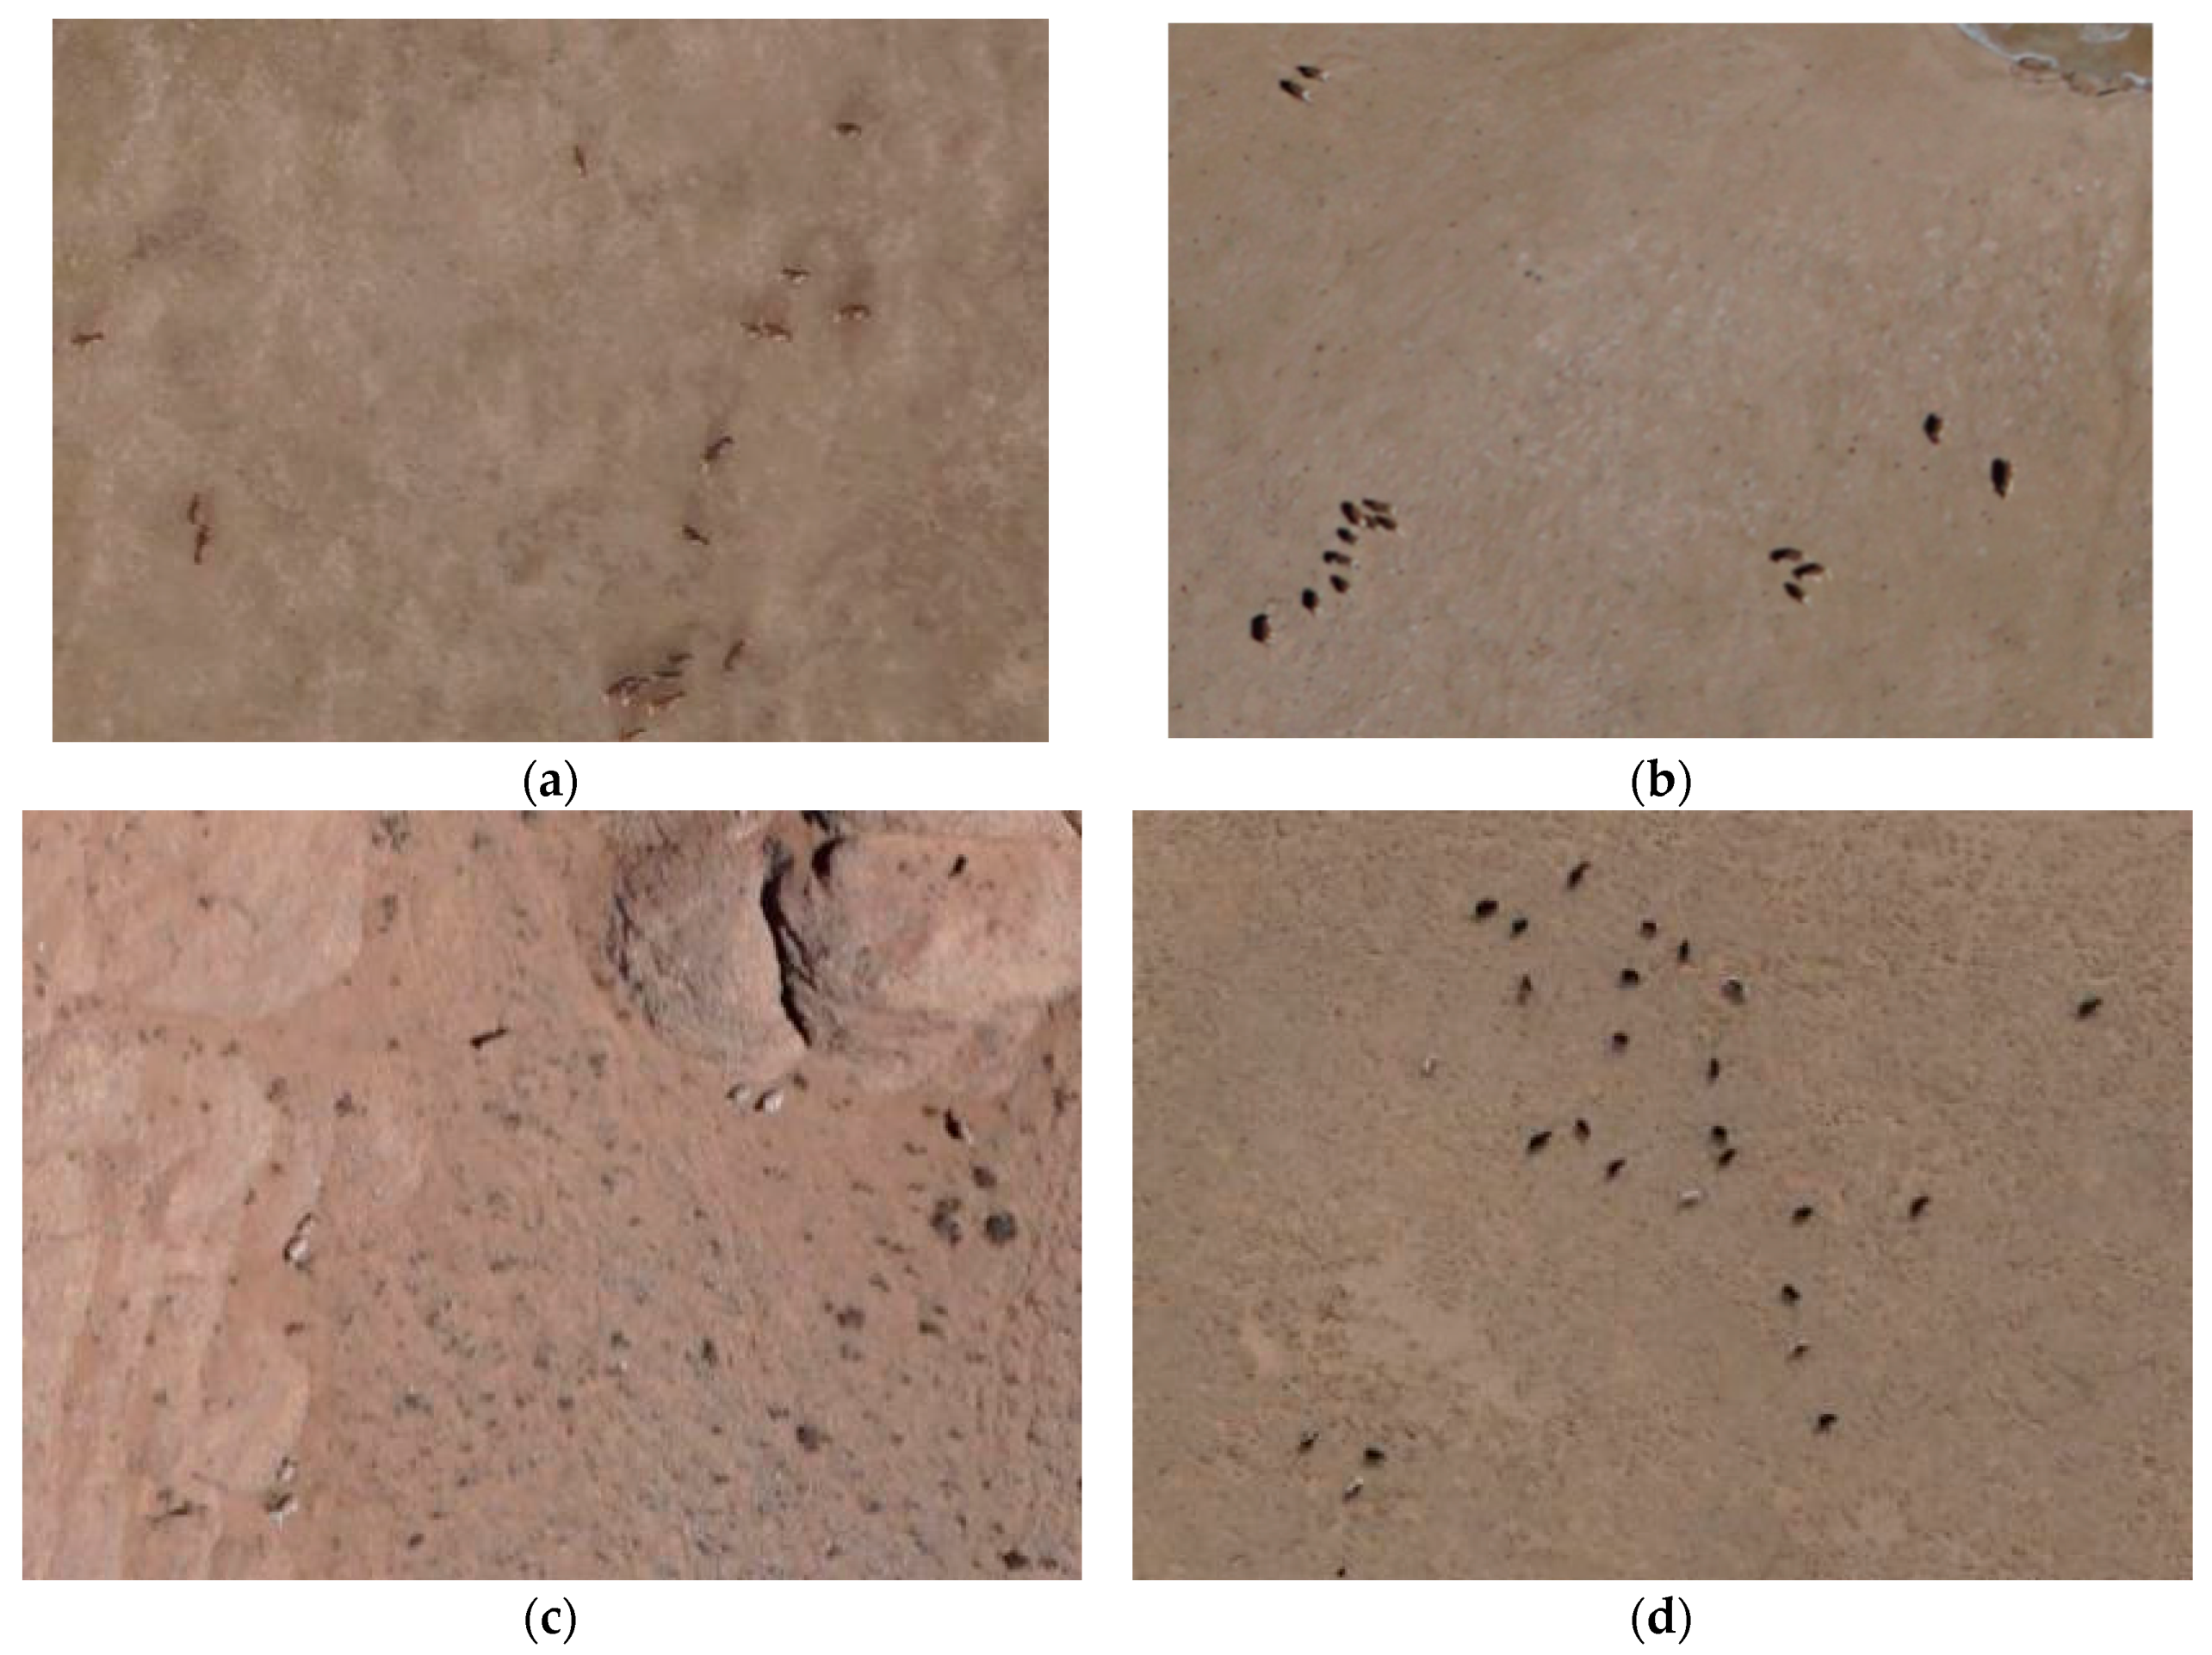
Images were stitched using Pix4Dmapper, Feima Intelligent Image Stitching and LiMapper software. The aerial photography images of large wild herbivores are shown in
Figure 2. A total effective photographic area of 2728 km
2 in 2016 was obtained. The actual usable area was 1488 km
2. The effective photographic area in 2017 was 356 km
2; and the actual usable area was 326.6 km
2. The images were visually interpreted and the individual animals were identified and counted. The visual interpretation was based on seven elements in remote sensing interpretation; namely, tone, color, texture, shadow, size, shape and pattern. The activity patterns of the animals observed during the field investigation were also noted. An interpretation symbol library was established. Individual animals were recognized and counted in a human-machine interactive way. The counting result was validated by image stitching using an animal category point vector layer overlay. Thus, a complete technical system of image processing and identification was established.
2.3. Estimation of Forage Grass Production and the Downscaling Algorithm
We estimated the forage grass production in Madoi County based on five remote sensing empirical models. First, taking into consideration differences between different types of grasslands, we divided the grassland in Madoi County into two types: alpine meadow and alpine steppe. Five remote sensing empirical models of forage grass production were correspondingly established; namely, linear function, logarithmic function, power function, exponential function and quadratic polynomial function.
Second, we used the 500 m-resolution normalized difference vegetation index (NDVI) product from every eight days in the MOD13A1 dataset and conducted a maximum value composite (MVC). A model was built by combing the field measured 393 actual forage grass production data of 112 permanent quadrats (
Figure 1) from 2011 to 2015 provided by the Qinghai Province Grassland Station and the maximum NDVI values (MOD13A1) extracted for those quadrats of the corresponding years. We compared the accuracies of the regression models using F tests and selected the best one based on the determination of the coefficients of the above five models. Lastly, the selected regression model was used as the estimation model of annual forage grass production of the grasslands in Madoi County. The empirical models of different types of grassland are shown in
Table 1.
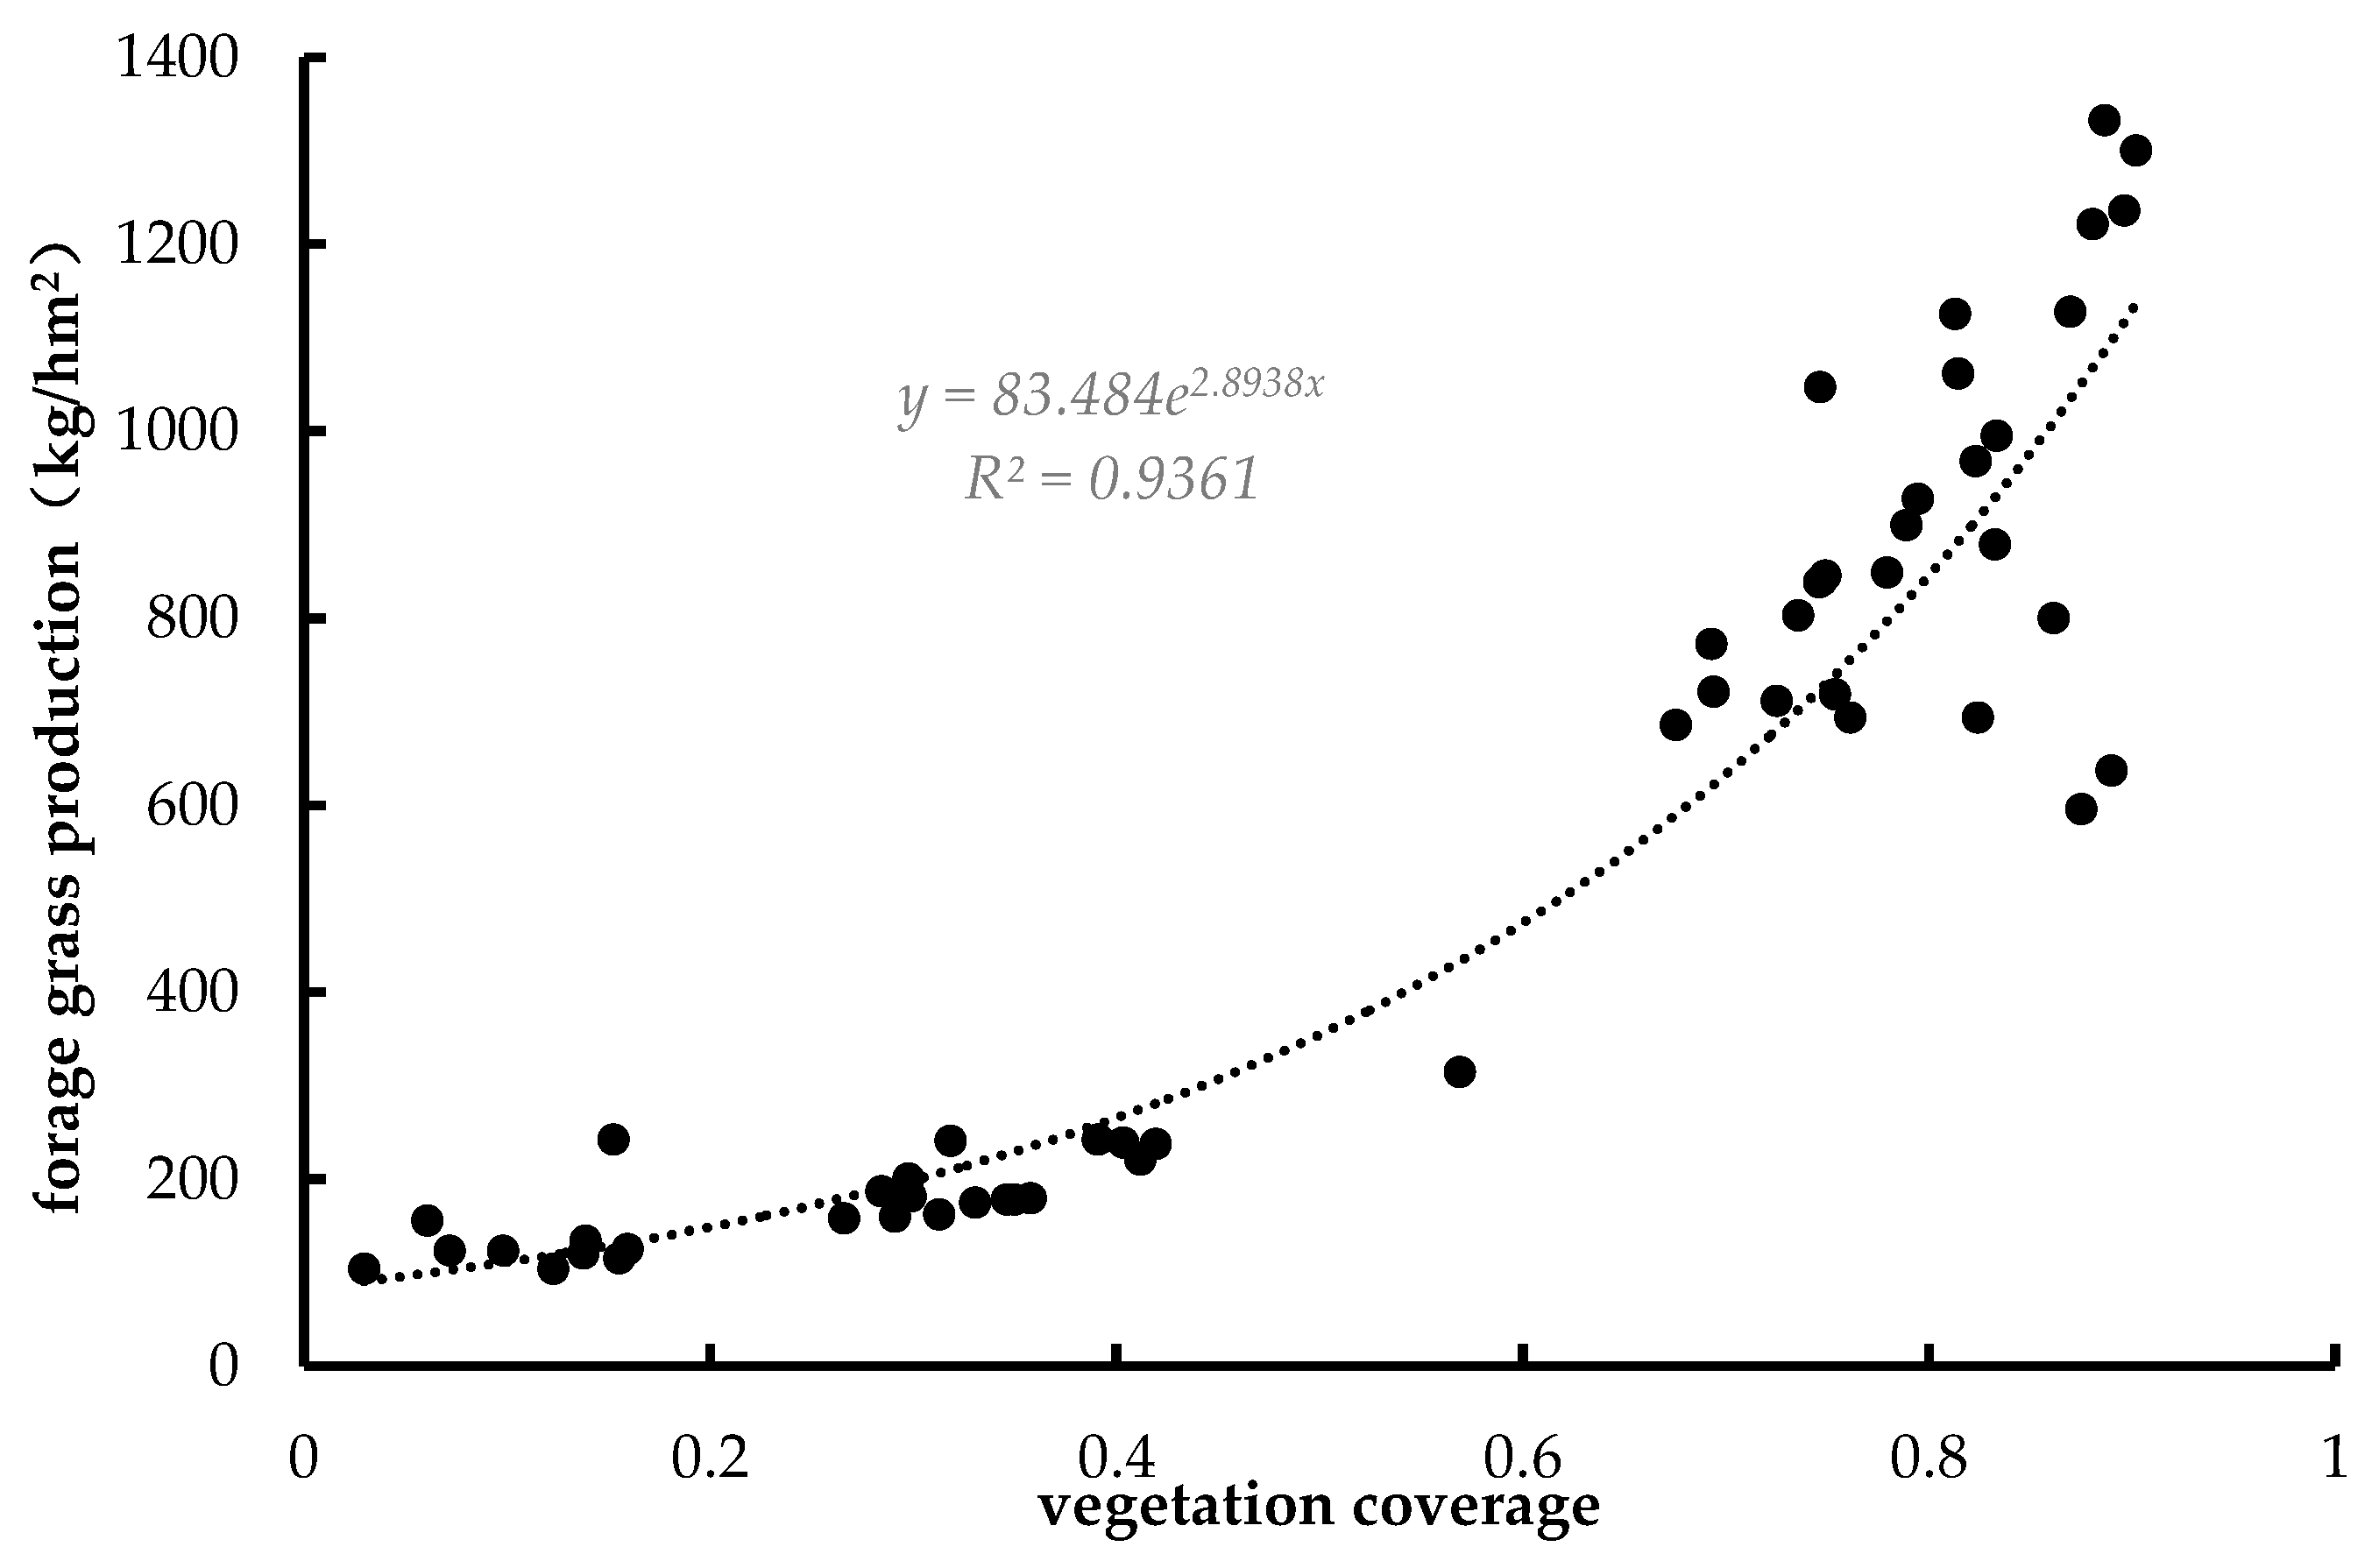
The estimated forage production data in medium resolution (500 m) by the empirical models indicates the forage production state in large scale; but it cannot accurately reflect the state of different types of vegetation coverage in small areas. Therefore, we derived forage grass production in a high resolution (30 m) by merging the forage grass production data in a medium resolution and vegetation coverage data in a high resolution (30 m). Specifically, the NDVI data (Landsat8-TM image) was first obtained by a band calculation and the vegetation coverage was calculated using the pixel binary model. Second, pure pixels (500 × 500 m single land coverage grid cell) were extracted based on land coverage data by a high-resolution interpretation and the forage grass production and vegetation coverage in the pure pixels were calculated. A total of 54 pairs of data were extracted. The relationship curves between forage grass production and vegetation coverage were fitted. The downscaled fitting curve of forage grass production is shown in
Figure 3. The forage grass production data in high resolution (30 m) were calculated using pixels.
2.4. Selection Coefficient and Selection Index
We used Vanderloeg and Scavia’s selection coefficient (
) and selection index (
) to measure the preferences or avoidance of large wild herbivores, including kiang, Tibetan gazelle and bharal, to types of grasslands [
26]. The calculation equation is:
where
is the selection coefficient;
is the selection index.
i refers to a given environmental characteristic.
is the number of quadrats of species selection with
i characteristic.
refers to the total number of quadrats with
i characteristic.
n refers to the number of level with a given environmental characteristic (
n = 1, 2, …,
n). If ‘
= 1’ refers to extreme preference; ‘
= −1’ refers to non-selection; ‘
< −0.1’ refers to negative selection; ‘
> 0.1’ refers to positive selection; ‘
= 0’ refers to random selection; and ‘-0.1 ≤
≤ 0.1’ refers to almost random selection.
2.5. Grazing Pressure
To analyze and assess the conflict between forage grass and herbivorous animals in the source region of the Yellow River, we calculated the grazing pressure of the grassland based on domestic animals and wild animals (kiang, Tibetan gazelle and bharal). The equations for the grazing pressure index of grassland areas follows [
20]:
where
and
respectively represent the grazing pressure index based on domestic animals and wild animals.
and
respectively represent the actual carrying capacity of the grassland based on domestic animals and wild animals (sheep units/hm
2).
and
represent the numbers of domestic animals and wild animals, respectively, obtained by UAV surveys.
represents the grassland area (hm
2).
refers to the theoretical carrying capacity of the grassland; in other words, the number of sheep that could be grazed in a unit of area (sheep units/hm
2).
refers to the forage grass production in a unit of area (kg/hm
2).
refers to the ratio of edible forage grass; and
is 0.6 (according to actual measured data in Madoi County).
refers to the possible grassland utilization rate; and
is 0.5 (according to national agricultural industry NY/T635-2002).
refers to the daily food consumption of domestic animals in a standard sheep unit (approximately 1.8 kg/day).
refers to grazing days (day), which is 365 days (
Table 2).
3. Results and Analysis
3.1. Distribution Characteristics of Large Herbivore Populations
3.1.1. Survey Results of the Sample Strip
A total of 4555 large herbivores were discovered in the winter season survey in 2017 (
Figure 4). In particular, there were a total of 1814.5 (sheep units) large wild herbivores and 7866 (sheep units) domestic animals. The total number of kiangs was 378 (1512 sheep units) and the density was 1.15/km
2. The total number of Tibetan gazelles was 199 (99.5 sheep units) and the density was 0.61/km
2. The total number of bharals was 203 (203 sheep units) and the density was 0.62/km
2. The total number of domestic yaks was 1351 (5404 sheep units) and the density was 4.12/km
2. The total number of domestic Tibetan sheep was 2405 (2405 sheep units) and the density was 7.34/km
2. The total number of horses was 19 (57 sheep units) and the density was 0.06/km
2.
Large wild herbivores accounted for 17.13% of the total herbivores. The density of large wild herbivores from our UAV surveys was consistent with the first national terrestrial wild animal resources survey result from 1995 to 2003 [
4]. The density of kiangs was 0.87/km
2; the density of Tibetan gazelles was 0.56/km
2; and the density of bharals was 1.86/km
2 in Qinghai Province.
3.1.2. Estimation Results for Madoi County
A separate winter summer and winter pasture estimation considered different animal husbandry activities in the summer and winter season, as well as the life habits of wild animals. According to some literature [
26,
27], kiangs migrate to low and flat places in the winter and to high places in the summer. In fact, elevation is the main division separating summer and winter pastures. The distributions of summer and winter pastures in Madoi County are shown in
Figure 5. The summer survey of 2016 had low photographic resolution and only kiangs and yaks could be recognized in the images. Furthermore, kiangs and yaks in groups could not be differentiated. Thus, we could only estimate the total number of kiangs and yaks together for the summer survey of 2016. The results were used for comparison with and verification of the winter season results in 2017.
Our survey results showed that the total numbers of yaks, Tibetan sheep and horses in the winter season of 2017 were 70,800, 102,200 and 1200, respectively, in Madoi County. The total numbers of kiangs, Tibetan gazelles and bharals were 17,100, 16,000 and 9300, respectively. Clearly, the total number of large, wild herbivores was much less than that of domestic animals (24.34%). In the conversion to sheep measurement units, the total number of large herbivores in Madoi County was 474,800. In particular, the total numbers of domestic yaks, Tibetan sheep and horses were 283,400, 102,200 and 3500 (sheep units), respectively. The number of kiangs, Tibetan gazelles and bharals were 68,400, 8000 and 9300 (sheep units), respectively. The ratio between the numbers of large wild herbivores and domestic animals (in sheep units) was 1:4.5 (
Table 3).
3.1.3. Estimation and Verification of the Large Herbivore Population
Based on the UAV survey results, we designed a statistical method from the sample strip for the area. Based on the fact that wild animals tend to inhabit and hunt for food in cool and grassy high-altitude areas with less human disturbances (summer pastures) in the summer season and in low-terrain, warm and wind-shielding low-altitudes areas (winter pastures) in the winter season, we used a 1:100,000 ratio between summer and winter pastures to estimate the population of large herbivores in Madoi County.
An estimation based on the UAV survey result in 2017 showed that the total numbers of Tibetan sheep, domestic yaks and horses were 102,194; 70,846; and 1156, respectively, in Madoi County. According to a birth rate of 30%, the populations of Tibetan sheep and domestic yaks by the end of 2016 were 78,611 and 54,497, respectively. The population of horses was still 1156 because no birth rate was considered. According to the statistical data provided by the Qinghai Province Grassland Station, the populations of sheep, cattle and horses by the end of 2015 in Madoi County were 73,133; 59,235; and 1476, respectively. Due to the lack of available statistical data in 2016, we used the population data in 2015 provided by the station to compare our UAV survey results. The comparison showed that the differences (in percentage) of Tibetan sheep, yaks and horses between the datasets were 7.49%, 7.99% and 21.68%, respectively, which are only small-scale differences.
As previously mentioned, due to the low resolution (15–18.5 cm/pixel) of the summer season survey in 2016, wild herbivores with small bodies, such as Tibetan sheep and Tibetan gazelles, could not be recognized; and furthermore, kiangs and yaks in groups were combined. Thus, we compared the UAV survey results in the summer season of 2016 and winter season of 2017 only in terms of the total numbers of yaks and kiangs. The comparison results showed that the total number of yaks and kiangs in the summer season survey of 2016 was 95,452 and 87,955 in the winter season survey of 2017, indicating a deviation of 7.85%.
3.2. Distribution of Forage Grass Production in Madoi County
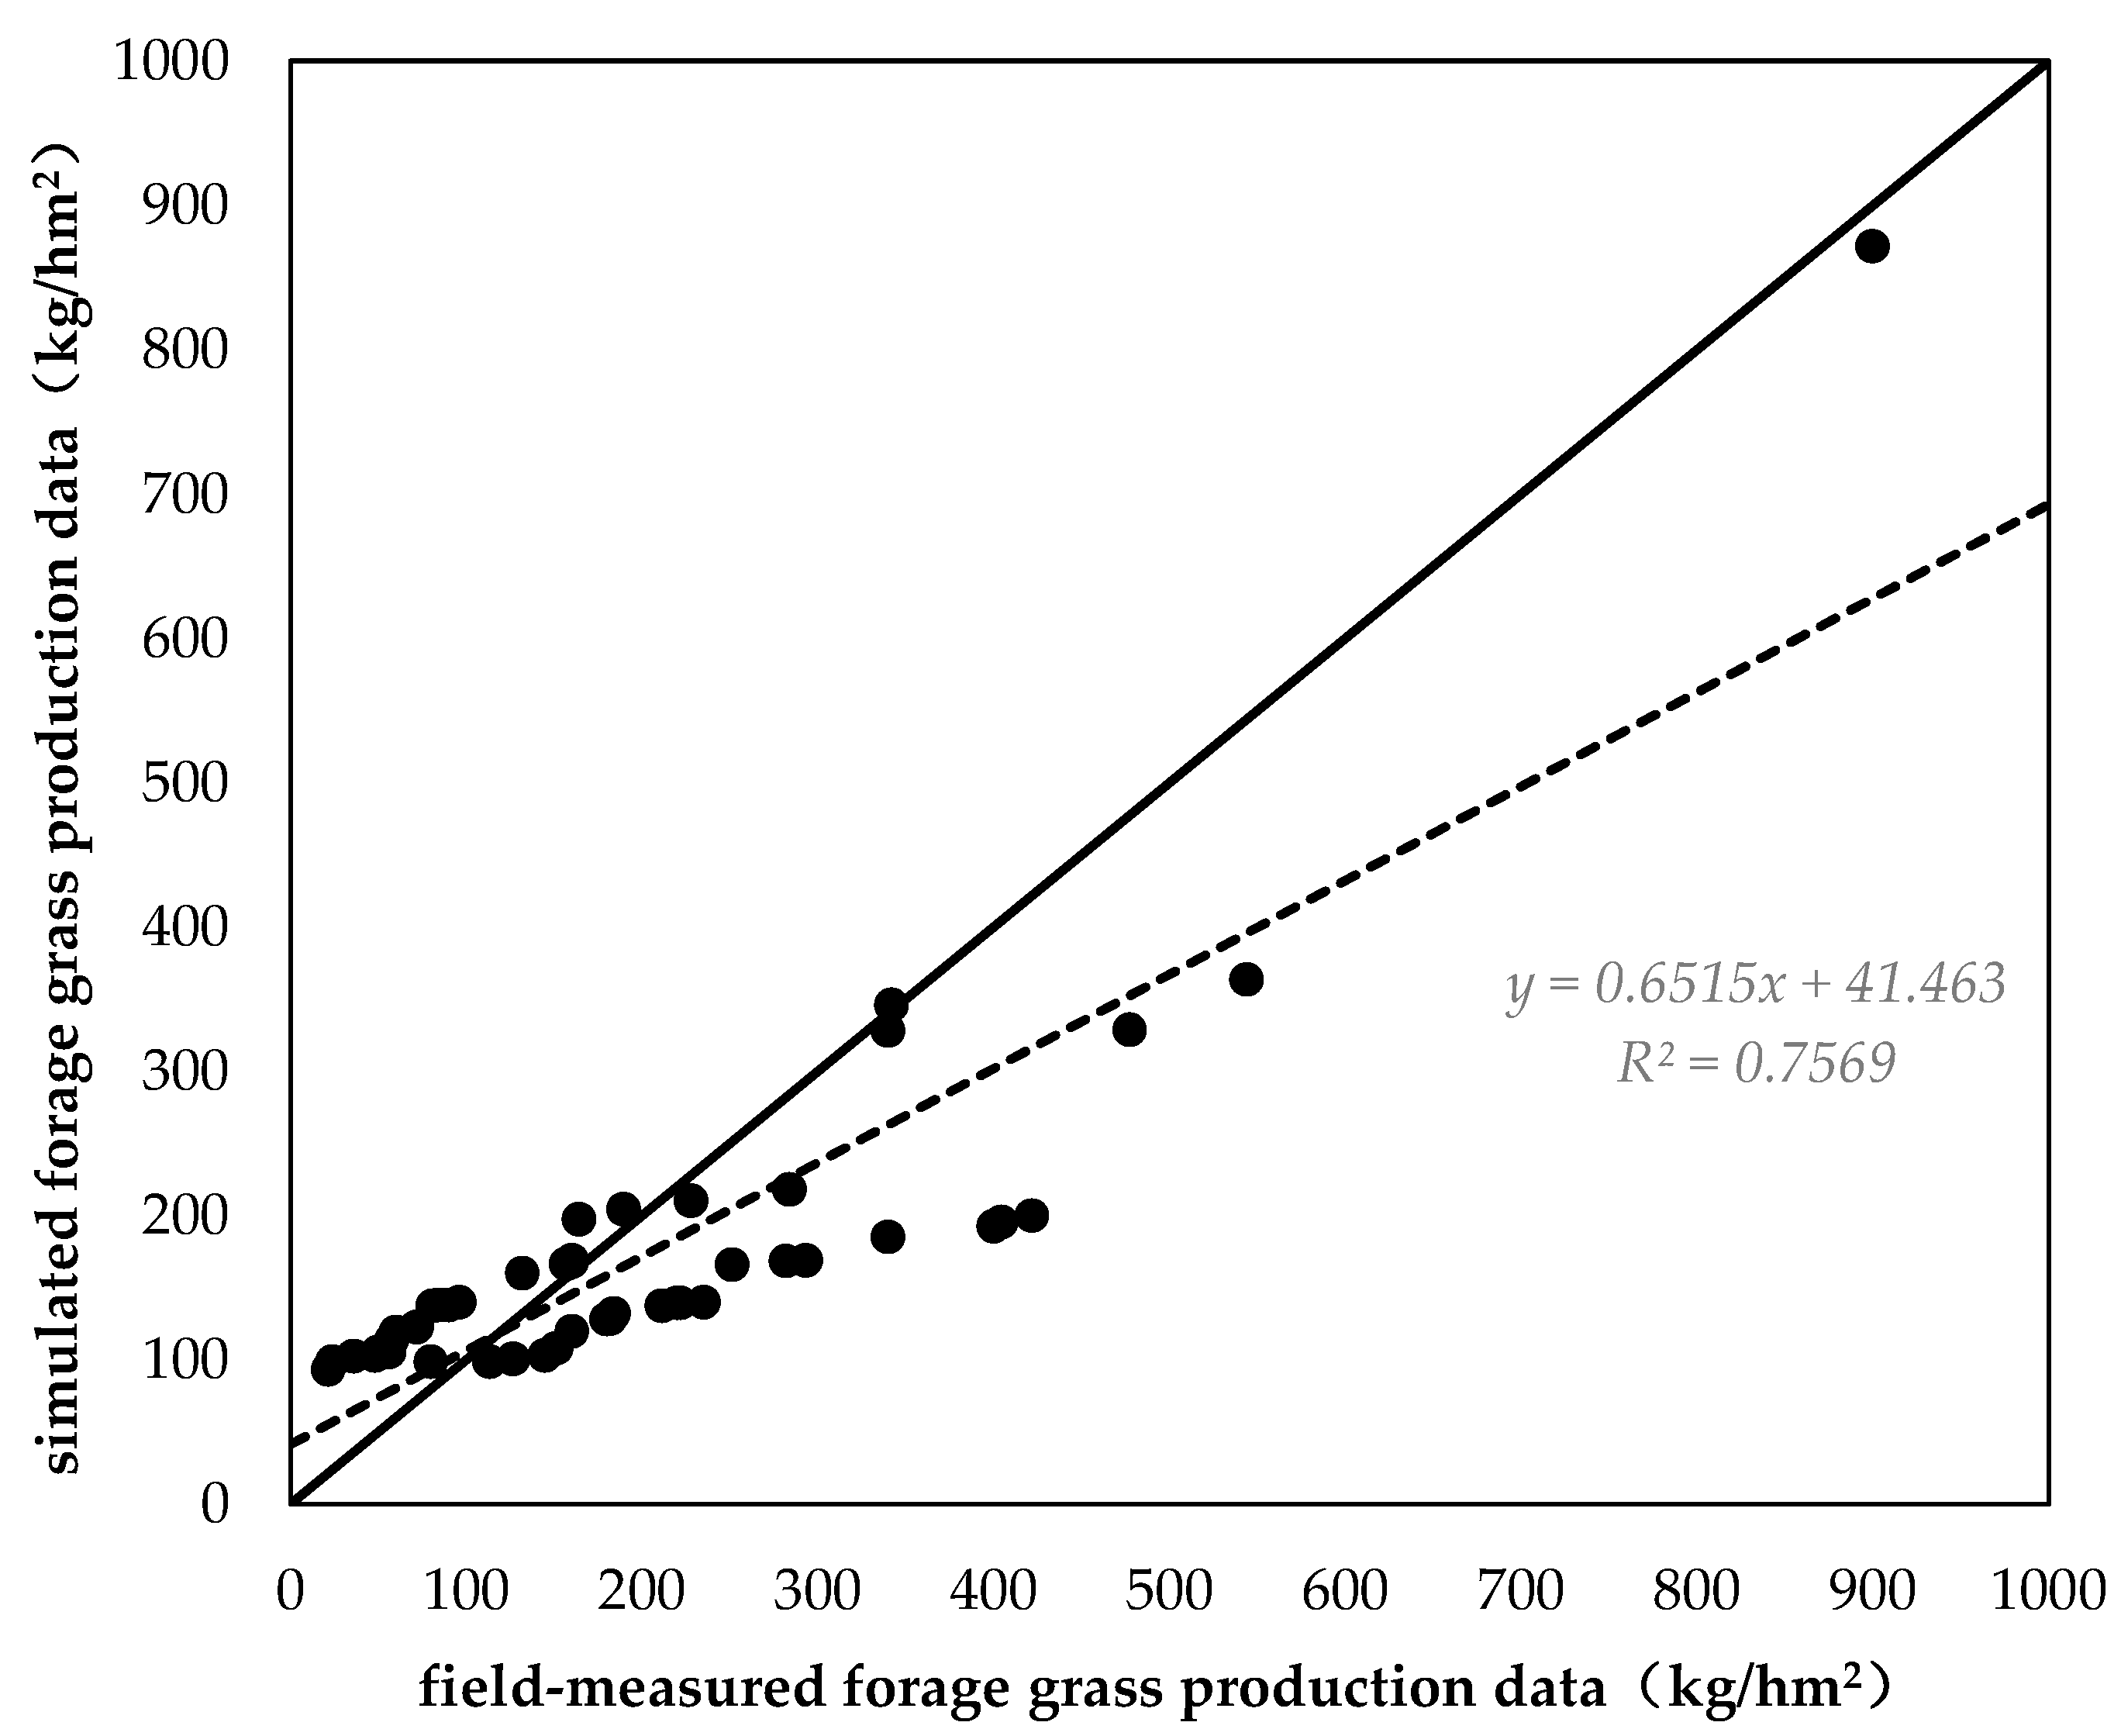
We compared downscaling forage grass production data in 2016 and the actual data from 48 field measurements in 2016. The comparison results showed that they exhibited a significant linear relationship (R
2 = 0.75, RMSE = 86.91,
p < 0.01). While a good linear relationship existed between our simulated forage grass production data and field-measured data, a certain system error existed (
Figure 6). Specifically, there was a certain distance between the fitting line and 1:1 line and this error may result from an inconsistency between sampling scale and simulation scale [
28].
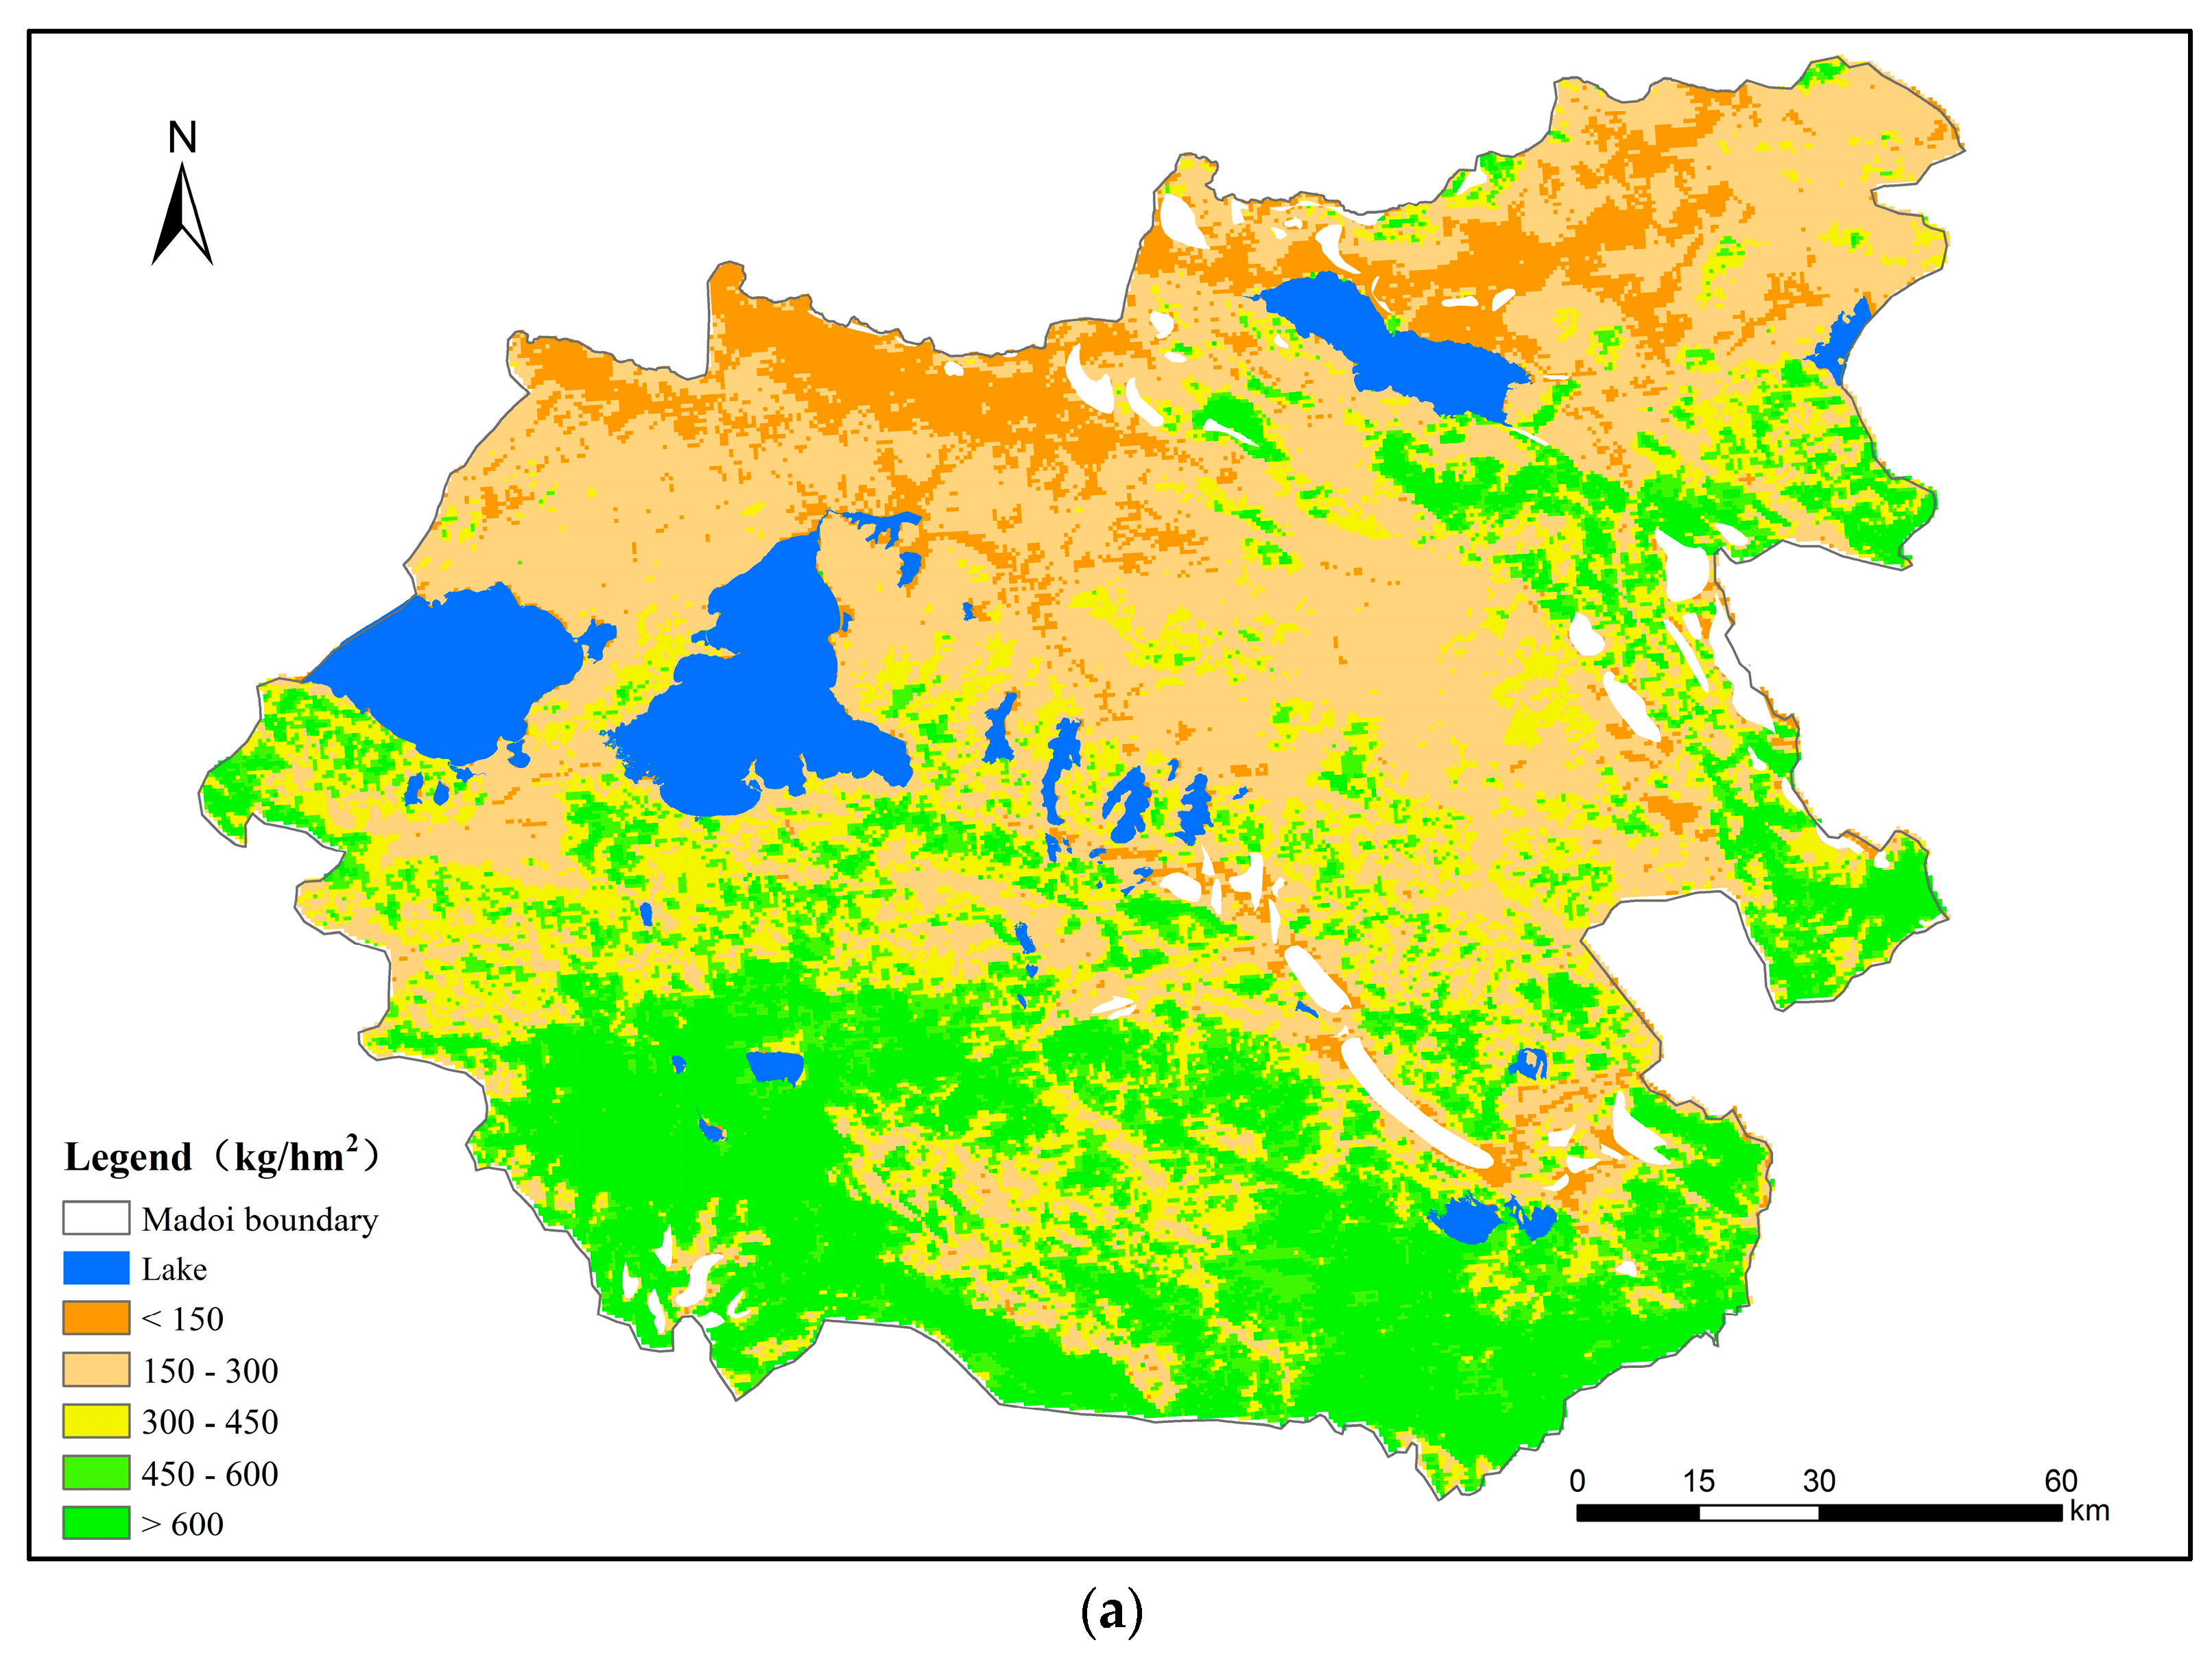
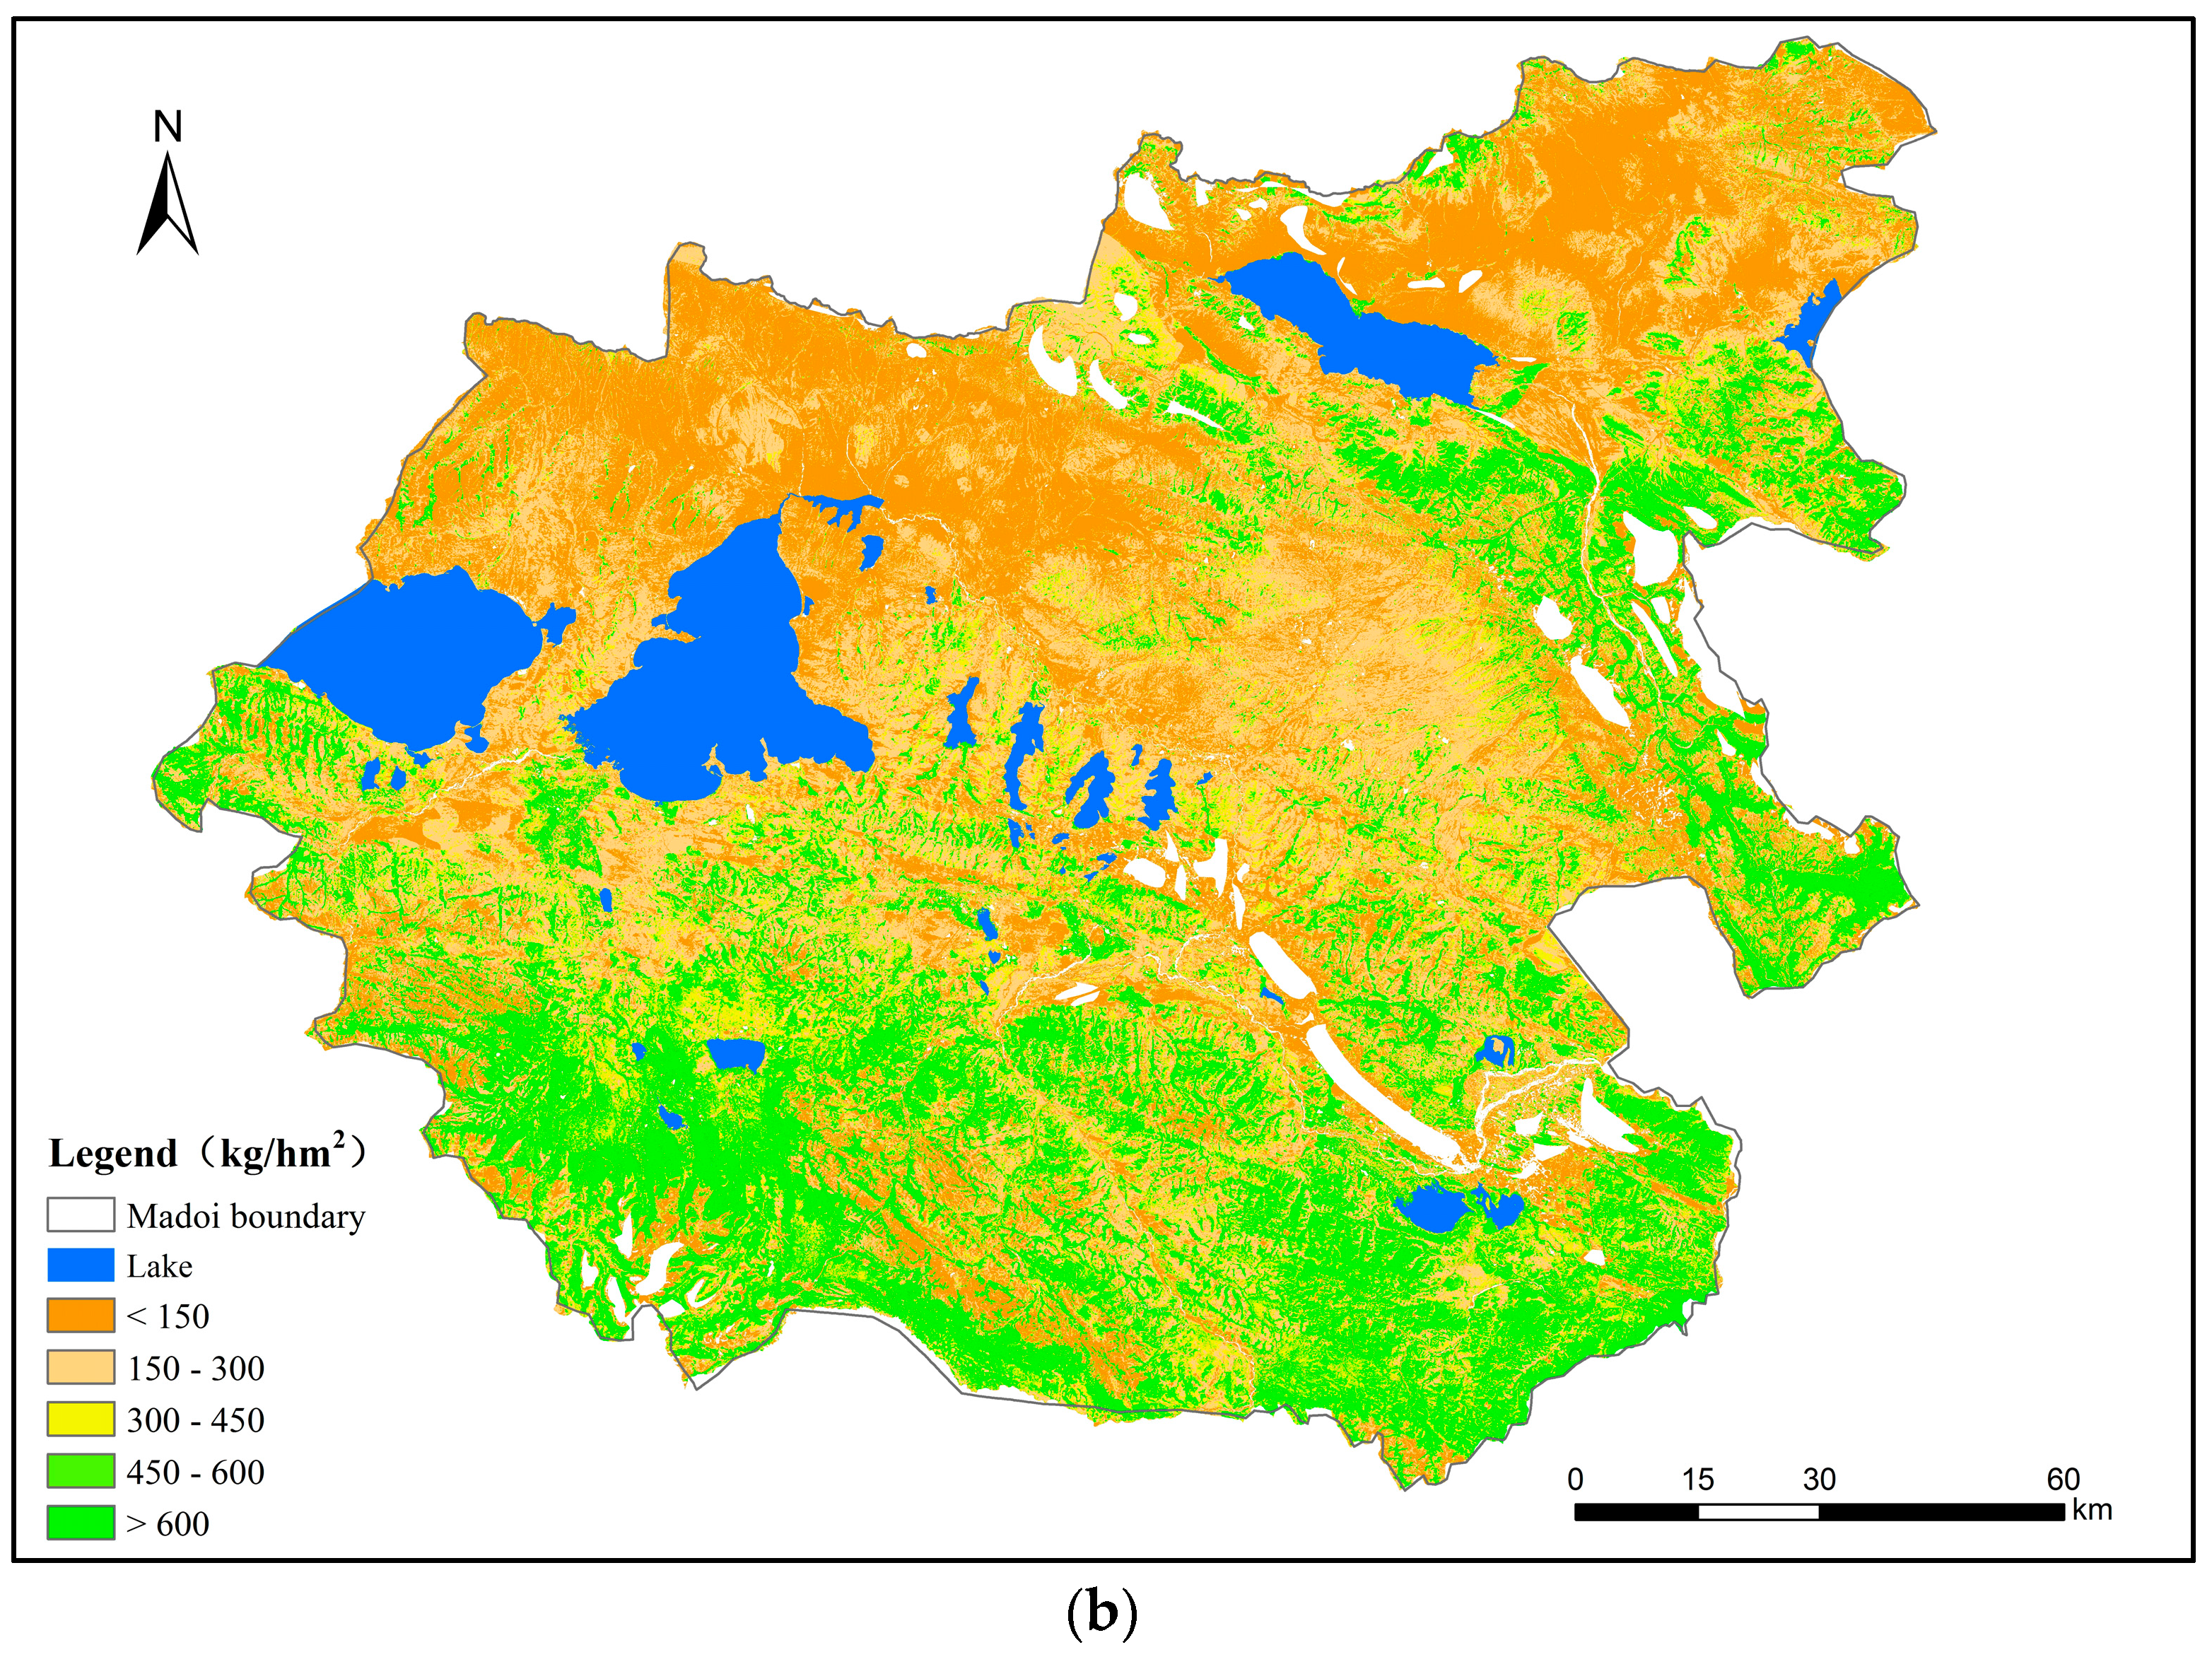
To effectively reflect the forage grass production at the county level, the forage grass production data in 500 m spatial resolution generated by empirical models were downscaled into 30 m resolution by data merging (
Figure 7). The downscaling data in 30 m resolution can clearly reflect the forage grass production characteristics. The earlier data roughly reflected the distribution of forage grass production, whereas the transition among spatial data in the downscaling data was smoother. Thus, a quantitative and statistical analysis could be conducted on different types of grasslands at the small scale. No other differences were observed from the data downscaling. Thus, the downscaling data can more precisely reflect the spatial differences and changes in forage grass production and greatly improve data accuracy in small-scale areas.
We estimated the forage grass production in Madoi County in 2016 based on empirical models and the data downscaling method. The results showed that the forage grass production in a unit area was 339.10 kg/hm
2. The annual total production was 754,600 tons. Significant spatial differences existed. The forage grass production distribution exhibited a pattern of a gradual decrease from the south to the north. The main types of grassland in Madoi County are alpine meadow, alpine steppe and swamp (
Figure 4). In particular, the forage grass production in a unit area of the swamp was the highest at 493.73 kg/hm
2 and the annual production was 12,100 tons. The forage grass production in a unit area of the alpine meadow and alpine steppe were 390.65 kg/hm
2 and 238.76 kg/hm
2, respectively. Their annual productions were 413,500 and 220,000 tons, respectively. The above results indicated that forage grass production primarily depends on water and warmth.
3.3. Effect of Large Wild Herbivores on the Forage-Livestock Balance
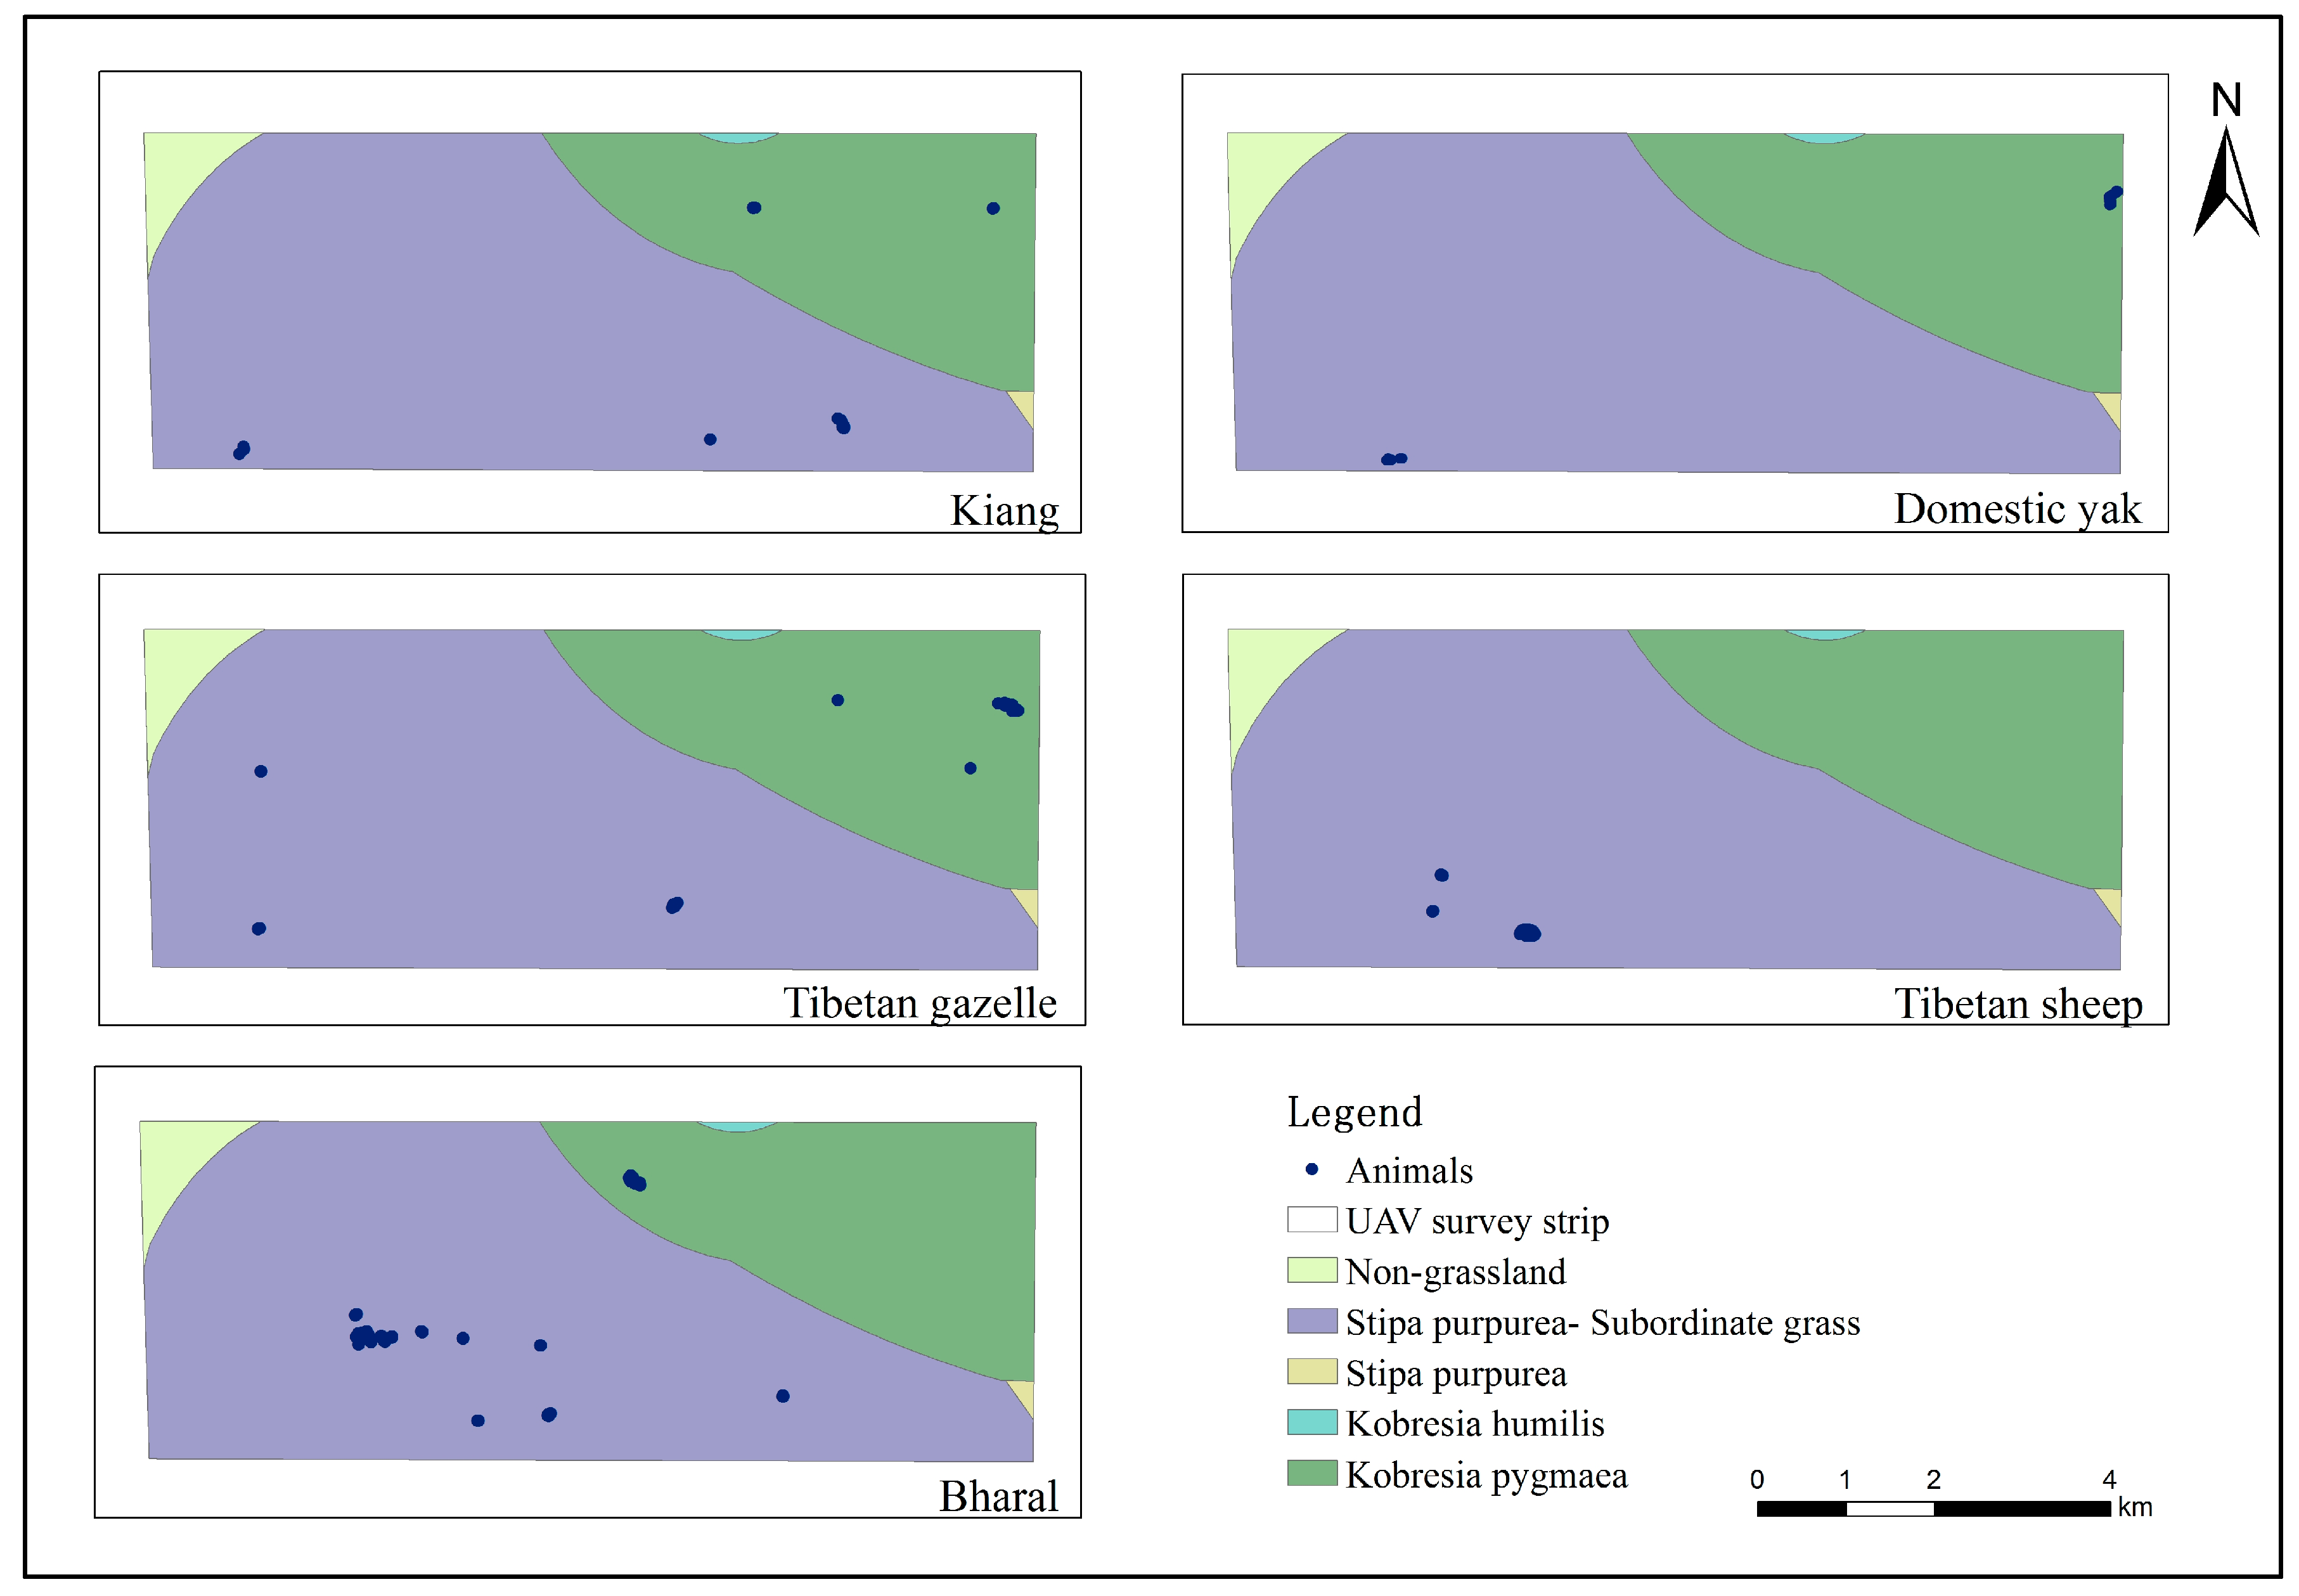
3.3.1. Preferences of Large Wild Herbivores to Grassland Types
There were a total of nine types of grassland in the survey sample strip. They were
Kobresia pygmaea,
K. pygmaea + miscellaneous grass,
K. pygmaea +
Stipa purpurea,
Kobresia tibetica,
K. tibetica +
Carex tristachya,
S. purpurea,
S. purpurea + miscellaneous grass,
Saussurea graminea and
Aneurolepidium dasystachys. The preferences of large wild herbivores for types of grassland are shown in
Table 4 and
Figure 8.
We found that 47.09% of kiangs were distributed in two types of grassland: K. pygmaea + miscellaneous grass and K. pygmaea + S. purpurea. Kiangs had a preference for K. pygmaea + miscellaneous grass ( = 0.39) and an obvious preference for K. pygmaea + S. purpurea ( = 0.61). Kiangs had low selection indexes on S. purpurea + miscellaneous grass, K. tibetica, K. pygmaea and S. purpurea. Their selection indexes were −0.36, −0.54, −0.69 and −0.32, respectively. They had a random selection on A. dasystachys ( = 0.06). No other preferences were observed ( = −1.00).
Overall, 57.29% of Tibetan gazelles were distributed in two types of grassland: K. pygmaea + miscellaneous grass and K. pygmaea. They had a preference for K. pygmaea + miscellaneous grass ( = 0.19) and an obvious preference for K. pygmaea ( = 0.70). Tibetan gazelles had low selection indexes on K. pygmaea + S. purpurea and S. purpurea + miscellaneous grass. Their selection indexes were −0.70 and −0.15, respectively. No other preferences were observed ( =−1.00).
With respect to bharals, 97.04% were distributed in two types of grassland, namely S. purpurea + miscellaneous grass and K. pygmaea. Bharals had obvious preferences for both of the two types of grassland. Their selection indexes were 0.54 and 0.69, respectively. Bharals had a low selection index on S. purpurea ( = −0.60). No other preferences were observed ( = −1.00).
3.3.2. Forage-Livestock Balance Based on Large Wild Herbivores and Domestic Animals
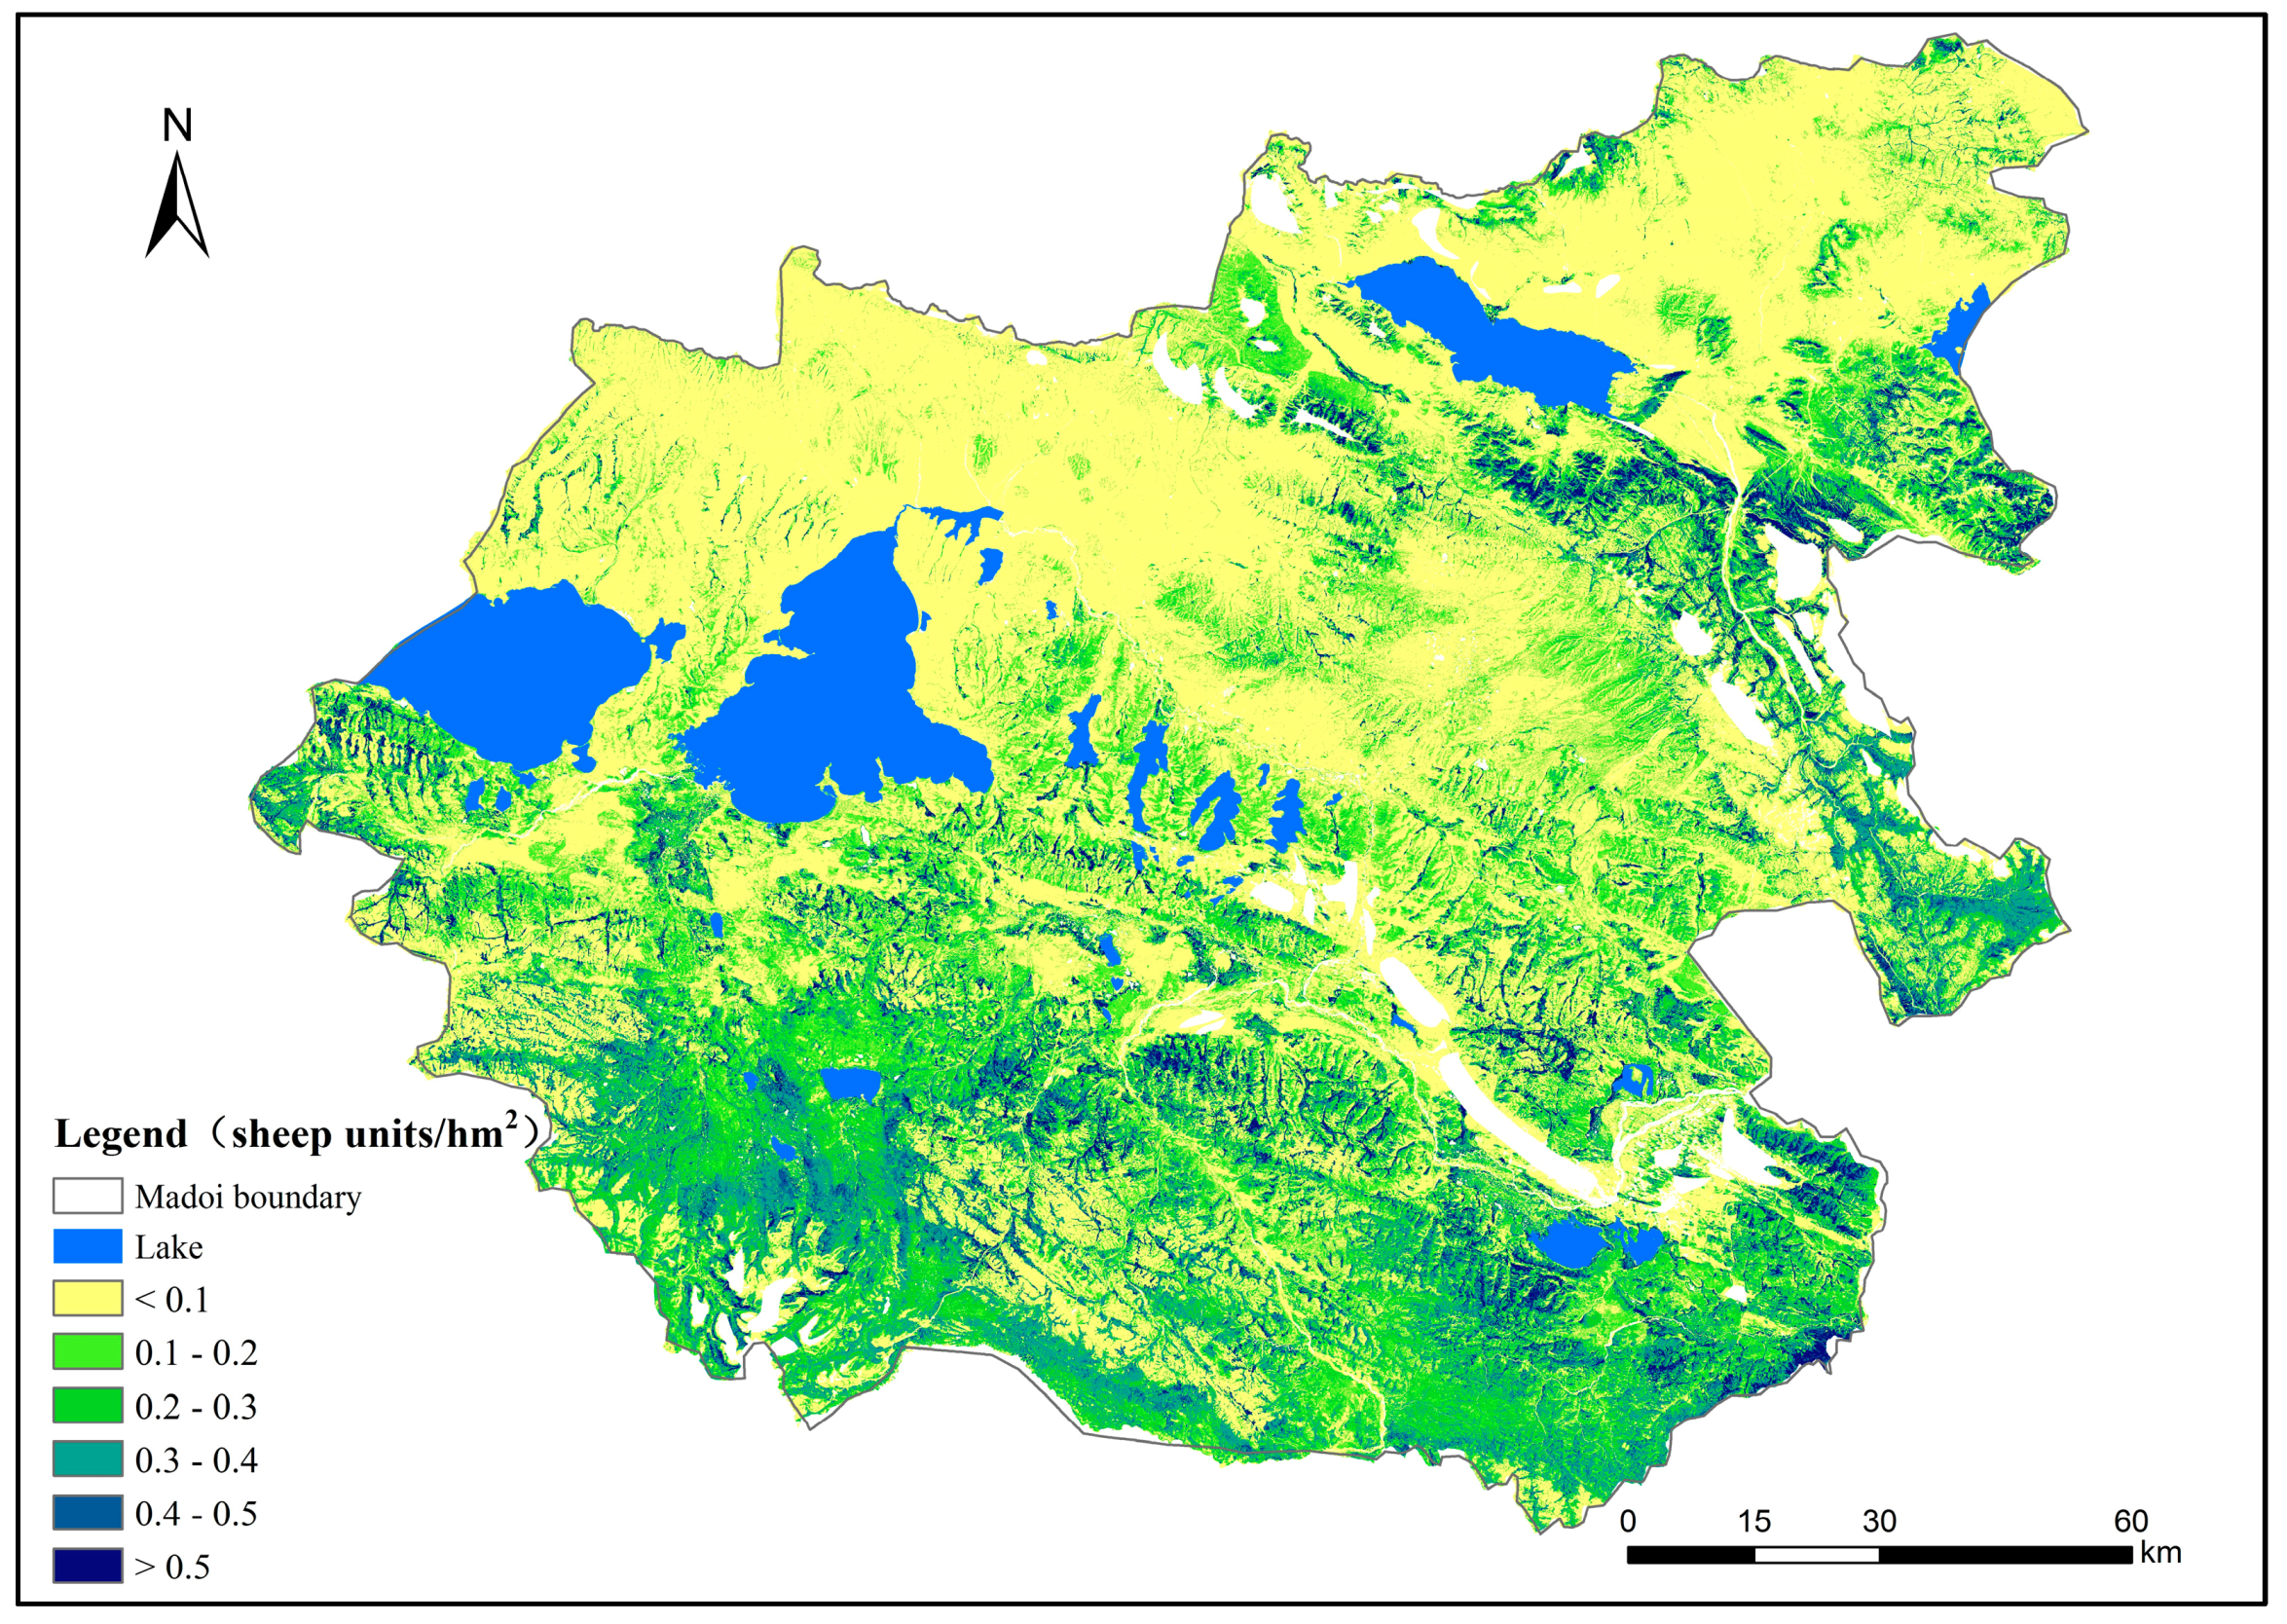
The theoretical carrying capacity a unit area in Madoi County in 2016 was calculated by downscaling the forage grass production data and the relevant parameters (
Figure 9). It was calculated to be 0.155 sheep unit/hm
2. The theoretical carrying capacity in a unit area tends to increase from the north to the south. The total theoretical carrying capacity was 344,600 (sheep units). The result was consistent with the data provided by the Qinghai Province Grassland Station, which suggested it to be 341,200 (sheep units).
The food consumption per animal of large wild herbivores is greater than that of domestic animals such as cattle and sheep. For example, one kiang consumes roughly 4 times that of a sheep per day. Large wild herbivores often live far from humans. With low densities, high invisibility and uncertain activity, their populations are difficult to accurately assess. Previous research on the forage-livestock balance considered only the food consumption of domestic animals, while ignoring that of wild animals. Therefore, we calculated the actual carrying capacities and grazing pressures based on domestic animals, large wild herbivores and domestic animals + large wild herbivores.
Table 5 lists the index levels accepted for grazing-pressure [
29,
30].
Our results indicate that when only domestic animals are considered, the actual carrying capacity was 0.175 sheep units/hm
2 in Madoi County (
Table 6), bringing the total actual carrying capacity to 389,000 sheep units. The grazing pressure index was 1.13. The above results indicate that the grassland of Madoi County is slightly overloaded. When only large wild herbivores (kiang, Tibetan gazelle and bharal) are considered (without any domestic animals), the actual carrying capacity of large wild herbivores was 0.039 sheep units/hm
2, with the total actual carrying capacity thus at 85,700 sheep units in the county. The grazing pressure index was 0.25. The results indicate that the grassland of Madoi County has grazing potential for more wild herbivores.
When both domestic animals and large wild herbivores (kiang, Tibetan gazelle and bharal) are considered, the actual carrying capacity in a unit area of the grassland was 0.214 sheep unit/hm
2 (
Table 7). The total actual carrying capacity was 474,800 (sheep units). The grazing pressure index was 1.38. The above results indicated that the grassland is moderately overloaded.
When considering the addition of large wild herbivores, the actual carrying capacity and grazing pressure of the grassland in Madoi County in 2016 will be increased by 22%. Thus, an extra 7900 tons of hay are required to maintain a forage-livestock balance. Importantly, to maintain a stable population of large wild herbivores, a 120,200 (sheep units) reduction in domestic animals (approximately 30%) is required to maintain a forage-livestock balance.
4. Discussion
The conservation plan of the Sanjiangyuan National Park clearly states that core conservation areas are important habitats for wild animals and thus human activities should be strictly controlled in these areas. However, our UAVs monitored the core conservation areas of Zhaling Lake-Eling Lake and Xingxing Sea over an area of 191.11 km2 and discovered 4389 (sheep unit) domestic animals. The density of domestic animals in these core areas was 22.97 sheep unit/km2, which is similar to that of non-core conservation areas (25.78 sheep unit/km2). Our discovery indicated that a large number of domestic animals were being grazed in core conservation areas despite human activities such as grazing being forbidden in these areas. This ultimately results in reduced habitat space for the wild herbivores.
Traditional research on the forage-livestock balance has focused more on the calculation of forage grass production, animal feed intake, forage grass utilization rate and grazing capacity. The actual carrying capacity is often estimated based on statistical data of domestic animals and does not truly reflect the actual grazing pressure. In this study, if large wild herbivores were not considered, the estimated actual grazing pressure would be reduced by 22%. Therefore, the grazing pressure estimates need to consider the wild herbivore population if accuracy is to be improved. Without these wild species in the overall calculations, the optimal conservation measures cannot be determined. Specifically, if domestic animals are excluded from core conservation areas and are rather concentrated in ecological conservation and restoration areas or traditional areas, then the grazing pressure will continuously increase if the domestic animal population is not reduced.
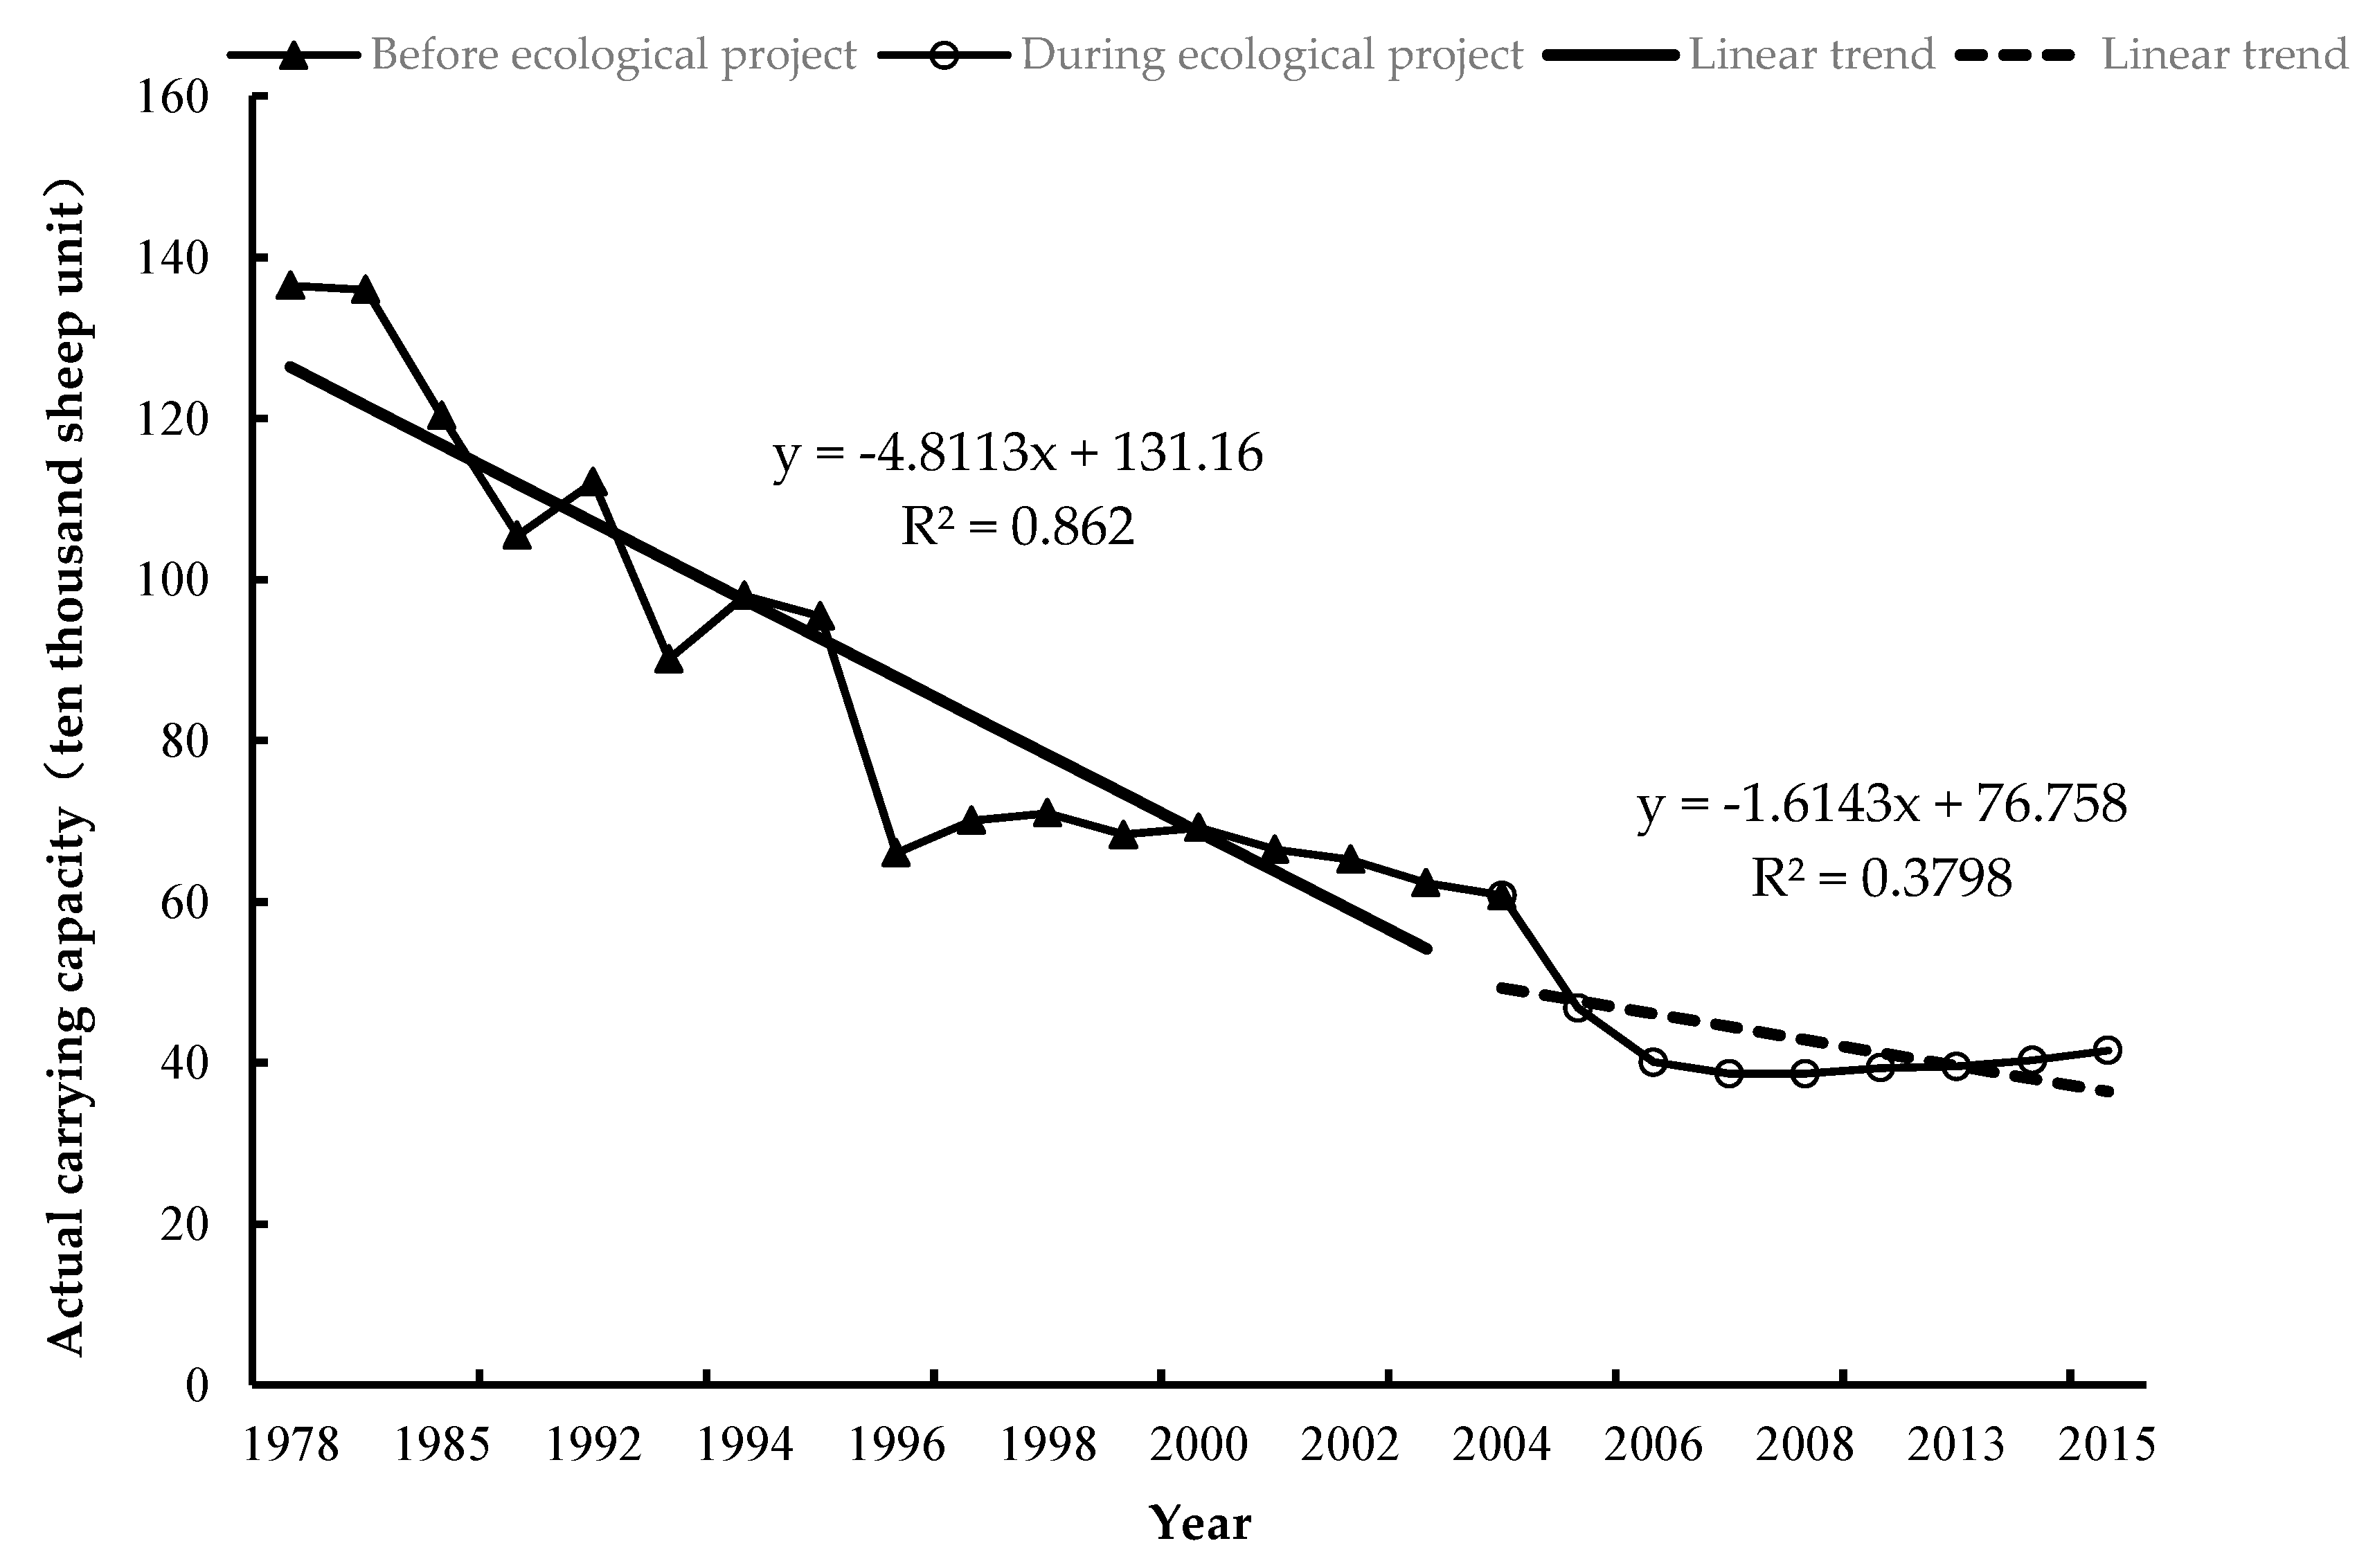
The domestic animal population in Madoi County has been reduced to 389,000 (sheep units) from 608,000 (sheep units) since the implementation of the first-phase ecological project in the Sanjiangyuan in 2005, the linear trend was −16,100 sheep units per year from 2005 to 2015 (
Figure 10). This constitutes a 36% reduction and some obvious changes have been implemented. However, the plan of Sanjiangyuan National Park clearly indicated a goal for a 20% increase in the wild animal population by 2020 at no cost to the forage-livestock balance. That implies more intense conflict between forage grass and herbivorous animals in the future. Therefore, a reduction in the domestic animal population and grazing pressure is still necessary and should alleviate grassland degradation in the source region of the Yellow River.
There are limitations to our study. Given the poor photographic resolution of the UAV summer survey of 2006, and therefore the difficulty in differentiating anything but groups composed of kiangs and domestic yaks, we recommend that the photographic resolution of UAV surveys should be maintained high (such as at 4–5 cm/pixel) at no cost to flight efficiency. The flight course and side overlaps should be kept at a minimum as much as possible. Furthermore, wild animals tend to migrate and thus the monitoring of wild animals has temporal and spatial effects. Standard and large-scale monitoring can reveal the changes and driving mechanism of the population of wild animals and this monitoring should be continuously tracked.
Based on the long-term, high-frequency remote sensing data of UAV, monitoring can also be conducted to provide data for biodiversity conservation, such as, plant species distribution and vegetation mapping, biodiversity inverting, habitat monitoring and monitoring application development that cannot be achieved by traditional biodiversity remote sensing monitoring. In summary, we believe that UAV remote sensing will improve capability to analyze and forecast biodiversity changes. Although UAVs have the advantages of high resolution and high time-effectiveness in wildlife monitoring, the technology still faces several challenges, such as the existing gap between software and hardware; how it fits with other multi-source remote sensing data; how to overcome spatial matching with satellite data; relevant industry standards in regions and sensitive areas have not yet been established; and finally, biodiversity data for forest under-story are not available and cannot completely replace traditional monitoring methods.
Our future research will focus on the following aspects: Localization of the input parameters of the forage grass production calculation model will be implemented by using a data fusion method based on the technology of UAV remote sensing, multi-source satellite remote sensing data and field measured data, and it will provide an optimal parameter scheme for accurately evaluating the forage grass production in the source regions of the Yellow River. The investigation on the population and basic situation of large herbivores will be further monitored in the Yellow River source area by using the techniques of aerial photography, pattern recognition and expert knowledge interpretation, and by incorporating the mathematical models of this paper to most accurately extrapolate the numbers of animals from the sample zone to the overall study area. Based on the above quantitative analysis, combined with the status quo of forage-livestock balance management in the source region of the Yellow River, countermeasures for future forage-livestock balance management will be proposed. This is an adaptive management strategy that is to be implemented.
5. Conclusions
This study estimated the size of a large wild herbivore population within Madoi County from UAV surveys conducted in the summer and winter seasons of 2016 and 2017, respectively. The study also analyzed the effect of large wild herbivores in relation to the balance between forage grass and wild herbivores. In summary, guided by “Technical Specifications for the Second National Terrestrial Wildlife Resources Survey” and “National Terrestrial Wildlife Resources Survey and Monitoring Technical Specifications”, UAV aerial surveys of large wild herbivores were conducted in Madoi County. Images were spliced and interpreted using human-machine interaction. In the sample strip of the winter season survey in 2017, a total of 4555 large wild herbivores were noted. In particular, the densities of kiang, Tibetan gazelle and bharal were 1.15/km2, 0.61/km2 and 0.62/km2, respectively. The densities of domestic yaks, Tibetan sheep and horses were 4.12, 7.34 and 0.06/km2, respectively. The populations of large wild herbivores in Madoi County were calculated based on their densities in the sample strip and compared and verified with statistical data and survey results from the winter and summer season. The population of kiang, Tibetan gazelle and bharal were 17,100, 16,000 and 9300, respectively. The populations of domestic yaks, Tibetan sheep and horses were 70,800, 102,200 and 1200, respectively. The total population of large wild herbivores and domestic animals was 475,000 (sheep units). The ratio between the population of large wild herbivores and domestic animals (in sheep units) was 1:4.5. If considering both domestic animals and large wild herbivores (kiang, Tibetan gazelle and bharal), the grazing pressure index was 1.38, indicating that the grassland is moderately overloaded. The effect of large wild herbivores on the forage-livestock balance is obvious, as the actual carrying capacity and grazing pressure are increased by 22%. An extra 79,000 tons of hay or a 30% reduction in domestic animals is required in Madoi County to maintain a forage-livestock balance.


