Article

Factors Affecting Nitrogen Use Efficiency and Grain Yield of Summer Maize on Smallholder Farms in the North China Plain

1
College of Resources and Environmental Sciences, China Agricultural University, Beijing 100193, China
2
College of Resources and Environment Science, Hebei Agricultural University, Baoding 071001, Hebei, China
3
Agricultural Bureau of Laoling County, Dezhou 253600, Shandong, China
4
Department of Sustainable Agricultural Sciences, Rothamsted Research, Harpenden, Hertfordshire AL5 2JQ, UK
*
Author to whom correspondence should be addressed.
These authors contributed equally to this work.
Sustainability 2018, 10(2), 363; https://doi.org/10.3390/su10020363
Submission received: 10 December 2017 / Revised: 19 January 2018 / Accepted: 23 January 2018 / Published: 31 January 2018

Abstract

:
The summer maize yields and partial factor productivity of nitrogen (N) fertilizer (PFPN, grain yield per unit N fertilizer) on smallholder farms in China are low, and differ between farms due to complex, sub-optimal management practices. We collected data on management practices and yields from smallholder farms in three major summer maize-producing sites—Laoling, Quzhou and Xushui—in the North China Plain (NCP) for two growing seasons, during 2015–2016. Boundary line analysis and a Proc Mixed Model were used to evaluate the contribution of individual factors and their interactions. Summer maize grain yields and PFPN ranged from 6.6 t ha−1 to 14.2 t ha−1 and 15.4 kg kg−1 to 96.1 kg kg−1, respectively, and averaged 10.5 t ha−1 and 49.1 kg kg−1, respectively. The mean total yield gap and PFPN gap were 3.6 t ha−1 and 43.3 kg kg−1 in Laoling, 2.2 t ha−1 and 24.5 kg kg−1 in Xushui, and 2.8 t ha−1 and 41.1 kg kg−1 in Quzhou. A positive correlation was observed between the yield gap and PFPN gap; the PFPN gap could be reduced by 6.0 kg kg−1 (3.6–6.6 kg kg−1) by reducing the yield gap by 1 t ha−1. The high yield and high PFPN (HH) fields had a higher plant density and lower N fertilization rate than the low yield and low PFPN (LL) fields. Our results show that multiple management factors caused the yield gap, but the relative contribution of plant density is slightly higher than that of other management practices, such as N input, the sowing date, and potassium fertilizer input. The low PFPN was mainly attributed to an over-application of N fertilizer. To enhance the sustainable production of summer maize, the production gaps should be tackled through programs that guide smallholder farmers on the adoption of optimal management practices.

1. Introduction

Maize is an important food crop for both humans and animals throughout the world, with a planting area of almost 186 million hectares in 174 countries [1]. Together with rice and wheat, maize provides more than 30% of food calories for humans in 94 developing countries [2]. Many studies show that the world will need 70% to 100% more food by 2050 [3,4]. However, the stagnation of maize grain production is common not only in developed countries, but also in developing countries [5]. Closing the maize yield gap, especially on smallholder farms, is necessary in order to ensure global food security [6,7,8,9].
China is the second largest maize producer in the world, and contributes 20.8% of the global maize output [1]. The North China Plain (NCP) is an important maize production area in China, producing one-third of all of its maize (Ministry of Agriculture of People’s Republic of China, 2009). In the next 20 years, 30–50% more food will be needed in China [10], driven by increases in the population and changes in diet. To ensure food security, it is important to improve the crop yield and close the existing yield gap between the attainable yield and farmers’ actual yield.
China consumed over 31 Mt of nitrogen (N) fertilizer in 2014, approximately 29% of the total global consumption [1], to maintain the necessary rapid growth of grain production. In China, smallholder farmers dominate agricultural production with low resource use efficiency, because most farmers in China believe that more fertilizer produces a higher grain yield, and they neglect nutrient use efficiency (NUE; commonly represented by the nitrogen partial factor productivity, PFPN, which indicates grain yield per unit of N use). Excessive N use has resulted in a low PFPN and a loss of 40–57% of the applied N [11,12,13,14], which is the major contributor to air pollution and soil acidification [15,16]. Based on numerous field experiments, N usage can be reduced by 30–60% without a yield loss of rice, wheat, and maize in intensive agricultural production systems [15,17]. Therefore, there is a clear possibility of optimizing summer maize yields and PFPN of smallholders, and identifying the limiting factors is the first step.
Numerous studies of the yield limiting factors have been published [7,18,19,20,21,22]. Many of these describe the limiting factors qualitatively using a modeling approach or survey and experimental data. For example, Liu et al. (2016) reported that almost 5%, 12%, and 18% yield losses of maize grain yield were caused by soil physical properties, cultivar, and management practices, respectively. Subedi and Ma (2009) suggested that weed competition was the major maize yield-limiting factor in a humid temperate environment based on a three-year field experiment. Previous studies show that grain yield is mainly dependent on climatic conditions, soil quality, and management practices [23,24,25,26,27], and that management practice is more important than climate and soil [23,26,28]. However, few studies have analyzed the factors limiting PFPN.
Different management practices have different impacts on the yield and PFPN [9]. Identifying the most important limiting management factors in farmers’ fields is fundamental to closing the yield and PFPN gaps. The boundary line approach is a widely used and useful tool for quantitatively analyzing and identifying the most important biophysical factors controlling crop production [21,29,30]. The objectives of this study were therefore to (i) investigate the optimal factors for the sustainable production of maize in the NCP; (ii) understand the association between yield and the PFPN of smallholder farmers; and (iii) examine the variations of maize yield and the PFPN in smallholder farmers’ fields over different years and sites.

2. Materials and Methods
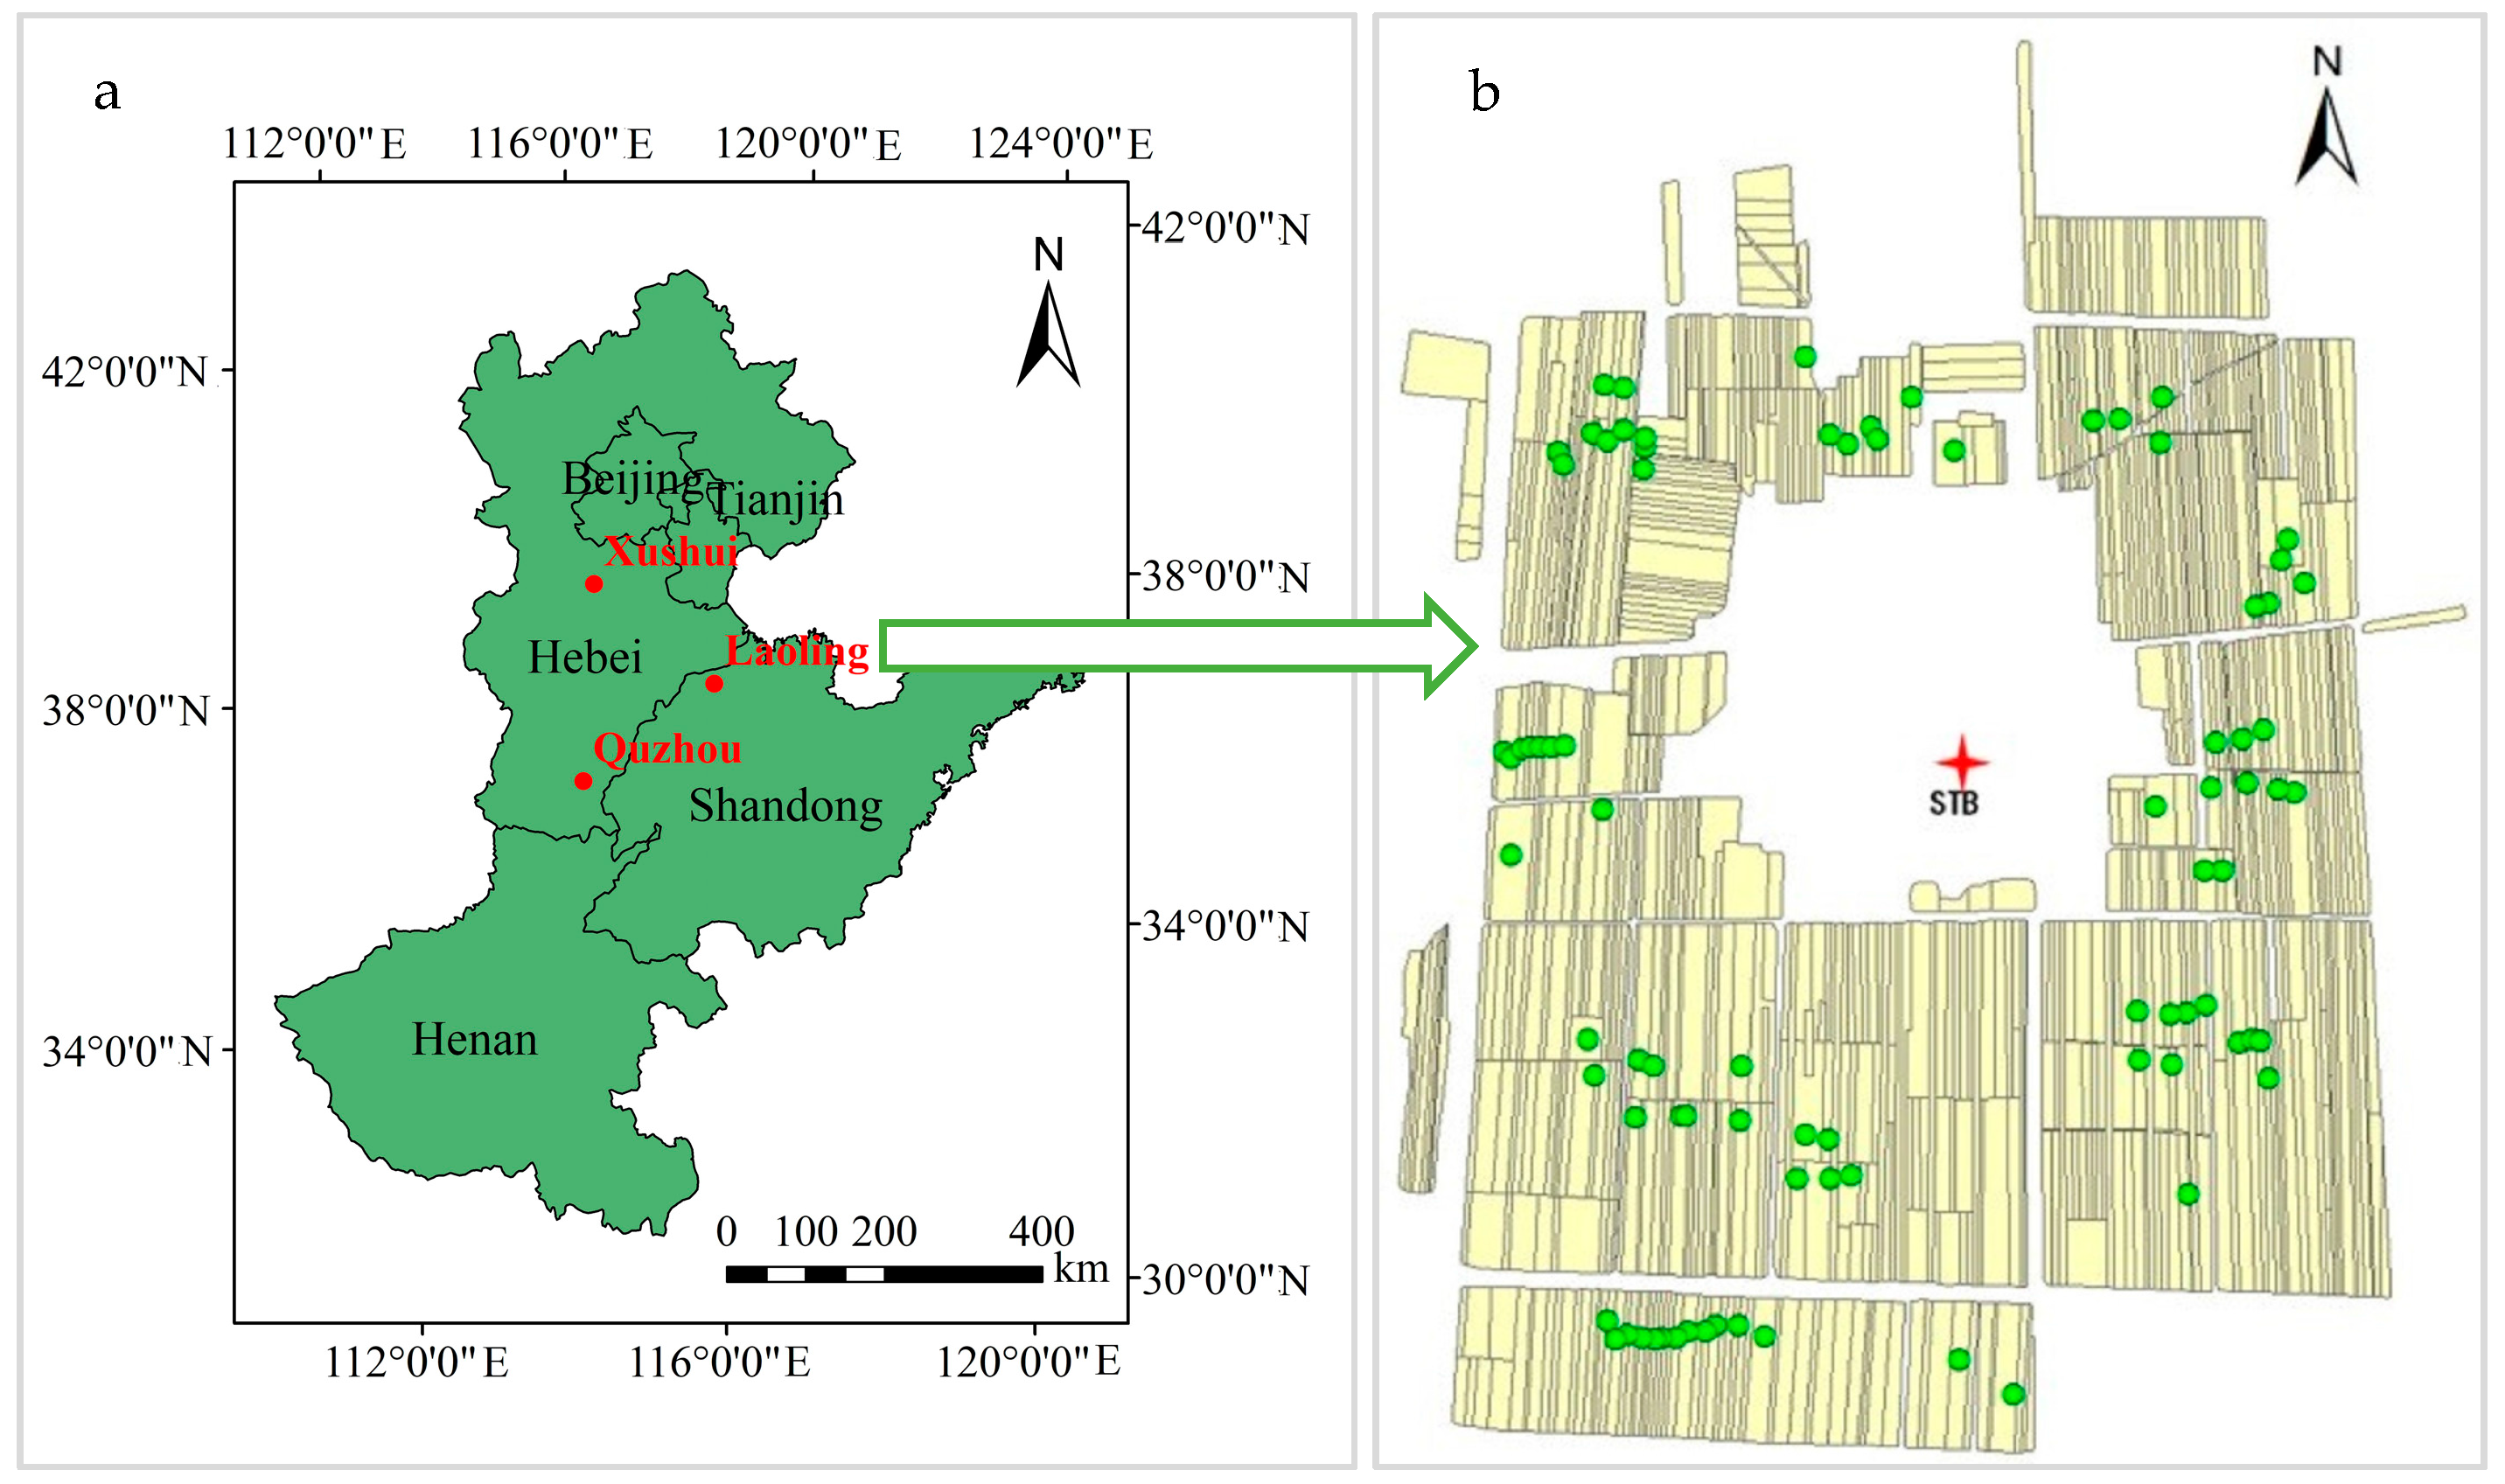
2.1. Study Site

The study was conducted at three sites (Laoling 37°43′N and 117°13′E, Xushui 39°06′N and 115°39′E, Quzhou 36°45′N and 114°57′E) in the NCP from June 2015 to October 2016 for two maize growing seasons (Figure 1). At each site, a village with a Science and Technology Backyard (STB; [9]) was selected: Nanxia village in Laoling county; Yangong village in Xushui county; and Wangzhuang village in Quzhou county. There were 244 fields selected randomly for research in 2015 (86, 44, and 114 fields in Laoling, Xushui, and Quzhou, respectively) and 192 fields in 2016 (74, 50, and 68 of the fields in Laoling, Xushui, and Quzhou, respectively). The per capita arable area was approximately 0.1 ha. The climate at all of the sites was a medium latitude monsoon climate, with an annual rainfall between 527–556 mm. The pH of the soil (0–20 cm) at the three sites was 7.31, 7.70, and 8.21 at Laoling, Xushui, and Quzhou, respectively. The soil nutrient contents (i.e., the soil organic matter (SOM), total nitrogen (total N), Olsen–P and available potassium) at Laoling were all slightly higher than those at Xushui and Quzhou (Table 1).

2.2. Data Collection
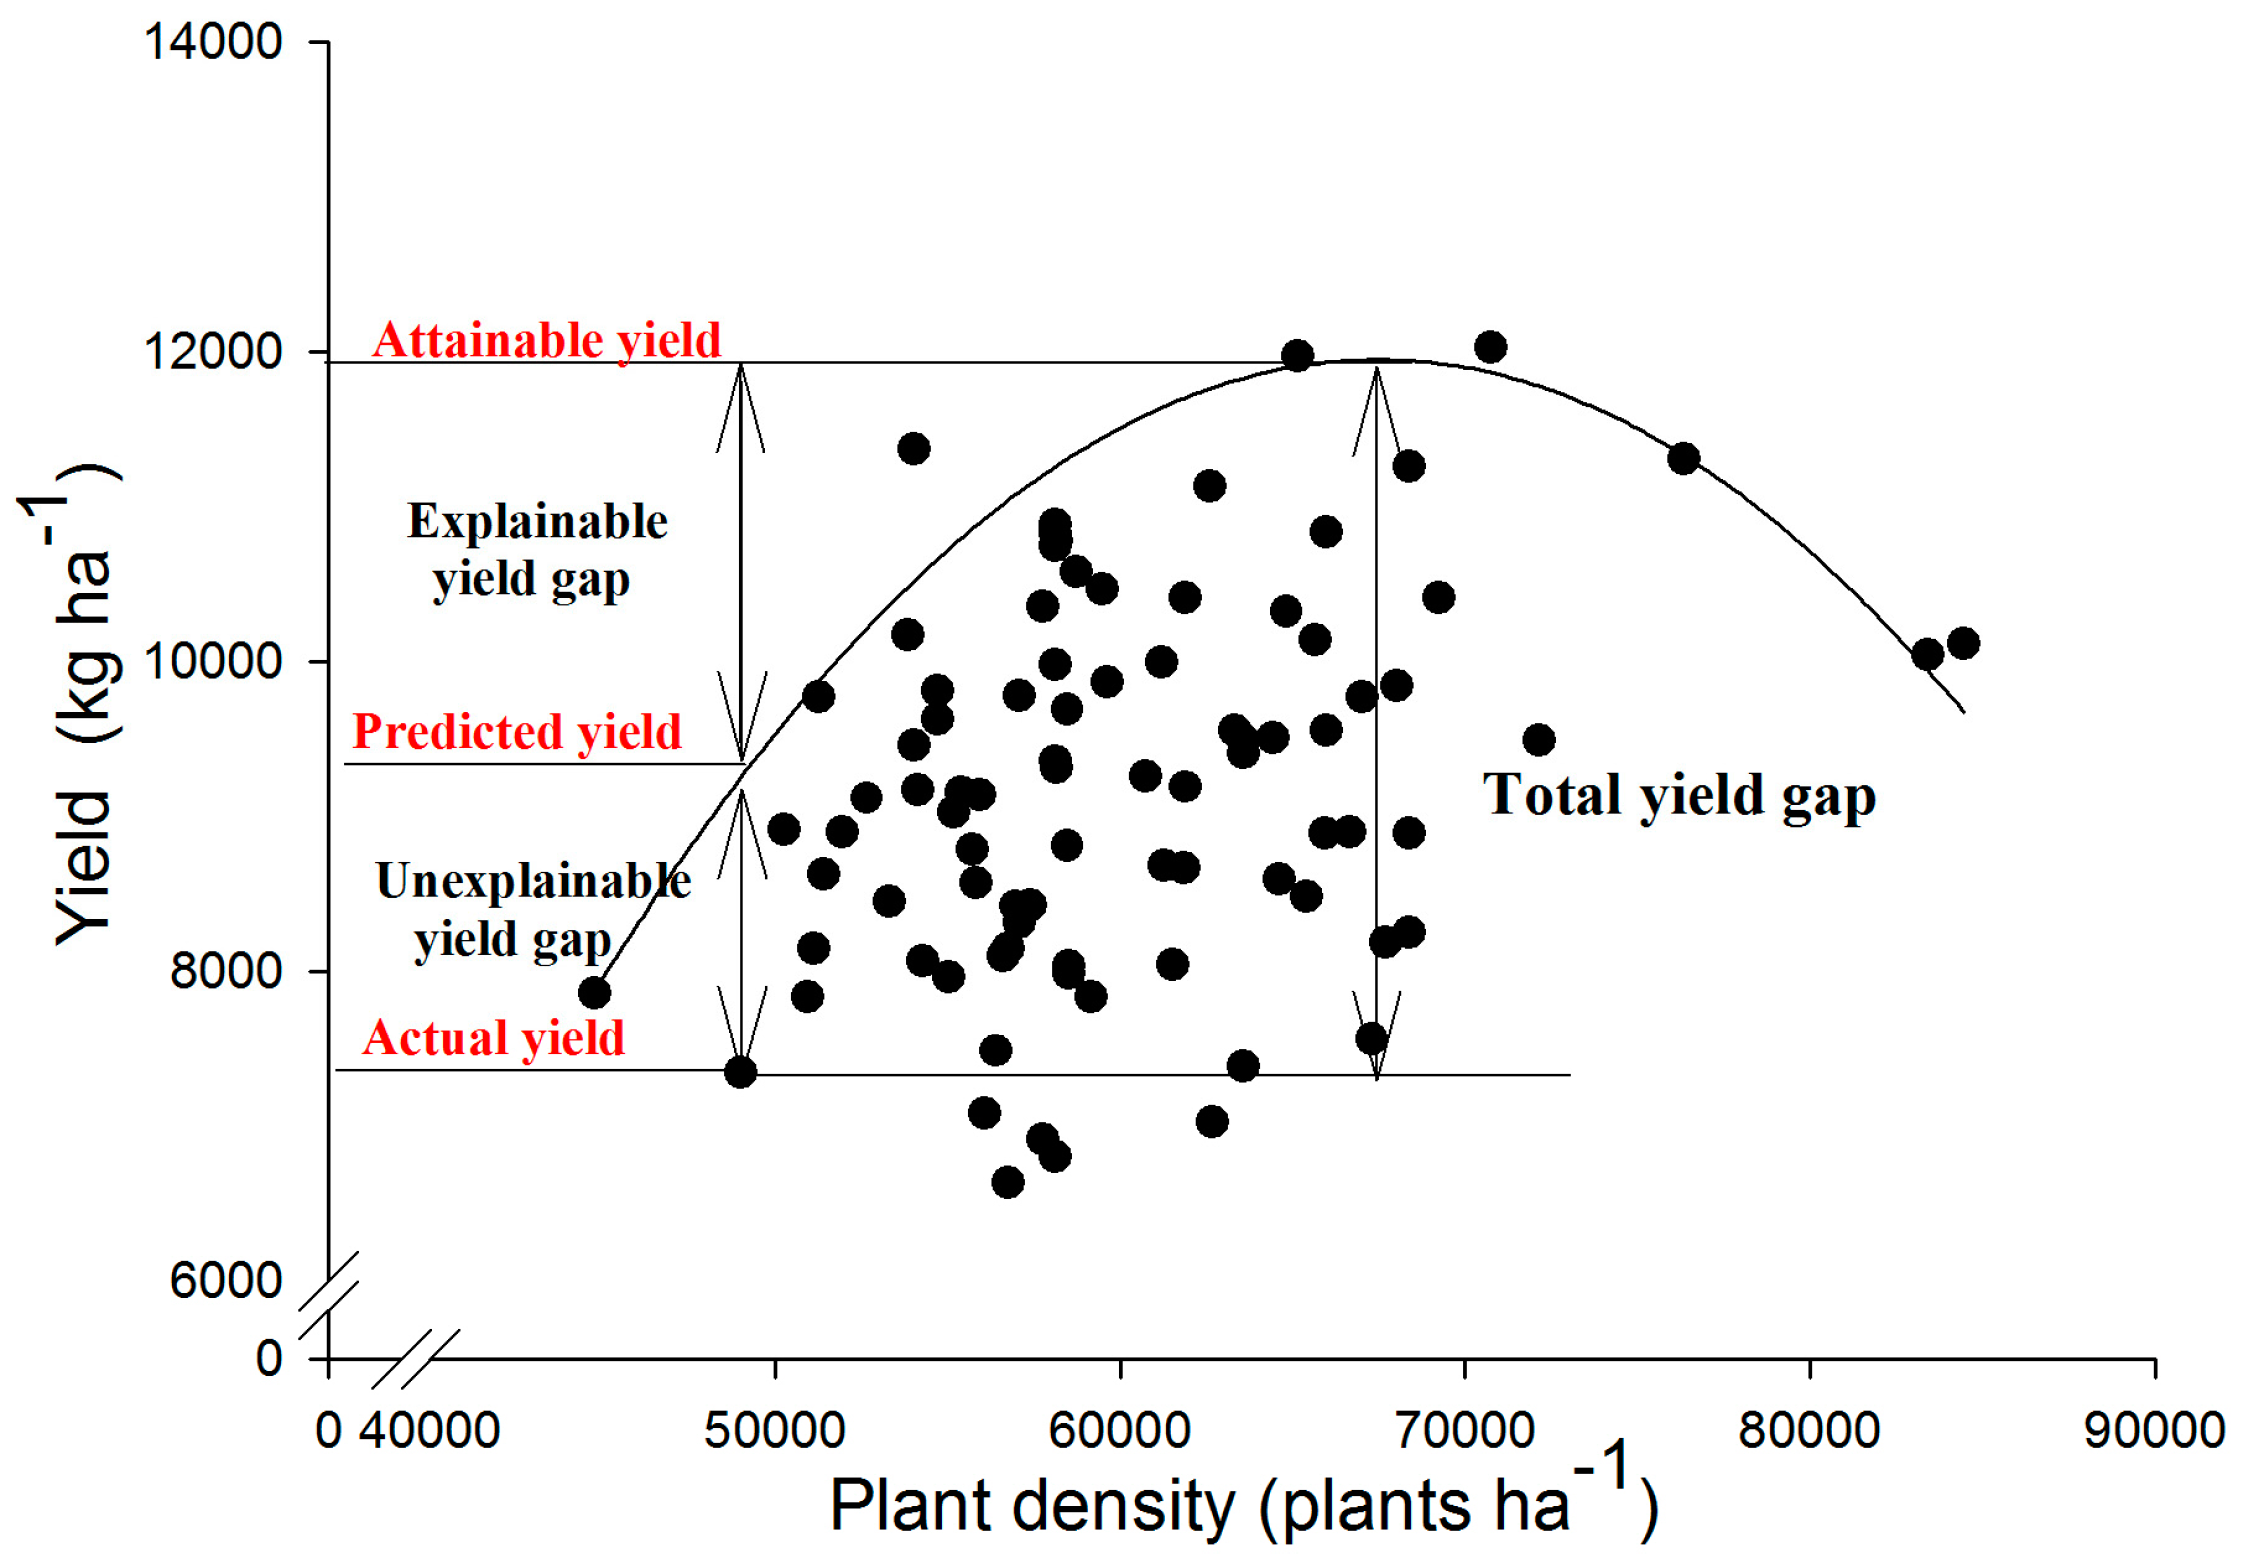
Farmers’ management practices that were recorded included N, phosphate fertilizer (P2O5) and potash fertilizer (K2O) applications, plant density, sowing date, and the timing of irrigation as well as of herbicide, insecticide, and bactericide applications. Researchers recorded all of these practices immediately after the farmers had completed their field work. For example, at sowing, researchers kept a record of maize varieties, sowing date, and the rate and formulation of basal fertilizers applied to each field. To obtain a precise amount of fertilizer input, researchers weighed the fertilizer and measured the field area. During the growing period, they recorded the fertilizer rate and formulation. The quantity, frequency, and formulation of fertilizers used in the fields were calculated to obtain the amounts of nutrients applied. At harvest, the average planting density in terms of plants per hectare was recorded. Maize grain yields were measured from three plots of 14.4 m2 (3 rows, each 8 m long) selected randomly in each field. Grain yields were adjusted to 15.5% moisture content.

2.3. Data Analysis

Nitrogen fertilizer partial factor productivity (PFPN) was calculated to show the N fertilizer use efficiency of summer maize production in the NCP. Standard deviation and coefficients of variation (CV) of yield and PFPN were used to compare the variation across fields, years and sites. The variation across research sites was calculated, as well as the mean yield and PFPN. Variation across years at each site was calculated together with the mean yield and PFPN. Variation between different fields was calculated for each research site every year. To evaluate the yield and PFPN of the smallholder farmers’ fields, we set standards of high yield (11.0 t ha−1) and high PFPN (60 kg kg−1). The high maize yield standard was the top 5% yield of all of the farms investigated (n = 5406), and the high PFPN was that achieved under the improved practice used to eliminate the major limitations to crop growth [31]. The fields at each site were divided into four categories: high yield and high PFPN (HH), high yield and low PFPN (HL), low yield and high PFPN (LH) and low yield and low PFPN (LL).
Boundary line analysis was used to evaluate the contribution of individual management factors to maize yield and PFPN, as originally proposed by Webb [32]. The assumption was that the data on the boundary line best represents the relationship between two variables, while the potential influence of other limiting factors can be considered minimal [32,33,34]. Recently, this approach has been widely adopted to study yield reduction factors [21,29,35]. The method of structuring a boundary line entails first eliminating abnormal values by a statistical process (the low and high outliers of box-plots in IBM SPSS Statistics 23.0, IBM, New York, NY, USA) and using empirical knowledge (e.g., a summer maize yield exceeding 16,300 kg ha−1 was regarded as an abnormal value, based on earlier research), and analyzing whether the data are consistent with a normal distribution. Boundary data were selected using the IF formula (logical-test, value-if-true, value-if-false) in Microsoft Office Excel (2010) (Microsoft, Redmond, WA, USA).
The basic steps to identify boundary data are:
(a)
Grouping the data points (Y = yield, X = management factors).
(b)
Arrange X (X1, X2, …, Xn) in ascending order and Y (Y1, Y2, …, Yn) in descending order.
(c)
The first boundary data is Y1, the second boundary data is identified by the IF formula (Y2 > Y1, Y2, Y1).
(d)
When the boundary data equals Yatt, the rest of the X and Y values are arranged in descending order.
(e)
The final boundary data is Yn; the previous boundary data is identified by the IF formula (Yn−1 > Yn, Yn−1, Yn), and is continued to Yatt.
For those boundary points that had positive or negative correlations with the yield or PFPN, a trend line in Microsoft Office Excel (2010) (Microsoft, Redmond, WA, USA ) was fitted to obtain the highest coefficient of determination (R2). However, for some factors, we used a linear plus platform model in SAS (SAS Institute Inc., Cary, NC, USA) or a sigmoidal curve in Sigmaplot (10.0) (Systat Software, San Jose, CA, USA) according to agronomic principles (e.g., the rates of P2O5 and K2O application on farms were not too high to reduce the maize yield) [36,37]. The boundary line was created for each management factor using the boundary data of yield and PFPN at every site for each year (Figures S1–S13).
Each boundary line function was used to predict the attainable yield or attainable PFPN (Yxi), which can be achieved at each value of the individual management factors (i = 1, 2, 3, …, n) in each field (x). The difference between the highest attainable yield (Yatt) and the farmers’ actual yield (Yobs) was the total yield gap (Figure 2). The gap between Yatt and Yxi was defined as the explainable yield gap, which was attributed to the difference between individual management factors (i = 1, 2, 3, …, n). The gap between Yxi and Yobs was the unexplainable yield gap, which was attributed to other unknown factors, together with the analysis of the PFPN gap. The total yield (or PFPN) gap was equal to the sum of the explainable yield (or PFPN) gap, and the unexplainable yield (or PFPN) gap. This approach to quantify the yield gap has been successfully used for cereals and cash crops [29,35,38].
The contribution of each factor to explain the reduction in the gap was expressed as the proportion of the explainable gap to the total gap. The most important limiting management factor to explain the reduction at the field level was identified according to von Liebig’s law of the minimum [39]. For the factor that was the most limiting, the number of corresponding fields was counted for each site [21,29]. The average contribution proportion for each factor on all of the monitored fields in a given site was calculated, and the sum of the average proportion of the nine factors was regarded as 100%. The relative values were used to compare the relative contributions.
Boundary line analysis focuses on the relative importance of an individual factor, but ignores the interactions between factors [40]. In order to overcome this, a Proc Mixed Model was used to analyze the interactions in a multiple regression analysis [41]. The model was applied to the interactions between yield and PFPN, and the monitored management factors, after a normal distribution test for yield and PFPN. Management factors and research sites were the independent variables, while the years were regarded as a random effect. The interaction between summer maize density and N fertilizer application was considered an independent variable because of its strong influence on yield and nutrient use efficiency [42,43]. Management data was standardized before analysis according to our knowledge of agronomy: e.g., plant density and N application were standardized according to attainable yield and the PFPN targets from the boundary line for each research site, because the two management practices had the most variations among different sites (Table S1); P2O5 and K2O applications were standardized according to the PFP target in the NCP; sowing date was standardized according to the attainable yield target in the NCP; and other management factors were standardized as measured. Detailed information on management practices and classification standards is in the supplementary materials (Table S2).
Boundary line analysis was done using Microsoft Office Excel 2010 (Microsoft, Redmond, WA, USA) and SigmaPlot 10.0 (Systat Software, San Jose, CA, USA). Comparisons among different categories were based on Duncan’s test at the 0.01 probability level (p < 0.01). The Proc Mixed Model and analysis of variance (ANOVA) were applied using SAS statistical software (SAS Institute Inc., Cary, NC, USA).

3. Results

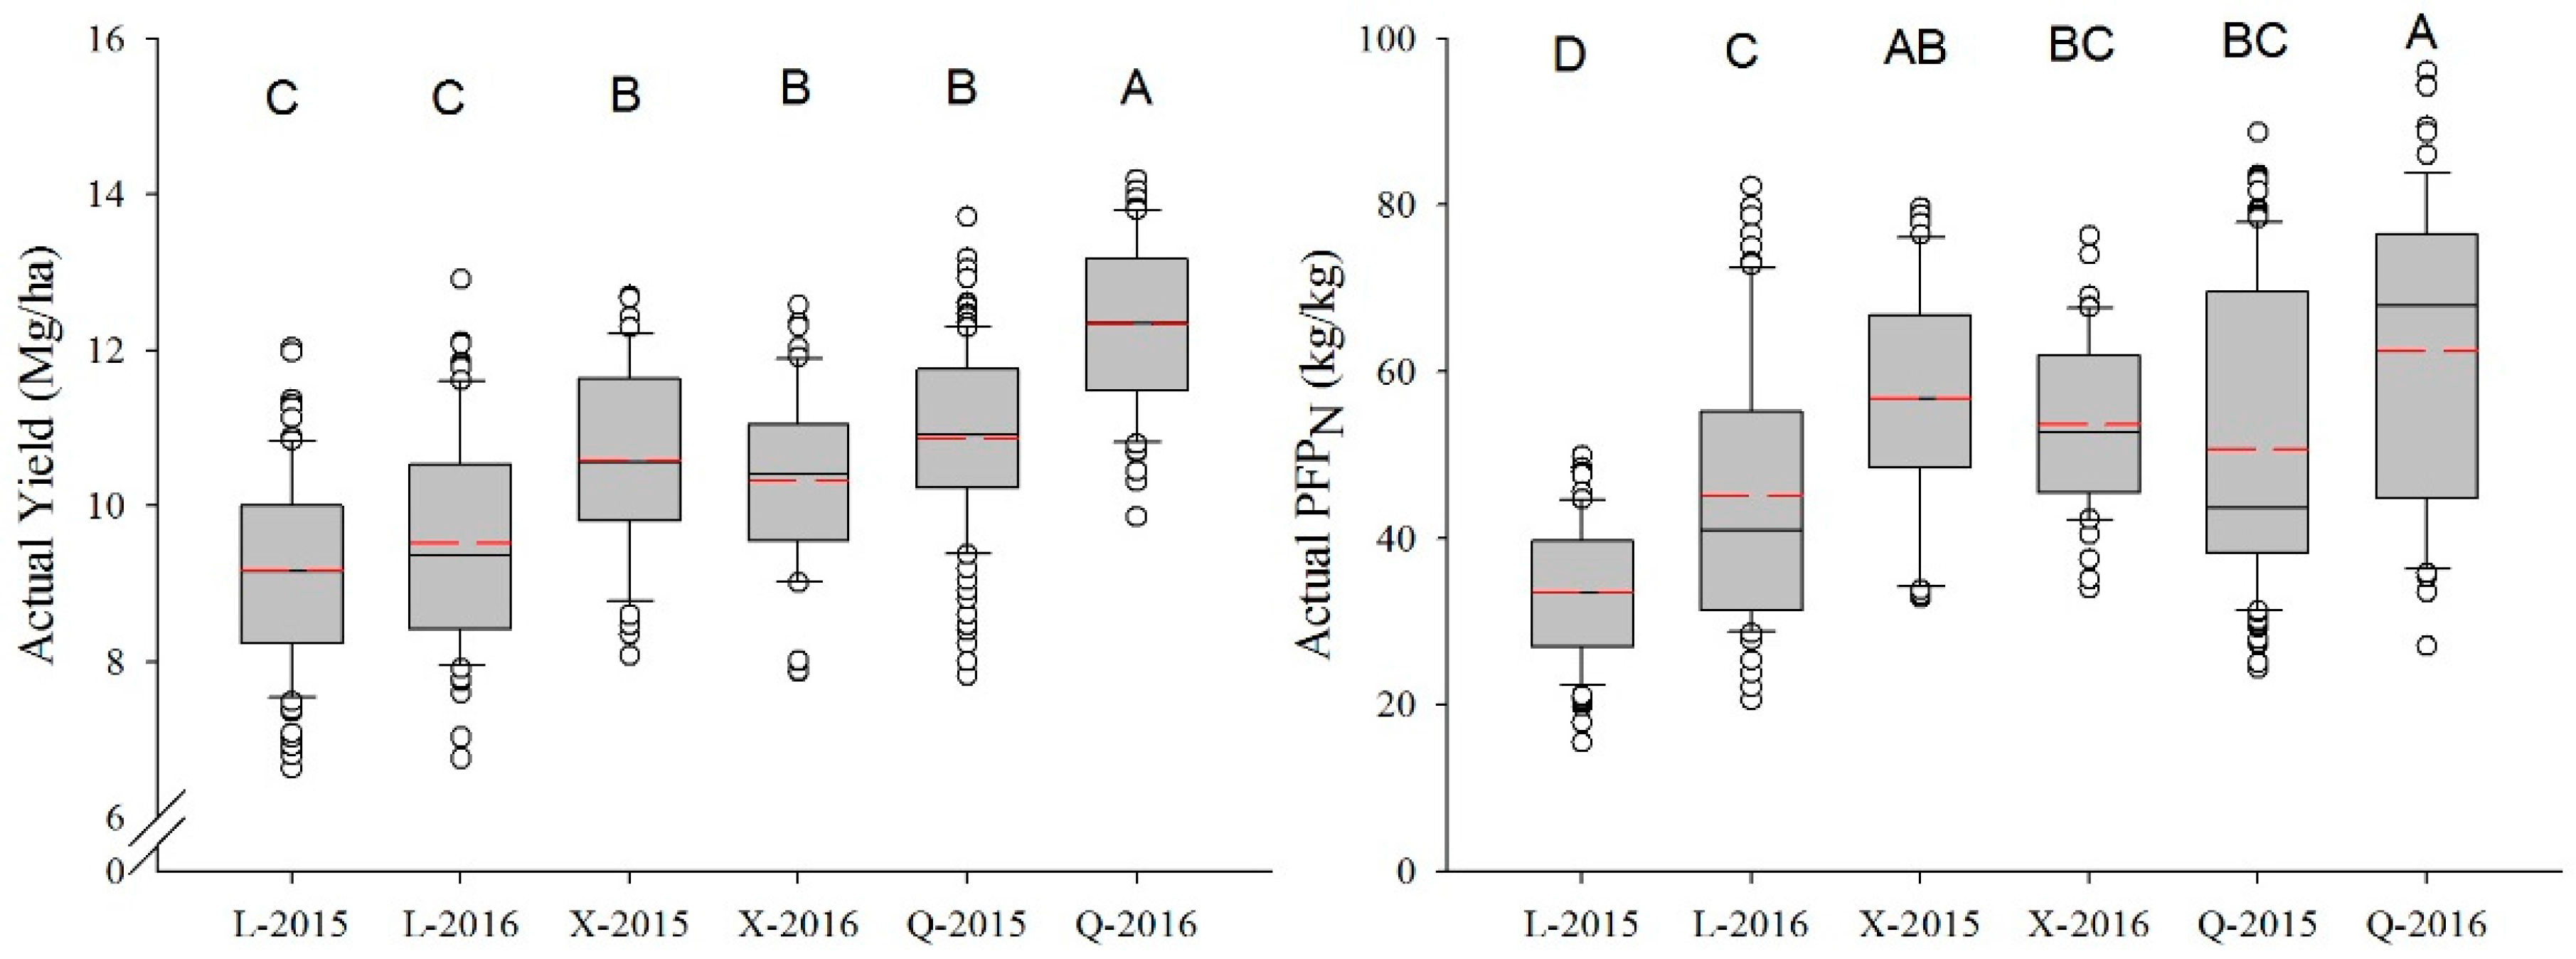
3.1. Variation of the Summer Maize Yield and PFPN

The yields at the three study sites ranged from 6.6 t ha−1 to 14.2 t ha−1, with a mean of 10.5 t ha−1 for the two years. The yield ranged from 6.6 t ha−1 to 12.9 t ha−1 in Laoling, from 7.9 t ha−1 to 12.7 t ha−1 in Xushui, and from 7.8 t ha−1 to 14.2 t ha−1 in Quzhou (Figure 3). The mean yield in Laoling (9.3 t ha−1) was significantly (p ≤ 0.01) lower than that in Xushui (10.5 t ha−1) and Quzhou (11.4 t ha−1). The Yatt in Quzhou (14.0 t ha−1) was higher than that in Laoling (12.5 t ha−1) and Xushui (12.6 t ha−1). The total yield gap ranged from 0 t ha−1 to 6.3 t ha−1 in Laoling, from 0 t ha−1 to 4.8 t ha−1 in Xushui, and from 0 t ha−1 to 6.4 t ha−1 in Quzhou. The mean total yield gaps were 3.6 t ha−1, 2.2 t ha−1, and 2.8 t ha−1 for Laoling (CV = 36.4%), Xushui (CV = 52.5%), and Quzhou (CV = 47.7%) (Figure 3), respectively. The total yield gap and total PFPN gap of summer maize were positively correlated (r = 0.4762, p < 0.0001) (Figure 4a). The PFPN gap was reduced by 6.0 kg kg−1 (3.6–6.6 kg kg−1) when the yield gap was reduced by 1 t ha−1. However, the relationships at the three sites were different.
Over two consecutive years of monitoring, the standard deviation and CV of the mean yields for the three sites were 1039.1 kg ha−1 and 10.0%, respectively (Table 2). There was a small variation in yield between different years at the same sites, except for Quzhou. For example, the yield standard deviation over the two years at the three sites ranged from 179.2 kg ha−1 to 1030.0 kg ha−1, and the CV ranged from 1.7% to 8.9%. The standard deviation of the yields among different fields at one site for a single year ranged from 1061.9 kg ha−1 to 1373.2 kg ha−1, and the CV ranged from 8.6% to 14.4% (Table 2). Therefore, the yield variation of smallholder farmers’ fields at each site was higher than the site variation and interannual variation, with the interannual variation being the lowest.
The PFPN of summer maize at the three sites ranged from 15.4 kg kg−1 to 96.1 kg kg−1, and the mean value from 38.8 kg kg−1 to 55.1 kg kg−1. The total PFPN gap ranged from 0 kg kg−1 to 64.3 kg kg−1 in Laoling, from 0 kg kg−1 to 46.7 kg kg−1 in Xushui, and from 0 kg kg−1 to 71.7 kg kg−1 in Quzhou. The mean total PFPN gaps were 43.3 kg kg−1, 24.5 kg kg−1, and 41.1 kg kg−1 for Laoling (CV = 31.7%), Xushui (CV = 48.5%), and Quzhou (CV = 45.0%) (Figure 3), respectively. The largest variation in PFPN was between fields, as it was for yield, with the standard deviation and CV ranging from 8.2 kg kg−1 to 18.2 kg kg−1 and 18.7% to 38.7%, respectively. The standard deviation over the two years at the three sites ranged from 2.1 kg kg−1 to 9.1 kg kg−1, and the CV ranged from 3.9% to 22.9%. The standard variation and CV of PFPN between different sites were 9.0 kg kg−1 and 18.0%, respectively (Table 2).

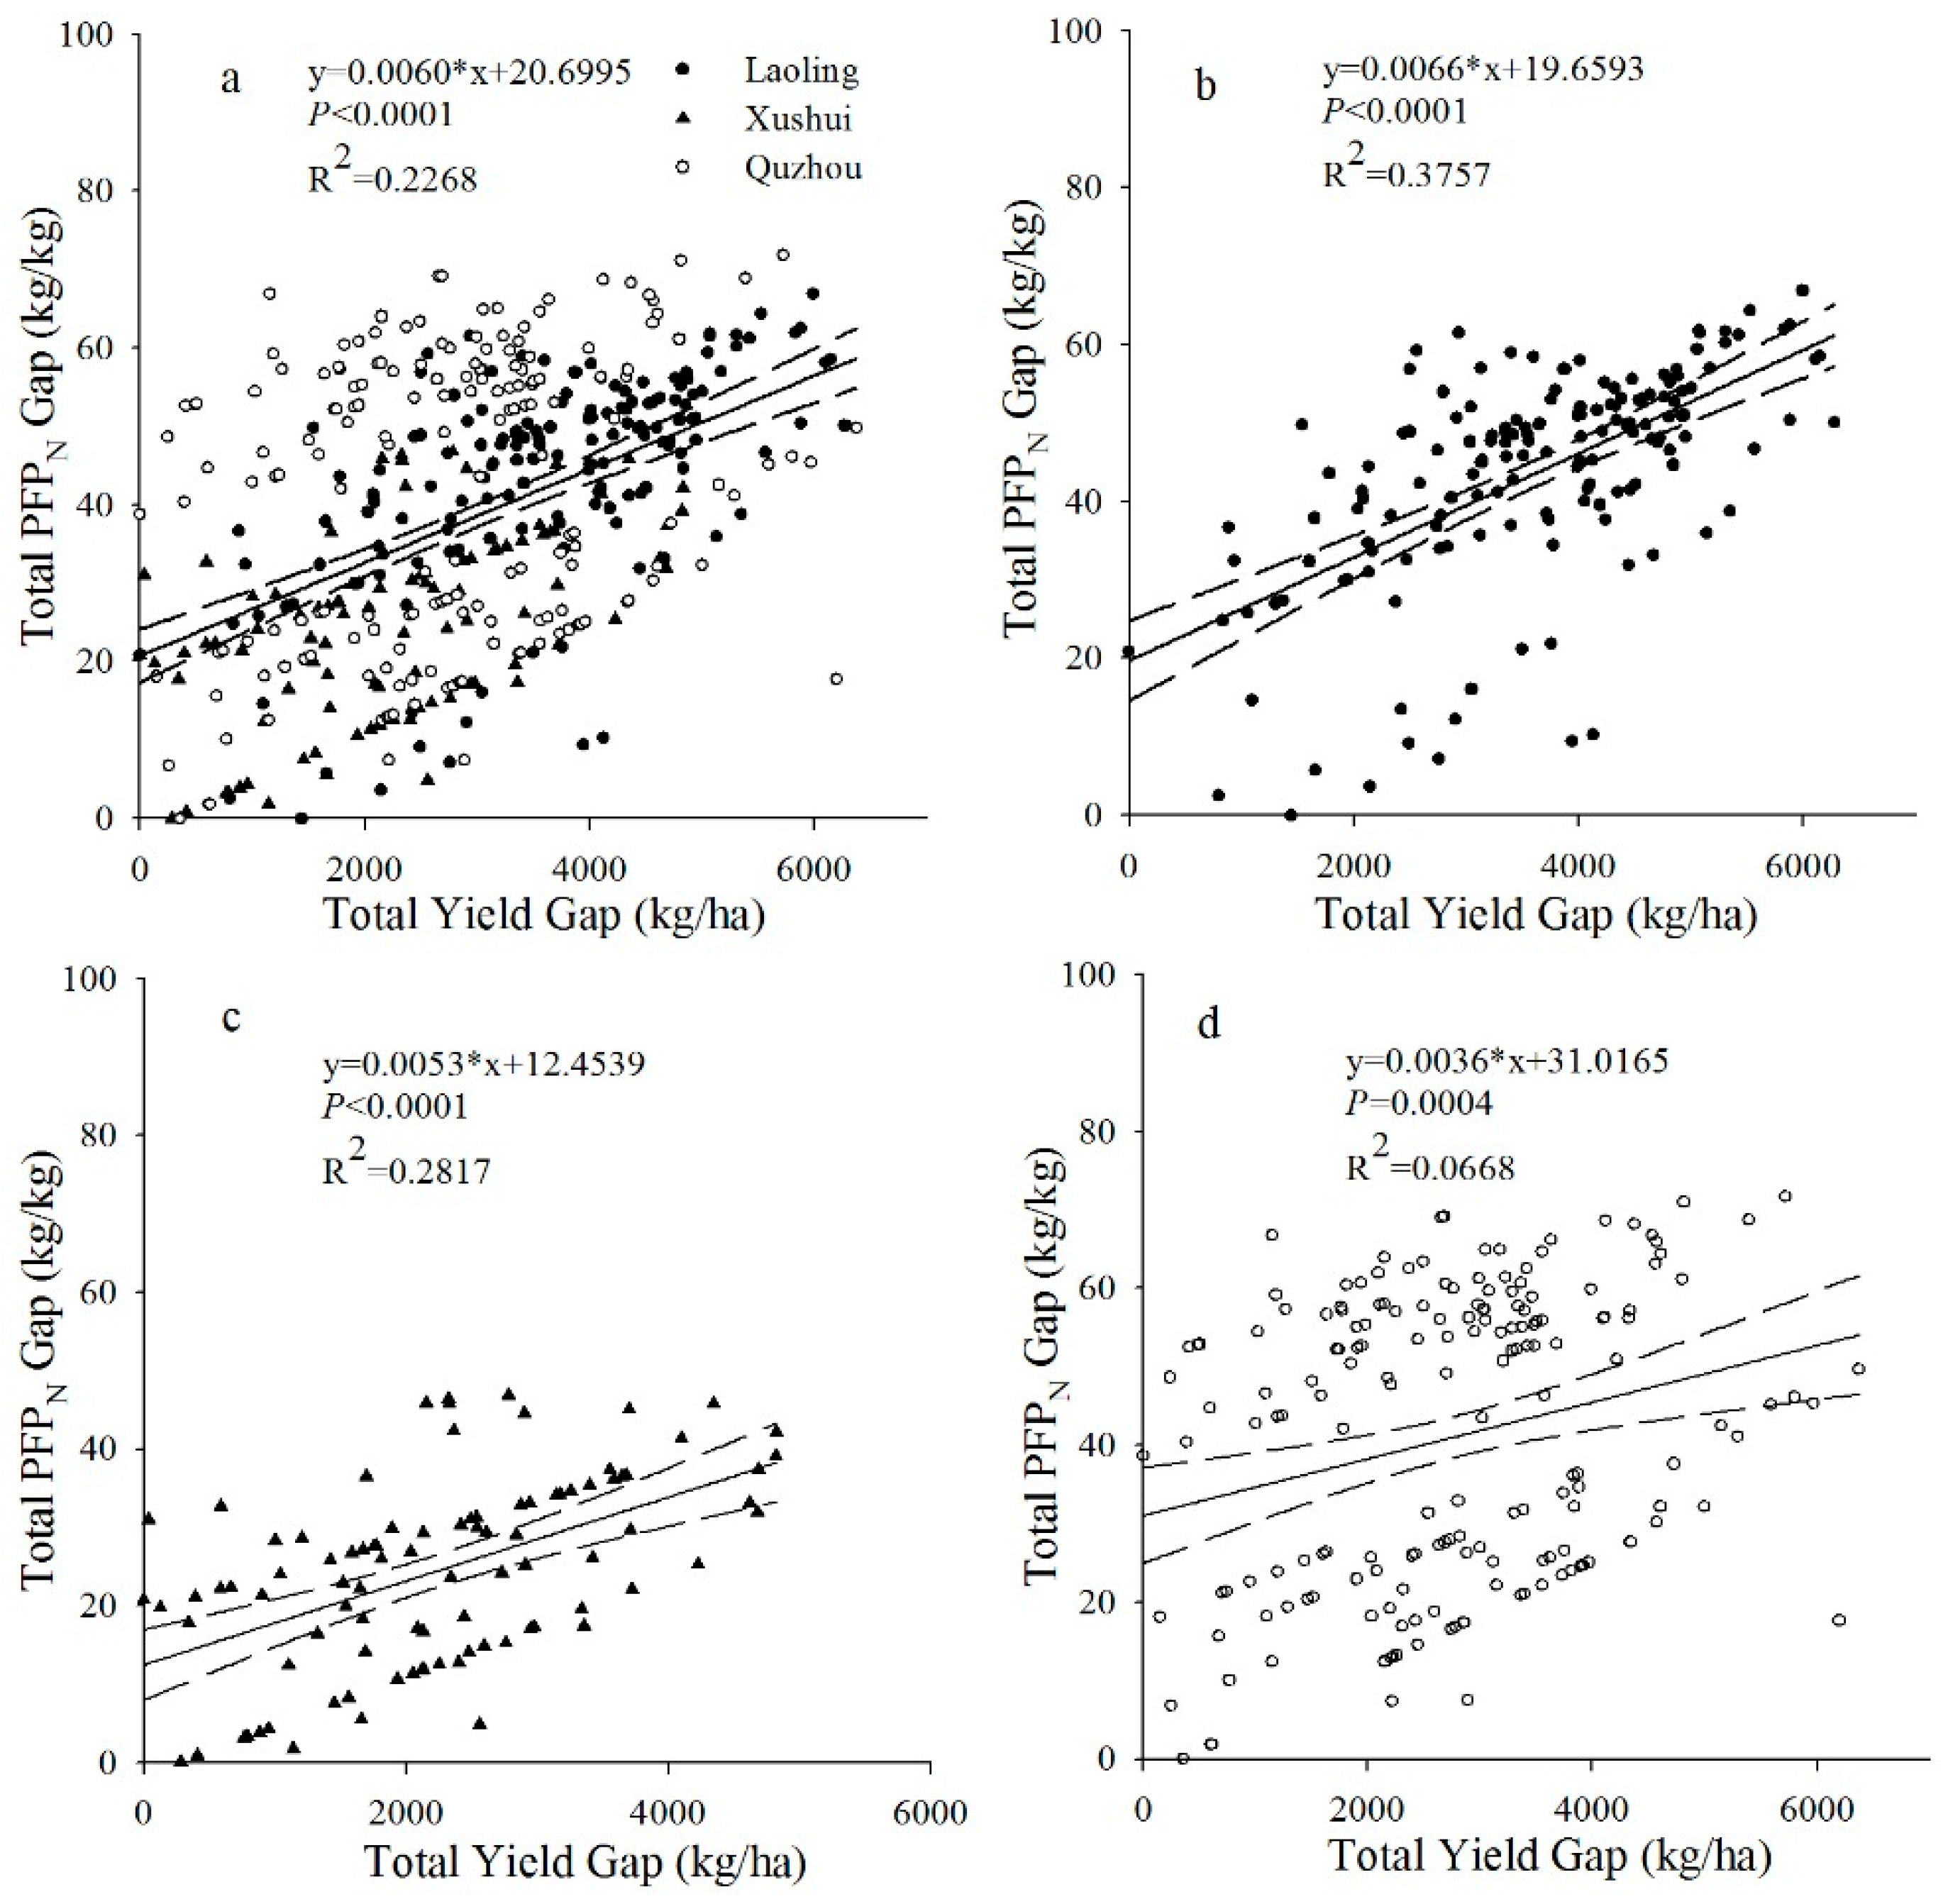
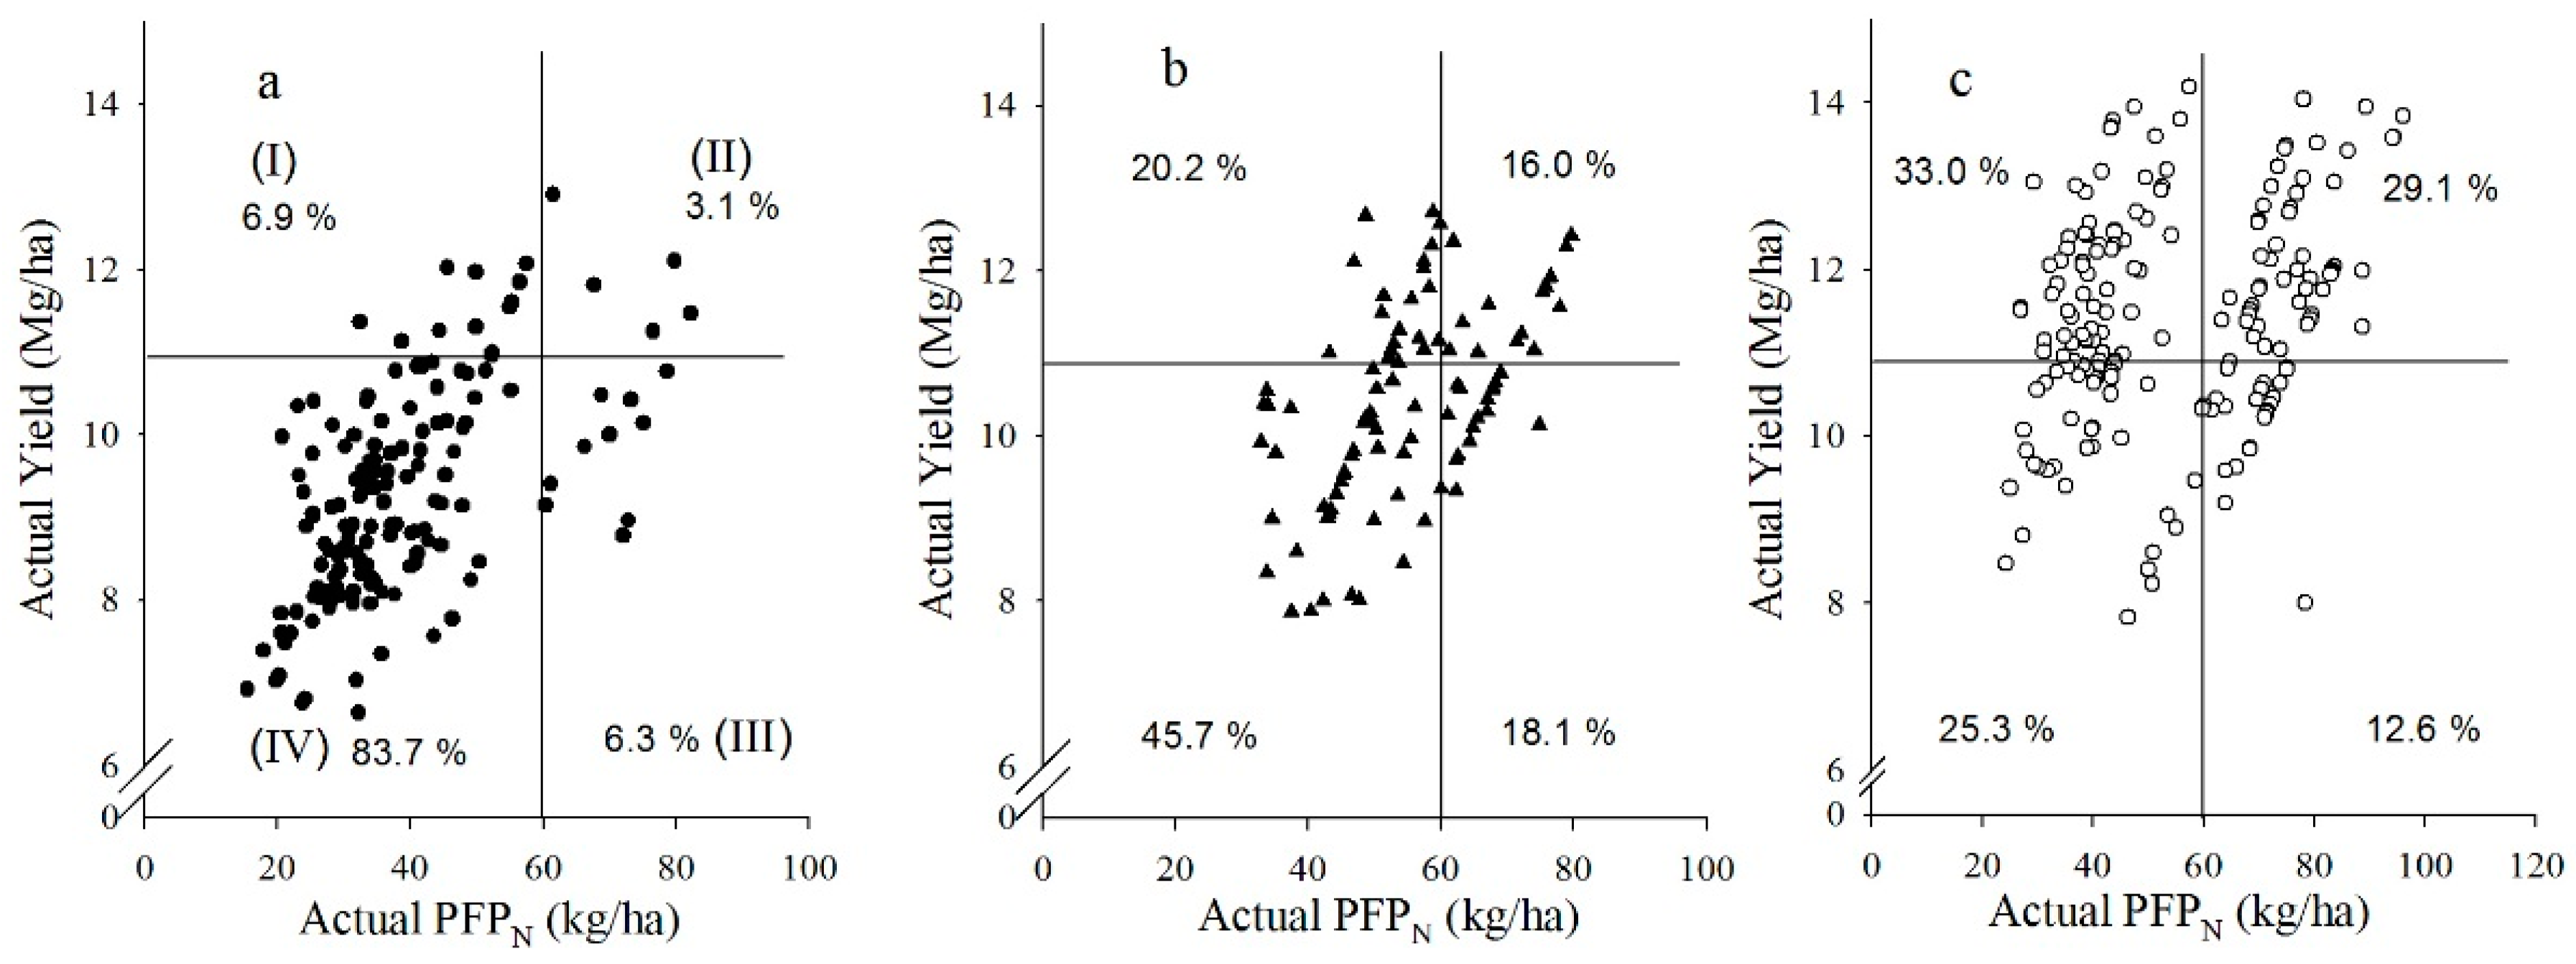
3.2. Relationship between Summer Maize Yield and PFPN

Most fields belonged to the LL category, except at Quzhou. The percentages of fields in the LL category for all of the fields for both years were 83.7%, 45.7%, and 25.3% for Laoling, Xushui, and Quzhou, respectively. Only 3.1–29.1% of the fields belonged to the HH category (Figure 5; Table 3). The proportions of high PFPN fields also in the high yield category were 31.3%, 44.1%, and 46.9% for Laoling, Xushui, and Quzhou, respectively. The proportions of high PFPN fields in the low yield category were 6.9%, 28.3%, and 33.3% for the three sites, respectively. This indicated that there was a greater chance to achieve high PFPN with high yields than with low yields.
The controlling management factors differed for the four categories. For each research site, the HH category had a higher planting density and lower amount of N than LL (Table 3). This suggests that the amount of N applied and plant density were the main factors producing a high yield and high PFPN simultaneously. However, the HH farmers’ plant density in Quzhou (58,319.1) was lower than that in Laoling (67,019.4) and Xushui (63,550.8), which indicated that the optimum plant density varies.

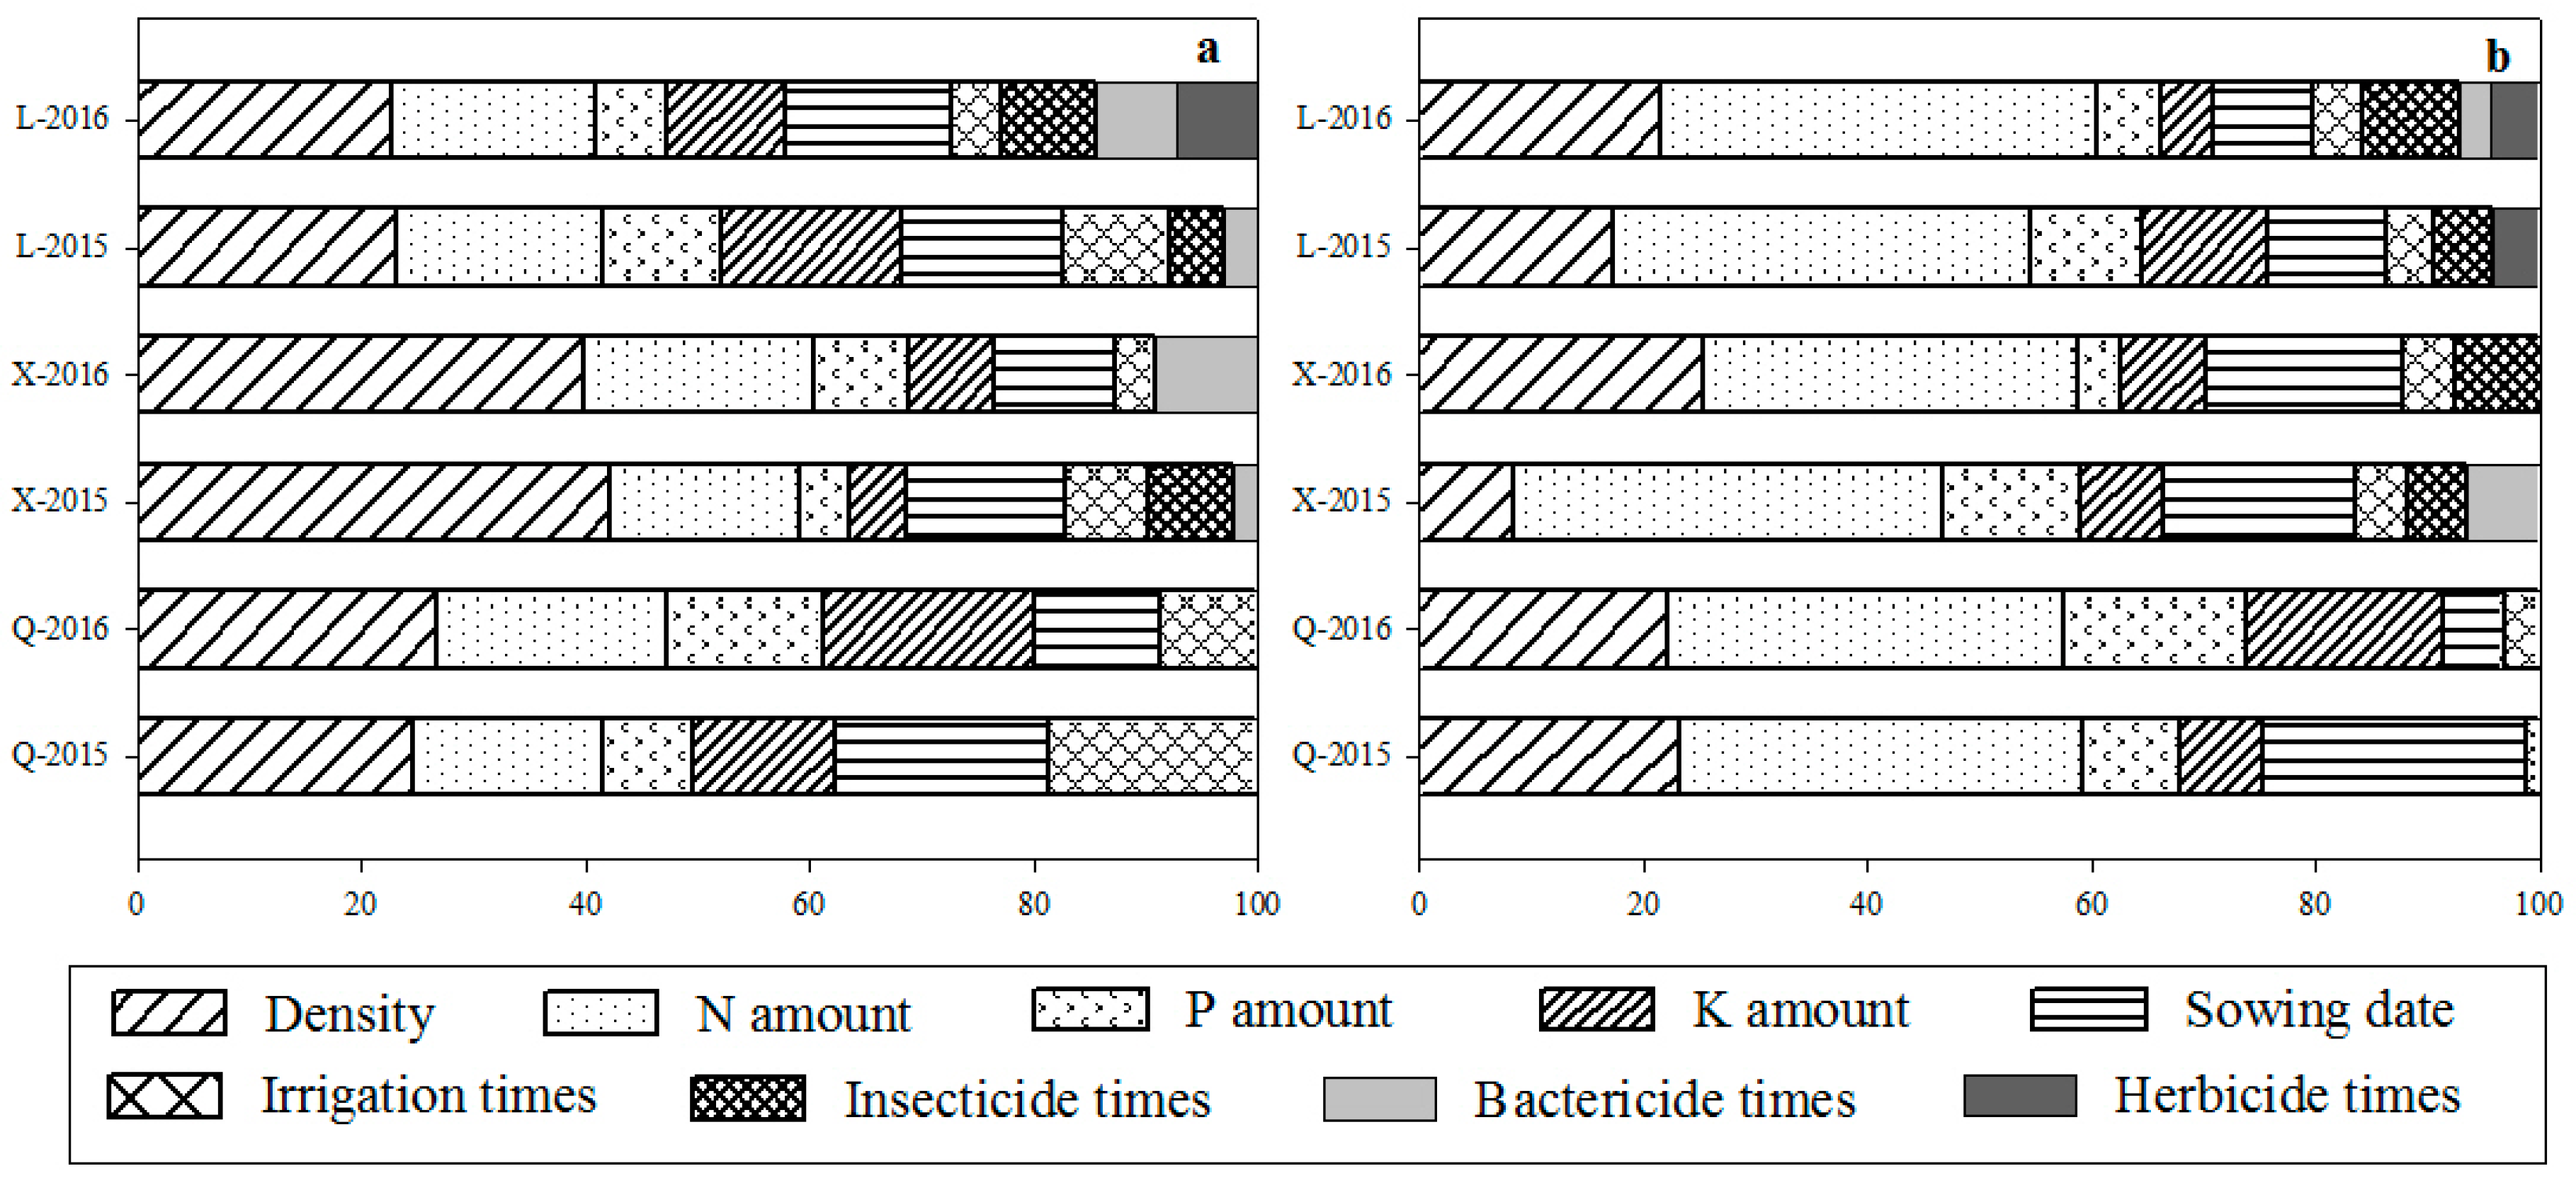
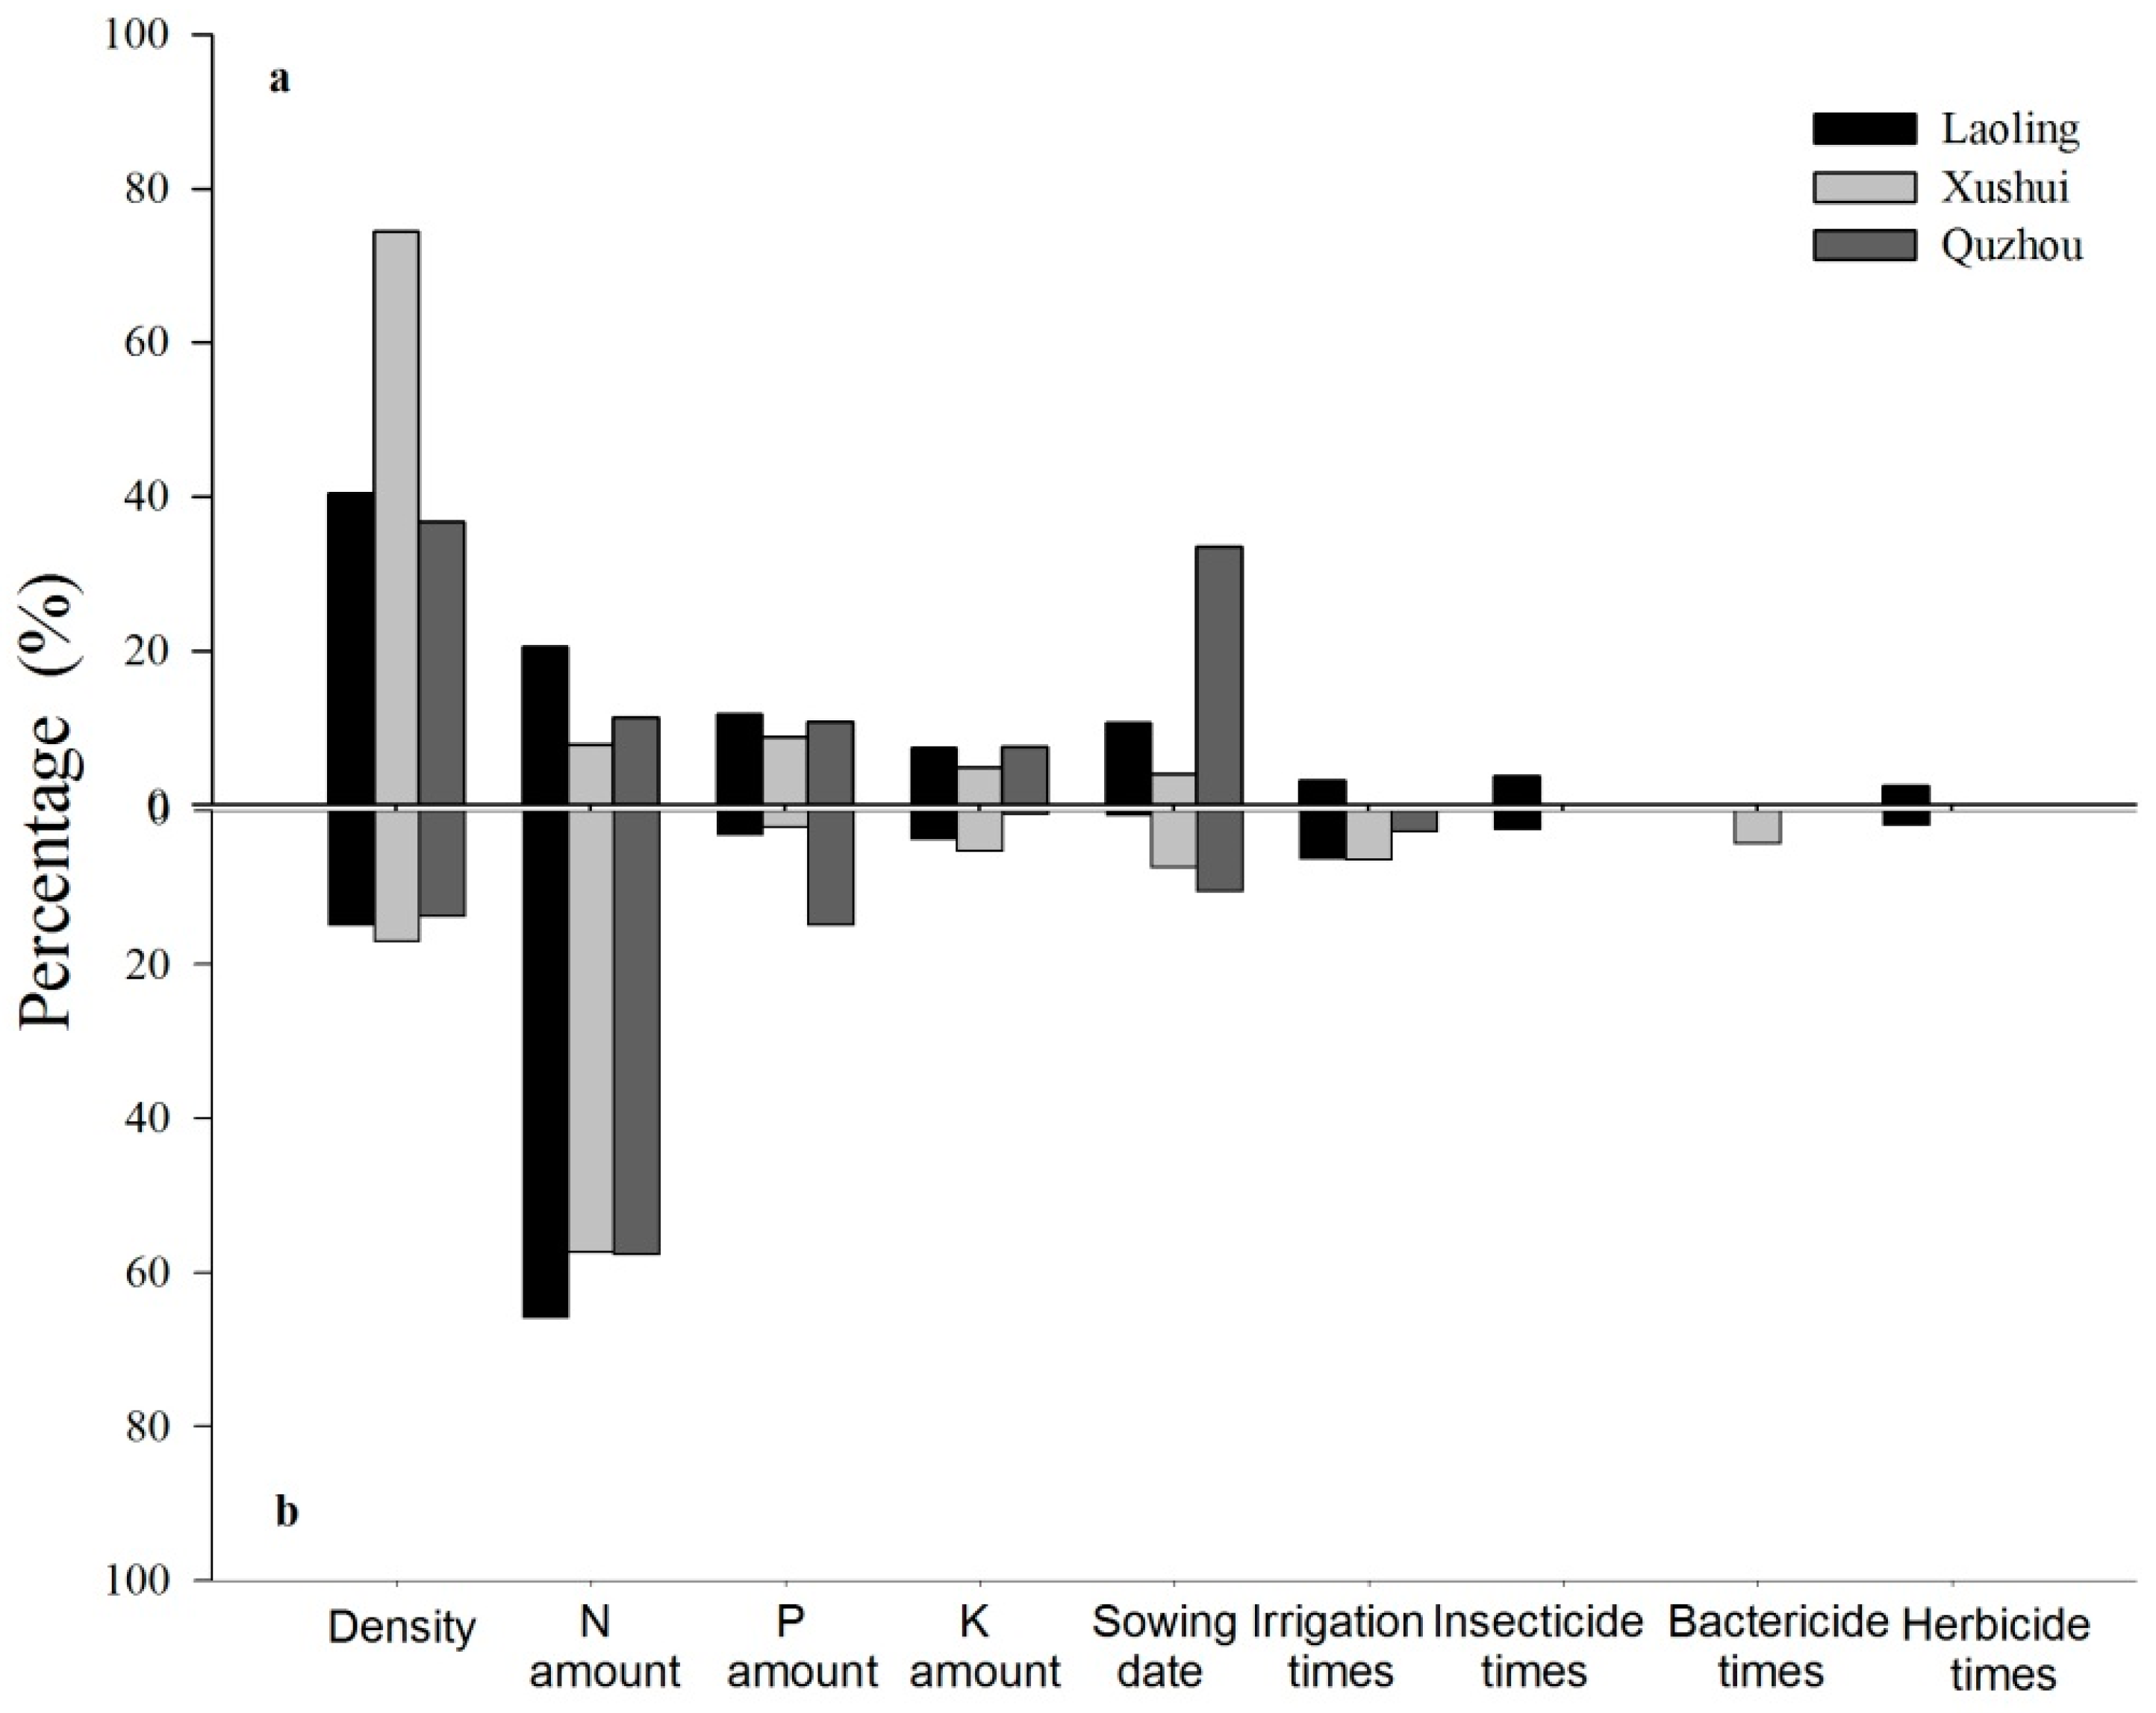
3.3. Key Limiting Management Factors of Yield and PFPN

Examining the boundary line analysis across all of the monitored fields, plant density was the most important yield-limiting factor in most fields, with the corresponding proportion of fields limited by this factor being 40.4%, 74.5%, and 36.8% for Laoling, Xushui, and Quzhou, respectively (Figure 6a). Not surprisingly, N application was the most important PFPN-limiting factor in 65.8%, 57.4%, and 57.7% of the fields at Laoling, Xushui, and Quzhou, respectively (Figure 6b).
However, at the site level, the top three yield-limiting management factors in Laoling were plant density, N application, and K2O application in 2015, and their relative contributions expressed as the percentage of the explainable yield gap to total yield gap were 23.1%, 18.6%, and 16.0%, respectively. In 2016, the top three factors were plant density, N application, and sowing date, accounting for 22.7%, 18.4%, and 14.8%, respectively, of the total yield gap. In Xushui, the top three constraints were plant density, N application, and sowing date in 2015, and their relative contributions were 42.3%, 16.9%, and 14.2%, respectively. In 2016, the top three factors were the same as in 2015, and their relative contributions were 39.9%, 20.5%, and 10.7%, respectively. In Quzhou, the top three limiting factors were plant density, sowing date, and irrigation times in 2015, and their relative contributions were 24.7%, 19.1%, and 18.6%, respectively. In 2016, the top three constraints were plant density, N application and K2O application, and their relative contributions were 26.8%, 20.6%, and 18.8%, respectively (Figure 7a). For PFPN, N application contributed a relatively high contribution at all three sites, with the values ranging from 33.3% to 38.9% over the two years. The contribution of plant density or sowing date ranged from 17.1% to 25.5%, far lower than that of N application (Figure 7b). Thus, for all three sites, an appropriate N application was the principal cause of a high PFPN achieved in smallholder farmers’ fields.
The results of the Proc Mixed Model indicated that the research year, site, plant density, sowing date, irrigation times, herbicide application times, and bactericide application times all had a significant influence on the summer maize yield. However, the amounts of N, P2O5, and K2O applied did not significantly affect the yield. The amount of N applied had a small, non-significant influence on yield under different plant densities. (Table 4). The yield in the first year was significantly lower than that in the second year (p < 0.0001). Yields in Laoling and Xushui were significantly lower than that in Quzhou, with a model estimate of the differences of −2.714 (p < 0.0001) and −1.378 (p < 0.0001) t ha−1, respectively. The summer maize yield was reduced significantly by a reduction in plant density (p < 0.0001) and a delay in sowing (p = 0.0089, p = 0.0216). The year, site, N applied, irrigation times, bactericide application times, and the interaction between plant density and N applied all had a significant influence on PFPN. Plant density had no influence on PFPN at low N inputs, but at medium N inputs, PFPN and plant density were significantly positively correlated (Table 4). For example, PFPN in the first year was lower than in the second year, with a model estimate of the difference being −9.170 kg kg−1. The PFPN in Laoling was lower than that in Xushui and Quzhou by −18.792 (p < 0.0001) kg kg−1 and −17.866 (p < 0.0001) kg kg−1, respectively. PFPN was reduced significantly by increasing the N input (p < 0.0001).

4. Discussion

4.1. Effects of Plant Density and N Application on Yield and PFPN

Plant density and N applied were the main limiting factors of the gaps in yield and PFPN, which is consistent with other research [44,45,46]. The relative contribution of plant density according to the boundary line approach was only slightly higher than that of other management factors in Laoling and Quzhou. Zhang et al. (2016) showed that a single technology such as increasing plant density can increase the maize yield to varying extents in 55 single-factor field experiments [9]. Others have shown that increasing plant density is likely to improve maize biomass and PFPN for both medium and high N inputs [43,47,48]. However, the choice of plant density for summer maize in farmers’ fields is more complicated than that in experimental plots. The Proc Mixed Model showed that an increase in plant density at high N inputs may reduce the maize yield, because too high a density will extend maturity due to its effect in reducing soil temperature through the thicker canopy reducing insolation [49].
The optimum plant density for maize in the NCP has been given as approximately 86,000 plants ha−1 [50]. In our study, the overall and optimum plant densities of summer maize ranged from 37,148 ha−1 to 84,445 plants ha−1. For instance, the plant densities that achieved Yatt and average yield were 70,684 ha−1 and 60,718 plants ha−1, respectively, in Laoling; 65,396 ha−1 and 59,080 plants ha−1, respectively, in Xushui; and 59,710 ha−1 and 57,244 plants ha−1, respectively, in Quzhou. Most of the farmers in the NCP have low yields because of low plant populations (Supplementary Materials Figures S1–S6), but the Yatt declined with excessive plant density, especially in Quzhou (Figures S5 and S6). Our findings also suggested that low germination rate, maize “rough dwarf disease”, and common smut were three major factors constraining plant density, and thus yield. Inappropriate tillage at sowing and too much or too little soil moisture will lead to approximately 10% of seeds not germinating (data not shown). In summary, improving tillage quality, increasing the sowing rate, and preventing pests and diseases can increase plant density, and so achieve high maize yields and a high PFPN in smallholder farmers’ fields.
Most farmers in China often overused and applied N fertilizer at the wrong times in intensive cropping systems [12,51,52,53]. We found that the amount of N applied was the most important limiting management factor for the PFPN gap in 57.4% to 65.8% of all fields (Figure 6b). The mean amounts of N applied in Laoling, Xushui, and Quzhou were 261 kg ha−1, 197 kg ha−1, and 231 kg ha−1, respectively, and the corresponding average grain yields ranged from 9.3 t ha−1 to 11.4 t ha−1. Thus, the N applied was much higher than N uptake (160–190 kg ha−1) [51,54].
In the NCP, smallholder farmers considerably overused N as a basal fertilizer, with basal dressings accounting for 23% to 100% of the total N application. However, early in the summer maize-growing season, large quantities of basal fertilizer are easily lost to the environment under the rainy climate, because the root system is not extensive [55]. Furthermore, the type of fertilizers and the timing and methods of top-dressing also affect N use efficiency [56,57]. Most of the farmers broadcast urea fertilizer at the elongation stage (V6) of summer maize, but an N top-dressing should be applied during the middle–late growing season (V10–12) in this region [58,59]. Also, an in-season N management strategy based on soil mineral nitrogen (Nmin) testing can save 40% N fertilizer without yield losses [58]. Unfortunately, smallholder farmers usually decide the amount of top-dressing based on their experience or the salesperson’s suggestions, rather than researching and testing the soil nutrients and plant growth.

4.2. Other Limiting Management Factors

Many other management factors also make significant contributions to the maize yield gap [60]. Earlier planting significantly contributes to increasing yields, and delayed planting has been shown to lead to yield declines [24]. The maize grain yield will decrease if the crop is sown before the end of May or delayed after the middle of June in the NCP [50,52]. However, farmers decide when to sow only after they have a guarantee of irrigation, because the topsoil is too dry to germinate maize seed without extra moisture. In our study, farmers used surface water in Laoling and well water in Xushui and Quzhou for irrigation. The sowing date was often delayed or prolonged due to the limited quantities of well water; sowing time in Quzhou can extend over 22 days from 6 June to 28 June. The proportions of fields in which planting was delayed were 8.0%, 42.5%, and 53.4% in Laoling, Xushui, and Quzhou, respectively. This reduced overall yield by 1.1% to 8.5%.
Due to the importance of irrigation, the average yield can increase by 4.2% if the field is within 150 m of a well or water source in Quzhou [61]. Our findings (data not shown) supported the importance of distance from a water source for summer maize yield and PFPN and that of weeds, cultivar selection, pests, and diseases for maize health and yield. In addition, the timing of herbicide and bactericide applications also had an important influence on summer maize yield, according to the Proc Mixed Model analysis. This suggests that smallholder farmers should pay more attention to crop protection practices in order to achieve high yields. Overall, our research suggests that on smallholder farmers’ fields, many management practices, rather than just one, need to be optimized to close the yield gap.

4.3. Variation of Yield and PFPN On Farms

There was a consistently large variation in yield and PFPN between fields for each year and site. Since smallholder farmers’ fields are small and scattered, farmers lack the economies of scale, and are easily affected by infrastructural and socioeconomic situations [9,62,63,64], leading to this high variability [61]. However, the interannual variation of PFPN was larger than that of the yield at all three sites; e.g., the interannual variation of yields in Laoling had a CV of 2.6%, but that of PFPN was 22.9%, the largest of the three sites. In other words, the PFPN on smallholder farms was easier to change than yield, which shows that the PFPN gap was mainly caused by one factor (N input), and the yield gap was caused by multiple management factors.
Additionally, the four distribution categories of yield and PFPN were different at different sites. To narrow the variation of yield and PFPN overall in China, we need to propose appropriate optimum solutions for each type of field at each site.

4.4. Yield and PFPN On Farms

On smallholder farms in the NCP, our research found that the average maize grain yield to be 10.5 t ha−1. This is approximately 59.7% of the yield potential according to Meng [7], but much higher than that found in previous studies, in which the on-farm average yield was 7.5 t ha−1 [52] or 7.3 t ha−1 [7]. This difference may be due to the different study years and methods for obtaining yields: Liang and Meng’s studies were conducted in 2004–2005 and 2007–2008 by surveying farmers. The increase in the yield on farms that we studied may also be due to the extension of agricultural technologies, e.g., more farmers being trained to achieve higher maize yields since Liang and Meng’s research [9,53].
Previous surveys of the PFPN of maize found values of 32 kg kg−1 [65] and 43 kg kg−1 [31]. We obtained a slightly higher PFPN of maize in smallholder farmers’ fields of 49.1 kg kg−1. However, this is far lower than that achieved in the United States. For example, the PFPN of maize was found to be 71 kg kg−1 and 64 kg kg−1 in the Tri-Basin area and Nebraska, respectively [66]. We found a large variation in N input between different smallholder farmers’ fields (102.0 kg ha−1 to 481.5 kg ha−1), so if the over-application of N was reduced, PFPN could be increased. The summer maize yield can reach approximately 12.0 t ha−1 with an N input from 180 kg N ha−1 to 210 kg N ha−1 [31,42,67], so the maize yield can be increased, and the N input reduced, on smallholder farmers’ fields by optimizing management practices.

5. Conclusions

Our findings suggest that the summer maize yield in smallholder farms of the NCP is still low compared to the potential yield, and there is a large variation across fields. The PFPN of summer maize at the three sites that we examined was slightly higher than that observed in previous studies, but still too low, as are yields. More than 50% of the fields belonged to the LL category (low PFPN; low yield) at the study sites, so there is considerable opportunity to improve smallholder farmers’ yield and N use efficiency, and thus achieve sustainable production. The analysis also clearly demonstrates that the reduction of PFPN was mainly caused by the overuse of N fertilizer. However, there is not a dominant management factor to explain the yield gap. Plant density, sowing date, the interaction between plant density and N inputs, and crop protection practices all significantly affected yield.
We conclude that, in order to achieve high yield and high PFPN on a large scale in China, a scientific integrated management strategy based on a comprehensive understanding of the causes of maize yield and PFPN limitations is required. Further research is needed to design the optimum sustainable production system for maize and test it on farms.

Supplementary Materials

The following are available online at https://www.mdpi.com/2071-1050/10/2/363/s1, Figures S1–S12, Tables S1 and S2.

Acknowledgments

This work was supported by the National Basic Research Program of China [2015CB150405]; and the National Key R&D Plan of China [2016YFD0200401]. We would like to especially thank Prof. Yaqun Huang (HEBAU) for helping us to analyse the data. We thank the STB students Dongdong Chen, Weili Zhao and Lingbo Zhang who helped with collecting the crop data. Our appreciation also goes to the farmers who participated in this field research.

Author Contributions

Guangfeng Chen, Hongzhu Cao, Jun Liang, Lufang Guo and Shuhua Zhang conducted the monitor work and collected data for this research. Guangfeng Chen, Hongyan Zhang and Hongzhu Cao analysed the data and wrote the manuscripts. Fusuo Zhang, Rongfeng Jiang, Wenqi Ma, Keith Goulding and Hongyan Zhang designed the research and revised the manuscripts.

Conflicts of Interest

The authors declare no conflict of interest.

References

  1. The Food and Agriculture Organization (FAO). Available online: http://www.fao.org/faostat/en/#data/QC (accessed on 19 January 2018).
  2. Shiferaw, B.; Prasanna, B.M.; Hellin, J.; Bänziger, M. Crops that feed the world 6. Past successes and future challenges to the role played by maize in global food security. Food Secur. 2011, 3, 307–327. [Google Scholar] [CrossRef]
  3. Godfray, H.C.J.; Beddington, J.R.; Crute, I.R.; Haddad, L.; Lawrence, D.; Muir, J.F.; Pretty, J.; Robinson, S.; Thomas, S.M.; Toulmin, C. Food security: The challenge of feeding 9 billion people. Science 2010, 327, 812–818. [Google Scholar] [CrossRef] [PubMed]
  4. World Bank. World Development Report 2008: Agriculture for Development; World Bank: Washington, DC, USA, 2008. [Google Scholar]
  5. Ray, D.K.; Ramankutty, N.; Mueller, N.D.; West, P.C.; Foley, J.A. Recent patterns of crop yield growth and stagnation. Nat. Commun. 2012, 3, 1293. [Google Scholar] [CrossRef] [PubMed]
  6. Tilman, D.; Balzer, C.; Hill, J.; Befort, B.L. Global food demand and the sustainable intensification of agriculture. Proc. Natl. Acad. Sci. USA 2011, 108, 20260–20264. [Google Scholar] [CrossRef] [PubMed]
  7. Meng, Q.; Hou, P.; Wu, L.; Chen, X.; Cui, Z.; Zhang, F. Understanding production potentials and yield gaps in intensive maize production in china. Field Crop Res. 2013, 143, 91–97. [Google Scholar] [CrossRef]
  8. Anthony, V.M.; Ferroni, M. Agricultural biotechnology and smallholder farmers in developing countries. Curr. Opin. Biotechnol. 2012, 23, 278–285. [Google Scholar] [CrossRef] [PubMed]
  9. Zhang, W.; Cao, G.; Li, X.; Zhang, H.; Wang, C.; Liu, Q.; Chen, X.; Cui, Z.; Shen, J.; Jiang, R.; et al. Closing yield gaps in china by empowering smallholder farmers. Nature 2016, 537, 671–674. [Google Scholar] [CrossRef] [PubMed]
  10. Zhang, F.; Cui, Z.; Fan, M.; Zhang, W.; Chen, X.; Jiang, R. Integrated soil-crop system management: Reducing environmental risk while increasing crop productivity and improving nutrient use efficiency in China. J. Environ. Qual. 2011, 40, 1051–1057. [Google Scholar] [CrossRef] [PubMed]
  11. Zhang, F.; Cui, Z.; Chen, X.; Ju, X.; Shen, J.; Chen, Q.; Liu, X.; Zhang, W.; Mi, G.; Fan, M.; et al. Integrated nutrient management for food security and environmental quality in China. In Advances in Agronomy; Sparks, D.L., Ed.; Academic Press: Cambridge, MA, USA, 2012; Volume 116, pp. 1–40. [Google Scholar]
  12. Cui, Z.; Chen, X.; Zhang, F. Current nitrogen management status and measures to improve the intensive wheat-maize system in China. Ambio 2010, 39, 376–384. [Google Scholar] [CrossRef] [PubMed]
  13. Cui, Z.; Xu, J.; Shi, L.; Chen, X.; Zhang, F.; Li, J. Field quick testing method of soil nitrate. J. Chin. Agric. Univ. 2005, 10, 10–25. (In Chinese) [Google Scholar]
  14. Huang, J.; Xiang, C.; Jia, X.; Hu, R. Impacts of training on farmers’ nitrogen use in maize production in Shandong, China. J. Soil Water Conserv. 2012, 67, 321–327. [Google Scholar] [CrossRef]
  15. Zhang, F.; Chen, X.; Vitousek, P. An experiment for the world. Nature 2013, 497, 33–35. [Google Scholar] [CrossRef] [PubMed]
  16. Guo, J.H.; Liu, X.J.; Zhang, Y.; Shen, J.L.; Han, W.X.; Zhang, W.F.; Christie, P.; Goulding, K.W.T.; Vitousek, P.M.; Zhang, F.S. Significant acidification in major Chinese croplands. Science 2010, 327, 1008–1010. [Google Scholar] [CrossRef] [PubMed] [Green Version]
  17. Ju, X.T.; Xing, G.X.; Chen, X.P.; Zhang, S.L.; Zhang, L.J.; Liu, X.J.; Cui, Z.L.; Yin, B.; Christie, P.; Zhu, Z.L.; et al. Reducing environmental risk by improving n management in intensive Chinese agricultural systems. Proc. Natl. Acad. Sci. USA 2009, 106, 3041–3046. [Google Scholar] [CrossRef] [PubMed] [Green Version]
  18. Lobell, D.B.; Ortiz-Monasterio, J.I. Regional importance of crop yield constraints: Linking simulation models and geostatistics to interpret spatial patterns. Ecol. Model. 2006, 196, 173–182. [Google Scholar] [CrossRef]
  19. Neumann, K.; Verburg, P.H.; Stehfest, E.; Müller, C. The yield gap of global grain production: A spatial analysis. Agric. Syst. 2010, 103, 316–326. [Google Scholar] [CrossRef]
  20. Affholder, F.; Poeydebat, C.; Corbeels, M.; Scopel, E.; Tittonell, P. The yield gap of major food crops in family agriculture in the tropics: Assessment and analysis through field surveys and modelling. Field Crop Res. 2013, 143, 106–118. [Google Scholar] [CrossRef]
  21. Wang, N.; Jassogne, L.; van Asten, P.J.A.; Mukasa, D.; Wanyama, I.; Kagezi, G.; Giller, K.E. Evaluating coffee yield gaps and important biotic, abiotic, and management factors limiting coffee production in Uganda. Eur. J. Agron. 2015, 63, 1–11. [Google Scholar] [CrossRef]
  22. Woittiez, L.S.; van Wijk, M.T.; Slingerland, M.; van Noordwijk, M.; Giller, K.E. Yield gaps in oil palm: A quantitative review of contributing factors. Eur. J. Agron. 2017, 83, 57–77. [Google Scholar] [CrossRef]
  23. Lobell, D.B.; Ortiz-Monasterio, J.I.; Addams, C.L.; Asner, G.P. Soil, climate, and management impacts on regional wheat productivity in Mexico from remote sensing. Agric. For. Meteorol. 2002, 114, 31–43. [Google Scholar] [CrossRef]
  24. Kucharik, C.J.; Serbin, S.P. Impacts of recent climate change on Wisconsin corn and soybean yield trends. Environ. Res. Lett. 2008, 3, 034003. [Google Scholar] [CrossRef]
  25. Ramankutty, N.; Foley, J.A.; Norman, J.; McSweeney, K. The global distribution of cultivable lands: Current patterns and sensitivity to possible climate change. Glob. Ecol. Biogeogr. 2002, 11, 377–392. [Google Scholar] [CrossRef]
  26. Liu, Z.; Yang, X.; Lin, X.; Hubbard, K.G.; Lv, S.; Wang, J. Maize yield gaps caused by non-controllable, agronomic, and socioeconomic factors in a changing climate of Northeast China. Sci. Total Environ. 2016, 541, 756–764. [Google Scholar] [CrossRef] [PubMed]
  27. Subedi, K.D.; Ma, B.L. Assessment of some major yield-limiting factors on maize production in a humid temperate environment. Field Crop Res. 2009, 110, 21–26. [Google Scholar] [CrossRef]
  28. Tanaka, A.; Saito, K.; Azoma, K.; Kobayashi, K. Factors affecting variation in farm yields of irrigated lowland rice in Southern-Central Benin. Eur. J. Agron. 2013, 44, 46–53. [Google Scholar] [CrossRef]
  29. Wairegi, L.W.I.; van Asten, P.J.A.; Tenywa, M.M.; Bekunda, M.A. Abiotic constraints override biotic constraints in East African highland banana systems. Field Crop Res. 2010, 117, 146–153. [Google Scholar] [CrossRef]
  30. Schmidt, U.; Thoni, H.; Kaupenjohann, M. Using a boundary line approach to analyze N2O flux data from agricultural soils. Nutr. Cycl. Agroecosyst. 2000, 57, 119–129. [Google Scholar] [CrossRef]
  31. Chen, X.; Cui, Z.; Fan, M.; Vitousek, P.; Zhao, M.; Ma, W.; Wang, Z.; Zhang, W.; Yan, X.; Yang, J.; et al. Producing more grain with lower environmental costs. Nature 2014, 514, 486–489. [Google Scholar] [CrossRef] [PubMed]
  32. Webb, R.A. Use of boundary line in analysis of biological data. J. Hortic. Sci. 1972, 47, 309–319. [Google Scholar] [CrossRef]
  33. Elliott, J.A.; Dejong, E. Prediction of field denitrification rates—A boundary-line approach. Soil Sci. Soc. Am. J. 1993, 57, 82–87. [Google Scholar] [CrossRef]
  34. Schnug, E.; Heym, J. Establishing critical values for soil and plant analysis by means of the boundary line development system (bolides). Commun. Soil Sci. Plan. 1996, 27, 2739–2748. [Google Scholar] [CrossRef]
  35. Fermont, A.M.; van Asten, P.J.A.; Tittonell, P.; van Wijk, M.T.; Giller, K.E. Closing the cassava yield gap: An analysis from smallholder farms in east Africa. Field Crop Res. 2009, 112, 24–36. [Google Scholar] [CrossRef]
  36. Jiao, X. Effects of Soil P Supply Intensity and Root Growth Volume on Maize Growth and Strategies for Improving P Use Efficiency in Intensive Cropping System; China Agricultural University: Beijing, China, 2016. (In Chinese) [Google Scholar]
  37. Wu, L.; Cui, Z.; Chen, X.; Zhao, R.; Si, D.; Sun, Y.; Yue, S. High-yield maize production in relation to potassium uptake requirements in China. Agron. J. 2014, 106, 1153–1158. [Google Scholar] [CrossRef]
  38. Casanova, D.; Goudriaan, J.; Bouma, J.; Epema, G.F. Yield gap analysis in relation to soil properties in direct-seeded flooded rice. Geoderma 1999, 91, 191–216. [Google Scholar] [CrossRef]
  39. Liebig, V. The Natural Laws of Husbandry; Walter and Maberly: London, UK, 1863. [Google Scholar]
  40. Shatar, T.M.; McBratney, A.B. Boundary-line analysis of field-scale yield response to soil properties. J. Agric. Sci. 2004, 142, 553–560. [Google Scholar] [CrossRef]
  41. Yang, R.C. Towards understanding and use of mixed-model analysis of agricultural experiments. Can. J. Plant Sci. 2010, 90, 605–627. [Google Scholar] [CrossRef]
  42. Jin, L.; Cui, H.; Li, B.; Zhang, J.; Dong, S.; Liu, P. Effects of integrated agronomic management practices on yield and nitrogen efficiency of summer maize in north China. Field Crop Res. 2012, 134, 30–35. [Google Scholar] [CrossRef]
  43. Ciampitti, I.A.; Vyn, T.J. A comprehensive study of plant density consequences on nitrogen uptake dynamics of maize plants from vegetative to reproductive stages. Field Crop Res. 2011, 121, 2–18. [Google Scholar] [CrossRef]
  44. Lobell, D.B.; Roberts, M.J.; Schlenker, W.; Braun, N.; Little, B.B.; Rejesus, R.M.; Hammer, G.L. Greater sensitivity to drought accompanies maize yield increase in the US Midwest. Science 2014, 344, 516–519. [Google Scholar] [CrossRef] [PubMed]
  45. Li, J.; Xie, R.Z.; Wang, K.R.; Ming, B.; Guo, Y.Q.; Zhang, G.Q.; Li, S.K. Variations in maize dry matter, harvest index, and grain yield with plant density. Agron. J. 2015, 107, 829–834. [Google Scholar] [CrossRef]
  46. Kihara, J.; Tamene, L.D.; Massawe, P.; Bekunda, M. Agronomic survey to assess crop yield, controlling factors and management implications: A case-study of babati in northern Tanzania. Nutr. Cycl. Agroecosyst. 2015, 102, 5–16. [Google Scholar] [CrossRef]
  47. Ayisi, K.K.; Poswall, M.A.T. Grain yield potential of maize and dry bean in a strip intercropping system. Appl. Plant Sci. 1997, 11, 56–58. [Google Scholar]
  48. Amanullah. Rate and timing of nitrogen application influence partial factor productivity and agronomic NUE of maize (Zea mays L.) planted at low and high densities on calcareous soil in northwest Pakistan. J. Plant Nutr. 2016, 39, 683–690. [Google Scholar] [CrossRef]
  49. Gul, B.; Marwat, K.B.; Khan, M.A.; Khan, H. Impact of tillage, plant population and mulches on phenological characters of maize. Pak. J. Bot. 2014, 46, 549–554. [Google Scholar]
  50. Sun, H.; Zhang, X.; Wang, E.; Chen, S.; Shao, L.; Qin, W. Assessing the contribution of weather and management to the annual yield variation of summer maize using APSIM in the north China plain. Field Crop Res. 2016, 194, 94–102. [Google Scholar] [CrossRef]
  51. Meng, Q.; Yue, S.; Hou, P.; Cui, Z.; Chen, X. Improving yield and nitrogen use efficiency simultaneously for maize and wheat in China: A review. Pedosphere 2016, 26, 137–147. [Google Scholar] [CrossRef]
  52. Liang, W.; Carberry, P.; Wang, G.; Lü, R.; Lü, H.; Xia, A. Quantifying the yield gap in wheat-maize cropping systems of the Hebei plain, China. Field Crop Res. 2011, 124, 180–185. [Google Scholar] [CrossRef]
  53. Jia, X.; Huang, J.; Xiang, C.; Hou, L.; Zhang, F.; Chen, X.; Cui, Z.; Bergmann, H. Farmer’s adoption of improved nitrogen management strategies in maize production in China: An experimental knowledge training. J. Integr. Agric. 2013, 12, 364–373. [Google Scholar] [CrossRef]
  54. Hou, P.; Gao, Q.; Xie, R.; Li, S.; Meng, Q.; Kirkby, E.A.; Römheld, V.; Müller, T.; Zhang, F.; Cui, Z.; et al. Grain yields in relation to n requirement: Optimizing nitrogen management for spring maize grown in China. Field Crop Res. 2012, 129, 1–6. [Google Scholar] [CrossRef]
  55. Sinclair, T.R.; Rufty, T.W. Nitrogen and water resources commonly limit crop yield increases, not necessarily plant genetics. Glob. Food Secur. 2012, 1, 94–98. [Google Scholar] [CrossRef]
  56. Yi, Z.; Wang, P.; Chen, P.; Tu, N. Effect of different types of nitrogen fertilizer on nitrogen absorption and utilization in summer maize (Zea mays L.). Plant Nutr. Fertil. Sci. 2008, 14, 472–478. [Google Scholar]
  57. Beza, E.; Silva, J.V.; Kooistra, L.; Reidsma, P. Review of yield gap explaining factors and opportunities for alternative data collection approaches. Eur. J. Agron. 2017, 82, 206–222. [Google Scholar] [CrossRef]
  58. Cui, Z.; Zhang, F.; Chen, X.; Miao, Y.; Li, J.; Shi, L.; Xu, J.; Ye, Y.; Liu, C.; Yang, Z.; et al. On-farm evaluation of an in-season nitrogen management strategy based on soil Nmin test. Field Crop Res. 2008, 105, 48–55. [Google Scholar] [CrossRef]
  59. Wang, T.; Lu, C.; Yu, B. Production potential and yield gaps of summer maize in the Beijing-Tianjin-Hebei region. J. Geogr. Sci. 2011, 21, 677–688. [Google Scholar] [CrossRef]
  60. An, N.; Wei, W.; Qiao, L.; Zhang, F.; Christie, P.; Jiang, R.; Dobermann, A.; Goulding, K.W.T.; Fan, J.; Fan, M. Agronomic and environmental causes of yield and nitrogen use efficiency gaps in Chinese rice farming systems. Eur. J. Agron. 2018, 93, 40–49. [Google Scholar] [CrossRef]
  61. Zhao, P.; Cao, G.; Zhao, Y.; Zhang, H.; Chen, X.; Li, X.; Cui, Z. Training and organization programs increases maize yield and nitrogen-use efficiency in smallholder agriculture in China. Agron. J. 2016, 108, 1944–1950. [Google Scholar] [CrossRef]
  62. Ma, L.; Feng, S.; Reidsma, P.; Qu, F.; Heerink, N. Identifying entry points to improve fertilizer use efficiency in Taihu basin, China. Land Use Policy 2014, 37, 52–59. [Google Scholar] [CrossRef]
  63. Wang, J.; Chen, K.Z.; Das Gupta, S.; Huang, Z. Is small still beautiful? A comparative study of rice farm size and productivity in China and India. China Agric. Econ. Rev. 2015, 7, 484–509. [Google Scholar] [CrossRef]
  64. Tittonell, P.; Giller, K.E. When yield gaps are poverty traps: The paradigm of ecological intensification in African smallholder agriculture. Field Crop Res. 2013, 143, 76–90. [Google Scholar] [CrossRef]
  65. Cui, Z.; Wang, G.; Yue, S.; Wu, L.; Zhang, W.; Zhang, F.; Chen, X. Closing the n-use efficiency gap to achieve food and environmental security. Environ. Sci. Technol. 2014, 48, 5780–5787. [Google Scholar] [CrossRef] [PubMed]
  66. Grassini, P.; Thorburn, J.; Burr, C.; Cassman, K.G. High-yield irrigated maize in the western U.S. Corn belt: I. On-farm yield, yield potential, and impact of agronomic practices. Field Crop Res. 2011, 120, 142–150. [Google Scholar] [CrossRef]
  67. Chen, X.; Cui, Z.; Vitousek, P.M.; Cassman, K.G.; Matson, P.A.; Bai, J.; Meng, Q.; Hou, P.; Yue, S.; Romheld, V.; et al. Integrated soil-crop system management for food security. Proc. Natl. Acad. Sci. USA 2011, 108, 6399–6404. [Google Scholar] [CrossRef] [PubMed]
Figure 1. (a) Location of the study sites in the North China Plain (NCP)—red circles; (b) an example of the distribution of monitored fields in one village of Laoling county; the red star is the location of the Laoling Science and Technology Backyard (STB). Residential areas are not shown.
Sustainability 10 00363 g001
Figure 2. Relationship between summer maize yield and plant density in Laoling in 2015. The curved black line is the boundary line; the values of the upper, middle, and lower horizontal lines are the attainable yield, predicted yield, and actual yield on farms, respectively. The total yield gap is the difference between the attainable yield and the actual yield; the explainable yield gap is the difference between the attainable yield and the predicted yield; and the remainder is the unexplainable yield gap.
Sustainability 10 00363 g002
Figure 3. Box plots of the actual summer maize yields (left) and nitrogen use efficiencies (PFPN, grain yield per unit N fertilizer, (right) obtained by farmers during 2015–2016 at the three sites. For each site, the three black horizontal lines in the boxes indicate the 75th percentile (top), median (solid line across boxes), and 25th percentile summer maize yield (bottom); the upper and lower bars outside the boxes show the 90% and 10% summer maize yields. The red dotted lines across the boxes are the mean yields of summer maize. The values followed by different letters in each box indicate significant differences at p ≤ 0.01 by the Duncan’s test.
Sustainability 10 00363 g003
Figure 4. Relationship between the total yield gap and total PFPN gap of summer maize for all three sites (a) and in Laoling (b), Xushui (c), and Quzhou (d). The lines represent trend lines.
Sustainability 10 00363 g004
Figure 5. Distribution of yield and PFPN on farms at Laoling (a), Xushui (b), and Quzhou (c). The horizontal and vertical lines are standards for high yield and high efficiency, respectively. For each site, sector (I) represents a high yield and low efficiency (HL), sector (II) represents high yield and high efficiency (HH), sector (III) represents low yield and high efficiency (LH), and sector (IV) represents low yield and low efficiency (LL).
Sustainability 10 00363 g005
Figure 6. The corresponding proportion of fields in which management factors were the most important factors limiting the yield (a) and PFPN (b) for the Laoling, Xushui, and Quzhou sites of the NCP in 2015–2016.
Sustainability 10 00363 g006
Figure 7. Explainable yield gap (a) and explainable PFPN gap (b) attributed to management factors, expressed as a proportion of the explainable gap to the total gap for the Laoling, Xushui, and Quzhou sites of the NCP in 2015–2016. The sum of the nine factors was regarded as 100%.
Sustainability 10 00363 g007
Table 1. Characteristics of the study sites, including the per capita arable land area, annual rainfall, and soil nutrient content.
RegionPer Capita Arable
Land Area
Annual RainfallSoil Nutrient Content *
Total NSOM **Olsen-PAvailable PotassiumpH
hammg kg−1g kg−1mg kg−1mg kg−1
Laoling0.125271.1516.621.0147.97.31
Xushui0.095470.8610.619.4114.17.70
Quzhou0.085561.0413.620.4103.28.21
* Soil properties refer to the top 0–20 cm; ** SOM: soil organic matter.
Table 2. Variation of summer maize yield and PFPN across fields, years, and sites.
VariationsYieldPFPN
SD * (t ha−1)CV ** (%)SD (kg ha−1)CV (%)
NCP1.0410.09.018.0
Laoling0.242.69.122.9
Xushui0.181.72.13.9
Quzhou1.038.98.314.6
Laoling20151.2113.28.224.6
20161.3714.417.938.7
Xushui20151.2311.613.624.0
20161.1411.010.018.7
Quzhou20151.1510.617.334.2
20161.068.618.229.2
* SD: standard deviation. ** CV: variation coefficient.
Table 3. Management practices of high yield and high PFPN (HH) and low yield and low PFPN (LL) farmers at the study sites. N: Nitrogen.
LaolingXushuiQuzhou
CategoriesHHLLHHLLHHLL
Numbers513415435346
Percentage (%)3.183.71645.729.125.3
Density (plants ha−1)67,019.4a *59,709.7bc63,550.8ab56,272.3c58,319.1bc55,681.0c
N amount (kg ha−1)164.6c274.7a163.1c215.2b159.5c262.7a
P2O5 amount (kg ha−1)45.5a54.5a56.1a68.8a53.3a58.0a
K2O amount (kg ha−1)45.5c43.9c71.0ab75.4a51.7c57.4bc
Sowing date (June)13.8a13.8a15.7a15.8a14.3a15.8a
Irrigation times1.0ab1.5a0.9ab0.7b0.5b1.0ab
Yield (t ha−1)11.9a8.99c11.6a9.59bc12.2a10.0b
PFPN (kg kg−1)73.5a34.3c71.8a45.6b77.2a40.2bc
* Values followed by different letters within a row mean significant differences at p ≤ 0.01.
Table 4. Results of Proc Mixed Model analysis of interactions between management factors, yield, and PFPN.
FactorsLevelDegree of FreedomYield (t h−1)PFPN (kg kg−1)
Parameter Estimate95% Confidencep-ValuesParameter Estimate95% Confidencep-Values
LowerUpperLowerUpper
Intercept 13.9212.3415.51 62.5748.4876.65
Year2015243−1.23−1.60−0.86-−9.17−12.43−5.91-
20161910.00---0.00---
SiteLaoling159−2.71−3.22−2.21<0.0001−18.79−23.29−14.30<0.0001
Xushui93−1.38−1.76−0.99<0.0001-0.93−4.342.490.5952
Quzhou1810.00---0.00---
DensityLow *58−1.38−2.02−0.73<0.00010.08−5.645.800.9785
Medium279−0.91−1.37−0.45<0.0001−0.89−4.973.190.6682
High960.00---0.00---
N amountLow460.04−0.630.700.916848.6842.7554.62<0.0001
Medium232−0.20−0.700.300.436623.0918.6227.56<0.0001
High1550.00---0.000.000.00-
P2O5 amountLow1610.47−0.131.060.1243−2.29−7.562.980.3943
Medium2590.45−0.161.050.1465−5.88−11.23−0.540.0315
High130.00---0.00---
K2O amountLow830.24−0.801.290.64881.67−7.6310.970.7249
Medium3470.34−0.681.360.51063.40−5.6612.460.4629
High30.00---0.00---
Sowing dateLow71.170.302.050.00897.49−0.2715.260.0593
Medium3730.420.060.770.0216−2.21−5.350.940.1693
High530.00---0.00---
Irrigation timesLow115−0.85−1.38−0.310.0021−5.97−10.73−1.210.0144
Medium224−0.67−1.03−0.300.0004−3.19−6.440.050.0543
High940.00---0.00---
Insecticide timesLow340.13−0.400.670.6249−1.72−6.513.070.4826
Medium2970.09−0.280.450.6414−2.25−5.490.990.1744
High1020.00---0.00---
Herbicide timesLow321−0.76−1.22−0.300.0013−2.30−6.411.800.2724
Medium1130.00---0.00---
Bactericide timesLow123−0.98−1.61−0.350.0023−0.79−6.354.770.7808
Medium280−0.98−1.55−0.410.0008−7.22−12.27−2.180.0052
High300.00---0.00---
Density *NLow–Low6−0.45−1.640.740.4567−2.04−12.608.520.7052
Low–Medium300.02−0.790.820.9669−11.15−18.29−4.000.0024
Low–High200.00---0.00---
Medium–Low260.50−0.311.310.2268−5.07−12.252.110.1671
Medium–Medium1490.54−0.031.110.064−6.28−11.35−1.220.0155
Medium–High1020.00---0.00---
High–Low140.00---0.00---
High–Medium500.00---0.00---
High–High 300.00---0.00---
* In order to conduct analysis by Proc Mixed Model, the management practices were divided into several groups to create levels of the variables.

