Air Pollution Inequality and Its Sources in SO2 and NOX Emissions among Chinese Provinces from 2006 to 2015


1
School of Public Affairs, University of Science and Technology of China, Hefei 230026, China
2
School of Management, University of Science and Technology of China, Hefei 230026, China
*
Author to whom correspondence should be addressed.
Sustainability 2018, 10(2), 367; https://doi.org/10.3390/su10020367
Submission received: 30 November 2017
/
Revised: 21 December 2017
/
Accepted: 18 January 2018
/
Published: 31 January 2018
Abstract
:This paper investigates inequality in SO2 and NOX emissions, by observing their extraordinary levels and uneven distribution in China during the period of the 11th and 12th Five-Year Plans (FYPs, 2006–2015). This provincial and regional analysis utilizing the Theil index and Kaya factors help us to find the trajectory of inequality and its primary sources. Based on our analysis, we conclude the driving factors behind emissions inequalities are as follows. There are four economic factors of per capita SO2 emission: SO2 emission intensity of coal consumption, coal intensity of power generation, power intensity of GDP, and per capita GDP. Additionally, there are four urban development factors of per capita NOX emission: NOX emission intensity of gasoline consumption, proportion of gasoline vehicles, vehicle use in urban population, and urbanization rate. The SO2 emission results represent an increase of 6% in overall inequality where the inequality of power intensity of GDP is the main contributor. In terms of NOX emission, the 3% growth in total inequality is related to the high effect of NOX emission intensity of gasoline consumption. We also examine the effect of other factors affecting the trajectory of inequalities. To apply these results in practice, we compare the 11th and 12th FYPs and give some policy suggestions.
1. Introduction
Air pollution in China has grown up to be a serious problem for both the Chinese people and government since it disturbs sustainable development along with threatening people’s health [1]. The structure of industry, energy consumption, and vehicular emissions can affect the regional air quality in China [2]. Additionally, economic growth, high population density, and rapid urbanization have been found to be the main reasons behind air pollution. According to the report of Clean Air Asia on China Air [3], the air quality in Chinese cities has improved but differentially among regions. Air pollution inequality is rising across regions in China, and the more heavily polluted regions suffer more health damage [4]. To parallel recent studies on examining air pollution inequality in the US [5,6,7,8] and Europe [9,10,11,12], it is important to bring the equal opportunity for people to have the healthy and clean environment [7]. Therefore, it is worthy to investigate emission disparities in China regions and what trends have occurred in air pollution inequality in recent years. We demonstrate that measuring emission inequality and its sources can be considered as one way to assess the policy impacts. The assessment helps policy makers to find the vulnerable regions and focus their policy agenda to improve air quality [7]. Therefore, we believe that identifying the perceived inequality can help to alleviate it and result in a better clean air policy to make a sustainable society in China (see, e.g., [13]).
To understand the main driving factors behind air pollution, we utilize the Kaya identity [14] which decomposes the per capita emission into three factors: emission intensity, energy intensity, and per capita income. The Kaya identity has been widely used in CO2 emission studies [15,16,17]. For instance, Rafaj et al. [15] applied Kaya factors to calculate the emission trends of SO2, NOX (NO and NO2 are both denoted by NOX since they can easily be converted to each other), and CO2 in European countries. Whereas they used same driving factors for different emissions, here we differ from previous studies by considering SO2 and NOX emissions separately. We initially determine the most important economic and urban development factors for SO2 and NOX emissions. These factors reflect the particular characteristics of SO2 and NOX emissions in China according to the body of literature (see Section 3.1). We believe these factors can well measure inequality because previous studies have investigated their impact on the different emission trends in China. Then, we use the Theil index [19], as a well-known inequality indicator to measure inequality and its decomposed factors according to the study of Duro and Padilla [16]. Using Theil index, we can weigh up Chinese provinces by their population and calculate between-region and within-region inequality to show the regional variation.
In view of the above points, this paper tries to answer the following questions: First, what is the extent of air pollution inequality in China and how can we measure it both on the provincial and regional level? Second, what driving factors affect air pollution inequality? Accordingly, we selected 30 Chinese provinces during the period of the 11th and 12th Five-Year Plans (2006–2015) to investigate the air pollution inequality. We choose a provincial level for inequality analysis to find the provincial divergence and its contribution to total inequality. Meanwhile, we can also consider all provinces in 3 regions: eastern, central, and western, and discuss policy implications for regional planning. After the data analysis, we introduce sources of inequality for government and policy makers.
2. Literature Review
Air Pollution in China
As we examined the literature in the field of the relation between different emissions and inequality, we considered SO2 and NOX emissions as two important pollutants for the following reasons:
The Highest Emission Level. In 2010, China was recorded as the largest producer of SO2 emission in the world, accounting for about 30% of global emission [20]. According to the China Clean Air Policy briefings of the 12th FYP [1], China has the highest level of SO2 and NOX emissions in the world and this generates a significant obstacle to Chinese sustainable development.
The Health Impact. Both NOX and SO2 emissions are precursors of PM2.5 [21,22] which is prominently varied in different areas and poses considerable challenges for the future [2]. PM2.5 affects humans by causing premature death and respiratory disease [23]. Xia et al. [24] showed the economic cost resulted from these diseases in the Chinese labor force accounted for around 1.1% of GDP in 2007. NOX and SO2 emissions cause acidification which leads to damaged crops and plants and affects the quality of water and soil [25] through which their harmful effects result in serious human health outcomes.
Inequality Trend. Many recent types of research efforts to use SO2 emission as the pollution indicator caused by combustion to measure disproportionate emission [10,26,27]. Dong et al. [28] mentioned that SO2 emission is unequally exposed in the different regions in China due to the uneven evolution of industrial activities. The NOX emission pattern is a well-known pollutant proxy used in studies because it is mostly caused by traffic and urbanization, although people in different social classes or groups are exposed to it unequally [11,12,26,29,30,31]. Gu et al. [32] found the regional disparity in NOX emission trend in China was that less-developed provinces suffer more growth rate of NOX emission than rich provinces due to the lack of strict environmental regulation to control emission in the less-developed provinces.
Figure 1 illustrates SO2 emission and its per capita value decreased in China from 2006 to 2015 according to the targets of the 11th and 12th FYPs (The national target of 11th FYP to reduce 10% of SO2 emission was achieved [1]. Also, China surpassed the national targets of the 12th FYP by 18% reduction in SO2 emission [18].) (see [18]). The total NOX emission and its per capita kept rising in the period of the 11th FYP but went down in the period 12th FYP (In 2015, China fulfilled the national targets of the 12th FYP by 18.6% reduction in NOX emission [18].) (Figure 1).
Despite the decrease of SO2 and NOX emissions during the period of the 12th FYP, there is a significant regional disparity in both emissions which needs more attention to improve the local air quality [28].
3. Data and Methods
3.1. Driving Factors behind SO2 and NOX Emissions in China
3.1.1. Economic Disparity and SO2 Emission
Economic growth accompanied by industrialization has been identified as one of the principal sources of SO2 emission in China [33,34]. It is also known that, in China, regional disparity is a primary barrier to control of SO2 emission from industrial sources [35]. Zhao et al. [4] argued rapid Chinese economic growth leads to environmental inequality due to the transfer of heavy industries from urban to rural areas. Thus, these industries deposit more pollution in the rural environment and threaten the health of nearby residents.
The Environmental Kuznet Curve (EKC) considered in the study of Grossman and Krueger [36] is the first theory that implied the relationship between income growth and air pollution could be modeled by an inverted U-shaped curve. The EKC have shown that economic growth initially imposes environmental degradation, but after the turning point—a certain level of economic growth—the environmental quality starts to improve.
Using this theory, Wang et al. [37] recognized an inverted-U shaped curve for SO2 emission in China. It means that China economic development could decrease SO2 emission while the income keeps increasing. Llorca and Meunié [38] showed that growth of per capita GDP increases SO2 emissions in China. In 2015, the share of industry in total energy consumption was 68%, which was mostly attributed to coal [39]. Among industrial sectors, power plants contribute the largest amount of SO2 emission, about 60% in China [20,35,40,41,42]. Power generation has been dominated by coal burning techniques [20,40,43,44,45,46] which have been proven to produce serious SO2 emission in China [28,37]. Power generation is an original driver for Chinese economic growth and has increased China’s GDP for the past three decades [47,48,49]. Accordingly, we consider the proportion of power generation in GDP as a driving factor for SO2 emission.
By the above arguments, economic structure affects SO2 emission through the coal consumption, power generation, and GDP (see Table 1) which are distributed unequally among provinces due to the rapid economic growth in China. In this study, based on Kaya factors, we view per capita SO2 emission as a product of SO2 emission intensity of coal consumption, coal intensity of power generation, power intensity of GDP, and per capita GDP.
3.1.2. Urban Development Disparity and NOX Emission
Urban development leads to environmental inequality because of the rapid increase of the urban population and the influx of rural immigrants into cities [27]. Fecht et al. [12] indicated urbanization as one important cause of air pollution inequality in exposure to NO2 in England and Netherlands. Teixidó-Figueras et al. [50] consider urbanization as one of the factors which create global environmental inequality because of activities requiring more resources. Knill et al. [51] found that rapid urbanization can increase NOX emission in OECD countries. According to Lung et al. [52], the high-speed urbanization trend in Asia is an important factor in the production of air pollution due to traffic jams and increased energy consumption, which leads to inequality among people with different socio-economic levels. They argued for environmental justice under the socioeconomic status and urbanization levels in Taiwan community.
Urbanization growth has increased the vehicle population, which further increases NOX emission in China [53,54,55]. For example, the nitrogen pattern is highly attributed to urbanization in Shanghai [56]. Deng et al. [57] demonstrated that NOX as a vehicle emission should be controlled in Chinese megacities. Therefore, aside from urban development, the other important source of NOX emission is transportation in China [28,34,42,45,53,58]. According to data published in the China Statistical Yearbook on Environment [39], the total national emission of NOX caused by motor vehicles increased by 14% from 2011 to 2014. Zhao et al. [59] showed the historical trend of NOX emissions in China and mentioned transport as one of the main NOX emission contributors; stating that a remarkable 25.4% of the total emission came from on-road vehicles in 2010. Based on their result, it is projected to increase the share of transportation in NOX emission up to 2030 under the current legislative status of China. Yao et al. [60] concluded that controlling vehicular emission could decrease NOX emission in Beijing. Motor vehicles increased 12.5% of NOX emission in China from 2006 to 2010; the oil consumption and vehicular emissions both increased in most provinces [61]. Liu et al. [62] showed that stricter regulation for vehicles-such as Euro IV standard and the retirement of old vehicles—has affected the reduction of NOX emission in Chinese urban areas after 2012. To measure vehicle population, we consider the number of urban vehicles (passenger vehicles, trucks, and other vehicles) which have a registered license. Gasoline consumption by vehicles has dramatically increased in proportion to the growth of vehicle population, which results in more NOX emission [55,63]. The China Vehicle Emission Control Annual Report [64] announced the gasoline-fueled vehicles accounted for 81.3% of motor vehicles and were responsible for 39% of NOX emission by the end of 2009. In 2014, the share of gasoline-fueled vehicles among total vehicles increased by 84.7% [65]. Therefore, we consider gasoline consumption as a measure of energy consumption most related to vehicles in urban areas. So, Gasoline consumption, vehicles, and urban population affect the level of NOX emission in China (see Table 1). For this reason, and according to the structure of Kaya identity, we decompose per capita NOX emission into four driving factors: NOX emission intensity of gasoline consumption, proportion of gasoline vehicles, vehicle use in urban population, and urbanization rate.
3.2. Data Source
All data are available from the yearbook of National Bureau of Statistics of China (NBS) [39] by region from 2006 to 2015. For NOX emission, there are missing data by province from 2006 to 2010 which was obtained from Annual Report on Environmental Statistics [66]. We used Excel software for all computations.
The study area includes 30 provinces (including provincial-level entities such as Beijing) in 3 regions (see Figure 2): the eastern region (Beijing, Tianjin, Hebei, Liaoning, Shandong, Jiangsu, Zhejiang, Shanghai, Fujian, Guangdong, and Hainan), central region (Heilongjiang, Jilin, Shanxi, Henan, Anhui, Hubei, Hunan, and Jiangxi), and western region (Inner Mongolia, Ningxia, Shaanxi, Gansu, Qinghai, Sichuan, Chongqing, Yunnan, Guizhou, Guangxi, and Xinjiang). We removed Tibet from the list due to missing data on coal and gasoline consumption.
3.3. The Empirical Methodology
Decomposition analysis is a suitable method to understand the driving factors of energy and the environmental problem [67,68]. In our case, we use the Kaya identity [14] as a proper measurement tool to recognize the main driving factors of pollution. Based on this tool, the per capita emission is equal to the product of three factors: emission intensity, energy intensity, and per capita income. To continue the analysis, the Theil index [19] as a generalized entropy index has been proposed to measure inequality. According to Bourguignon [69], it is the only population-weighted index which can measure inequality by groups of the sample; it provides differentiable, symmetric, and invariant criteria; and it supports Pigou–Dalton condition. After the study of Theil [19] in the field of income inequality, the vast literature of environmental inequality studies has emerged. Some of these studies have applied the Theil index to measure CO2 emission inequality globally (see, e.g., [50,70,71,72,73,74]), exposure to industrial pollution [7], or health disparity [75].
The lower limit of the Thiel index is zero which means an equitable situation, and the upper depends on the sample size and indicates a higher inequality level.
The Theil index is defined as follows:
where defines Theil index, is the share of the population of province in the national population, represents the average total per capita emission of SO2 or NOX, and shows the per capita emission of province in each period year.
The expression indicates the contribution of each province in total inequality, which is defined as the Theil element [76]. A positive value reflects a positive contribution and expresses that the per capita emission of the province is lower than the national average, and negative values mean the opposite.
By using the Kaya identity concept and applying the particular characteristics of SO2 and NOX emissions in China, we calculate the per capita emission of SO2 and NOX as follows:
where and refer to per capita emissions of each province and means population. , , , , , and respectively denote coal consumption, power generation, gross domestic product, gasoline consumption, urban vehicles, and urban population.
For both Equations (2) and (3) we can consider the equilibrium below:
is per capita emission of SO2 or NOX, and are the multiplying fractions in Equations (2) and (3) respectively.
We propose four hypothetical vectors as follows:
where , , , and refer to the national average amount of each factor. Given these vectors, we can define the per capita emission of each component in the province as a vector with one variable factor and 3 constant factors.
Duro and Padilla [16] were the first to mix the Theil index and Kaya factors to measure international CO2 emission inequality to find its sources. Then other papers utilized the Theil index and Kaya factors for CO2 emission by different approaches in Europe or world (see, e.g., [17,72,77]).
Concerning Duro and Padilla’s [16] formula and Remuzgo and Sarabia’s [17] expanded method, the inequality product of per capita SO2 and NOX emissions can be calculated as follows:
Here,, , , and are inequality measurements for contributors , , , and respectively. Also, is the interaction between and other contributors of , , and ; and are analogous.
These interaction terms are correlated factors which can be defined as follows:
In terms of SO2 emission, is the covariance between SO2 emission intensity of coal consumption and the per capita coal consumption; measures the covariance between coal intensity of power generation and the per capita power generation; and finally, defines the covariance between the power intensity of GDP and the per capita GDP. In terms of NOX emission, , , and can be defined respectively as follows: The covariance between NOX emission intensity of gasoline consumption and the per capita gasoline consumption, the covariance between proportion of gasoline vehicles and the per capita urban vehicles, and the covariance between the vehicle use in urban population and the urbanization rate.
Furthermore, we can decompose emission inequality into within-region and between-region inequality, if we consider regions of China as the unit of inequality analysis.
Therefore, we continue the analysis with the following:
where is the within-region inequality and is the between-region inequality. displays the region population share in the national population. denotes the internal inequality in the region and refers to the emission average in region . Also, is the number of regions.
and can both be applied to our decomposed components to measure the sources of within-region and between-region inequality.
4. Results and Discussion
4.1. SO2 Emission Inequality
Figure 3 shows China’s SO2 emission inequality (Theil index) and represents an increase of 6% in overall inequality from 2006 to 2015. In spite of achieving the targets of the 11th and 12th FYPs to reduce the SO2 emission [18], the Theil index reveals a slightly increasing trajectory of between-province inequality during this period. During the period of the 11th FYP, 9.2% decline in total inequality occurred but during the period of the 12th FYP, it increased by about 17%. The main reason for this growth after 2010 is related to the power intensity of GDP ().
There is a divergence between developed and developing provinces when they increase their GDP as a result of increasing power production. In the most-developed provinces, GDP increase is dominated by tertiary industry-the service sector, which brings good air quality and decreases the per capita SO2 emission due to the non-industrial activity. For developing provinces, however, GDP increases primarily because of industrial activity enabled by increased power generation, so the emission situation becomes worse. The developed provinces have better improvement in SO2 emission reduction while increasing their GDP. This result is similar to Wang et al. [37] who proved the inverted U-shaped curve for SO2 emission and economic growth in China.
The proportion of power production generated by coal () increased over the study period in China. In fact, the coal-burning plants to generate power have been unequally placed into less-developed provinces. More than 80% of energy consumption is related to coal in some provinces such as Inner Mongolia, Ningxia, Guizhou, and Shaanxi, all of which are located in the western region [2]. However, the developed provinces have more electrical demand and are shifting to use renewable energy instead of coal [78].
Inequality in per capita GDP () and SO2 emission intensity of coal consumption () show an insignificant impact on the overall inequality; both have declined by about 37%. The first phenomenon does not agree with published works which confirm a substantial link between income inequality and CO2 emission in China [79] and worldwide [16].
The efforts of the Chinese government in the 11th and 12th FYPs to alleviate income inequality may have contributed to equalizing the affluence between provinces. It seems that China could bring the equal opportunities for all provinces to strengthen their economic status, although it has ignored the essential balance between the economic development and environmental protection in some western provinces. The inequality in SO2 emission intensity of coal consumption is of particular interest due to the control of total coal consumption and its replacement with clean energy which could decrease SO2 emission [2]. Additionally, the utility of advanced technology and the emission standards for coal-fired power plants could aid in decreasing the SO2 emission.
Looking at the importance of interaction terms, we explain some notable points (see Table 2) as follows. The contribution of —the interaction factor between the power intensity of GDP and per capita GDP—increased 29% from 2006 to 2015. This indicates that the provinces which generate more power intensity of GDP, appear to have a higher income. This high positive correlation occurred especially in developing provinces. The measures and have the lowest contribution in total inequality during the whole period. The former measures the positive correlation between SO2 emission intensity of coal consumption and per capita coal consumption, so the low contribution means that the provinces which consume more per capita coal, emit more SO2. The latter stands for the negative covariance between coal intensity of power generation and per capita power generation and its low contribution says that if a province has a high coal intensity of power generation, its tendency to generate more per capita power is lower than a province with less intensity.
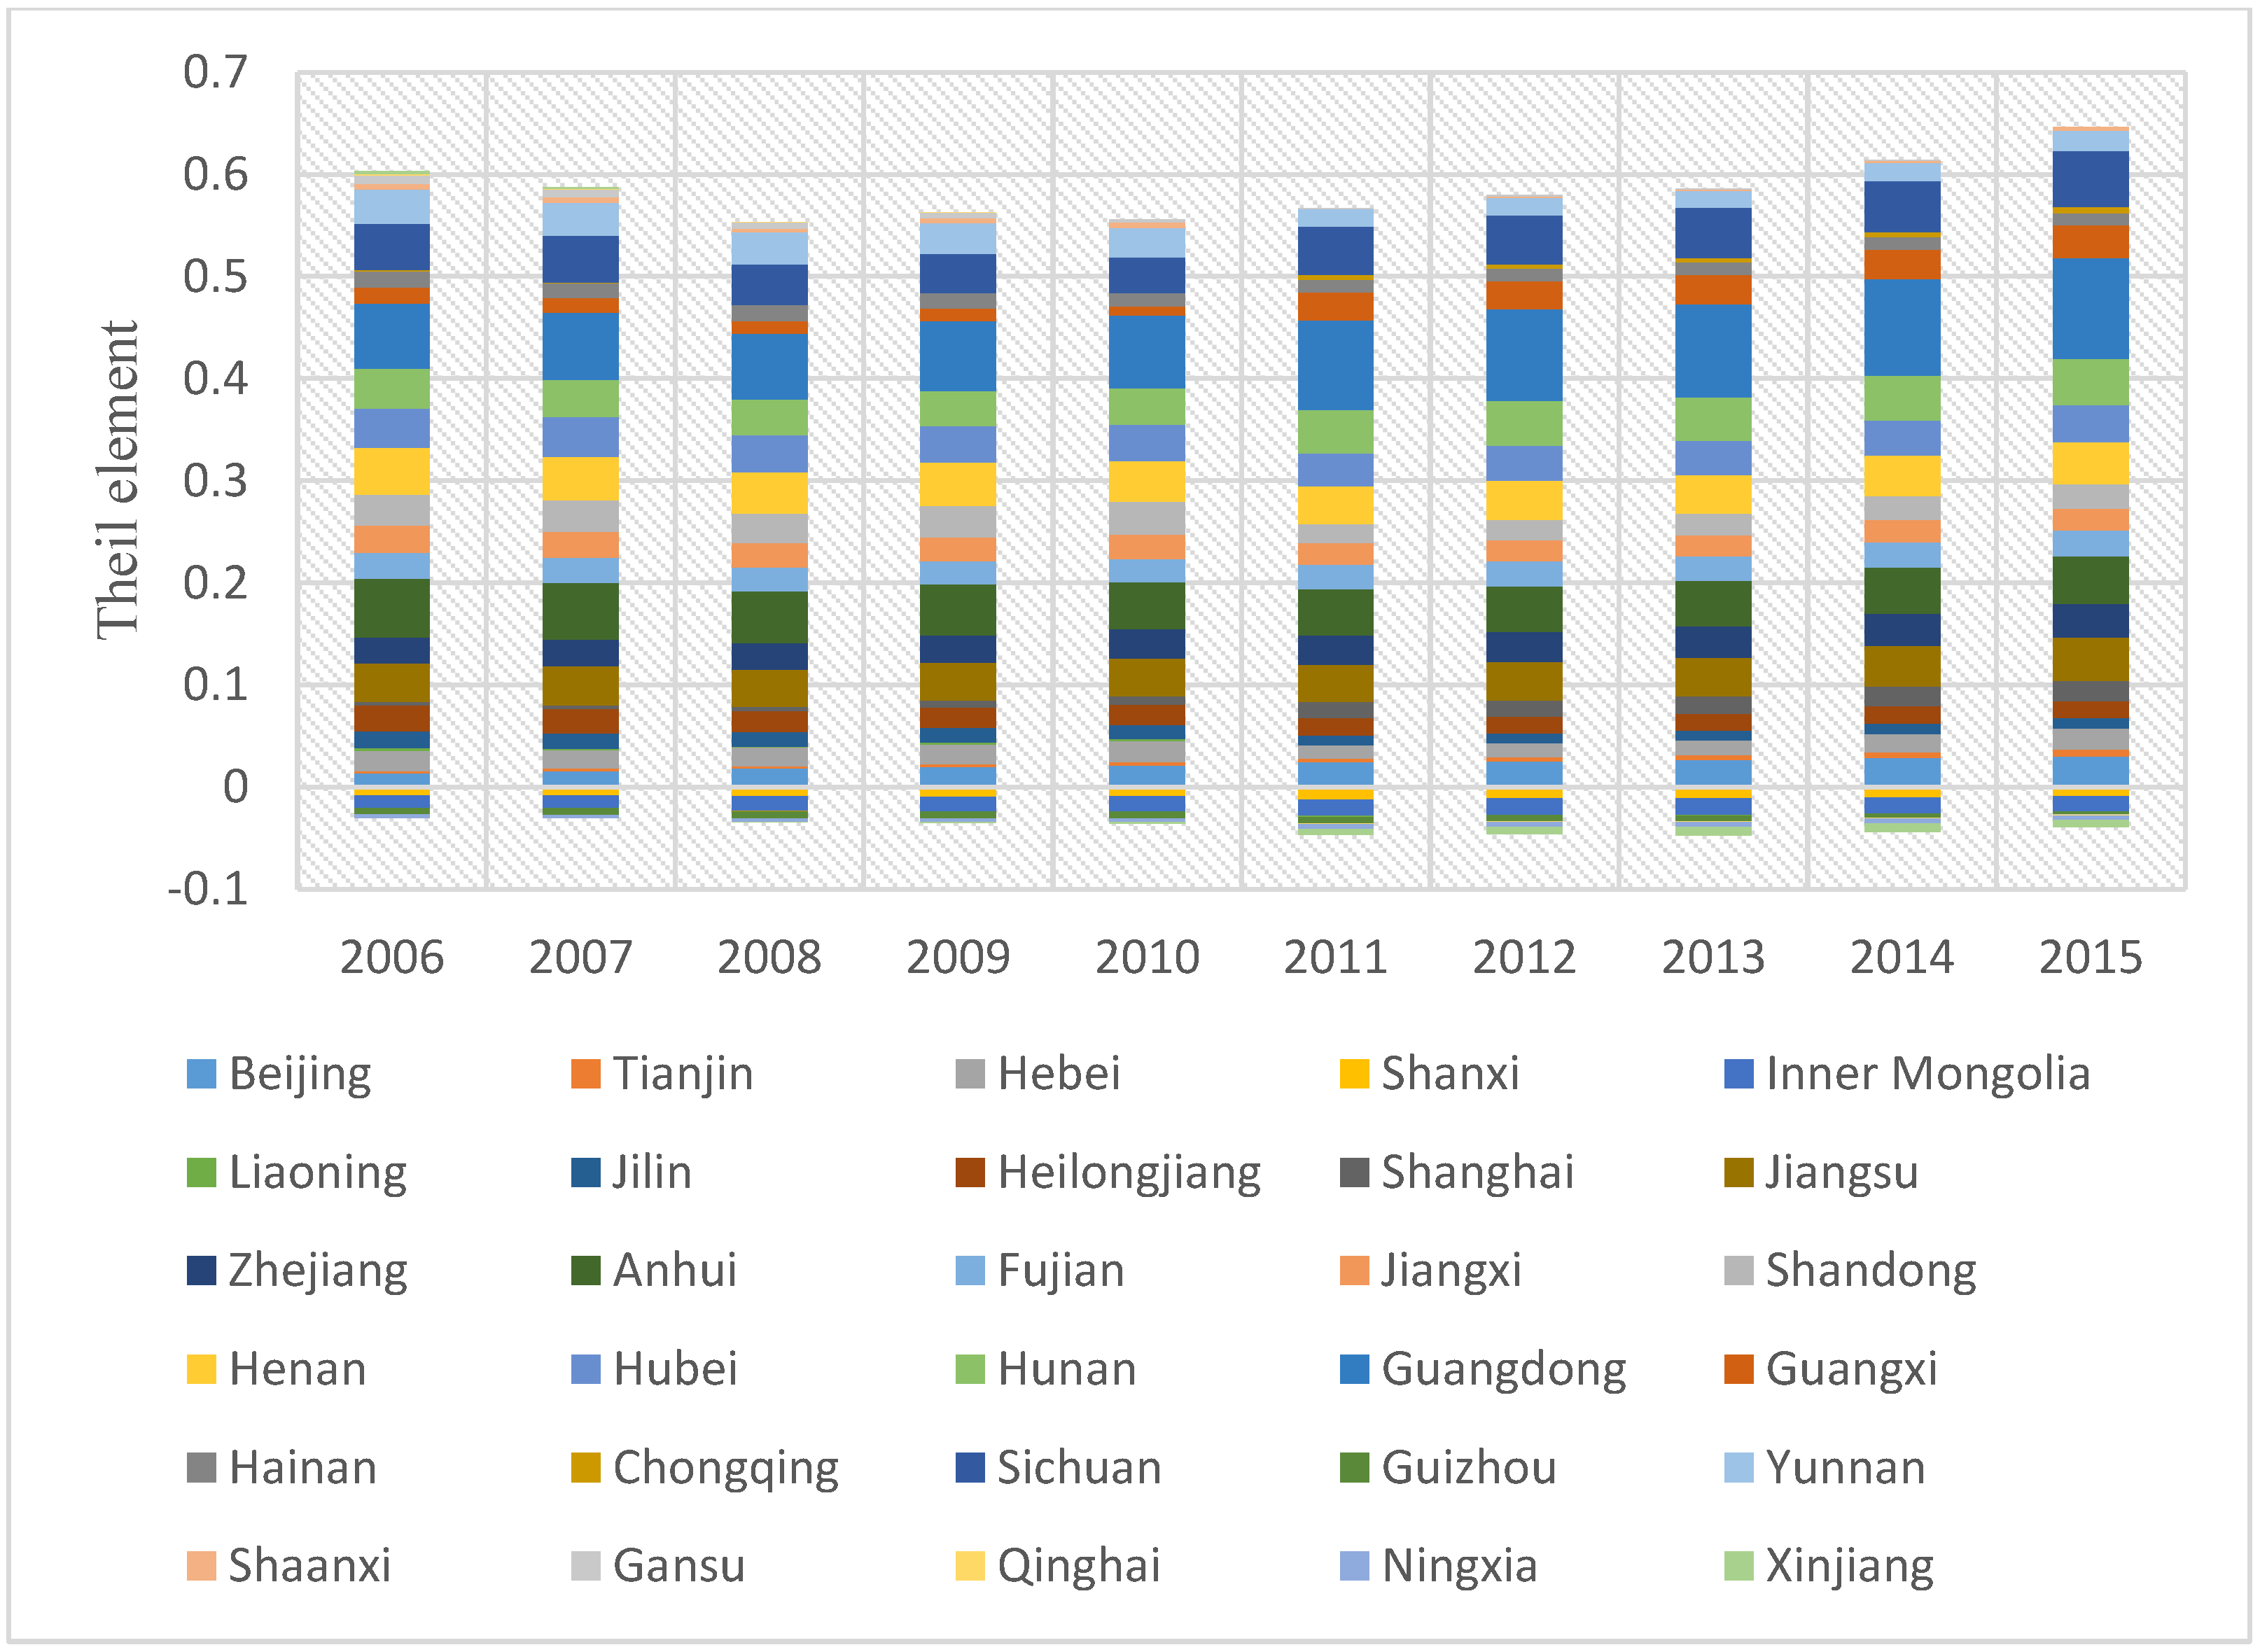
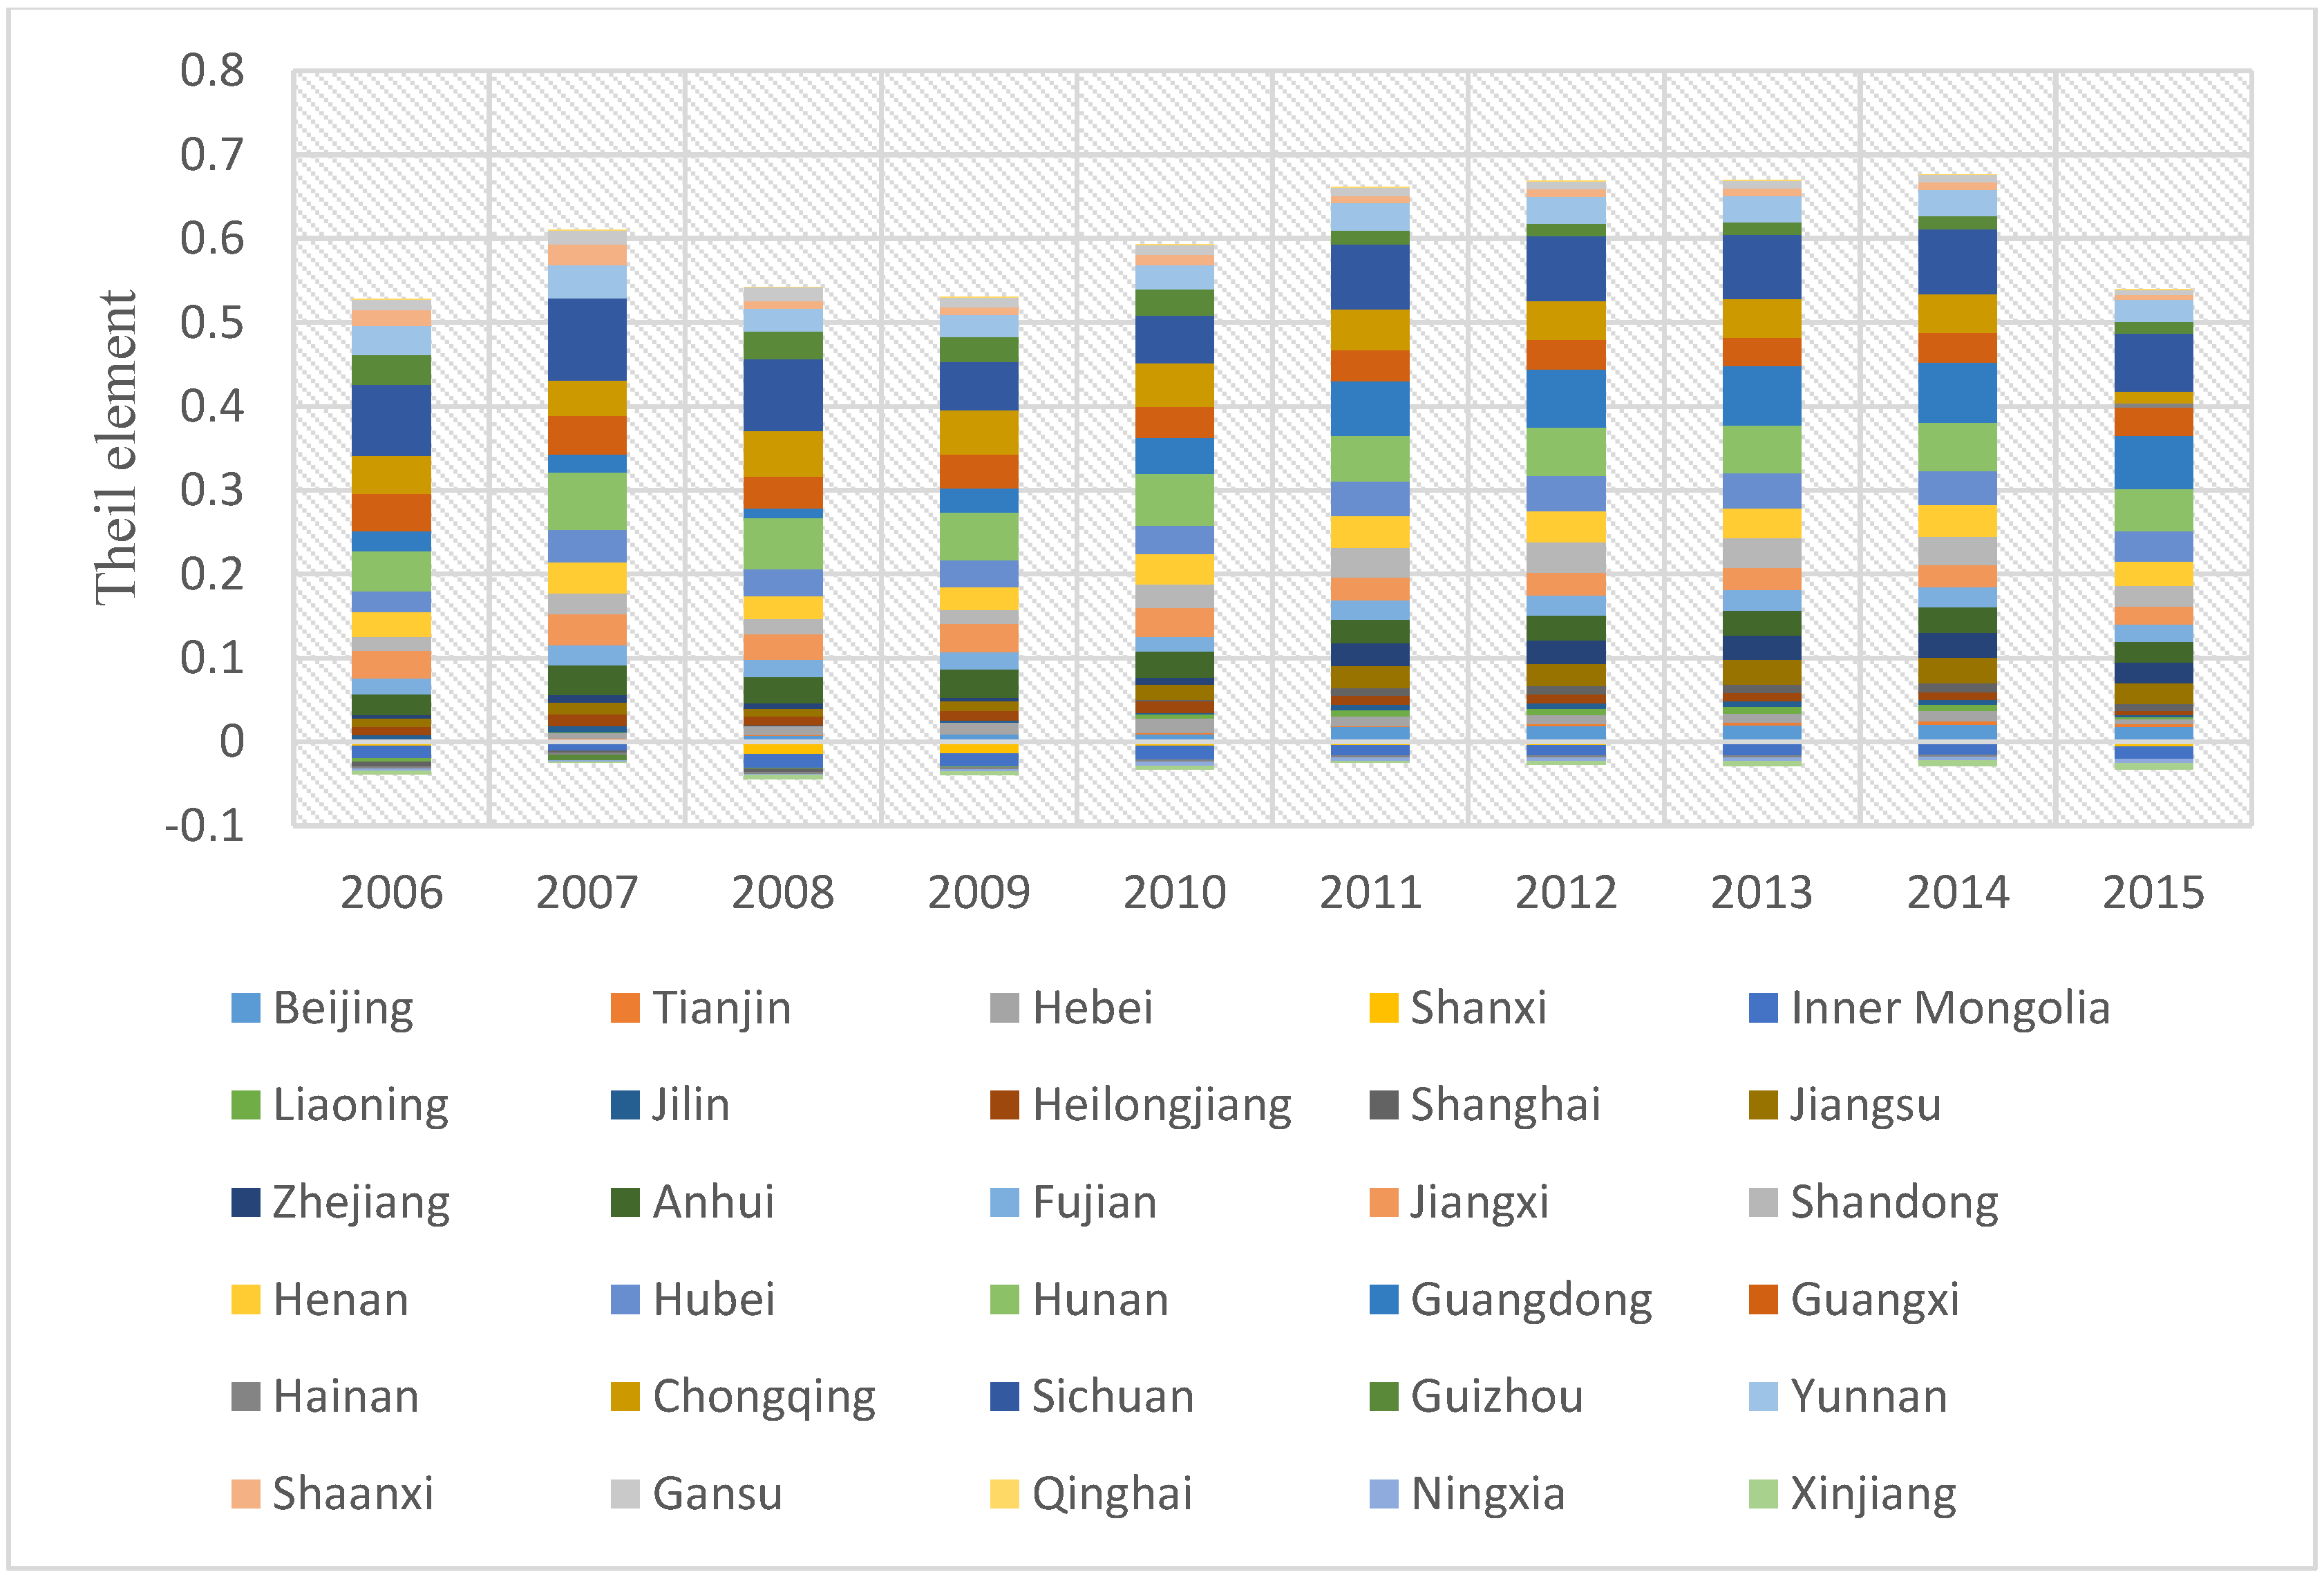
Figure 4 shows the evolution of per capita SO2 emission inequality in each province, which is defined as Theil element. Positive values indicate better air quality because per capita sulfur dioxide is lower than the national average and negative values correspond to per capita SO2 emission higher than the national average. Guangdong has the most positive growth rate of air quality improvement in terms of SO2 emission and this change makes the largest contribution to overall inequality, about 16.3% in 2015. The other largest contributors are Sichuan, Anhui, Hunan, and Jiangsu in the whole period.
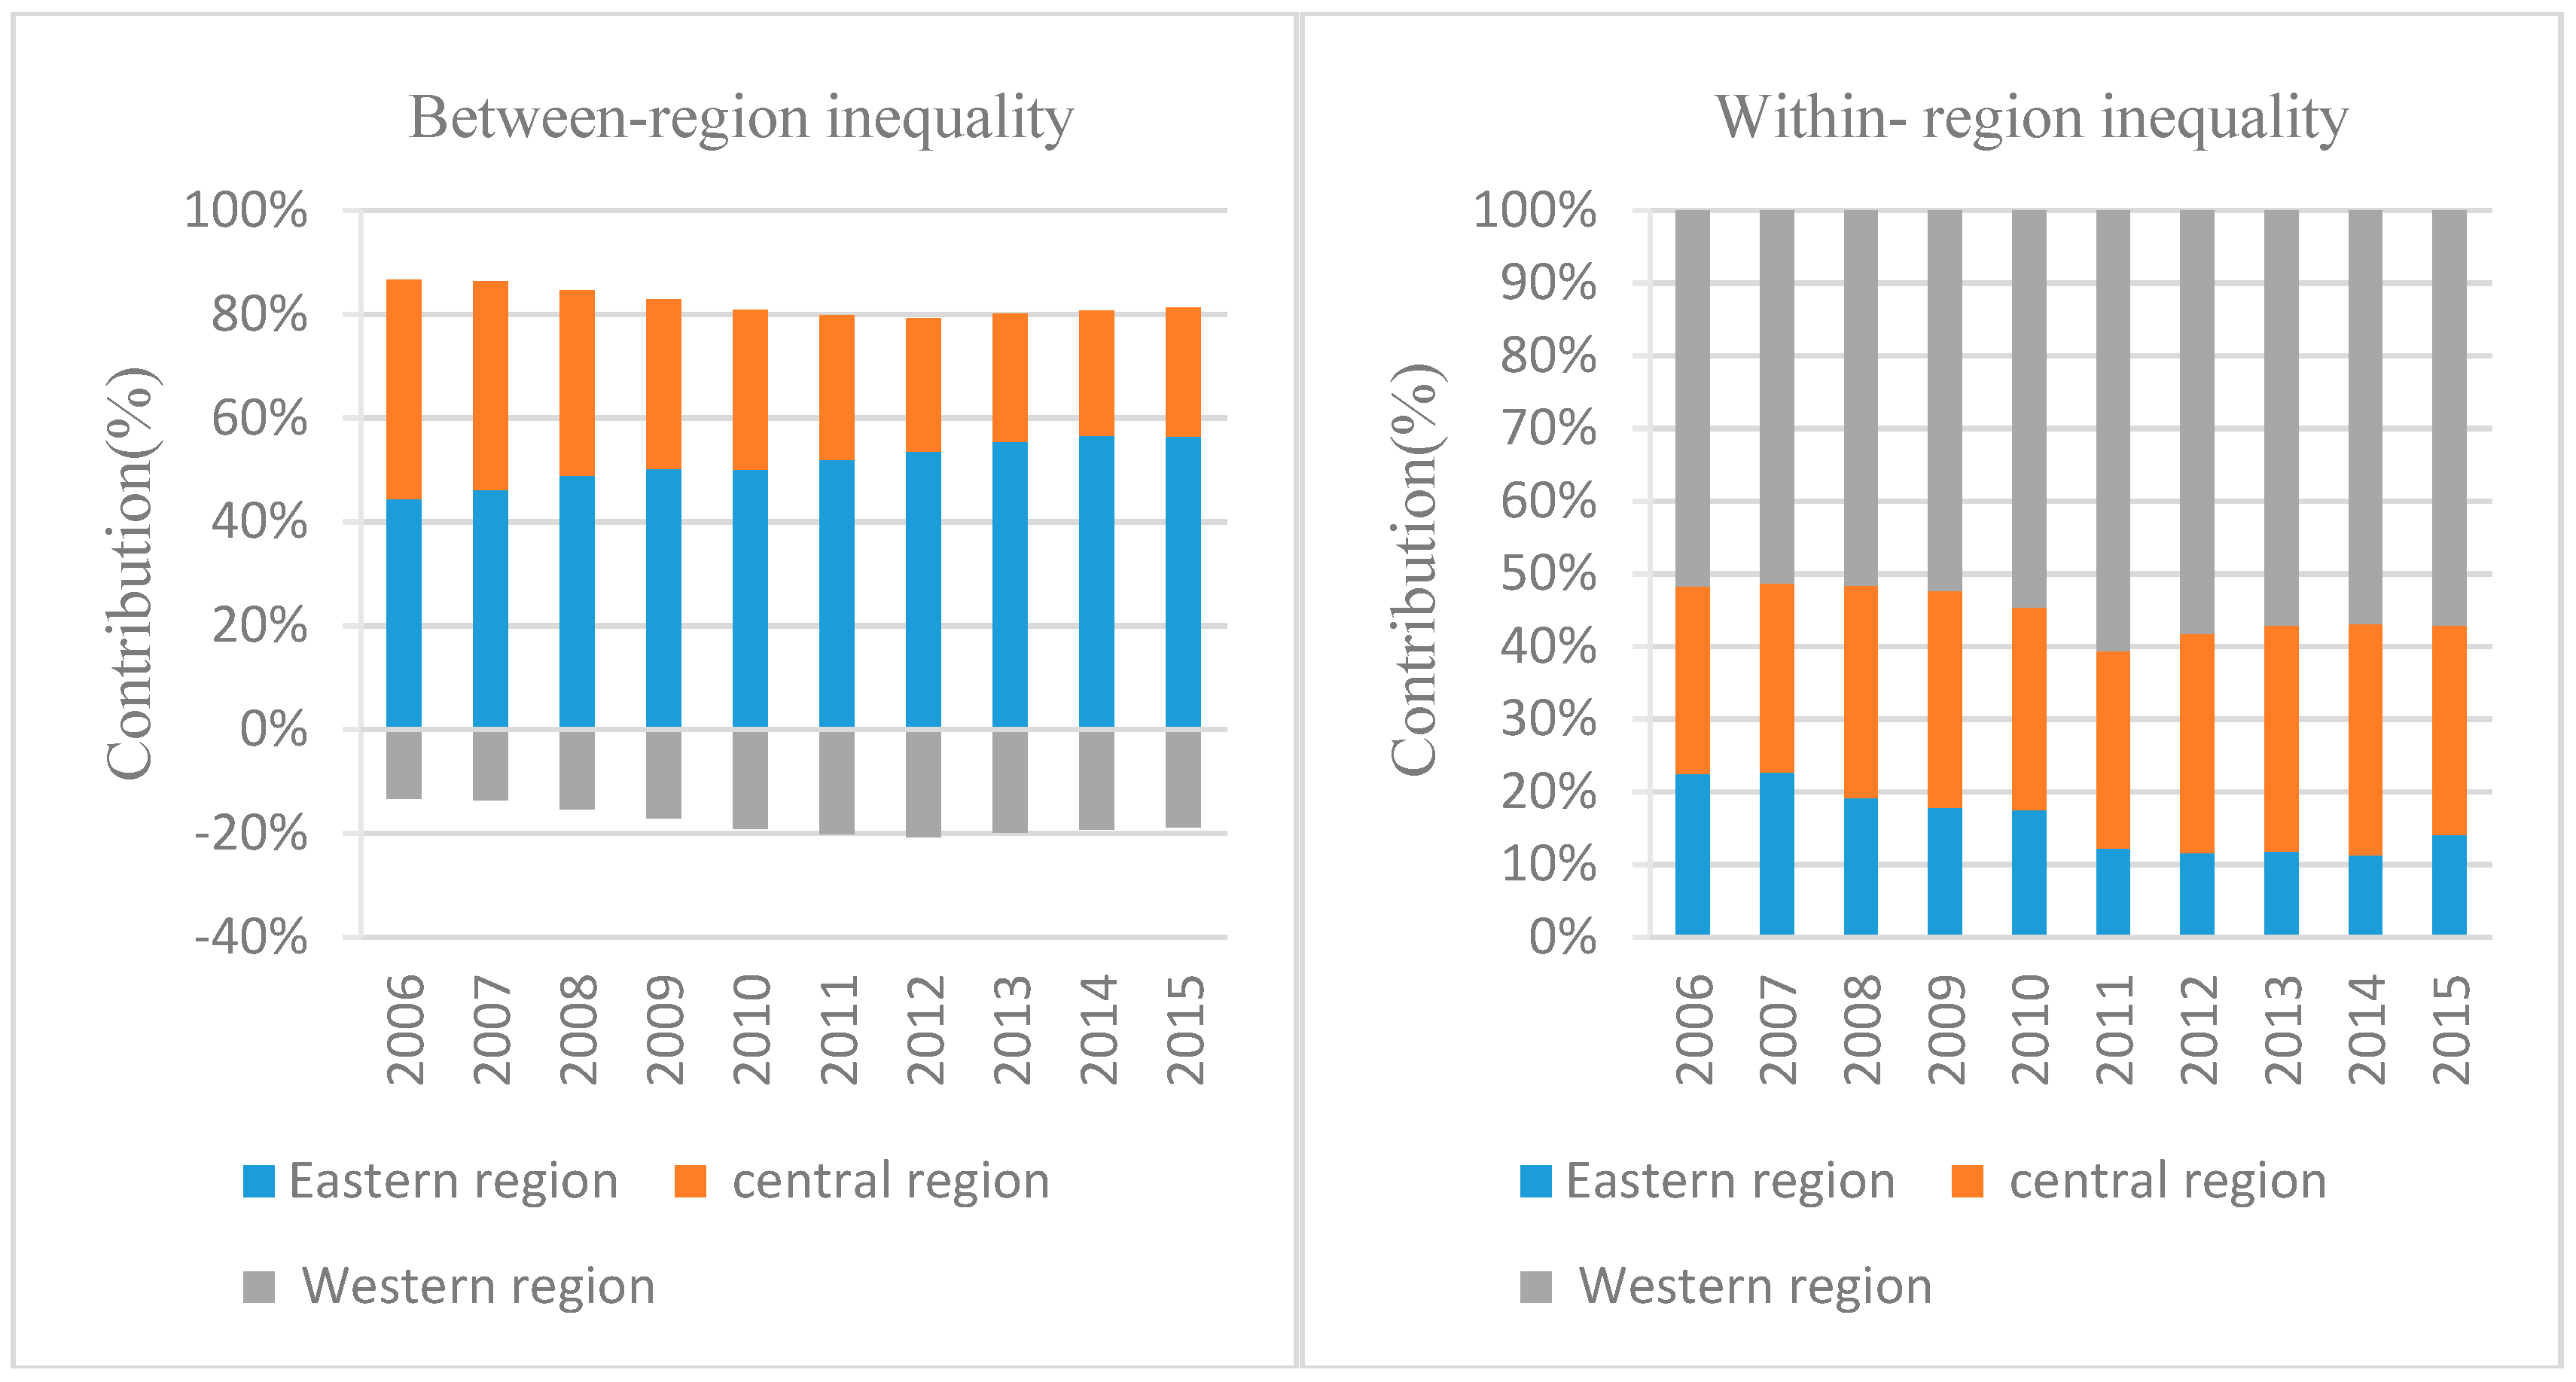
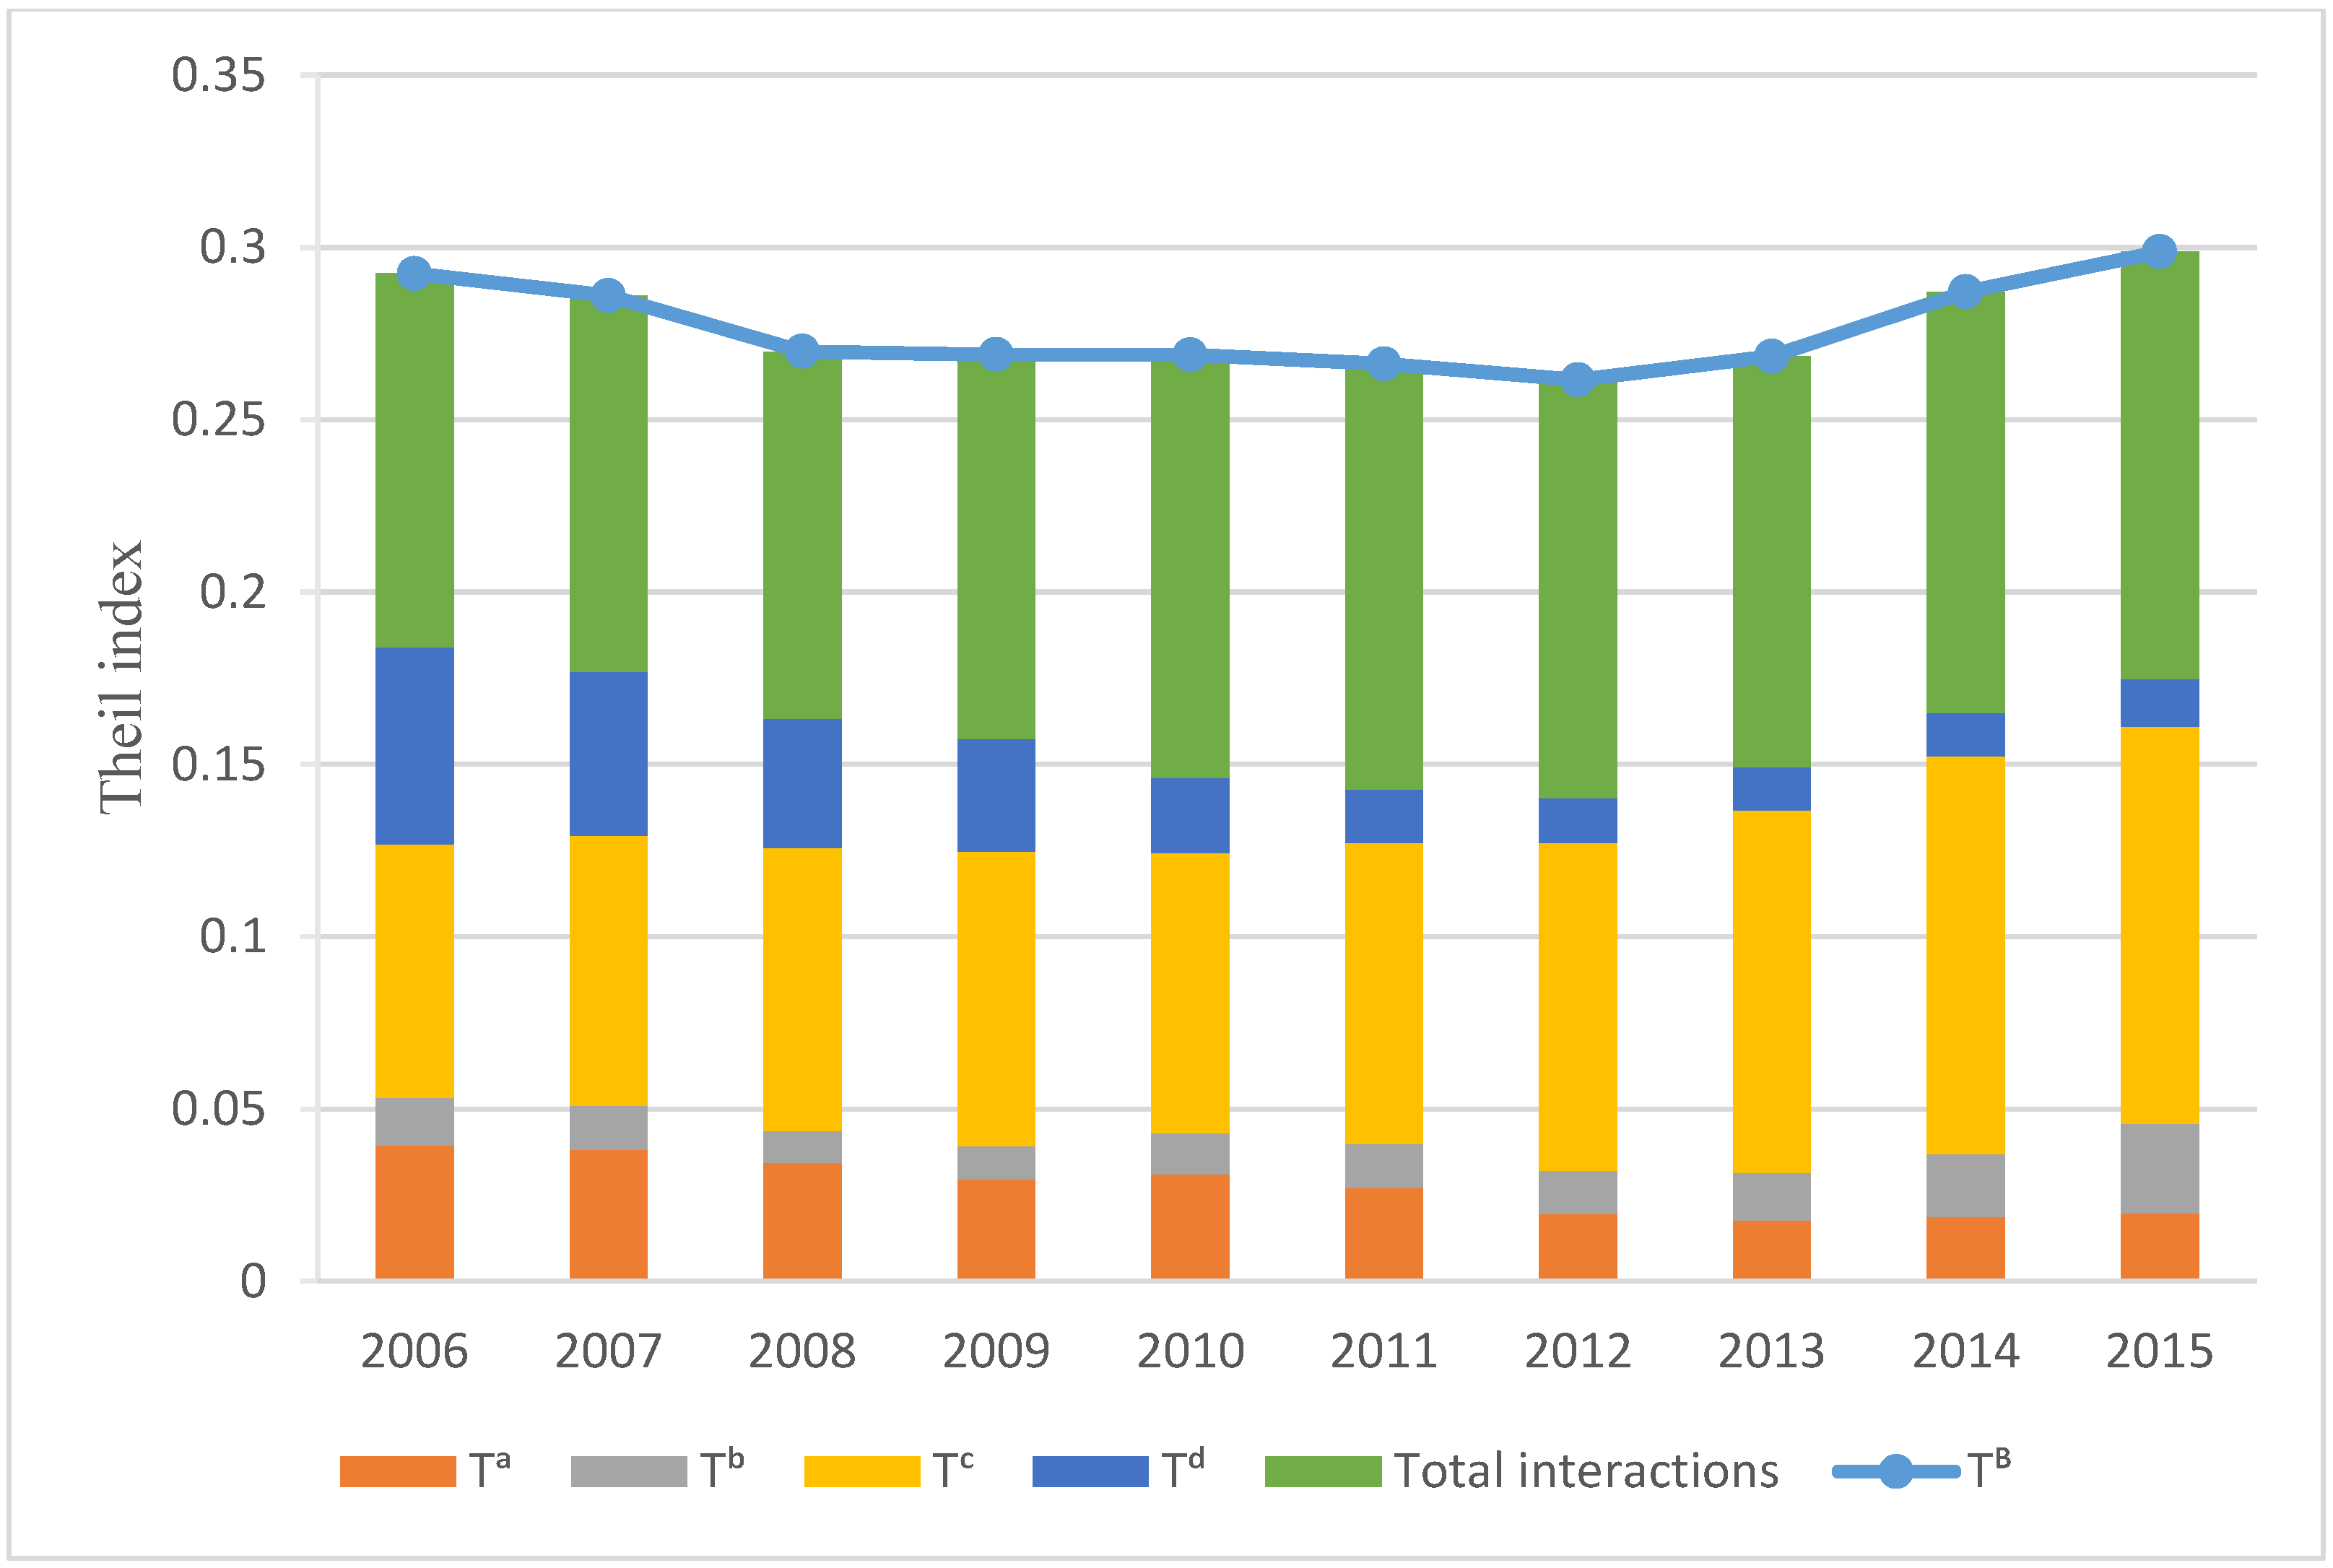
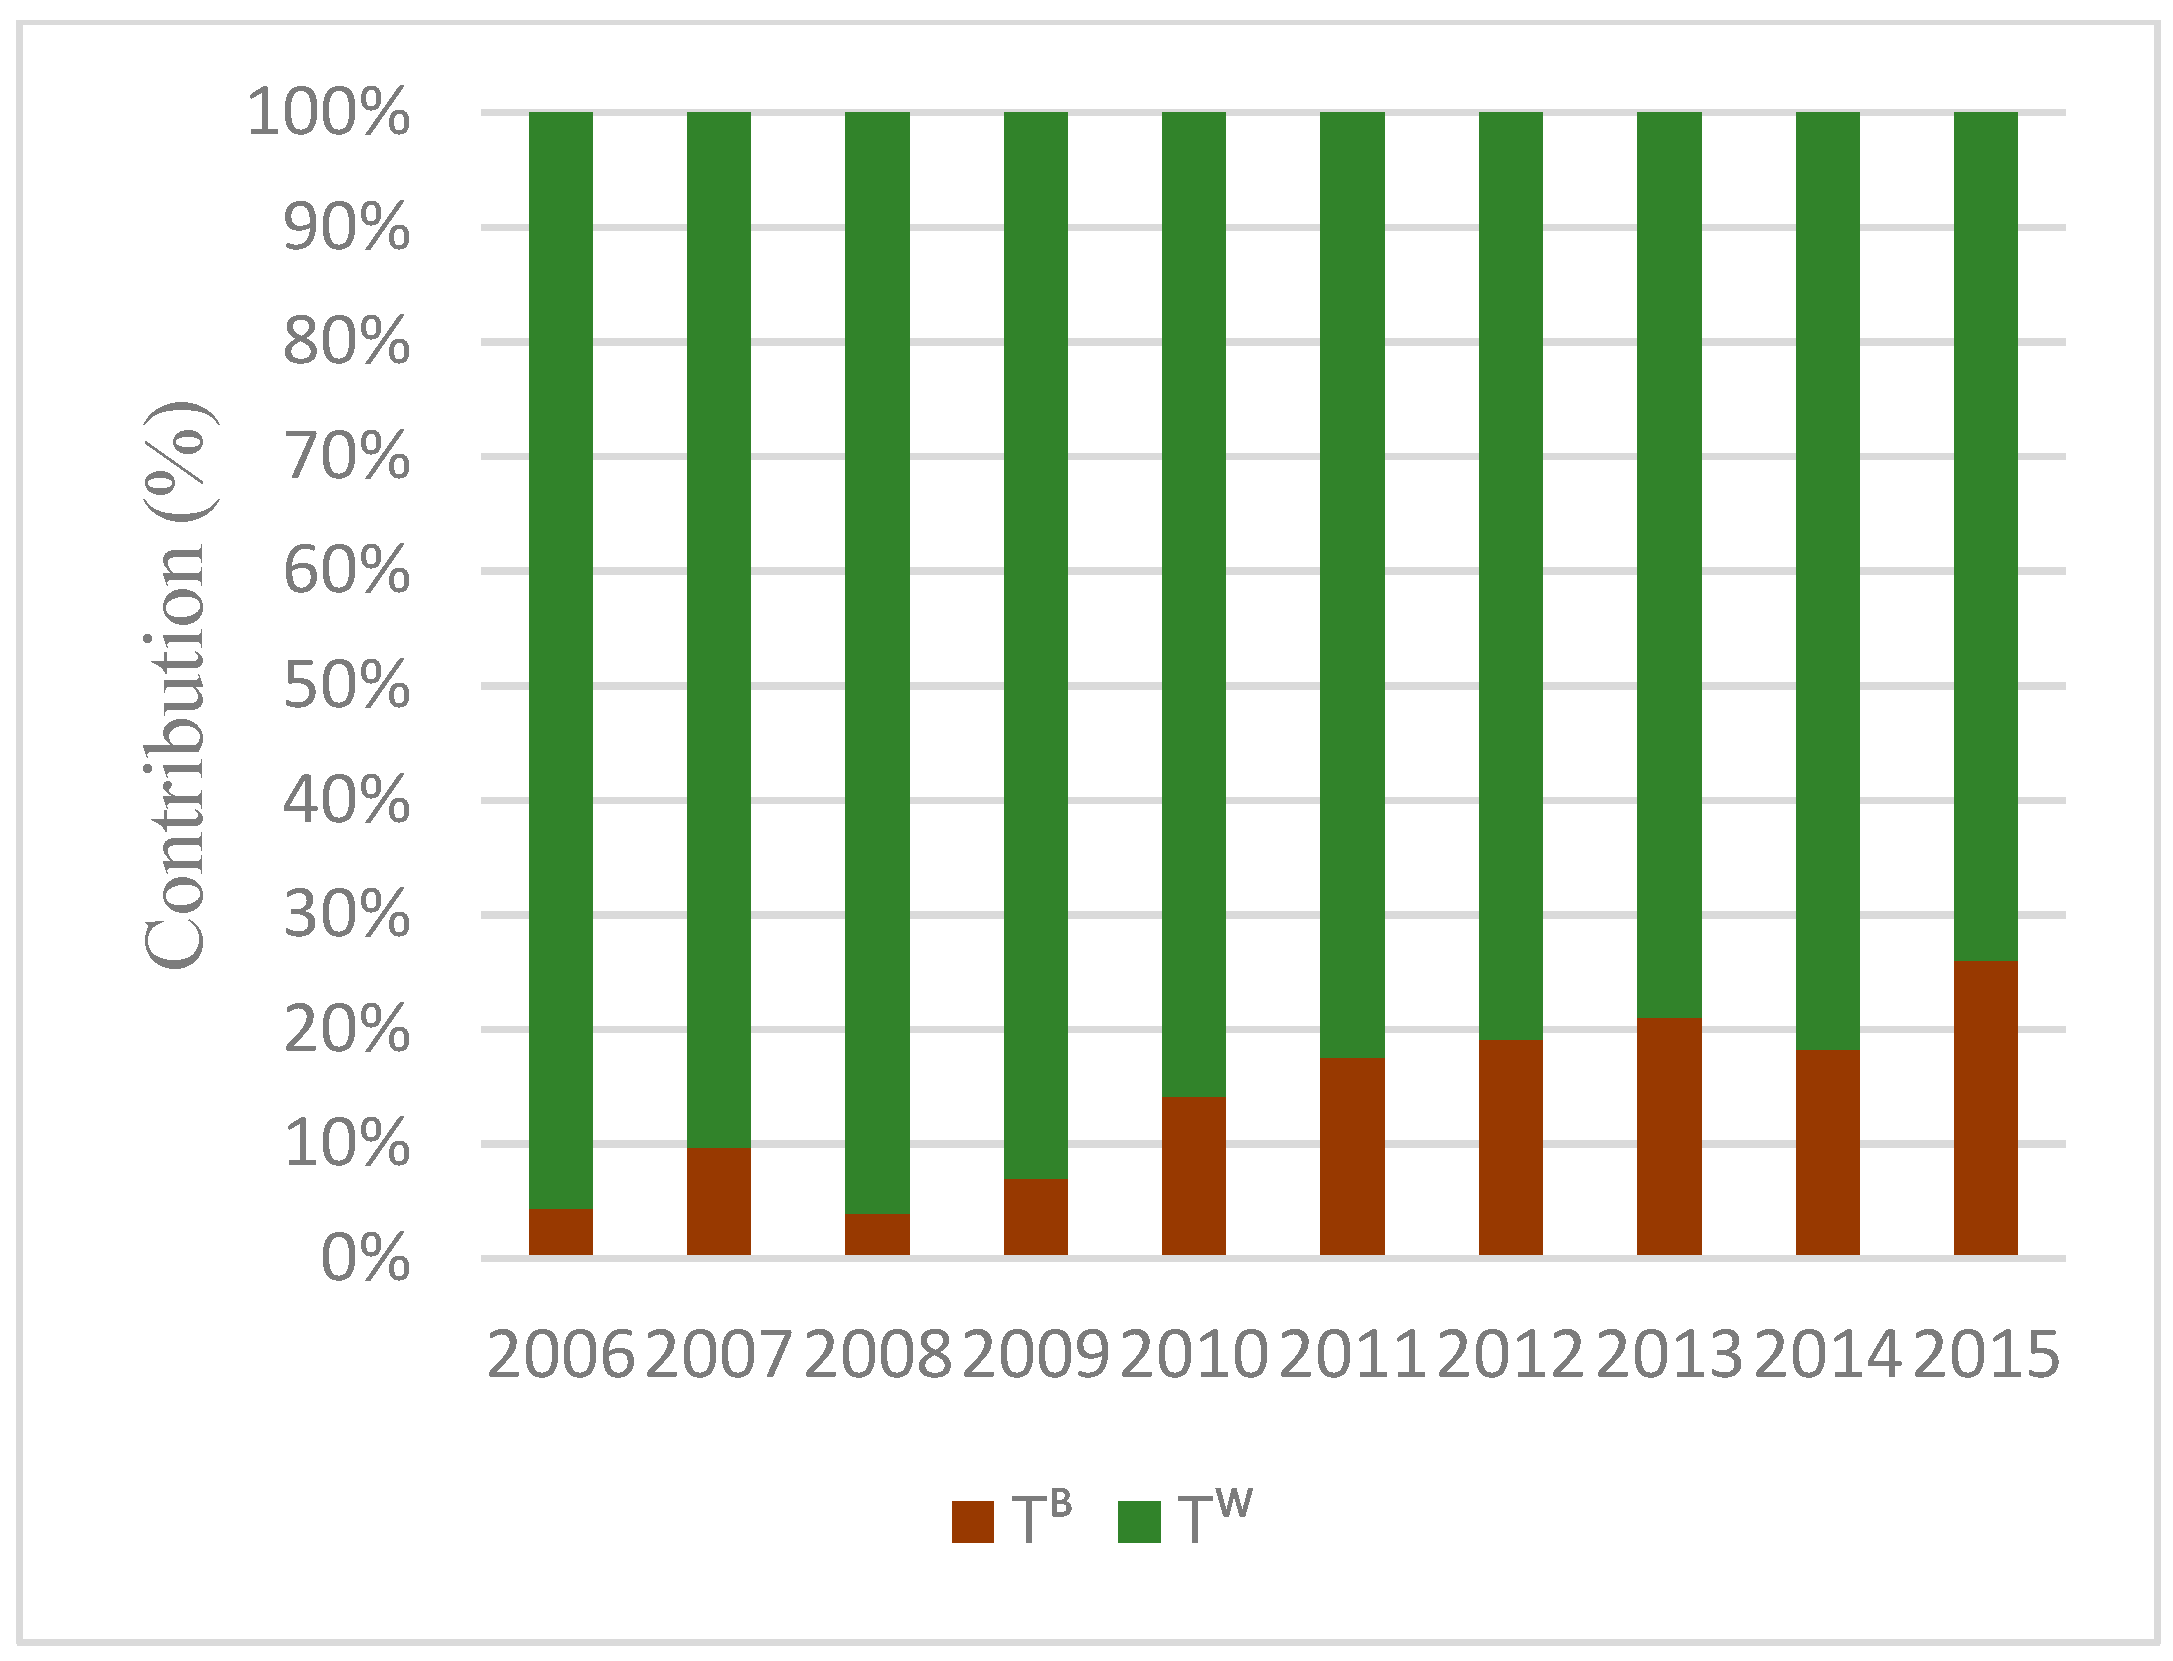
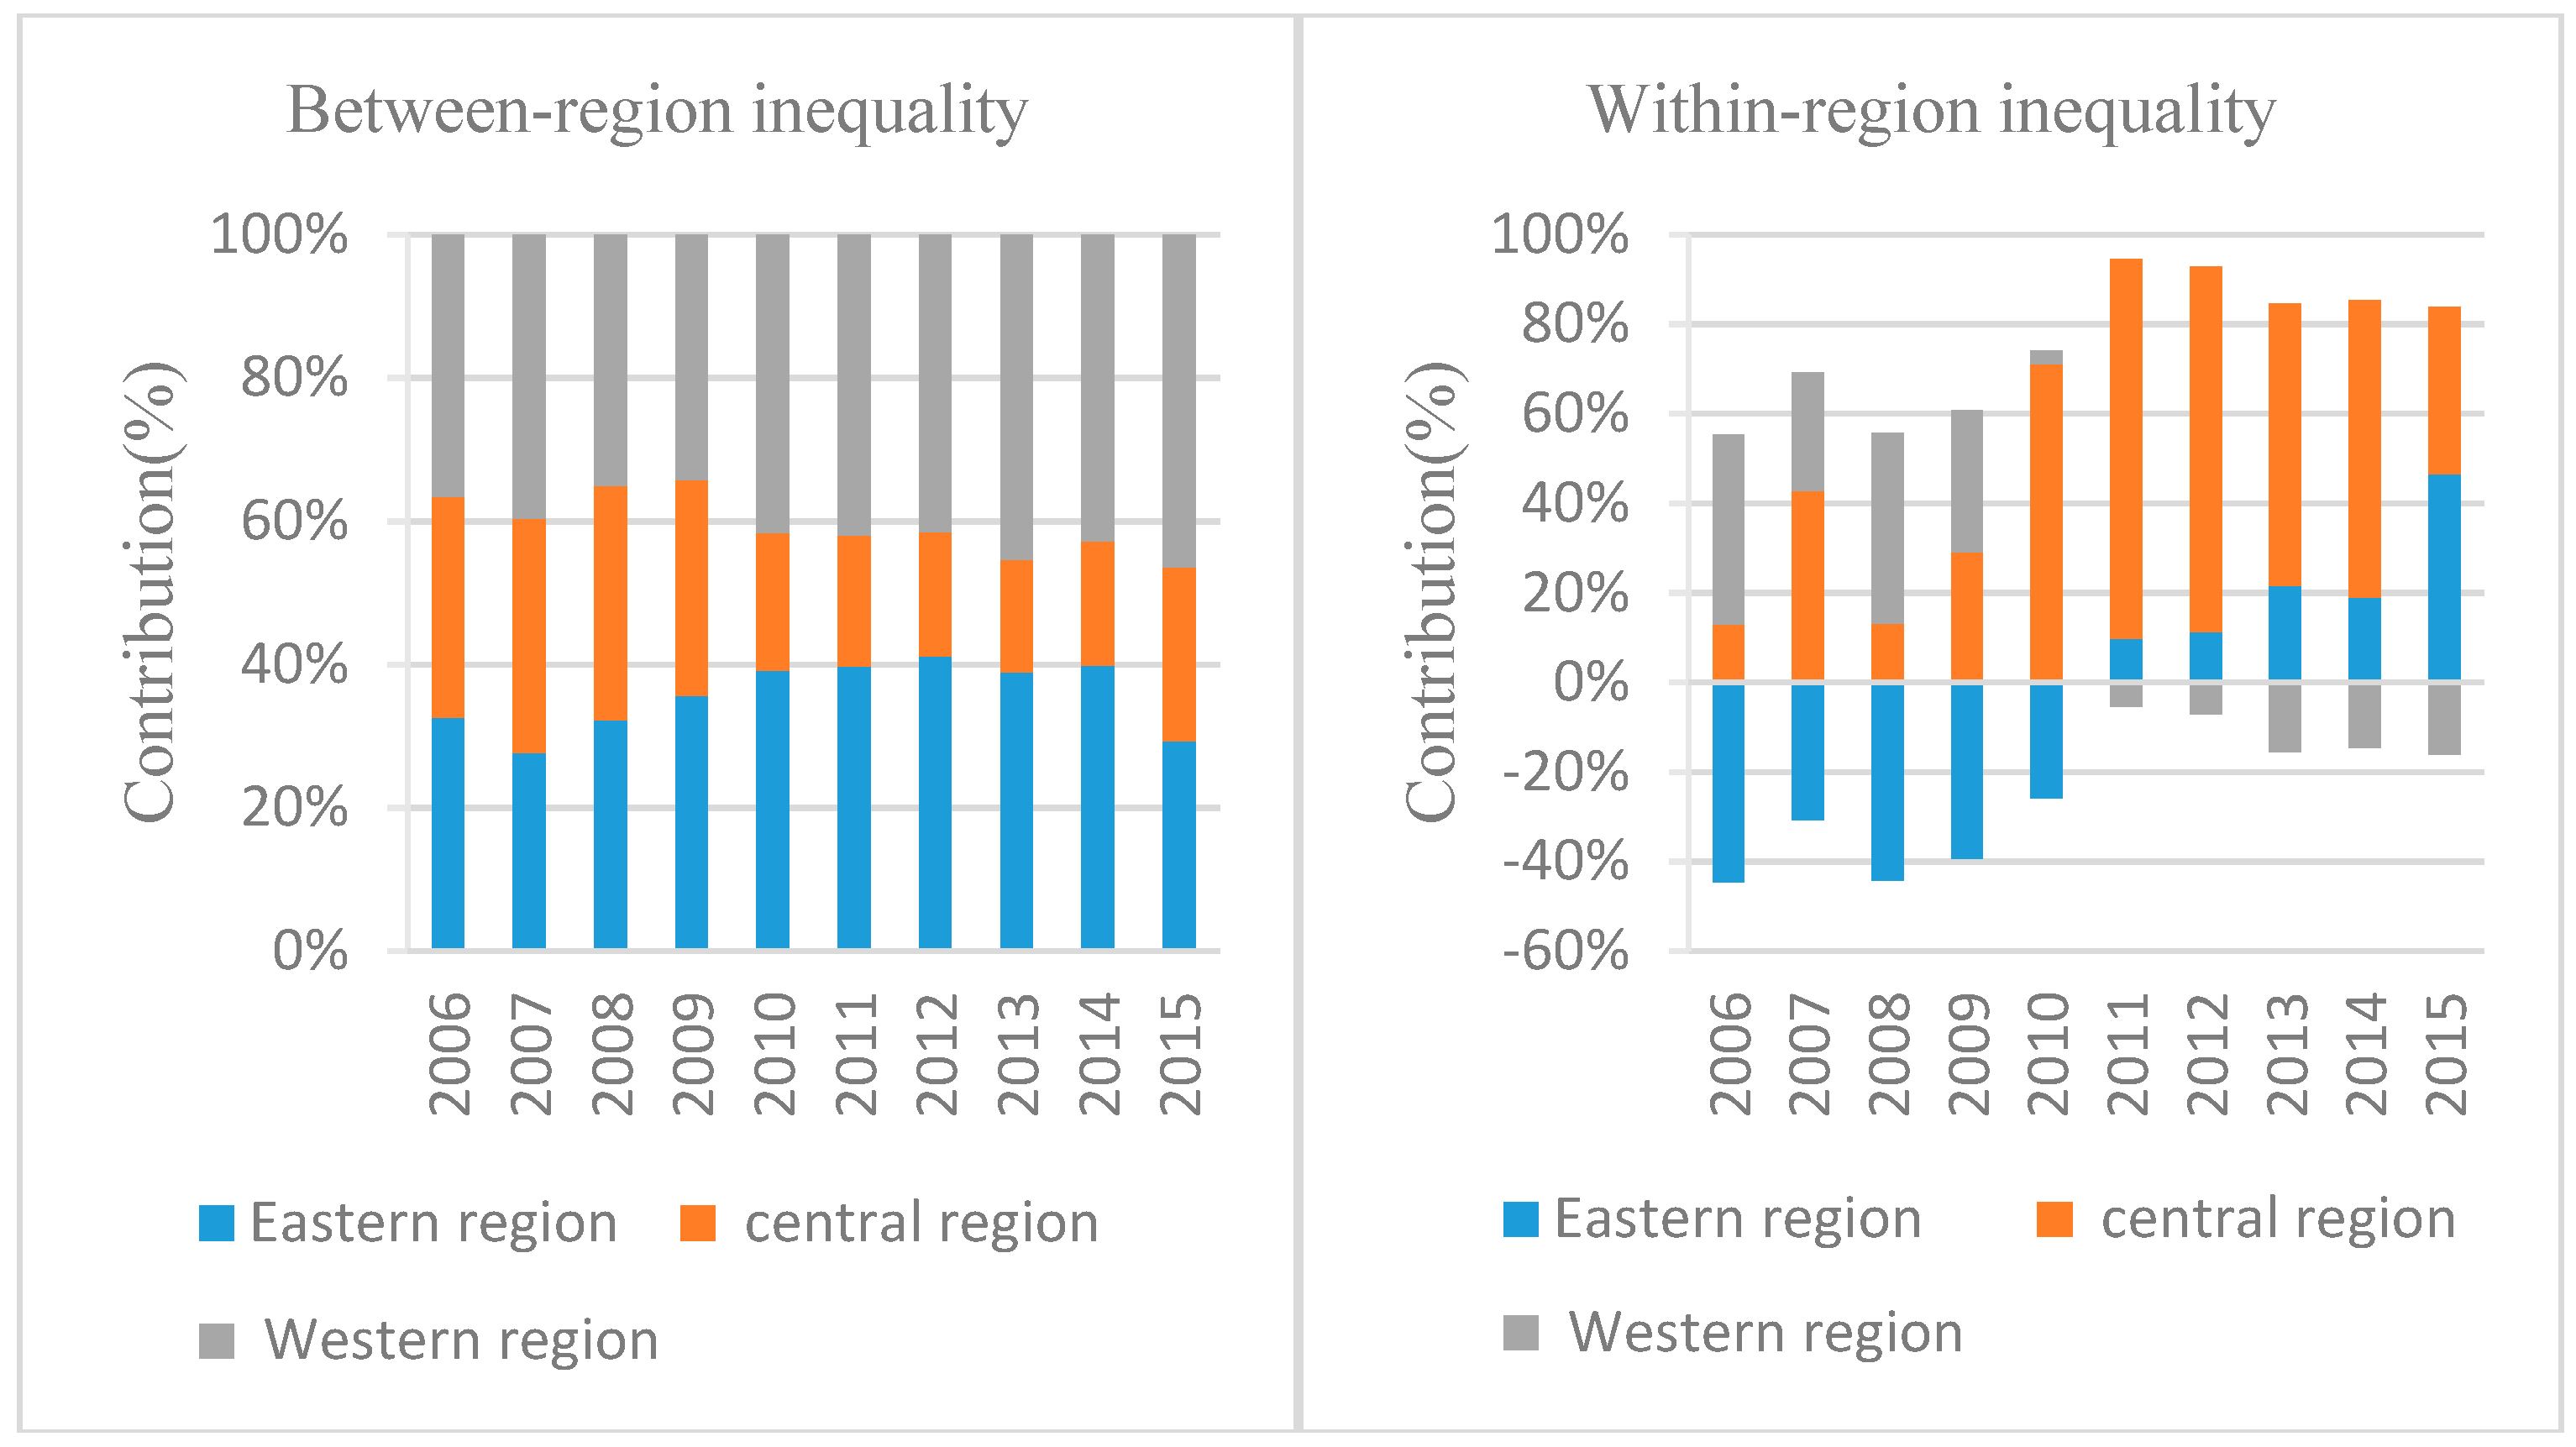
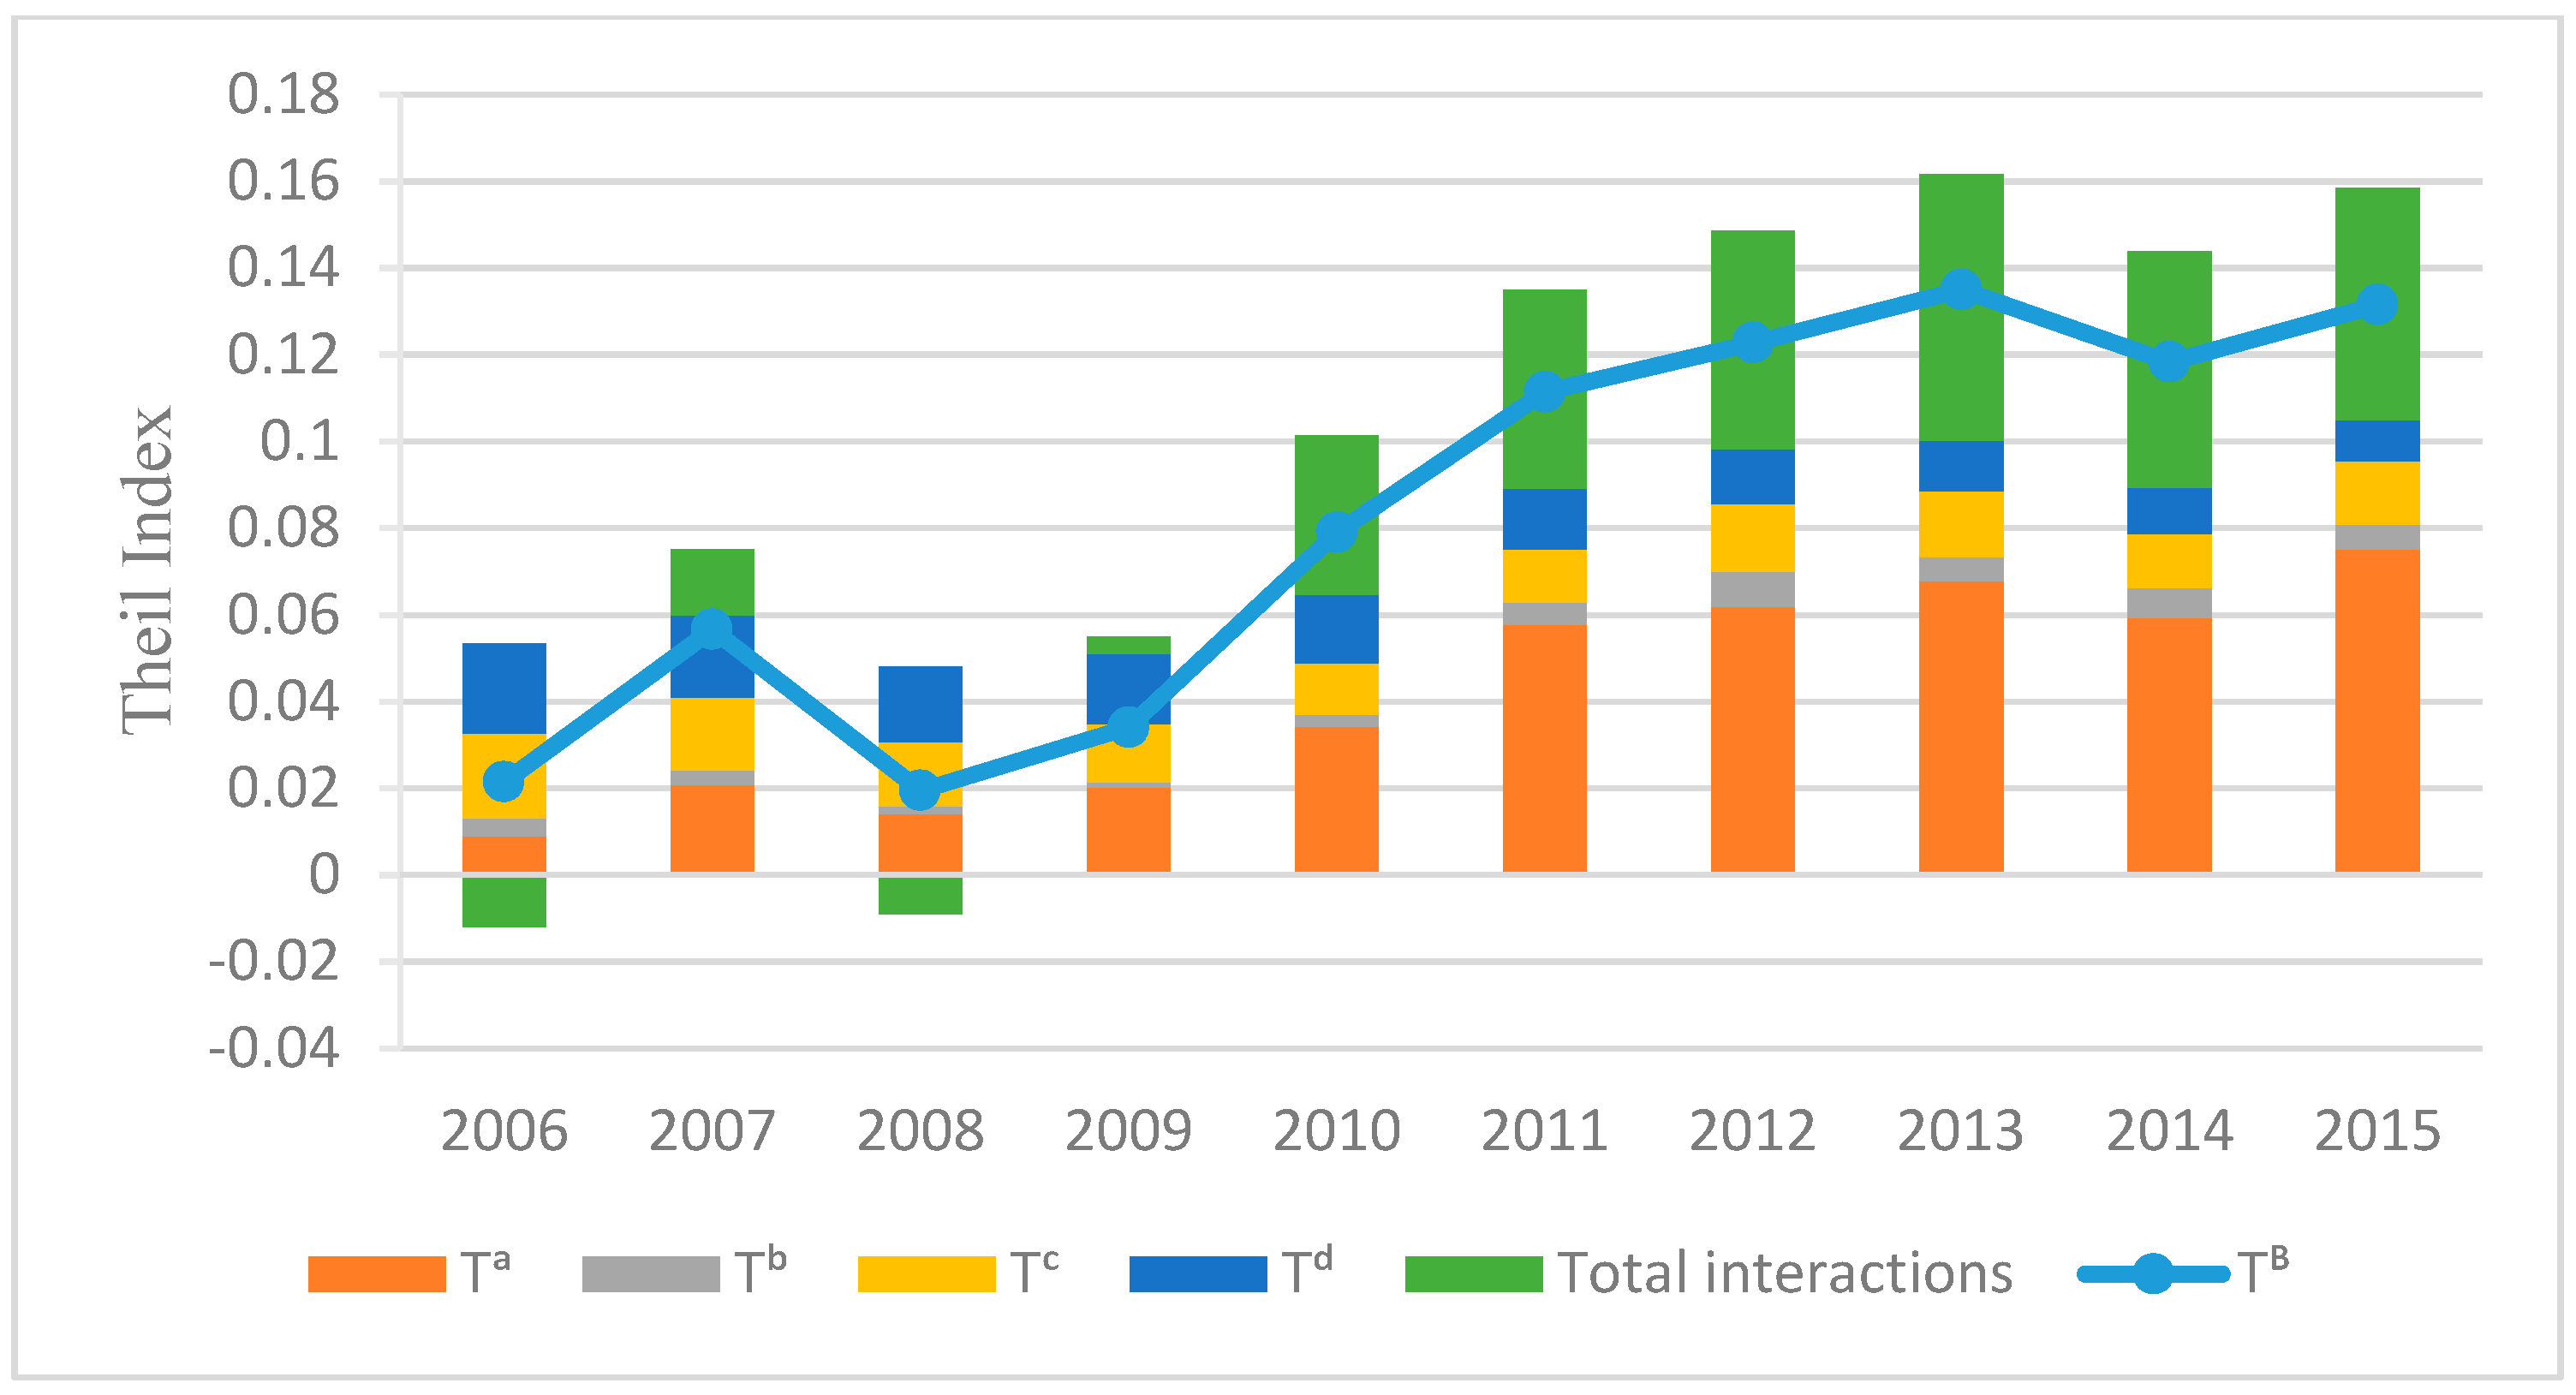
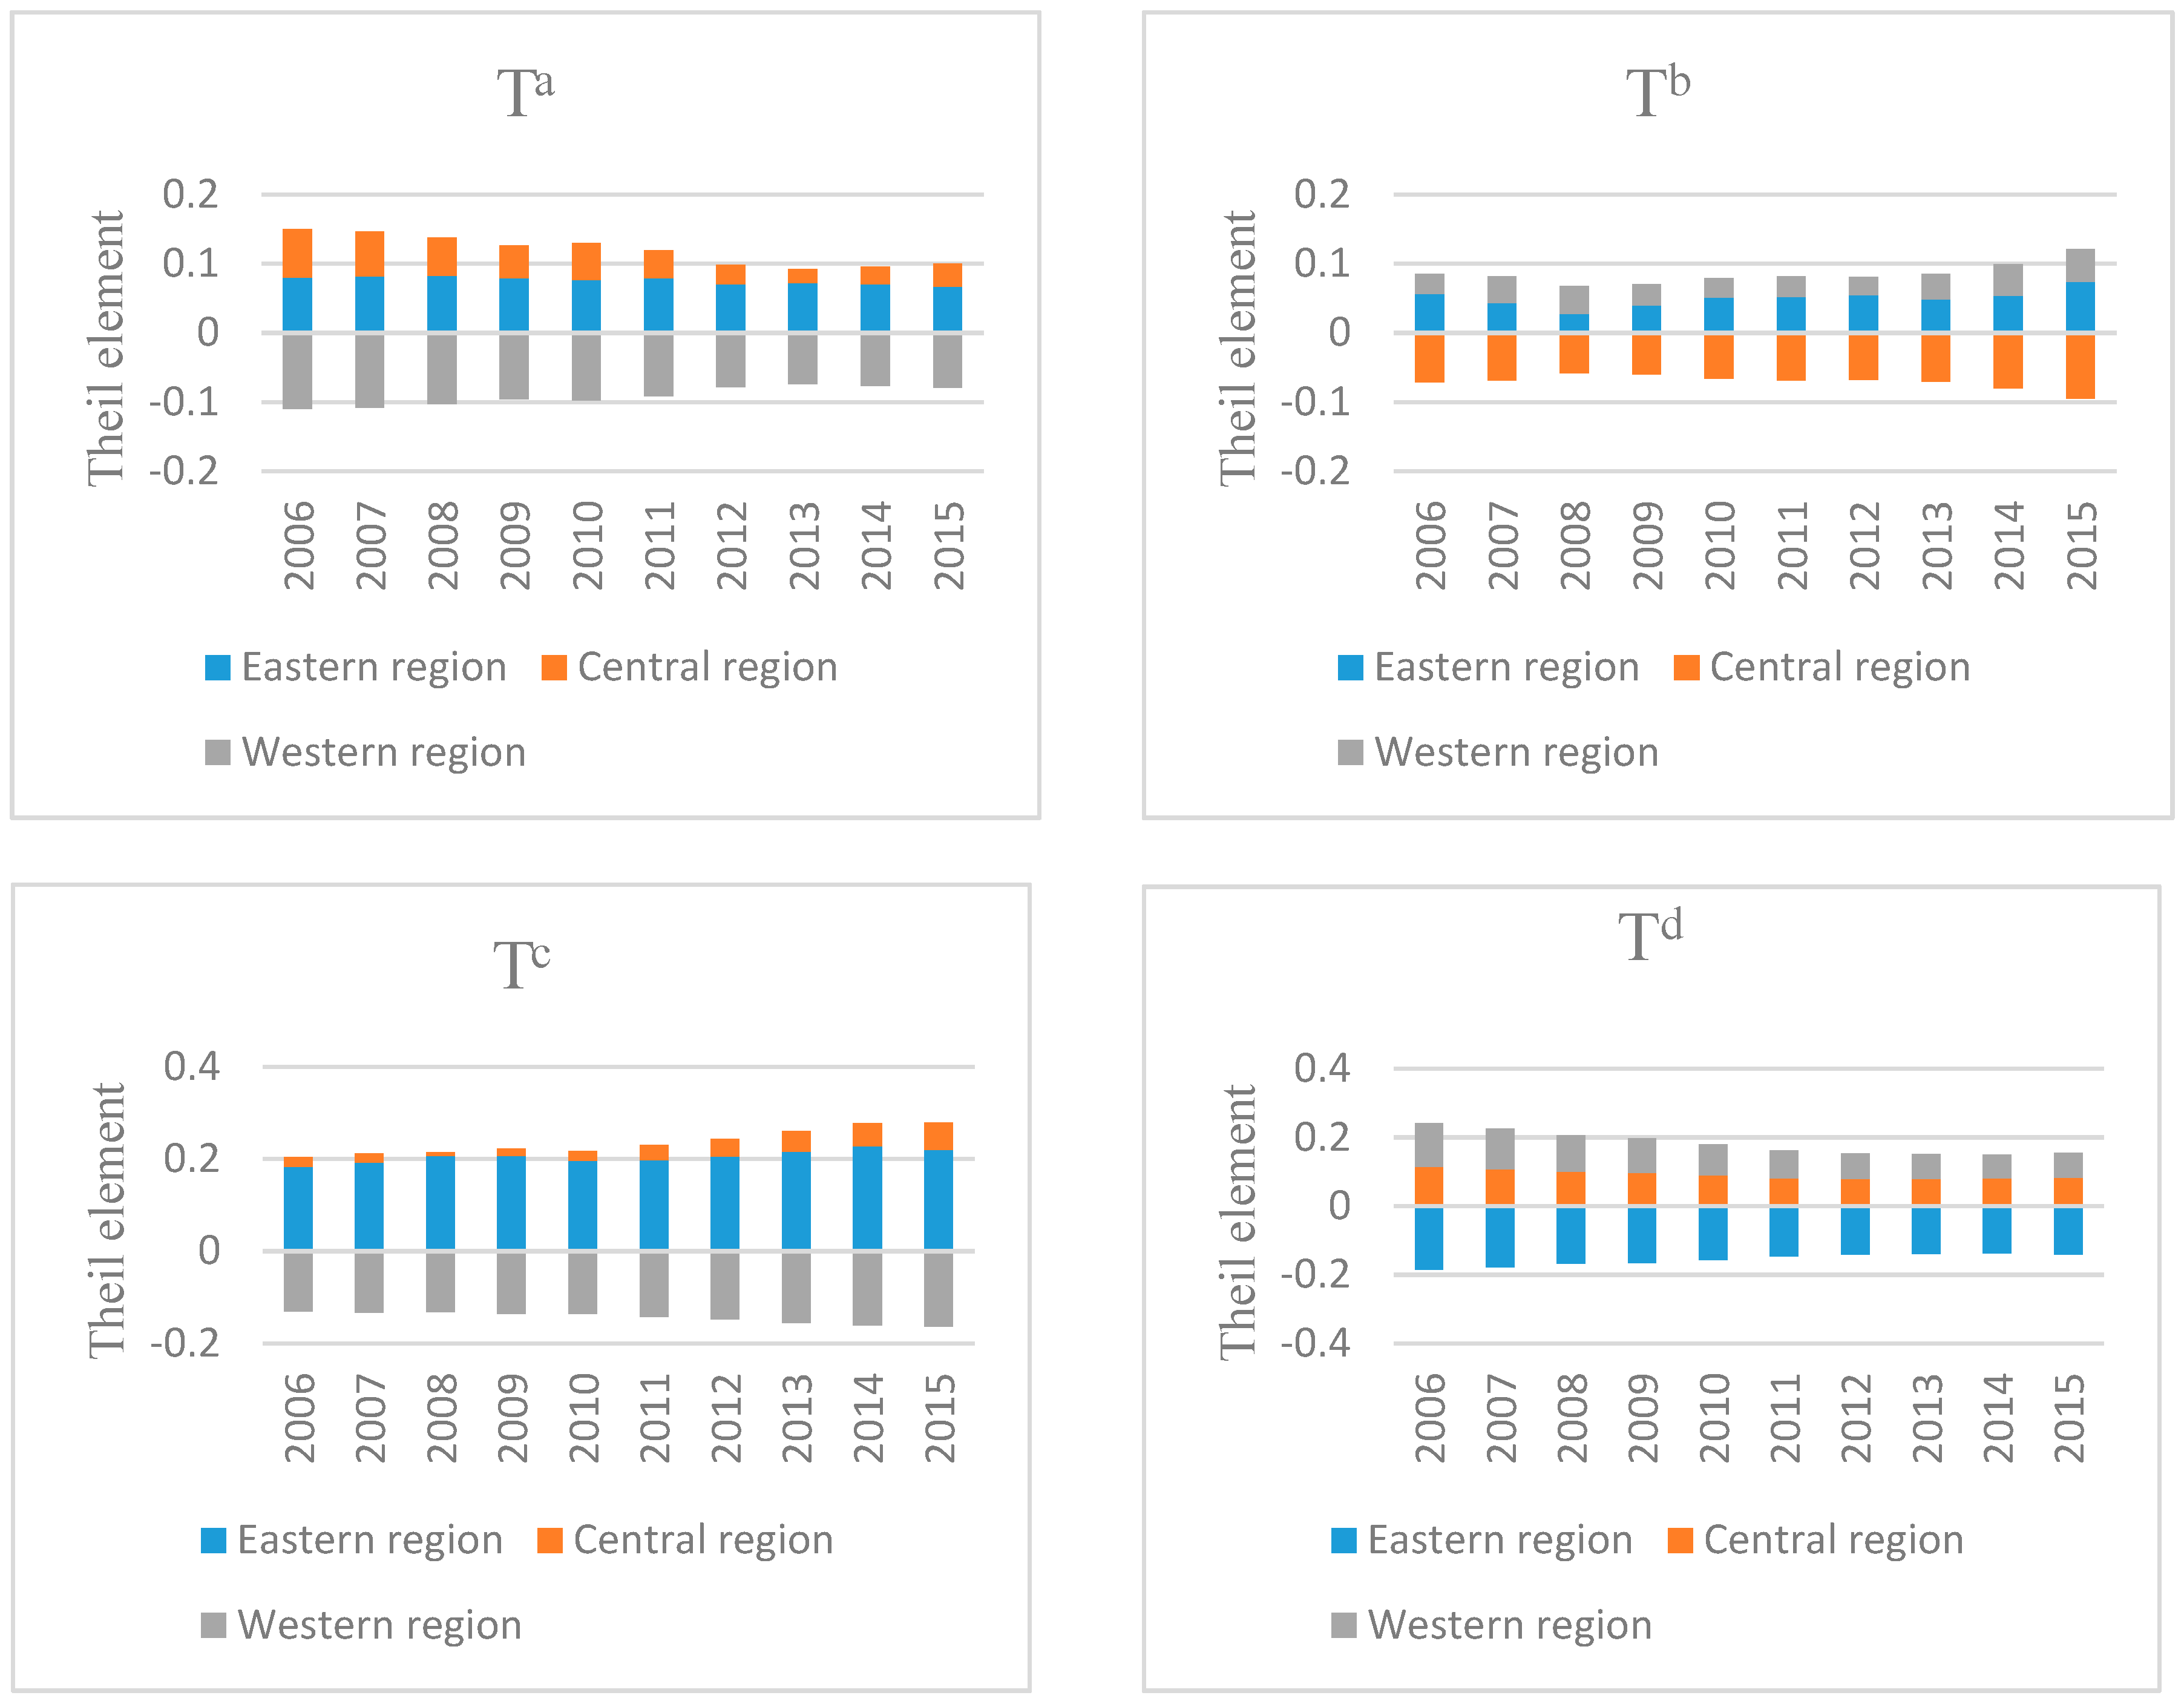
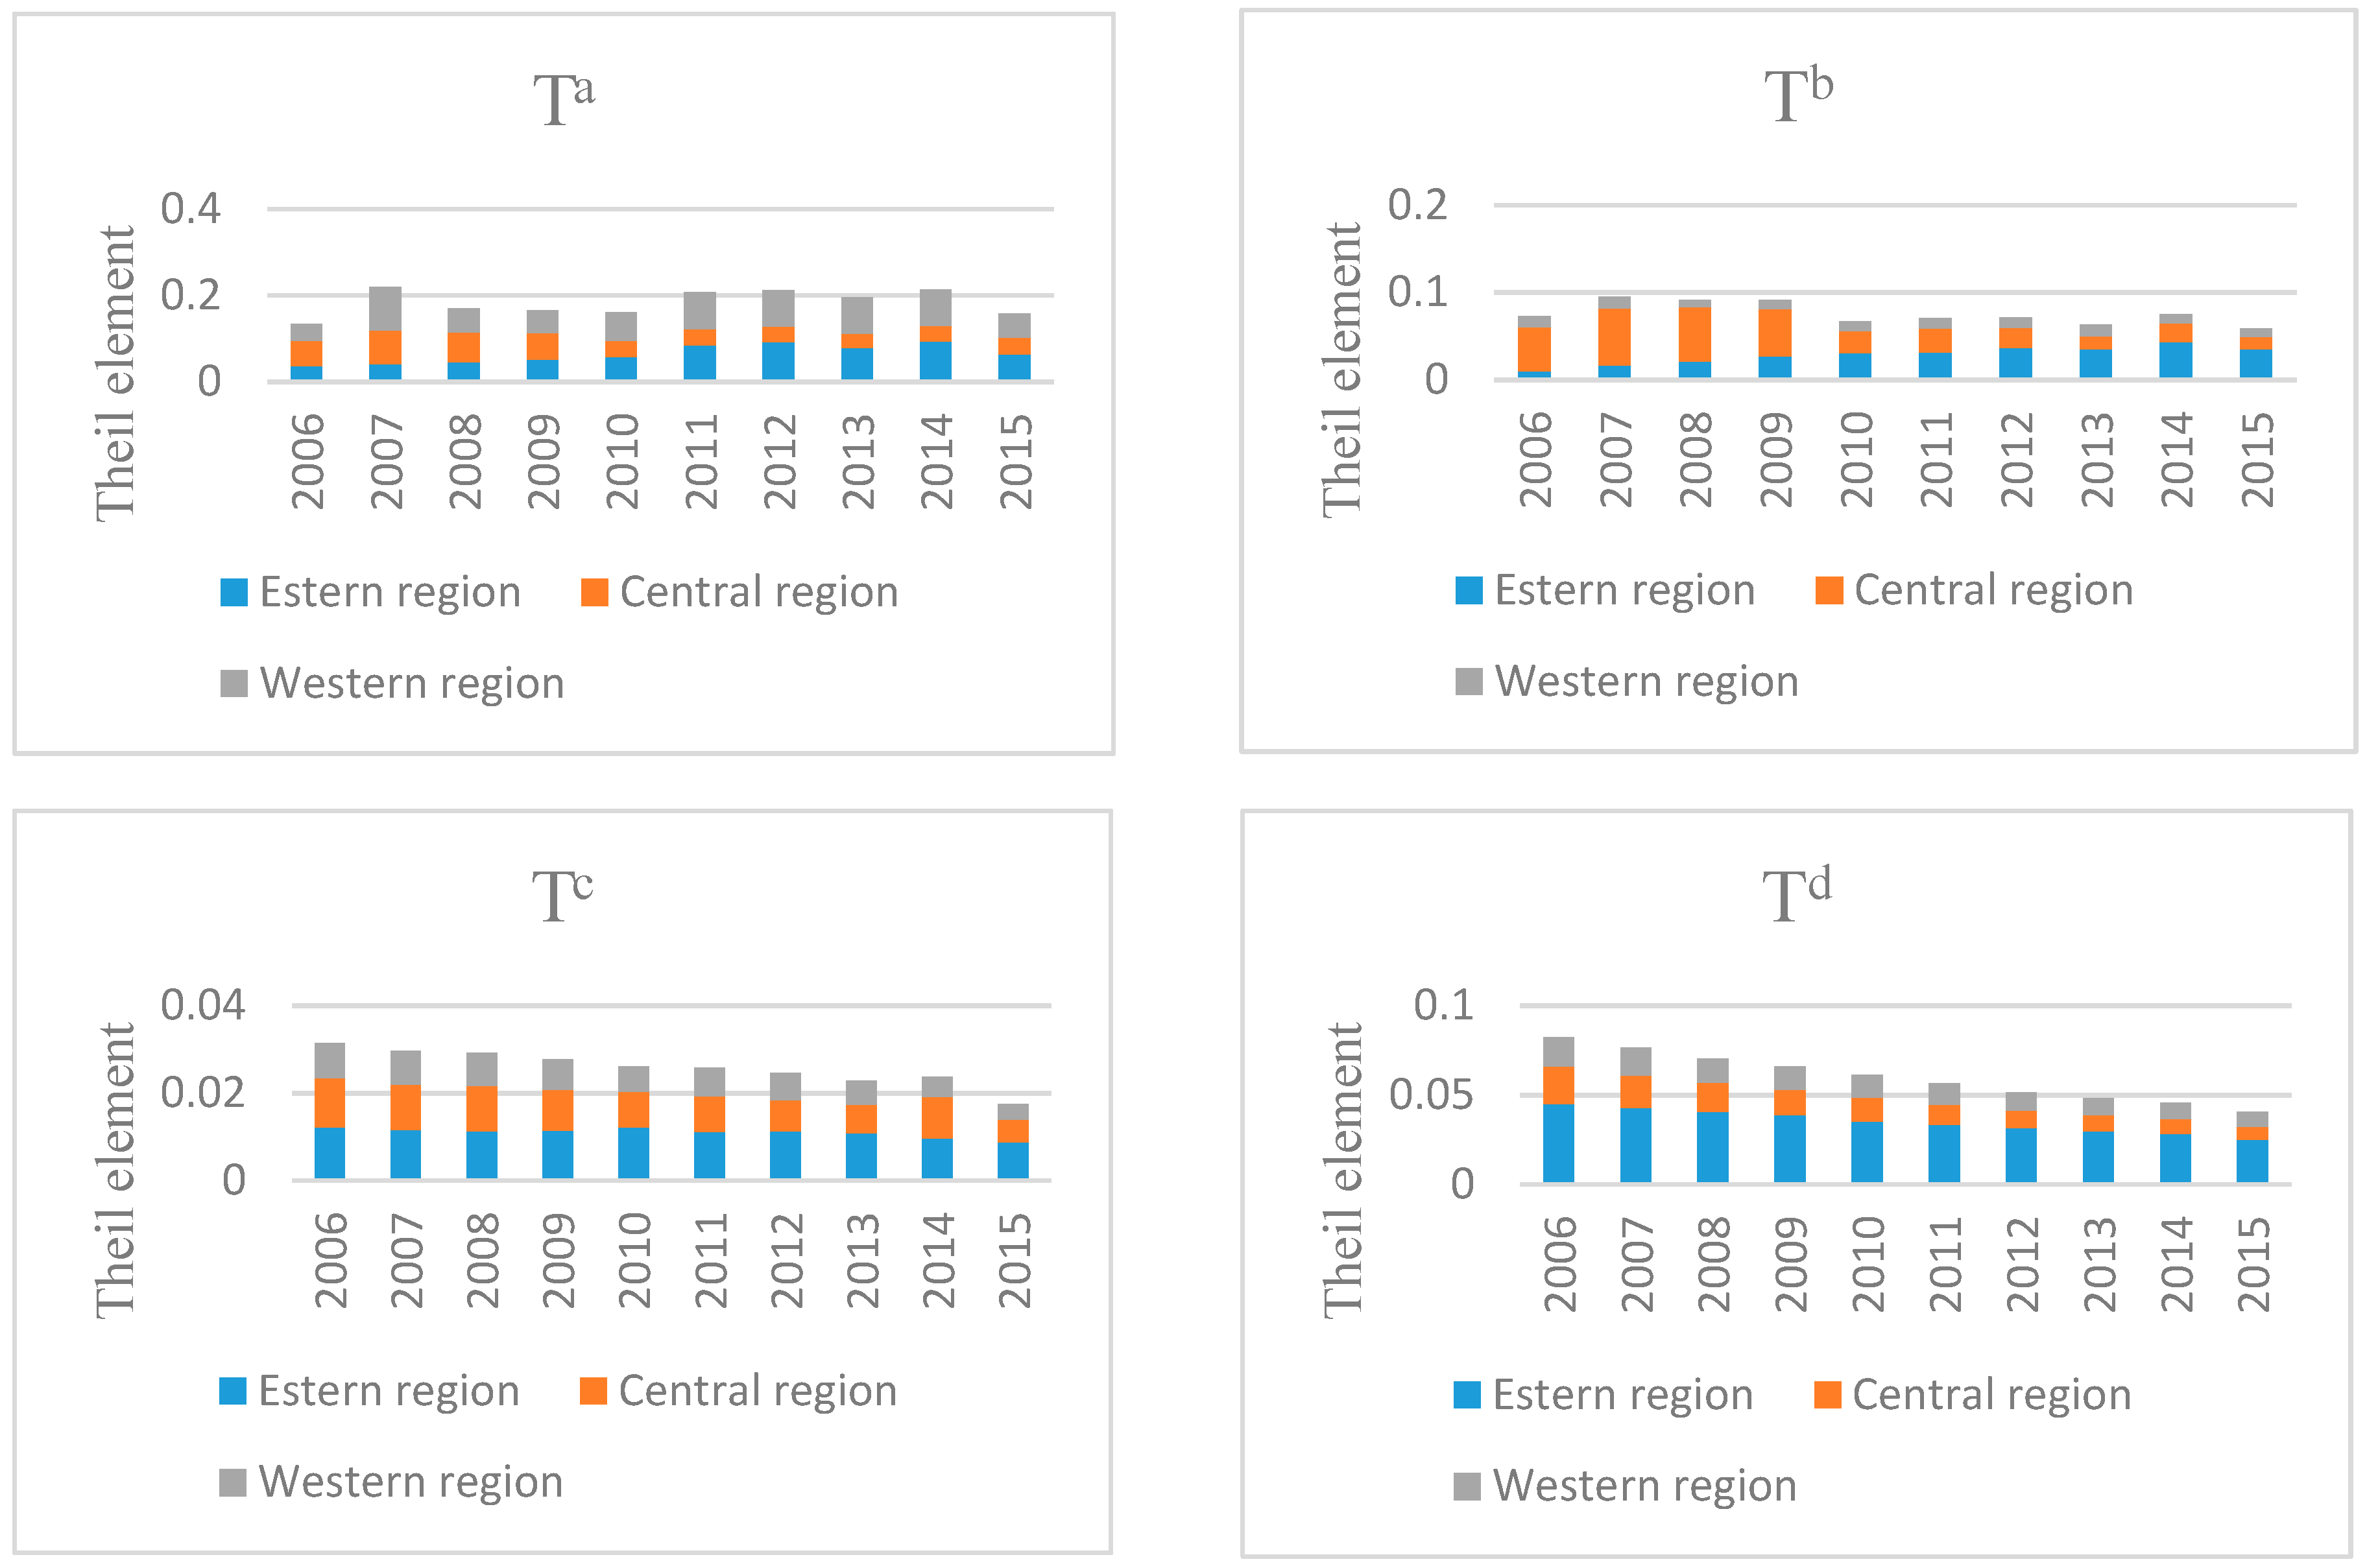
Most of the eastern provinces such as Guangdong, Beijing, Shanghai, Jiangsu, Zhejiang, Hebei, and Tianjin experienced positive growth of the Theil element, which means they contributed more to raising China’s inequality from 2006 to 2015. This trend reflects the success of local treatments to control SO2 emission under 11th and 12th FYPs in these provinces. According to the 12th FYP on air pollution prevention and control [1], coal-fired power plants have to install desulfurization equipment, which can bring SO2 emission reduction efficiency of about 90% in key regions. Inner Mongolia has the greatest negative magnitude (−6.3%) to reduce the total inequality, which indicates the worst air quality. Guizhou, Qinghai, and Xinjiang have the total lowest shares, following Inner Mongolia, and the negative influence of the western region in China inequality is significant. Figure 5 shows within-region inequality () is quite similar to that between-region () for all years. The contributions of the eastern region in between-region inequality () and the western region in within-region inequality () are remarkable for the whole period (see Figure 5). With regard to the increase of between-region inequality (), the power intensity of GDP () contributed to its growth from 2010 onward (see Figure 6). This finding is related to the positive element of the eastern region for the power intensity which shows power production is only a minor share of GDP compared to the national average (see Figure A1). However, regarding within-region inequality, the coal intensity of power generation (), and power intensity of GDP () are all responsible for inequality growth after 2011 (see Figure 7), and the primary cause was the western region (see Figure A2).
The contribution of Sichuan in the western region to inequality is greater than other provinces; Sichuan alone accounts for about 42% of the total western inequality in 2015, which shows that policies to control SO2 emission could have more benefit in Sichuan than in other provinces in the western region. Inner Mongolia holds the least share in total western inequality. This broad range of inequality contributions highlights the necessity of the national government implementing different regulations according to the existing disparity in the level of per capita SO2 emission in the western region. As Hao et al. [33] implied, there is a need for more attention to the western region and stricter regulations there.
Ningxia, the province with the least population density yet high coal consumption, suffered from inequality in government regulation to improve SO2 emission before 2012, although after 2012 the government started to control SO2 emission strictly. Gao et al. [80] showed that strict abatement policy in some regions could decrease SO2 emission especially in the power sectors which use FGD (Flue Gas Desulfurization) equipment.
Due to the central government’s preferential treatment of the most-developed provinces, which are located in the eastern China, the inequality in that region is insignificant. The central region inequality has approximately the common trend and remained steady in all studied years.
Figure 8 shows the percentage value of increase or decrease the national and regional inequality with the aim of comparing the 11th and 12th FYPs. The biggest increase in the level of different inequalities took place during the period of the 12th FYP. 64% increase in coal intensity of power generation () during the period of the 12th FYP must be related to the particular attention given to coal combustion, such as prohibiting the construction of new coal-fired power plants and mandating the use of cleaner energy in the power sector. Those policies covered just the key regions (China promulgated its Plan to Control Air Pollution in the key regions including the Beijing–Tianjin–Hebei, Yangtze River Delta, and Pearl River Delta regions, as well as the city clusters of Central Liaoning, Shandong Province, Wuhan region, Changsha–Zhuzhou–Xiangtan, Chengdu–Chongqing, Straits Fujian, Central and Northern Shanxi, Shaanxi–Guanzhong, Gansu–Ningxia, and Urumqi in Xinjiang [1]. These clusters are located mostly in the eastern and western China areas.) which account for 52% of the national coal consumption [1]. However, some of the remaining areas, especially in the central region such as Henan, Jilin, and Heilongjiang, have more intensive coal consumption by power generation than the national average level, yet they were excluded from the plan. The exclusion has increased the within-region inequality ) in the central region. Meanwhile, the importance of power intensity of GDP () has grown in this period.
4.2. NOX Emission Inequality
Figure 9 shows that the NOX emission inequality (Theil index) had an uneven trend but increased 3% in the whole period in spite of high emission reduction 10 years earlier. The impact of the inequality of NOX emission intensity of gasoline consumption () is significant in all years. This phenomenon is linked to the disparity in the quality of gasoline and the improvement of technology after 2010.
Going into details, the sharp rise in 2009–2011 is related to increasing the (see Table 3). The rise means the NOX emission intensity became more correlated to the amount of per capita gasoline consumed in this period and its importance increased. In terms of proportion of gasoline vehicles (), the slow reduction of inequality trend can be interpreted as a result of the implementation of national standards for fuel consumption by vehicles. As Wu et al. [55] noted, China 3 and China 4 gasoline standards for vehicles could reduce NOX emission. Also, regulations on alternative fuel vehicles and strict standards on fuel consumption are expected to decrease not only gasoline consumption but also NOX emission by about 67% and 59% respectively by 2030. The vehicle-use in urban population () and urbanization rate () and their relative importance have decreased, which was not predictable based on the previous studies worldwide. Based on the major achievements of the 12th FYP, the Chinese central government could amplify the urbanization rate and bring it more equal across China. The Chinese government is helping rural immigrants to move into new urban areas, especially in the central and western regions [81].
The factors and have little contribution to total inequality (see Table 3). The first term defines the interaction factor between the proportion of gasoline vehicles and per capita urban vehicles. Its sign was changed from negative to positive which indicates an increase in the number of vehicles can gradually increase the intensity of gasoline consumption. The second term is related to the interaction between vehicle use in urban population and urbanization rate which has clearly decreased.
Sichuan, Guangdong, Hunan, and Chongqing each greatly raised the inequality (see Figure 10), so each should benefit from the end-of-pipe treatment plan which, according to Ding et al. [82], has a high effect in reducing NOX emission from car exhaust in urban areas. Regarding the reports of local governments for the 12th FYP [83], Sichuan met the national targets to reduce emission and energy intensity with the aim of green development. Inner Mongolia, Xinjiang, Shanxi, and Ningxia all had less negative contributions in all years. All these provinces are located in the western region and so, based on Ding et al. [82], are potential hotspots of NOX emission needing special attention by policy makers and central government to control the local pollution.
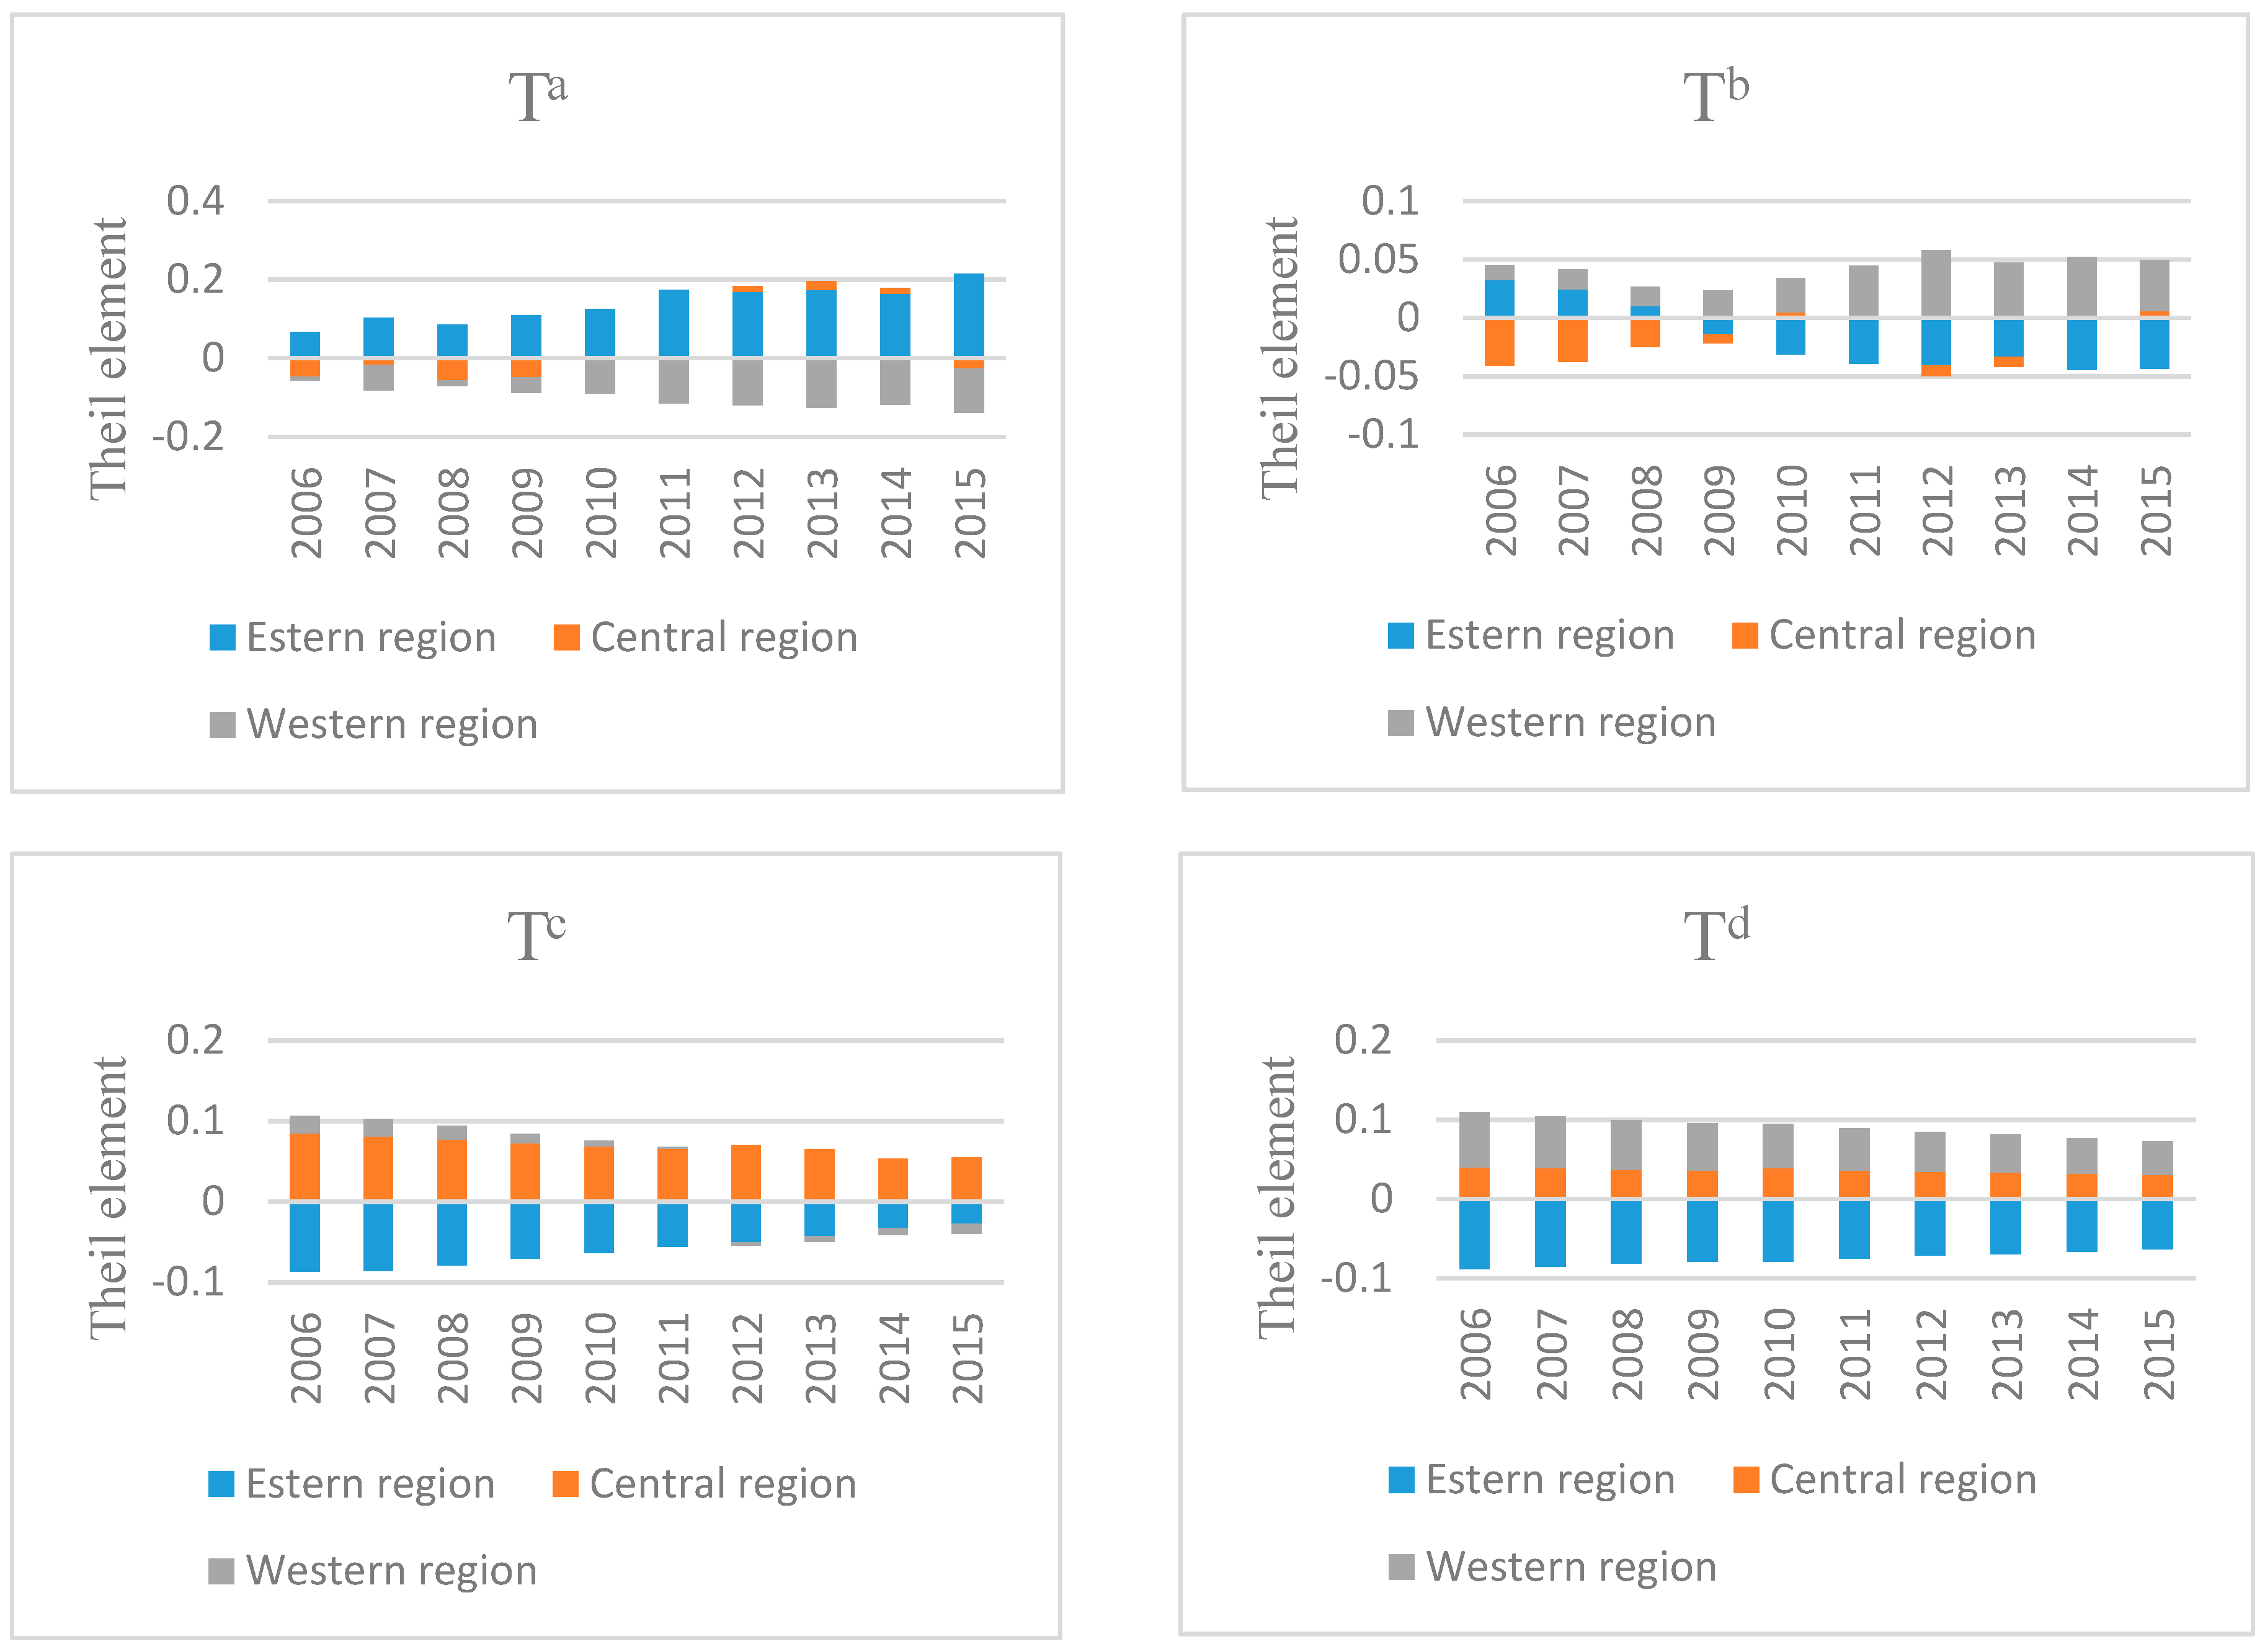
Figure 11 shows the great difference in within- and between-region inequality (). The difference implies a disparity in regional planning and this illustrates the importance of decomposition analysis. The contribution of the western region into between-region inequality () is significant in all years (see Figure 11). But for within-region inequality, the increased proportion of the NOX emission intensity of gasoline consumption () is significant in within-region inequality () (see Figure 12). The western and eastern regions are more responsible for increasing the within-region inequality (), and interestingly, it decreased after 2014 (see Figure A3). Also, the between-region inequality is rising due to the rise of inequality in NOX emission intensity of gasoline consumption () across regions (see Figure 13). This is strongly linked to the 230% growth rate of the share of the eastern region from 2006 to 2015 in total between-region inequality (see Figure A4). This dramatic growth is mostly attributed to the improvement of the quality of gasoline and technology in the eastern provinces.
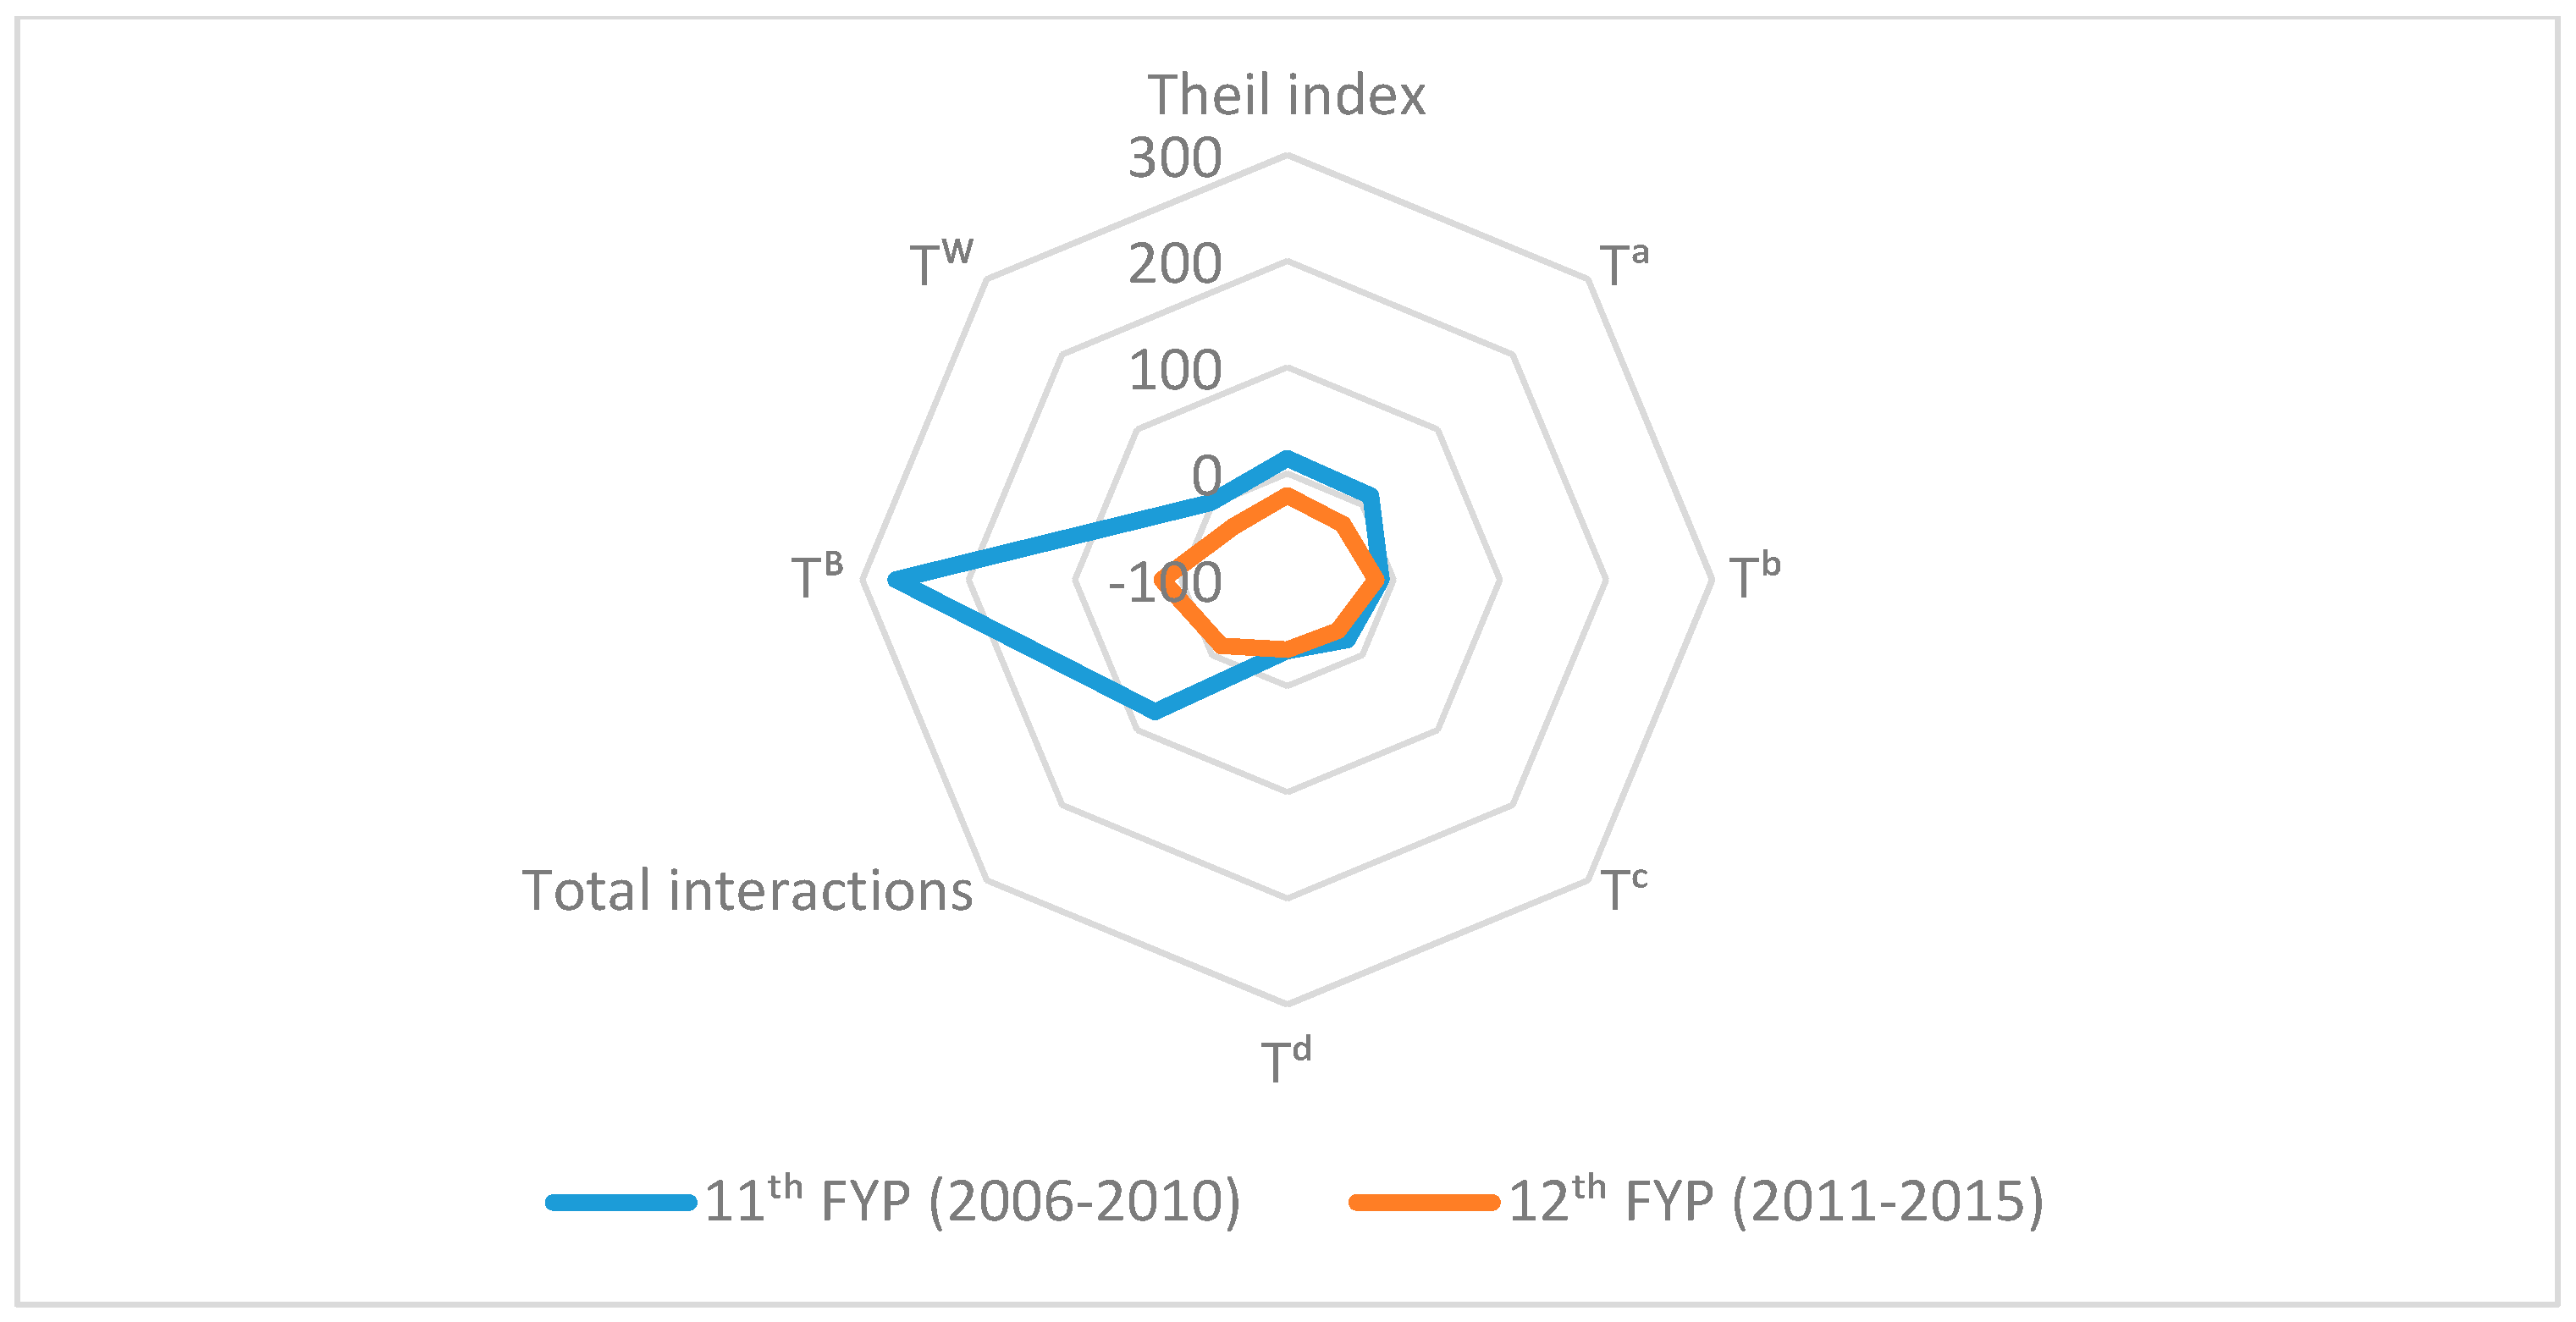
According to Figure 14, the 12th FYP had a much better effect than the 11th FYP. The significant reductions in the overall inequality and its factors indicate that China could achieve its targets under the last plan. The government policy resulted in prominent gains such as the 35% reduction of inequality in urbanization rate (). In contrast, the 268% increase in between-region inequality () under the 11th FYP is related to the large contribution of the eastern provinces in NOX emission intensity of gasoline consumption (). The difference between the plan results may reflect the abatement treatment of emission exhaust by cars which occurred in the developed provinces in 2006–2010.
5. Conclusions and Policy Implications
In China, air pollution has grown up to be a serious problem for both the people and the government because it disturbs sustainable development along with threatening people’s health. The Chinese government has implemented the number of policies to reduce air pollution [1]. Although Chinese society was able to reach its targets for the reduction of SO2 and NOX emissions during the period of the 12th FYPs [18], we investigated the level of inequality and what sources contributed to these pollutants. First, we introduced the driving factors as the sources of emissions based on the particular features of each pollutant in China according to the research literature. Then, by using an interesting method which uses Kaya factors in the Theil index [16,17], we constructed our factors to measure national and regional inequality of per capita emission as well as their decomposed factors. We selected 30 provinces and three regions for study during the 2006–2015 period.
The results for per capita SO2 emission inequality reveal that the 6% growth from 2006–2015 is mainly linked to the power intensity of GDP. Considering regional inequality, the within-region and between-region inequalities show a similar trend. Comparing the 11th and 12th FYPs, we find that most of the inequality increase is clearly connected to the 12th FYP which implemented the first comprehensive clean air policy. The rise in inequality might be the outcome of the disparity in applying this policy with a focus on the key regions, especially developed provinces. Accordingly, the bulk of regulatory application was allocated to the eastern provinces to make better air quality while, at the same time, the transfer of industry to the western provinces was making the new pollution issues there. Guangdong in the eastern China, Sichuan in the western China and Anhui in the central China have the greatest positive contribution to total inequality. Liu and Wang [84] concluded the reduction policy was the main factor that reduced SO2 emissions in these three China regions under the 11th FYP. As the consequences of government’s efforts in both FYPs, the inequality of SO2 emission intensity of coal consumption, coal intensity of power generation, and per capita GDP gradually became less, that is, the figures became more equal. These successful achievements are likely attributed to flue gas desulfurization (FGD) facilities, less coal-burning, and equal income balance respectively. The significant positive level of the interaction term between the power intensity of GDP and per capita GDP indicates the provinces which generate more power became richer. This took place as a result of economic growth in developing provinces which helps to increase their GDP but does not protect the environment.
For per capita NOX emission inequality, there is 3% growth in the whole period. However, the incremental trend was stopped and then it decreased during the period of the 12th FYP. This desirable reduction was caused by changes in NOX emission intensity of gasoline consumption which occurred probably as the result of improving the vehicle emission standards and clean fuels. The inequality of proportion of gasoline vehicles, vehicle use in urban population, and urbanization rate became insignificant. These can be interpreted as the outcome of controlling vehicular emission with exhaust treatment, strengthening public transportation in urban areas, and developing urbanization with economic structure, respectively. Sichuan in the west and Guangdong in the east contributed significantly to the total inequality. Also, the positive contribution of Sichuan was significant to within-region inequality in the western region. However, the between-region inequality increased due to better fuel quality in the eastern region from 2014 onward. The correlation factor of NOX emission intensity of gasoline consumption and per capita gasoline consumption is highly significant in all years. This can be explained by the fact that the provinces which consume more per capita gasoline emit more NOX, especially in developing provinces. In addition, the 12th FYP seemed to be more effective than the 11th FYP to decrease the level of inequality, and this success resulted in national attention to the standards of fuel, improving new electric vehicles, and accelerating the infrastructure for transportation and urbanization during the period of the 12th FYP.
To mitigate the regional inequality, the diffusion of incentive policies is suggested to transfer technology from developed regions to developing regions. For this purpose, we believe it is obligatory to use high-efficiency, low-emission equipment.
Accordingly, the economic disparity could increase SO2 emission inequality in the whole period, while the reduction of urban development disparity alleviated NOX emission inequality after 2014. These effects validate the role of the government paying more attention to economic structure of different provinces to prevent greater SO2 emission in those polluted areas. In contrast, the urban development disparity decreased in step with the NOX emission inequality from 2014 onward as a result of the construction of new urban areas and control of vehicular emissions nationwide.
Considering the existing air pollution inequality in China, especially in the western region, it is favorable to apply mitigation policy in the western region and advocate more investment in pollution abatement. As Dong et al. [28] concluded, it is more cost-effective to improve the technology and equipment for emission reduction in the western region than in the eastern region. Furthermore, Van der A et al. [45] showed the successful effect of policy implication for SO2 and NOX emissions reduction in China. We also conclude the importance of national and regional policy to alleviate inequality and achieve a balance between development and environmental protection in all regions.
Considering the importance of the interaction terms studied herein, it is a worthy future study goal to research new factors to measure inequality in both types of emissions. Also, it is suggested to use different decomposition methods to find the inequality and its sources. This study could also be extended by the provision of data about the empirical disadvantages of emission inequality in China related to important driving factors. Such research will help governments and researchers understand the policy outcomes.
Acknowledgments
We would like to acknowledge CAS-TWAS President’s Fellowship for International PhD Students funding that supported this work. We also express sincere gratitude to the anonymous referees and the editor for their helpful comments on the earlier version of the manuscript.
Author Contributions
F.F. and M.A. conceived and designed the research framework; M.A. collected data; M.A. and Y.Y. analyzed the data. All authors contributed data and analysis tools; M.A. wrote the paper. All authors read and approved the final manuscript.
Conflicts of Interest
The authors declare no conflict of interest.
Abbreviations
| SO2 | Sulfur dioxide |
| NOX | Nitrogen oxides |
| FYP | Five-Year Plan |
| NBS | National Bureau of Statistics of China |
| EKC | Environmental Kuznets curve |
Appendix A. Supplementary Figures
Figure A1.
Contribution of each region (Theil element) into , , , and for between-region inequality ( ) in terms of per capita SO2 emission using the Theil index (2006–2015). Source: Authors using NBS data.
Figure A1.
Contribution of each region (Theil element) into , , , and for between-region inequality ( ) in terms of per capita SO2 emission using the Theil index (2006–2015). Source: Authors using NBS data.

Figure A2.
Contribution of each region (Theil element) into , , , and for within-region inequality ( ) in terms of per capita SO2 emission using the Theil index (2006–2015). Source: Authors using NBS data.
Figure A2.
Contribution of each region (Theil element) into , , , and for within-region inequality ( ) in terms of per capita SO2 emission using the Theil index (2006–2015). Source: Authors using NBS data.
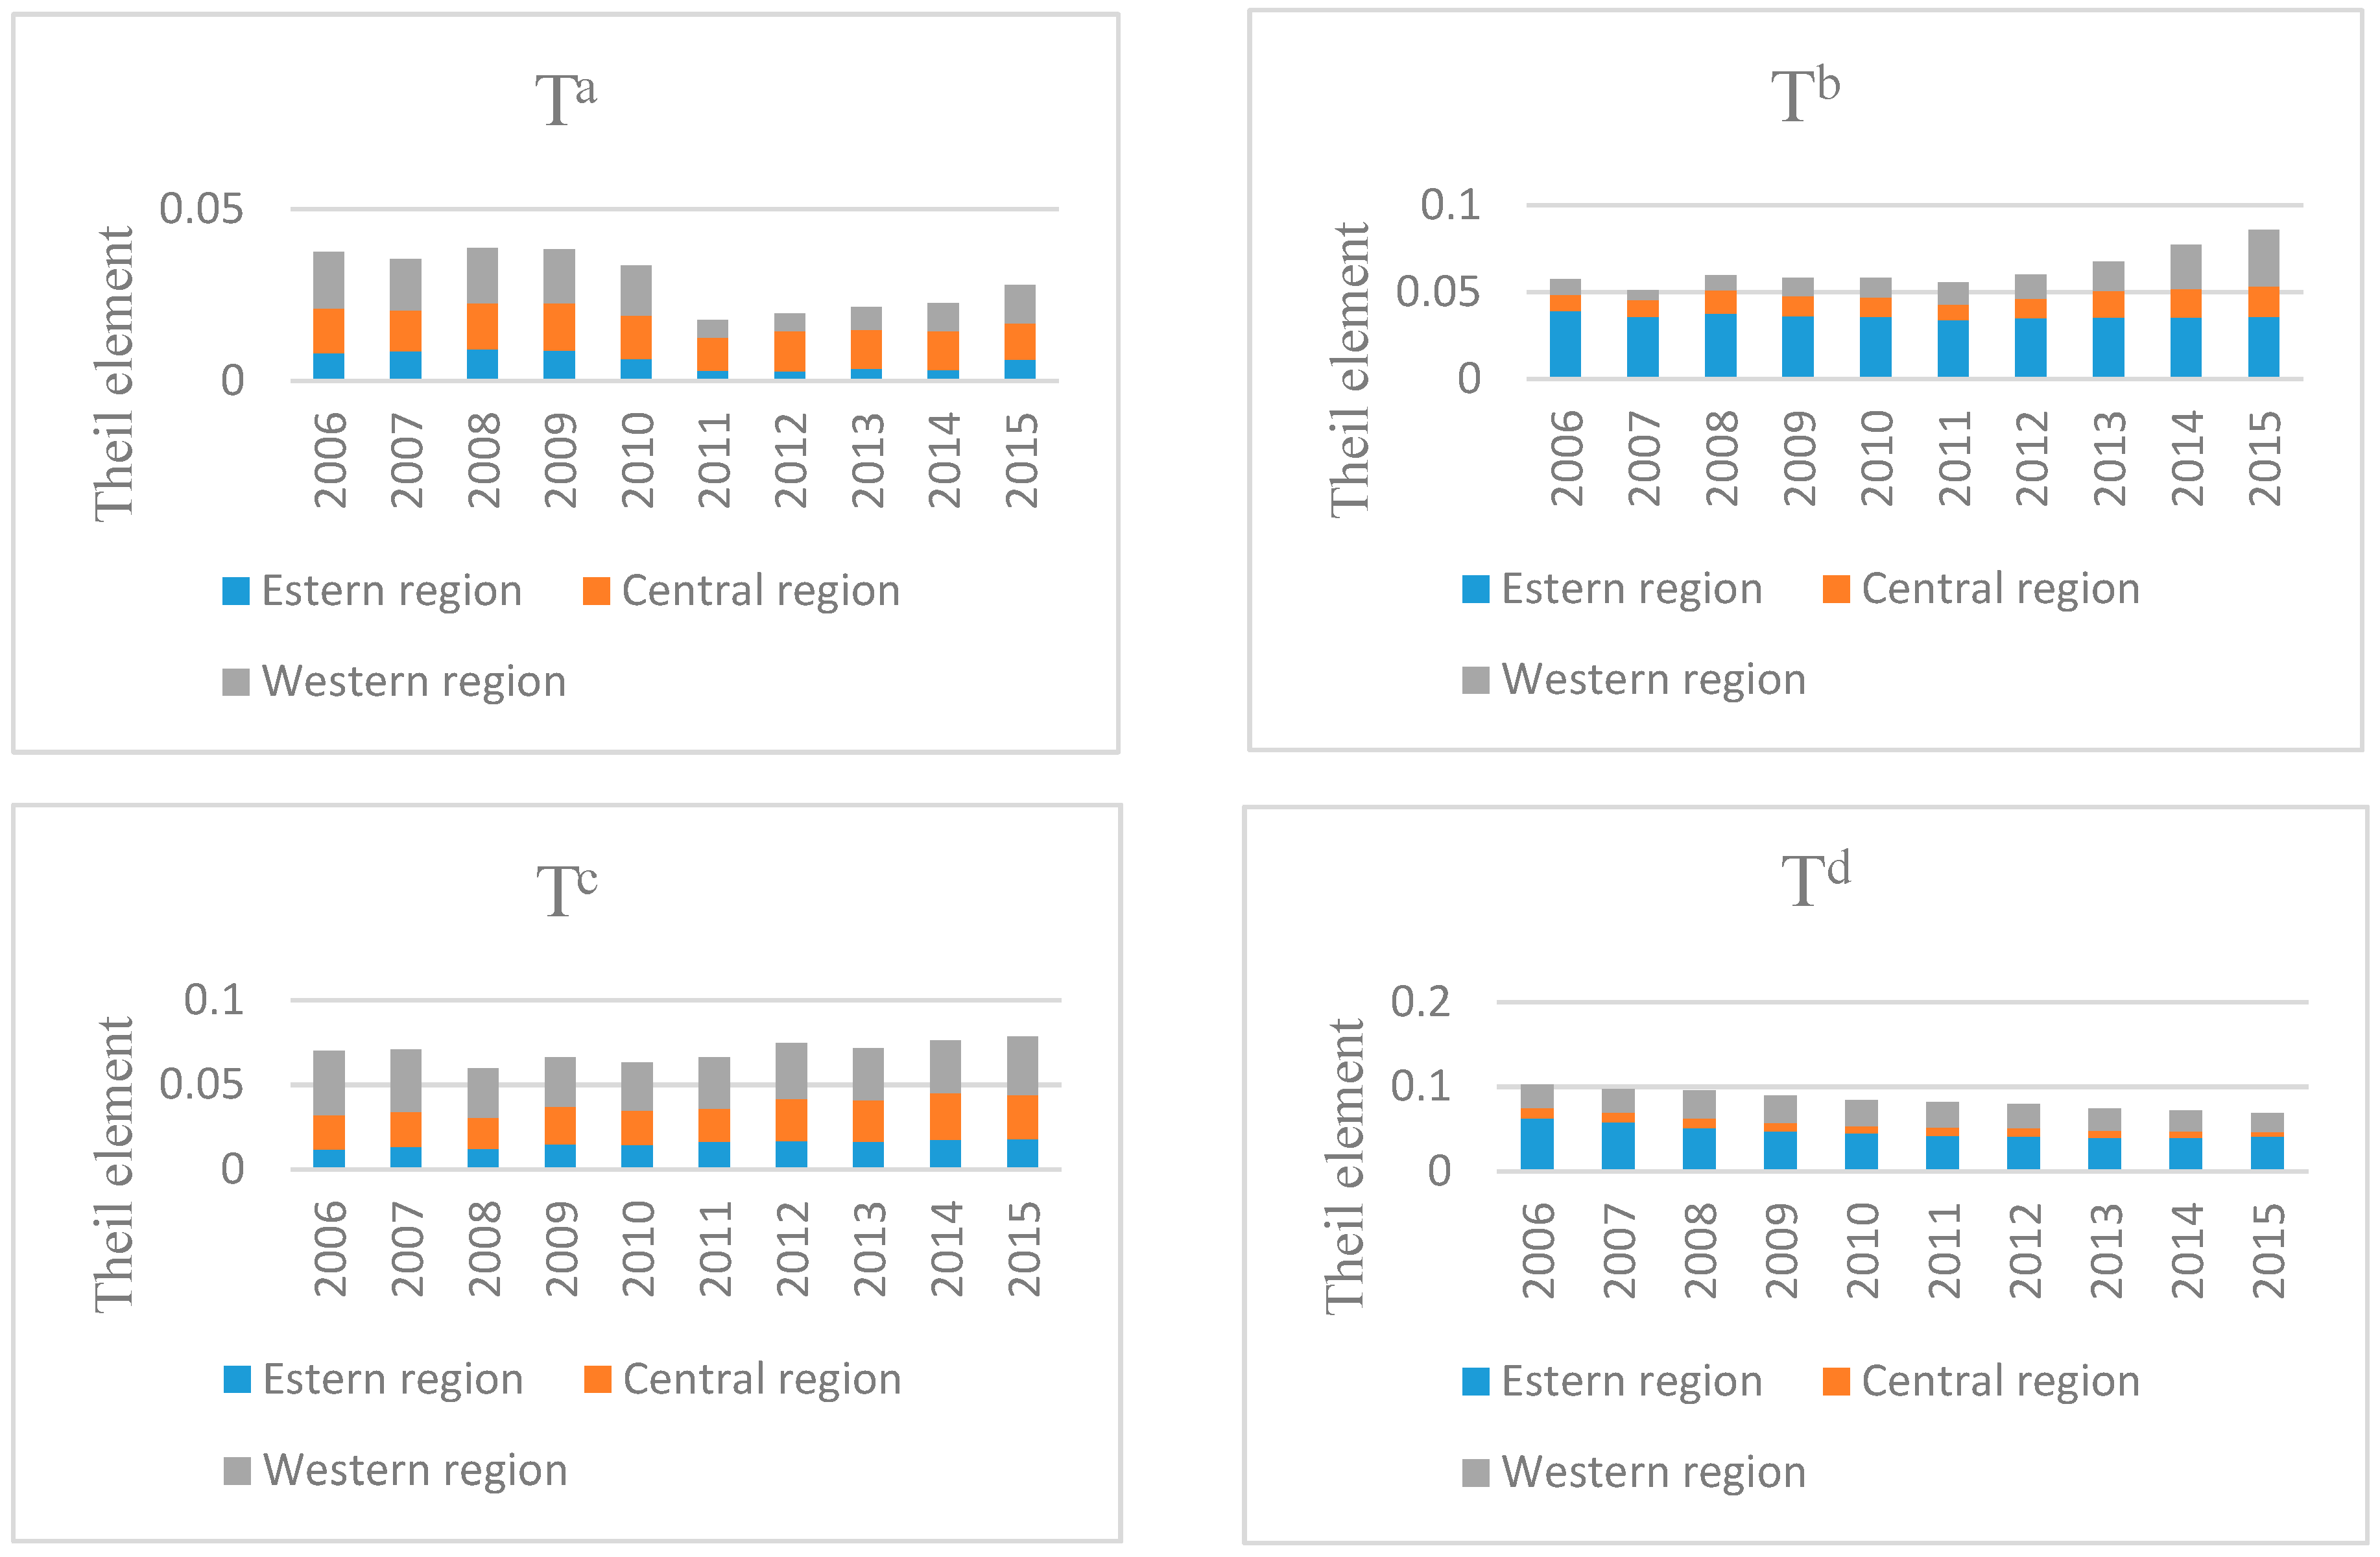
Figure A3.
Contribution of each region (Theil element) into , , , and for within-region inequality ( ) in terms of per capita NOX emission using the Theil index (2006–2015). Source: Authors using NBS data.
Figure A3.
Contribution of each region (Theil element) into , , , and for within-region inequality ( ) in terms of per capita NOX emission using the Theil index (2006–2015). Source: Authors using NBS data.

Figure A4.
Contribution of each region (Theil element) into , , , and for between-region inequality ( ) in terms of per capita NOX emission using the Theil index (2006–2015). Source: Authors using NBS data.
Figure A4.
Contribution of each region (Theil element) into , , , and for between-region inequality ( ) in terms of per capita NOX emission using the Theil index (2006–2015). Source: Authors using NBS data.

References
- Clean Air Alliance of China (CAAC). “Twelfth Five-Year Plan” on Air Pollution Prevention and Control in Key Regions (China Clean Air Policy Briefings No. 1); English Translation; Secretariat for Clean Air Alliance of China: Beijing, China, 2013; Available online: http://www.ewp.rpi.edu/hartford/~ernesto/F2013/AWPPCE/AdditionalReadings/Air/China2013AirPollutionPreventionControl.pdf (accessed on 14 June 2017).
- Clean Air Alliance of China (CAAC). China Air Quality Management Assessment Report 2015; Secretariat for Clean Air Alliance of China: Beijing, China, 2015; Available online: file:///C:/Users/moh/Downloads/China+Air+Quality+Management+Assessment+Report+%25282015%2529+English+version.pdf (accessed on 14 June 2017).
- Fu, L.; Wan, W.; Zhang, W.; Cheng, H. China Air 2016 Air Pollution Prevention and Control Progress in Chinese Cities. 2016. Available online: http://cleanairasia.org/wp-content/uploads/2016/08/China-Air-2016-Report-Full.pdf (accessed on 14 June 2017).
- Zhao, X.; Zhang, S.; Fan, C. Environmental externality and inequality in China: Current Status and future choices. Environ. Pollut. 2014, 190, 176–179. [Google Scholar] [CrossRef] [PubMed]
- Zwickl, K.; Ash, M.; Boyce, J.K. Regional variation in environmental inequality: Industrial air toxics exposure in U.S. cities. Ecol. Econ. 2014, 107, 494–509. [Google Scholar] [CrossRef]
- Ard, K. Trends in exposure to industrial air toxins for different racial and socioeconomic groups: A spatial and temporal examination of environmental inequality in the U.S. from 1995 to 2004. Soc. Sci. Res. 2015, 53, 375–390. [Google Scholar] [CrossRef] [PubMed]
- Boyce, J.K.; Zwickl, K.; Ash, M. Measuring environmental inequality. Ecol. Econ. 2016, 124, 114–123. [Google Scholar] [CrossRef]
- Yu, H.; Stuart, A.L. Exposure and inequality for select urban air pollutants in the Tampa Bay area. Sci. Total Environ. 2016, 551–552, 474–483. [Google Scholar] [CrossRef] [PubMed]
- Goodman, A.; Wilkinson, P.; Stafford, M.; Tonne, C. Characterising socio-economic inequalities in exposure to air pollution: A comparison of socio-economic markers and scales of measurement. Health Place 2011, 17, 767–774. [Google Scholar] [CrossRef] [PubMed]
- Germani, A.R.; Morone, P.; Testa, G. Environmental justice and air pollution: A case study on Italian provinces. Ecol. Econ. 2014, 106, 69–82. [Google Scholar] [CrossRef] [Green Version]
- Padilla, C.M.; Kihal-Talantikite, W.; Vieira, V.M.; Rossello, P.; Nir, G.L.; Zmirou-Navier, D.; Deguen, S. Air quality and social deprivation in four French metropolitan areas? A localized spatio-temporal environmental inequality analysis. Environ. Res. 2014, 134, 315–324. [Google Scholar] [CrossRef] [PubMed]
- Fecht, D.; Fischer, P.; Fortunato, L.; Hoek, G.; de Hoogh, K.; Marra, M.; Hansell, A. Associations between air pollution and socioeconomic characteristics, ethnicity and age profile of neighbourhoods in England and the Netherlands. Environ. Pollut. 2015, 198, 201–210. [Google Scholar] [CrossRef] [PubMed]
- Rodríguez-rosa, M.; Gallego-álvarez, I. Are Social, Economic and Environmental Well-Being Equally Important in all Countries around the World? A Study by Income. Soc. Indic. Res. 2017. [Google Scholar] [CrossRef]
- Kaya, Y. Impact of Carbon Dioxide Emission Control on GNP Growth: Interpretation of Proposed Scenarios; IPCC: Paris, France, 1989. [Google Scholar]
- Rafaj, P.; Amann, M.; Siri, J.; Wuester, H. Changes in European greenhouse gas and air pollutant emissions 1960–2010: Decomposition of determining factors. Clim. Chang. 2014, 124, 477–504. [Google Scholar] [CrossRef]
- Duro, J.A.; Padilla, E. International inequalities in per capita CO2 emissions: A decomposition methodology by Kaya factors. Energy Econ. 2006, 28, 170–187. [Google Scholar] [CrossRef]
- Remuzgo, L.; Sarabia, J.M. International inequality in CO2 emissions: A new factorial decomposition based on Kaya factors. Environ. Sci. Policy 2015, 54, 15–24. [Google Scholar] [CrossRef]
- Ministry of Environmental Protection of the People’s Republic of China (MEP). Report on the State of the Environment in China; Ministry of Environmental Protection of the People’s Republic of China: Beijing, China, 2015. Available online: http://english.sepa.gov.cn/Resources/Reports/soe/Report/201706/P020170614504782926467.pdf (accessed on 16 November 2017).
- Theil, H. Economics and Information Theory; North-Holland Pub. Co.: Amsterdam, The Netherlands, 1967. [Google Scholar]
- Klimont, Z.; Smith, S.J.; Cofala, J. The last decade of global anthropogenic sulfur dioxide: 2000–2011 emissions. Environ. Res. Lett. 2013, 8, 14003. [Google Scholar] [CrossRef]
- Amann, M.; Klimont, Z.; Wagner, F. Regional and Global Emissions of Air Pollutants: Recent Trends and Future Scenarios. Annu. Rev. Environ. Resour. 2013, 38, 31–55. [Google Scholar] [CrossRef]
- Zhao, B.; Wang, S.; Wang, J.; Fu, J.S.; Liu, T.; Xu, J.; Hao, J. Impact of national NOX and SO2 control policies on particulate matter pollution in China. Atmos. Environ. 2013, 77, 453–463. [Google Scholar] [CrossRef]
- Lin, H.; Liu, T.; Xiao, J.; Zeng, W.; Li, X.; Guo, L.; Ma, W. Mortality burden of ambient fine particulate air pollution in six Chinese cities: Results from the Pearl River Delta study. Environ. Int. 2016, 96, 91–97. [Google Scholar] [CrossRef] [PubMed]
- Xia, Y.; Guan, D.; Jiang, X.; Peng, L.; Schroeder, H.; Zhang, Q. Assessment of socioeconomic costs to Chinas air pollution. Atmos. Environ. 2016, 139, 147–156. [Google Scholar] [CrossRef]
- Buehn, A.; Farzanegan, M.R. Hold your breath: A new index of air pollution. Energy Econ. 2013, 37, 104–113. [Google Scholar] [CrossRef]
- Branis, M.; Linhartova, M. Association between unemployment, income, education level, population size and air pollution in Czech cities: Evidence for environmental inequality? A pilot national scale analysis. Health Place 2012, 18, 1110–1114. [Google Scholar] [CrossRef] [PubMed]
- Schoolman, E.D.; Ma, C. Migration, class and environmental inequality: Exposure to pollution in China’s Jiangsu Province. Ecol. Econ. 2012, 75, 140–151. [Google Scholar] [CrossRef]
- Dong, L.; Dong, H.; Fujita, T.; Geng, Y.; Fujii, M. Cost-effectiveness analysis of China’s Sulfur dioxide control strategy at the regional level: Regional disparity, inequity and future challenges. J. Clean Prod. 2015, 90, 345–359. [Google Scholar] [CrossRef]
- Su, J.G.; Morello-Frosch, R.; Jesdale, B.M.; Kyle, A.D.; Shamasunder, B.; Jerrett, M. An index for assessing demographic inequalities in cumulative environmental hazards with application to Los Angeles, California. Environ. Sci. Technol. 2009, 43, 7626–7634. [Google Scholar] [CrossRef] [PubMed]
- Romero-Lankao, P.; Qin, H.; Borbor-Cordova, M. Exploration of health risks related to air pollution and temperature in three Latin American cities. Soc. Sci. Med. 2013, 83, 110–118. [Google Scholar] [CrossRef] [PubMed]
- Moreno-Jiménez, A.; Cañada-Torrecilla, R.; Vidal-Domínguez, M.J.; Palacios-García, A.; Martínez-Suárez, P. Assessing environmental justice through potential exposure to air pollution: A socio-spatial analysis in Madrid and Barcelona, Spain. Geoforum 2016, 69, 117–131. [Google Scholar] [CrossRef]
- Gu, D.; Wang, Y.; Smeltzer, C.; Liu, Z. Reduction in NOX emission trends over China: Regional and seasonal variations. Environ. Sci. Technol. 2013, 47, 12912–12919. [Google Scholar] [CrossRef] [PubMed]
- Hao, Y.; Zhang, Q.; Zhong, M.; Li, B. Is there convergence in per capita SO2 emissions in China? An empirical study using city-level panel data. J. Clean Prod. 2015, 108, 944–954. [Google Scholar] [CrossRef]
- Lyu, W.; Li, Y.; Guan, D.; Zhao, H.; Zhang, Q.; Liu, Z. Driving forces of Chinese primary air pollution emissions: An index decomposition analysis. J. Clean Prod. 2016, 133, 136–144. [Google Scholar] [CrossRef]
- Kanada, M.; Dong, L.; Fujita, T.; Fujii, M.; Inoue, T.; Hirano, Y.; Geng, Y. Regional disparity and cost-effective SO2 pollution control in China: A case study in 5 mega-cities. Energy Policy 2013, 61, 1322–1331. [Google Scholar] [CrossRef]
- Grossman, G.M.; Krueger, A.B. Environmental Impacts of a North American Free Trade Agreement; Working Paper Series; No. 3914; National Bureau of Economic Research: Cambridge, MA, USA, 1991; pp. 1–57. Available online: http://www.nber.org/papers/w3914.pdf (accessed on 13 June 2017).
- Wang, Y.; Han, R.; Kubota, J. Is there an Environmental Kuznets Curve for SO2 emissions? A semi-parametric panel data analysis for China. Renew. Sustain. Energy Rev. 2016, 54, 1182–1188. [Google Scholar] [CrossRef]
- Llorca, M.; Meunié, A. SO2 emissions and the environmental Kuznets curve: The case of Chinese provinces. J. Chin. Econ. Bus. Stud. 2009, 7, 1–16. [Google Scholar] [CrossRef]
- National Bureau of Statistics of China (NBS). National Data, Annual by Province; National Bureau of Statistics of China: Beijing, China, 2015. Available online: http://data.stats.gov.cn/english/easyquery.htm?cn=E0103 (accessed on 25 December 2016).
- Lu, Z.; Streets, D.G.; Zhang, Q.; Wang, S.; Carmichael, G.R.; Cheng, Y.F.; Tan, Q. Sulfur dioxide emissions in China and sulfur trends in East Asia since 2000. Atmos. Chem. Phys. 2010, 10, 6311–6331. [Google Scholar] [CrossRef]
- Yang, X.; Wang, S.; Zhang, W.; Li, J.; Zou, Y. Impacts of energy consumption, energy structure, and treatment technology on SO2 emissions: A multi-scale LMDI decomposition analysis in China. Appl. Energy 2016, 184, 714–726. [Google Scholar] [CrossRef]
- Qu, Y.; An, J.; He, Y.; Zheng, J. An overview of emissions of SO2 and NOX and the long-range transport of oxidized sulfur and nitrogen pollutants in East Asia. J. Environ. Sci. 2016, 44, 13–25. [Google Scholar] [CrossRef] [PubMed]
- Li, X.; Wu, X.; Zhang, F. A method for analyzing pollution control policies: Application to SO2 emissions in China. Energy Econ. 2015, 49, 451–459. [Google Scholar] [CrossRef]
- Huang, L.; Hu, J.; Chen, M. Impacts of power generation on air quality in China—Part I: An overview. Resour. Conserv. Recycl. 2017, 121, 103–114. [Google Scholar] [CrossRef]
- Van Der A, R.J.; Mijling, B.; Ding, J.; Elissavet Koukouli, M.; Liu, F.; Li, Q.; Theys, N. Cleaning up the air: Effectiveness of air quality policy for SO2 and NOX emissions in China. Atmos. Chem. Phys. 2017, 17, 1775–1789. [Google Scholar] [CrossRef]
- Yang, L.; Li, J. Rebound effect in China: Evidence from the power generation sector. Renew. Sustain. Energy Rev. 2017, 71, 53–62. [Google Scholar] [CrossRef]
- Zhang, Q.; Weili, T.; Yumei, W.; Yingxu, C. External costs from electricity generation of China up to 2030 in energy and abatement scenarios. Energy Policy 2007, 35, 4295–4304. [Google Scholar] [CrossRef]
- Cheng, Y.S.; Wong, W.K.; Woo, C.K. How much have electricity shortages hampered China’s GDP growth? Energy Policy 2013, 55, 369–373. [Google Scholar] [CrossRef]
- Lin, B.; Liu, C. Why is electricity consumption inconsistent with economic growth in China? Energy Policy 2016, 88, 310–316. [Google Scholar] [CrossRef]
- Teixidó-Figueras, J.; Steinberger, J.K.; Krausmann, F.; Haberl, H.; Wiedmann, T.; Peters, G.P.; Kastner, T. International inequality of environmental pressures: Decomposition and comparative analysis. Ecol. Indic. 2016, 62, 163–173. [Google Scholar] [CrossRef]
- Knill, C.; Schulze, K.; Tosun, J. Regulatory policy outputs and impacts: Exploring a complex relationship. Regul. Gov. 2012, 6, 427–444. [Google Scholar] [CrossRef]
- Lung, S.-C.C.; Lee, C.-R.; Hu, S.-C. Inequality of Asian-type neighborhood environmental quality in communities with different urbanization levels. Environ. Sci. Policy 2014, 38, 1–10. [Google Scholar] [CrossRef]
- Liu, J.; Zhu, T. NOX in Chinese Megacities. Disposal of Dangerous Chemicals in Urban Areas and Mega Cities: Role of Oxides and Acids of Nitrogen in Atmospheric Chemistry; Barnes, I., Rudziński, K.J., Eds.; Springer: Dordrecht, The Netherlands, 2013; pp. 249–263. [Google Scholar]
- Wang, S.; Xing, J.; Zhao, B.; Jang, C.; Hao, J. Effectiveness of national air pollution control policies on the air quality in metropolitan areas of China. J. Environ. Sci. 2014, 26, 13–22. [Google Scholar] [CrossRef]
- Wu, Y.; Zhang, S.; Hao, J.; Liu, H.; Wu, X.; Hu, J.; Stevanovic, S. On-road vehicle emissions and their control in China: A review and outlook. Sci. Total Environ. 2017, 574, 332–349. [Google Scholar] [CrossRef] [PubMed]
- Gu, B.; Dong, X.; Peng, C.; Luo, W.; Chang, J.; Ge, Y. The long-term impact of urbanization on nitrogen patterns and dynamics in Shanghai, China. Environ. Pollut. 2012, 171, 30–37. [Google Scholar] [CrossRef] [PubMed]
- Deng, Y.; Chen, C.; Li, Q.; Hu, Q.; Yuan, H.; Li, J.; Li, Y. Measurements of real-world vehicle CO and NOX fleet average emissions in urban tunnels of two cities in China. Atmos. Environ. 2015, 122, 417–426. [Google Scholar] [CrossRef]
- Streets, D.; Waldhoff, S. Present and future emissions of air pollutants in China. Atmos. Environ. 2000, 34, 363–374. [Google Scholar] [CrossRef]
- Zhao, B.; Wang, S.X.; Liu, H.; Xu, J.Y.; Fu, K.; Klimont, Z.; Amann, M. NOX emissions in China: Historical trends and future perspectives. Atmos. Chem. Phys. 2013, 13, 9869–9897. [Google Scholar] [CrossRef] [Green Version]
- Yao, Z.; Wu, B.; Wu, Y.; Cao, X.; Jiang, X. Comparison of NOX emissions from China III and China IV in-use diesel trucks based on on-road measurements. Atmos. Environ. 2015, 123, 1–8. [Google Scholar] [CrossRef]
- Tang, G.; Chao, N.; Wang, Y.; Chen, J. Vehicular emissions in China in 2006 and 2010. J. Environ. Sci. 2016, 48, 179–192. [Google Scholar] [CrossRef] [PubMed]
- Liu, F.; Zhang, Q.; Zheng, B.; Tong, D.; Yan, L.; Zheng, Y.; He, K. Recent reduction in NOX emissions over China: Synthesis of satellite observations and emission inventories. Environ. Res. Lett. 2016, 11, 114002. [Google Scholar] [CrossRef]
- Shi, Y.; Xia, Y.; Lu, B.; Liu, N.; Zhang, L.; Li, S.; Li, W. Emission inventory and trends of NOX for China, 2000–2020. J. Zhejiang Univ.-SCI A 2014, 15, 454–464. [Google Scholar] [CrossRef]
- Ministry of Environmental Protection of the People’s Republic of China (MEP). China Vehicle Emission Control Annual Report; Ministry of Environmental Protection of the People’s Republic of China: Beijing, China, 2010. Available online: http://www.vecc-mep.org.cn/news/e_home_gg/2010engreport.pdf (accessed on 6 June 2017).
- Ministry of Environmental Protection of the People’s Republic of China (MEP). China Vehicle Emission Control Annual Report; Ministry of Environmental Protection of the People’s Republic of China: Beijing, China, 2015. Available online: http://dqhj.mep.gov.cn/jdchjgl/zhgldt/201605/P020160513584304398771.pdf (accessed on 6 June 2017). (In Chinese)
- Ministry of Environmental Protection of the People’s Republic of China (MEP). Annual Report on Environmental Statistics 2006–2014; Ministry of Environmental Protection of the People’s Republic of China: Beijing, China, 2016. Available online: https://wenku.baidu.com/view/441928f458fb770bf68a552d.html?from=search (accessed on 5 May 2017). (In Chinese)
- Ang, B.W.; Zhang, F.Q. A survey of index decomposition analysis in energy and environmental studies. Energy 2000, 25, 1149–1176. [Google Scholar] [CrossRef]
- Ang, B. Decomposition analysis for policymaking in energy. Energy Policy 2004, 32, 1131–1139. [Google Scholar] [CrossRef]
- Bourguignon, F. Decomposable income inequality measures. J. Econom. Soc. 1979, 47, 901–920. [Google Scholar] [CrossRef]
- Padilla, E.; Serrano, A. Inequality in CO2 emissions across countries and its relationship with income inequality: A distributive approach. Energy Policy 2006, 34, 1762–1772. [Google Scholar] [CrossRef]
- Clarke-Sather, A.; Qu, J.; Wang, Q.; Zeng, J.; Li, Y. Carbon inequality at the sub-national scale: A case study of provincial-level inequality in CO2 emissions in China 1997–2007. Energy Policy 2011, 39, 5420–5428. [Google Scholar] [CrossRef]
- Duro, J.A. The international distribution of energy intensities: Some synthetic results. Energy Policy 2015, 83, 257–266. [Google Scholar] [CrossRef]
- Sauter, C.; Grether, J.-M.; Mathys, N.A. Geographical spread of global emissions: Within-country inequalities are large and increasing. Energy Policy 2016, 89, 138–149. [Google Scholar] [CrossRef]
- Duro, J.A.; Teixidó-Figueras, J.; Padilla, E. Empirics of the International Inequality in CO2 Emissions Intensity: Explanatory Factors According to Complementary Decomposition Methodologies. Environ. Resour. Econ. 2016, 63, 57–77. [Google Scholar] [CrossRef]
- Harper, S.; Ruder, E.; Roman, A.H.; Geggel, A.; Nweke, O.; Payne-Sturges, D.; Levy, I.J. Using Inequality Measures to Incorporate Environmental Justice into Regulatory Analyses. Int. J. Environ. Res. Public Health 2013, 10, 4039–4059. [Google Scholar] [CrossRef] [PubMed] [Green Version]
- Zhang, W.; Bao, S. Created unequal: China’s regional pay inequality and its relationship with mega-trend urbanization. Appl. Geogr. 2015, 61, 81–93. [Google Scholar] [CrossRef]
- Padilla, E.; Duro, J.A. Explanatory factors of CO2 per capita emission inequality in the European Union. Energy Policy 2013, 62, 1320–1328. [Google Scholar] [CrossRef]
- Zhao, G.; Guerrero, J.M.; Pei, Y. Marginal generation technology in the Chinese power market towards 2030 based on consequential life cycle assessment. Energies 2016, 9, 788. [Google Scholar] [CrossRef]
- Zhang, C.; Zhao, W. Panel estimation for income inequality and CO2 emissions: A regional analysis in China. Appl. Energy 2014, 136, 382–392. [Google Scholar] [CrossRef]
- Gao, C.; Yin, H.; Ai, N.; Huang, Z. Historical Analysis of SO2 Pollution Control Policies in China. Environ. Manag. 2009, 43, 447–457. [Google Scholar] [CrossRef] [PubMed]
- National People’s Congress of the People’s Republic of China (NPC). Report on the Work of the Government. 2016. Available online: http://www.npc.gov.cn/englishnpc/Speeches/2016-03/18/content_1985677.htm (accessed on 10 June 2017).
- Ding, L.; Liu, C.; Chen, K.; Huang, Y.; Diao, B. Atmospheric pollution reduction effect and regional predicament: An empirical analysis based on the Chinese provincial NOX emissions. J. Environ. Manag. 2017, 196, 178–187. [Google Scholar] [CrossRef] [PubMed]
- Sichuan Provincial People’s Government (SPPG). Report on the Work of the Government. 2016. Available online: http://www.sc.gov.cn/10462/10758/10760/10766/2016/2/23/10370523.shtml (accessed on 12 June 2017).
- Liu, Q.; Wang, Q. Pathways to SO2 emissions reduction in China for 1995–2010: Based on decomposition analysis. Environ. Sci. Policy 2013, 33, 405–415. [Google Scholar] [CrossRef]
Figure 1.
Trajectory of China SO2 and NOX emissions and their per capita (2006–2015). Source: Authors using NBS data.
Figure 1.
Trajectory of China SO2 and NOX emissions and their per capita (2006–2015). Source: Authors using NBS data.
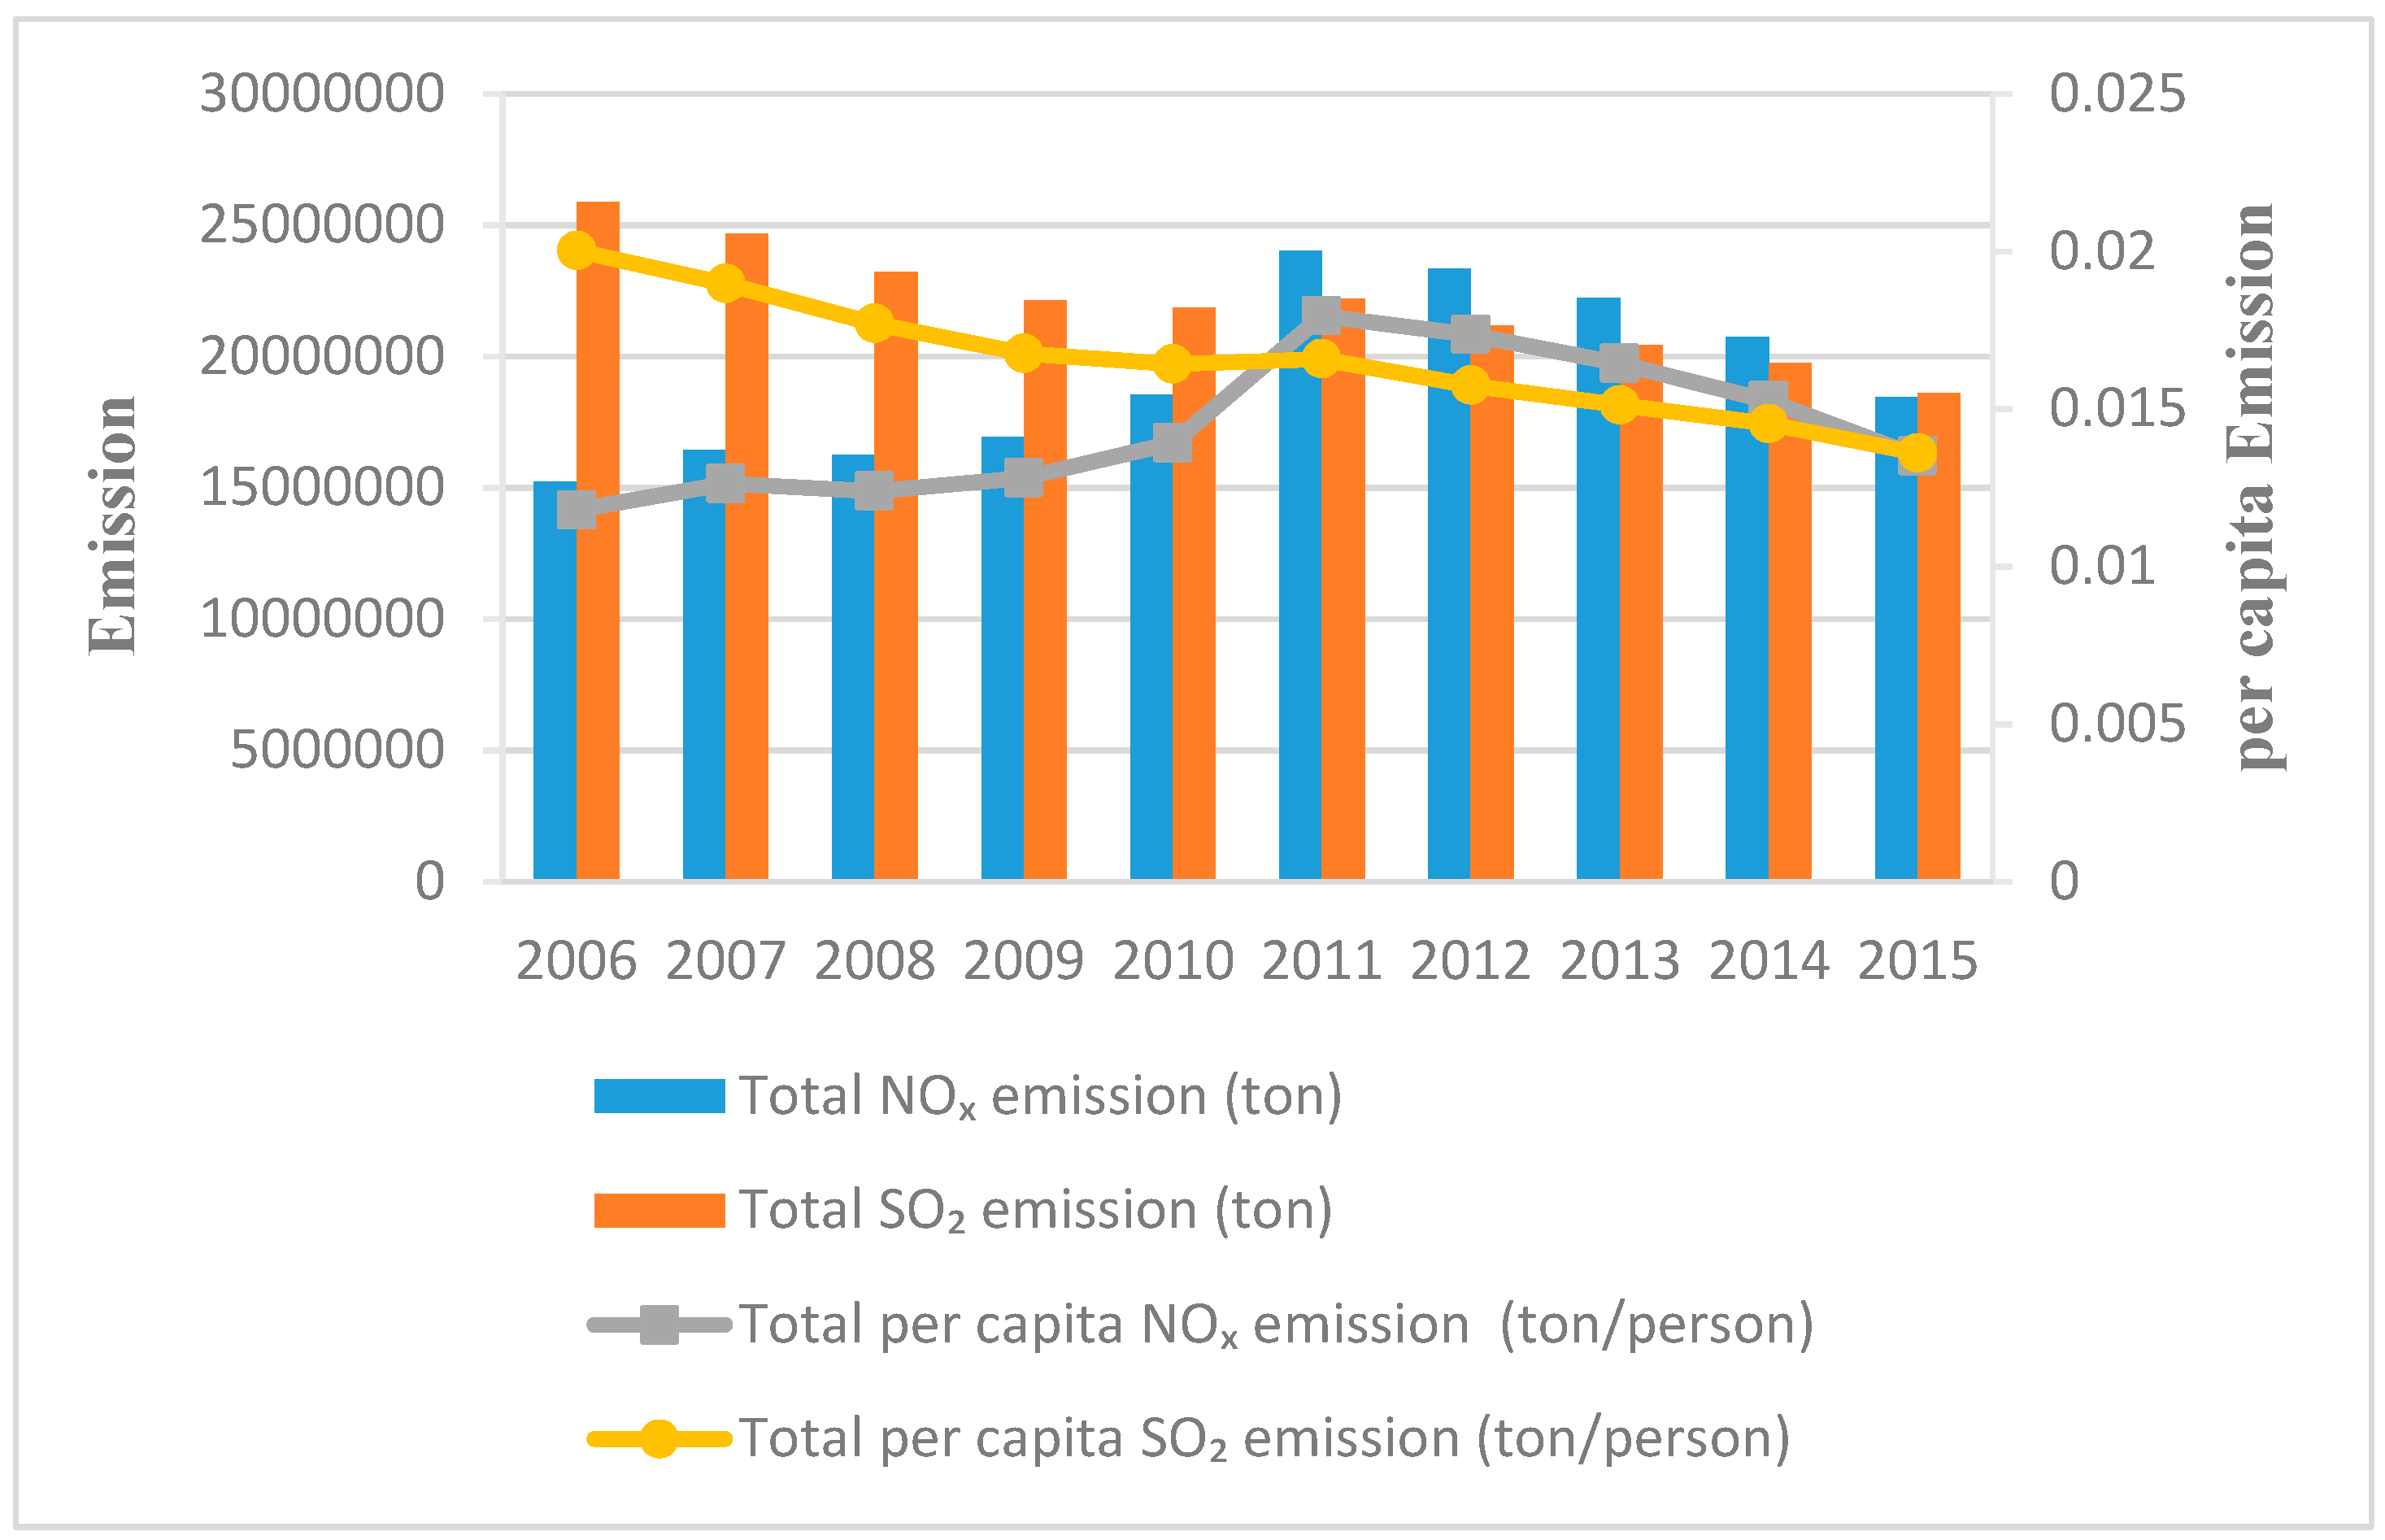
Figure 2.
Map of China provinces into 3 regions. Source: Authors using NBS data.
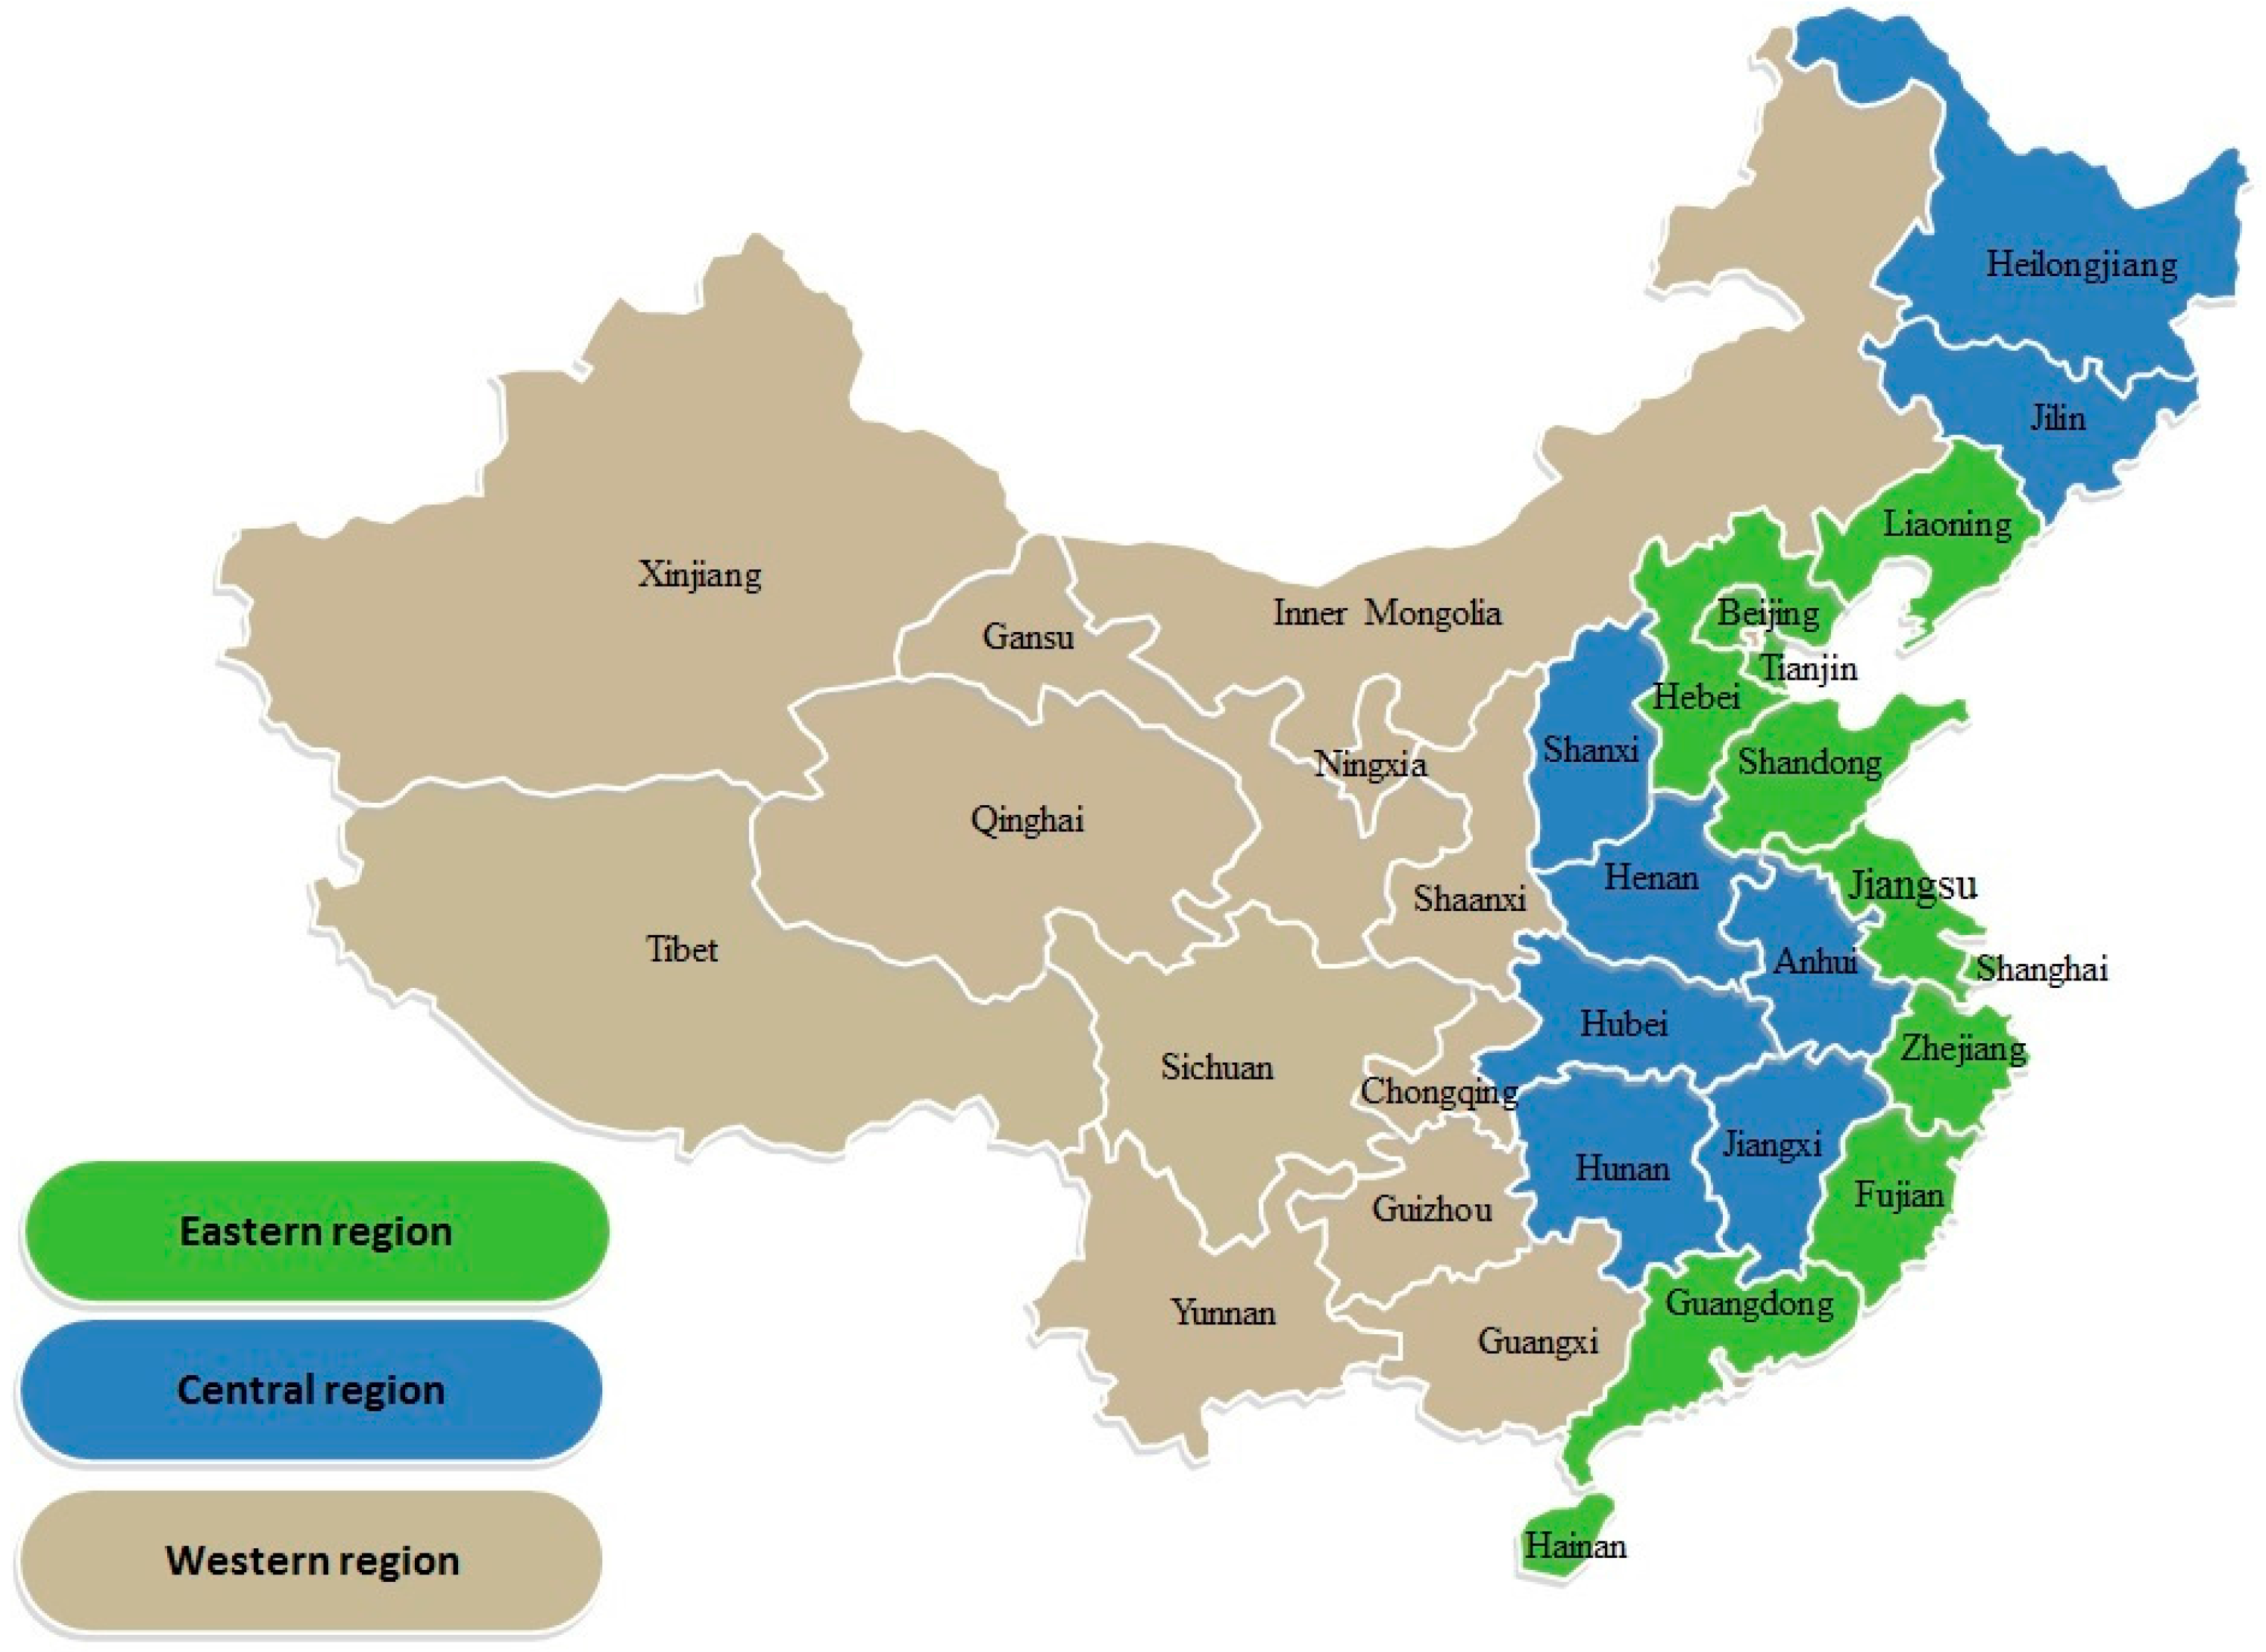
Figure 3.
Trajectory of China inequality in terms of per capita SO2 emission and its driving factors using the Theil index (2006–2015). Source: Authors using NBS data.
Figure 3.
Trajectory of China inequality in terms of per capita SO2 emission and its driving factors using the Theil index (2006–2015). Source: Authors using NBS data.
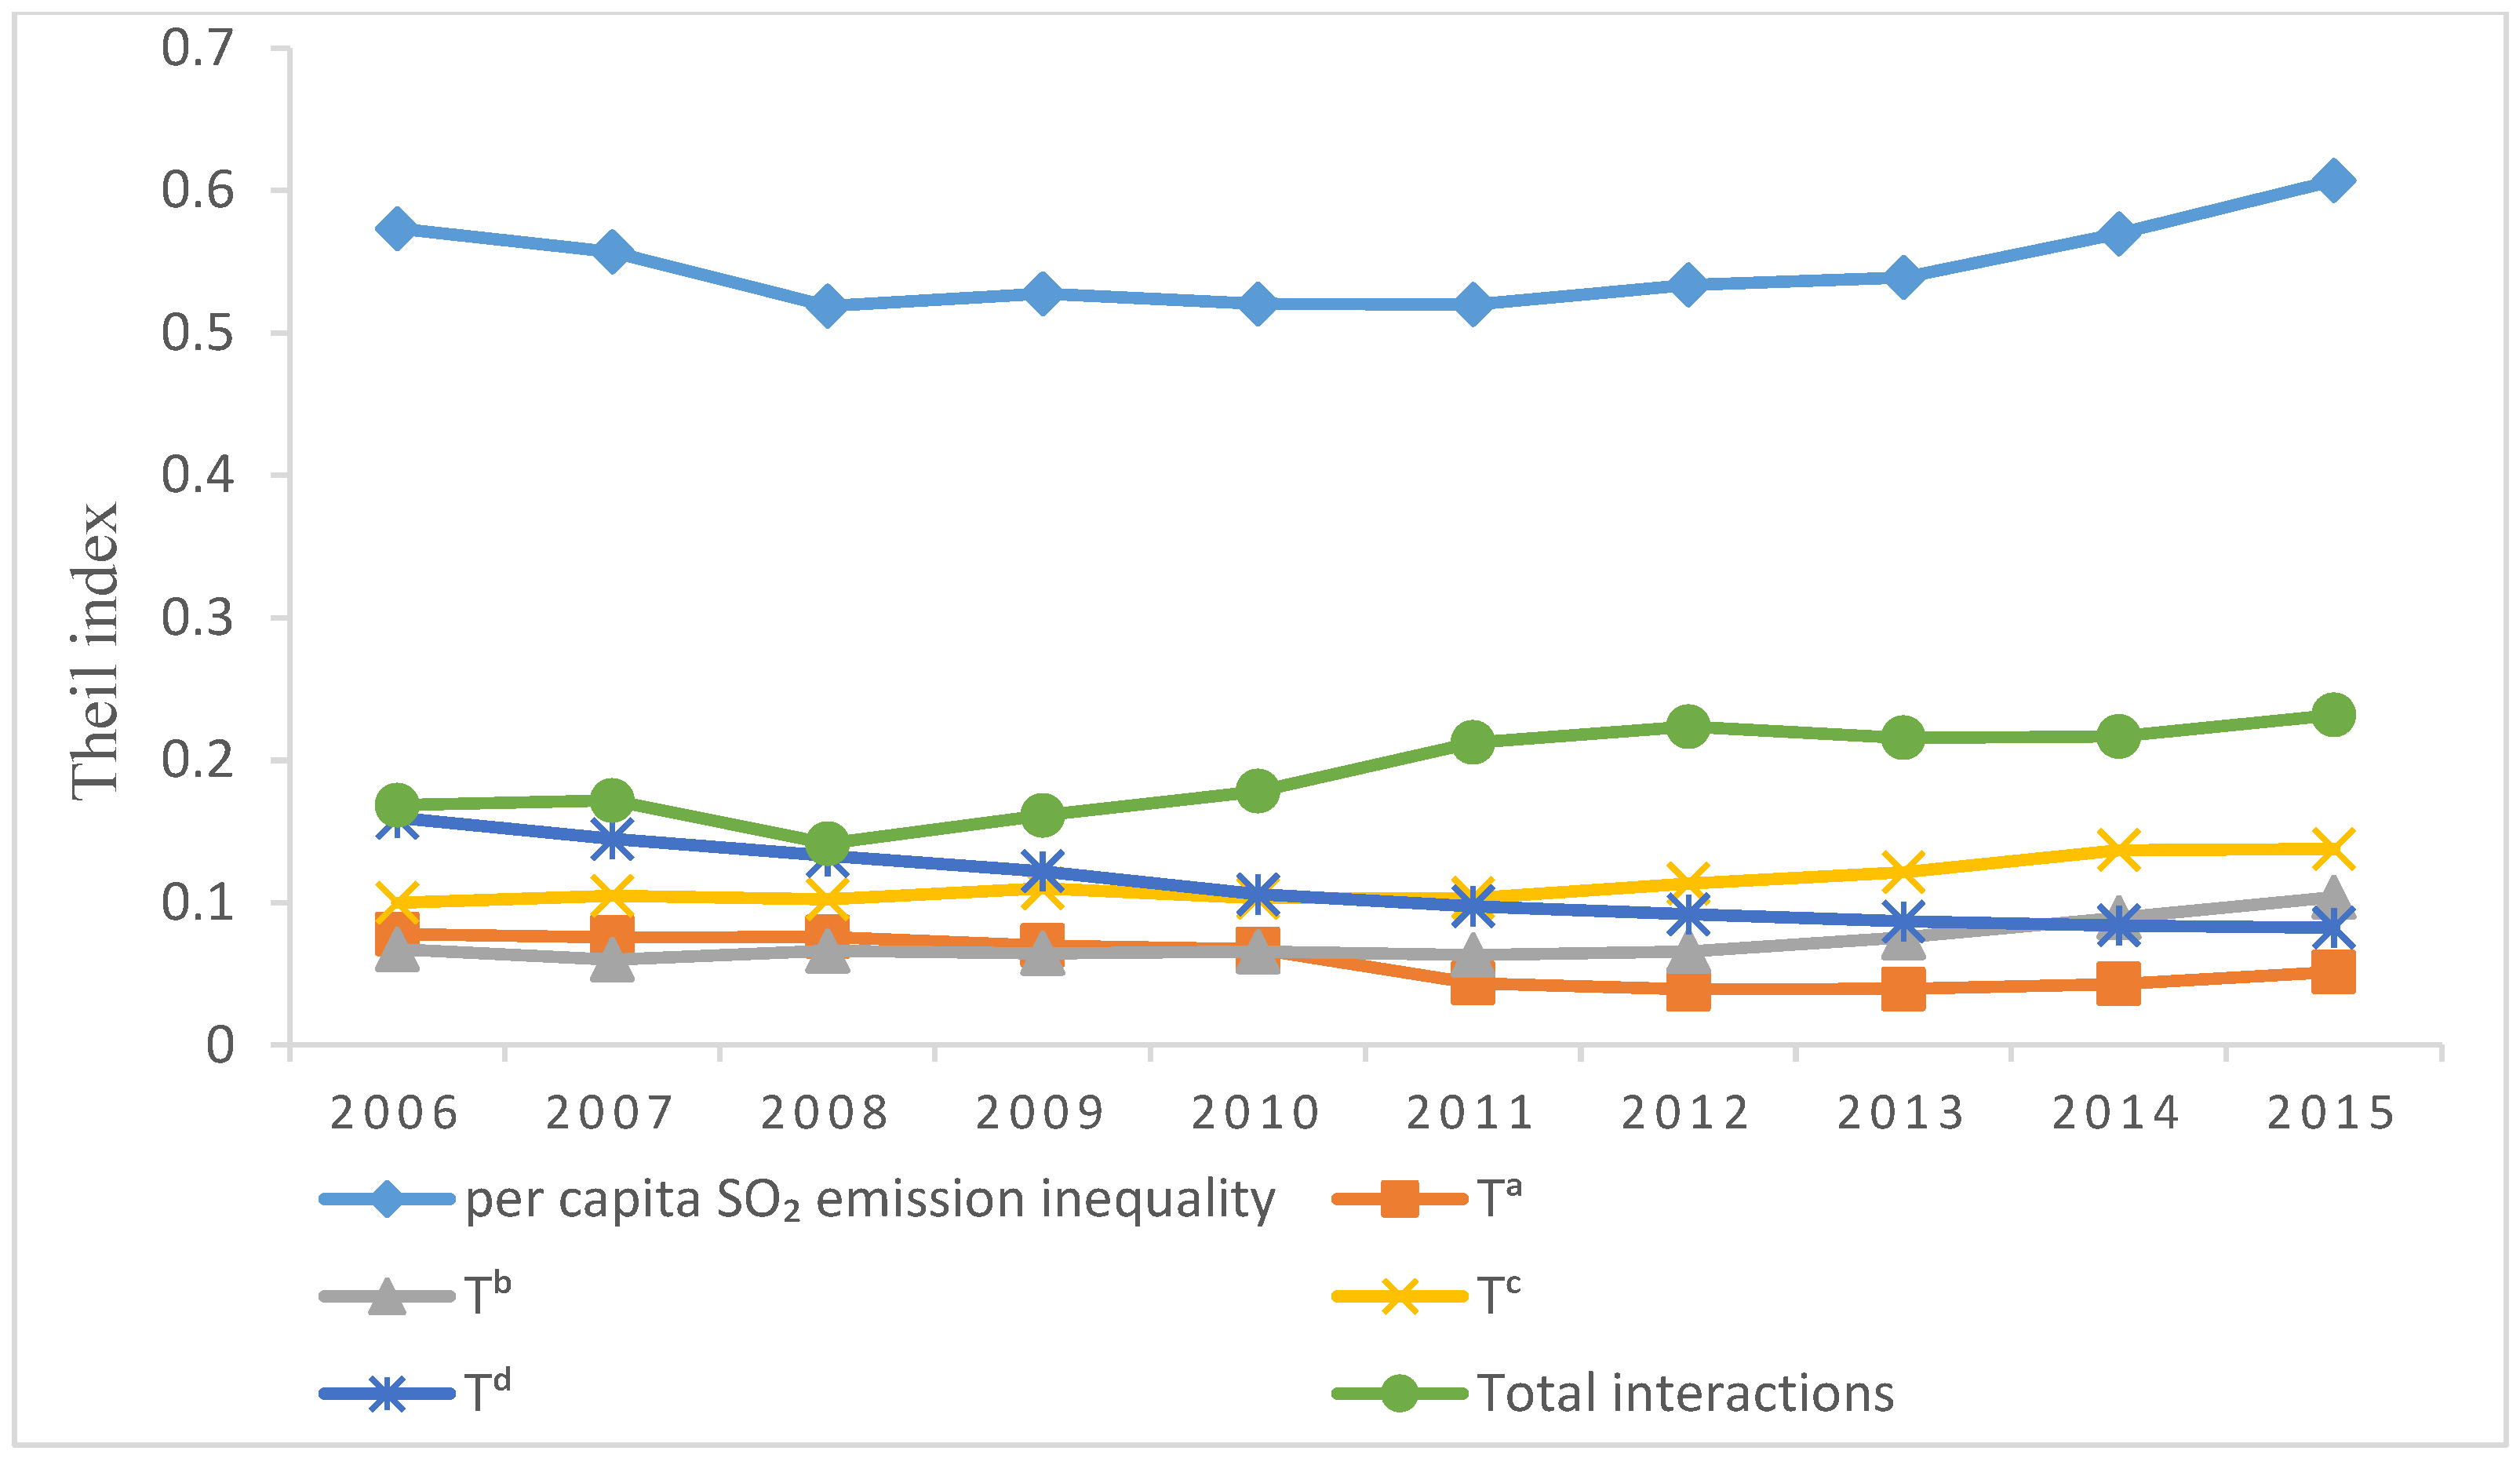
Figure 4.
Provincial contribution of per capita SO2 emission inequality (Theil element) using the Theil index (2006–2015). Source: Authors using NBS data.
Figure 4.
Provincial contribution of per capita SO2 emission inequality (Theil element) using the Theil index (2006–2015). Source: Authors using NBS data.

Figure 5.
Contribution of between-region () and within-region () inequality into per capita SO2 emission inequality (upper) and the contribution of each region into the between-region inequality (lower left) and within-region inequality (lower right) using the Theil index (2006–2015). Source: Authors using NBS data.
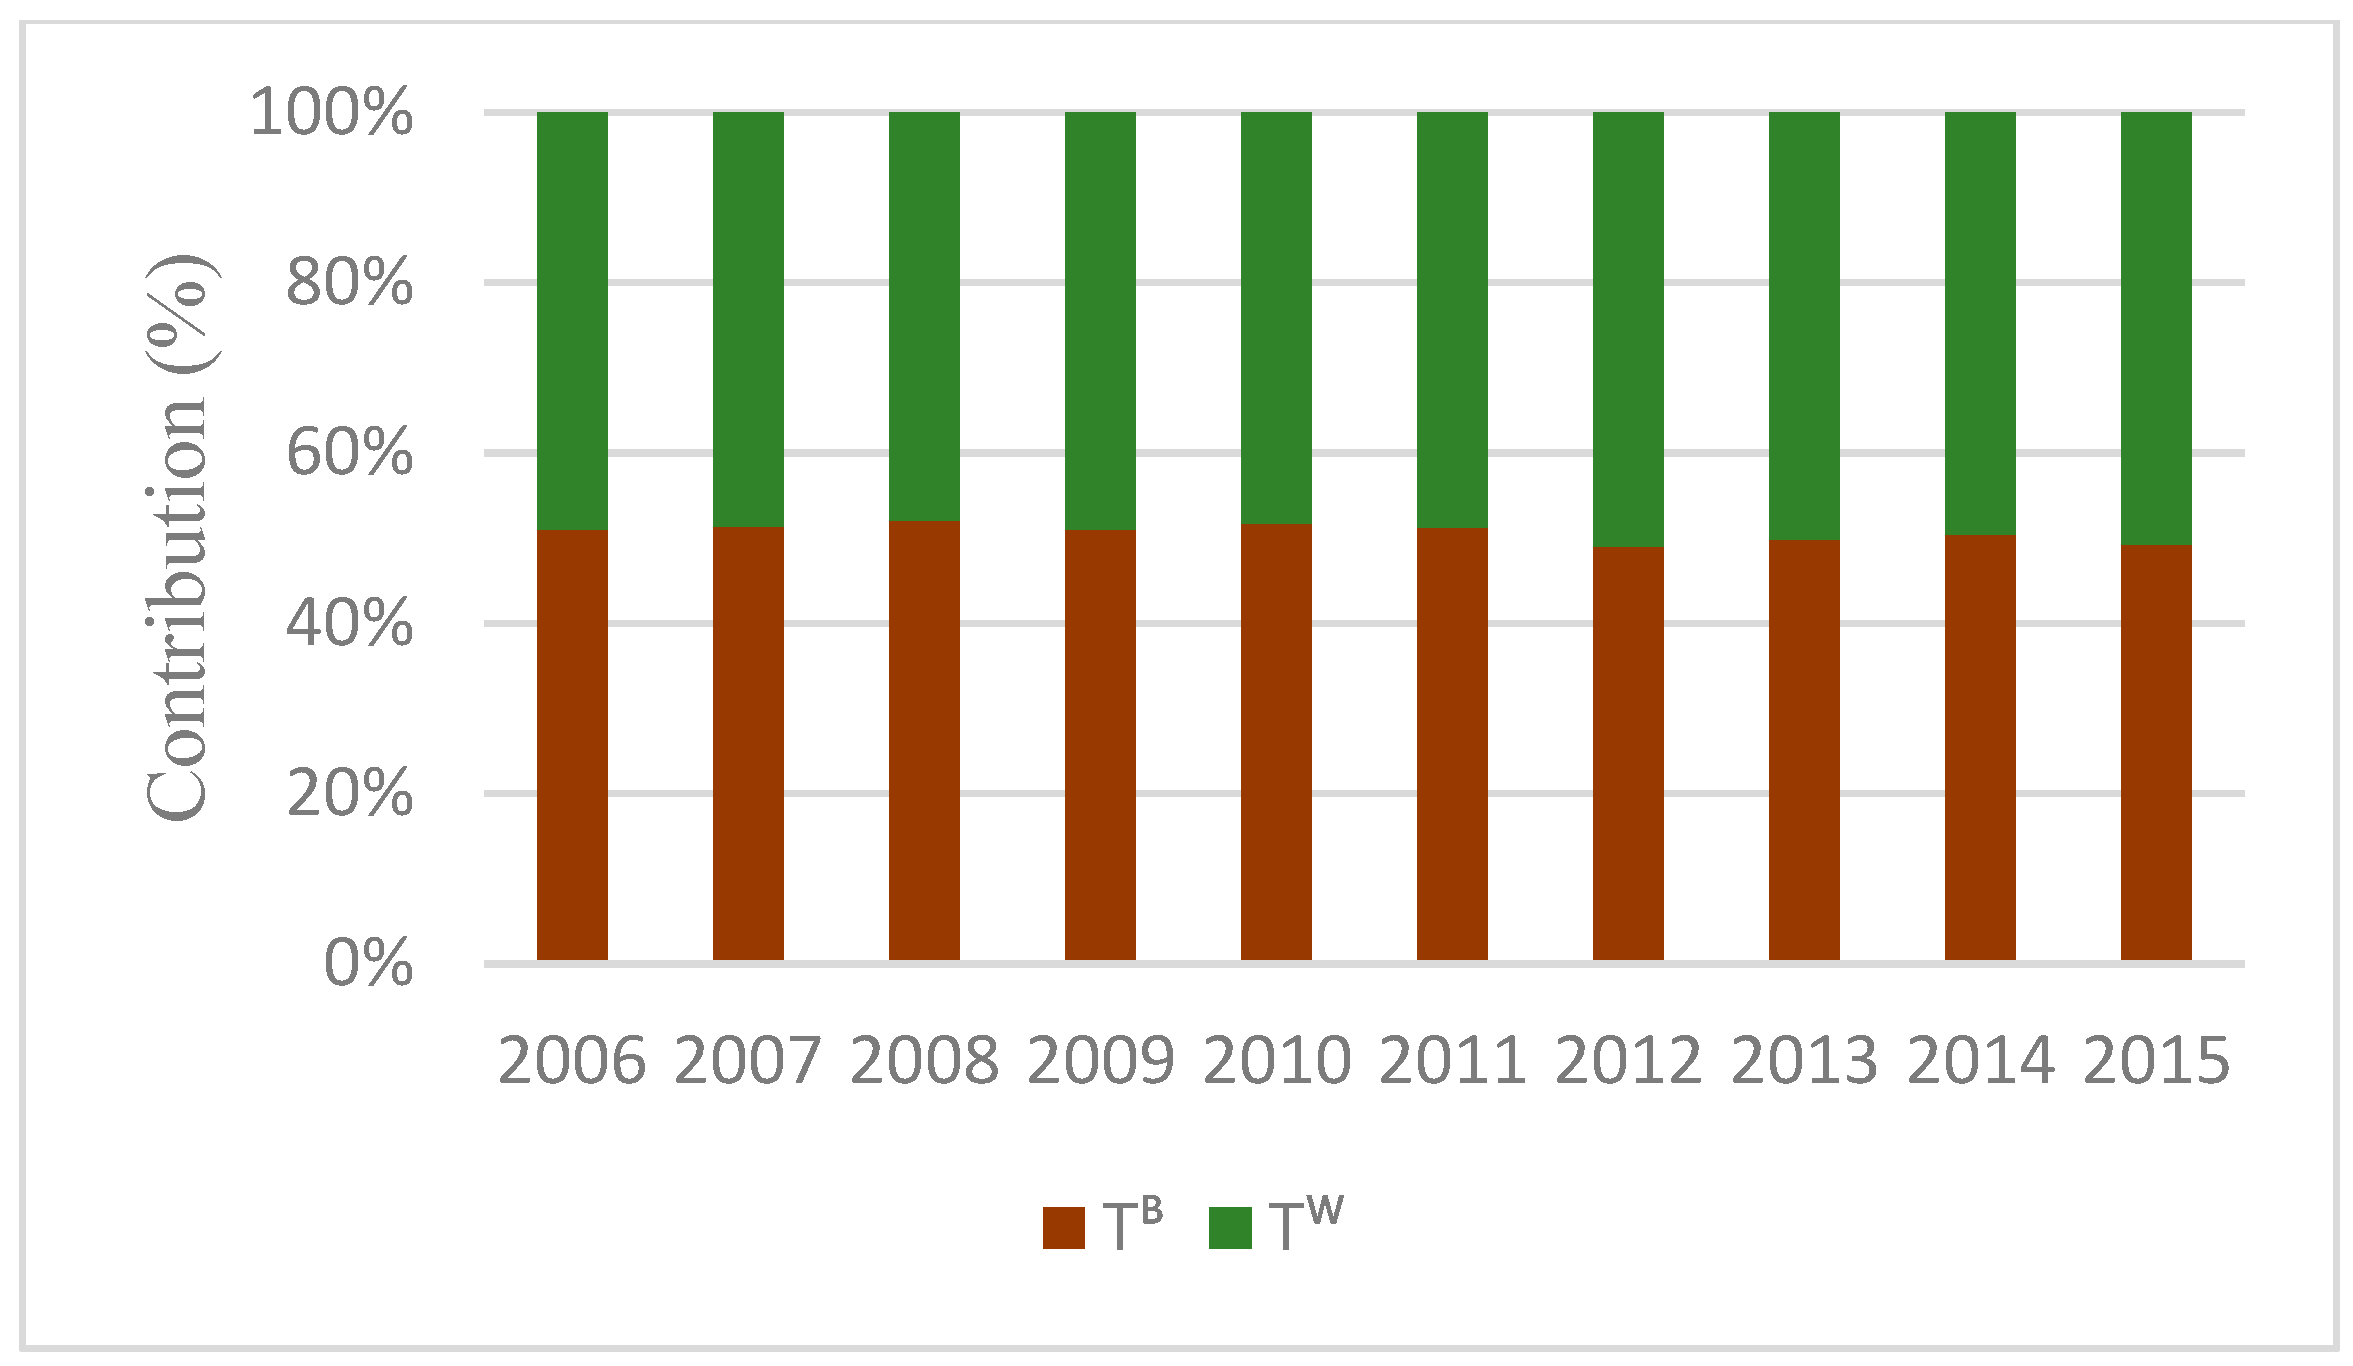

Figure 6.
Between-region inequality () in terms of per capita SO2 emission and its driving factors using the Theil index (2006–2015). Source: Authors using NBS data.
Figure 6.
Between-region inequality () in terms of per capita SO2 emission and its driving factors using the Theil index (2006–2015). Source: Authors using NBS data.

Figure 7.
Within-region inequality ) in terms of per capita SO2 emission and its driving factors using the Theil index (2006–2015). Source: Authors using NBS data.
Figure 7.
Within-region inequality ) in terms of per capita SO2 emission and its driving factors using the Theil index (2006–2015). Source: Authors using NBS data.
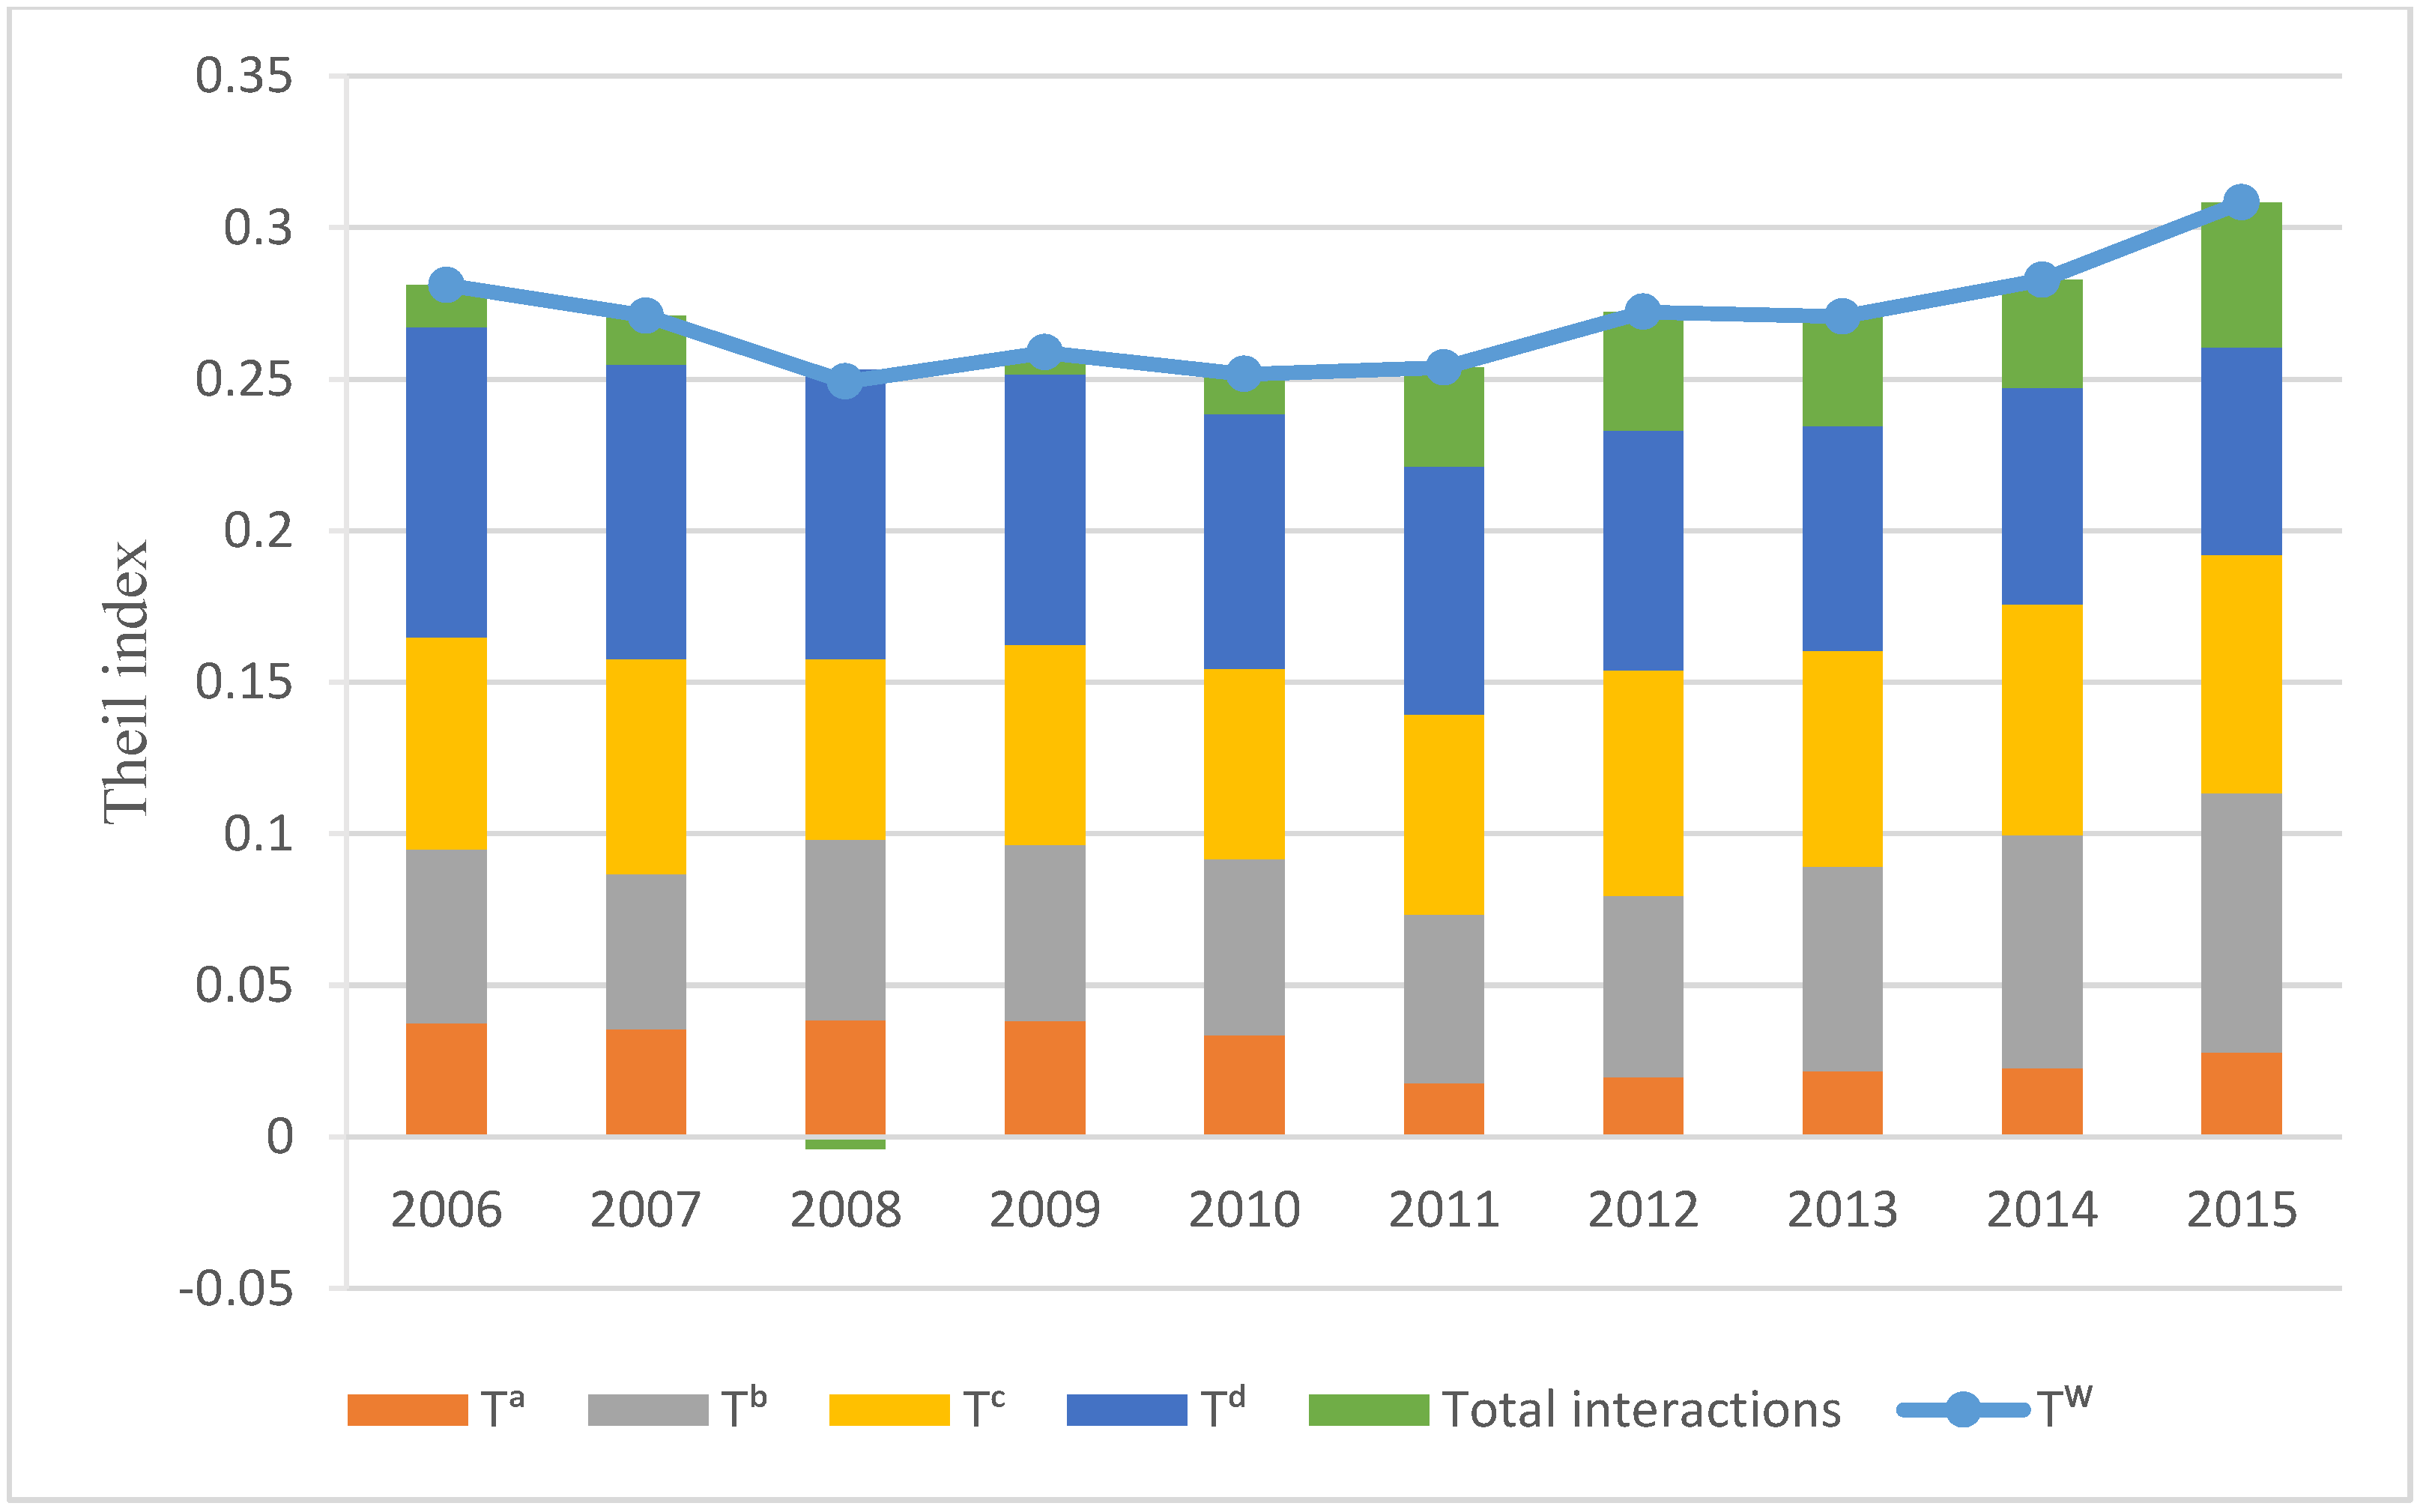
Figure 8.
The percentage evolution of per capita SO2 emission inequality and its driving factors using the Theil index during the period of the 11th and 12th Five Year Plans (FYPs) (2006–2015). Source: Authors using NBS data.
Figure 8.
The percentage evolution of per capita SO2 emission inequality and its driving factors using the Theil index during the period of the 11th and 12th Five Year Plans (FYPs) (2006–2015). Source: Authors using NBS data.
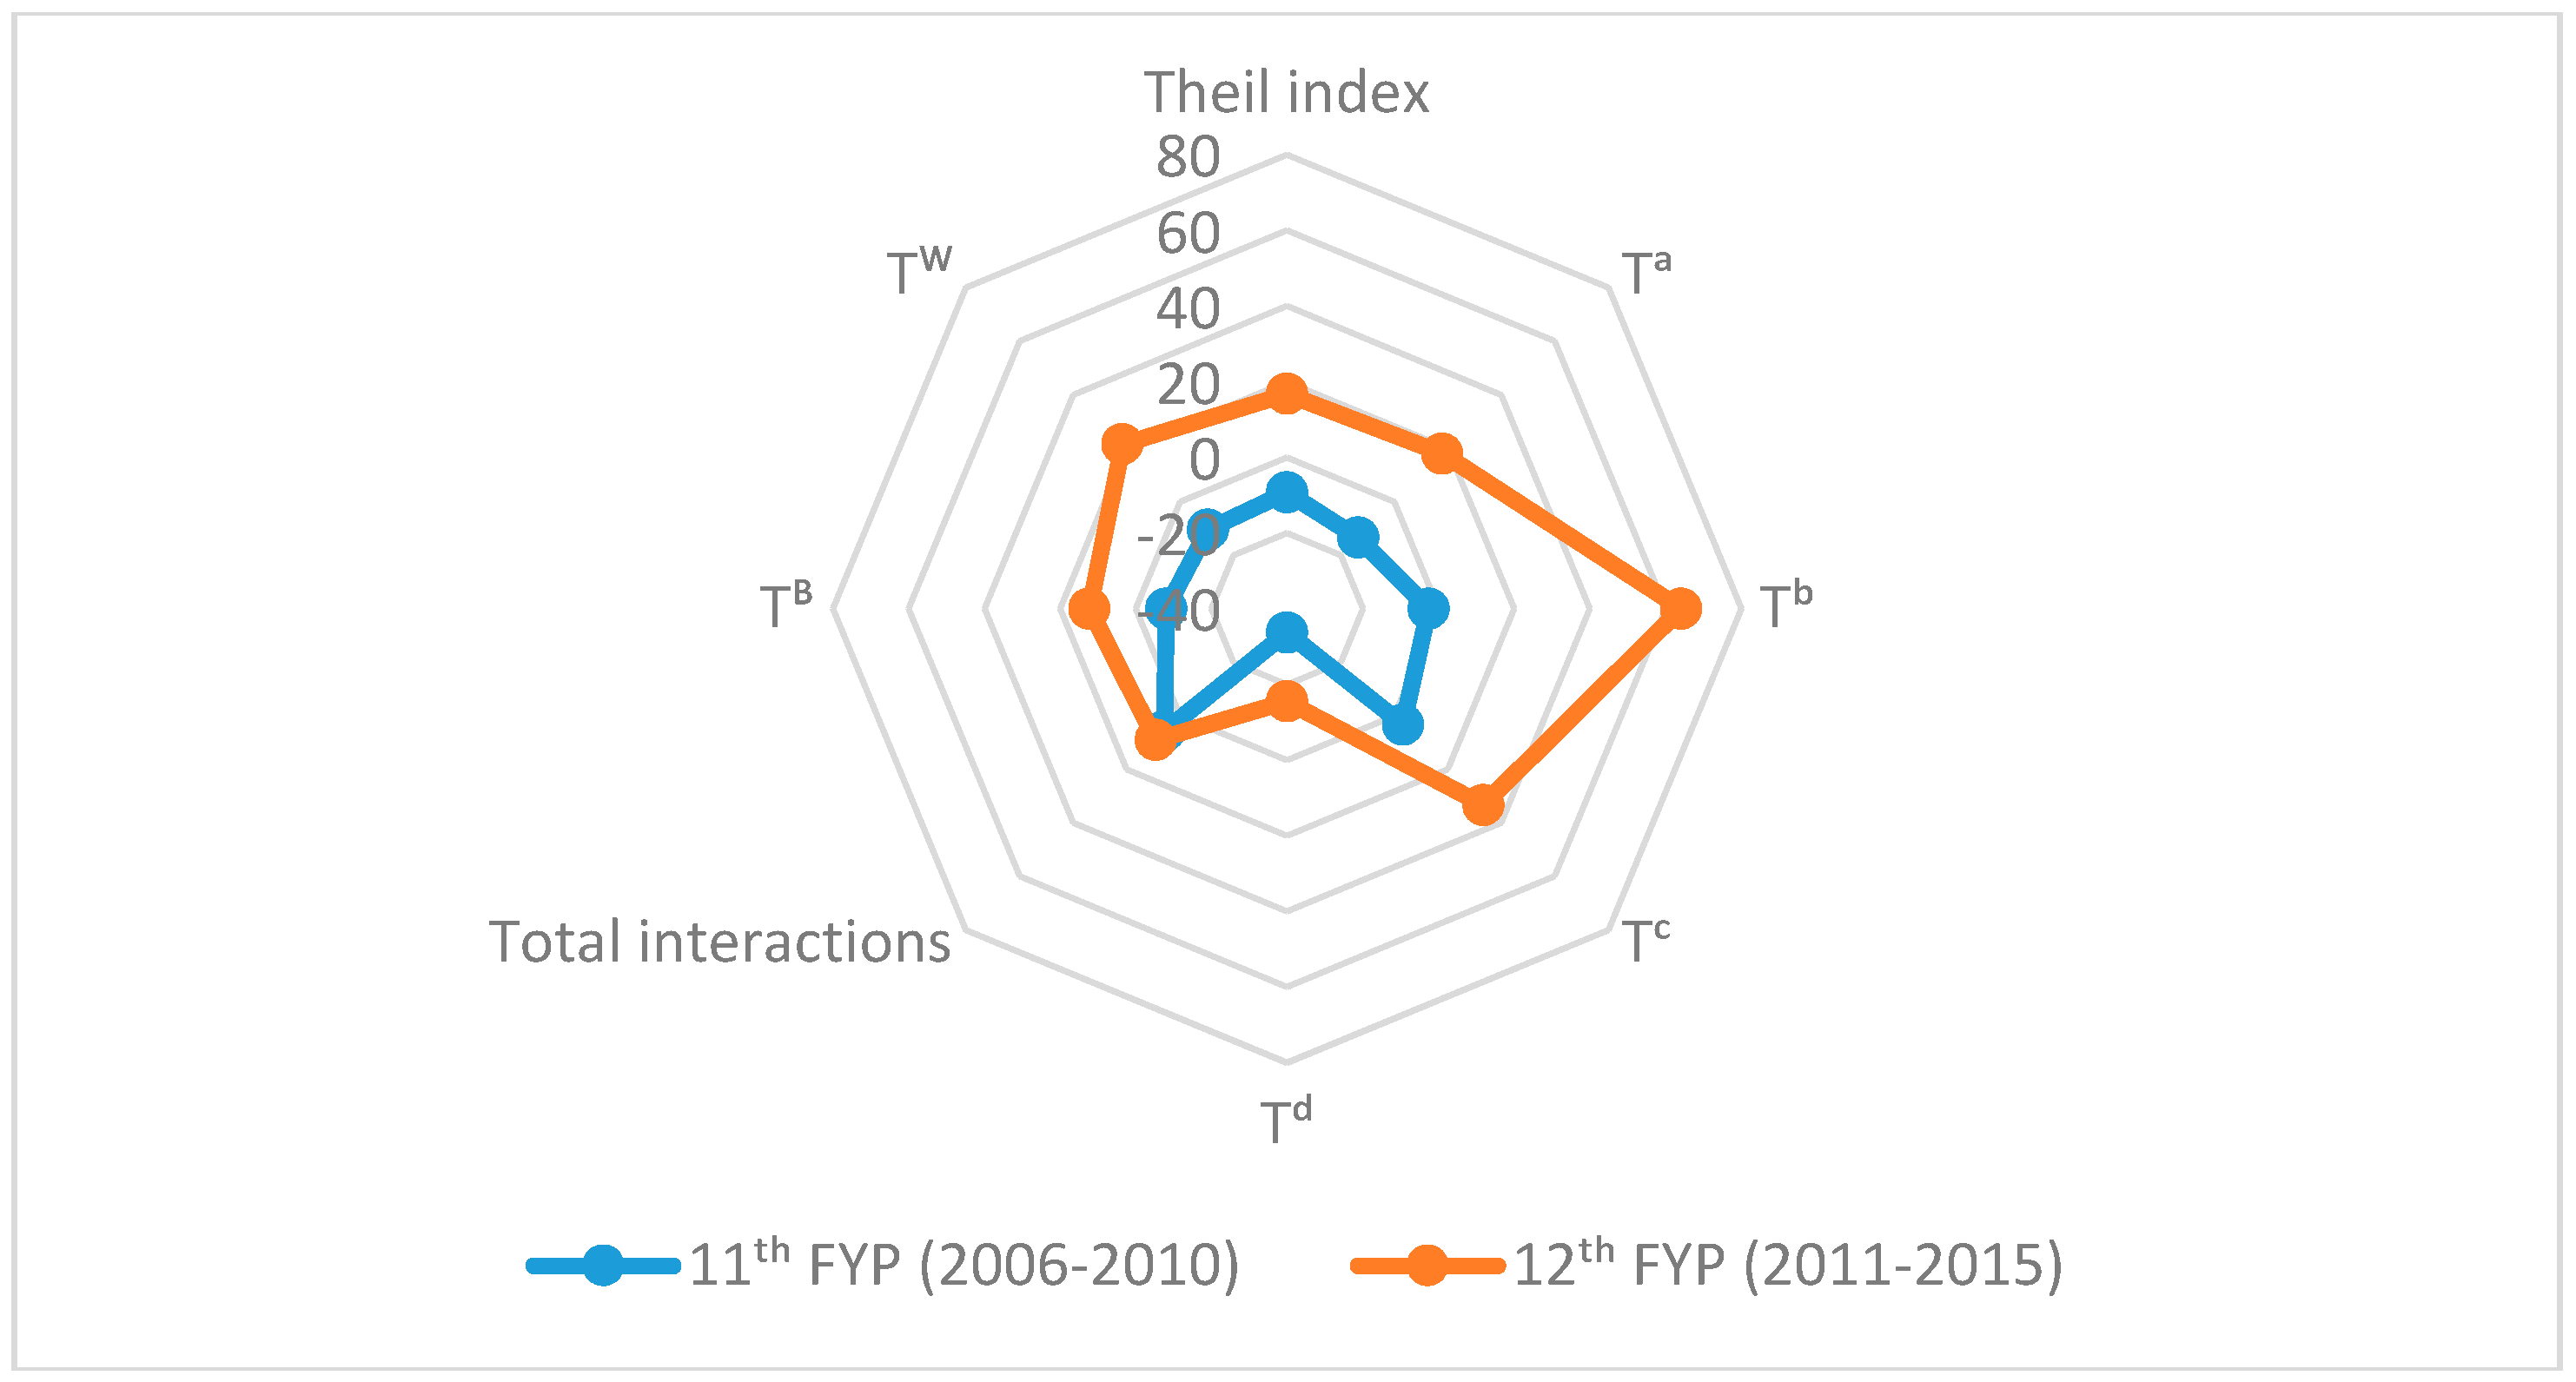
Figure 9.
Trajectory of China inequality in terms of per capita NOX emission and its driving factors using the Theil index (2006–2015). Source: Authors using NBS data.
Figure 9.
Trajectory of China inequality in terms of per capita NOX emission and its driving factors using the Theil index (2006–2015). Source: Authors using NBS data.
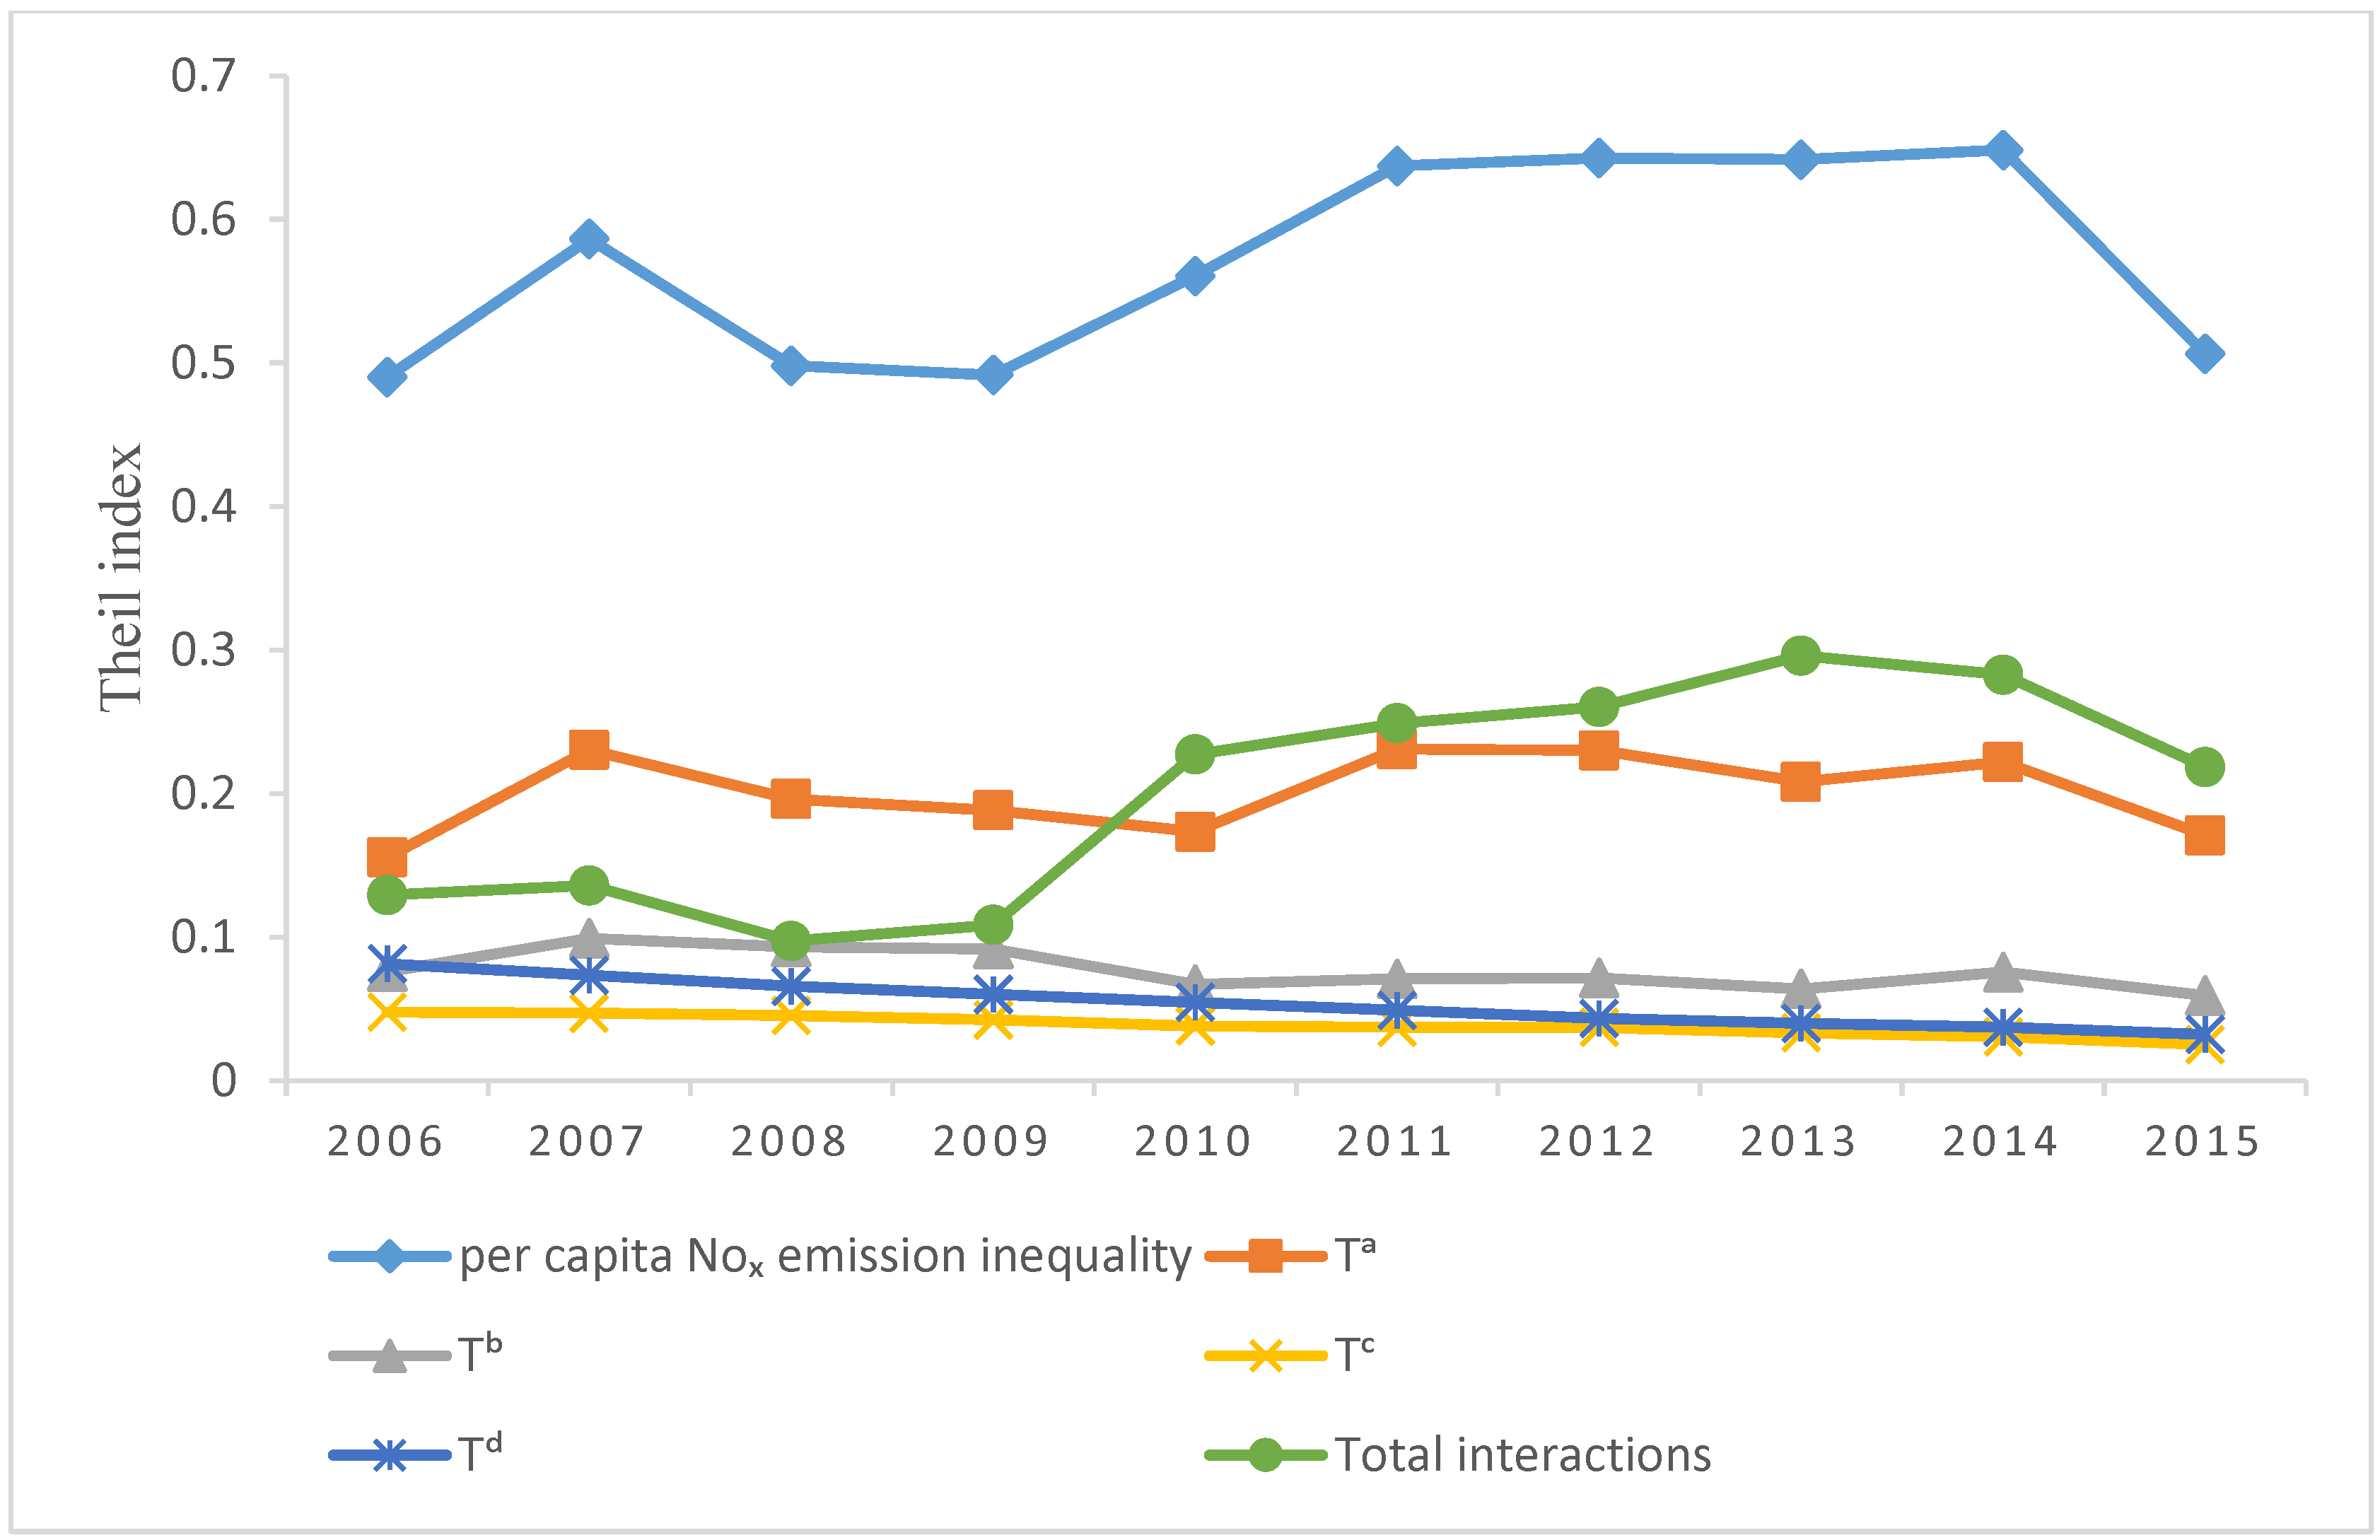
Figure 10.
Provincial contribution of per capita NOX emission inequality (Theil element) using the Theil index (2006–2015). Source: Authors using NBS data.
Figure 10.
Provincial contribution of per capita NOX emission inequality (Theil element) using the Theil index (2006–2015). Source: Authors using NBS data.

Figure 11.
Contribution of between-region () and within-region () inequality into per capita NOX emission inequality (upper) and the contribution of each region into the between-region inequality (lower left) and within-region inequality (lower right) using the Theil index (2006–2015). Source: Authors using NBS data.


Figure 12.
Within-region inequality () in terms of per capita NOX emission and its driving factors using the Theil index (2006–2015). Source: Authors using NBS data.
Figure 12.
Within-region inequality () in terms of per capita NOX emission and its driving factors using the Theil index (2006–2015). Source: Authors using NBS data.
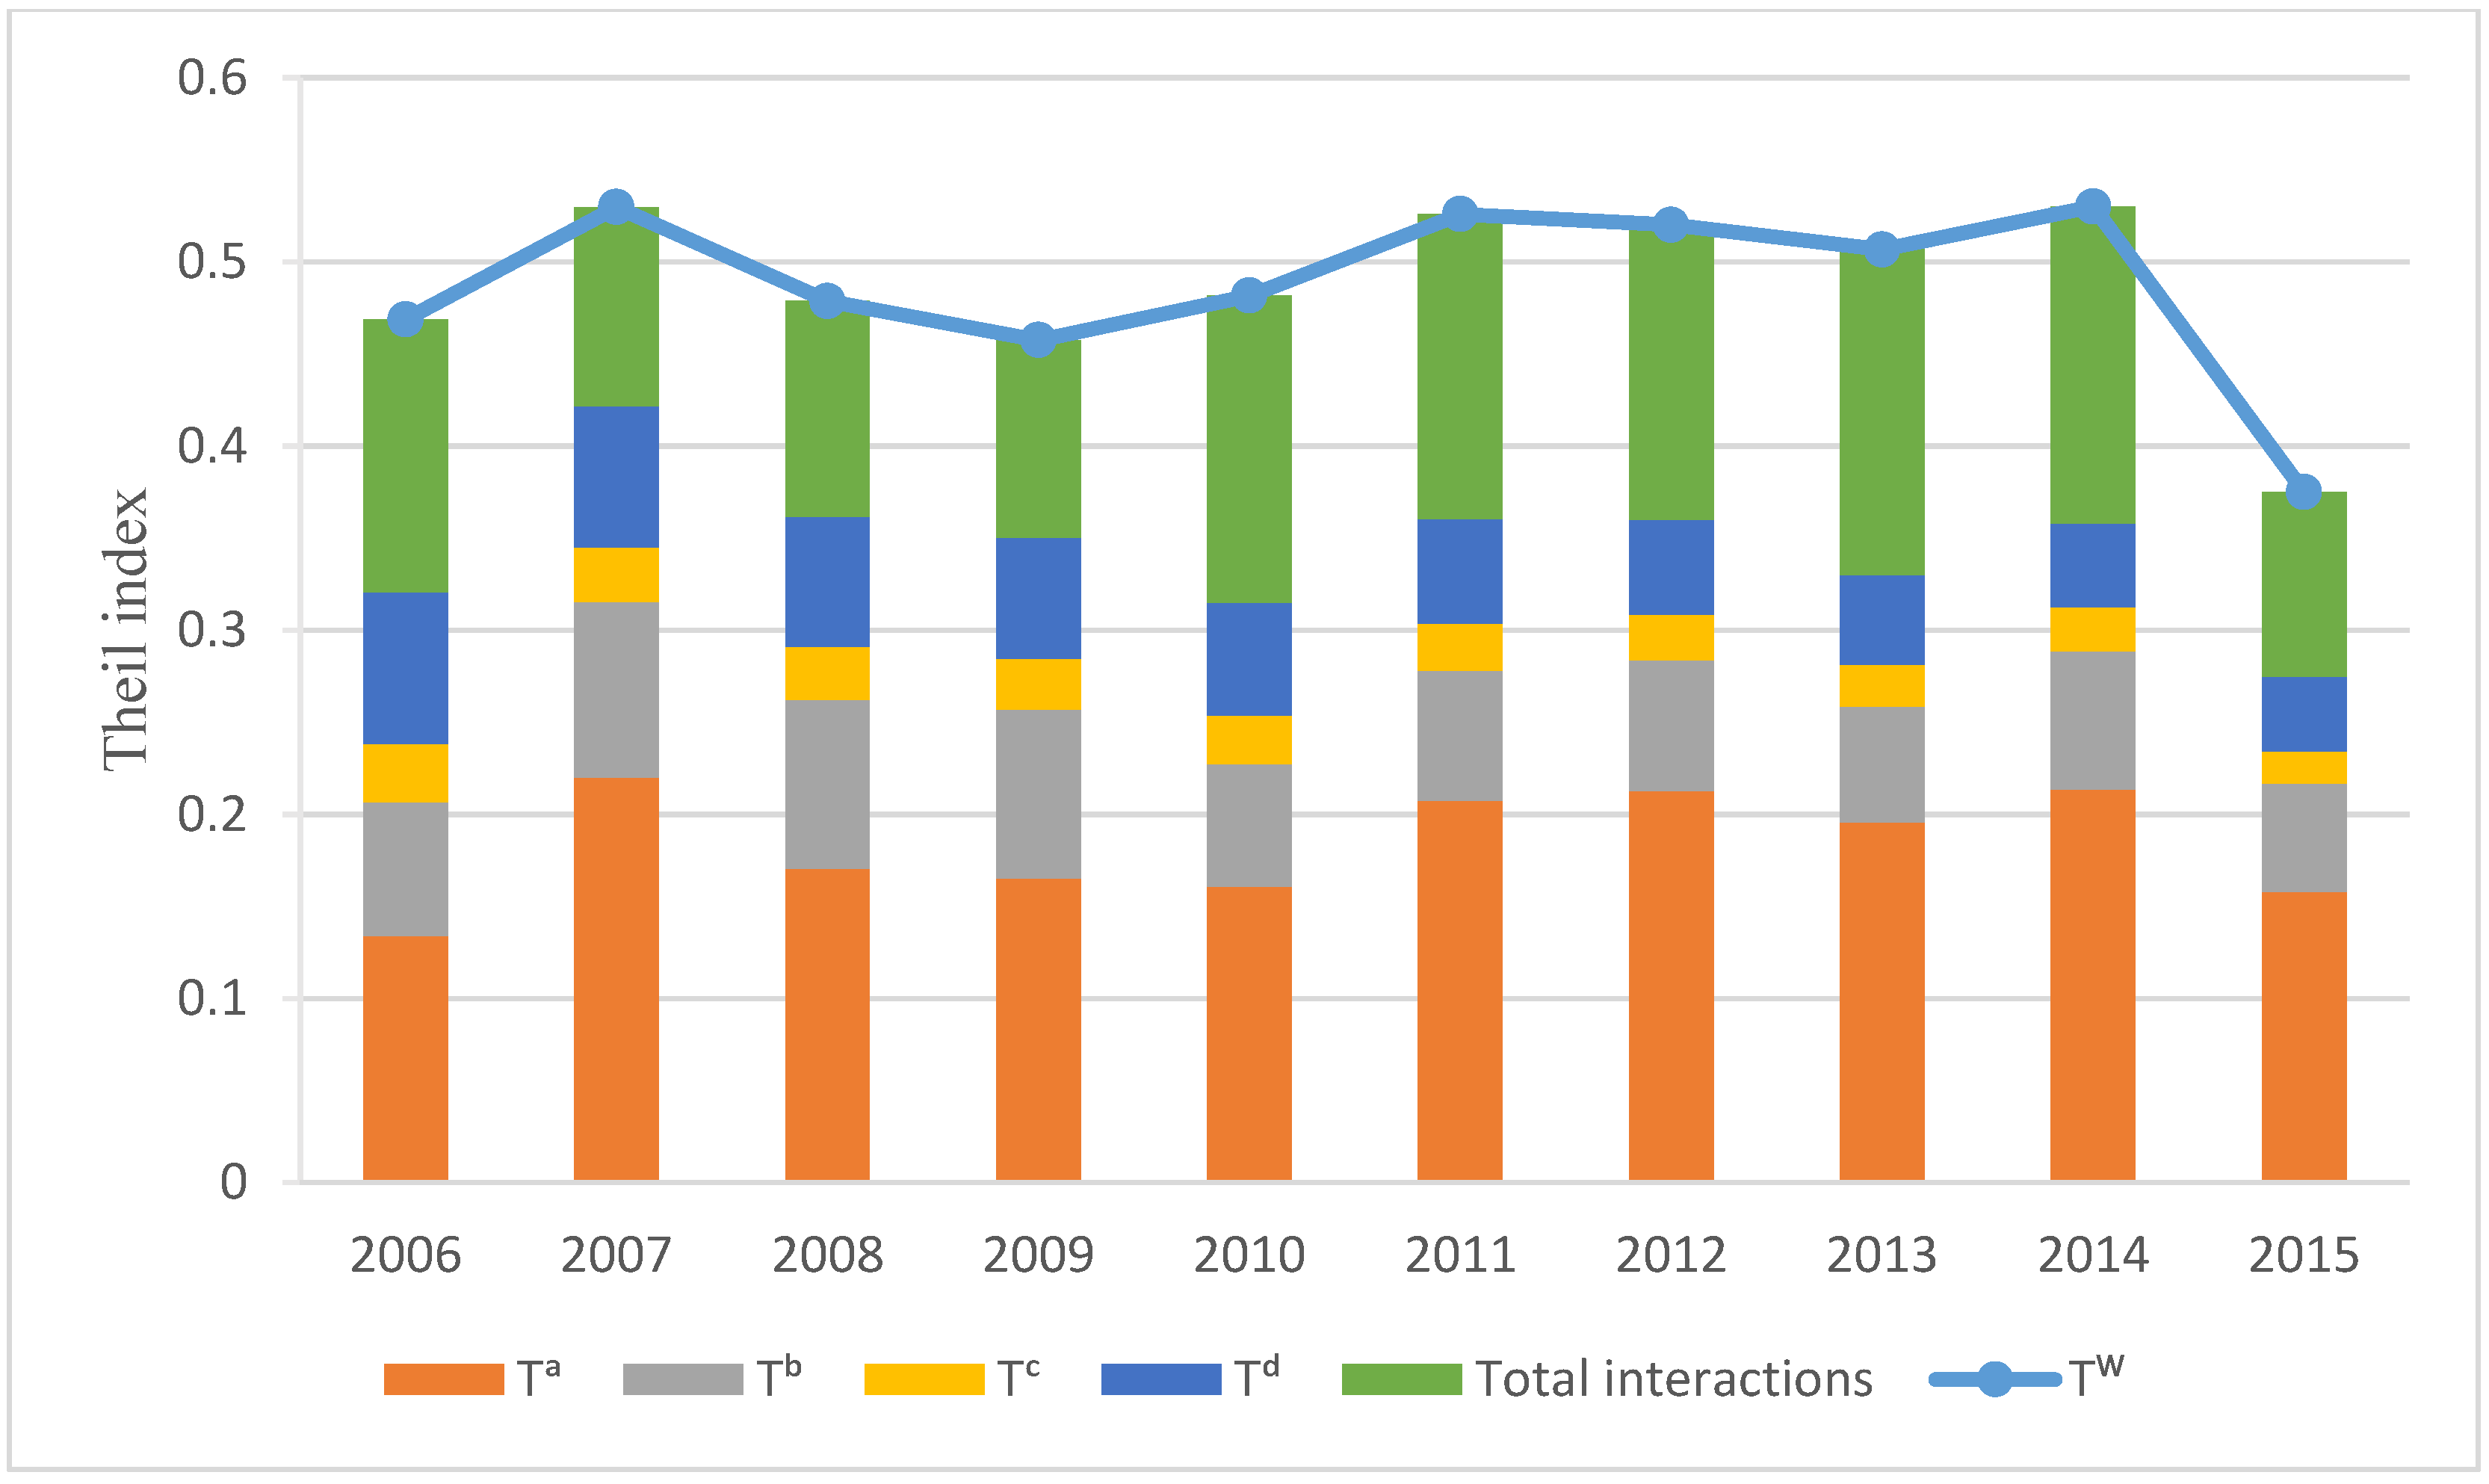
Figure 13.
Between-region inequality () in terms of per capita NOX emission and its driving factors using the Theil index (2006–2015). Source: Authors using NBS data.
Figure 13.
Between-region inequality () in terms of per capita NOX emission and its driving factors using the Theil index (2006–2015). Source: Authors using NBS data.

Figure 14.
The percentage evolution of per capita NOX emission inequality and its driving factors using the Theil index during the period of the 11th and 12th FYPs (2006–2015). Source: Authors using NBS data.
Figure 14.
The percentage evolution of per capita NOX emission inequality and its driving factors using the Theil index during the period of the 11th and 12th FYPs (2006–2015). Source: Authors using NBS data.


Table 1.
Summary of data characteristics.
| Variable | Index | Factor | Unit |
|---|---|---|---|
| Air pollution | SO2, NOX | Emission | Ton |
| Cause | Economic | Coal consumption | 10,000 tons |
| Power generation | 100 million kWh | ||
| GDP | 100 million Yuan | ||
| Urban development | Gasoline consumption | 10,000 tons | |
| Transportation (Urban vehicles) | 10,000 units | ||
| Urban population | 10,000 persons |
Source: Authors using NBS data.
Table 2.
Per capita SO2 emission inequality and its driving factors using the Theil index (2006–2015).
Table 2.
Per capita SO2 emission inequality and its driving factors using the Theil index (2006–2015).
| Year | Theil Index | (%) | (%) | (%) | (%) | (%) | (%) | (%) |
|---|---|---|---|---|---|---|---|---|
| 2006 | 0.5734 | 0.0780 (13.60) | 0.0673 (11.75) | 0.0999 (17.43) | 0.1596 (27.84) | 0.0248 (4.32) | −0.0077 (−1.34) | 0.1514 (26.41) |
| 2007 | 0.5569 | 0.0757 (13.59) | 0.0600 (10.77) | 0.1047 (18.81) | 0.1447 (25.99) | 0.0334 (5.99) | −0.0127 (−2.28) | 0.1511 (27.13) |
| 2008 | 0.5189 | 0.0760 (14.64) | 0.0662 (12.76) | 0.1024 (19.73) | 0.1329 (25.60) | 0.0230 (4.43) | −0.0184 (−3.54) | 0.1369 (26.38) |
| 2009 | 0.5276 | 0.0699 (13.25) | 0.0644 (12.20) | 0.1100 (20.86) | 0.1220 (23.12) | 0.0249 (4.72) | −0.0058 (−1.09) | 0.1422 (26.95) |
| 2010 | 0.5205 | 0.0675 (12.97) | 0.0656 (12.61) | 0.1032 (19.84) | 0.1059 (20.34) | 0.0337 (6.47) | −0.0093 (−1.79) | 0.1539 (29.57) |
| 2011 | 0.5199 | 0.0434 (8.36) | 0.0633 (12.17) | 0.1033 (19.87) | 0.0975 (18.75) | 0.0451 (8.67) | −0.0072 (−1.38) | 0.1745 (33.57) |
| 2012 | 0.5337 | 0.0392 (7.34) | 0.0658 (12.32) | 0.1135 (21.26) | 0.0918 (17.20) | 0.0298 (5.58) | −0.0012 (−0.22) | 0.1949 (36.52) |
| 2013 | 0.5389 | 0.0394 (7.31) | 0.0756 (14.02) | 0.1214 (22.52) | 0.0869 (16.12) | 0.0212 (3.94) | −0.0012 (−0.22) | 0.1957 (36.31) |
| 2014 | 0.5698 | 0.0429 (7.52) | 0.0894 (15.70) | 0.1369 (24.02) | 0.0839 (14.73) | 0.0239 (4.19) | −0.0032 (−0.56) | 0.1960 (34.41) |
| 2015 | 0.6070 | 0.0513 (8.45) | 0.1039 (17.11) | 0.1377 (22.69) | 0.0824 (13.57) | 0.0366 (6.03) | −0.0002 (−0.03) | 0.1953 (32.18) |
Source: Authors using NBS data.
Table 3.
Per capita NOX emission inequality and its driving factors using the Theil index (2006–2015).
Table 3.
Per capita NOX emission inequality and its driving factors using the Theil index (2006–2015).
| Year | Theil Index | (%) | (%) | (%) | (%) | (%) | (%) | (%) |
|---|---|---|---|---|---|---|---|---|
| 2006 | 0.4902 | 0.1558 (31.78) | 0.0759 (15.48) | 0.0478 (9.75) | 0.0814 (16.61) | 0.0883 (18.01) | −0.0032 (−0.66) | 0.0443 (9.04) |
| 2007 | 0.5864 | 0.2305 (39.32) | 0.0992 (16.91) | 0.0471 (8.04) | 0.0735 (12.54) | 0.0939 (16.01) | 0.0060 (1.03) | 0.0361 (6.16) |
| 2008 | 0.4981 | 0.1962 (39.40) | 0.0931 (18.70) | 0.0455 (9.13) | 0.0658 (13.22) | 0.0673 (13.51) | −0.0051 (−1.03) | 0.0353 (7.08) |
| 2009 | 0.4915 | 0.1884 (38.33) | 0.0918 (18.69) | 0.0425 (8.64) | 0.0602 (12.25) | 0.0748 (15.22) | 0.0079 (1.61) | 0.0259 (5.27) |
| 2010 | 0.5606 | 0.1735 (30.95) | 0.0671 (11.96) | 0.0381 (6.80) | 0.0546 (9.74) | 0.2107 (37.58) | −0.0042 (−0.75) | 0.0208 (3.72) |
| 2011 | 0.6373 | 0.2310 (36.25) | 0.0710 (11.14) | 0.0372 (5.84) | 0.0490 (7.69) | 0.2396 (37.60) | −0.0084 (−1.31) | 0.0178 (2.79) |
| 2012 | 0.6428 | 0.2301 (35.79) | 0.0717 (11.15) | 0.0372 (5.78) | 0.0435 (6.76) | 0.2583 (40.18) | −0.0147 (−2.29) | 0.0169 (2.63) |
| 2013 | 0.6417 | 0.2081 (32.44) | 0.0639 (9.96) | 0.0335 (5.22) | 0.0400 (6.24) | 0.2939 (45.80) | −0.0132 (−2.06) | 0.0154 (2.40) |
| 2014 | 0.6483 | 0.2219 (34.23) | 0.0756 (11.67) | 0.0306 (4.72) | 0.0373 (5.75) | 0.2716 (41.89) | 0.0086 (1.32) | 0.0027 (0.42) |
| 2015 | 0.5064 | 0.1710 (33.76) | 0.0593 (11.71) | 0.0253 (4.99) | 0.0323 (6.37) | 0.1995 (39.39) | 0.0159 (3.13) | 0.0033 (0.64) |
Source: Authors using NBS data.
© 2018 by the authors. Licensee MDPI, Basel, Switzerland. This article is an open access article distributed under the terms and conditions of the Creative Commons Attribution (CC BY) license (http://creativecommons.org/licenses/by/4.0/).
Share and Cite
MDPI and ACS Style
Azimi, M.; Feng, F.; Yang, Y. Air Pollution Inequality and Its Sources in SO2 and NOX Emissions among Chinese Provinces from 2006 to 2015. Sustainability 2018, 10, 367. https://doi.org/10.3390/su10020367
AMA Style
Azimi M, Feng F, Yang Y. Air Pollution Inequality and Its Sources in SO2 and NOX Emissions among Chinese Provinces from 2006 to 2015. Sustainability. 2018; 10(2):367. https://doi.org/10.3390/su10020367
Chicago/Turabian StyleAzimi, Mohaddeseh, Feng Feng, and Yang Yang. 2018. "Air Pollution Inequality and Its Sources in SO2 and NOX Emissions among Chinese Provinces from 2006 to 2015" Sustainability 10, no. 2: 367. https://doi.org/10.3390/su10020367
Note that from the first issue of 2016, this journal uses article numbers instead of page numbers. See further details here.