Climate Change Mitigation Potential of Wood Use in Civil Engineering in Japan Based on Life-Cycle Assessment

1
Graduate School of Agriculture, Tokyo University of Agriculture and Technology, 3-5-8 Saiwai-cho, Fuchu-shi, Tokyo 183-8509, Japan
2
Graduate School of Engineering Science, Akita University, 1-1 Tegata Gakuen-machi, Akita-shi, Akita 010-8502, Japan
*
Author to whom correspondence should be addressed.
Sustainability 2018, 10(2), 561; https://doi.org/10.3390/su10020561
Submission received: 2 December 2017
/
Revised: 9 February 2018
/
Accepted: 22 February 2018
/
Published: 23 February 2018
(This article belongs to the Special Issue Environmental Life Cycle Assessment)
Abstract
:Throughout its life-cycle, wood contributes to climate change mitigation through carbon storage and material and energy substitution. Focusing on wood use for piles, check dams, paved walkways, guardrails, and noise barriers, we quantified the nationwide potential for climate change mitigation in civil engineering in Japan through 2050. To assess mitigation potential, we examined life-cycle greenhouse gas (GHG) emissions that are avoided by storing carbon in wood and forests, substituting wooden materials for non-wooden materials (cement, concrete, steel, and asphalt), and substituting processing residue and waste wood salvaged from defunct civil engineering structures for fossil fuels (heavy oil). Our projections suggest that there will be a maximum potential domestic log volume of 6.80 million m3/year available for civil engineering use in Japan in 2050, and that it would be possible to produce this volume while increasing Japan’s forest resources over the long term. A maximum nationwide avoided GHG emissions potential of 9.63 million t-CO2eq/year could be achieved in 2050, which is equivalent to 0.7% of Japan’s current GHG emissions. The breakdown of avoided emissions is 73%, 19%, and 8% for carbon storage, material substitution, and energy substitution, respectively, with the greatest contributions coming from carbon storage through the use of log piles.
1. Introduction
The transition toward a sustainable society requires addressing climate change issues. Wood use can mitigate climate change through carbon storage, in which CO2 that is absorbed by growing trees is stored in harvested wood, and by providing a substitute for materials that consume high amounts of energy and generate high amounts of greenhouse gases (GHGs) in their production. In addition, wood can be used as an alternative energy source with reduced GHG emissions [1].
In examining the environmental impacts and benefits of wood in the context of climate change, it is necessary to apply the concept of life-cycle assessment (LCA), in which the environmental burden of a product throughout its life-cycle, from resource extraction through product manufacture, and, finally, recycling and/or disposal, is quantified. International LCA standards have been published as the ISO 14040 series. Under these standards, four general procedure phases are involved in conducting an LCA: definition of the goal and scoping of the LCA; life-cycle inventory analysis (LCI); life-cycle impact assessment (LCIA); and, life-cycle interpretation [2]. Several system boundaries can be applied in LCA, including: “cradle-to-grave”, which covers the entire life-cycle from resource extraction to disposal; “cradle-to-gate”, which covers resource extraction through production of the targeted product, but excludes use and disposal processes; and, “gate-to-gate”, which is limited to a part of the life-cycle processes (only one process or some processes). In addition, the practice of measuring carbon footprints (CFs) that only target GHGs has been promoted in recent years as an environmental burden item in LCI.
Many previous studies have conducted LCA targeting of the GHG balances of individual wood products and applications, including buildings [3,4,5], furniture [6,7], paper [8,9], energy [10,11,12,13,14], and civil engineering [15,16,17]. In addition, several LCA studies have covered multiple or whole wood applications [18,19,20,21].
Looking specifically at Japan, prior LCA research focusing on GHGs has been applied to wood use in buildings [22,23], paper [24], energy [25,26], and individual wood products, such as wood-based boards [27], with one study examining multiple wood applications in buildings, furniture, paper, and energy [28]. Although wood was once nearly universally used in civil engineering applications, such as piles and bridges, following the period of high economic growth from the late 1950s to the early 1970s, the primary construction materials in Japan transitioned to concrete and steel [29]. In recent years, however, wood has again begun to attract attention as a civil engineering material within the context of addressing the issue of climate change and promoting domestic forestry. The Japanese government is promoting the increased use of wooden civil engineering structures such as log piles, wooden guardrails, and wooden noise barriers [29,30,31,32]. It is therefore important to use LCA methods to clarify the potential contribution to climate change mitigation from the use of wood in civil engineering. There are few prior research cases of LCA targeting wood use in civil engineering in Japan. Although studies have analyzed the life-cycle GHG emissions from wood use in civil engineering and the emission reductions resulting from substituting wood for non-wooden materials [33,34,35,36,37], these studies have targeted only individual applications, including log piles [33], wooden check dams [34], woodchip-paved walkways [35], wooden guardrails [36], and wooden noise barriers [37]. The future availability of wood for civil engineering structures in the country as a whole and the associated nationwide potential for climate change mitigation remain unclear.
Many prior studies [3,7,16,27,34,35,36,37] assumed the biogenic carbon (CO2) balance of wood in the LCA and the CFs to be carbon-neutral. In other words, they had no effect on the CO2 concentrations in the atmosphere; thus, the biogenic carbon balance was considered zero. This is based on the idea that the carbon emitted by wood incineration or biodegradation in the end-of-life process is originally absorbed through photosynthesis during the tree growth process. Another way of seeing this is that carbon emissions are absorbed by the growth of next-generation trees after wood incineration or biodegradation [38,39]. The similar logic is used in the global warming potential (GWP) and the international standards of the LCA and the CFs (ISO14067) [40]. As a result, the biogenic carbon balance was agreed to be consequently omitted. However, this widely used assumption about carbon neutrality is criticized because it ignored a significant time lag between biogenic carbon absorption and emissions that is caused by temporary carbon storage [4,15,18,39,40,41]. Regarding time change, wood continues to store carbon for a certain period, and the timing of wood incineration or biodegradation and growth in forests varies. Therefore, the carbon balance of both wood and forests in conjunction with the time changes within the LCA and CF framework must be considered to precisely comprehend how wood use mitigates climate change.
Therefore, in this study, we target five representative wooden civil engineering structures—log piles, wooden check dams, woodchip-paved walkways, wooden guardrails, and wooden noise barriers [42]—and use the LCA method to quantify the climate change mitigation potential of using wood in such civil engineering applications in Japan through 2050. In the examined cases, the climate change mitigation potential includes avoided life-cycle GHG emissions through wood use as a result of carbon storage in wood and forests and material and energy substitution of non-wooden materials with wood.
The main findings of this study are summarized as follows. A likely potential domestic log volume of 3.40 million m3/year, with a maximum of 6.80 million m3/year, is expected to be available for civil engineering use in Japan in 2050, and it would be possible to produce these volumes while increasing Japan’s forest resources. A likely nationwide avoided GHG emissions potential of 4.82 million t-CO2eq/year was estimated for 2050. Moreover, a maximum nationwide avoided GHG emissions potential of 9.63 million t-CO2eq/year could be obtained in 2050, which is equivalent to 0.7% of Japan’s current GHG emissions. The breakdown of avoided emissions is 45%, 28%, 19%, and 8% for carbon storage in wood, carbon storage in forests, material substitution, and energy substitution, respectively, with the most significant contributions coming from the increased use of log piles. We noted average avoided GHG emissions per unit wood use volume of 1.04 t-CO2eq/m3 from the carbon storage effect, 0.26 t-CO2eq/m3 from the material substitution effect, and 0.11 t-CO2eq/m3 from the energy substitution effect, adding up to a total mitigation potential of 1.41 t-CO2eq/m3.
2. Materials and Methods
2.1. Wood Use Potential in Civil Engineering in Japan
Wood use volumes in the five civil engineering applications in Japan listed in Section 1 were currently insignificant and unclear [42]. Therefore, we assumed zero volume of wood use in these five applications until 2017 because of the lack of reliable figures from statistical data. We estimated two future wood use potentials for the period from 2018 to 2050: likely and maximum potentials. The details of the respective estimation methods are described below.
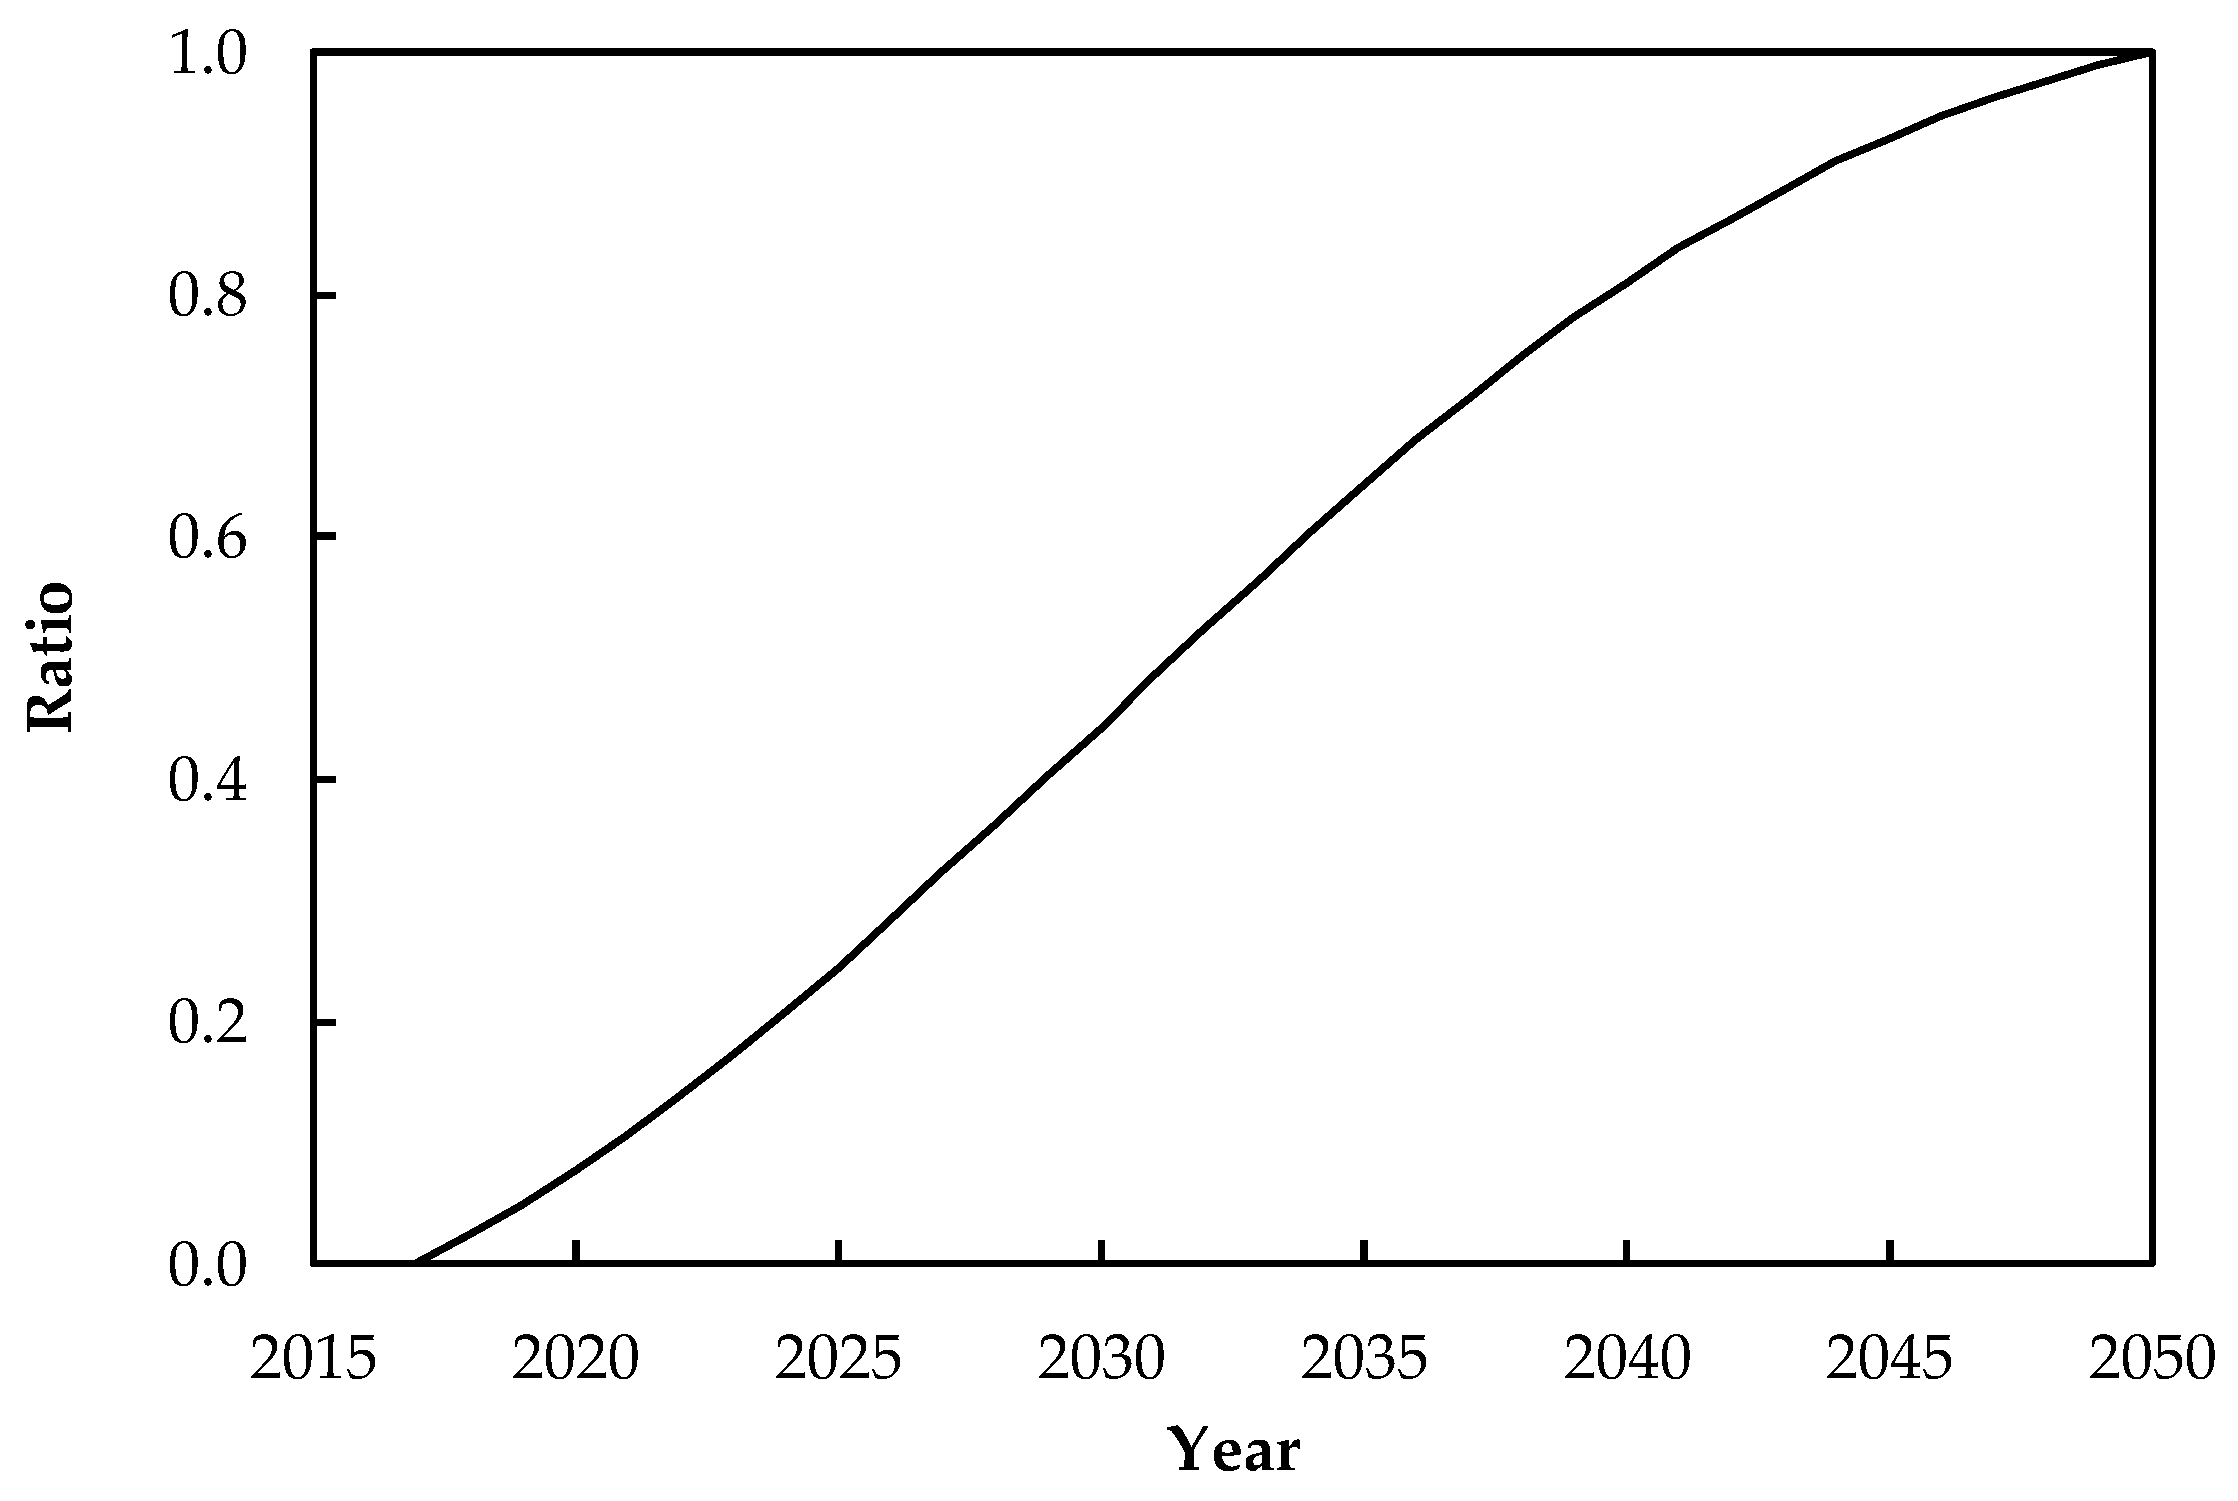
For log piles, an annual piling area for soil improvement through protection against soil liquefaction of approximately 400 ha/year has been identified [42], reflecting the current total area that is dedicated to this purpose. Currently, cement (approximately four million t of which were shipped in 2008) and steel (approximately 600 thousand t in 2006) [42] are primarily used as piling materials. The likely potential for wood-product substitution was calculated by assuming that log pile use would be expanded to half of the annual piling area (i.e., 200 ha/year) in 2050. The maximum potential was calculated by assuming that log piles would be used over the total area (i.e., 400 ha/year) in 2050. We estimated the potential volume (m3/year) of log pile wood use in 2050 by multiplying the area (ha/year) for using log piles by the usage volume of logs per unit piling area (1.17 m3/m2) [33]. The values from 2018 to 2049 were interpolated using a sigmoid curve (Figure 1).
To project wooden check dam installation, we primarily looked at check dams with heights below 5 m. The annual installation of <5 m-high check dams is approximately 980 dams/year [42] (currently, concrete is the primary dam material). Our likely potential assumes that wooden check dams will constitute half (i.e., 490 dams/year) of the annually installed dams in 2050. The maximum potential assumes that wooden check dams will account for the total projected installation rate of 980 dams/year in 2050. We estimated the potential volume (m3/year) of wood use by wooden check dams in 2050 by multiplying the annual installation rate (dam/year) of wooden check dams by the usage volume of wood product per unit check dam (186.89 m3/dam) [34]. Again, the values from 2018 to 2049 were interpolated using a sigmoid curve (Figure 1).
To project woodchip-paved walkway installation, we looked at the annual paving area of roads covered by the Road Act, which is reported to be approximately four thousand ha/year [42] (currently, asphalt is the primary paving material). The reported annual paving area of forestry roads is approximately 400 ha/year [42]. We assumed that woodchip paving can be used in walkways in urban areas to improve drainage, walkability, and aesthetics, and that it can also be used in roads with reduced traffic volume such as forestry roads. Thus, our likely potential assumes that woodchip-paved walkways will account for 5% of the annual paving area of road covered by the Road Act (i.e., 200 ha/year) and half the annual paving area of forestry roads (i.e., 200 ha/year) in 2050. The maximum potential assumes that woodchip-paved walkways will account for 10% of the Road Act coverage annual (i.e., 400 ha/year) and 100% of the annual forestry road coverage (i.e., 400 ha/year) in the same year. We estimated the potential volume (m3/year) of wood use for woodchip-paved walkways by multiplying the annual paving area (ha/year) for such walkways by the usage volume of woodchips per unit paving area (0.06 m3/m2) [35]. Values from 2018 to 2049 were interpolated using a sigmoid curve (Figure 1).
To project wooden guardrail installation, we examined the total length of installed guardrails (currently, steel is used as the primary beam material) of approximately 170 thousand km for roads that are covered by the Road Act and approximately 30 thousand km for other roads (200 thousand km in total) [42]. As a likely potential, we projected that half of the total guardrail length (i.e., 100 thousand km) would comprise wooden guardrails in 2050; for the maximum potential, we projected that wooden guardrails would cover the total length (i.e., 200 thousand km) in that year. We obtained an annual installed length of 10 thousand km/year in 2050 for the likely potential and 20 thousand km/year for the maximum potential by dividing the total projected lengths by a lifetime of 10 years for a guardrail [36]. We estimated the potential volume (m3/year) of wood used for wooden guardrails in 2050 by multiplying the annual installed length (km/year) of wooden guardrails by the usage volume of wood product per unit length (0.05 m3/m) [36]. Once again, values from 2018 to 2049 were interpolated using a sigmoid curve (Figure 1).
To project wooden noise barrier installation, we looked at the total installed length of substitutable noise barriers, which are currently primarily constructed from concrete [42]. The likely potential for wooden barrier installation in 2050 was then set at half of the current total length of three thousand km (i.e., 1.5 thousand km), while the maximum potential was set as the entire installed length. From this, we obtained annual projected installation lengths of 50 and 100 km/year for the respective cases by dividing the total length of wooden noise barriers in each case by a lifetime of 30 years per barrier [37]. We estimated the potential volume (m3/year) of wood use for wooden noise barriers in 2050 by multiplying the annual installed length (km/year) by the usage volume of wood product per unit length (0.15 m3/m) [37]. As in the other cases, values from 2018 to 2049 were interpolated using a sigmoid curve (Figure 1).
2.2. Carbon Storage Effect
Prior studies focus on carbon storage in wood and forests using the LCA and CFs [39,40,41]. The dynamic LCA approach, as proposed by Levasseur et al. [39,41], used a dynamic life-cycle inventory, including the carbon storage in wood and forests through time, whereas that proposed by Vogtländer et al. [40] did not account for the changes in the carbon storage in wood and forests over time. Meanwhile, we herein evaluated the potential carbon storage effect using the approach described in Section 2.2.1, Section 2.2.2 and Section 2.2.3 because we considered the time change of the carbon storage in wood and forests through 2050 to be consistent with the framework in the United Nations Framework Convention on Climate Change (UNFCCC).
2.2.1. Carbon Storage in Wood
As stipulated in Article 3, Paragraphs 3 and 4 of the Kyoto Protocol [43], the UNFCCC adopts a modified production approach to calculating GHG emissions and sinks that includes the annual change in the carbon storage volume in the wood produced domestically by a country’s forests (including wood exported to other countries). Because the wood that is used in civil engineering in Japan is almost completely produced from domestic forests [29,42], the modified production approach can be applied for our calculation as it is consistent with the UNFCCC framework. We estimated the annual change of carbon storage in wood using Equations (1) through (4):
where ACSW (t-CO2eq/year) is the year-to-year change in the amount of carbon stored in wood, CSW (t-CO2eq) is the carbon storage in wood in a given year, WS (m3) is the volume of wood stock used in civil engineering, DW (t/m3) is the density (oven dry mass over air dry volume) of wood (0.45 for coniferous wood) [43], CC (t-C/t) is carbon content of oven-dried wood (0.50) [43], CD (t-CO2/t-C) is conversion factor from the weight of carbon to the weight of carbon dioxide (=44/12), WU (m3/year) is the wood product use potential in civil engineering as described in Section 2.1, LT (-) is the lifetime function, n (years) is the number of years elapsed, r (-) is the rate of decrease (0.2), and a (years) is the civil engineering lifetime (half-life) (infinite for log piles and wooden check dams; 10 years for woodchip-paved walkways and wooden guardrails; 30 years for wooden noise barriers) [33,34,35,36,37]. Additionally, t represents the year, and i is an index denoting the respective wood applications (log pile, wooden check dam, woodchip-paved walkway, wooden guardrail, and wooden noise barrier).
ACSWt,i = CSWt,i − CSWt−1,i
CSWt,i = WSt,i∙DW∙CC∙CD
WSt,i = ∑n{WUt−n,i∙LTt,i(n)}
LTt,i(n) = Exp{−r(n − ai)}/[1 + Exp{−r(n − ai)}]
Meanwhile, the lack of decay over long periods of log piles stored underground has been reported regarding the biodegradation in wood [44,45]. In contrast, the speed of the decay in the other applications is not scientifically clear [34,35,36,37,46]. Therefore, this study did not consider the decrease of carbon storage in wood as a result of the biodegradation in wood for the operational period.
2.2.2. Carbon Storage in Forests
We estimated the annual change of carbon storage in forests using Equations (5) through (8) based on the stock-difference method in the 2006 IPCC Guidelines [47]:
where ACSF (t-CO2eq/year) is the year-to-year change in the amount of carbon stored in forests, CSF (t-CO2eq) is the carbon storage in forests in a given year, FS (m3) is the volume of forest growing stock (stem volume), BEF (-) is the above-ground biomass expansion factor (1.400 for Japanese cedar; 1.325 for Japanese larch) [48], RB (-) is the ratio of the below-ground biomass to the above-ground biomass (0.25 for Japanese cedar; 0.29 for Japanese larch) [48], DF (t/m3) is the density (oven dry mass over wet volume) of green wood (0.314 for Japanese cedar; 0.404 for Japanese larch) [48], FA (ha) is the area of reforestation (=the area of wood harvesting), FSA(n) (m3/ha) is the forest growing stock per unit area n years after reforestation following harvesting [48], YL (-) is the yield from a log to the wood product (1.00 for log piles; 0.64 for squared-off timber for wooden check dams; 0.95 for woodchips used in woodchip-paved walkways; 0.80 for wooden beams used in wooden guardrails; and, 0.32 for wooden panels used in wooden noise barriers) [33,34,35,36,37], YS (-) is the yield from a tree stem to a log (0.856) [33], and FSA(50) (m3/ha) is the forest growing stock (stem volume) per unit area of 50 year-old trees at the time of harvesting (468 for Japanese cedar; 222 for Japanese larch) [48]. k represents an index denoting the tree species (Japanese cedar for log pile, wooden check dam, and woodchip-paved walkway; Japanese larch for wooden guardrail and wooden noise barrier) [33,34,35,36,37].
ACSFt,i = CSFt,i − CSFt−1,i
CSFt,i = FSt,i∙BEFk∙(1 + RBk)∙DFk∙CC∙CD
FSt,i = ∑n{FAt−n,i∙FSAt,k(n)}
FAt−n,i = WUt−n,i/YL/YS/FSUk(50)
We used a baseline for carbon storage at the time of wood harvesting in forests (that is, the carbon storage level of the existing forests) [39]. The 50 year-old for tree age at the time of harvesting was the generally adopted time of harvesting in Japanese forestry [32]. The tree species for reforestation was assumed to be Japanese cedar or Japanese larch because they are the same species as the trees that were harvested [33,34,35,36,37]. The forest growing stock per unit area {FSA(n) and FSA(50)} was adapted from the average value based on the yield tables, which show the relationship between the tree age and the standing tree stem volume per unit area, for the whole of Japan [48].
2.2.3. Carbon Storage Effect of Wood and Forests
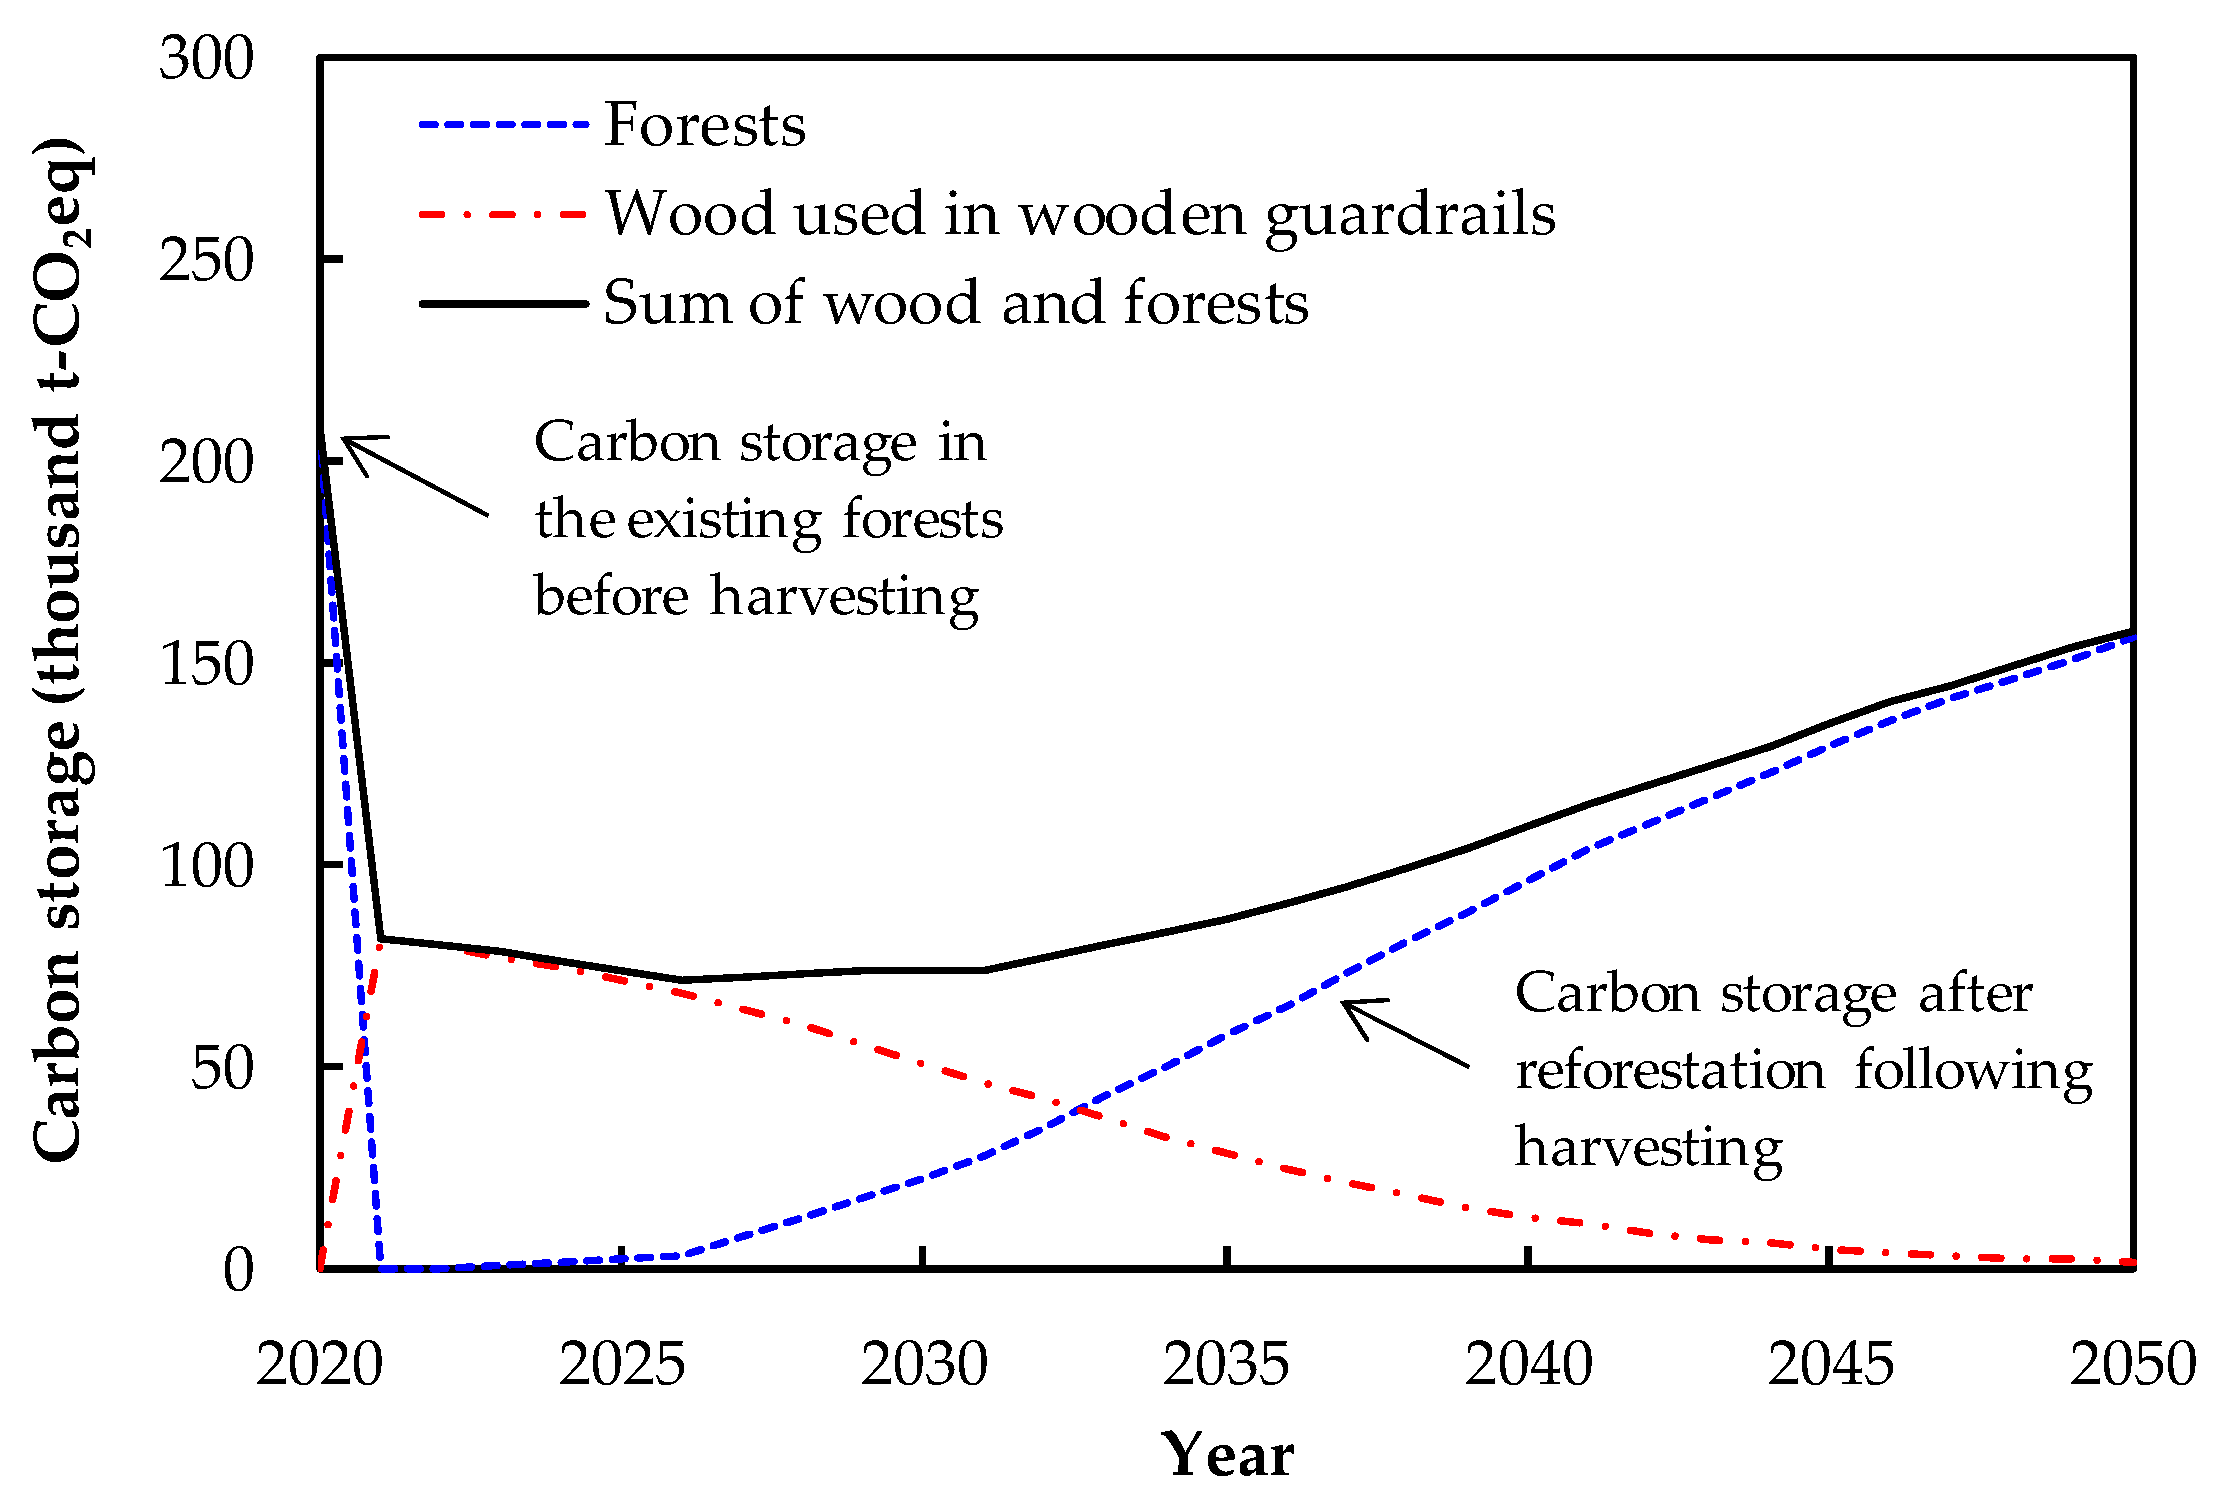
The carbon storage effect was calculated as the sum of the annual change of carbon storage in wood, as outlined in Section 2.2.1, and the annual change of carbon storage in forests, as outlined in Section 2.2.2. An increase in the annual change of carbon storage was evaluated as a positive effect, whereas a decrease in the annual change was a negative effect. Figure 2 shows the case of wood used in wooden guardrails installed in 2021 for the maximum potential as an example of carbon storage in wood and forests.
2.3. Material Substitution Effect
The potential material substitution effect was assessed in terms of the life-cycle GHG emissions avoided by replacing non-wooden materials with wood. The most commonly used non-wood materials in civil engineering were targeted for substitution with wood, including: cement by log piles, concrete by wooden check dams, asphalt by woodchip-paved walkways, steel by wooden guardrails, and concrete by wooden noise barriers. As we included the processes of raw material procurement and product production through the construction process within the system boundary, the analysis could be considered cradle-to-gate; the process of maintenance and management was excluded from our analysis, because log piles, woodchip-paved walkways, and wooden noise barriers require no maintenance [33,35,37]. In addition, GHG emissions from the maintenance and management of wooden check dams and wooden guardrails are insignificant (approximately 5% of the total life-cycle emissions) [34,36]. The processes of disposal and recycling are examined in Section 2.4. For each process, we targeted emissions of CO2, CH4, and N2O originating from the consumption of fossil fuels. The emissions of each GHG were calculated as a CO2 equivalent (kg-CO2eq) using the respective 100-year time-horizon GWP (CO2: 1; CH4: 34; N2O: 298) [49]. We evaluated the GHG emissions (t-CO2eq/year) that were avoided as a result of material substitution by multiplying the avoided GHG emissions per unit wood use volume (kg-CO2eq/m3) for each application shown in Table 1 by the potential wood use volume (m3/year) for each application examined in Section 2.1, above. The details of the evaluation methods applied are described the following sections.
2.3.1. Avoided Life-Cycle GHG Emissions for Log Piles
Our previous study [33] assessed and compared the life-cycle GHG emissions for cement, sand, and log piles in Japan stored underground for the purpose of soil improvement through protection against soil liquefaction. The results on GHG emissions from both log and cement piles per unit piling area (kg-CO2eq/m2) were used in this study and are shown in Table 2. A consistent functional unit based on equal soil improvement conditions was used for both the log and cement pile methods. We found that piles that are driven and stored underground are generally left in the ground rather than disposed of, which is in line with previous experience. Therefore, for lifetime calculations, it was assumed that the piles would remain permanently in the ground. Our modeling of the raw material procurement and product production processes considered the stages of silviculture through log production for log piles and the stages of resource extraction through cement production for cement piles. Also included in the processes for both log and cement piles were the stages of resource extraction through the production of light oil (fuels used to operate machinery at the construction site). For the construction process, we assumed light oil consumption (combustion) from machinery operation. Our results showed that the GHG emissions by log piles are approximately 14% of those by cement piles; thus, reductions in GHG emissions can be obtained by replacing cement piles with log piles. We determined the avoided GHG emission factor (343.12 kg-CO2eq/m3 in Table 1) by dividing the avoided GHG emissions per unit piling area (401.97 kg-CO2eq/m2 in Table 2) by the usage volume of logs per unit piling area (1.17 m3/m2). Note that the values are rounded off to the second decimal place.
2.3.2. Avoided Life-Cycle GHG Emissions for Wooden Check Dams
In a previous work [34], we assessed and compared the life-cycle GHG emissions of two types of wooden check dams with those of concrete and steel check dams in Japan. In this study, we compared the GHG emissions results for one of the two types of wooden check dams (the all-wood type, which uses more wood and produces lower life-cycle GHG emissions) with those of concrete check dams, which is the most common structural type of check dam. The emissions per unit check dam (kg-CO2eq/dam) are shown in Table 3. A consistent functional unit based on the volume of sediment runoff at a given site was used for wooden and concrete check dams. The lifetime of a check dam was assumed to be infinite because they are commonly left in place in the forest rather than disposed of. The raw material procurement and product production process was assumed to include the stages of silviculture through wood product (squared-off timber) production for wooden check dams and the stages of resource extraction through concrete production for concrete check dams. The processes for both wooden and concrete check dams also include the stages of resource extraction through the production of light oil and gasoline (fuels used to operate machinery at the construction site). The construction process was assumed to involve the consumption of light oil and gasoline. GHG emissions by wooden check dams were found to be approximately 45% of those of concrete check dam, resulting in a reduction of GHG emissions by substituting the former for the latter. We obtained the avoided GHG emission factor (131.75 kg-CO2eq/m3 in Table 1) by dividing the avoided GHG emissions per unit dam (24,622.70 kg-CO2eq/dam in Table 3) by the usage volume of wood product per unit dam (186.89 m3/dam).
2.3.3. Avoided Life-Cycle GHG Emissions for Woodchip-Paved Walkways
In a prior study [35], we assessed and compared the life-cycle GHG emissions of woodchip-paved with asphalt-paved and artificial turf walkways in Japan. In this study, we used the GHG emissions results for woodchip-paved and asphalt-paved walkways, as asphalt is most commonly used for paving roads. The GHG emissions per unit paving area (kg-CO2eq/m2) are shown in Table 4. A consistent functional unit based on a typical paving thickness of 4 cm was used for woodchip- and asphalt-paved walkways. We assumed a 10-year walkway lifetime based on the legal service life (the statutory number of years for depreciation of assets) [50]. For woodchip-paved walkways, the raw material procurement and product production processes were assumed to include the stages of silviculture, log production, log transportation from the log production site to the woodchip production site, woodchip production, and woodchip transportation from the woodchip production site to the walkway construction site. These processes also include the stages of resource extraction through the production of the adhesive that is mixed with the woodchips. The construction process was assumed to comprise the stages of resource extraction to the production and consumption of the light oil and electricity used to operate machinery. By contrast, there was no breakdown by process for asphalt-paved walkways [35]. We found that GHG emissions by woodchip-paved walkways are approximately 159% of those by asphalt-paved walkways because the emissions from the adhesive production step in the former are significant. This gives a negative value to the avoided GHG emissions obtained by substituting woodchip-paved roads for asphalt-paved roads. We obtained the avoided GHG emission factor (−171.73 kg-CO2eq/m3 in Table 1) by dividing the avoided GHG emissions per unit paving area (−9.68 kg-CO2eq/m2 in Table 4) by the usage volume of woodchips per unit paving area (0.06 m3/m2). Note that the values are rounded off to the second decimal place.
2.3.4. Avoided Life-Cycle GHG Emissions for Wooden Guardrails
In a previous study [36], we assessed and compared the life-cycle GHG emissions of two types of wooden guardrails with those of steel guardrails and steel guard pipes in Japan. In this study, we used that study’s GHG emissions results for one of the two types of wooden guardrails (wooden type no. 3, which uses more wood and produces lower life-cycle GHG emissions) and for steel guardrails, which are the most common structural type of guardrail. The respective emissions per unit length (kg-CO2eq/m) are shown in Table 5. The previous study [36] examined the use of both surface coating with paint and pressure injection with a preservative as wooden beam preservation methods. The lifetime of guardrails treated by the former method was assumed to be 10 years, while that for the pressure injection-treated rails was assumed to be 20 years. We assumed the use of surface coating methods that generate reduced GHG emissions, even if they reduce the length of service life. A consistent functional unit assuming an equivalent class for roadside earth embedded guardrails was used for both wooden and steel guardrails. The service life was assumed to be 10 years based on the legal service life [50]. The raw material procurement and product production processes for wooden guardrails were assumed to include the stages of silviculture through wood product (wooden beam) production and the stages of resource extraction through paint production for wooden beam coating. The steel guardrail processes were assumed to further include the stages of resource extraction through steel beam production. The construction processes were assumed to include the stages of resource extraction through the production and consumption of the light oil used to operate machinery. We found that the GHG emissions from wooden guardrails are approximately 66% of those from steel guardrails, indicating that reductions in GHG emissions are obtained by replacing steel guardrails with wooden guardrails. We calculated the avoided GHG emission factor (228.36 kg-CO2eq/m3 in Table 1) by dividing the avoided GHG emissions per unit length (12.02 kg-CO2eq/m in Table 5) by the usage volume of wood product per unit length (0.05 m3/m). Note that the values are rounded off to the second decimal place.
2.3.5. Avoided Life-Cycle GHG Emissions for Wooden Noise Barriers
In a previous work [37], we assessed and compared the life-cycle GHG emissions of two types of wooden noise barriers with those of concrete noise barriers in Japan. In this study, we used the results of GHG emissions for one of the two types of wooden noise barriers (Japanese larch barriers, which produce lower life-cycle GHG emissions) and for concrete noise barriers, which are the most common type of noise barrier. The emissions per unit length (kg-CO2eq/m) are shown in Table 6. A consistent functional unit that is based on equal levels of sound transmission loss and wind load was used for both wooden and concrete noise barriers. We assumed a 30-year noise barrier lifetime based on actual data [37]. The raw material procurement and product production processes for wooden noise barriers were assumed to include the stages of silviculture through wood product (wooden panel) production and wooden panel transportation from the panel production site to the construction site. The concrete noise barrier process was assumed to include the stages of resource extraction through concrete panel production. The construction processes were assumed to include the stage of resource extraction and to involve light oil production and consumption through machinery use. We found that the GHG emissions by wooden noise barriers are approximately 94% of those by concrete noise barriers, indicating a slight reduction in life-cycle GHG emissions from replacing concrete noise barriers with wooden noise barriers. We calculated the avoided GHG emission factor (187.29 kg-CO2eq/m3 in Table 1) by dividing the avoided GHG emissions per unit length (27.54 kg-CO2eq/m in Table 6) by the usage volume of wood product per unit length (0.15 m3/m). The values are rounded off to the second decimal place.
2.4. Energy Substitution Effect
The energy substitution effect potential of substituting processing residue and waste wood for fossil fuels in energy generation was assessed in terms of the relevant avoided GHG emissions. Most of the waste wood from construction is currently being used for thermal energy in Japan [51]. Generally in Japan, wood that is used for thermal energy is converted into chips and used as fuels in a chip boiler in place of a heavy oil boiler [52]. Therefore, assuming that processing residue and waste wood were converted into chips, we estimated the reduction of GHG emissions from substituting for heavy oil with chips for a boiler using Equations (9) through (13):
where GER (t-CO2eq/year) is the annual reduction in GHG emissions as a result of energy substitution, GEH (t-CO2eq/year) is the emissions of GHGs from production and consumption of heavy oil, GEW (t-CO2eq/year) is the emissions of GHGs from the production of woodchips for energy use, PR (m3/year) is the volume of processing residue that is generated during wood product production from logs, WW (m3/year) is the volume of waste wood generated from civil engineering structures post-use, CW (GJ/t) is the net calorific value of oven dried-wood (15.34) [53], UW (-) is the average energy usage efficiency for chip boilers (0.775) [52], EH (t-CO2eq/kl) is the emissions of GHGs from production and consumption of heavy oil (including the processes of resource extraction through heavy oil production and combustion) per unit heavy oil volume (3.12) [54], CH (GJ/kl) is the net calorific value of heavy oil (36.73) [53], UH (-) is the average energy efficiency for heavy oil boilers (0.885) [52], LU (kl/m3) is the usage volume of light oil in woodchip production from processing residue and waste wood (0.0015, as obtained from an interview survey of forestry public corporations that own chip plants), and EL (t-CO2eq/kl) is the emissions of GHGs from the production and consumption of light oil (including the processes of resource extraction through light oil production and combustion) per unit light oil volume (2.94) [54].
GERt,i = GEHt,i − GEWt,i
GEHt,i = (PRt,i + WWt,i)∙DW∙CW∙UW∙EH/CH/UH
GEWt,i = (PRt,i + WWt,i)∙LU∙EL
PRt,i = WUt,i/YLi − WUt,i
WWt,i = WSt−1,i − WSt,i + WUt,i
2.5. Climate Change Mitigation Potential
The climate change mitigation potential was calculated as the sum of the annual change in carbon storage volume, as outlined in Section 2.2, the avoided life-cycle GHG emissions enabled by the material substitution, as outlined in Section 2.3, and the avoided GHG emissions from energy substitution, as outlined in Section 2.4.
3. Results and Discussion
3.1. Wood Use Potential in Civil Engineering in Japan
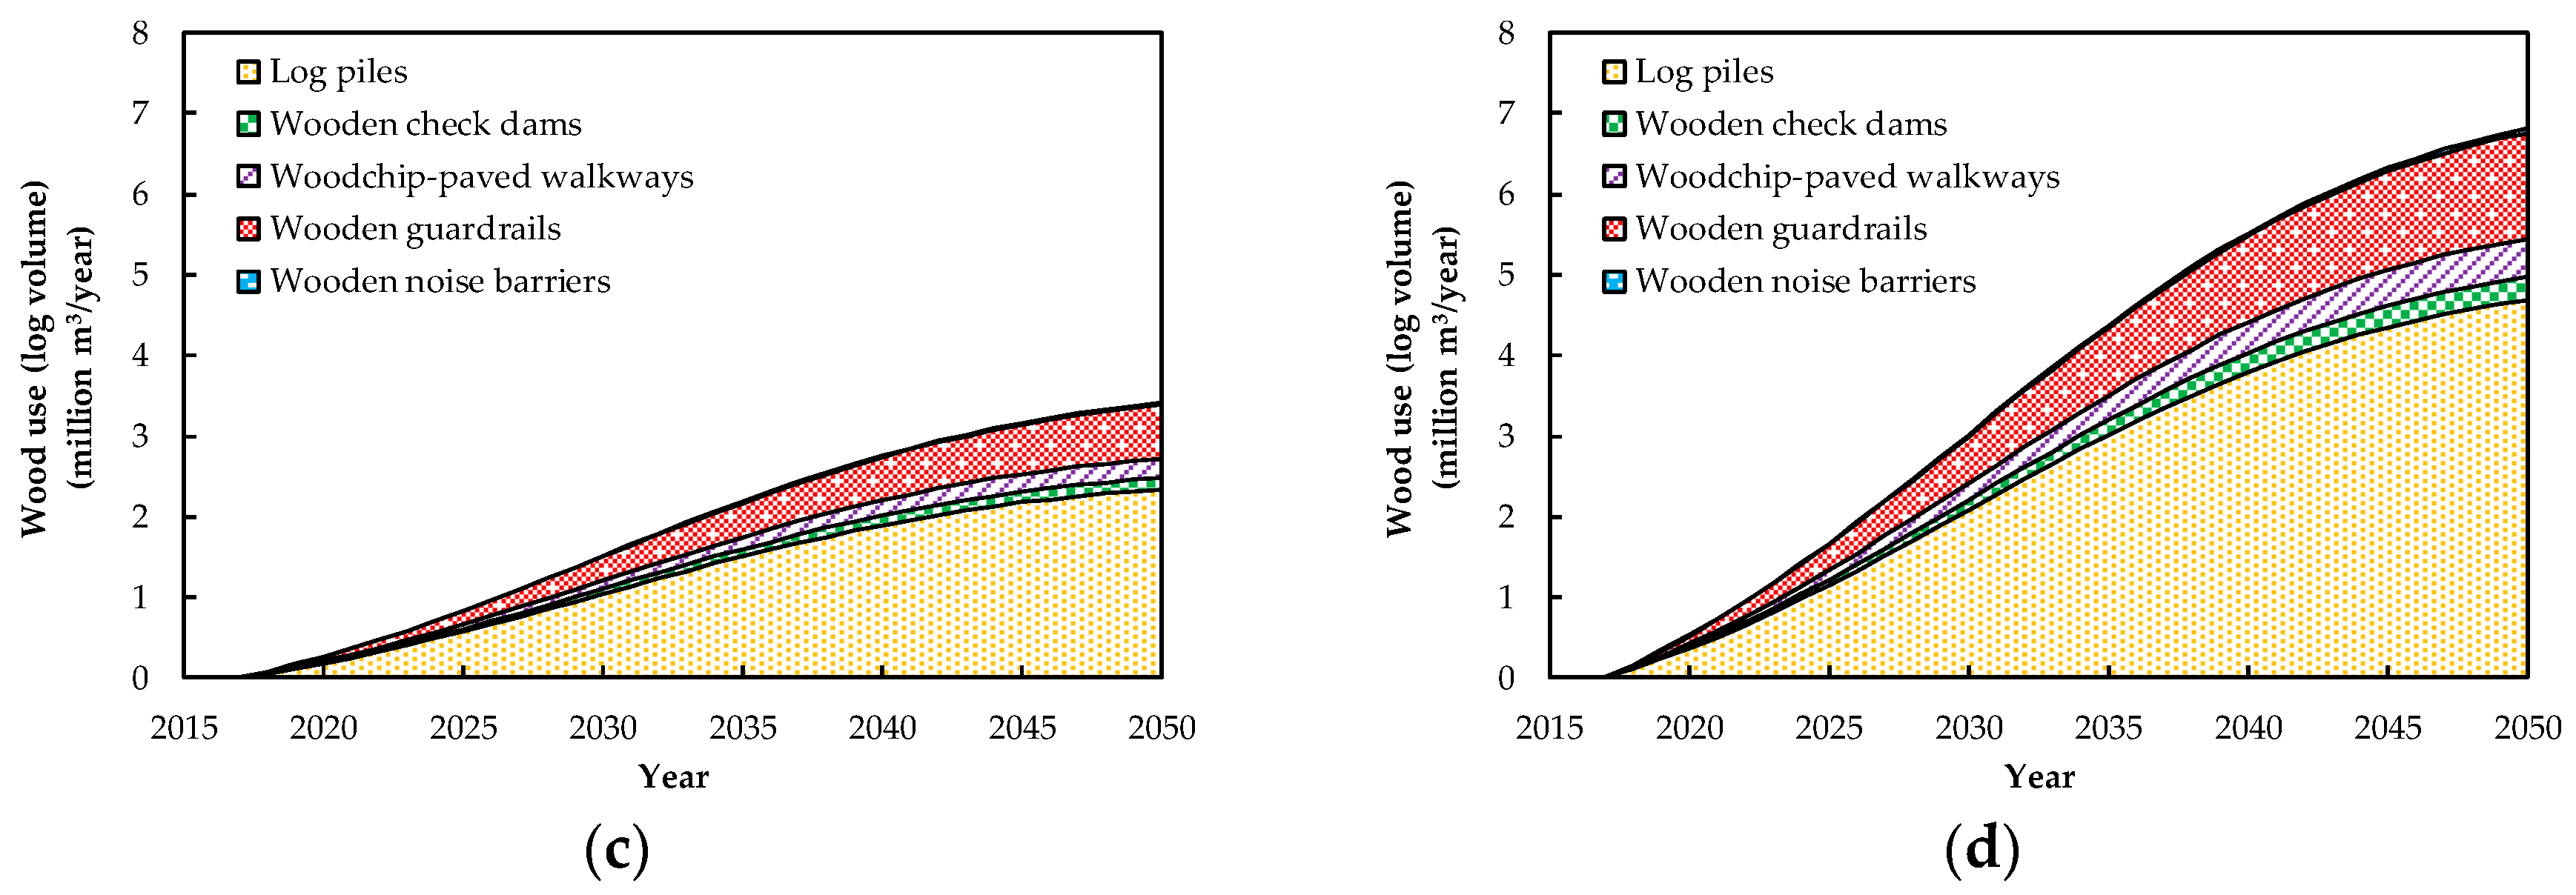
The wood use potential in civil engineering in Japan through 2050 is shown in Figure 3. Figure 3a,b represent the wood product volumes for logs for log piles, squared-off timber for wooden check dams, woodchips for woodchip-paved walkways, wooden beams for wooden guardrails, and wooden panels for wooden noise barriers. Figure 3c,d indicate converted log volumes obtained as the volumes of each wood product yielded by a given volume of logs. The likely and maximum potential product volumes of wood use in 2050 are estimated to be 3.19 and 6.39 million m3/year, respectively. For the likely and maximum potential scenarios, the estimated log volumes in 2050 are 3.40 and 6.80 million m3/year, respectively. These potential volumes correspond, respectively, to 16 and 32% of Japan’s total log production volume (21.58 million m3/year) in 2015 [55]. The 2050 breakdown by application for both the likely and maximum potentials is 69% for log piles, 4% for wooden check dams, 7% for woodchip-paved walkways, 19% for wooden guardrails, and 1% for wooden noise barriers, with log piles accounting for most of the distribution. Although an economics-based feasibility analysis of this wood use potential is required going forward, these results suggest a significant potential availability for civil engineering uses.
The total stock of forests in Japan has continued to increase since the 1960s [29]. The annual growth (stock increase) of Japan’s total forests in 2015 is reported to be approximately 70 million m3/year, with growth after 2035 being projected at 54 million m3/year [56]. Japan’s total log production in 2015 [55] was equivalent to only 31% of forest growth in the same year and 40% of projected future growth. Therefore, there is room for the expansion of domestic wood use, not only in civil engineering, but also in other fields, while increasing Japan’s forest stock.
3.2. Carbon Storage Effect
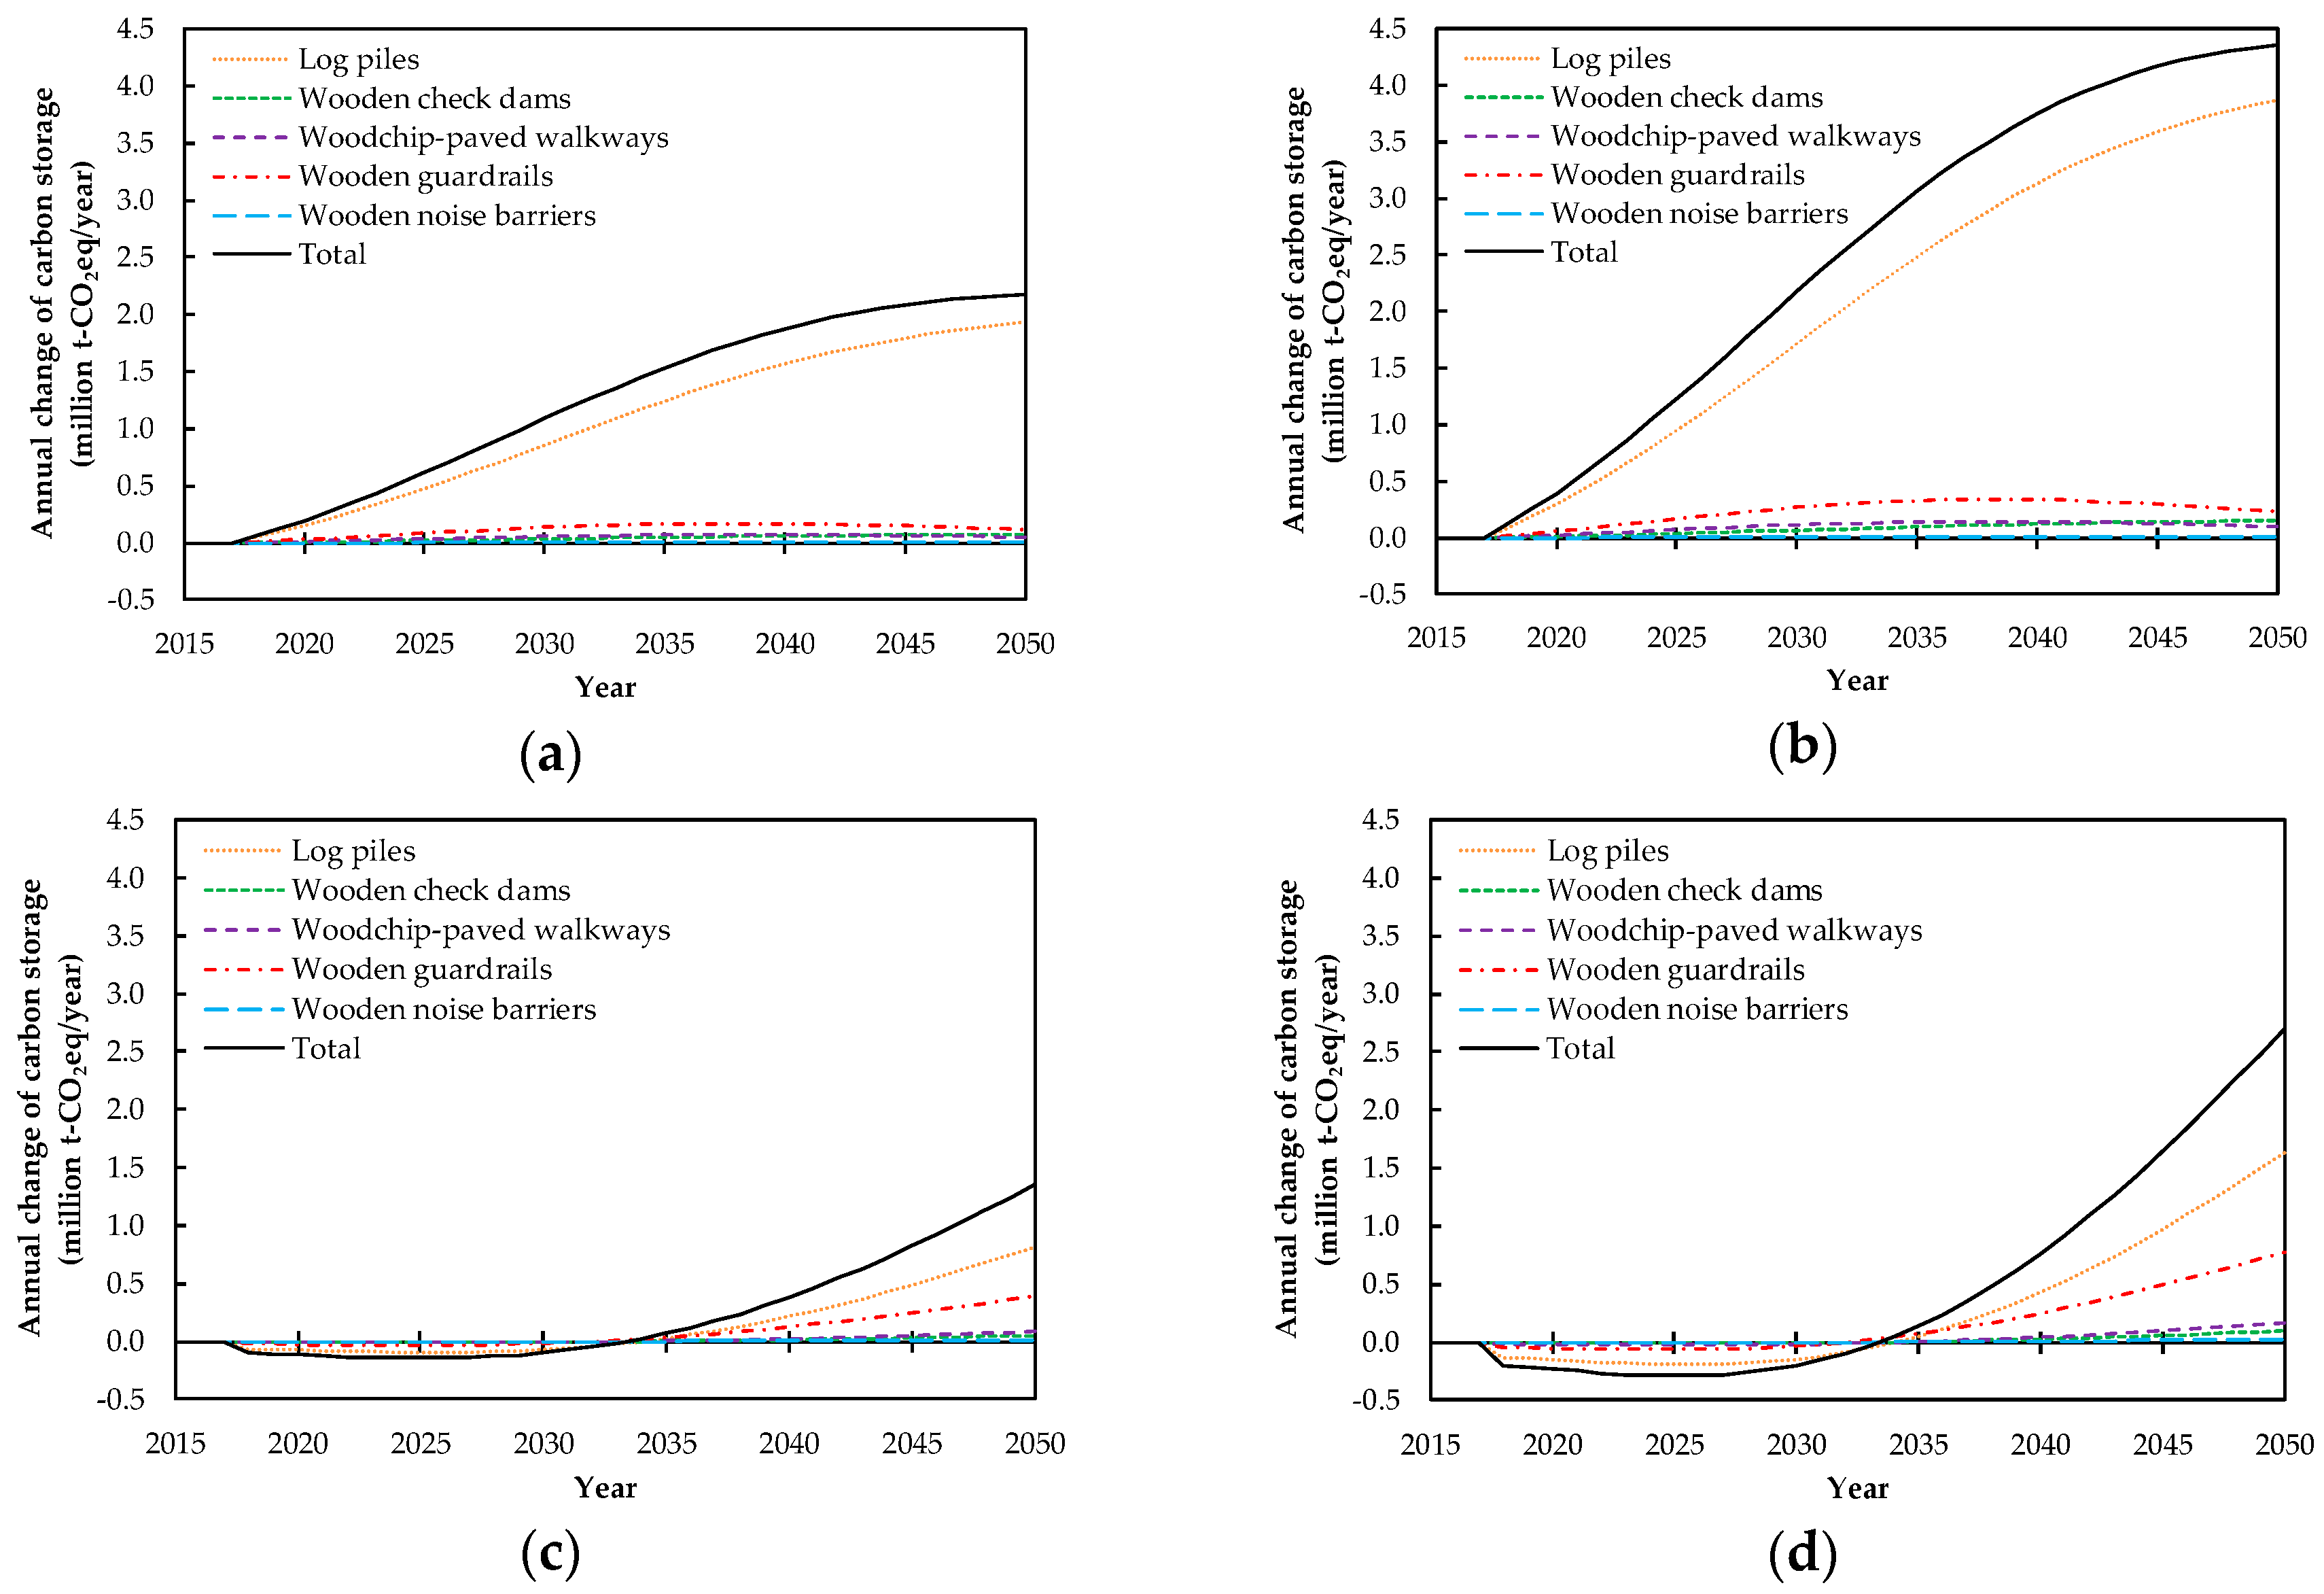
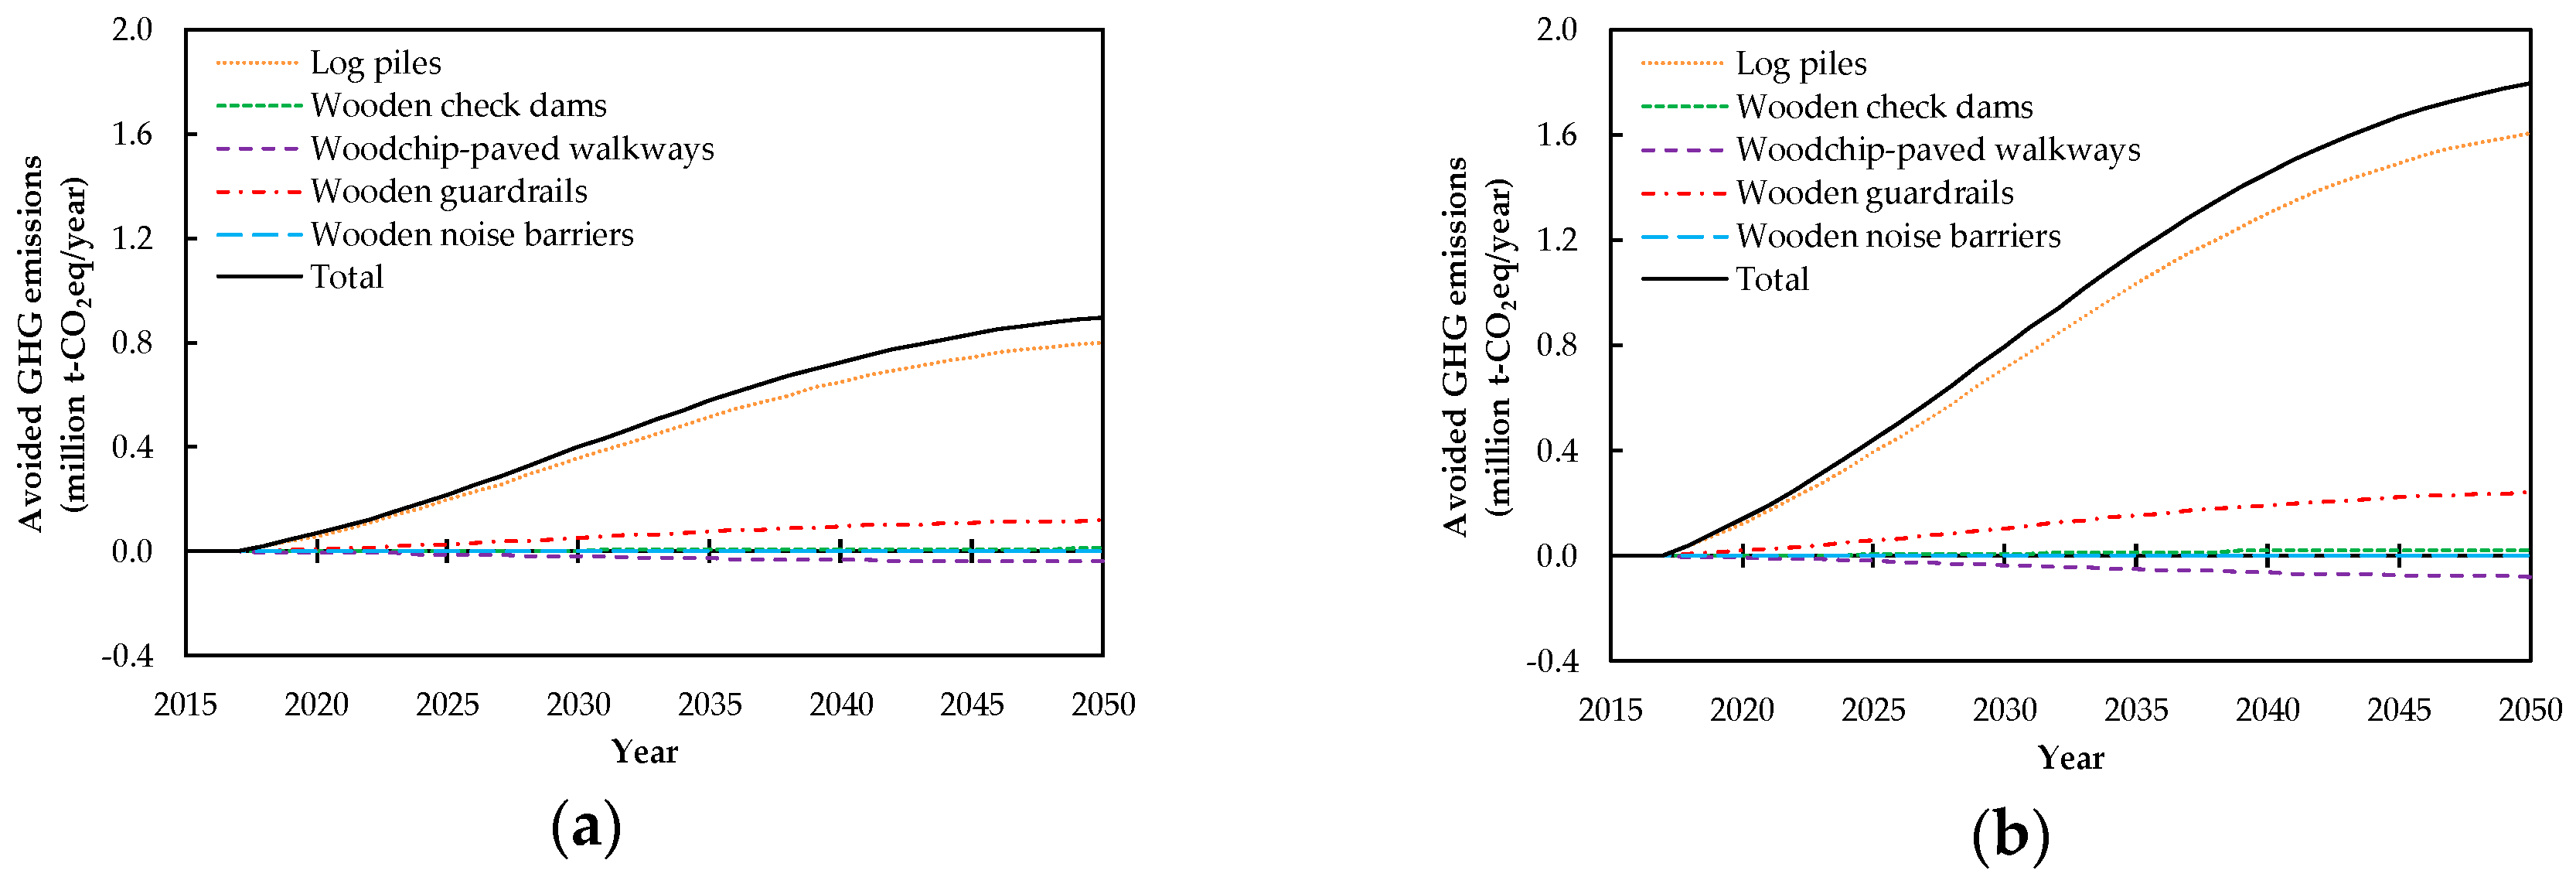
The potential carbon storage effect (annual change in carbon storage) in civil engineering-related wood use in Japan through 2050 is shown in Figure 4a,b. We project total 2030 carbon storage effects arising from the wood substitution applications discussed in this study of 1.09 and 2.17 million t-CO2eq/year under the likely and maximum potential scenarios, respectively. In 2050, these effects are projected to reach 2.18 and 4.36 million t-CO2eq/year, respectively. Of all applications, the effects of using log piles predominate, accounting for 75–89% of the total effect for the period between 2018 and 2050 under both potential pathways. The effects of wooden guardrails are the second greatest, accounting for 5–15% of the total effects for the period, while the effects of the other applications are each less than 10% of the total. Both log piles and wooden check dams are assumed to have indefinite lifetimes. The confirmed lack of decay over long periods of time of log piles stored underground [44,45] makes log piles one of the more promising repositories for long-term carbon storage. By contrast, wooden check dams might experience decreasing carbon storage as a result of biodegradation, depending on environmental conditions, although it is not scientifically clarified [46]. In this case, our projections of their carbon storage effect would be overestimated. However, the overall potential effects of wooden check dam storage are an insignificant proportion (less than 3%) of the total carbon storage effects under both the likely and maximum potential pathways. Thus, even this uncertainty would not change our overall results significantly.
Figure 4c,d present the potential carbon storage effect (annual change in carbon storage) in forest harvested wood that will be used for civil engineering in Japan until 2050. The annual decrease of carbon storage will be observed until 2033 for both the likely and maximum potential scenarios because the amount of carbon storage that decreased by harvesting wood exceeded the amount of carbon storage increased by reforestation after harvesting. However, the annual increase of carbon storage could be obtained after 2034 because of the greater carbon storage that is caused by growing trees after reforestation. The carbon storage effects in forests in 2050 are estimated to be 1.35 and 2.70 million t-CO2eq/year under the likely and maximum potential pathways, respectively. The breakdown by application is 60% for log piles, 29% for wooden guardrails, and 11% for the other applications in 2050 under both potential pathways. Note that reforestation after harvesting is essential in achieving carbon storage effects in forests until 2050.
3.3. Material Substitution Effect
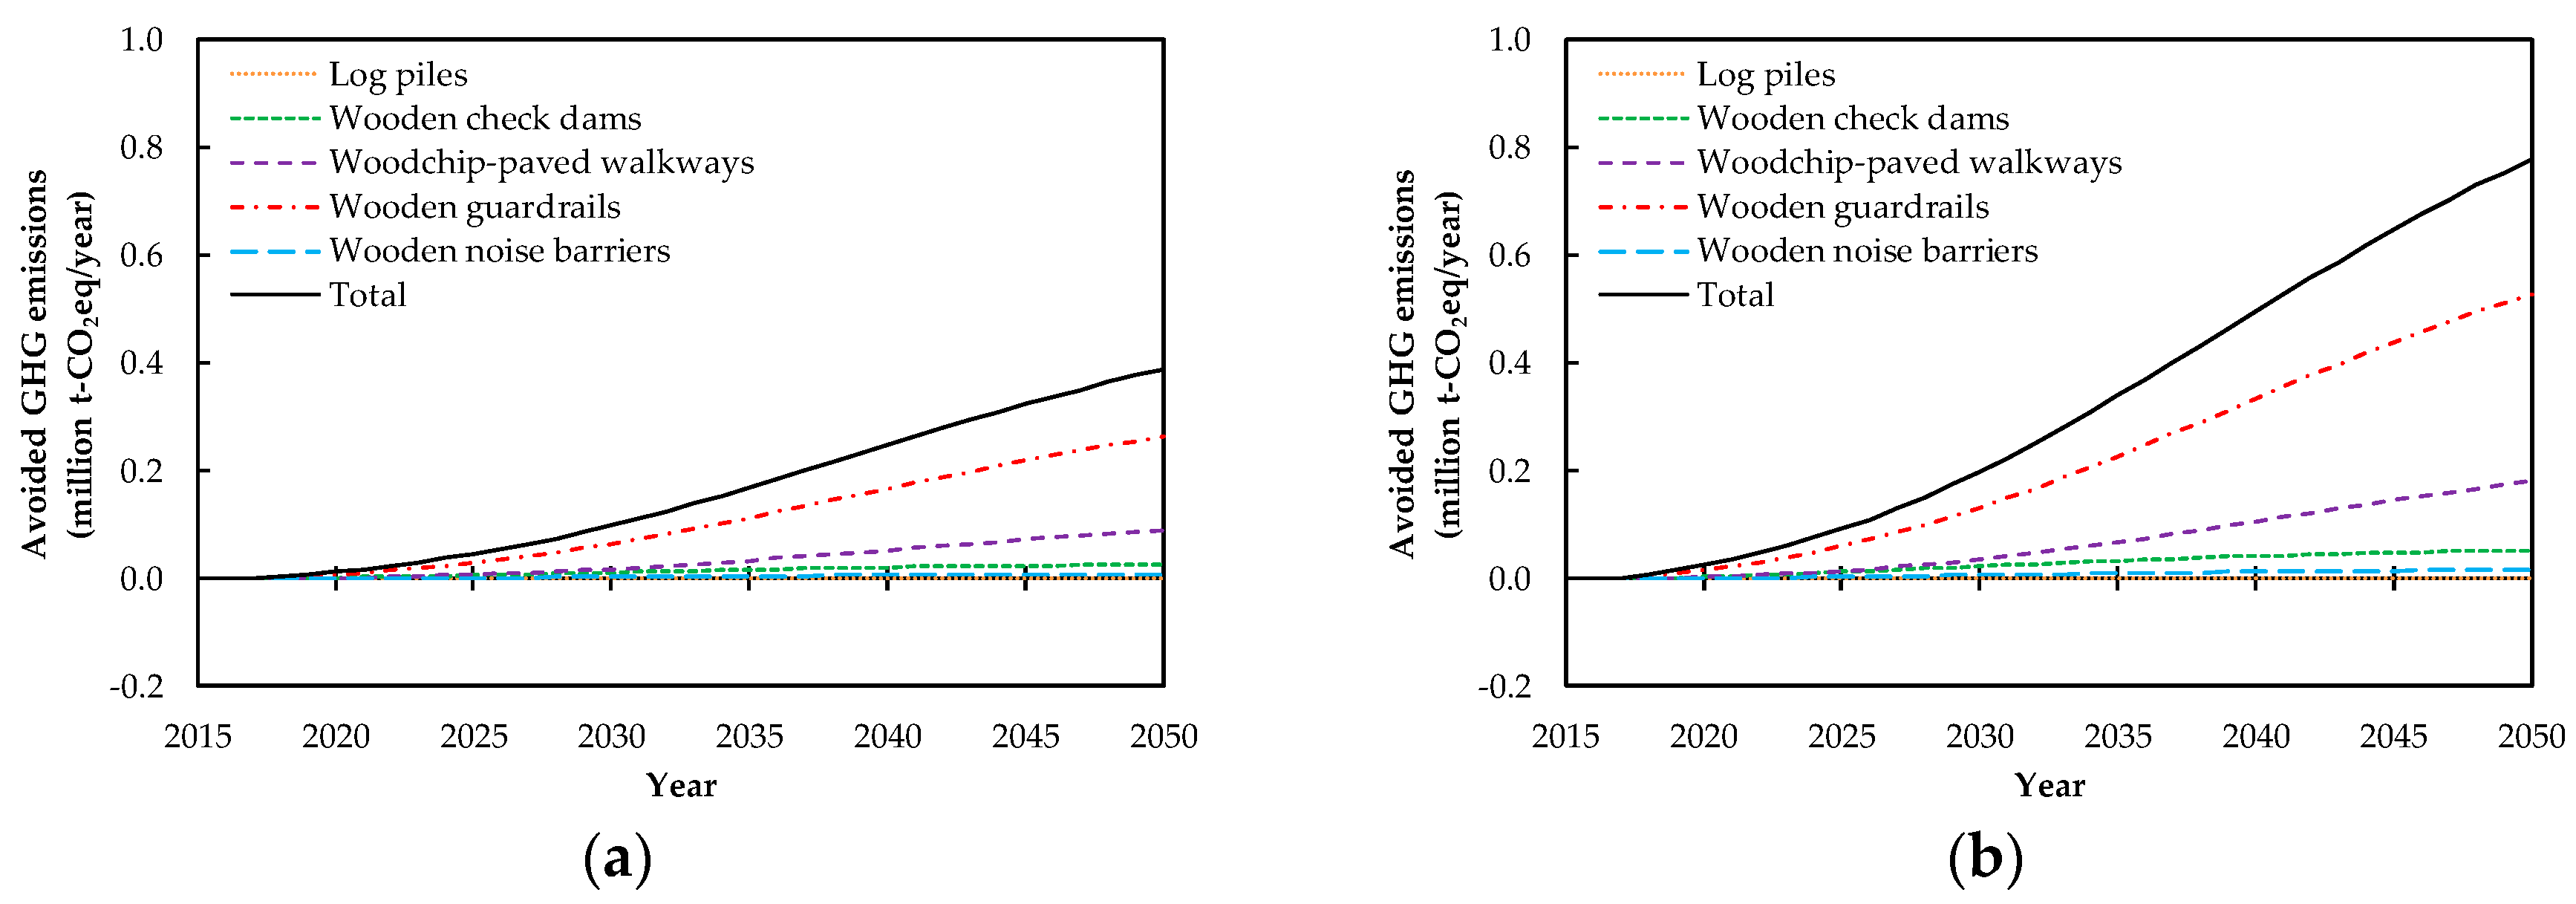
The potential material substitution effect (avoided GHG emissions) through 2050 of using wood in civil engineering in Japan is shown in Figure 5. The avoided life-cycle GHG emissions in 2030 obtained by substituting wooden for non-wooden materials are projected to be 0.40 and 0.80 million t-CO2eq/year under the likely and maximum potential pathways, respectively. In 2050, the projected life-cycle emission reductions are 0.90 and 1.80 million t-CO2eq/year under the respective scenarios. Again, the contribution of log piles is the greatest, reaching 86% of total avoided emissions in 2030 and 2050 under both potential pathways. The effect of wooden guardrails is second highest, accounting for 13% of total reductions. Conversely, replacing asphalt-paved walkways with woodchip-paved walkways results in net negative avoided (increased) emissions (see Table 1 and Table 4). In this study, we targeted the types of wooden structures discussed in previous works [33,34,35,36,37] that produce the lowest life-cycle GHG emissions (i.e., those with the highest avoided GHG emissions). Thus, the consideration of types of structures with higher net emissions would diminish the results produced in this study.
3.4. Energy Substitution Effect
The potential energy substitution effect (avoided GHG emissions), as obtained through 2050 from the use of wood in civil engineering in Japan is shown in Figure 6. The projected life-cycle GHG emissions avoided by replacing heavy oil with processing residue and waste wood in energy use are 0.10 and 0.20 million t-CO2eq/year in 2030 under the likely and maximum potential pathways, respectively. In 2050, the avoided emissions are 0.39 and 0.78 million t-CO2eq/year, respectively. In a breakdown by application, the largest avoided emissions are obtained through wooden guardrail installation, which accounts for 65–68% of the total reductions for the period from 2018 to 2050 under both of the potential pathways. The second-highest level of reductions is obtained from the construction of woodchip-paved walkways, which accounts for 13–23% of total reductions for the period until 2050. This level of avoided emissions by energy substitution—which under the maximum potential pathway equals 0.18 million t-CO2eq/year in 2050—exceeds the increased emissions resulting from material substitution (0.08 million t-CO2eq/year in 2050 under the maximum potential pathway, as shown in Figure 5). Thus, net positive avoided GHG emissions are still obtained by substituting woodchip paving for asphalt paving. In the case of log piles, processing residue for energy use does not generate reductions because the logs are still used in the same manner that they would be used without processing; this is true for waste wood as well as a result of the assumed indefinite lifetime for logs stored underground. Consequently, there is no energy substitution effect for log piles.
3.5. Climate Change Mitigation Potential
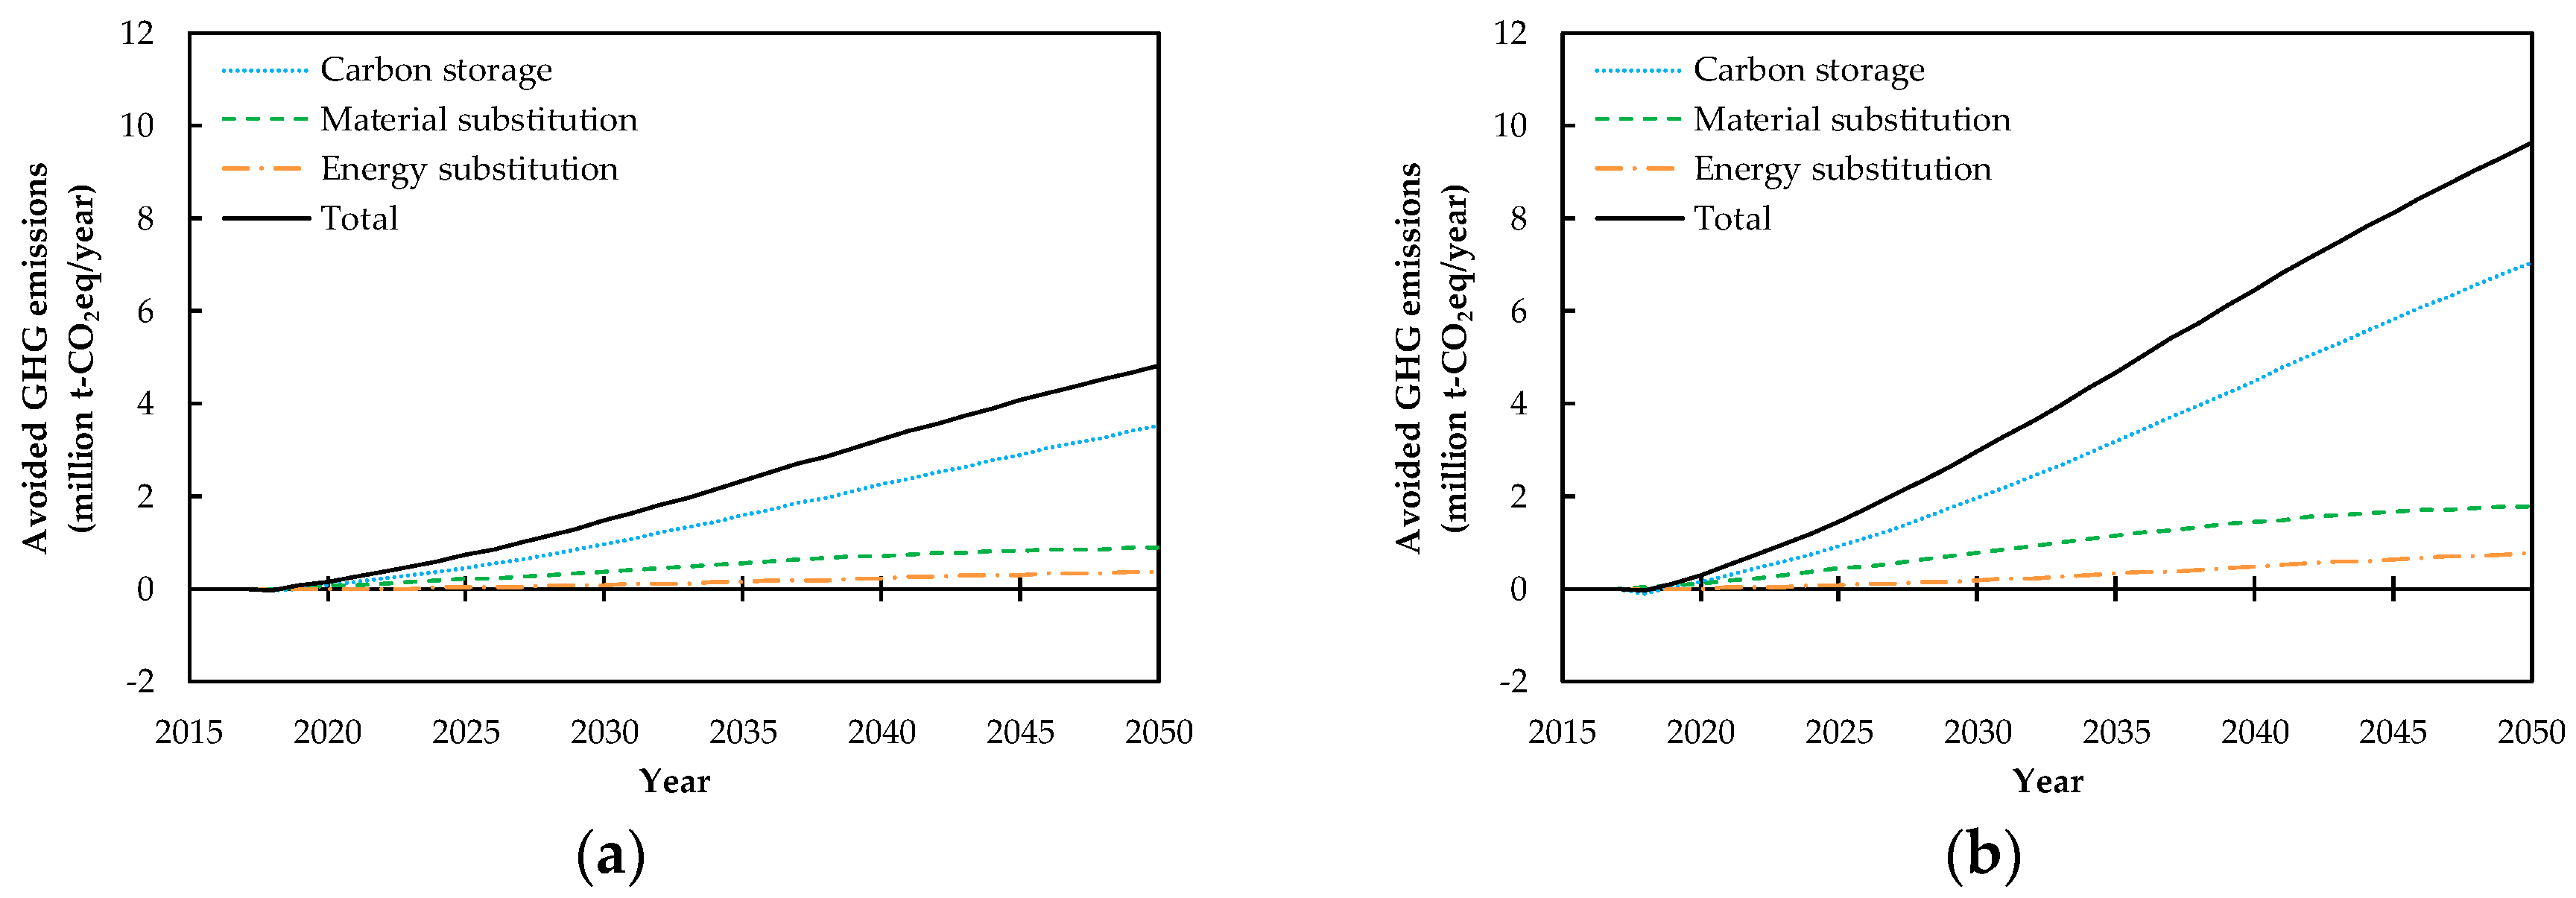
The climate change mitigation potential (avoided GHG emissions) obtained from the projected use of wood in civil engineering in Japan through 2050 is shown in Figure 7. Total avoided GHG emissions in 2050 are estimated to be 4.82 and 9.63 million t-CO2eq/year under the likely and maximum potential pathways, respectively. The total projected avoided GHG emissions in 2050 under the likely and maximum potential pathways are 0.4 and 0.7%, respectively, of Japan’s total GHG emissions in 2015 [57]. The effect in 2050 for both of the pathways is broken down as follows: carbon storage accounts for 73% (wood for 45% and forests for 28%), material substitution accounts for 19%, and energy substitution accounts for 8%. These figures emphasize the significance of the log pile carbon storage effect.
From our results, we calculated an average avoided GHG emission per unit volume of wood product used in civil engineering: 1.04 t-CO2eq/m3 from the carbon storage effect, 0.26 t-CO2eq/m3 from the material substitution effect, and 0.11 t-CO2eq/m3 from the energy substitution effect, adding up to a total mitigation potential of 1.41 t-CO2eq/m3. We compared this value to those found in previous studies [15,16,17,18,19,20]. In prior research focusing on civil engineering, Petersen and Solberg [15] reported that using glulam instead of steel for beams in an airport in Norway could result in emissions reductions of 0.24–0.97 t-CO2eq/m3 of wood used. Hammervold et al. [16] compared wooden, steel, and concrete bridges in Norway and reported that the substitution of steel bridges with wooden bridges resulted in emissions reductions of approximately 0.47 t-CO2eq/m3 of wood (glue-laminated wood and sawn timber), while substitution for concrete bridges produced reductions of approximately 0.10 t-CO2eq/m3. Lu and Hanandeh [17] compared the use of wood (veneer-based composite), steel, and concrete as materials in utility power poles in Australia and found that the substitution of steel by wood resulted in emissions reductions ranging from 0.08–0.10 t-CO2eq/m3 of wood, while substitution for concrete produced emissions reductions of 0.18–0.20 t-CO2eq/m3. Therefore, the average avoided GHG emissions of 1.41 t-CO2eq/m3 in our results were higher than those in other studies targeting civil engineering [15,16,17]. Furthermore, previous works on other applications, in addition to civil engineering include Petersen and Solberg [18], who reported that substitution of steel with wood in Norway and Sweden produced emissions reductions in the range of 0.036–0.53 t-CO2eq/m3 of wood used, while substitution for concrete produced emissions reductions of 0.093–1.062 t-CO2eq/m3. Werner et al. [19] reported an emission reduction of 1.3 t-CO2eq/m3 of wood as a result of substitution for non-wooden materials in Switzerland. Sathre and O’Conner [20] integrated data from 21 different international studies and found an average emission reduction of 1.9 t-CO2eq/m3 from the use of wood as a replacement for non-wooden materials. Thus, our result of 1.41 t-CO2eq/m3 was in the middle range among other studies considering various wood applications [18,19,20]. This suggests that, although using wood instead of non-wooden materials in civil engineering in Japan can produce higher avoided emission factors than in other countries, the improvement in factors involving civil engineering will not particularly translate to all wood applications. However, the assumptions pertaining to the system boundaries, targeted wood and substituted non-wooden materials, and LCI data used in this study differ from those of the previous studies; hence, more detailed comparisons between them are difficult.
4. Conclusions
This study used LCA-based analysis to clarify and quantify the climate change mitigation potential in terms of carbon storage, material substitution, and energy substitution, as obtainable from the use of wood for five representative civil engineering structures in Japan. The findings of the study are summarized as follows:
- The maximum potential domestic wood use in civil engineering applications in 2050 equates to a projected log volume of 6.80 million m3/year. It would be possible to increase domestic wood use in civil engineering while increasing Japan’s forest resources in the future.
- The maximum projected nationwide potential for carbon storage in wood used in civil engineering represents an increase in carbon storage of 4.36 million t-CO2eq/year in 2050. As the most significant contribution comes from the increased use of log piles. When assuming reforestation after harvesting, the maximum nationwide potential for carbon storage in forest harvested wood used in civil engineering would be an increase of 2.70 million t-CO2eq/year in 2050.
- The maximum projected nationwide material substitution effect would equate to an avoided 1.80 million t-CO2eq/year of life-cycle GHG emissions in 2050. We emphasize the significance of avoided emissions that are attributable to the substitution of log piles for cement piles and wooden guardrails for steel guardrails.
- The maximum projected nationwide energy substitution effect would equate to an avoided 0.78 million t-CO2eq/year of life-cycle GHG emissions in 2050. Using processing residue and waste wood generated from both wooden guardrails and woodchip-paved walkways would make significant inroads to avoiding emissions.
- Altogether, the projected carbon storage, material substitution, and energy substitution effects add up to a maximum nationwide climate change mitigation potential of 9.63 million t-CO2eq/year in 2050, which is equivalent to 0.7% of Japan’s total GHG emissions in 2015. This amounts to an average avoided GHG emission per unit wood use volume of 1.41 t-CO2eq/m3 over all three effects.
A primary avenue of future research will be the examination of climate change mitigation potential from wood use in other civil engineering applications, such as wooden bridges and marine reefs. In addition, LCA should be conducted to consider environmental impacts other than climate change to more fully clarify the environmental impacts and benefits of wood use and investigate effective strategies for sustainable wood use.
Acknowledgments
This work was supported by JSPS KAKENHI Grant No. 16K21023, MEXT KAKENHI Grant No. 15H02863, and the Policy Study Fund for Environmental Economics (the third period) of the Ministry of the Environment, Japan.
Author Contributions
C.K. conceived and designed the research framework of this study, conducted the estimation and assessment, and drafted the article. R.N. conceived and designed the research framework with C.K., and assisted in writing the article.
Conflicts of Interest
The authors declare no conflict of interest.
References
- Intergovernmental Panel on Climate Change (IPCC). Climate Change 2014, Fifth Assessment Report, Mitigation of Climate Change; Cambridge University Press: New York, NY, USA, 2014. [Google Scholar]
- International Standards Organization (ISO). Environmental Management—Life-Cycle Assessment—Principles and Framework (ISO 14040), 2nd ed.; ISO: Geneva, Switzerland, 2006. [Google Scholar]
- Jönsson, A.; Tillman, A.M.; Svensson, T. Life-cycle assessment of flooring materials: Case study. Build. Environ. 1997, 32, 245–255. [Google Scholar] [CrossRef]
- Börjesson, P.; Gustavsson, L. Greenhouse gas balances in building construction: Wood versus concrete from life-cycle and forest land-use perspective. Energy Policy 2000, 28, 575–588. [Google Scholar] [CrossRef]
- Dodoo, A.; Gustavsson, L.; Sathre, R. Carbon implication of end-of-life management of building materials. Resour. Conserv. Recycl. 2009, 53, 276–286. [Google Scholar] [CrossRef]
- Iritani, D.R.; Silva, D.A.L.; Saavedra, Y.M.B.; Grael, P.F.F.; Ometto, A.R. Sustainable strategies analysis through life cycle assessment: A case study in a furniture industry. J. Clean. Prod. 2015, 96, 308–318. [Google Scholar] [CrossRef]
- Wenker, J.L.; Richter, K.; Rüter, S. A methodical approach for systematic life cycle assessment of wood-based furniture. J. Ind. Ecol. 2017. [Google Scholar] [CrossRef]
- Ghose, A.; Carrasco, G.C. Environmental aspects of Norwegian production of pulp fibres and printing paper. J. Clean. Prod. 2013, 57, 293–301. [Google Scholar] [CrossRef]
- Achachlouei, M.A.; Moberg, Å. Life cycle assessment of a magazine, part II: A comparison of print and tablet editions. J. Ind. Ecol. 2015, 19, 590–606. [Google Scholar] [CrossRef]
- Henkel, J.; Kunde, R.; Gaderer, M.; Erdmann, G. Assessment of Global Emissions, Local Emissions and Immissions of Different Heating Systems. Sustainability 2009, 1, 494–515. [Google Scholar] [CrossRef]
- Bright, R.M.; Strømman, A.H. Life cycle assessment of second generation bioethanols produced from Scandinavian boreal forest resources: A regional analysis for middle Norway. J. Ind. Ecol. 2009, 13, 514–531. [Google Scholar] [CrossRef]
- Sunde, K.; Brekke, A.; Solberg, B. Environmental impacts and costs of woody Biomass-to-Liquid (BTL) production and use—A review. For. Policy Econ. 2011, 13, 591–602. [Google Scholar] [CrossRef]
- Puettmann, M.E.; Lippke, B. Woody biomass substitution for thermal energy at softwood lumber mills in the US Inland Northwest. For. Prod. J. 2012, 62, 273–279. [Google Scholar] [CrossRef]
- Shen, X.; Kommalapati, R.R.; Huque, Z. The Comparative Life Cycle Assessment of Power Generation from Lignocellulosic Biomass. Sustainability 2015, 7, 12974–12987. [Google Scholar] [CrossRef]
- Petersen, A.K.; Solberg, B. Greenhouse gas emissions, life-cycle inventory and cost-efficiency of using laminated wood instead of steel construction. Case: Beams at Gardermoen airport. Environ. Sci. Policy 2002, 5, 169–182. [Google Scholar] [CrossRef]
- Hammervold, J.; Reenaas, M.; Brattebø, H. Environmental life cycle assessment of bridges. J. Bridge Eng. 2013, 18, 153–161. [Google Scholar] [CrossRef]
- Lu, H.R.; Hanandeh, A.E. Environmental and economic assessment of utility poles using life cycle approach. Clean Technol. Environ. Policy 2017, 19, 1047–1066. [Google Scholar] [CrossRef]
- Petersen, A.K.; Solberg, B. Environmental and economic impacts of substitution between wood products and alternative materials: A review of micro-level analysis from Norway and Sweden. For. Policy Econ. 2005, 7, 249–259. [Google Scholar] [CrossRef]
- Werner, F.; Taverna, R.; Hofer, P.; Thürig, E.; Kaufmann, E. National and global greenhouse gas dynamics of different forest management and wood use scenarios: A model-based assessment. Environ. Sci. Policy 2010, 13, 72–85. [Google Scholar] [CrossRef]
- Sathre, R.; O’Connor, J. Meta-analysis of greenhouse gas displacement factors of wood product substitution. Environ. Sci. Policy 2010, 13, 104–114. [Google Scholar] [CrossRef]
- Suter, F.; Steubing, B.; Hellweg, S. Life cycle impacts and benefits of wood along the value chain: The case of Switzerland. J. Ind. Ecol. 2017, 21, 874–886. [Google Scholar] [CrossRef]
- Sakai, K.; Urushizaki, N.; Ohga, H.; Shimoyama, M. Life cycle CO2 emission from the buildings and the restrain means. J. Archit. Plan. (Trans. AIJ) 1996, 61, 105–112. (In Japanese) [Google Scholar] [CrossRef]
- Urushizaki, N.; Mizuno, M.; Shimoda, Y.; Sakai, K. Estimation on environmental load from construction industry based on Japanese input/output table. J. Archit. Plan. (Trans. AIJ) 2001, 66, 75–82. (In Japanese) [Google Scholar] [CrossRef]
- Kayo, C.; Hashimoto, S.; Moriguchi, Y. Paper and paperboard demand and associated carbon dioxide emissions in Asia through 2050. J. Ind. Ecol. 2012, 16, 529–540. [Google Scholar] [CrossRef]
- Komata, H.; Sakai, S.; Yasaka, M.; Ishikawa, Y.; Hattori, N. An application of life cycle assessment for electric power generated by forest residues: Discussion of reduction of greenhouse gas emissions. Mokuzai Gakkaishi 2013, 59, 22–28. (In Japanese) [Google Scholar] [CrossRef]
- Nishiguchi, S.; Tabata, T. Assessment of social, economic, and environmental aspects of woody biomass energy utilization: Direct burning and wood pellets. Renew. Sustain. Energy Rev. 2016, 57, 1279–1286. [Google Scholar] [CrossRef]
- Nakano, K.; Ando, K.; Takigawa, M.; Hattori, N. Life cycle assessment of wood-based boards produced in Japan and impact of formaldehyde emissions during the use stage. Int. J. Life Cycle Assess. 2017. [Google Scholar] [CrossRef]
- Kayo, C.; Tsunetsugu, Y.; Noda, H.; Tonosaki, M. Carbon balance assessments of harvested wood products in Japan taking account of inter-regional flows. Environ. Sci. Policy 2014, 37, 215–226. [Google Scholar] [CrossRef]
- Forestry Agency. Annual Report on Forest and Forestry in Japan (Fiscal Year 2016); Forestry Agency: Tokyo, Japan, 2017.
- Forestry Agency. Annual Report on Forest and Forestry in Japan (Fiscal Year 2013); Forestry Agency: Tokyo, Japan, 2014.
- Forestry Agency. Annual Report on Forest and Forestry in Japan (Fiscal Year 2014); Forestry Agency: Tokyo, Japan, 2015.
- Forestry Agency. Annual Report on Forest and Forestry in Japan (Fiscal Year 2015); Forestry Agency: Tokyo, Japan, 2016.
- Kayo, C.; Hashimoto, S.; Numata, A.; Hamada, M. Reductions in greenhouse gas emissions by using wood to protect against soil liquefaction. J. Wood Sci. 2011, 57, 234–240. [Google Scholar] [CrossRef]
- Noda, R.; Kayo, C.; Sasaki, T.; Takaoku, S. Evaluation of CO2 emissions reductions by timber check dams and their economic effectiveness. J. Wood Sci. 2014, 60, 461–472. [Google Scholar] [CrossRef]
- Kayo, C.; Watanabe, C.; Sasaki, T.; Kumagai, S.; Noda, R.; Hashimoto, S. Life cycle greenhouse gas emissions of woodchip-paved walkways using tsunami salt-damaged wood—Examination in Otsuchi, Iwate Prefecture. J. Wood Sci. 2015, 61, 620–629. [Google Scholar] [CrossRef]
- Noda, R.; Kayo, C.; Yamanouchi, M.; Shibata, N. Life cycle greenhouse gas emission of wooden guardrails—A study in Nagano Prefecture. J. Wood Sci. 2016, 62, 181–193. [Google Scholar] [CrossRef]
- Noda, R.; Kayo, C.; Yamanouchi, M.; Shibata, N. Life cycle greenhouse gas emissions of wooden roadside noise barriers in Nagano Prefecture. Mokuzai Gakkaishi 2017, 63, 41–53. (In Japanese) [Google Scholar] [CrossRef]
- Holtsmark, B. Quantifying the global warming potential of CO2 emissions from wood fuels. GCB Bioenergy 2015, 7, 195–206. [Google Scholar] [CrossRef]
- Brandão, M.; Levasseur, A.; Kirschbaum, M.U.F.; Weidema, B.P.; Cowie, A.L.; Jørgensen, S.V.; Hauschild, M.Z.; Pennington, D.W.; Chomkhamsri, K. Key issues and options in accounting for carbon sequestration and temporary storage in life cycle assessment and carbon footprinting. Int. J. Life Cycle Assess. 2013, 18, 230–240. [Google Scholar] [CrossRef]
- Vogtländer, J.G.; Velden, N.M.; Lugt, P. Carbon sequestration in LCA, a proposal for a new approach based on the global carbon cycle; cases on wood and on bamboo. Int. J. Life Cycle Assess. 2014, 19, 13–23. [Google Scholar] [CrossRef]
- Levasseur, A.; Lesage, P.; Margni, M.; Samson, R. Biogenic carbon and temporary storage addressed with dynamic life cycle assessment. J. Ind. Ecol. 2013, 17, 117–128. [Google Scholar] [CrossRef]
- Interdisciplinary Committee on the Increased Use of Wood in Civil Engineering. 2009 Report on Interdisciplinary Study on the Increased Use of Wood in Civil Engineering; Interdisciplinary Committee on the Increased Use of Wood in Civil Engineering: Tokyo, Japan, 2010; pp. 63–74. (In Japanese) [Google Scholar]
- Hiraishi, T.; Krug, T.; Tanabe, K.; Srivastava, N.; Baasansuren, J.; Fukuda, M.; Troxler, T.G. (Eds.) 2013 Revised Supplementary Methods and Good Practice Guidance Arising from the Kyoto Protocol; Intergovernmental Panel on Climate Change (IPCC): Geneva, Switzerland, 2014. [Google Scholar]
- Numata, A.; Uesugi, A.; Yoshida, M.; Kubo, M.; Genzai, H.; Nomura, T. Case study of decay of wood used in civil engineering. In Proceedings of the 57th Annual Meeting of the Japan Wood Research Society, Hiroshima, Japan, 8–10 August 2007. (In Japanese). [Google Scholar]
- Numata, A.; Kubo, M.; Hamada, M.; Yoshida, M.; Nakamura, H.; Nomura, T. Investigation of soundness and saturation of log pile collected from underground. In Proceedings of the Japan Society of Civil Engineers 2009 Annual Meeting, Fukuoka, Japan, 2–4 September 2009. (In Japanese). [Google Scholar]
- Kayo, C.; Noda, R.; Sasaki, T.; Takaoku, S. Carbon balance in the life cycle of wood: Targeting a timber check dam. J. Wood Sci. 2015, 61, 70–80. [Google Scholar] [CrossRef]
- Eggleston, H.S.; Buendia, L.; Miwa, K.; Ngara, T.; Tanabe, K. (Eds.) 2006 IPCC Guidelines for National Greenhouse Gas Inventories; Intergovernmental Panel on Climate Change (IPCC), the Institute for Global Environmental Strategies (IGES): Hayama, Japan, 2006. [Google Scholar]
- Ministry of the Environment. Results of Greenhouse Gas Emission Calculations; Report No. 5 of subcommittee Meetings on Forest Sinks; Ministry of the Environment: Tokyo, Japan, 2006. (In Japanese)
- Intergovernmental Panel on Climate Change (IPCC). Climate Change 2013, Fifth Assessment Report, The Physical Science Basis; Cambridge University Press: New York, NY, USA, 2013. [Google Scholar]
- Ministry of Finance, Japan. Ministerial Ordinance Concerning the Useful Life, etc. of Depreciable Assets; Ministry of Finance, Japan: Tokyo, Japan, 2017. Available online: http://law.e-gov.go.jp/htmldata/S40/S40F03401000015.html (accessed on 6 November 2017). (In Japanese)
- Ministry of the Environment. The Current Situation as Regards Reduction of Wood Generated by Construction; Ministry of the Environment: Tokyo, Japan, 2013. (In Japanese)
- Japan Wood Energy Co., Ltd. Wood Biomass Boiler Installation Guide; Japan Wood Energy Co., Ltd.: Tokyo, Japan, 2012. (In Japanese) [Google Scholar]
- Research Institute of Economy, Trade and Industry. RIETI Discussion Paper Series 14-J-047; Research Institute of Economy, Trade and Industry: Tokyo, Japan, 2014. (In Japanese)
- Japan Environmental Management Association for Industry. MiLCA; Japan Environmental Management Association for Industry: Tokyo, Japan, 2014. [Google Scholar]
- Ministry of Agriculture, Forestry, and Fisheries. Report on Wood Supply and Demand 2015; Ministry of Agriculture, Forestry, and Fisheries: Tokyo, Japan, 2016.
- Forestry Agency. Forest and Forestry Basic Plan; Forestry Agency: Tokyo, Japan, 2016. (In Japanese)
- Ministry of the Environment. Environmental Statistics 2015; Ministry of the Environment: Tokyo, Japan, 2016.
Figure 1.
Sigmoid curve to interpolate values from 2018 to 2049.

Figure 2.
Carbon storage in wood and forests in the case of wood used in wooden guardrails installed in 2021 for the maximum potential.
Figure 2.
Carbon storage in wood and forests in the case of wood used in wooden guardrails installed in 2021 for the maximum potential.

Figure 3.
Wood use potential for civil engineering in Japan until 2050: (a) likely potential with wood product volume; (b) maximum potential with wood product volume; (c) likely potential with log volume; and, (d) maximum potential with log volume.
Figure 3.
Wood use potential for civil engineering in Japan until 2050: (a) likely potential with wood product volume; (b) maximum potential with wood product volume; (c) likely potential with log volume; and, (d) maximum potential with log volume.


Figure 4.
Annual change of carbon storage in wood used in civil engineering and forest harvested wood in Japan until 2050: (a) likely potential for wood; (b) maximum potential for wood; (c) likely potential for forests; and, (d) maximum potential for forests.
Figure 4.
Annual change of carbon storage in wood used in civil engineering and forest harvested wood in Japan until 2050: (a) likely potential for wood; (b) maximum potential for wood; (c) likely potential for forests; and, (d) maximum potential for forests.

Figure 5.
Avoided GHG emissions from material substitution by using wood in civil engineering in Japan until 2050: (a) likely potential; and, (b) maximum potential.
Figure 5.
Avoided GHG emissions from material substitution by using wood in civil engineering in Japan until 2050: (a) likely potential; and, (b) maximum potential.

Figure 6.
Avoided GHG emissions from energy substitution by using wood in civil engineering in Japan until 2050: (a) likely potential; and, (b) maximum potential.
Figure 6.
Avoided GHG emissions from energy substitution by using wood in civil engineering in Japan until 2050: (a) likely potential; and, (b) maximum potential.

Figure 7.
Climate change mitigation potential by using wood in civil engineering in Japan through 2050: (a) likely potential; and, (b) maximum potential.
Figure 7.
Climate change mitigation potential by using wood in civil engineering in Japan through 2050: (a) likely potential; and, (b) maximum potential.


Table 1.
Avoided life-cycle greenhouse gases (GHG) emission factors for material substitution (kg-CO2eq/m3-wood product).
Table 1.
Avoided life-cycle greenhouse gases (GHG) emission factors for material substitution (kg-CO2eq/m3-wood product).
| Civil Engineering Application | Avoided Life-Cycle GHG Emissions |
|---|---|
| Log pile (cement substitution ) | 343.12 |
| Wooden check dam (concrete substitution) | 131.75 |
| Woodchip-paved walkway (asphalt substitution) | −171.73 |
| Wooden guardrail (steel substitution) | 228.36 |
| Wooden noise barrier (concrete substitution) | 187.29 |
Note: The values are rounded off to the second decimal place.
Table 2.
Life-cycle GHG emissions of log and cement piles (kg-CO2eq/m2).
| Life-Cycle Process/Stage | Log Pile | Cement Pile | |
|---|---|---|---|
| Raw material procurement and product production | Silviculture—log production | 32.45 | - |
| Resource extraction—cement production | - | 353.38 | |
| Resource extraction—light oil production | 3.66 | 12.23 | |
| Construction | Light oil consumption | 30.97 | 103.44 |
| Total | 67.09 | 469.05 | |
Note: The values are rounded off to the second decimal place.
Table 3.
Life-cycle GHG emissions of wooden check and concrete check dams (kg-CO2eq/dam).
| Life-Cycle Process/Stage | Wooden Check Dam | Concrete Check Dam | |
|---|---|---|---|
| Raw material procurement and product production | Silviculture—squared-off timber production | 10,108.80 | - |
| Resource extraction—concrete production | - | 42,202.40 | |
| Resource extraction—artificial lawn production | 1368.00 | 842.10 | |
| Resource extraction—lag screw production | 2373.60 | - | |
| Resource extraction—steel bar production | 1084.10 | - | |
| Resource extraction—vinyl chloride pipe production | 780.70 | 551.10 | |
| Resource extraction—light oil production | 285.30 | 79.60 | |
| Resource extraction—gasoline production | 0.60 | 0.40 | |
| Construction | Light oil and gasoline consumption | 4029.90 | 978.10 |
| Total | 20,031.00 | 44,653.70 | |
Note: The values are rounded off to the second decimal place.
Table 4.
Life-cycle GHG emissions of woodchip-paved and asphalt-paved walkways (kg-CO2eq/m2).
| Life-Cycle Process/Stage | Woodchip-Paved | Asphalt-Paved | |
|---|---|---|---|
| Raw material procurement and product production | Silviculture—log production | 0.08 | 16.48 |
| Log transportation | 0.00 | ||
| Woodchip production | 0.28 | ||
| Woodchip transportation | 0.08 | ||
| Resource extraction—adhesive production | 24.73 | ||
| Construction | Light oil and electricity production/consumption | 0.99 | |
| Total | 26.16 | 16.48 | |
Note: The values are rounded off to the second decimal place.
Table 5.
Life-cycle GHG emissions of wooden and steel guardrails (kg-CO2eq/m).
| Life-Cycle Process/Stage | Wooden Guardrail | Steel Guardrail | |
|---|---|---|---|
| Raw material procurement and product production | Silviculture—wooden beam production | 1.49 | - |
| Resource extraction—steel beam production | - | 20.96 | |
| Resource extraction—support post production | 14.00 | 12.72 | |
| Resource extraction—connector production | 4.83 | 1.36 | |
| Resource extraction—paint production | 0.47 | - | |
| Construction | Light oil production/consumption | 2.82 | 0.59 |
| Total | 23.61 | 35.64 | |
Note: The values are rounded off to the second decimal place.
Table 6.
Life-cycle GHG emissions of wooden and concrete noise barriers (kg-CO2eq/m).
| Life-Cycle Process/Stage | Wooden Noise Barrier | Concrete Noise Barrier | |
|---|---|---|---|
| Raw material procurement and product production | Silviculture—wooden panel production | 42.25 | - |
| Wooden panel transportation | 1.78 | - | |
| Resource extraction—concrete panel production | 75.93 | 147.51 | |
| Resource extraction—support post production | 94.60 | 94.60 | |
| Resource extraction—foundation production | 244.72 | 244.72 | |
| Construction | Light oil production/consumption | 3.73 | 3.73 |
| Total | 463.01 | 490.55 | |
Note: The values are rounded off to the second decimal place.
© 2018 by the authors. Licensee MDPI, Basel, Switzerland. This article is an open access article distributed under the terms and conditions of the Creative Commons Attribution (CC BY) license (http://creativecommons.org/licenses/by/4.0/).
Share and Cite
MDPI and ACS Style
Kayo, C.; Noda, R. Climate Change Mitigation Potential of Wood Use in Civil Engineering in Japan Based on Life-Cycle Assessment. Sustainability 2018, 10, 561. https://doi.org/10.3390/su10020561
AMA Style
Kayo C, Noda R. Climate Change Mitigation Potential of Wood Use in Civil Engineering in Japan Based on Life-Cycle Assessment. Sustainability. 2018; 10(2):561. https://doi.org/10.3390/su10020561
Chicago/Turabian StyleKayo, Chihiro, and Ryu Noda. 2018. "Climate Change Mitigation Potential of Wood Use in Civil Engineering in Japan Based on Life-Cycle Assessment" Sustainability 10, no. 2: 561. https://doi.org/10.3390/su10020561
Note that from the first issue of 2016, this journal uses article numbers instead of page numbers. See further details here.