Social Network Analysis of Scientific Articles Published by Food Policy
by
 , , ,
, , ,
József Popp
1 ,
,
Péter Balogh
1, 
Judit Oláh
2,* ,
,
Sebastian Kot
3,4 ,
,
Mónika Harangi Rákos
1 and
Péter Lengyel
2 1
Institute of Sectoral Economics and Methodology, Faculty of Economics and Business, University of Debrecen, Debrecen 4032, Hungary
2
Institute of Applied Informatics and Logistics, Faculty of Economics and Business, University of Debrecen, Debrecen 4032, Hungary
3
The Management Faculty, Czestochowa University of Technology, Częstochowa 42-201, Poland
4
Faculty of Economic Sciences and IT, North-West University, Vanderbijlpark 1900, South Africa
*
Author to whom correspondence should be addressed.
Sustainability 2018, 10(3), 577; https://doi.org/10.3390/su10030577
Submission received: 8 February 2018
/
Revised: 18 February 2018
/
Accepted: 21 February 2018
/
Published: 26 February 2018
(This article belongs to the Special Issue Alliances and Network Organizations for Sustainable Development)
Abstract
:The article analyses co-authorship and co-citation networks in Food Policy, which is the most important agricultural policy journal in the field of agricultural economics. The paper highlights the principal researchers in this field together with their authorship and citation networks on the basis of 714 articles written between 2006 and 2015. Results suggest that the majority of the articles were written by a small number of researchers, indicating that groups and central authors play an important role in scientific advances. It also turns out that the number of articles and the central role played in the network are not related, contrary to expectations. Results also suggest that groups cite themselves more often than average, thereby boosting the scientific advancement of their own members.
1. Introduction
The number of articles published globally in different scientific areas has increased exponentially in recent years, and the behavior of those involved in scientific production itself has changed over time [1]. Despite the clear importance of the topic, analyses of co-authorship and co-citation networks operating mainly in the field of agricultural economics or agribusiness, are scarce. As [2] state, the link between scientific collaboration in a research project and the impact of the research results have been investigated in only a small number of studies.
During the analysis of co-authorship patterns in a single journal or conference, many authors adopt and implement methods from Social Network Analysis (SNA), the second stream of the research methodology which is relevant in this case [3].
In an attempt to evaluate the quality of scientific publications, different efforts have been made to measure their influence [4]. We can agree that the benefits of collaboration between researchers are almost universal. Actual samples of behaviour in terms of cooperation can depend on the country of origin, disciplines, research institutions, or journals [5]. Publishing habits have changed dramatically in the past years, both in regard to Food Policy specifically and to all scientific journals in general. With the spread of the Internet and online journals, authors are now able to rapidly acquire access to published research and working papers. But how have these changes influenced the quantity of citations and the types of the cited articles? It is important to answer this question because the number of citations for the articles published in a journal, via statistics such as the impact factor or the Hirsch index, is increasingly being used as a metric of journal quality and stature [6]. In Kőmíves and Dajnoki [7]’s summary of the most important metric elements of the different international and Hungarian higher educational ranking systems, the authors revealed that, for example, the Shanghai Jiao Tong University ranking, which is the best known ranking system of the world, pays much attention to publications and citations in the most important international journals—such as Nature or Science. The relevance of the different factors during the analysis of the position of each university in comparison with other higher educational institutions is still not finalized: as Hazelkorn [8] showed, we can still find debates about the relevance of the number of publications or citations. On the other hand, it is clear to all that the strength or the impact of the research or scientific cooperation cannot only be analyzed on the basis of the number of papers or citations alone—this process is much more complex [9].
More specifically, we investigate the following hypotheses in this paper:
Hypothesis (H1).
Significant changes occurred in the subject matter examined by researchers in the 10-year-period from 2006 to 2015.
Hypothesis (H2).
The majority of articles are written by various research groups rather than one single author.
Hypothesis (H3).
The key members of the network have the best publication performance.
Hypothesis (H4).
The articles by influential authors are cited more due to their centrality ranking.
Following this introduction, the paper is structured as follows. The literature review provides a brief description of the theoretical background of social network analysis in general, and particularly in scientific collaboration. The third section describes materials and methods used for the analysis. In the fourth section, the results are presented with descriptive statistics used to describe the basic features of the data in a study, followed by co-authorship network and co-citation network analysis. In the fifth section we summarize in a discussion and draw the main conclusions.
2. Literature Review
2.1. Collaboration, Competition, or Coopetition?
During the analysis of the international cooperation in the fields of research and publications, scientists face several issues they have to resolve to ensure the success of their collaboration. We investigated the structural pathology of different networks. The importance of international cooperation and networks has significantly increased in the past three decades [10]. The risks of inter-organizational cooperation can cause different pathologies. These pathologies are able to bring benefits for international cooperating partners not only in business cases [11], but also in the case of scientific networks. [12] uses the word “coopetition” to describe the special habit or behavior of different companies: they partly cooperate with each other but on the other hand they are—at the same time—competitors as well. They work together on several issues, but they are all chasing the same customers. We can apply the same concept to international research communities as well—of course these communities are not interested in attracting “customers”, but they have to find those potential partners who are able to fund the research and the operation of higher educational institutions and research institutions. To become reliable partners for international cooperating partners, research groups have to implement and respect international research ethical norms—just as Sroka and Lőrinczy [13] wrote in their article when describing relevant expectations for companies facing business ethical rules and practices. That means the role of the research group leader will become more important—similarly to business life, where the role of the manager is a key component, too. As Sroka and Gajdzik [14] found that the manager is the key to the network’s success, we can define the leader of the research group as a key actor as well.
During the implementation of this aspect of the business world to the academic sector, institutions and researchers face almost the same problems. Cross-border cooperation between different institutions and individual researchers seems to be a good idea—but on the other hand, higher educational institutions and research institutions are rivals when the institution leaders try to attract future students, sponsors, partners, etc. As Hazelkorn [15] noted, the Shanghai Jiao Tong Ranking System is mainly based on the quality of the publications written by the researchers employed by each university. Publishing research of high quality and significant impact is fundamental to progress in the sciences and social sciences. From a career perspective, the perceived research performance of individual researchers can be crucial for hiring, tenure, and promotion decisions worldwide [16]. It is one thing to use impact factors to compare journals and quite another to use them to compare authors. Journal impact factors generally involve relatively large populations of articles and citations. Indeed, most metrics relating to impact and quality are based on citation data [17]. Of course, the ranking system also pays attention to many other factors (e.g., size, social and other impacts etc.) but the measurement of the publications’ quality is driven in the same way that we used to analyze it during our research: it is mainly based on the Scopus and WoS peer reviewed publications—and on Nature or Science publications. Analyzing the co-authorship patterns can be a useful way to enrich these evaluation methods, which can help to allocate resources to the research community which can use them in the best way [18]. The importance of fundraising can be crucial: some fields of research can get much support from the private sector. As Calero et al. [19] reported in the bio-pharmaceutical sector, the most important multinational companies spend about 15% of their sales on research and development.
Publishing research of high quality and significant impact is fundamental to progress in the sciences and social sciences.
Coopetition can be a good solution for higher educational institutions as well. The theory is mainly relevant for business enterprises, but it can be adapted to the academic sector as well. During the coopetition process, companies try to do the best for themselves. Sometimes they cooperate with each other and sometimes they compete. Sometimes they are able to reach their aims at the expense of the other company and sometimes not. The model is based on game theory—but the aim is not to create a win-lose situation [20].
2.2. Social Network Analysis
Analysis of social networks can be achieved by analyzing the structural characteristics of the network. We can identify the key features of social networks as the users and their connections [21]. These links create the structure of the network. While not without their accompanying problems, as noted by [22], structural and topological attributes have been used in several studies to understand the nuances and the importance of human behavior in social networks [23].
Social Network Analysis (SNA) has developed as a specialty in parallel with scientometrics since the end of the 1970s. In a foundational work. Freeman [24] developed a set of measures of centrality based on betweenness. Freeman stated that “betweenness” as a structural characteristic of communication was described in the literature as the first measure of centrality [25,26]. The SNA point of view on social relationships in terms of network theory can consist of nodes and ties (also called edges, links, or connections). Nodes (or, as they are called in the ferial usage: junctions) are the individual actors creating the networks, and ties are the relationships between them. The resulting graph-based structures are often very complex. We can state that research in several academic fields has shown that social networks operate on different levels and play a crucial role in determining the way problems are solved, organizations are run, and the degree to which individuals succeed in achieving their goals [27]. SNA is a wide strategy during the investigation of social structure [3] and is used to gain patterns of relationships between the nodes mentioned above to ascertain an underlying social structure [28]. SNA integrated the narrative data analysis while it provided a way of examining the relation structure among the people, organisations, and the places they mentioned across each of the interviews. This versatile approach was particularly useful because it provided not only a possibility to analyze the specific links individuals had with one another, with places and with organizations [29], but also because one of the main aims of SNA is to identify the core actors in a network [30] and to find and interpret patterns of social ties among actors [31]. The role of SNA has increased recently because the topic plays an important role in several disciplines [3,32]. Network analysis permits the investigation of the characteristics of management to compare with other fields of knowledge, as well as the existing linkages between the most central and most prominent authors within the examined discipline. Finally, network analysis gives a greater understanding of which authors collaborate, of the social groups that emerge from the collaboration relationships, of the role played by the most important ‘star authors’, and of the impact of their belonging to certain institutions and journals [33].
Using the graph theory [34], SNA is able to make the web of social interactions visible, both on global and individual levels. The former seeks to describe the characteristics of these networks as a whole (e.g., distance, clusters, etc.), while the latter refers to the analysis of the individual actors (e.g., status, position, etc.). The status of every actor can be described by centrality, as evident from the methodological chapter below.
2.3. Co-Author Network
Co-author networks can be defined as a type of social network, and paper citation networks as a type of information science network. These two different types of networks are thoroughly studied, especially in the complex networks field [31,35,36,37]. Co-author and paper citation networks in different disciplines were studied by complex network researchers [38,39,40,41]. Co-authorship networks, as one of the most understandable and well-known forms of collaboration networks [42], are built on the social dimension of the relatedness of different authors [43]. Studies of cooperation networks can cluster forms based on co-authorships, and then identify the ‘‘invisible community’’ within a field [30].
The research and publishing method has changed dramatically over the past decades. 60–70 years ago, the most scientific research was done by individual researchers publishing single-authored articles. Later this changed significantly: while in 1950, only 8% of articles published in the American Economic Review were co-authored, the co-authorship rate increased to 55% by 1993 [44] and to 81% in 2014. This trend was noted in the 1980s as well: as McDowell and Melvin [45] stated, the percentage of co-authored articles in the field of economics increased between 1946 and 1976 from less than 5% to more than 30%. As an outcome of the trend towards co-authorship, academic interest in collaboration has increased among researchers [37,46,47,48,49]. Nowadays, science is more accessible and freer than it has ever been before and—because of globalization—there is a particularly growing interest in scientific collaboration. This collaboration can take various forms (e.g., research projects, publications in peer-reviewed journals or in conference papers). According to [50], collaboration is mostly facilitated by technological advances, geographical proximity, and the similarity of the actual research topics.
We can define the two most important aspects of collaborations that boost research outcomes: first the growing number of publications, and second the number of citations received. Citations of articles published in academic journals are central to the scholarly venture. Citations are considered a mark of the research contribution made by an article—a sign that the new scientific outcome is valuable to other scholars [51]. Based on the research completed by [52], we can declare that the number of references increases with the number of co-authors and this effect can become more efficient if the latter are from different institutions.
While the differences between research fields can mean differences in variables related to citations [53], several common factors come up. These are in line with the conclusions of [54] and include the length of the article [55], the number of co-authors [56,57], whether the publication is a review paper [55,58], the seniority of the authors [53,58], and the affiliation of the authors [55,59].
When a scientist publishes together with their colleagues, they can establish a scientific network. After the analysis of such networks, we can acquire a useful picture of the relationships between individual authors.
Differences between partners (potential co-authors) and their different motivations for undertaking and developing sustainable international and interorganizational cooperation are important issues in terms of the prospects for this cooperation [60]. We agree with the idea that the harmonization of international collaboration is primarily the result of improving its key determinant, which is people and higher educational and research institutions, and it has become clear that all the factors are related to the partnership [61]. Several studies have sought to determine the measurement of collaboration performance [62].
We can state that scientific networks are usually formed around prominent researchers. These well-known scientists mostly work as a hub in attracting a large number of researchers from several different universities and research institutions [50]. According to [47], research collaboration increases research quality and leads to more often cited co-authored papers. Narin et al. [63] found that internationally co-authored papers can result in twice as many citations as single-authored ones. Sooryamoorthy [64] also found a significant positive correlation between the number of co-authors and the number of citations linked to articles published by South African scientists.
Earlier studies have shown that scientific collaboration (especially the trends towards co-authorship) produces a higher research impact than a single researcher in terms of the number of articles [65] and citations [2,64]. This may come from the fact that a single researcher cannot effectively mobilize all the resources needed for conducting research [66].
Co-authorship analysis can be used to ascertain the position of an author in the cooperation network. It might provide important information on the scientists’ own contribution to the research output included in their official scientific biography. In conjunction with the h-core analysis, this helps to clarify details on the extent of the examined scientist’s real contribution to the research output shared by themselves and the achieved citation impact of these publications [67]. The leanness of the connections across the communities denotes the fact that most of the journals which belong to the same community tend to cite the same publications within their community, and rarely reference articles from other communities [68].
Journal rankings might also have an impact on global scientific collaboration because publishing in more prestigious scientific journals in many countries has a higher value in most academic performance indicators. Several authors and research groups have analyzed different discipline-specific journal rankings and quality (see e.g., [69,70]). Funding the different research groups might depend on the prestige of their publications and the number—and quality—of citations they receive.
Over the past few years, an improvement has appeared in bibliometrics, as a result of which citation impact will no longer be restricted to the “times cited” factor, but a more specific analysis will be carried out [71]. For example, during the preparation of different bibliometric analyses the citation context is considered, in order to get deeper and more detailed information on the impact of publications and how the analyzed cited publications are perceived [72]. Authors may cite the work of others (or themselves) for different reasons and these can vary from purely rational to mostly accidental [73]. Citation indexes are widely used in scientometrics during the evaluation of the quality and impact of scientific publications. However, although citation index based metrics remain a fundamental component in the evaluation process on the research performance of every single author or research community, it alone cannot reflect all the variable aspects of scientific communication [74]. Most of the articles we analyzed during our research have dealt with specific distributions of citations. We can define a group of good examples: the sleeping beauties. These are articles which generate little or no citation impact over a longer period (e.g., 10 years), before they start to generate stupendous impact. According to [75], the phenomenon of sleeping beauties is also labeled (from the viewpoint of the authors or co-authors of the article citing the original publication) as resisted or premature discoveries, delayed recognition, or information awakening. Several authors have published articles on sleeping beauties’ studies, e.g., [76,77].
Bibliometrically, the collaboration of authors or author communities is not normally viewed or studied graphically, but rather described as a social phenomenon with different factors, including economic factors and factors from many other fields of research [78], intrascientific factors [25], scientific acknowledgement factors (describing the recognition of a scientific publication) [79], organizational factors [42], geographical factors [80], social stratification factors (describing the different groups of society) [81], sector factors [82], and—one of the most important factors from the viewpoint of the fundraising and sponsorship of research work—academic credit factors. The general trend observed in the most influential scientific journals is an increase in activities driven by collaboration both between researchers and between research institutions and universities, especially with regard to international co-authorship [5] and citation networks.
On the whole, co-authorship and citation networks can be defined as social networks as well, but we should always keep in mind that co-authorship implies a much stronger social bond than citation. A Citation Network (CN) is defined as a type of information network which represents the network of relatedness of subject matter [83]. A CN is a special kind of social network. The first analyses of this phenomenon was completed by [2,78] in his seminal paper titled “Networks of Scientific Papers”. Citation network analysis is a perfect tool for evaluation, but the combination of the knowledge coming from qualitative and quantitative reviews is the most efficient means of evaluating a research field [84]. Archambault, Campbell, Gingras and Larivière [85] have demonstrated a high correlation between the number of articles and the number of citations received by country. Their calculation was based on Scopus and on WoS, and thus drew the conclusion that both databases are suitable tools for analyses in scientometrics. Gavel and Iselid [86] nalyzed the paper coverage overlap between WoS and Scopus, based on 2006 data and showed that, at the time, 54% of active article titles in Scopus were also available in WoS and that 84% of active article titles in WoS were indexed in Scopus as well.
It is unarguable that high quality publications are needed to develop a personal researcher career [33]. When a researcher publishes together with their co-authors, they create a unique and individual co-author network. This co-author network includes all those who have added their own knowledge to the common database significantly and on merit during the preparation of the article. Imaging these personal networks together, we can create a sample on which the connections between the authors and co-authors can be analyzed. Earlier studies have shown that collaboration makes the research achievement of the co-authors better and more effective [2]. Actually, many scientometric studies have evidenced the significance of the different socio-economic variables (e.g., HDI) in scientific production measurement based on the nationality or the country of residence and collaboration patterns [87]. Overall, countries with a high gross domestic product (in US dollars per capita) have invested more in scientific development aimed to promote an increase in publications [88] and to reach this aim.
3. Materials and Methods
The sample that we used for our research was acquired from Scopus, the largest multidisciplinary bibliographical abstract and citation search database [89]. Despite the apparent importance of the topic, there has been little analytical research on co-authorship and co-citation networks in the field of agricultural economics. According to the InCites Journal Citation Reports, there were 17 journals in category of agricultural economics and policy in 2016. In this rank the top six journals are the following:
- Food Policy, IF = 3.086.
- American Journal of Agricultural Economics, IF = 1.829.
- Australian Journal of Agricultural and Resource Economics, IF = 1.826.
- Journal of Agricultural Economics, IF = 1.795.
- Agricultural Economics, IF = 1.758.
- European Review of Agricultural Economics, IF = 1.6.
Food Policy with the highest impact factor was selected for our research because it is a multidisciplinary journal on issues in implementation and evaluation of policies for the food sector in developing, transition, and advanced economies considering papers from any of the social sciences. Furthermore, Food Policy prioritize economic and social aspects of empirical studies on international food policy debates and is the most relevant journal with its highest ranking in the field of agricultural economics.
The basis of our sample is comprised of the 714 papers published between 2006 and 2015. Altogether, these papers originated from 1708 different authors. If redundancies are also taken into consideration, this number is 2119. In our analysis, we also examined the 8749 citations referring to these papers, 6456 of which originated from different papers. Altogether, the examined sample consists of 6838 papers, not considering redundancies.
The database of our sample contains the following tables: affiliation (affiliation_id, name, city, country); articles (article_id, journal_id, volume, issue, first, last, title, source_type); articles_authors (article_id, author_id); authors (author_id, name, surname, givenname, initilas, affiliation_id); cited (article_id, cited_article_id); journals (journal_id, name); keywords (article_id, keyword); subjects (article_id, subject).
Network Analysis
Gephi is an open source network exploration and manipulation software. Developed modules can import, visualize, spatialize, filter, manipulate, and export all types of networks. The visualization module uses a special 3D render engine to render graphs in real-time. This technique uses the computer graphics card, as video games do, and leaves the CPU free for other computing. It can deal with large networks (i.e., over 20,000 nodes) and, because it is built on a multi-task model, it takes advantage of multi-core processors. The user interface is structured into Workspaces, where separate work can be done, and a powerful plugin system is currently being developed. Great attention has been taken to the extendibility of the software. An algorithm, filter, or tool can be easily added to the program, with little programming experience. Sets of nodes or edges can be obtained manually or by using the filter system. Filters can select nodes or edges with thresholds, ranges, and other properties. In practice, filter boxes are chained, each box takes in input, the output of the upper box [90]. Dynamic network visualization offers possibilities to understand structure transition or content propagation [91]. Exploring dynamic networks in an easy and intuitive way has been incorporated into Gephi from the beginning.
We used the Yifan Hu Multilevel layout algorithm which is an algorithm that brings together the good elements of force-directed algorithms and a multilevel algorithm to reduce algorithm complexity. This is one of the algorithms that works really well with large networks [92].
Our network analysis comprises the analysis of the below centrality markers. Our betweenness centrality analysis reveals which participants’ cooperation keeps the relationship going. In other words, we will identify which participants are most able to control the information flowing in the network. In this regard, the key author will be the one that stands in between multiple other authors, as this means they have a high chance of standing on the path between two authors.
Our closeness centrality research aims to identify which authors are able to reach all members of the network—primarily within their own clique—directly, rapidly, and easily, without relying on any third member. Authors can also be ranked based on their degree of centrality. This value reflects how many other authors the given author is linked to, i.e., it shows how many incoming or outgoing links the node (i.e., the author) has. This helps identify which authors have a central role with regards to publications in the subject area of our research [93].
In order to be able to present visual graphs, we transferred the nodes and links into Excel, which was then imported into the program. The records (nodes) were provided by an existing table containing the ID number and full name of the author. We used the ID codes of the articles and the ID number of the author to identify the relationships between the nodes (i.e., the links). If an article was published by multiple authors, then the ID code of the article (along with the ID number of the author) is shown in the table once for each of the authors it was written by. These data provided a table that—based on the ID numbers—made it possible to identify which other authors each author is linked to.
We used IBM SPSS Statistics 22.0 for statistical analysis, and mapping was completed using the online application “MapsData”. Mapsdata is a data visualization platform dedicated to representing geospatial data directly on the map.
4. Results
4.1. Descriptive Statistics
We created a map that shows where the authors published on the chosen topic. For this we generated the geographical coordinates of research locations based on work material containing the location (city and country) of the publications. Latitudinal and longitudinal values were imported into the MapsData website—results are shown in Figure 1.
Figure 1 shows the number of research locations in various regions. Based on these results, we came to the conclusion that in the period analyzed, the majority of publications were issued by authors working in North American and European research institutes. According to several studies, geographic distance and socioeconomic factors have influenced the manner of how collaboration occurs among researchers from different countries. Parreira et al. found that highly collaborative countries are those that belong to similar Trade blocs, have a similar Human Development Index, and have similar scientific characteristics. The same paper concluded that another factor that has influenced the collaboration among ecologists is geographic distance [1]. Geographically closer countries tend to present a higher number of collaborative papers than distant countries. Globalization may contribute to the increase of research collaboration among distant countries. The English language did not show a significant influence on the international collaboration because the majority of published papers in international journals are already in English [94]. The agreements and treaties among these countries facilitate international trade and people mobility between countries leading to expansion of the scientific collaboration [95]. Topics in Food Policy are frequently associated to global issues, thus there is a growing necessity to form researchers with experience in working worldwide.
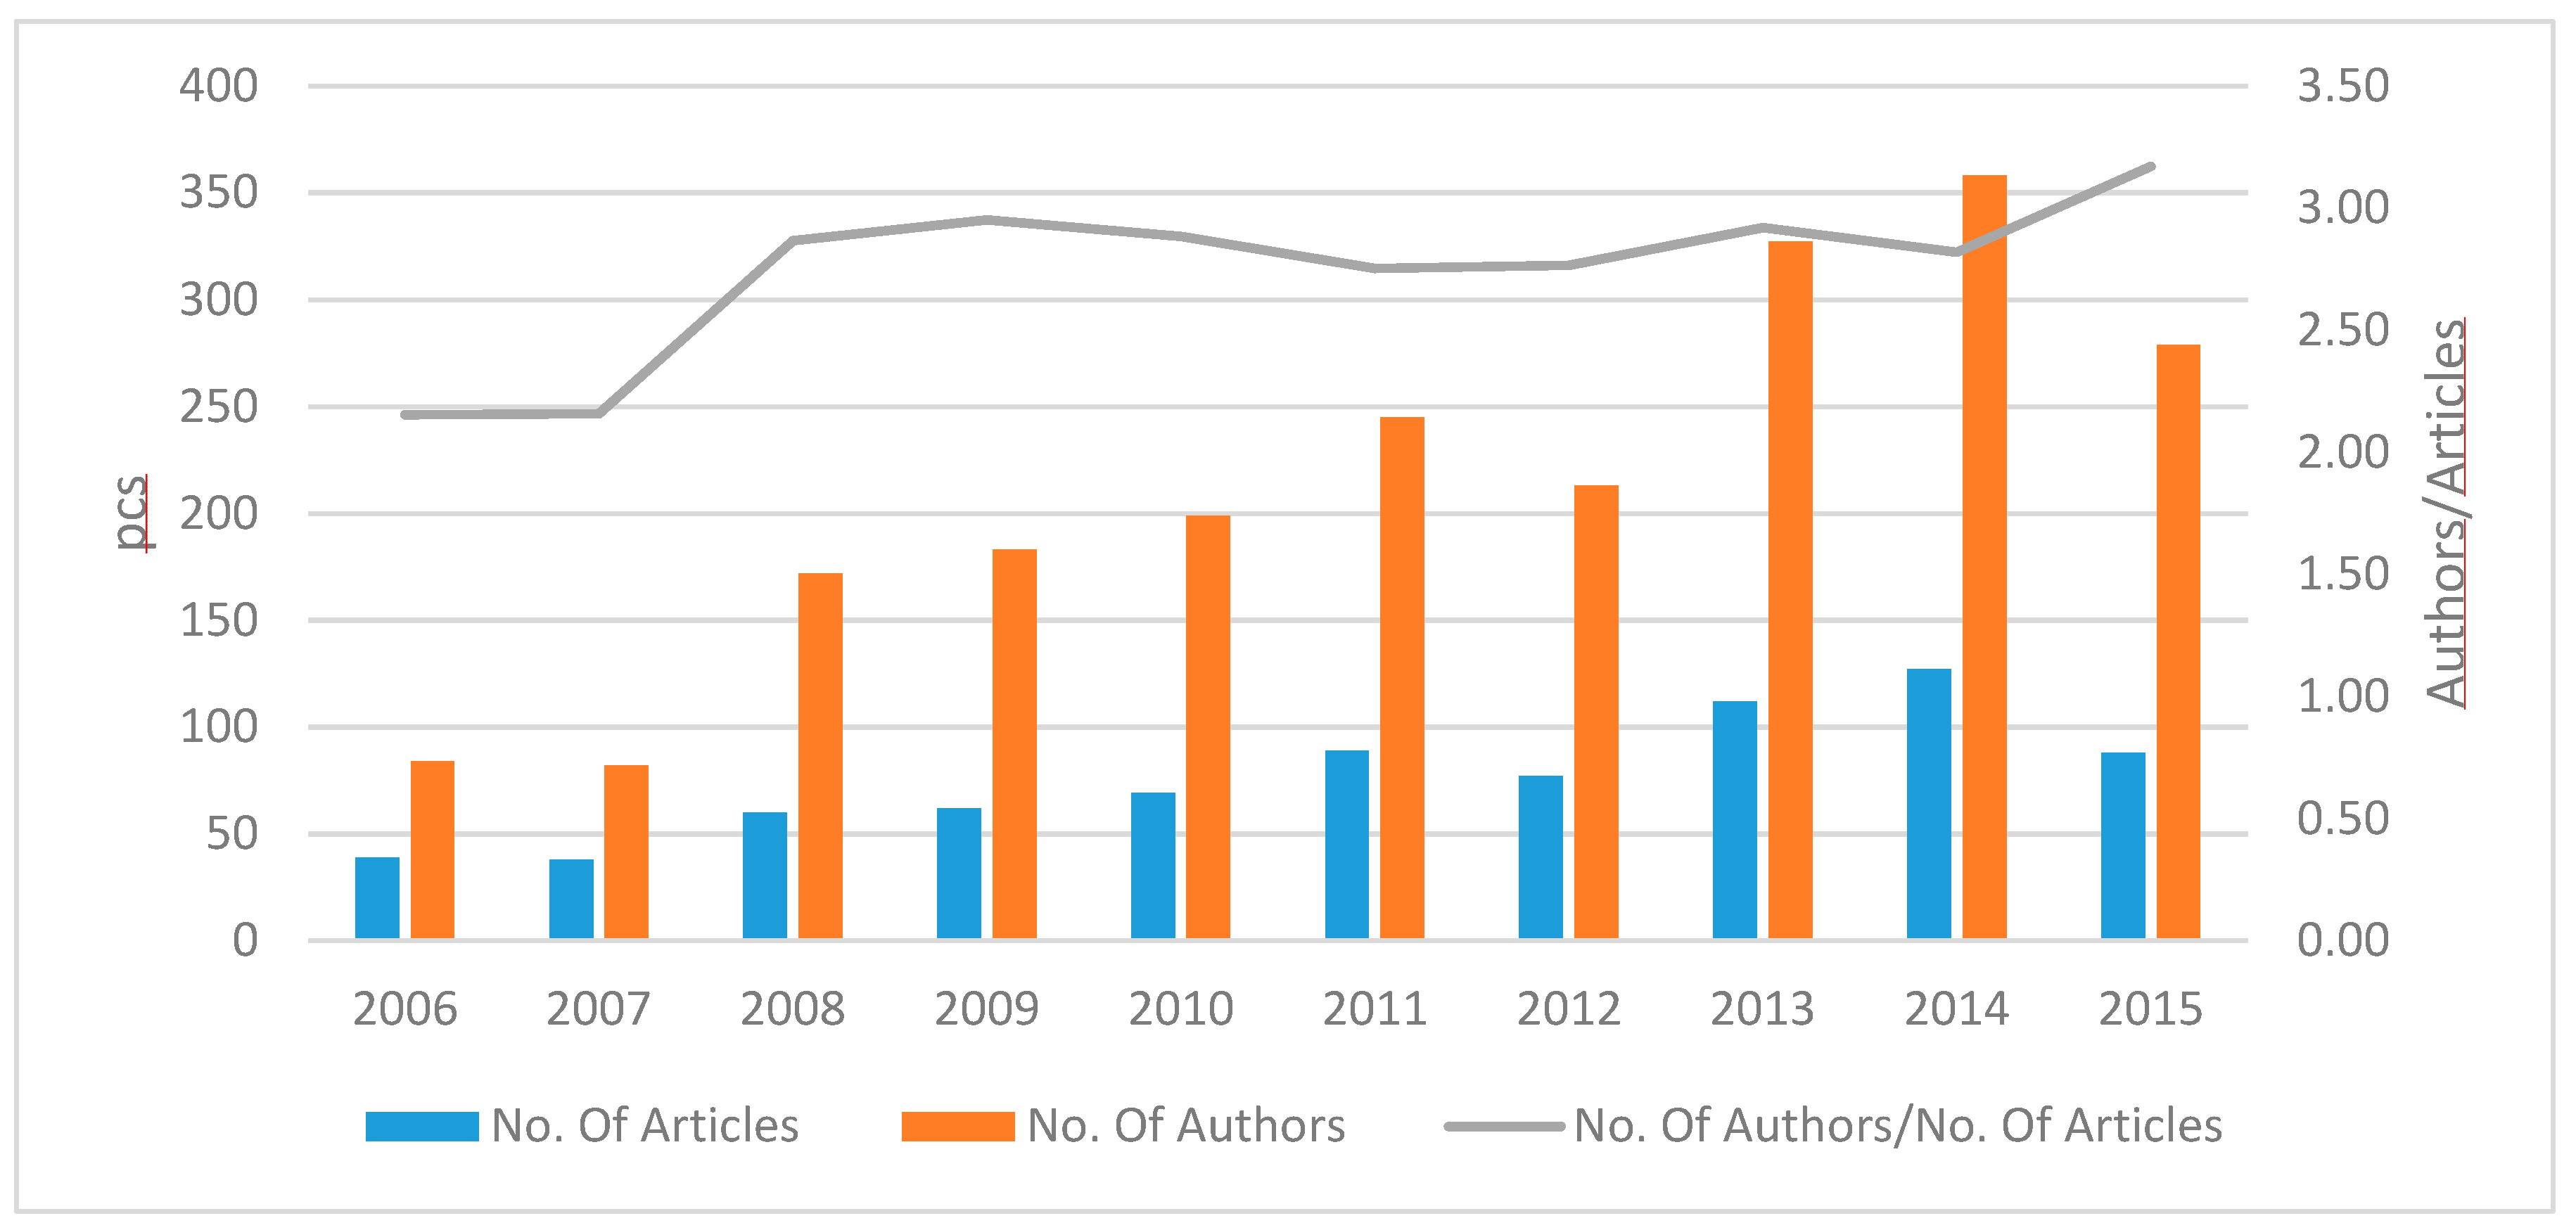
The 714 articles in our sample have been published by 2119 authors, including redundancies, which means an average of 2.97 authors per article. Excluding redundancies, the articles have been published by a total of 1708 authors. Thus, the individual authors contributed to an average of 2.39 publications in the period analyzed. The sample also shows a continuous increase in the number of authors per article, which suggests an increase in the authors’ willingness to cooperate (Figure 2). While the average author/article ratio was 2.15 in 2006, by 2015 an average of over 3 authors were linked to each publication. This statement is in line with international trends. 2008 saw a significant increase to an author/article ratio of 2.87, which more or less stagnated until 2014.
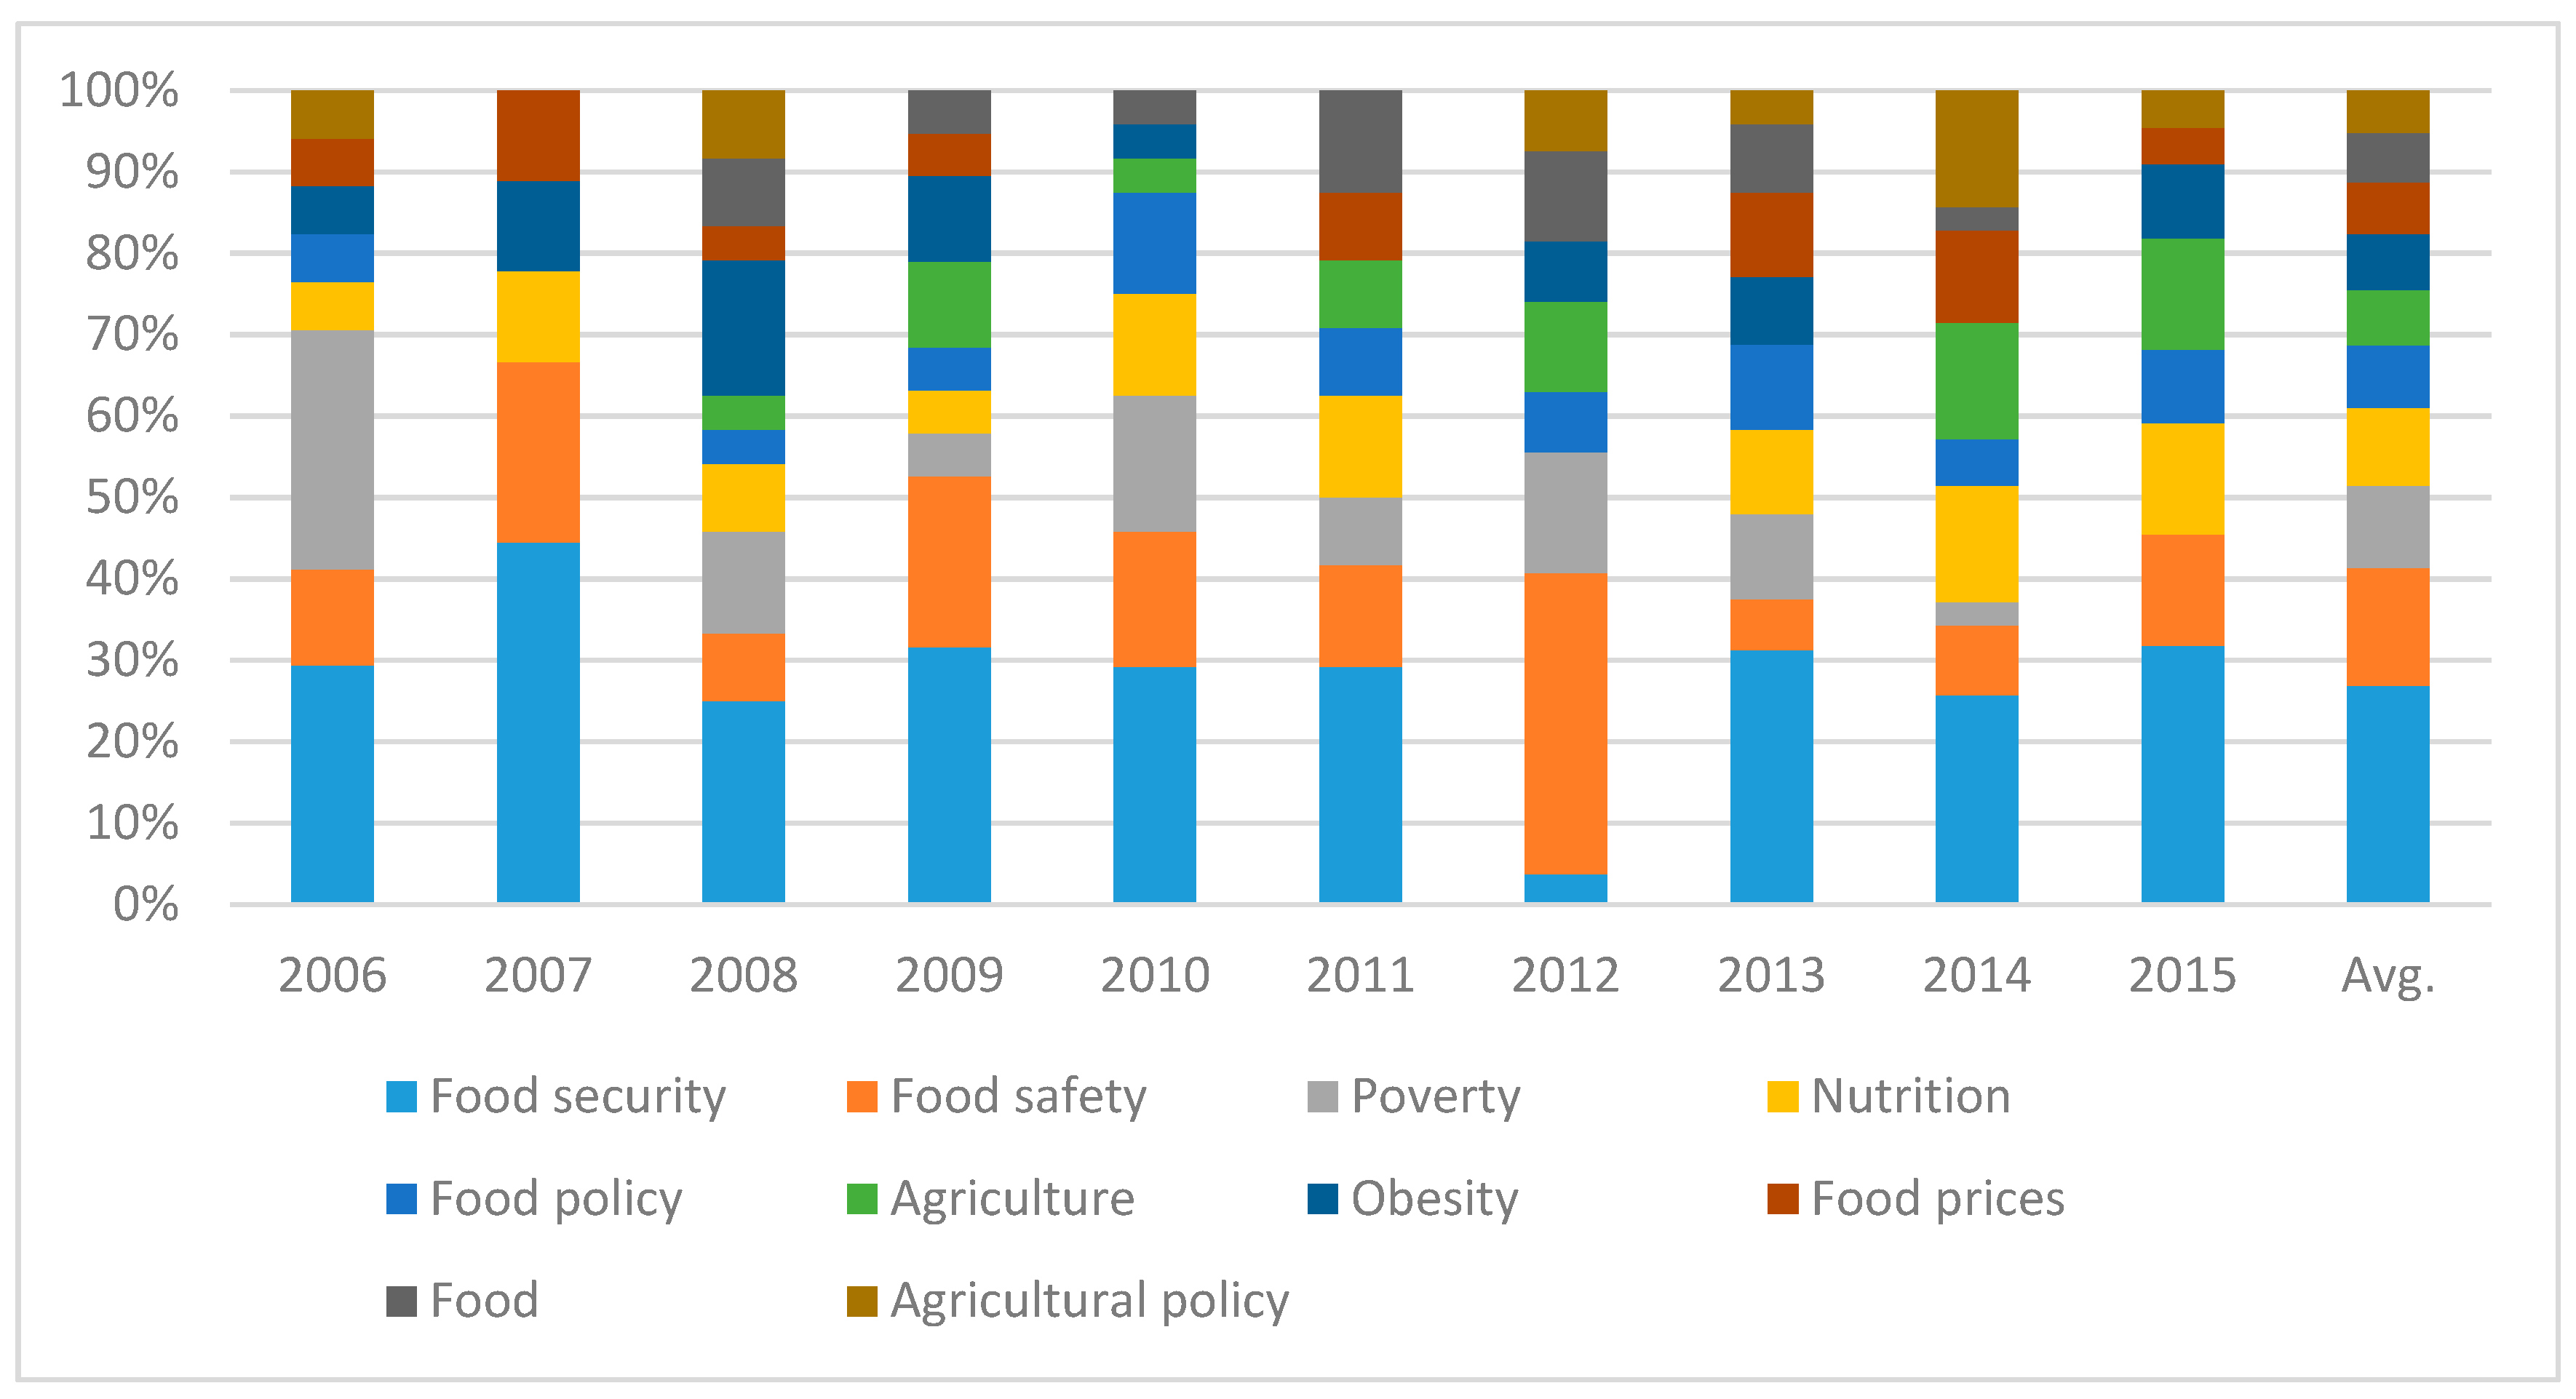
As we stated in H1, significant changes occurred in the subject categories examined by researchers in the period analyzed (Figure 3). Sorting by subject categories is necessarily somewhat arbitrary as we based this allocation on the articles’ title, abstracts, and keywords to generate an initial list of subject categories. The final list of 10 subject categories was refined in the course of a second pass. This process, the resulting categories, and their headings are subjective. Furthermore, the boundaries between subject categories are not always sharp. Articles dealing with agricultural policy, for example, often deal, to some extent, with farm size and restructuring issues or finance. Despite these caveats, the categorization presented here summarizes the main areas of Food Policy and their relative weights in the journal.
With regard to the entire period, the keyword was food security with 67 articles, which represented 26.91% of the 10 most significant keywords. Food security was followed by food safety (36, 14.46%), poverty (25, 10.04%), nutrition (24, 9.64%), food policy (19, 7.63%), agriculture (17, 6.83%), obesity (17, 6.83%), food prices (16, 6.43%), food (15, 6.02%), and agricultural policy (13, 5.22%). These 10 keywords made up 34.9% of the total sample; in other words, these were the issues of most interest to the agricultural economists around the world during the examined 10-year-period. It is worth mentioning the change in the significance of the above keywords over time. As shown in Figure 3, food security and food safety subject categories were of more importance in 2007, whilst subject category poverty completely disappeared. One reason for this may have been the fact that this subject category poverty was not in the focus of research in the year before the financial and economic crisis. Looking at later periods with decreasing food prices, this subject category disappeared again by 2015.
4.2. Co-Authorship Network
Before analyzing the links between authors, it is worth looking at the authors with the highest number of publications in the examined area, thus indicating the role of the network leaders (Table 1). In the examined period, the most articles (12) were published by Thomas Jayne, Professor of Agricultural Economics, researcher at Michigan State University, followed by Chinese researcher Jikun Huang (9), American researcher Scott Rozelle (8), and German researcher Matim Quaim (8). It can be noted that the 10 leading authors published 73 out of the total 714 articles (including co-authored publications), which means a proportion of over 10%. This might be an indication that the majority of articles is written by a close circle of authors. Table 1 also shows that the authors with the most publications may not necessarily be the most important ones from a network perspective. As indicated by the above degree values, Jikun Huang, Scott Rozelle, and Wim Verbeke published the most co-authored articles. It is also evident that Jikun Huang’s ranking is 40% higher than that of Thomas Jayne, who published the most articles, although the latter published 33% (3) more articles than the former. Similarly, although Wim Verbeke is ranked high, the number of his articles is relatively low, which suggests that he wrote relatively few articles but with many co-authors.
As per Table 1, Wim Verbeke ranks first in terms of betweenness, which suggests his outstanding “intermediary” role. Based on the definition in the Methodology section above, this means that Wim Verbeke is the easiest to reach in the network. George Chryssochoidis and Rodolfo Nayga’s intermediary role is also worth mentioning, which suggests the high number of co-authors working with them. All in all, these results show that there is no correlation between the number of authors and their role in the network. Some authors seem to publish many articles with few co-authors, whilst others have an extended network of co-authors but relatively few publications. The same conclusions can be drawn from the graphic representation below of the co-authorship network (Figure 4 and Figure 5). There were no differences in the ten highest closeness centrality values, so these are not presented in Table 1. The value of the closeness centrality is 1 for many of the authors in the network because they are in the center places of certain subnetworks with the same distance as the other authors.
Figure 4 shows the central role of a number of authors as well as the existence of multiple larger cliques within the network. It must be stated that most groups have no relationship, or only very loose relationships with the largest cliques, which might be due to the fact that 84.7% of the authors only published one article in the examined period. Figure 5 shows the network of the largest clique, made up of 48 authors and their co-authors. The size of the dots representing the members of the network (authors) is in line with the degree ranking of the given member. Thus, the author ranking highest in this sub-network is Wim Verbeke, whom we know to have the highest betweenness value.
Next, our third hypothesis was analyzed by applying multivariate linear regression calculations, where we assumed that the authors with the most publications have a leading role in the network, i.e., there is a correlation between the number of articles and centrality values.
We have used the regression linked to the number of the author’s published articles to identify influencing factors. Table 2 makes it evident that the pagerank value and the betweenness value have a positive effect, whereas degree and closeness have a negative effect on the number of articles. In other words, an author’s central role in the network significantly affects the number of articles they are able to publish. Our results are 1% significant, and our model is in line with all preliminary regression conditions.
Furthermore, scientific cliques have been analyzed, since 82% of the authors in our sample worked in cliques of at least 3 authors. Table 3 lists the members of the three largest cliques, each of which has at least 40 members. It is remarkable that only 139 authors (8% of all authors) were able to get into these cliques, which also means that most researchers in the sample were working in smaller groups that are visibly more peripheral in Figure 4.
4.3. Co-Citation Network
After analysing the relationships between authors, we also examined the network of citations, as we assumed that references to the individual authors and publications are an acknowledgement of the authors’ performance. The 714 articles in our sample were referenced in a total of 8856 articles, which means an average of 12 citations per article. Of all citations, 622 “refer back” to the sample articles, which means a 7% citation ratio within the journal.
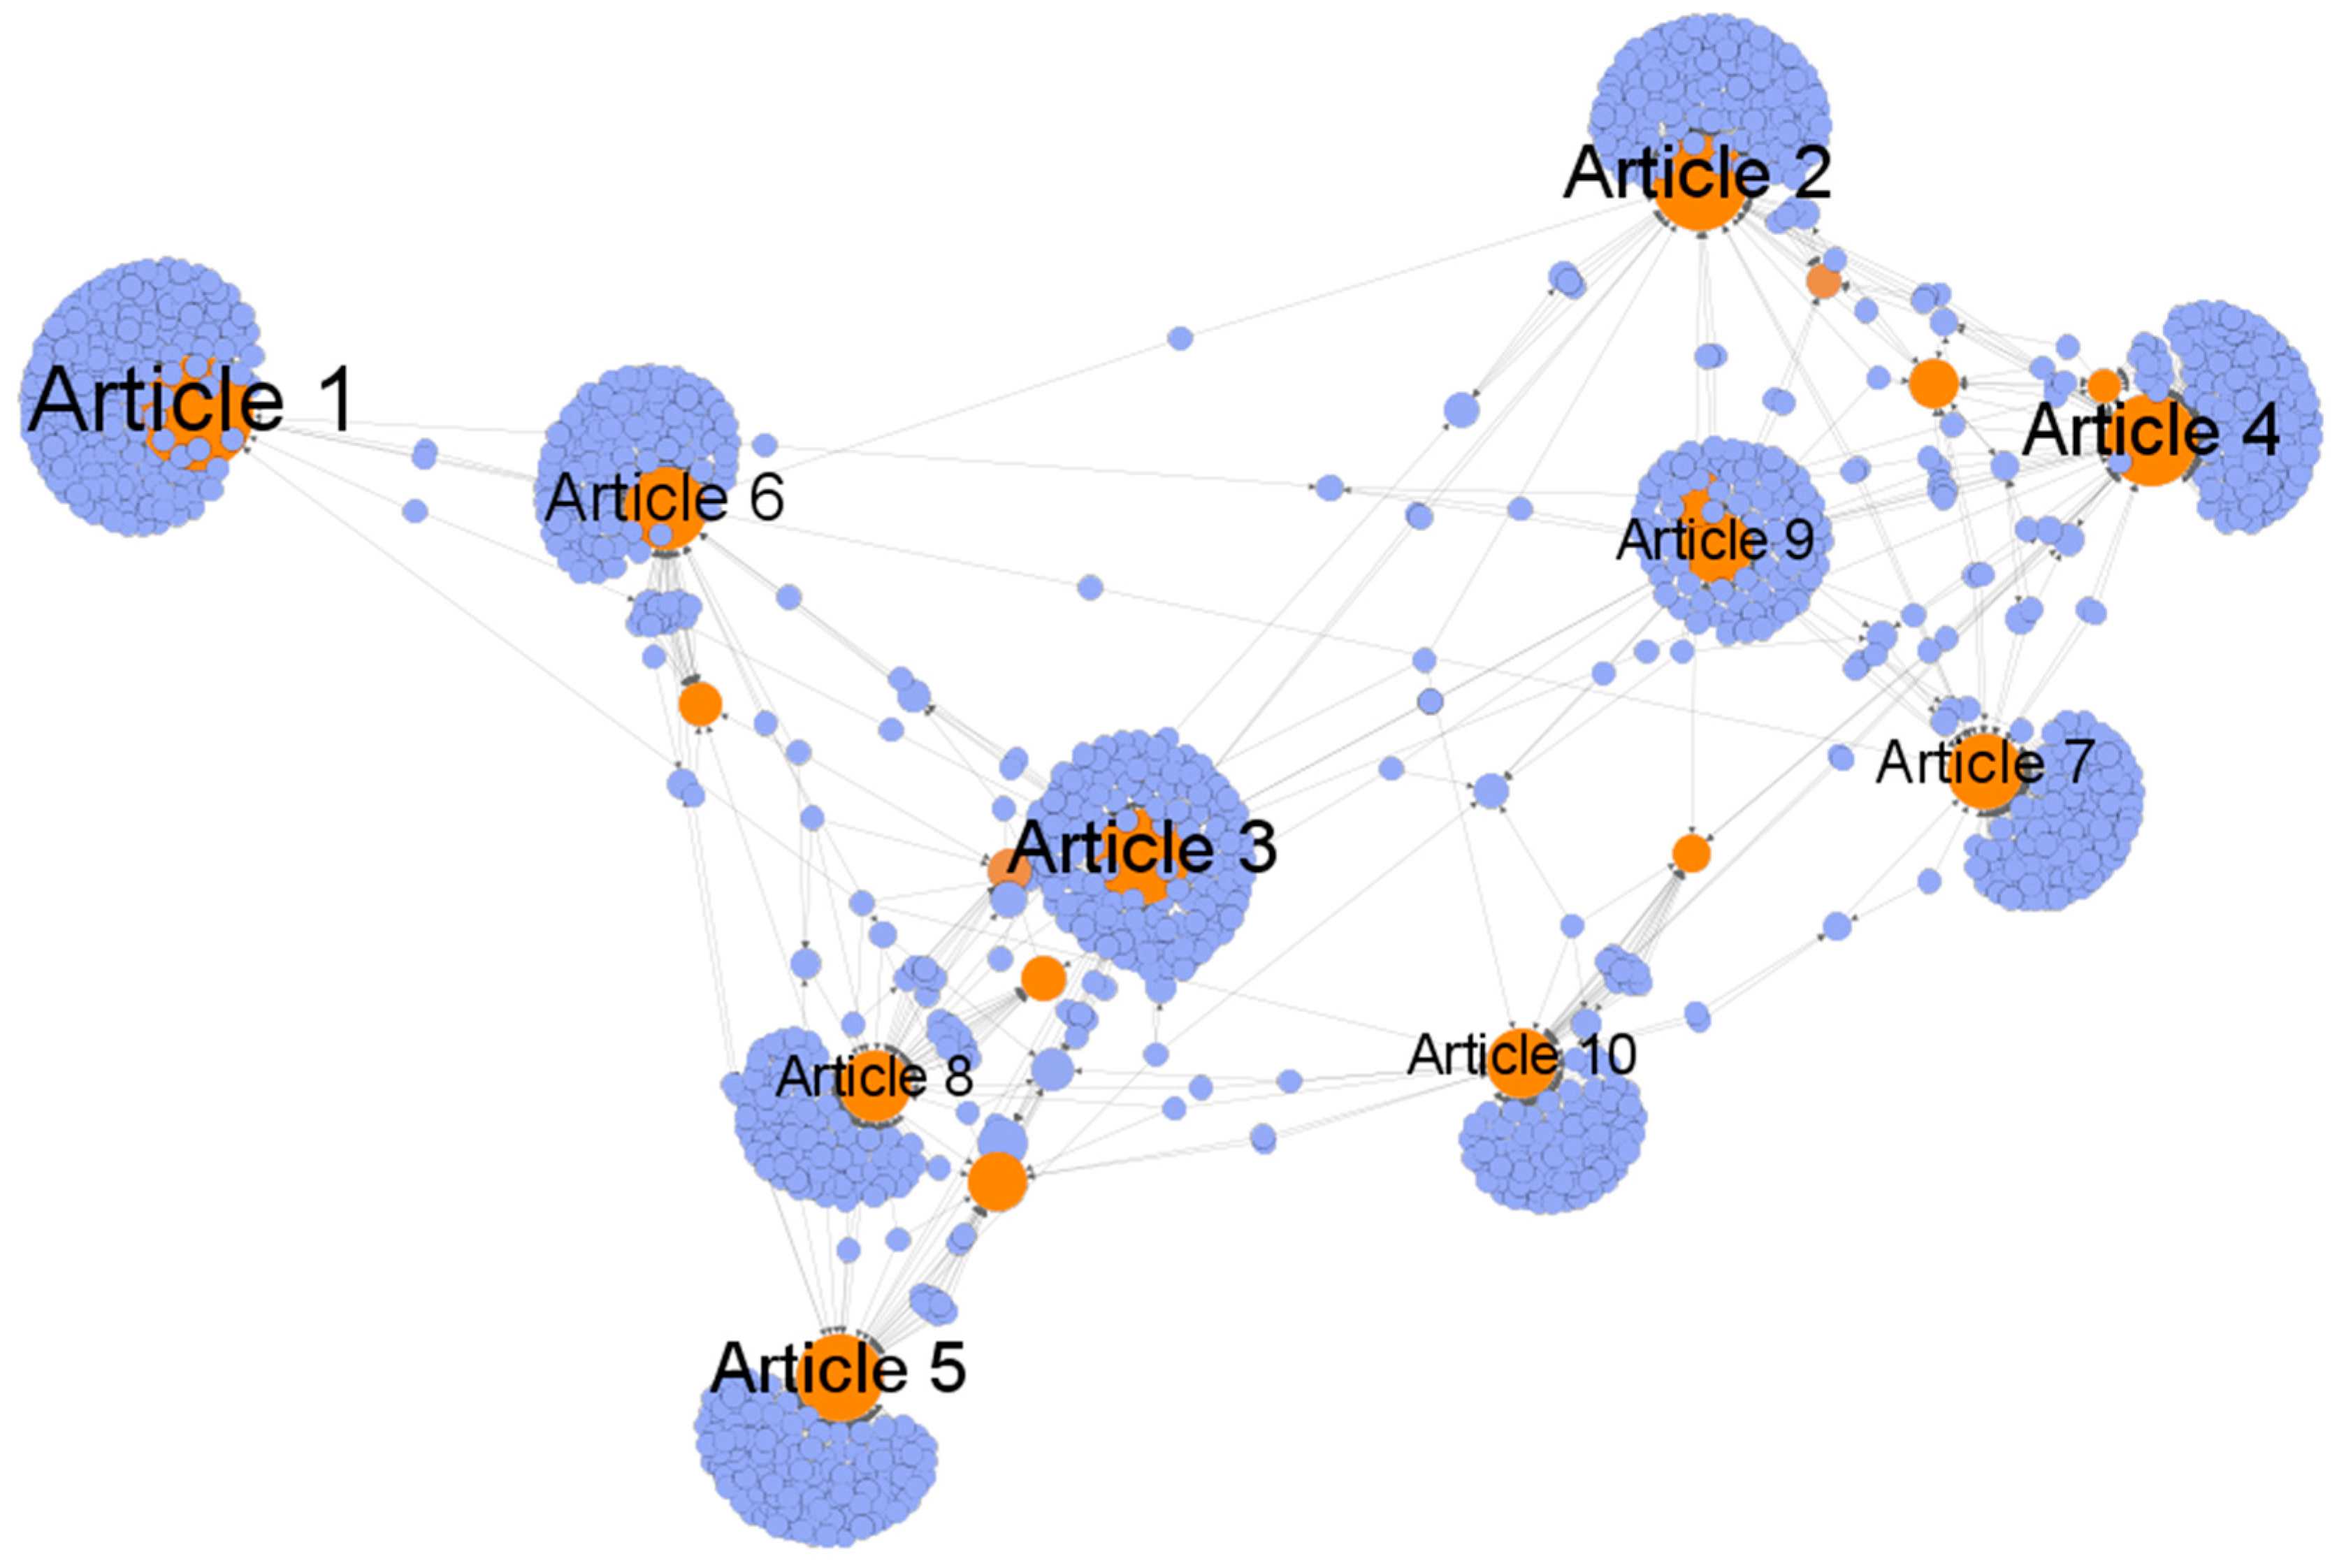
Table 4 suggests that the most cited article is not necessarily the most important one from a network perspective, i.e., it does not necessarily rank higher in terms of pagerank—it is also important who the article was cited by. A good example of this is article number 9 in Figure 6. In terms of citation, the article only ranks ninth; however, it comes third with regards to pagerank. Comparing the results in Table 3 and Table 4, it seems that the 10 most cited articles were not written by authors of the three most significant cliques. Of all these articles, only article No. 4 was written by members of one of the 3 most significant cliques (Maria Loireiro és Wendy Umberger in clique No 1).
Figure 6 shows the citation network of the 10 most cited articles from Table 4. Looking at this network article by article shows that each of the most cited articles were written by authors of one of the scientific cliques, which confirms the outstanding importance of cliques.
Finally, we have determined the influencing factors using the regression of the number of citations. Table 5 clearly shows that pagerank and betweenness values affect the number of citations positively, whereas closeness has a negative effect. In other words, an author’s central role in the network has a significant impact on the number of times they get cited. The results in Table 5 also show that researchers playing an intermediary role (based on high betweenness values) get more citations than their peers who are ranked higher based on other values of the network. Our results are 1% significant and our model is in line with all preliminary regression conditions.
5. Discussion and Conclusions
The main objective of this research is to interpret the social network of collaborations and network of citations in the field of agricultural economics. We have analyzed the scientific collaboration network of scientists who conduct research in the Food Policy journal. We have also explored the flow and connectivity in the paper citation network that forms an unweighted directed graph. The data to create the networks are extracted from the scientific literature database ‘‘Scopus’’. The data covers the papers published in years 2006 through 2015. The results are presented for the average number of papers published by scientists, average number of citations received by scientists, mean number of co-authored papers, distribution of numbers of collaborators of authors, distribution of number of papers cited, and distribution of number of papers citing a given paper. Finally, the network characteristics indicate that most of the research analyzed is performed by a small number of large communities and a large number of small communities.
The proposed four hypotheses are mostly supported with high statistical significance. We found that significant changes occurred in the subject categories examined by researchers in the period analyzed as stated in H1. For example, subject categories “food security” and “food safety subject categories composed far a largest group of articles in 2007, whilst subject category “poverty” became considerably smaller. One reason for this may have been the fact that subject category “poverty” was not in the focus of research in the year before the financial and economic crisis. Looking at later periods with decreasing food prices, this subject category disappeared again by 2015.
Based on our results, a large proportion of articles are written by a close group of authors as declared in H2. This conclusion is in line with international literature [33,50], i.e., it shows the importance of cliques and significant authors in a scientific community.
Although co-authorship of published articles is only an indicator of collaboration [47], collaborating scientists have focused on the phenomenon of papers written in co-authorship because publications may play the most important role in scientific development generally, and in the reward structure for academics in particular [96]. Studies investigating co-authorship have taken two different approaches. The first of these approaches is to analyze the reasons why authors collaborate and to analyze the consequences of such decisions [48,91]. The basis of the second approach is the idea that co-authorship is able to create a social network of researchers [36,46]. The results of the analysis show that indicators of centrality play important role in taking advantage of non-redundant resources in a network aimed to increase the level of co-authorship, thereby significantly affecting citations for publications. On the other hand, they found that prolific co-author count, team exploration, and publishing tenure all have indirect effects on the number of citations. Specifically, writing an article in co-authorship with prolific scholars helps scientists develop centralities and generates higher numbers of citations. Researchers with longer publishing tenure (who are used to publishing more) tend to have higher degrees of centrality in the analyzed networks [97].
We also confirmed H3 as we found a positive correlation between the number of publications and betweenness and pagerank values. Finally, the results of H4 show that centrality values clearly affect the number of citations. This is exactly in line with the results of studies by [74,98], which confirmed a positive correlation between centrality values and citation values.
We are aware that our selection method has limitations. First, our sample is only valid for articles published in the selected Food Policy journal. The analysis presented in this paper suffers from limitations that could be dealt with in future work. Our sample of articles covers what has been published in the main international journal of agricultural economics but fails to include articles in another 16 journals in the category of agricultural economics and policy reported by InCites Journal Citation Reports. Furthermore, the list of journals to survey could also be expanded to include non-English language peer-reviewed journals in Europe. The dataset could even go beyond journal articles to capture conference papers and studies produced in an advisory capacity (for the World Bank, the European Commission, FAO etc.). The question arises whether these other types of publication are characterized by the same authors and co-authorship networks as the journal articles.
It can be observed that the journal literature is moving towards more method-driven articles resembling the conference paper literature in terms of collaboration and becomes increasingly distinct from the more issue-driven studies that are produced for international and financial institutions. Citation network analysis of conference papers and advisory studies discussed above can be of interest as well, presumably revealing more links between the relatively disconnected components in the co-authorship network, as authors who do not necessarily collaborate directly nevertheless make use of and cite each others’ work.
Author Contributions
József Popp and Péter Balogh conceived and designed the experiments; Judit Oláh and Mónika Harangi Rákos performed the experiments; Péter Balogh, Péter Lengyel and Mónika Harangi Rákos analyzed the data; Sebastian Kot and Péter Lengyel contributed analysis tools; József Popp, Judit Oláh, Sebastian Kot, Péter Lengyel, Péter Balogh, Mónika Harangi Rákos wrote the paper.
Conflicts of Interest
The authors declare no conflict of interest.
References
- Parreira, M.R.; Machado, K.B.; Logares, R.; Diniz-Filho, J.A.F.; Nabout, J.C. The roles of geographic distance and socioeconomic factors on international collaboration among ecologists. Scientometrics 2017, 113, 1539–1550. [Google Scholar] [CrossRef]
- Gazni, A.; Didegah, F. Investigating different types of research collaboration and citation impact: A case study of Harvard University’s publications. Scientometrics 2011, 87, 251–265. [Google Scholar] [CrossRef]
- Otte, E.; Rousseau, R. Social network analysis: A powerful strategy, also for the information sciences. J. Inf. Sci. 2002, 28, 441–453. [Google Scholar] [CrossRef]
- Palacios-Huerta, I.; Volij, O. The measurement of intellectual influence. Econometrica 2004, 72, 963–977. [Google Scholar] [CrossRef]
- Bukowska, G.; Fałkowski, J.; Łopaciuk-Gonczaryk, B. Teaming Up or Writing Alone-Authorship Strategies in Leading Polish Economic Journals. Working Papers No. 29/2014 (146); University of Warsaw, Faculty of Economic Sciences: Warsaw, Poland, 2014; pp. 1–26. [Google Scholar]
- Hilmer, C.E.; Lusk, J.L. Determinants of citations to the agricultural and applied economics association journals. Rev. Agric. Econ. 2009, 31, 677–694. [Google Scholar] [CrossRef]
- Kőmíves, P.M.; Dajnoki, K. Ranking systems as the connection between the higher education and the labour market in Hungary. Procedia Econ. Financ. 2015, 32, 292–297. [Google Scholar] [CrossRef]
- Hazelkorn, E. The impact of league tables and ranking systems on higher education decision making. High. Educ. Manag. Policy 2007, 19, 1–24. [Google Scholar] [CrossRef]
- Börner, K.; Dall’Asta, L.; Ke, W.; Vespignani, A. Studying the emerging global brain: Analyzing and visualizing the impact of co-authorship teams. Complexity 2005, 10, 57–67. [Google Scholar] [CrossRef]
- Cygler, J.; Sroka, W. Structural pathologies in inter-organizational networks and their consequences. Procedia-Soc. Behav. Sci. 2014, 110, 52–63. [Google Scholar] [CrossRef]
- Cygler, J. Structural pathology in inter-organizational networks and the decision-making autonomy of its members. In Management of Network Organizations; Sroka, W., Hittmár, Š., Eds.; Springer International Publishing: Cham, Switzerland, 2015; pp. 181–195. [Google Scholar]
- Sroka, W. Coopetition in the steel industry-analysis of coopetition relations in the value net. Metalurgija 2013, 52, 127–130. [Google Scholar]
- Sroka, W.; Lőrinczy, M. The perception of ethics in business: Analysis of research results. Procedia Econ. Financ. 2015, 34, 156–163. [Google Scholar] [CrossRef]
- Sroka, W.; Gajdzik, B. Managerial challenges for networks and beyond. In Management of Network Organizations; Sroka, W., Hittmár, Š., Eds.; Springer International Publishing: Cham, Switzerland, 2015; pp. 121–134. [Google Scholar]
- Hazelkorn, E. Impact of Global Rankings on Higher Education Research and the Production of Knowledge. Occasional Paper No. 18; United Nations Educational, Scientific and Cultural Organization: Paris, France, 2009. [Google Scholar]
- Chang, C.-L.; McAleer, M. How should journal quality be ranked? An application to agricultural, energy, environmental and resource economics. J. Rev. Glob. Econ. 2014, 3, 33–47. [Google Scholar] [CrossRef]
- Chang, C.-L.; McAleer, M. Bibliometric rankings of journals based on the Thomson Reuters citations database. J. Rev. Glob. Econ. 2015, 4, 120–125. [Google Scholar] [CrossRef]
- Morel, C.M.; Serruya, S.J.; Penna, G.O.; Guimarães, R. Co-authorship network analysis: A powerful tool for strategic planning of research, development and capacity building programs on neglected diseases. PLoS Negl. Trop. Dis. 2009, 3, e501. [Google Scholar] [CrossRef] [PubMed]
- Calero, C.; van Leeuwen, T.; Tijssen, R. Research cooperation within the bio-pharmaceutical industry: Network analyses of co-publications within and between firms. Scientometrics 2007, 71, 87–99. [Google Scholar] [CrossRef]
- Brandenburger, A.M.; Nalebuff, B.J. Co-Opetition; Crown Business: New York, NY, USA, 2011. [Google Scholar]
- Oinas-Kukkonen, H.; Lyytinen, K.; Yoo, Y. Social networks and information systems: Ongoing and future research streams. J. Assoc. Inf. Syst. 2010, 11, 61–68. [Google Scholar] [CrossRef]
- Batool, K.; Niazi, M.A. Towards a methodology for validation of centrality measures in complex networks. PLoS ONE 2014, 9, e90283. [Google Scholar] [CrossRef] [PubMed]
- Shapiro, C.; Varian, H. A Strategic Guide to the Network Economy; Harvard Business School Press: Boston, MA, USA, 2013. [Google Scholar]
- Freeman, L.C. A set of measures of centrality based on betweenness. Sociometry 1977, 40, 35–41. [Google Scholar] [CrossRef]
- Bavelas, A. A mathematical model for group structures. Hum. Organ. 1948, 7, 16–30. [Google Scholar] [CrossRef]
- Shimbel, A. Structural parameters of communication networks. Bull. Math. Biophys. 1953, 15, 501–507. [Google Scholar] [CrossRef]
- Scott, J. Social Network Analysis; Sage Publications Ltd.: London, UK, 2017; ISBN 152641225X. [Google Scholar]
- Qi, X.; Fuller, E.; Wu, Q.; Wu, Y.; Zhang, C.-Q. Laplacian centrality: A new centrality measure for weighted networks. Inf. Sci. 2012, 194, 240–253. [Google Scholar] [CrossRef]
- McKether, W.L.; Friese, S. Qualitative social network analysis with ATLAS. ti Increasing Power In A Black Community. In Proceedings of the ATLAS.ti User Conference 2015, Berlin, Germany, 29–31 August 2015; Universitätsverlag der TU Berlin: Berlin, Germany, 2016. [Google Scholar]
- Zhao, Y.; Zhao, R. An evolutionary analysis of collaboration networks in scientometrics. Scientometrics 2016, 107, 759–772. [Google Scholar] [CrossRef]
- De Nooy, W.; Mrvar, A.; Batagelj, V.; Granovetter, M. Exploratory Social Network Analysis; Cambridge University Press: Cambridge, UK, 2005. [Google Scholar]
- Butts, C.T. Social network analysis: A methodological introduction. Asian J. Soc. Psychol. 2008, 11, 13–41. [Google Scholar] [CrossRef]
- Acedo, F.J.; Barroso, C.; Casanueva, C.; Galán, J.L. Co-authorship in management and organizational studies: An empirical and network analysis. J. Manag. Stud. 2006, 43, 957–983. [Google Scholar] [CrossRef]
- Wasserman, S.; Faust, K. Social Network Analysis: Methods and Applications; Cambridge University Press: Cambridge, UK, 1994; ISBN 0521387078. [Google Scholar]
- Newman, M.E. Scientific collaboration networks. I. Network construction and fundamental results. Phys. Rev. E 2001, 64, 016131. [Google Scholar] [CrossRef] [PubMed]
- Newman, M.E. Scientific collaboration networks. II. Shortest paths weighted networks and centrality. Phys. Rev. E 2001, 64, 016132. [Google Scholar] [CrossRef] [PubMed]
- Newman, M.E. The structure of scientific collaboration networks. Proc. Natl. Acad. Sci. USA 2001, 98, 404–409. [Google Scholar] [CrossRef] [PubMed]
- Kot, S.; Grabara, J. Publications analysis according to management disciplines based on scopus indexed journals from easter european countries. Pol. J. Manag. Stud. 2017, 16, 147–159. [Google Scholar] [CrossRef]
- Leicht, E.A.; Clarkson, G.; Shedden, K.; Newman, M.E. Large-scale structure of time evolving citation networks. Eur. Phys. J. B 2007, 59, 75–83. [Google Scholar] [CrossRef]
- Newman, M.E.; Girvan, M. Finding and evaluating community structure in networks. Phys. Rev. E 2004, 69, 026113. [Google Scholar] [CrossRef] [PubMed]
- Shi, X.; Tseng, B.L.; Adamic, L.A. Information Diffusion in Computer Science Citation Networks. In Proceedings of the 3rd International AAAI Conference on Weblogs and Social Media, San Jose, CA, USA, 17–20 May 2009. [Google Scholar]
- Glänzel, W.; Schubert, A. Analysing scientific networks through co-authorship. In Handbook of Quantitative Science and Technology Research; Moed, H.F., Glänzel, W., Schmoch, U., Eds.; Springer: Dordrecht, The Netherland, 2004; pp. 257–276. [Google Scholar]
- Koopman, R.; Wang, S.; Scharnhorst, A.; Englebienne, G. Ariadne’s Thread: Interactive Navigation in a World of Networked Information. In Proceedings of the 33rd Annual ACM Conference Extended Abstracts on Human Factors in Computing Systems, Seoul, Korea, 18–23 April 2015; ACM: New York, NY, USA, 2015; pp. 1833–1838. [Google Scholar]
- Hudson, R.A. Sociolinguistics; Cambridge University Press: Cambridge, UK, 1996; ISBN 0521563496. [Google Scholar]
- McDowell, J.M.; Melvin, M. The determinants of co-authorship: An analysis of the economics literature. Rev. Econ. Stat. 1983, 65, 155–160. [Google Scholar] [CrossRef]
- Barabási, A.-L.; Jeong, H.; Néda, Z.; Ravasz, E.; Schubert, A.; Vicsek, T. Evolution of the social network of scientific collaborations. Phys. A Stat. Mech. Appl. 2002, 311, 590–614. [Google Scholar] [CrossRef]
- Katz, J.S.; Martin, B.R. What is research collaboration? Res. Policy 1997, 26, 1–18. [Google Scholar] [CrossRef]
- Laband, D.N.; Tollison, R.D. Intellectual collaboration. J. Polit. Econ. 2000, 108, 632–662. [Google Scholar] [CrossRef]
- Moody, J. The structure of a social science collaboration network: Disciplinary cohesion from 1963 to 1999. Am. Sociol. Rev. 2004, 69, 213–238. [Google Scholar] [CrossRef]
- Cabanac, G.; Hubert, G.; Milard, B. Academic careers in Computer Science: Continuance and transience of lifetime co-authorships. Scientometrics 2015, 102, 135–150. [Google Scholar] [CrossRef] [Green Version]
- Reingewertz, Y.; Lutmar, C. Academic in-group bias: An empirical examination of the link between author and journal affiliation. J. Informetr. 2018, 12, 74–86. [Google Scholar] [CrossRef]
- Persson, O.; Glänzel, W.; Danell, R. Inflationary bibliometric values: The role of scientific collaboration and the need for relative indicators in evaluative studies. Scientometrics 2004, 60, 421–432. [Google Scholar] [CrossRef]
- Slyder, J.B.; Stein, B.R.; Sams, B.S.; Walker, D.M.; Jacob Beale, B.; Feldhaus, J.J.; Copenheaver, C.A. Citation pattern and lifespan: A comparison of discipline institution and individual. Scientometrics 2011, 89, 955–966. [Google Scholar] [CrossRef]
- Tahamtan, I.; Afshar, A.S.; Ahamdzadeh, K. Factors affecting number of citations: A comprehensive review of the literature. Scientometrics 2016, 107, 1195–1225. [Google Scholar] [CrossRef]
- Mingers, J.; Xu, F. The drivers of citations in management science journals. Eur. J. Oper. Res. 2010, 205, 422–430. [Google Scholar] [CrossRef]
- Chung, K.H.; Cox, R.A.; Kim, K.A. On the relation between intellectual collaboration and intellectual output: Evidence from the finance academe. Q. Rev. Econ. Financ. 2009, 49, 893–916. [Google Scholar] [CrossRef]
- Vieira, E.S.; Gomes, J.A. Citations to scientific articles: Its distribution and dependence on the article features. J. Informetr. 2010, 4, 1–13. [Google Scholar] [CrossRef]
- Walters, G.D. Measuring the utility of journals in the crime-psychology field: Beyond the impact factor. J. Assoc. Inf. Sci. Technol. 2006, 57, 1804–1813. [Google Scholar] [CrossRef]
- Leimu, R.; Koricheva, J. What determines the citation frequency of ecological papers? Trends Ecol. Evol. 2005, 20, 28–32. [Google Scholar] [CrossRef] [PubMed]
- Castanho, R.A.; Loures, L.; Cabezas, J.; Fernández-Pozo, L. Cross-Border Cooperation (CBC) in Southern Europe-An Iberian Case Study. The Eurocity Elvas-Badajoz. Sustainability 2017, 9, 360. [Google Scholar] [CrossRef]
- Kurowska-Pysz, J.; Szczepańska-Woszczyna, K. The Analysis of the Determinants of Sustainable Cross-Border Cooperation and Recommendations on Its Harmonization. Sustainability 2017, 9, 2226. [Google Scholar] [CrossRef]
- Yoon, C.; Lee, K.; Yoon, B.; Toulan, O. Typology and Success Factors of Collaboration for Sustainable Growth in the IT Service Industry. Sustainability 2017, 9, 2017. [Google Scholar] [CrossRef]
- Narin, F.; Stevens, K.; Whitlow, E.S. Scientific co-operation in Europe and the citation of multinationally authored papers. Scientometrics 1991, 21, 313–323. [Google Scholar] [CrossRef]
- Sooryamoorthy, R. Do types of collaboration change citation? Collaboration and citation patterns of South African science publications. Scientometrics 2009, 81, 177. [Google Scholar] [CrossRef]
- Lee, S.; Bozeman, B. The impact of research collaboration on scientific productivity. Soc. Stud. Sci. 2005, 35, 673–702. [Google Scholar] [CrossRef]
- Kling, R.; McKim, G. Not just a matter of time: Field differences and the shaping of electronic media in supporting scientific communication. J. Assoc. Inf. Sci. Technol. 2000, 51, 1306–1320. [Google Scholar] [CrossRef]
- Glänzel, W. Analysis of co-authorship patterns at the individual level. Transinformação 2014, 26, 229–238. [Google Scholar] [CrossRef]
- Onel, S.; Zeid, A.; Kamarthi, S. The structure and analysis of nanotechnology co-author and citation networks. Scientometrics 2011, 89, 119–138. [Google Scholar] [CrossRef]
- Axarloglou, K.; Theoharakis, V. Diversity in economics: An analysis of journal quality perceptions. J. Eur. Econ. Assoc. 2003, 1, 1402–1423. [Google Scholar] [CrossRef]
- Barnett, A.H.; Ault, R.W.; Kaserman, D.L. The rising incidence of co-authorship in economics: Further evidence. Rev. Econ. Stat. 1988, 70, 539–543. [Google Scholar] [CrossRef]
- Bornmann, L.; Adam, Y.Y.; Fred, Y.Y. Sequence analysis of annually normalized citation counts: An empirical analysis based on the characteristic scores and scales (CSS) method. Scientometrics 2017, 113, 1665–1680. [Google Scholar] [CrossRef] [PubMed]
- Small, H.; Tseng, H.; Patek, M. Discovering discoveries: Identifying biomedical discoveries using citation contexts. J. Informetr. 2017, 11, 46–62. [Google Scholar] [CrossRef]
- Aksnes, D.W.; Rip, A. Researchers’ perceptions of citations. Res. Policy 2009, 38, 895–905. [Google Scholar] [CrossRef]
- Chen, K.-H.; Tang, M.-C.; Wang, C.-M.; Hsiang, J. Exploring alternative metrics of scholarly performance in the social sciences and humanities in Taiwan. Scientometrics 2015, 102, 97–112. [Google Scholar] [CrossRef]
- Mir, T.A.; Ausloos, M. Benford’s law: A ‘sleeping beauty’sleeping in the dirty pages of logarithmic tables. J. Assoc. Inf. Sci. Technol. 2017. [Google Scholar] [CrossRef]
- Min, C.; Sun, J.; Pei, L.; Ding, Y. Measuring delayed recognition for papers: Uneven weighted summation and total citations. J. Informetr. 2016, 10, 1153–1165. [Google Scholar] [CrossRef]
- Teixeira, A.A.; Vieira, P.C.; Abreu, A.P. Sleeping Beauties and their princes in innovation studies. Scientometrics 2017, 110, 541–580. [Google Scholar] [CrossRef]
- De Solla Price, D.J.; de Solla Price, D.J.; de Solla Price, D.J.; de Solla Price, D.J. Little Science, Big Science... and Beyond; Columbia University Press: New York, NY, USA, 1986. [Google Scholar]
- Cronin, B.; Shaw, D.; La Barre, K. A cast of thousands: Coauthorship and subauthorship collaboration in the 20th century as manifested in the scholarly journal literature of psychology and philosophy. J. Assoc. Inf. Sci. Technol. 2003, 54, 855–871. [Google Scholar] [CrossRef]
- Ding, Y.; Foo, S.; Chowdhury, G. A bibliometric analysis of collaboration in the field of information retrieval. Int. Inf. Lib. Rev. 1998, 30, 367–376. [Google Scholar] [CrossRef]
- Kretschmer, H. Coauthorship networks of invisible colleges and institutionalized communities. Scientometrics 1994, 30, 363–369. [Google Scholar] [CrossRef]
- Leydesdorff, L.; Etzkowitz, H. Emergence of a Triple Helix of university-industry-government relations. Sci. Public Policy 1996, 23, 279–286. [Google Scholar] [CrossRef]
- Newman, M. Networks: An Introduction; Oxford University Press: Oxford, UK, 2010. [Google Scholar]
- Whitley, B.E.; Kite, M.E.; Adams, H.L. Principles of Research in Behavioral Science; Routledge: New York, NY, USA; London, UK, 2013; ISBN 10 0415879280. [Google Scholar]
- Archambault, É.; Campbell, D.; Gingras, Y.; Larivière, V. Comparing bibliometric statistics obtained from the Web of Science and Scopus. J. Assoc. Inf. Sci. Technol. 2009, 60, 1320–1326. [Google Scholar] [CrossRef]
- Gavel, Y.; Iselid, L. Web of Science and Scopus: A journal title overlap study. Online Inf. Rev. 2008, 32, 8–21. [Google Scholar] [CrossRef]
- Livingston, G.; Waring, B.; Pacheco, L.F.; Buchori, D.; Jiang, Y.; Gilbert, L.; Jha, S. Perspectives on the global disparity in ecological science. BioScience 2016, 66, 147–155. [Google Scholar] [CrossRef]
- Pan, R.K.; Kaski, K.; Fortunato, S. World citation and collaboration networks: Uncovering the role of geography in science. Sci. Rep. 2012, 2, 902. [Google Scholar] [CrossRef] [PubMed]
- Erfanmanesh, M. Status and quality of open access journals in Scopus. Collect. Build. 2017, 36, 155–162. [Google Scholar] [CrossRef]
- Bastian, M.; Heymann, S.; Jacomy, M. Gephi: An open source software for exploring and manipulating networks. In Proceedings of the 3rd International AAAI Conference on Weblogs and Social Media, San Jose, CA, USA, 17–20 May 2009; Volume 8, pp. 361–362. [Google Scholar]
- Moody, J.; McFarland, D.; Bender-deMoll, S. Dynamic network visualization. Am. J. Sociol. 2005, 110, 1206–1241. [Google Scholar] [CrossRef]
- Hu, Y. Efficient, High-Quality Force-Directed Graph Drawing. Math. J. 2005, 10, 37–71. Available online: https://pdfs.semanticscholar.org/be33/ebd01f336c04a1db20830576612ab45b1b9b.pdf (accessed on 12 December 2017).
- Freeman, L.C. Centrality in social networks conceptual clarification. Soc. Netw. 1978, 1, 215–239. [Google Scholar] [CrossRef]
- Van Weijen, D. The Language of (Future) Scientific Communication. Res. Trends 2012, 31. Available online: https://www.researchtrends.com/issue-31-november-2012/the-language-of-future-scientific-communication (accessed on 12 December 2017).
- Foxley, A. Regional Trade Blocs: The Way to the Future? Carnegie Endowment for International Peace: Washington, DC, USA, 2010. [Google Scholar]
- Holder, M.E.; Langrehr, F.W.; Schroeder, D.M. Finance journal coauthorship: How do coauthors in very select journals evaluate the experience? Financ. Pract. Educ. 2000, 10, 142–152. [Google Scholar]
- Li, E.Y.; Liao, C.H.; Yen, H.R. Co-authorship networks and research impact: A social capital perspective. Res. Policy 2013, 42, 1515–1530. [Google Scholar] [CrossRef]
- Fischbach, K.; Putzke, J.; Schoder, D. Co-authorship networks in electronic markets research. Electron. Mark. 2011, 21, 19–40. [Google Scholar] [CrossRef]
Figure 1.
Spatial distributions of Research Institutes publishing articles in Food Policy. Source: Authors’ own construction.
Figure 1.
Spatial distributions of Research Institutes publishing articles in Food Policy. Source: Authors’ own construction.
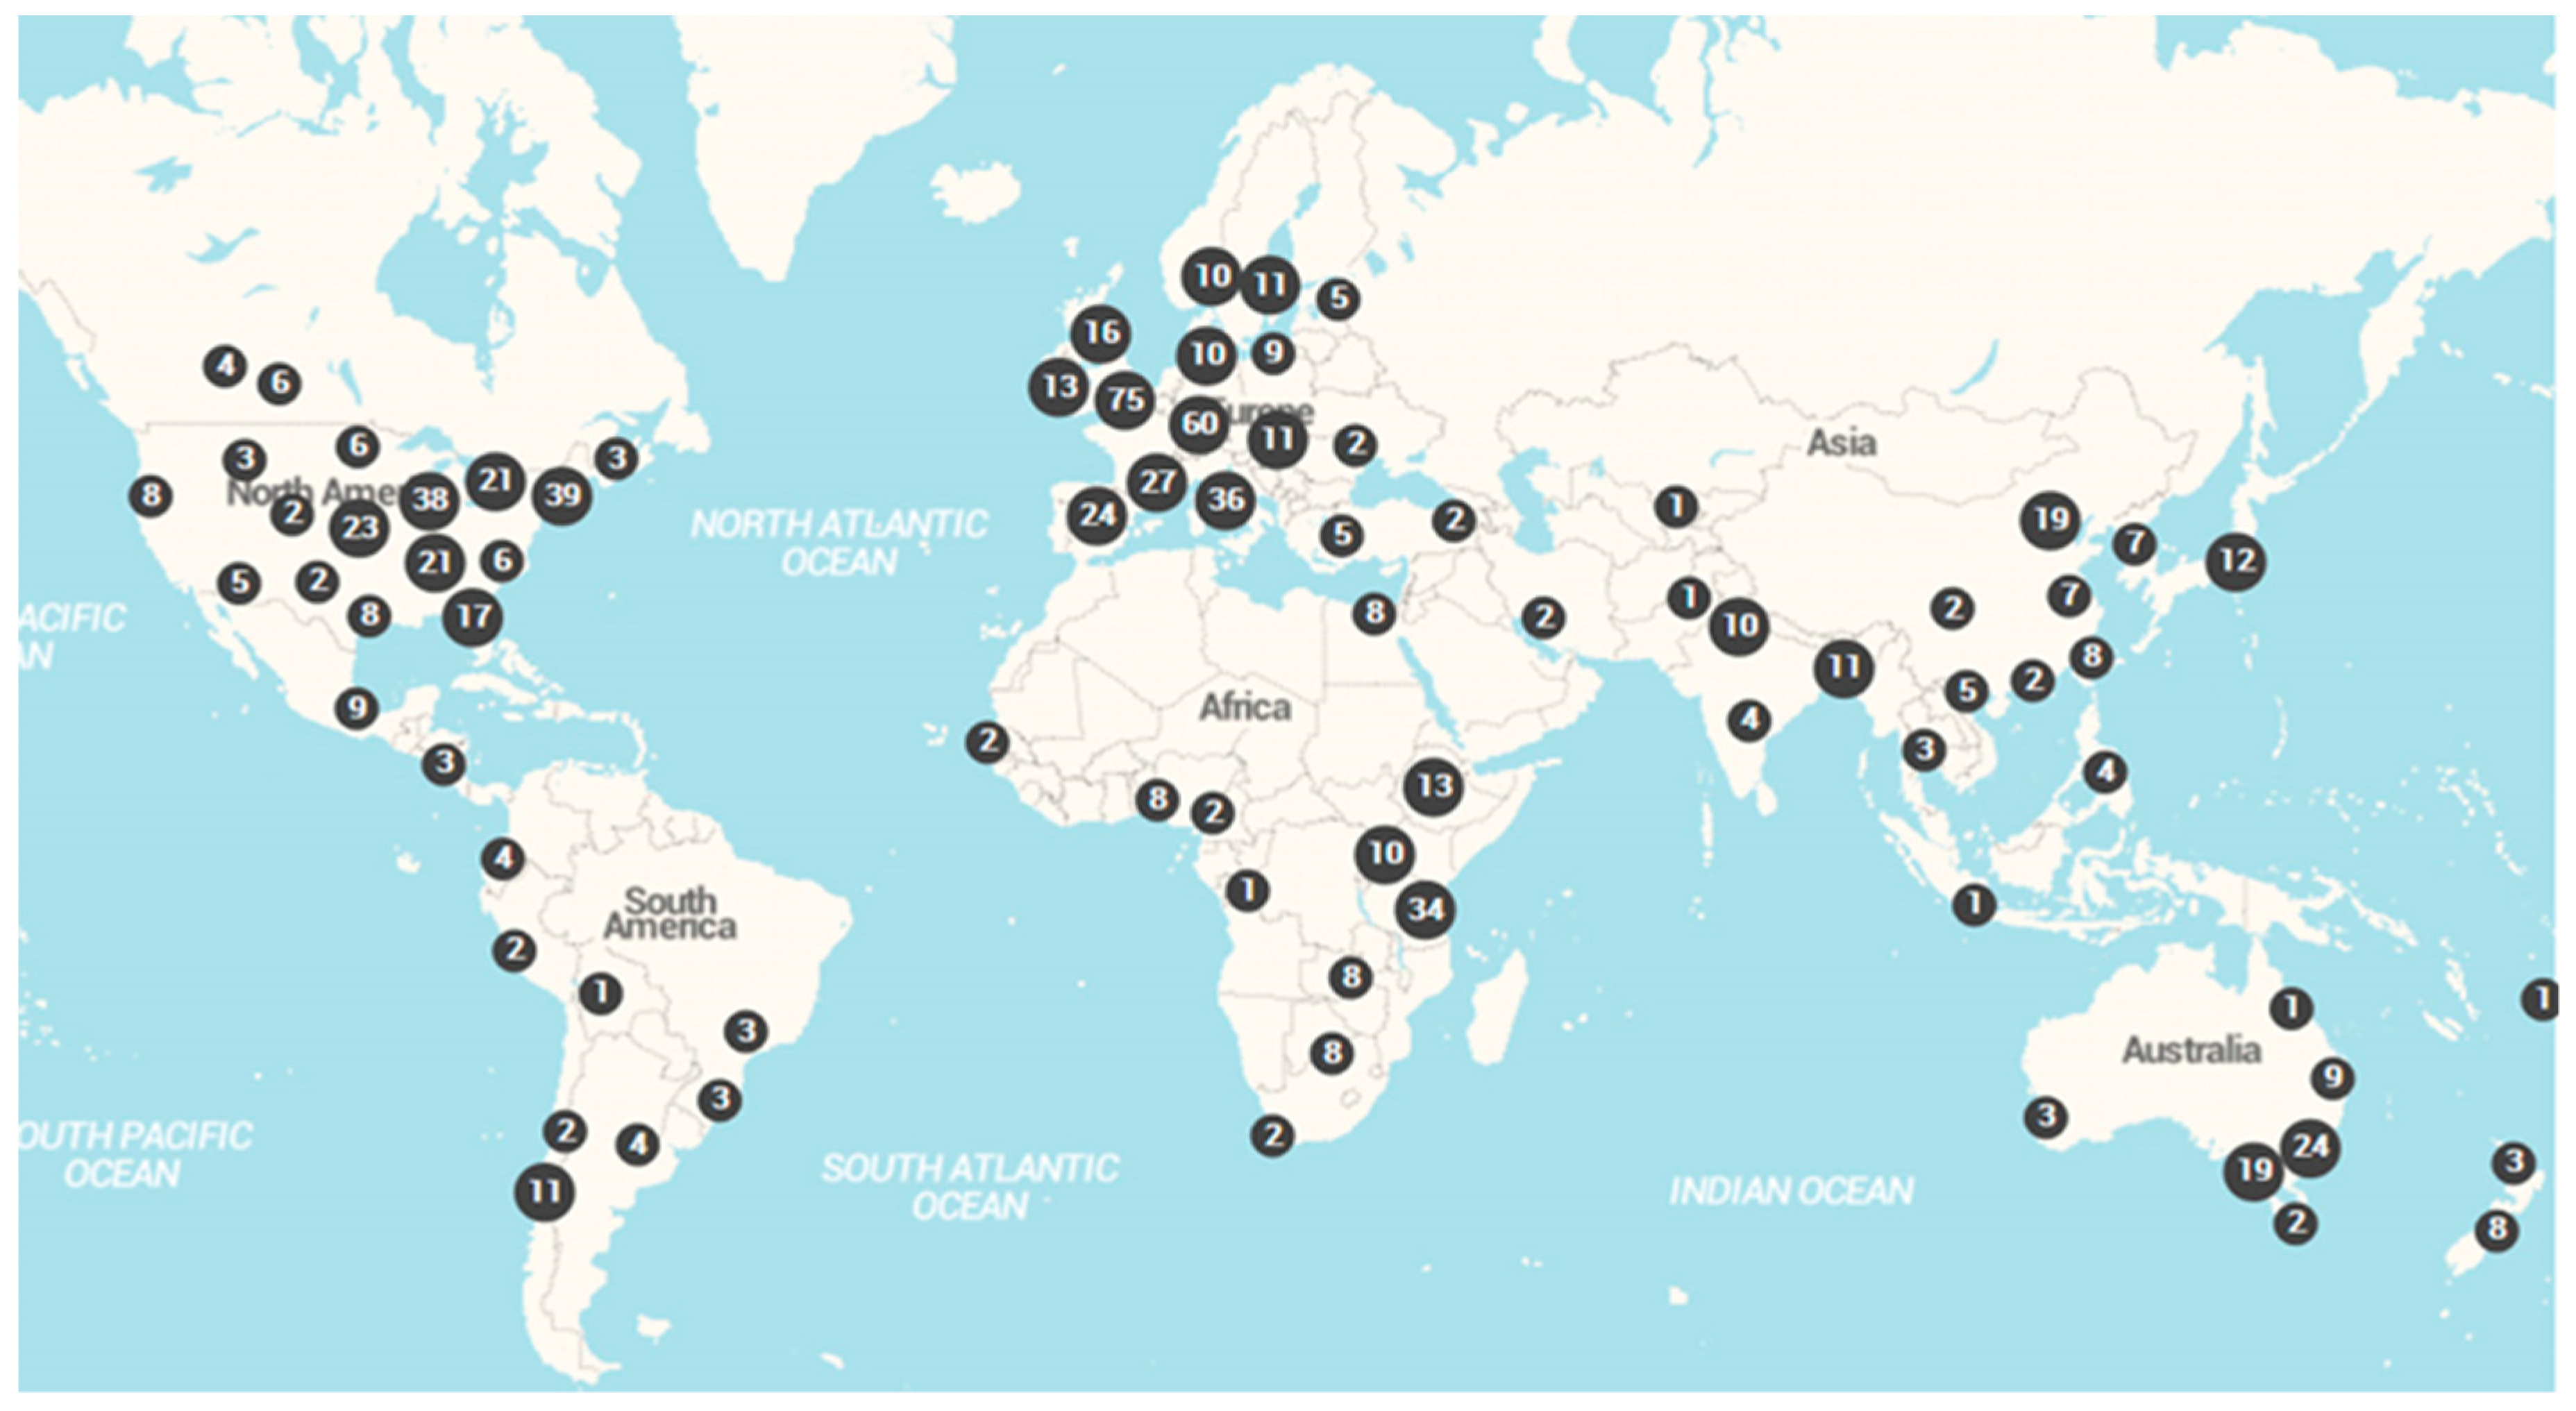
Figure 2.
The number of papers and authors in the examined period. Source: Authors’ own construction.
Figure 2.
The number of papers and authors in the examined period. Source: Authors’ own construction.

Figure 3.
The 10 most frequent keywords in the examined papers by years. Source: Authors’ own construction.
Figure 3.
The 10 most frequent keywords in the examined papers by years. Source: Authors’ own construction.

Figure 4.
The co-authorship network. Source: Authors’ own construction.
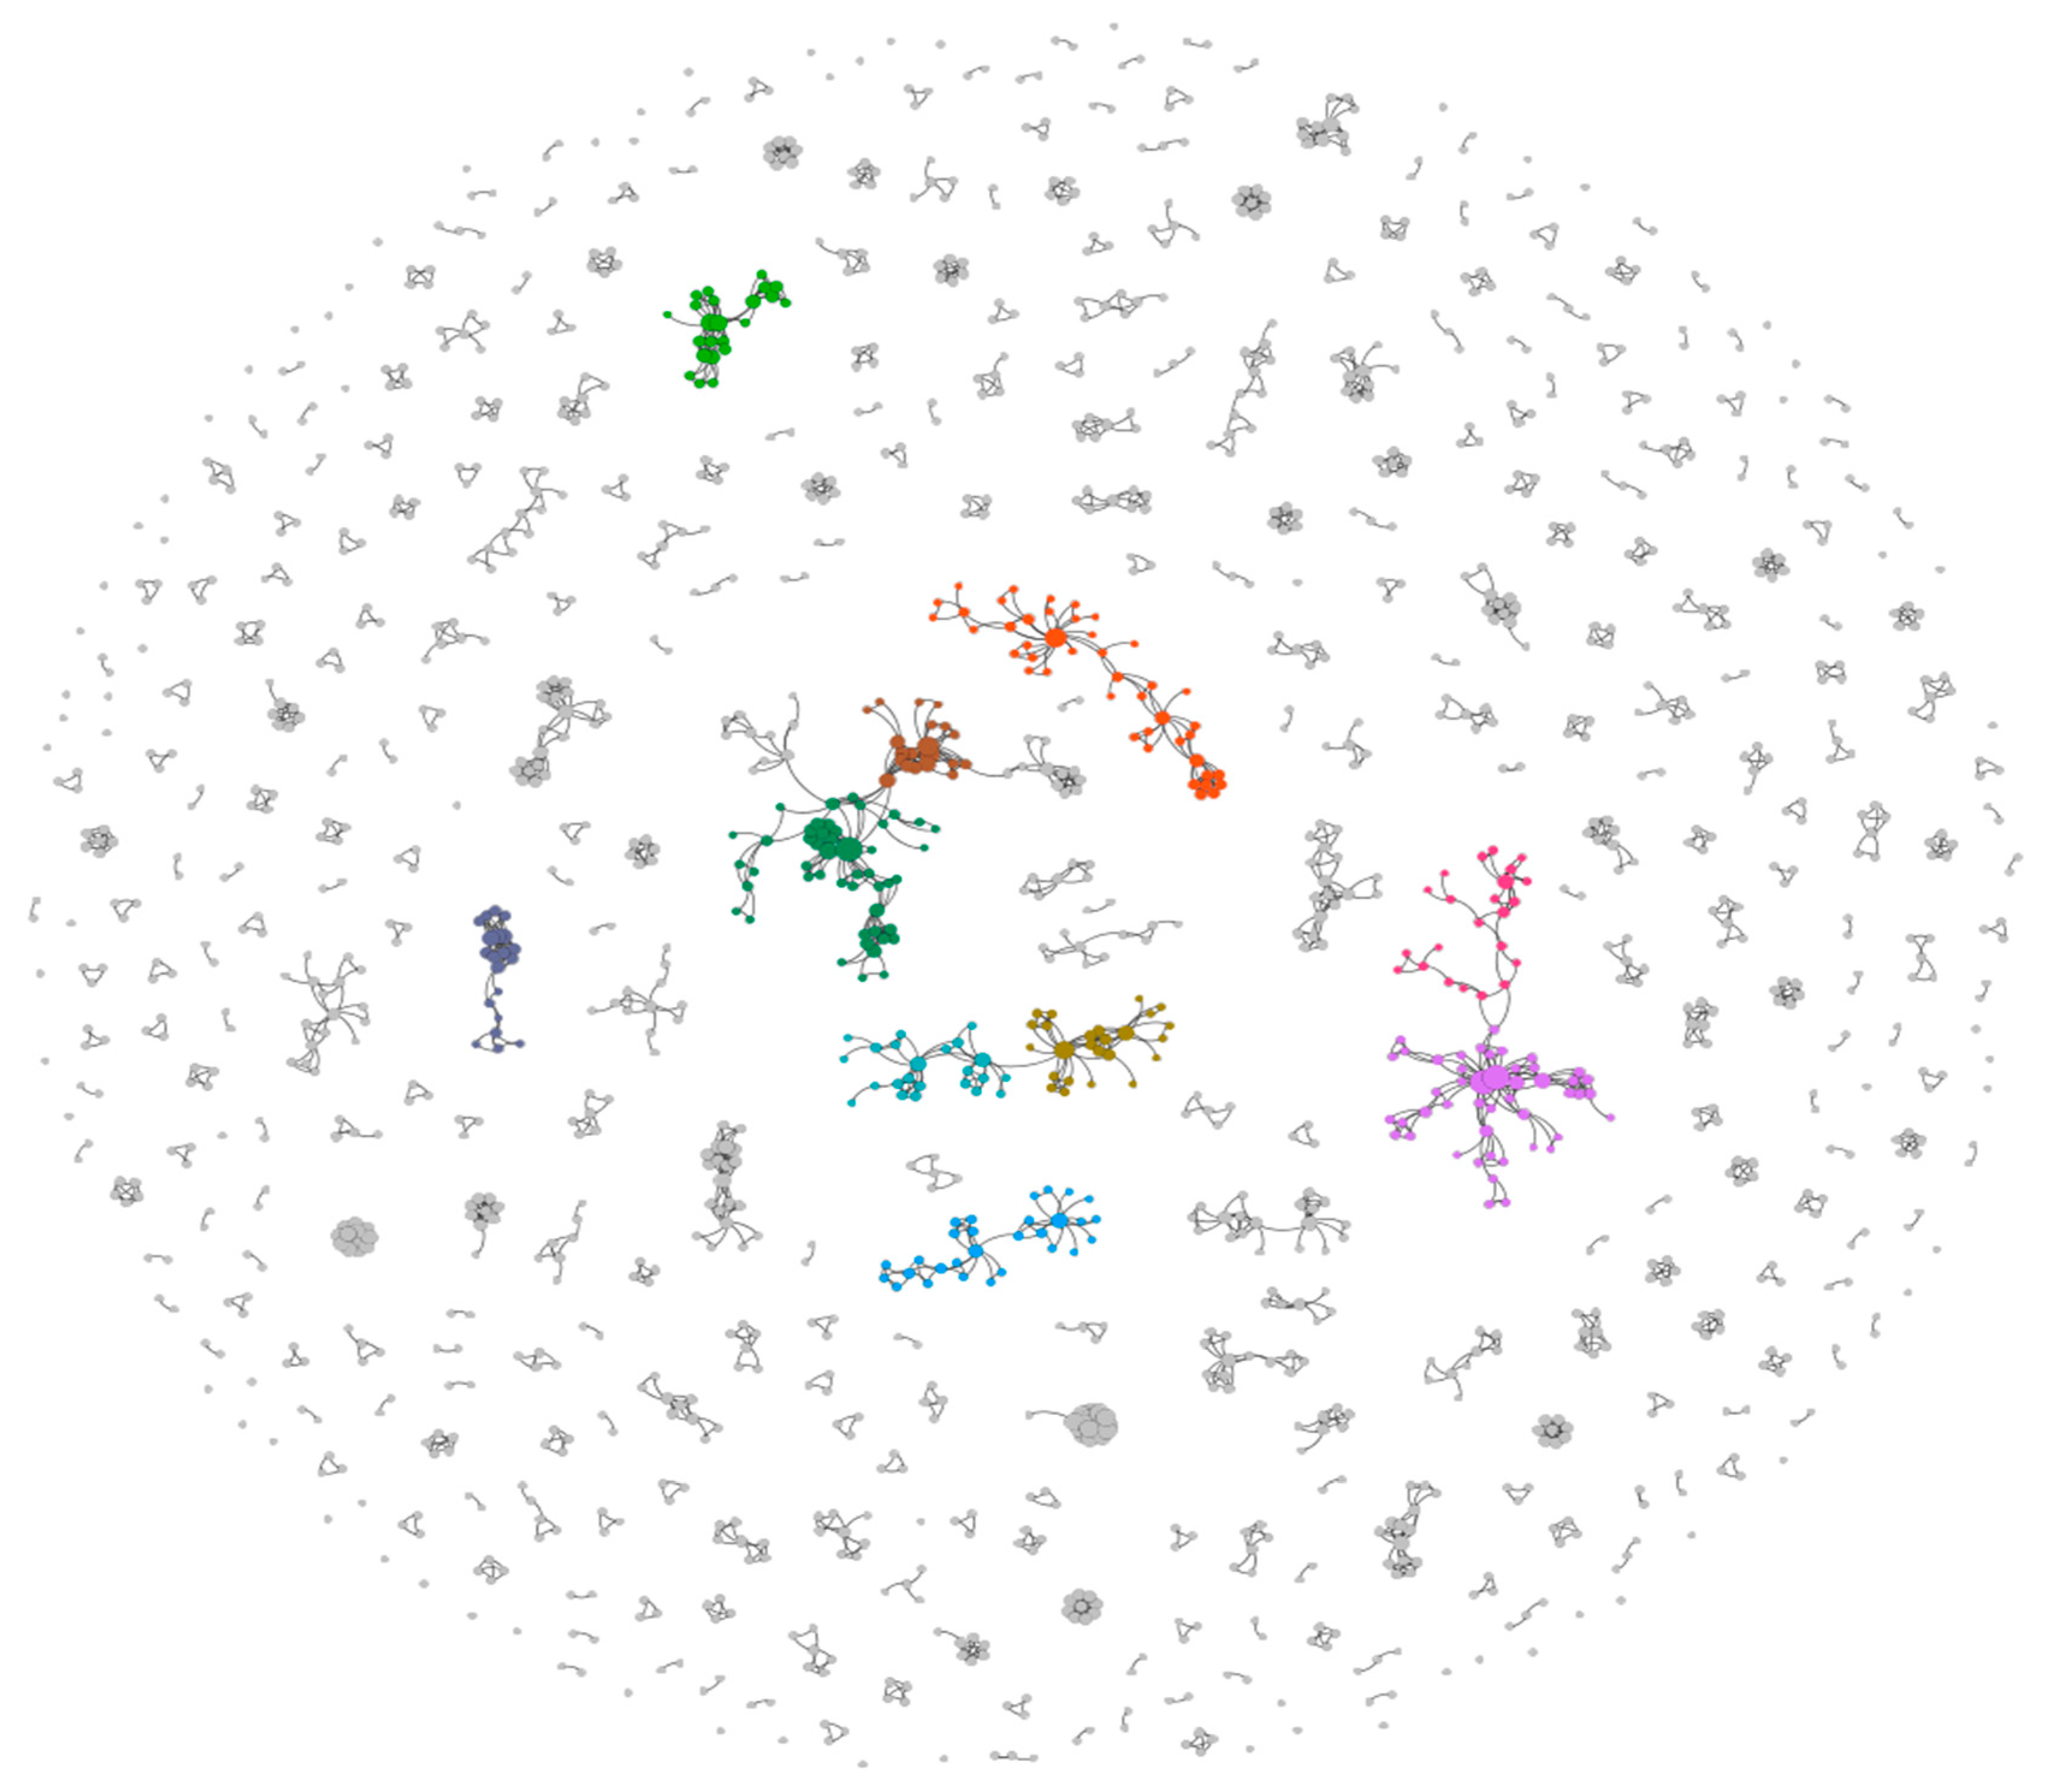
Figure 5.
The most modularity subnetwork (clique 1). Source: Authors’ own construction.
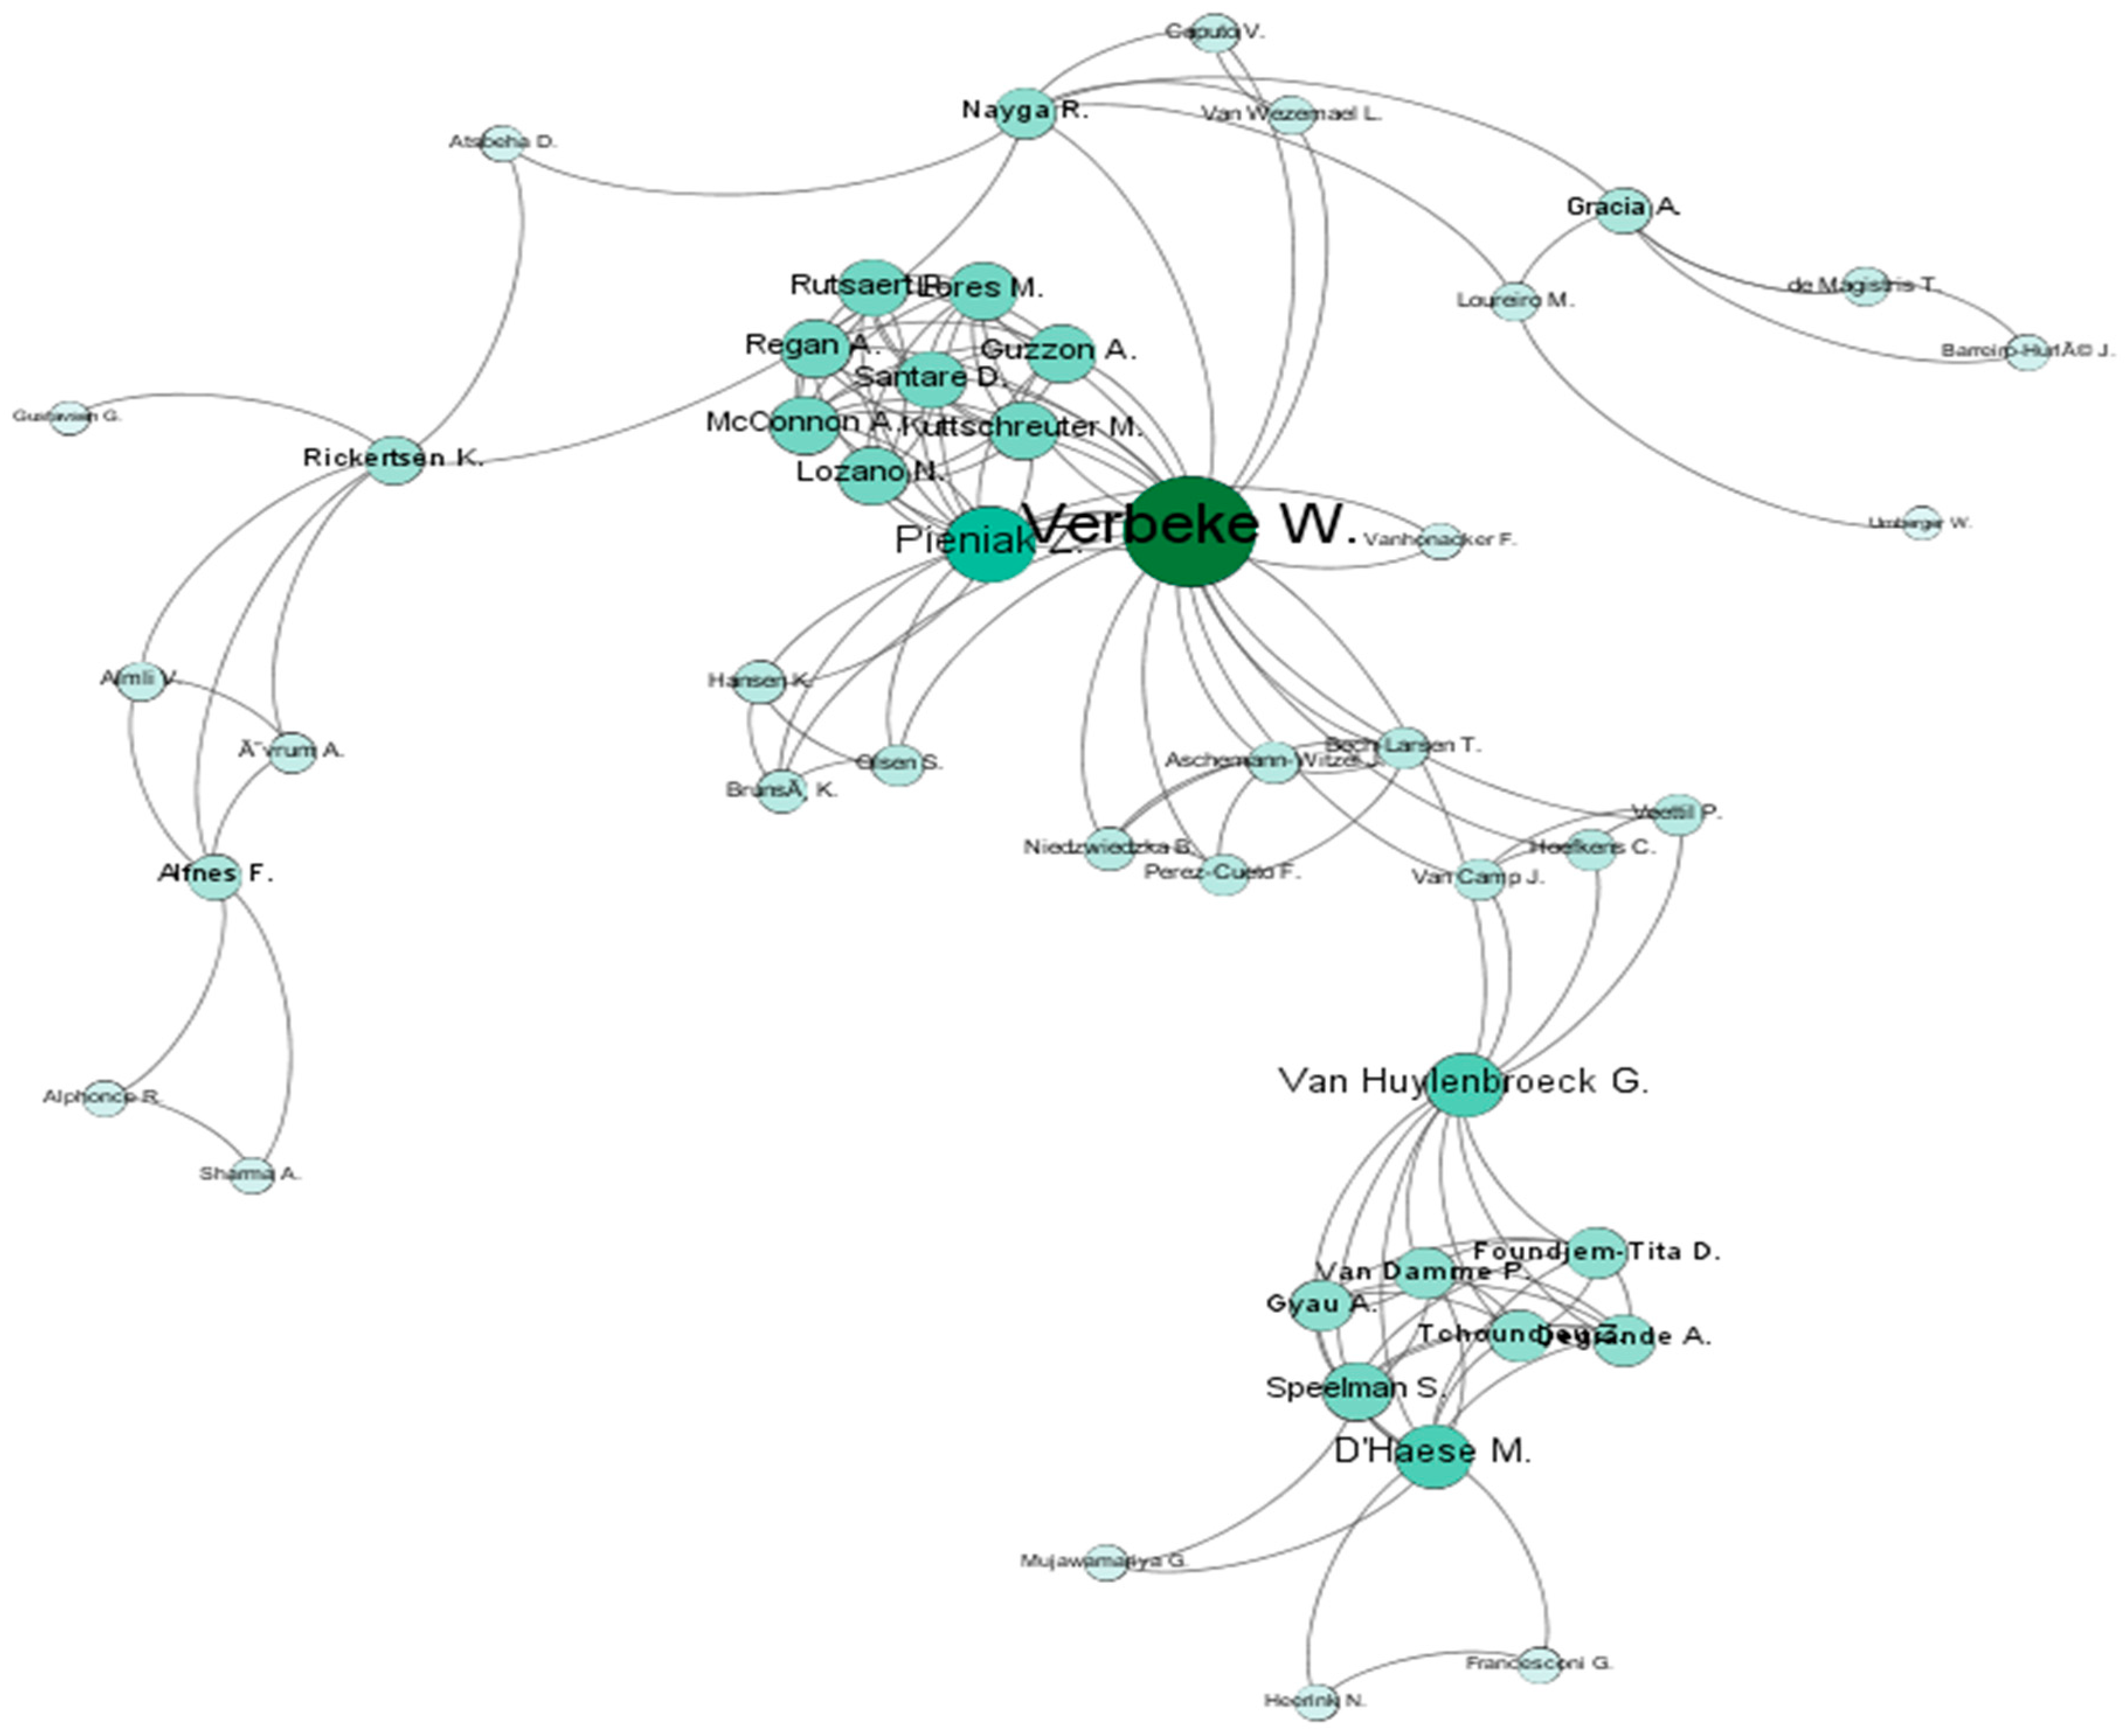
Figure 6.
Citation subnetwork based on top 10 most cited articles. Source: Authors’ own construction.
Figure 6.
Citation subnetwork based on top 10 most cited articles. Source: Authors’ own construction.


Table 1.
Centrality indexes based on co-authorship network (TOP 10).
| No. of Articles | Degree Centrality | Betweenness Centrality | |||
|---|---|---|---|---|---|
| Author | Value | Author | Value | Author | Value |
| Jayne T. | 12 | Huang J. | 28 | Verbeke W. | 2075 |
| Huang J. | 9 | Rozelle S. | 28 | Chryssochoidis G. | 1740 |
| Rozelle S. | 8 | Verbeke W. | 27 | Nayga R. | 1665 |
| Qaim M. | 8 | Rowe G. | 20 | Wang X. | 1058 |
| Barrett C. | 7 | Jayne T. | 20 | Huang J. | 1024 |
| Marette S. | 7 | Barrett C. | 18 | de Jonge J. | 847 |
| Sumner D. | 6 | Frewer L. | 18 | Rozelle S. | 813 |
| Verbeke W. | 6 | McGuire S. | 17 | Herzfeld T. | 810 |
| Maxwell D. | 5 | Violon C. | 16 | Van Huylenbroeck G. | 780 |
| Gruère G. | 5 | Caillon S. | 16 | Van Trijp H. | 780 |
Source: Authors’ own construction.
Table 2.
Regression of the factors affecting the number of published articles.
| Variables | Unstandardized Coefficients | Stand. Coefficients | t | Sig. | Collinearity Statistics | ||
|---|---|---|---|---|---|---|---|
| B | Std. Error | B | Tolerance | VIF | |||
| Constant | 0.307 | 0.028 | 11.098 | 0.000 | |||
| Closeness centrality | −0.997 | 0.034 | −0.432 | −29.468 | 0.000 | 0.689 | 1.451 |
| Betweenness centrality | 0.001 | 0.000 | 0.098 | 6.767 | 0.000 | 0.698 | 1.433 |
| Pageranks | 2984.869 | 60.219 | 0.956 | 49.567 | 0.000 | 0.397 | 2.516 |
| Degree | −0.034 | 0.004 | −0.142 | −8.499 | 0.000 | 0.531 | 1.882 |
Dependent Variable: no of articles; Adjusted R Square = 0.748; Breusch–Pagan test (LM = 2.165; p = 0.342); Koenker test (LM = 0.486; p = 0.216); F(4;1703) = 1265.7; p ≤ 0.001. Source: Authors’ own construction.
Table 3.
Members of the three largest cliques of the network.
| Clique 1 | Clique 2 | Clique 3 | |||
|---|---|---|---|---|---|
| Alfnes F. | McConnon A. | Arora A. | Msangi S. | Alemu D. | Li L. |
| Almli V. | Mujawamariya G. | Baker D. | Nelgen S. | Barik N. | Mason N. |
| Alphonce R. | Nayga R. | Ciaian P. | Notenbaert A. | Bernard T. | Mather D. |
| Aschemann-W. J. | Niedzwiedzka B. | Dagevos H. | Oxley L. | Black R. | Muyanga M. |
| Atsbeha D. | Olsen S. | Deconinck K. | Qiu H. | Boughton D. | Myers R. |
| Barreiro-Hurlé J. | Ovrum A. | Dries L. | Rozelle S. | Burke W. | Nijhoff J. |
| Bech-Larsen T. | Perez-Cueto F. | Enahoro D. | Stoop N. | Byerlee D. | Nissapa A. |
| Brunso¸ K. | Pieniak Z. | Fuller F. | Swinnen J. | Cavalieri A. | Pham N. |
| Caputo V. | Regan A. | Havlik P. | van der Lans I. | Chamberlin J. | Rahman M. |
| Degrande A. | Rickertsen K. | He Y. | Verpoorten M. | Chapoto A. | Rao N. |
| De-Magistris T. | Rutsaert P. | Herrero M. | Wang J. | Chen O. | Renkow M. |
| D’Haese M. | Santare D. | Huang J. | Wang J. M. | Dereje M. | Ricker-G. J. |
| Foundjem-Tita D. | Sharma A. | Huang Q. | Wang X. | Dey M. | Sheahan M. |
| Francesconi G. | Speelman S. | Huang Z. | Weersink A. | Donovan C. | Sitko N. |
| Gracia A. | Tchoundjeu Z. | Jia X. | Xiao H. | Florax R. | Spielman D. |
| Gustavsen G. | Umberger W. | Kalaitzan. N. | Yang J. | Haque A. | Taffesse A. |
| Guzzon A. | Van Camp J. | Kaufman J. | Yu E. | Headey D. | Traub L. |
| Gyau A. | Van Damme P. | Liu Y. | Zhai F. | Jayne T. | Valmonte-S. R. |
| Hansen K. | Van Huylenbr. G. | Lohmar B. | Zhang D. | Jones M. | Zulu B. |
| Heerink N. | Van Wezemael L. | Luan H. | Zhang W. | Josephson A. | |
| Hoefkens C. | Vanhonacker F. | Ma H. | Zhang X. | Jumbe C. | |
| Kuttschreuter M. | Veettil P. | Magnan N. | Kelemework D. | ||
| Lores M. | Verbeke W. | Magnier A. | Khan M. | ||
| Loureiro M. | Martin W. | Kolady D. | |||
| Lozano N. | Miller D. | Kumar P. | |||
The authors in each clique were listed in alphabetical order rather than based on their role in the network. Source: Authors’ own construction.
Table 4.
The top 10 most cited articles.
| Article | Author(s) | Title of Article | Year | Citations Received | Order of Pageranks |
|---|---|---|---|---|---|
| 1. | Knowler, Bradshaw | Farmers’ adoption of conservation agriculture: A review and synthesis of recent research | 2007 | 200 | 2. |
| 2. | Fulponi | Private voluntary standards in the food system: The perspective of major food retailers in OECD country | 2006 | 156 | 1. |
| 3. | Pingali | Westernization of Asian diets and the transformation of food systems: Implications for research and policy | 2007 | 155 | 4. |
| 4. | Loureiro, Umberger | A choice experiment model for beef: What US consumer responses tell us about relative preferences for food safety, country-of-origin labeling and traceability | 2007 | 150 | 6. |
| 5. | Hanjra, Qureshi | Global water crisis and future food security in an era of climate change | 2010 | 139 | 8. |
| 6. | Barrett | Smallholder market participation: Concepts and evidence from eastern and southern Africa | 2008 | 130 | 10. |
| 7. | Costa-Font, Gil, Traill | Consumer acceptance, valuation of and attitudes towards genetically modified food: Review and implications for food policy | 2008 | 114 | 9. |
| 8. | Batte, Hooker, Haab, Beaverson | Putting their money where their mouths are: Consumer willingness to pay for multi-ingredient, processed organic food products | 2007 | 104 | 7. |
| 9. | Piesse, Thirtle | Three bubbles and a panic: An explanatory review of recent food commodity price events | 2009 | 104 | 3. |
| 10. | Coley, Howard, Winter | Local food, food miles and carbon emissions: A comparison of farm shop and mass distribution approaches | 2009 | 101 | 5. |
Source: Authors’ own construction.
Table 5.
Regression of the factors affecting the number of citations.
| Variables | Unstandardized Coefficients | Stand. Coefficients | t | Sig. | Collinearity Statistics | ||
|---|---|---|---|---|---|---|---|
| B | Std. Error | B | Tolerance | VIF | |||
| Constant | 0.104 | 0.102 | 1.022 | 0.307 | |||
| Closeness centrality | −1.037 | 0.117 | −0.039 | −8.898 | 0.000 | 0.914 | 1.094 |
| Betweenness centrality | 0.00008 | 0.000 | 0.026 | 6.210 | 0.000 | 0.995 | 1.005 |
| Pagerank | 13692.33 | 64.376 | 0.925 | 212.692 | 0.000 | 0.910 | 1.099 |
Dependent Variable: no of articles; Adjusted R Square = 0.882; Breusch–Pagan test (LM = 7.493; p = 0.058); Koenker test (LM = 0.597; p = 0.897); F (3;6831) = 17069.5; p ≤ 0.001. Source: Authors’ own construction.
© 2018 by the authors. Licensee MDPI, Basel, Switzerland. This article is an open access article distributed under the terms and conditions of the Creative Commons Attribution (CC BY) license (http://creativecommons.org/licenses/by/4.0/).
Share and Cite
MDPI and ACS Style
Popp, J.; Balogh, P.; Oláh, J.; Kot, S.; Harangi Rákos, M.; Lengyel, P. Social Network Analysis of Scientific Articles Published by Food Policy. Sustainability 2018, 10, 577. https://doi.org/10.3390/su10030577
AMA Style
Popp J, Balogh P, Oláh J, Kot S, Harangi Rákos M, Lengyel P. Social Network Analysis of Scientific Articles Published by Food Policy. Sustainability. 2018; 10(3):577. https://doi.org/10.3390/su10030577
Chicago/Turabian StylePopp, József, Péter Balogh, Judit Oláh, Sebastian Kot, Mónika Harangi Rákos, and Péter Lengyel. 2018. "Social Network Analysis of Scientific Articles Published by Food Policy" Sustainability 10, no. 3: 577. https://doi.org/10.3390/su10030577
Note that from the first issue of 2016, this journal uses article numbers instead of page numbers. See further details here.