Article

Spatiotemporal Patterns of Desertification Dynamics and Desertification Effects on Ecosystem Services in the Mu Us Desert in China

1
School of Ecology and Environment, Inner Mongolia University, Hohhot 010021, China
2
College of Resources and Environment, Baotou Normal College, Inner Mongolia University of Science and Technology, Baotou 014030, China
3
Department of Geography and Planning, University at Albany, State University of New York, Albany, NY 12222, USA
4
Inner Mongolia Academy of Forestry Science, Hohhot 010010, China
*
Authors to whom correspondence should be addressed.
These authors contributed equally to this work and should be considered co-first authors.
Sustainability 2018, 10(3), 589; https://doi.org/10.3390/su10030589
Submission received: 30 December 2017 / Revised: 13 February 2018 / Accepted: 23 February 2018 / Published: 26 February 2018

Abstract

:
Degradation of semi-arid and arid ecosystems due to desertification is arguably one of the main obstacles for sustainability in those regions. In recent decades, the Mu Us Desert in China has experienced such ecological degradation making quantification of spatial patterns of desertification in this area an important research topic. We analyzed desertification dynamics for seven periods from 1986 to 2015 and focused on five ecosystem services including soil conservation, water retention, net primary productivity (NPP), crop productivity, and livestock productivity, all assessed for 2015. Furthermore, we examined how ecosystem services relate to each other and are impacted by desertification. Three major conclusions are drawn from the study. First, the eastern part of the study area experienced overall improvement while desertification in the west first increased and then reversed its trend during those periods between 1986 and 2015. Second, significant synergistic relationships are observed for three regulating services (soil conservation, water retention, NPP) and two provisioning services (crop productivity and livestock productivity). Strong relationships across different types of ecosystem services were found only between crop productivity and NPP. Third, in response to increasing desertification, the three regulating services exhibit a monotonically decreasing trend, while the two provisioning services follow a hump-shaped response.

1. Introduction

People benefit from ecosystems in the form of provisioning (food, water, wood, and fiber), regulating (climate, floods, diseases, waste, and water quality), and supporting (soil formation, photosynthesis, and nutrient cycling) ecosystem services, on one hand, and entertainment, aesthetic enjoyment and spiritual benefits and other cultural needs, on the other [1]. All those services are important for maintenance and improvement of human well-being and, eventually, for the sustainability of regions [2]. The Millennium Ecosystem Assessment [1] reports that in the last 50 years 15 out of 24 ecosystem services have been degrading worldwide. Such degradation will directly threaten the safety and health of human populations, as well as regional and global ecological security [1,3]. Induced by a combination of climate change and human activities, desertification has become the main reason for ecosystem degradation in many dry regions. Rightfully so, it was named one of the main impediments in sustainable trajectories of development of those regions by the Ordos Declaration issued by the United Nations Convention to Combat Desertification’s 13th conference [4]. If desertification continued to occur at the current rate, it could seriously endanger and jeopardize the existence of approximately 350 million people [5]. It is, therefore, important to study the impact of desertification on ecosystem services, which will have far-reaching implications for regional sustainability.
Due to the diversity of ecosystem services and the spatial-temporal heterogeneity of land uses, their interactions are not only characterized by a combination of natural environmental dynamics and human decisions and experiences but also by reciprocal tradeoffs and synergies [6]. For example, when availability of ecosystem services is highly constrained by natural conditions, the increase in provisioning services often results in the reduction of regulating and cultural services thus exhibiting trade-offs [1,7]. With respect to ecosystem services, synergy refers to the simultaneous increase or reduction of two kinds of ecosystem services. For example, biodiversity conservation can cause an increase in provisioning services [8,9]. There are two main types of maintenance mechanisms for tradeoffs or synergies in ecosystem services. The first one is based on a single factor driving multiple ecosystem services. Changes in this driving factor will cause feedbacks from ecosystem services, resulting in trade-off or synergy between them. The second mechanism stems from interactions between ecosystem services. Changes in one ecosystem service will be immediately reflected in the other [10]. Therefore, to achieve maximum benefits from ecosystem services, we need to understand the relationships between multiple services and use the knowledge to anticipate reciprocal effects rather than just pursuing the revenue from one service [11].
Desertification is referred to as land degradation triggered by climate change and human activities in arid and semi-arid regions. Such degradation takes form of physical, chemical, and biological degradation of soil characteristics and the long-term loss of natural vegetation [12,13]. The latter is often used as the indicator of desertification in addition to documenting the reduction in soil depth due to erosion and in the decline in productive capacity and water-holding properties of the soil. Desertification is accompanied by the decrease of soil nutrients, such as nitrogen, phosphorus, and potassium resulting in the decline of soil fertility [14,15]. Another negative process is the decline in soil water holding capacity, which directly impacts many ecosystem services. On broader scales, desertification can lead to the change in productivity of the whole region by affecting regional photosynthesis by dust particles suspended in the air. As a result, soil conservation, water retention and net primary productivity become a matter of concern [16]. Clearly, desertification has mainly negative impacts on provisioning of ecosystem services [17].
To address desertification trends and their impact on ecosystem services we chose to study the Mu Us Desert transitioning from the Ordos Plateau to the Loess Plateau in China. It is characterized as an ecotone of pasture, forest, and agriculture, mainly pasture grazing. The area is deemed to be quite fragile and sensitive to environmental changes [18]. Being exposed to effects of recent climate changes the region has experienced the development of agriculture and animal husbandry and the increase in energy production, among other human activities, which contribute to the accelerated desertification in the area. While those threats and their effects have been extensively studied in the Mu Us Desert, only a few studies focused on the effects of desertification on ecosystem services. Our study was designed to simultaneously assess the process of desertification and dynamics of five ecosystem services—soil conservation, water retention, net primary productivity (NPP), crop productivity, and livestock productivity—in the area. This allowed us to assess the relationships between desertification and these ecosystem services, which we consider a contribution to the theory and analysis of ecosystem services in dry regions. The work is important in that it provides scientific knowledge for controlling desertification and achieving regional sustainability in the Mu Us Desert.

2. Materials and Methods
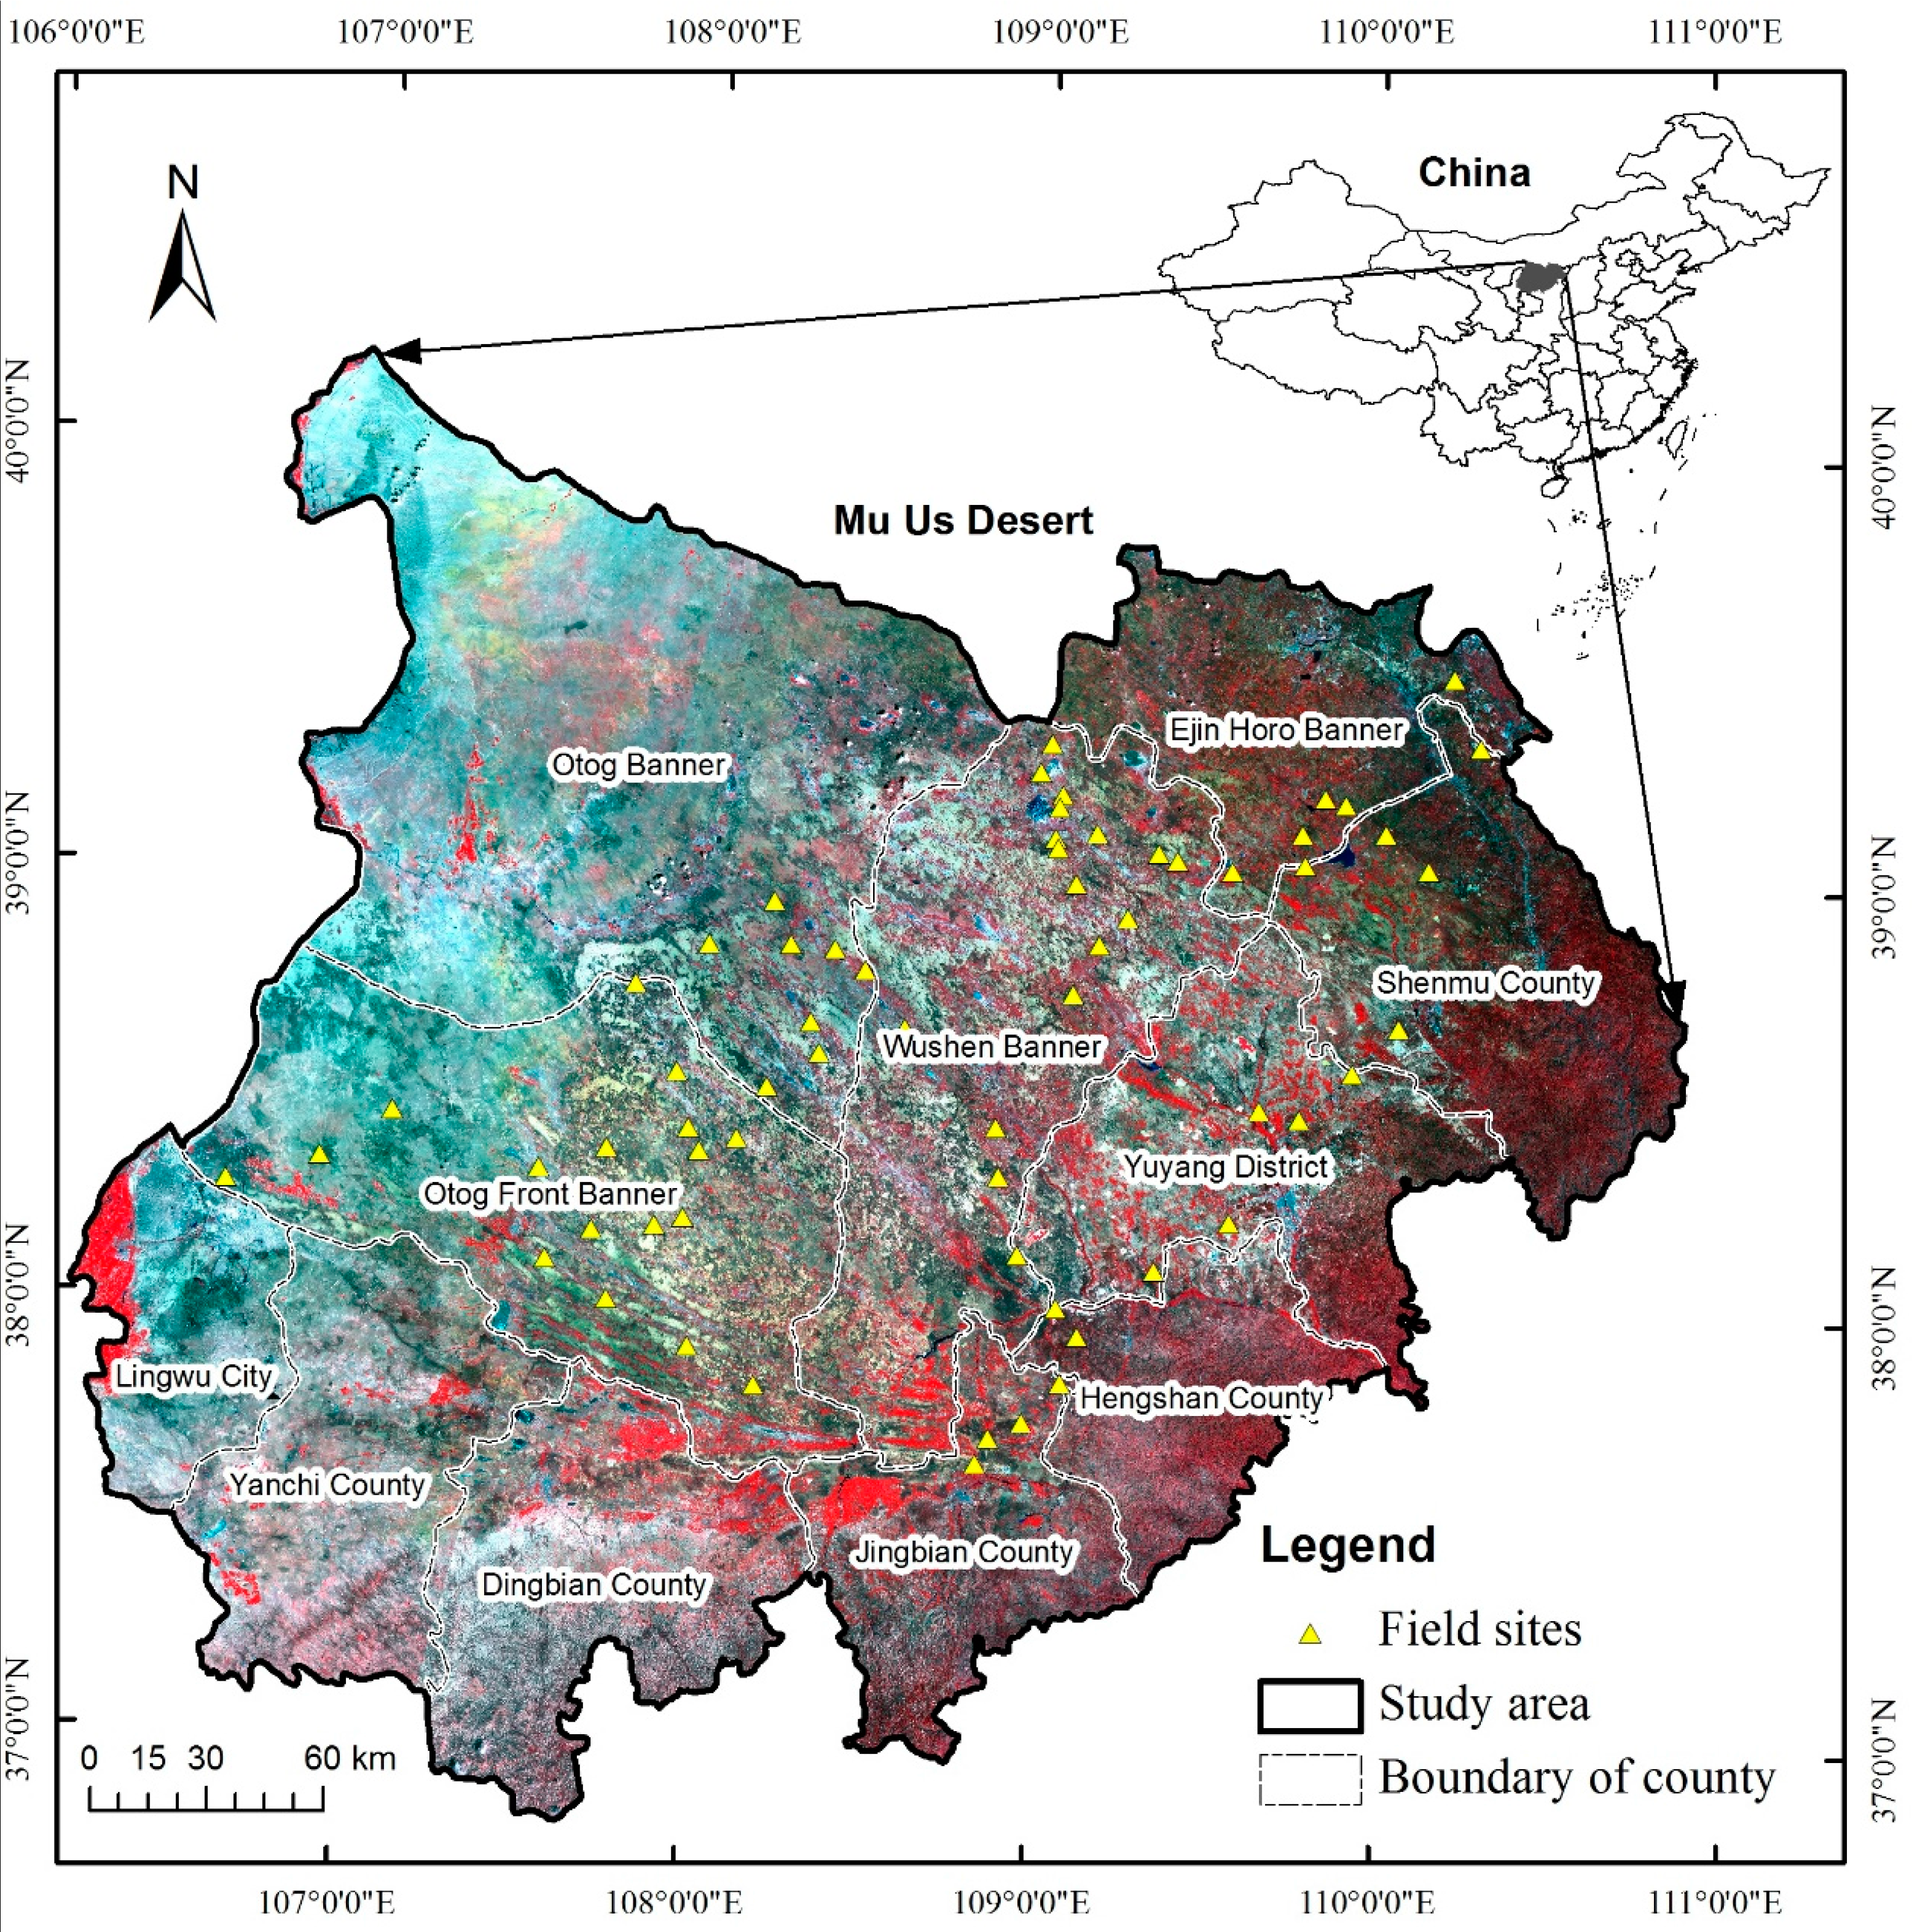
2.1. Study Area

The Mu Us Desert (106°11′–110°54′ E, 36°49′–40°12′ N) cuts across Shaanxi Province, Ningxia Hui and Inner Mongolia Autonomous Regions and includes eleven counties (banners) and districts (Figure 1). The climate of the area is temperate arid, semi-arid continental monsoon climate with the annual average temperature of 6–9 °C. The average annual precipitation increases from about 250 mm in the northwest to 400 mm in the southeast. Elevation generally changes from 1000 to 1600 m following the northwest–southeast trend. The variable topography includes such landforms as active dunes, semi-fixed dunes, and fixed dunes. The main soil contains Kastanozems, Arenosols, Histosols and Solonchaks. The zonal vegetation is dominated by Stipa bungeana and Thymus serpyllum plant communities, and sand vegetation is dominated by Artemisia ordosica, Salix psammophyla and Sabina vulgaris.

2.2. Data Sources

Based on field investigation, the vegetation coverage in the study area was obtained at the end of July 2016; a total of 71 sites were set up (Figure 1), three 10 × 10-m sample plots were established within each site, all the shrubbery clump width was measured, and the vertical projection area of each plant was calculated by the ellipse calculation method. Five 10 × 10-m quadrats were established within each sample plot, using digital cameras to shoot photos vertically above 1 m, ENVI 5.3 software (Exelis Visual Information Solutions; Boulder, CO, USA; 2015) is used to extract the herbaceous coverage. The sum coverage of shrubs and herbaceous as the measured coverage of one sample plot, the average value of coverage of three sample plots as the measured coverage.
63 Landsat images (TM and OLI, 30-m spatial resolution) from 1986 to 2015 (1986, 1990, 1995, 2000, 2005, 2010, 2015; path/row: 127/32-34, 128/32-34, 129/32-34; http://landsat.usgs.gov) were used in the study. All images were selected at the end of the July, due to the limits of cloud and time resolution, some images have to be replaced by near time: in 1995, images of 128/32-34 were replaced by the same period in 1996; in 2000, image of 128/34 was replaced by the same period in 1999; in 2010, images of 128/32 and 128/33 were replaced by the same period in 2009. Radiometric calibration, atmospheric, topographical, and geometric corrections were performed using ENVI 5.3 software with Digital Elevation Model (DEM). We obtained land use from the global land cover maps at 300-m spatial resolution published by the European Space Agency (ESA). DEM data were obtained from ASTER satellite images at 30-m spatial resolution (http://www.jspacesystems.or.jp/en_/). Data on precipitation and temperature were provided by the China Meteorological Data Service Center. Maps of soil type, soil texture, and soil depth were prepared by the Inner Mongolia Grassland Ecosystem Research Station, Chinese Academy of Sciences. Crop productivity and livestock productivity are from published statistical yearbook.

2.3. Data Analysis

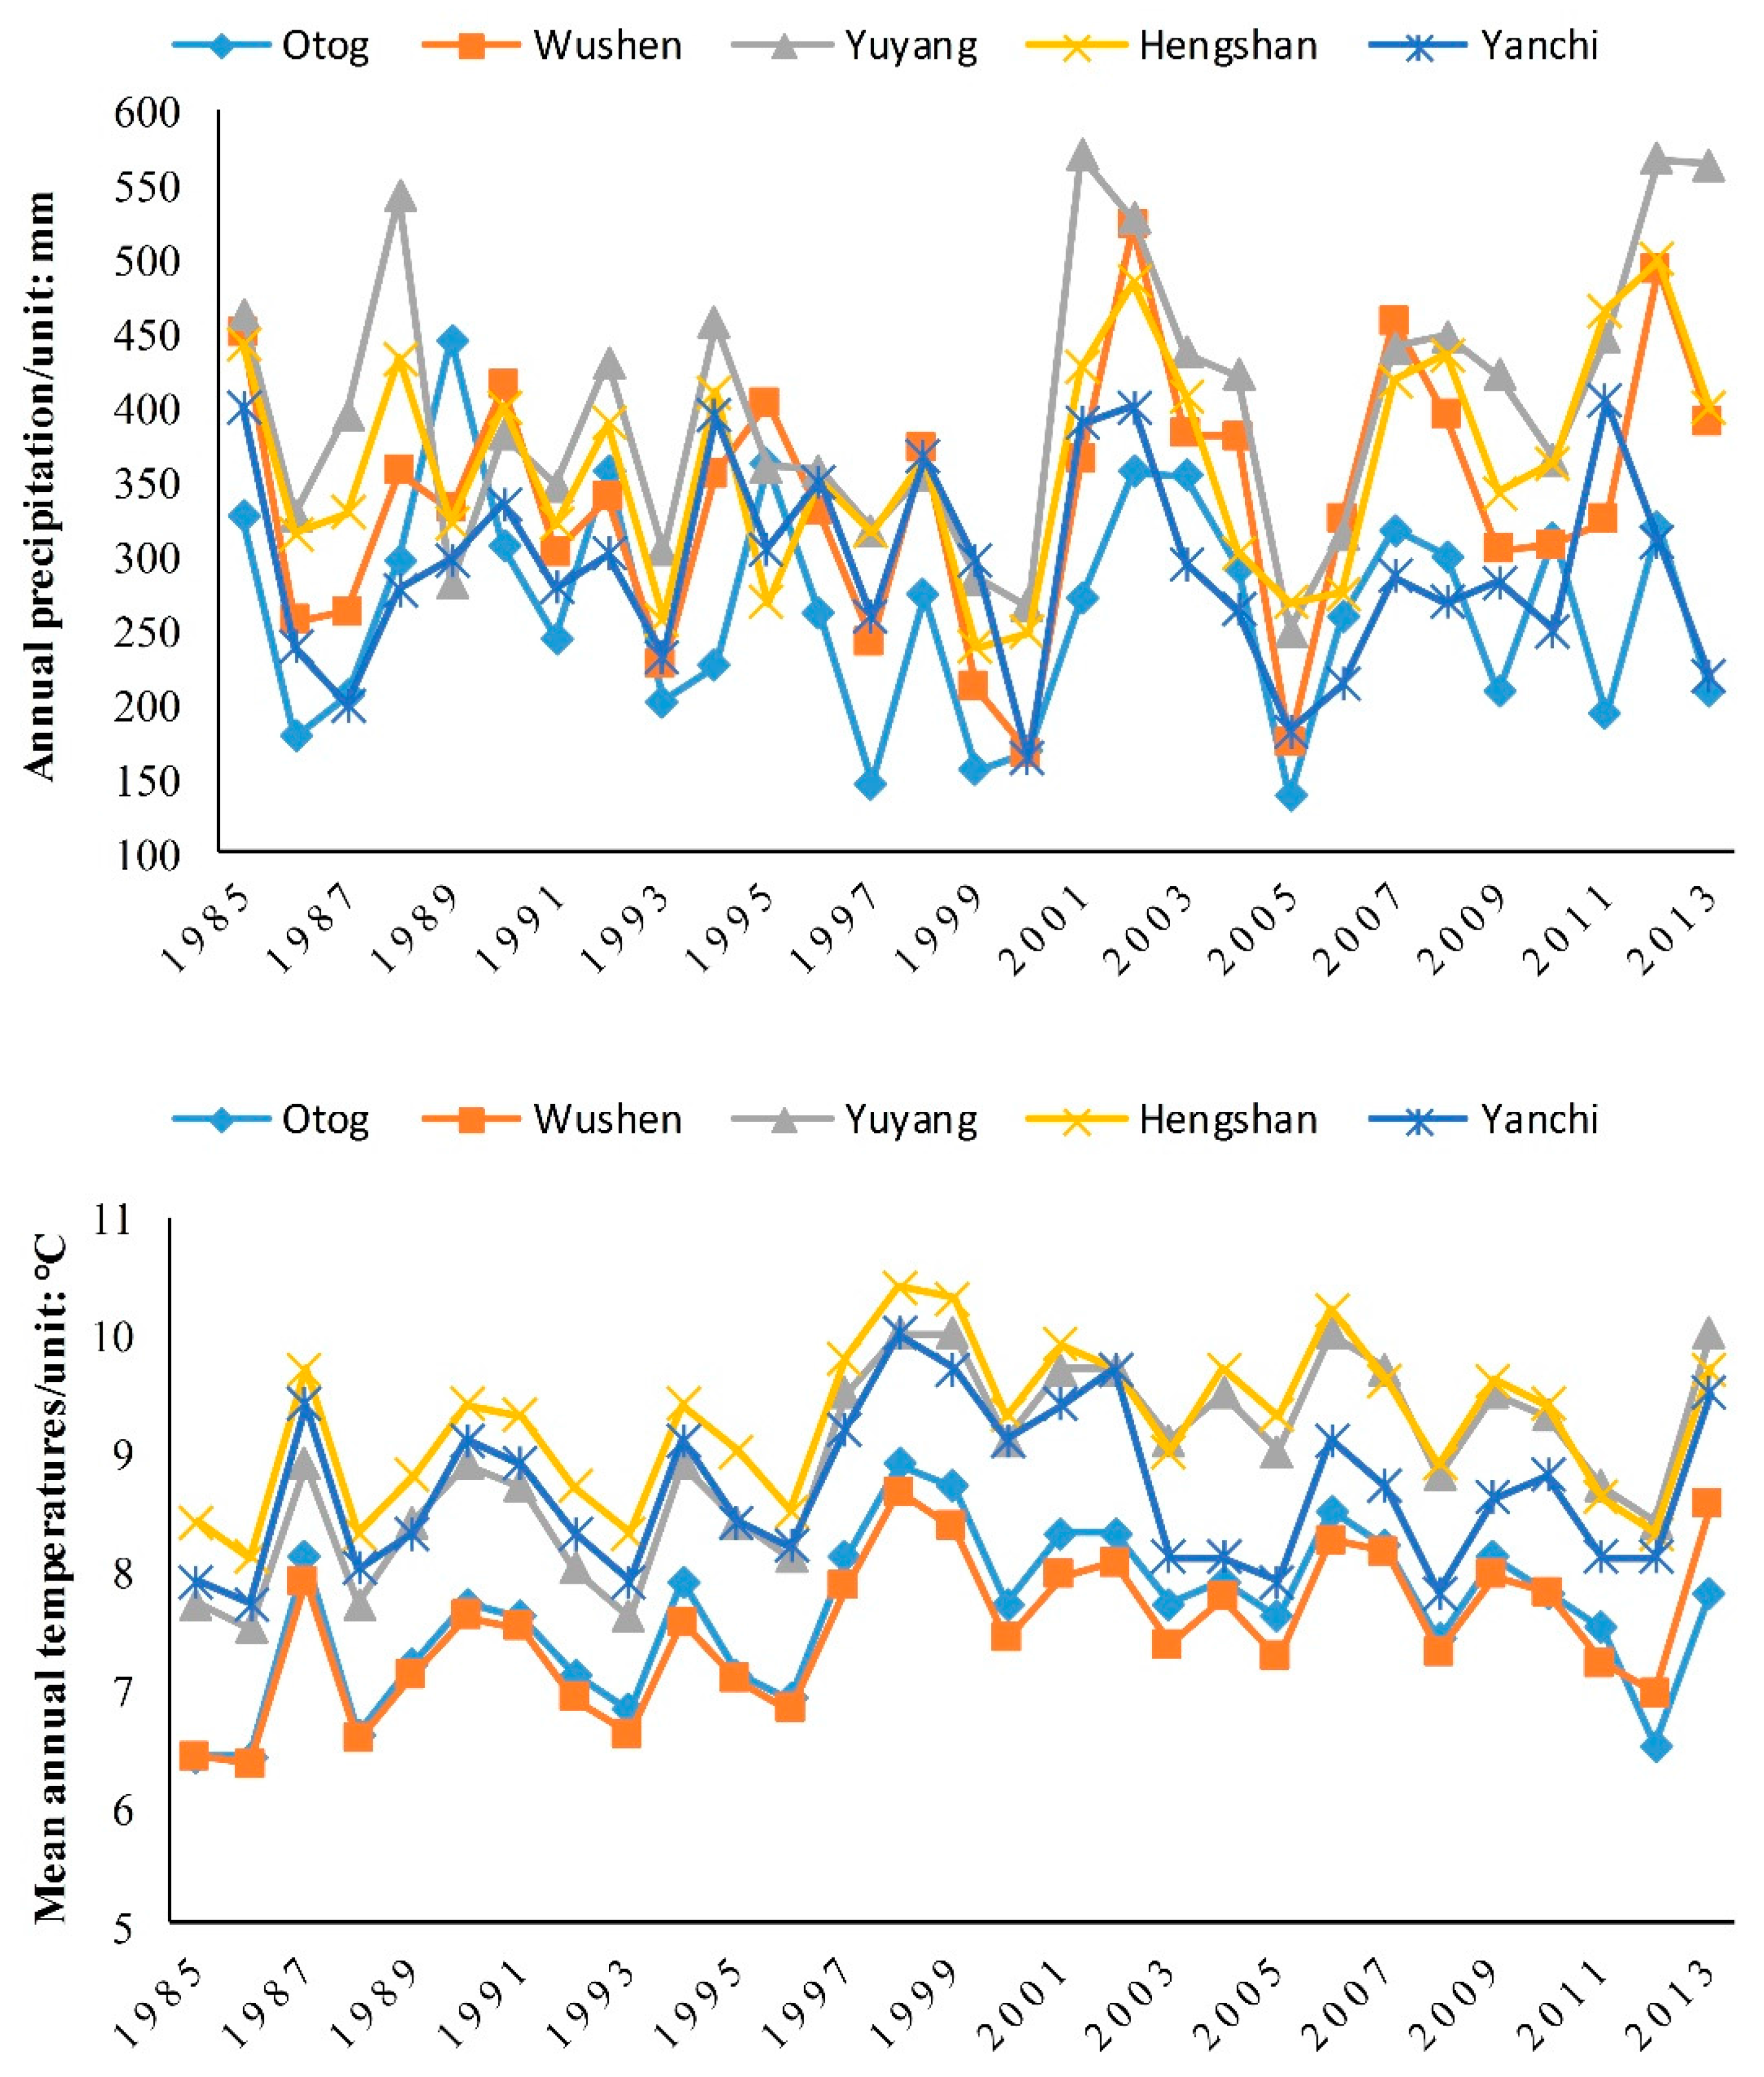
2.3.1. Climate Change in Mu Us Desert from 1985 to 2013

Due to the lack of data from some meteorological stations, finally we obtained annual precipitation and mean annual temperature data from five meteorological stations in 1985–2013, two meteorological stations in the Inner Mongolia Autonomous Region (in Otog and Wushen banner), two meteorological stations in the Shaanxi Province (in Yuyang district, Hengshan county) and one in the Ningxia Autonomous Region (in Yanchi county). The distance between five meteorological stations is far enough and is evenly distributed in the study area. Pearson correlation analysis was conducted to determine the differences of trends in climate change between meteorological stations in Mu Us Desert for 1985–2013.

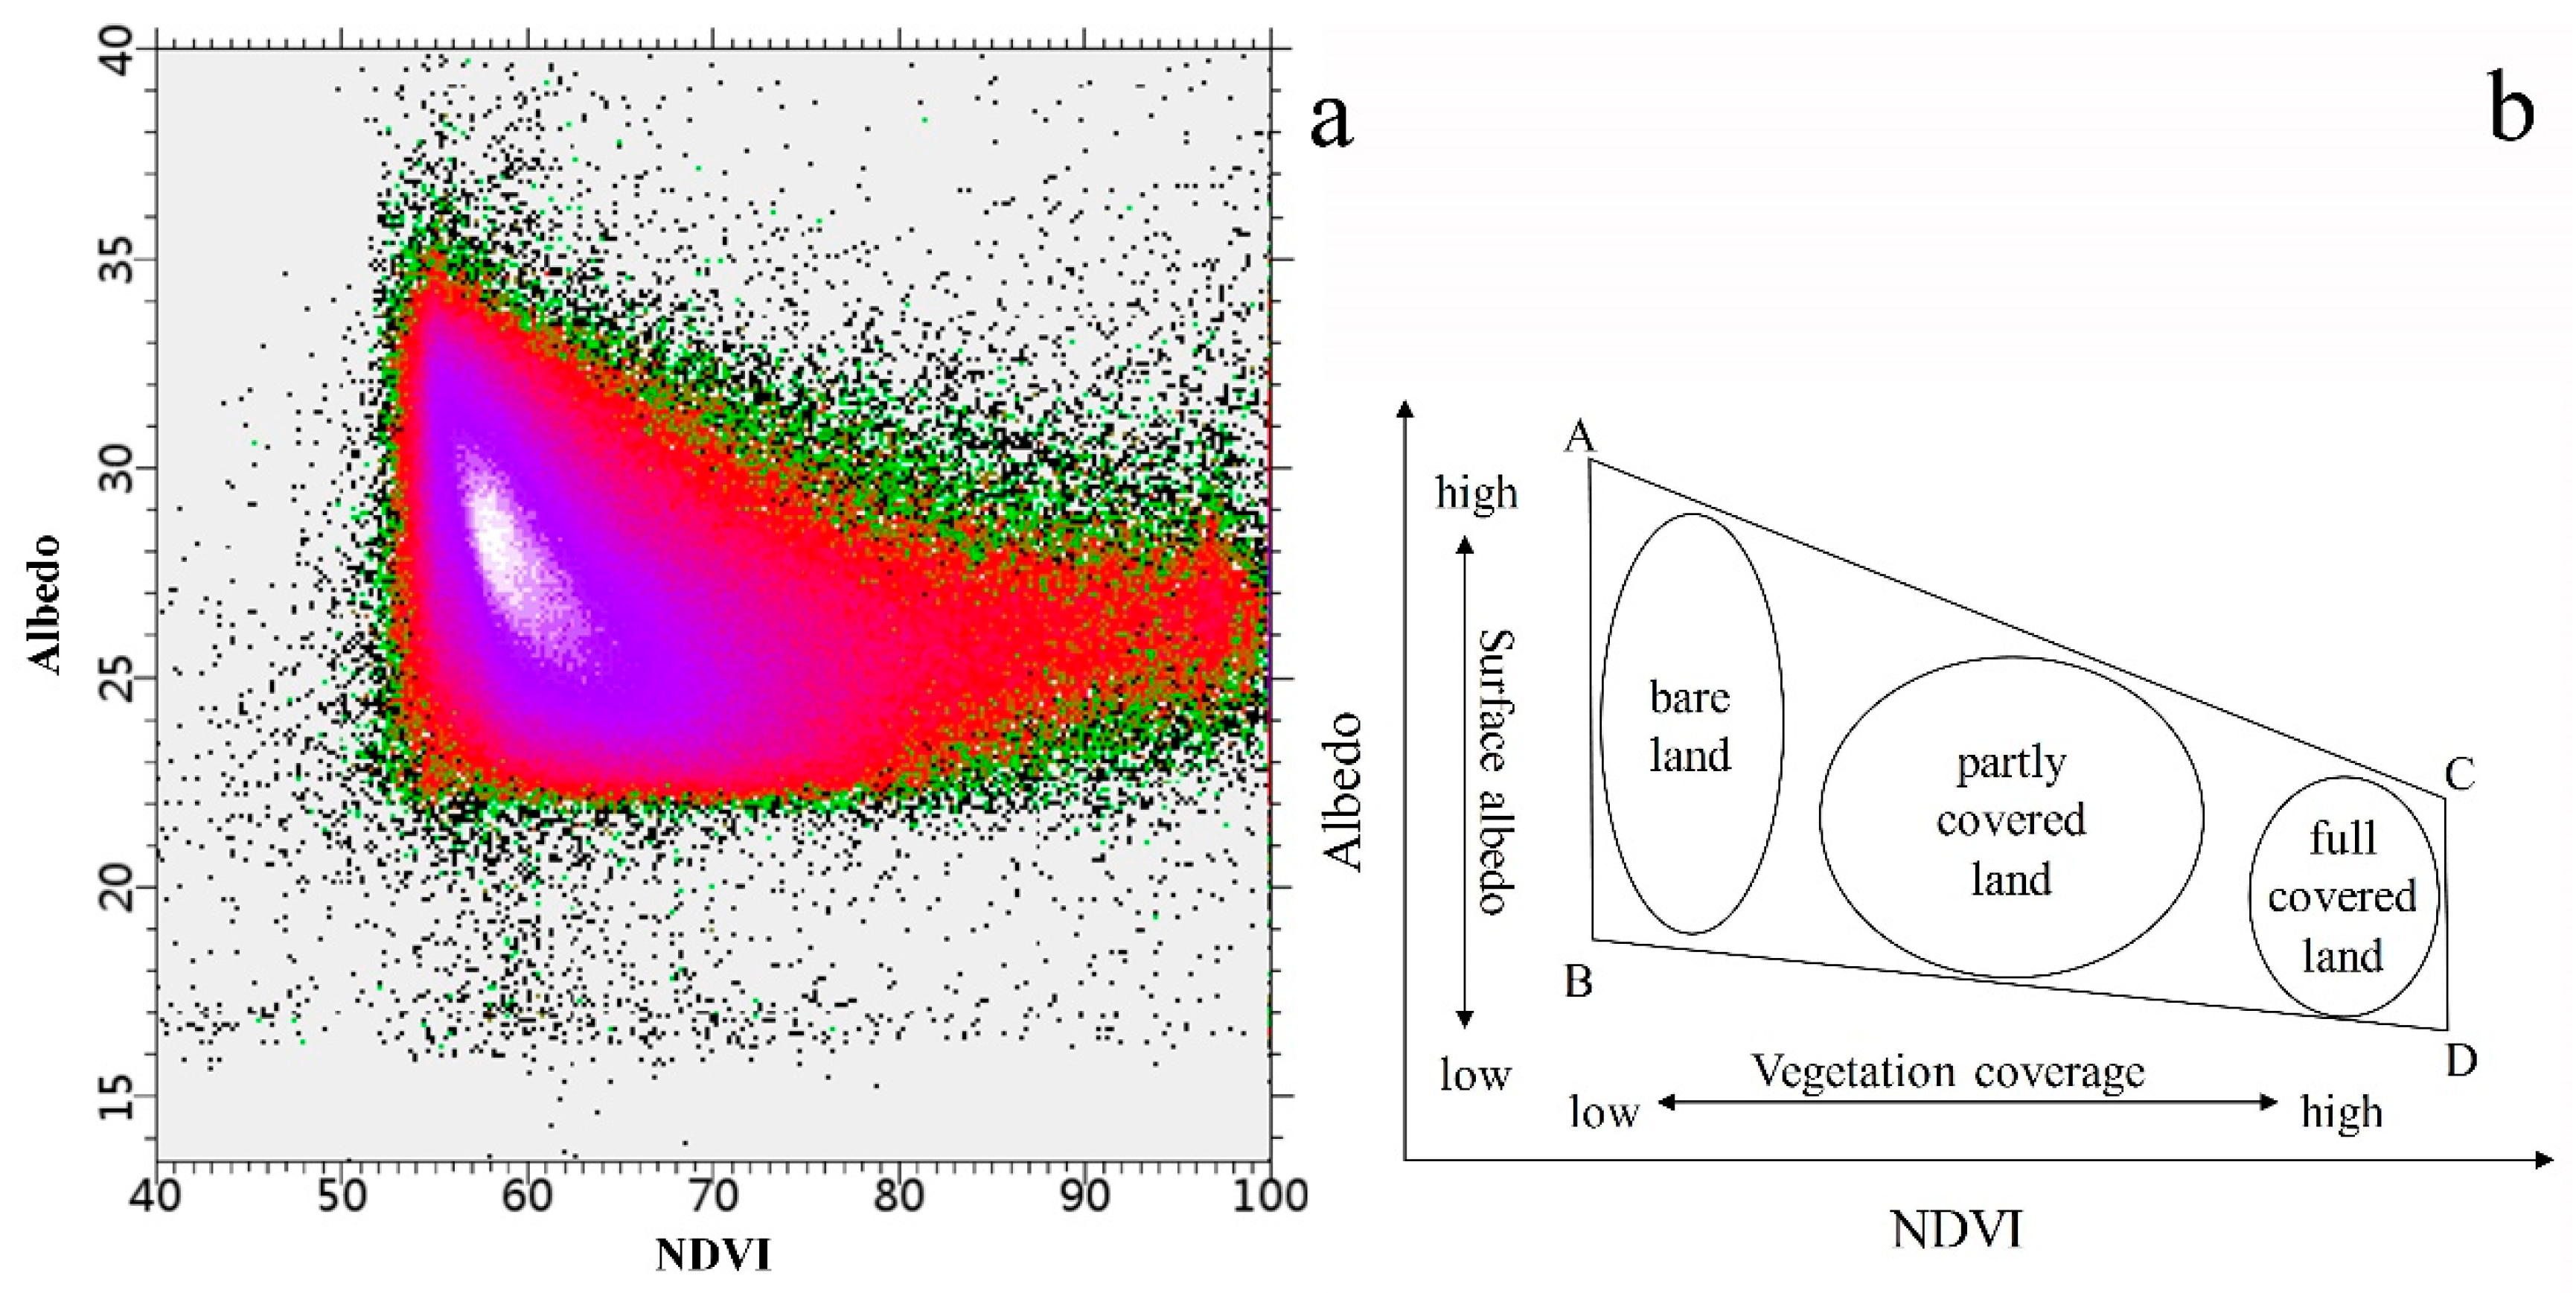
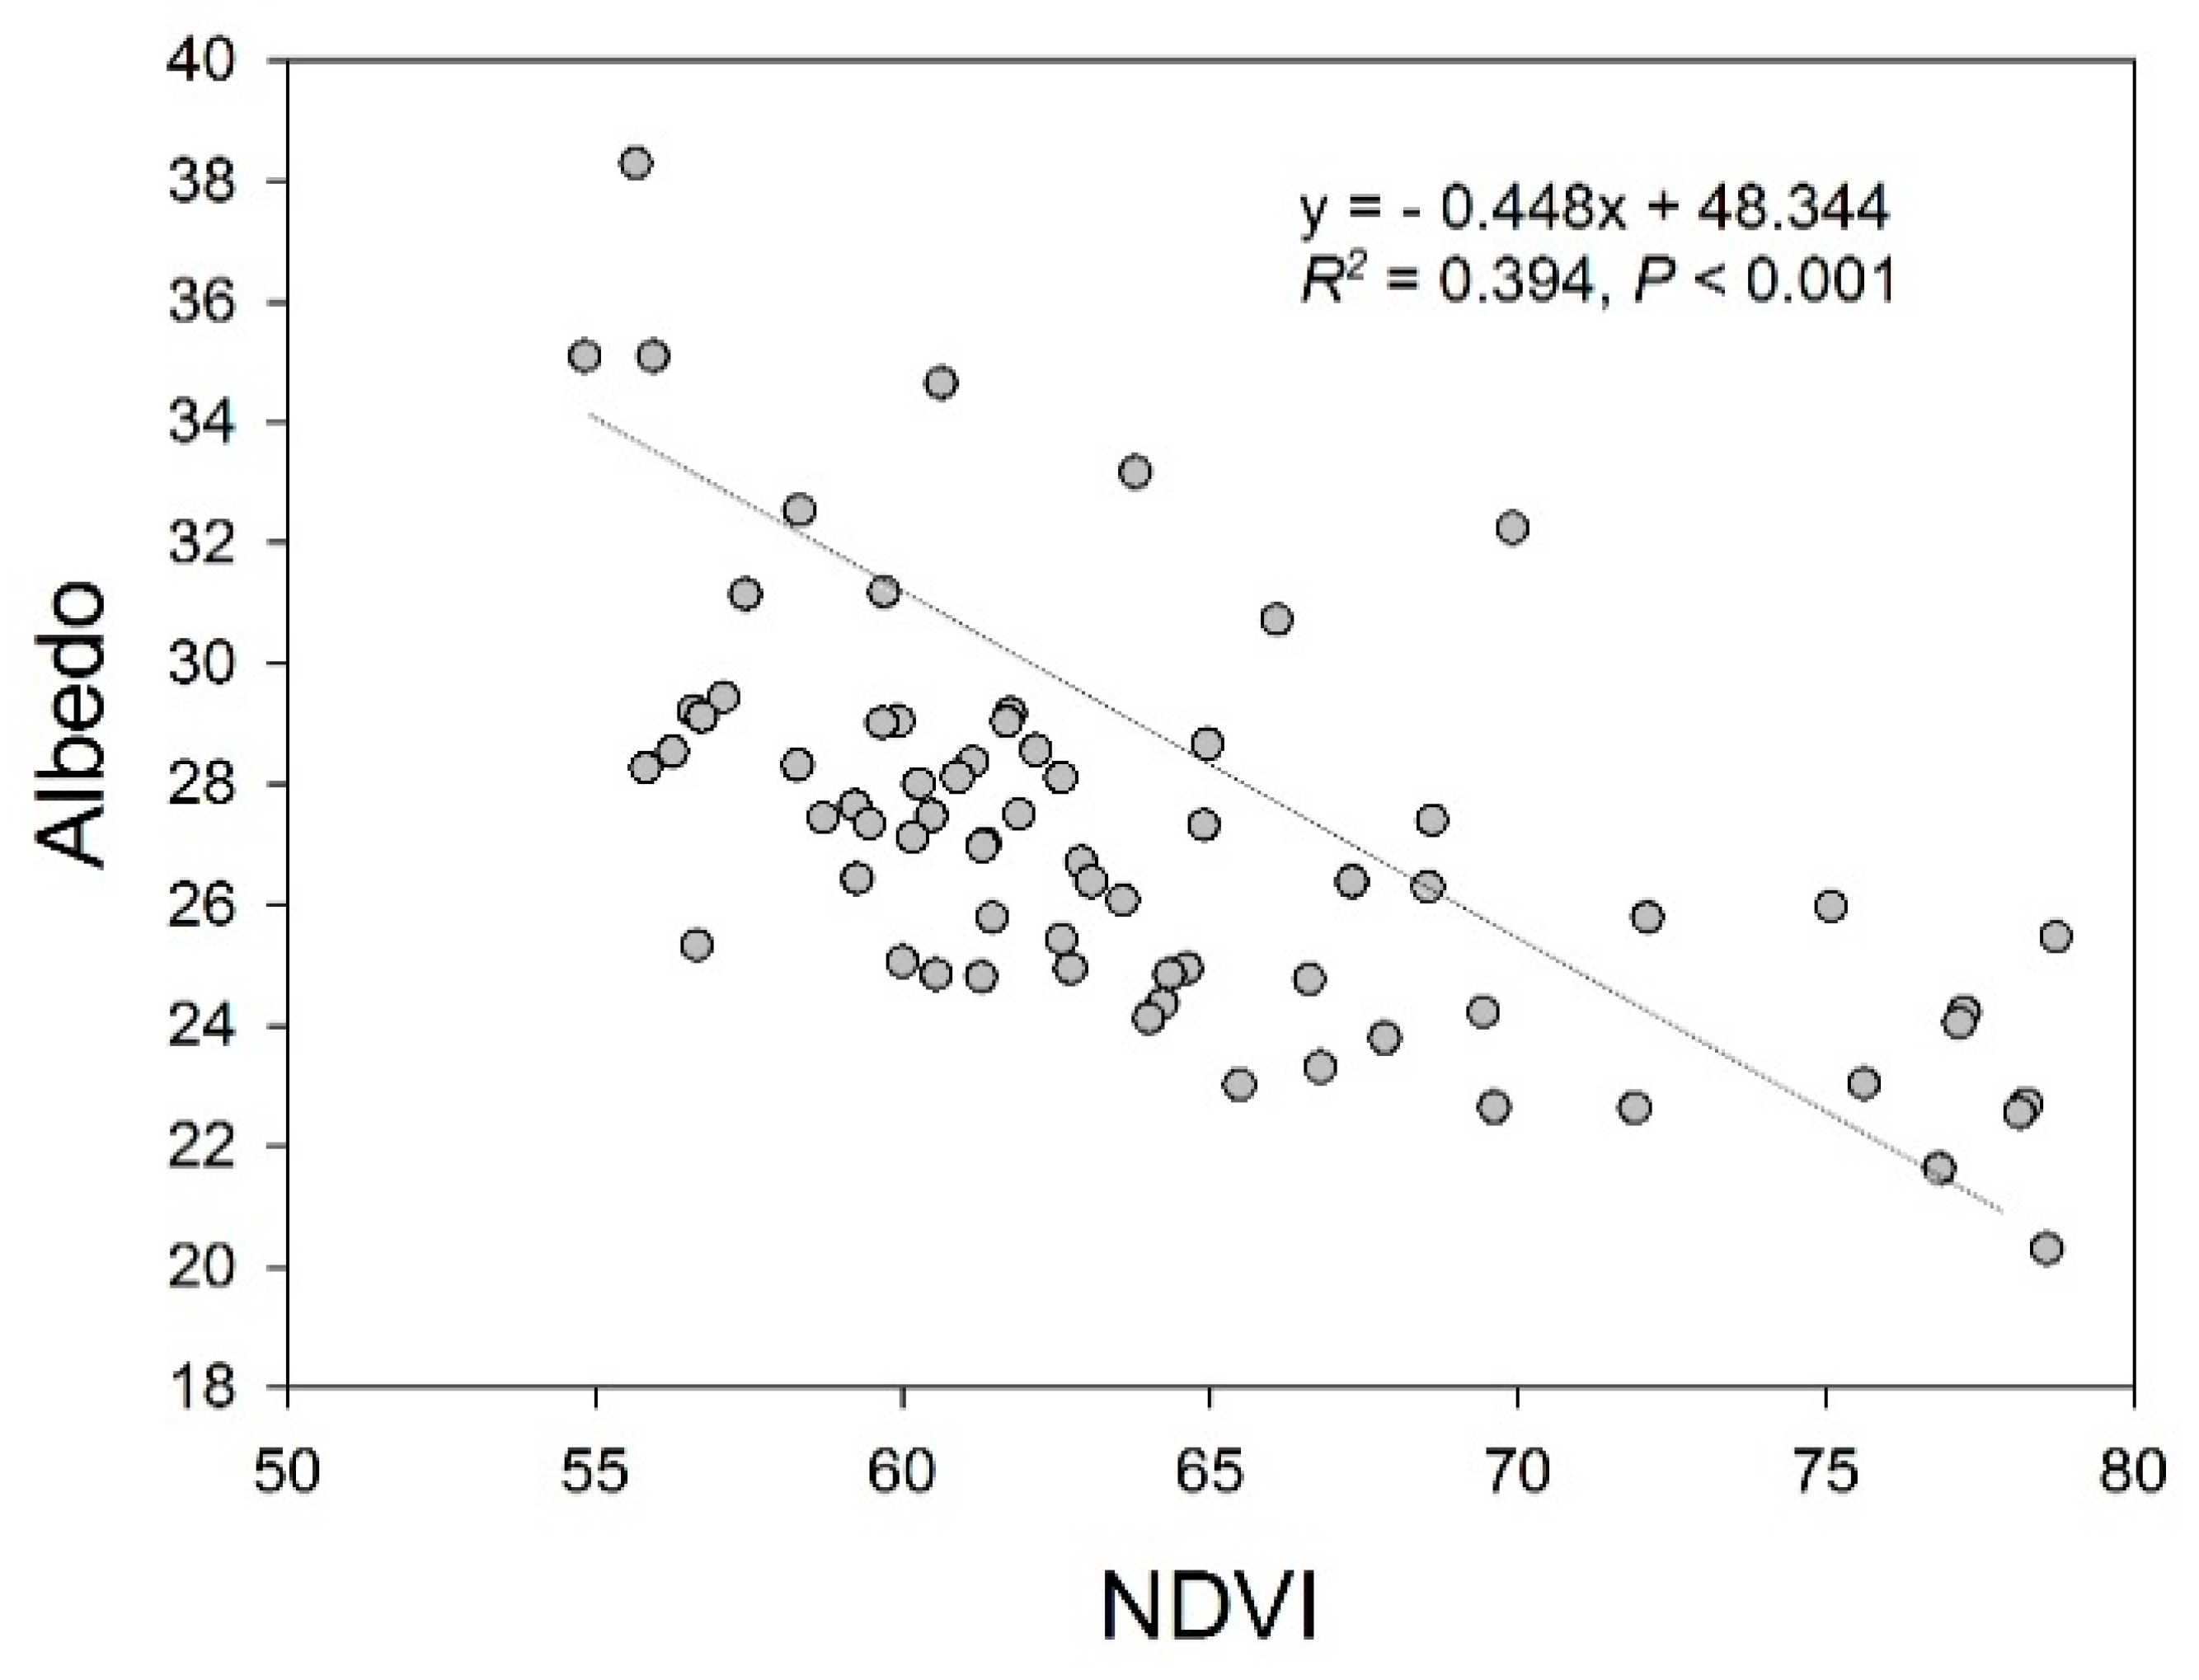
2.3.2. Desertification Difference Index (DDI)

The DDI was developed to quantify the degree of desertification based on remotely sensed data. The index combines the amount of vegetation with albedo, an important characteristic relevant to the surface radiation exchange [19,20]:
DDI = 2.234·NDVI − Albedo
where NDVI is the Normalized Difference Vegetation Index, which is often used as a proxy for vegetation cover or biomass. It is calculated as follows:
NDVI   =   N I R R E D N I R + R E D
where NIR and RED correspond to spectral reflectance in the near-infrared band and the red band of a multispectral satellite image, respectively.
Albedo used in DDI calculation is the land surface albedo derived from satellite data. We used for following empirical formulas developed for Landsat imagery [21]:
Albedo (TM) = 0.356·ρ1 + 0.130·ρ3 + 0.373·ρ4 + 0.085·ρ5 + 0.072·ρ7 − 0.0018
Albedo (OLI) = 0.356·ρ2 + 0.130·ρ4 + 0.373·ρ5 + 0.085·ρ6 + 0.072·ρ7 − 0.0018
where ρ1, ρ2, ρ3, ρ4, ρ5, ρ6, ρ7 are spectral reflectance of corresponding Landsat TM and OLI spectral bands.
The range of NDVI and Albedo was normalized to 0–100:
N = [(NDVI − NDVImin)/(NDVImax − NDVImin)] × 100
A = [(Albedo − Albedomin)/(Albedomax − Albedomin)] × 100
To investigate the transformation of desertification in two-dimensional feature space constituted by Albedo and NDVI, the scatter diagram of Albedo-NDVI feature space is constructed (Figure 2a), and Zeng et al. [20] summarized the all situation of desertification to Figure 2b. In Albedo-NDVI feature space, Albedo is not only a function of vegetation coverage but also a function of soil moisture content. In Figure 2b, point A represents dry bare soil, point B represents wet bare soil, point C represents a high vegetation covered area with low soil moisture content, point D represents high vegetation covered area, and the soil moisture content is high [20].
To obtain the quantitative relationship between Albedo and NDVI under different desertification, the statistical regression analysis was carried out by using the Albedo and NDVI values of the 71 field samples, and various degrees of desertification can be found in these samples. The results show that there is a significant negative linear relationship between Albedo and NDVI (Figure 3):
Albedo = −0.44762 NDVI + 48.344
According to Verstraete and Pinty’s study [22], if the Albedo-NDVI feature space is divided on the vertical direction of desertification change trend, different desertification land can be separated effectively, and the desertification can be expressed by a binary linear equation:
DDI = a·NDVI − Albedo
where DDI is Desertification difference index, a is the reciprocal of the slope in the equation, so in this study the a is 2.234.
The accuracy of obtained DDI was compared with the other 9 desertification monitoring indices, it was verified by field measured vegetation coverage data through correlation analysis (Table 1).

2.3.3. Quantification of Ecosystem Services in the Mu Us Desert

Soil Conservation (SC) was assessed as the difference between potential and actual soil losses calculated using the Revised Universal Soil Loss Equation (RUSLE) as follows [23]:
Ap = R·K·LS
where Ap is the potential soil loss (t/ha·y); R is the rainfall erosivity factor (MJ·mm/ha·h·yr):
R   =   i = 1 12 [ 1.735 × 10 ( 1.5 l g P i 2 P 0.8188 ) ]
where P is annual precipitation (mm); Pi is i month preipitation (mm).
K is the soil erodibility factor (t·ha·h/ha·MJ·mm):
K   =   { 0.2 + 0.3 e x p [ 0.0256 S A N ( 1 S I L 100 ) ] } ( S I L C L A + S I L ) 0.3 ( 1 0.25 C C + e x p ( 3.72 2.95 C ) ) ( 1 0.7 S N S N e x p ( 5.51 + 22.9 S N ) )
where SAN, SIL, CLA and C is percentage content (%) of sand (0.05~2 mm), silt (0.002~0.05 mm), clay (<0.002 mm) and organic carbon in soil; SN = 1 − SAN/100.
LS is the topographic factor:
L   =   ( λ 22.1 ) α
S   = { 10.8 sin θ + 0.03 θ < 9 ° 16.8 sin θ 0.50 9 ° θ < 14 ° 21.91 sin θ 0.96 θ 14 °
α = β/(1 + β)
β   =   ( sin θ 0.0896 ) / ( 3.0 sin θ 0.8 + 0.56 )
where L is slope length factor; λ is horizontal slope length; S is slope factor; θ is slope extract from DEM; α is slope length index; β is the ratio of rill erosion to surface erosion.
Ar is the actual soil loss (t/ha·y):
Ar = R·K·LS·C·P
where C is the vegetation cover and management factor:
C   =   { 1 0 f c < 0.1 % 0.6508 0.3436 lg ( f c ) 0.1 % f c < 78.3 % 21.91 sin θ 0.96 f c 78.3 % f c   = N D V I N D V I m i n N D V I m a x + N D V I m i n
where fc is vegetation coverage (%); P is the conservation practices factor, refers to the ratio of soil loss of sloping land under specific soil conservation measures to soil loss with no soil conservation measures, which reflects the inhibition of soil erosion.
Soil conservation (Ac) can be estimated as follows:
Ac = Ap − Ar = R·K·LS·(1 − C·P)

Water Retention (WR)

Water retention was estimated using the water yield sub model of the InVEST model [24], the equation is:
WR   =   Min ( 1 ,   249 V e l o c i t y ) · Min ( 1 ,   0.3 TI ) · Min ( 1 ,   K s a t 300 ) · WY
where Velocity is the flow coefficient, TI is the topographic index extract from DEM, Ksat is the soil saturated hydraulic conductivity, and WY is the water yield, which is defined as the amount of water calculated using the InVEST model. The formula for the water yield model is based on the Budyko curve and the annual average precipitation [25]:
WY x j   =   ( 1 A E T x j P x ) · P x
where WYxj is the annual water yield at pixel x of land cover type j, AETxj is the annual actual evapotranspiration for pixel x with land cover j, Px is the annual precipitation for pixel x, AETxj/Px is based on the expression of the Budyko curve given as:
A E T x j P x   =   1   +   P E T x j P x     [ 1 + ( P E T x j P x ) ω ] 1 ω
where PETxj is the potential evapotranspiration for pixel x with land cover j, w is a non-physical parameter that characterizes the natural climatic-soil properties, which is defined as:
ω x   =   Z · A W C x P x   +   1.25
where AWCx is the volumetric (mm) plant available water content at pixel x, which is estimated using soil texture, soil depth, and root depth of vegetation, Z is the seasonal rainfall factor known as Zhang coefficient, which represents annual precipitation distribution and can be any real number in the range from 1 to 30. In our study, area, we set Z to 7, according to the InVEST User’s Guide.

Net Primary Productivity (NPP)

We used the CASA model to estimate NPP [26] based on the intercepted photosynthetically active radiation (IPAR) and light utilization efficiency (ε) as:
NPP ( x ,   t )   =   IPAR ( x ,   t ) · ε ( x ,   t ) IPAR ( x ,   t )   =   SOL ( x ,   t ) · FPAR ( x ,   t ) · 0.5 FPAR ( x ,   t )   =   N D V I ( x ,   t ) N D V I i ,   m i n N D V I i ,   m a x N D V I i ,   m i n ( FPAR m a x FPAR m i n )   +   FPAR m i n
where t is time, and x is the grid cell; SOL(x, t) is the total solar radiation (gC·m−2·month−1) in t month at pixel x; FPAR(x, t) is the absorption ratio of the vegetation layer to the incident photosynthetic effective radiation; the values of FPARmax and FPARmin were independent of the vegetation types, which were 0.001 and 0.95, respectively.
ε(x, t) = Tε1(x, t)·Tε2(x, t)·Wε(x, t)·εmax
where Tε1(x, t) and Tε2(x, t) indicate the stress effects of low temperature and high temperature on the utilization of light energy; Wε(x, t) is the coefficient of water stress, reflecting the effect of water conditions; εmax is the maximum utilization rate of the light energy under the optimum conditions.

Crop Productivity (CP) and Livestock Productivity (LP)

CP and LP were calculated from statistical data. We obtained the crop production and livestock production per district and per county (banner) from the 2015 statistical yearbook and determined the spatial distribution of CP and LP in the study area. For statistical purposes we converted all large livestocks into sheep units.
From the 2015 statistical yearbook, only a specific value of CP and LP is obtained in each county, unable to get the pixel size of the spatial distribution in the entire area, so these two services are limited to the county scale. For the five ecosystem services to be analyzed together, we extend raster layers of DDI, SC, WR, and NPP to county scales, that is, calculate the mean value of all pixels in each county as the value of ecosystem service. So, we show the values of ecosystem services on a county scale on the map. Spatial patterns of DDI and ecosystem services were analyzed for the period of 1986–2015 in each of the 11 districts and counties (banners) of the Mu Us Desert using ArcGIS 10.0. Pearson correlation analysis was conducted using SPSS 21 to determine the relationship between ecosystem services and the impact of desertification (2015) on ecosystem services [27], and the differences of trends in climate change between meteorological stations in Mu Us Desert for 1985–2013.

3. Results

3.1. Climate Change in Mu Us Desert from 1985 to 2013

The annual precipitation and mean annual temperature in Mu Us Desert monitored by each meteorological station are fluctuating in 1985–2013 (Figure 4). Whether annual precipitation or mean annual temperature, the trends of change in each meteorological station are consistent (Table 2 and Table 3).

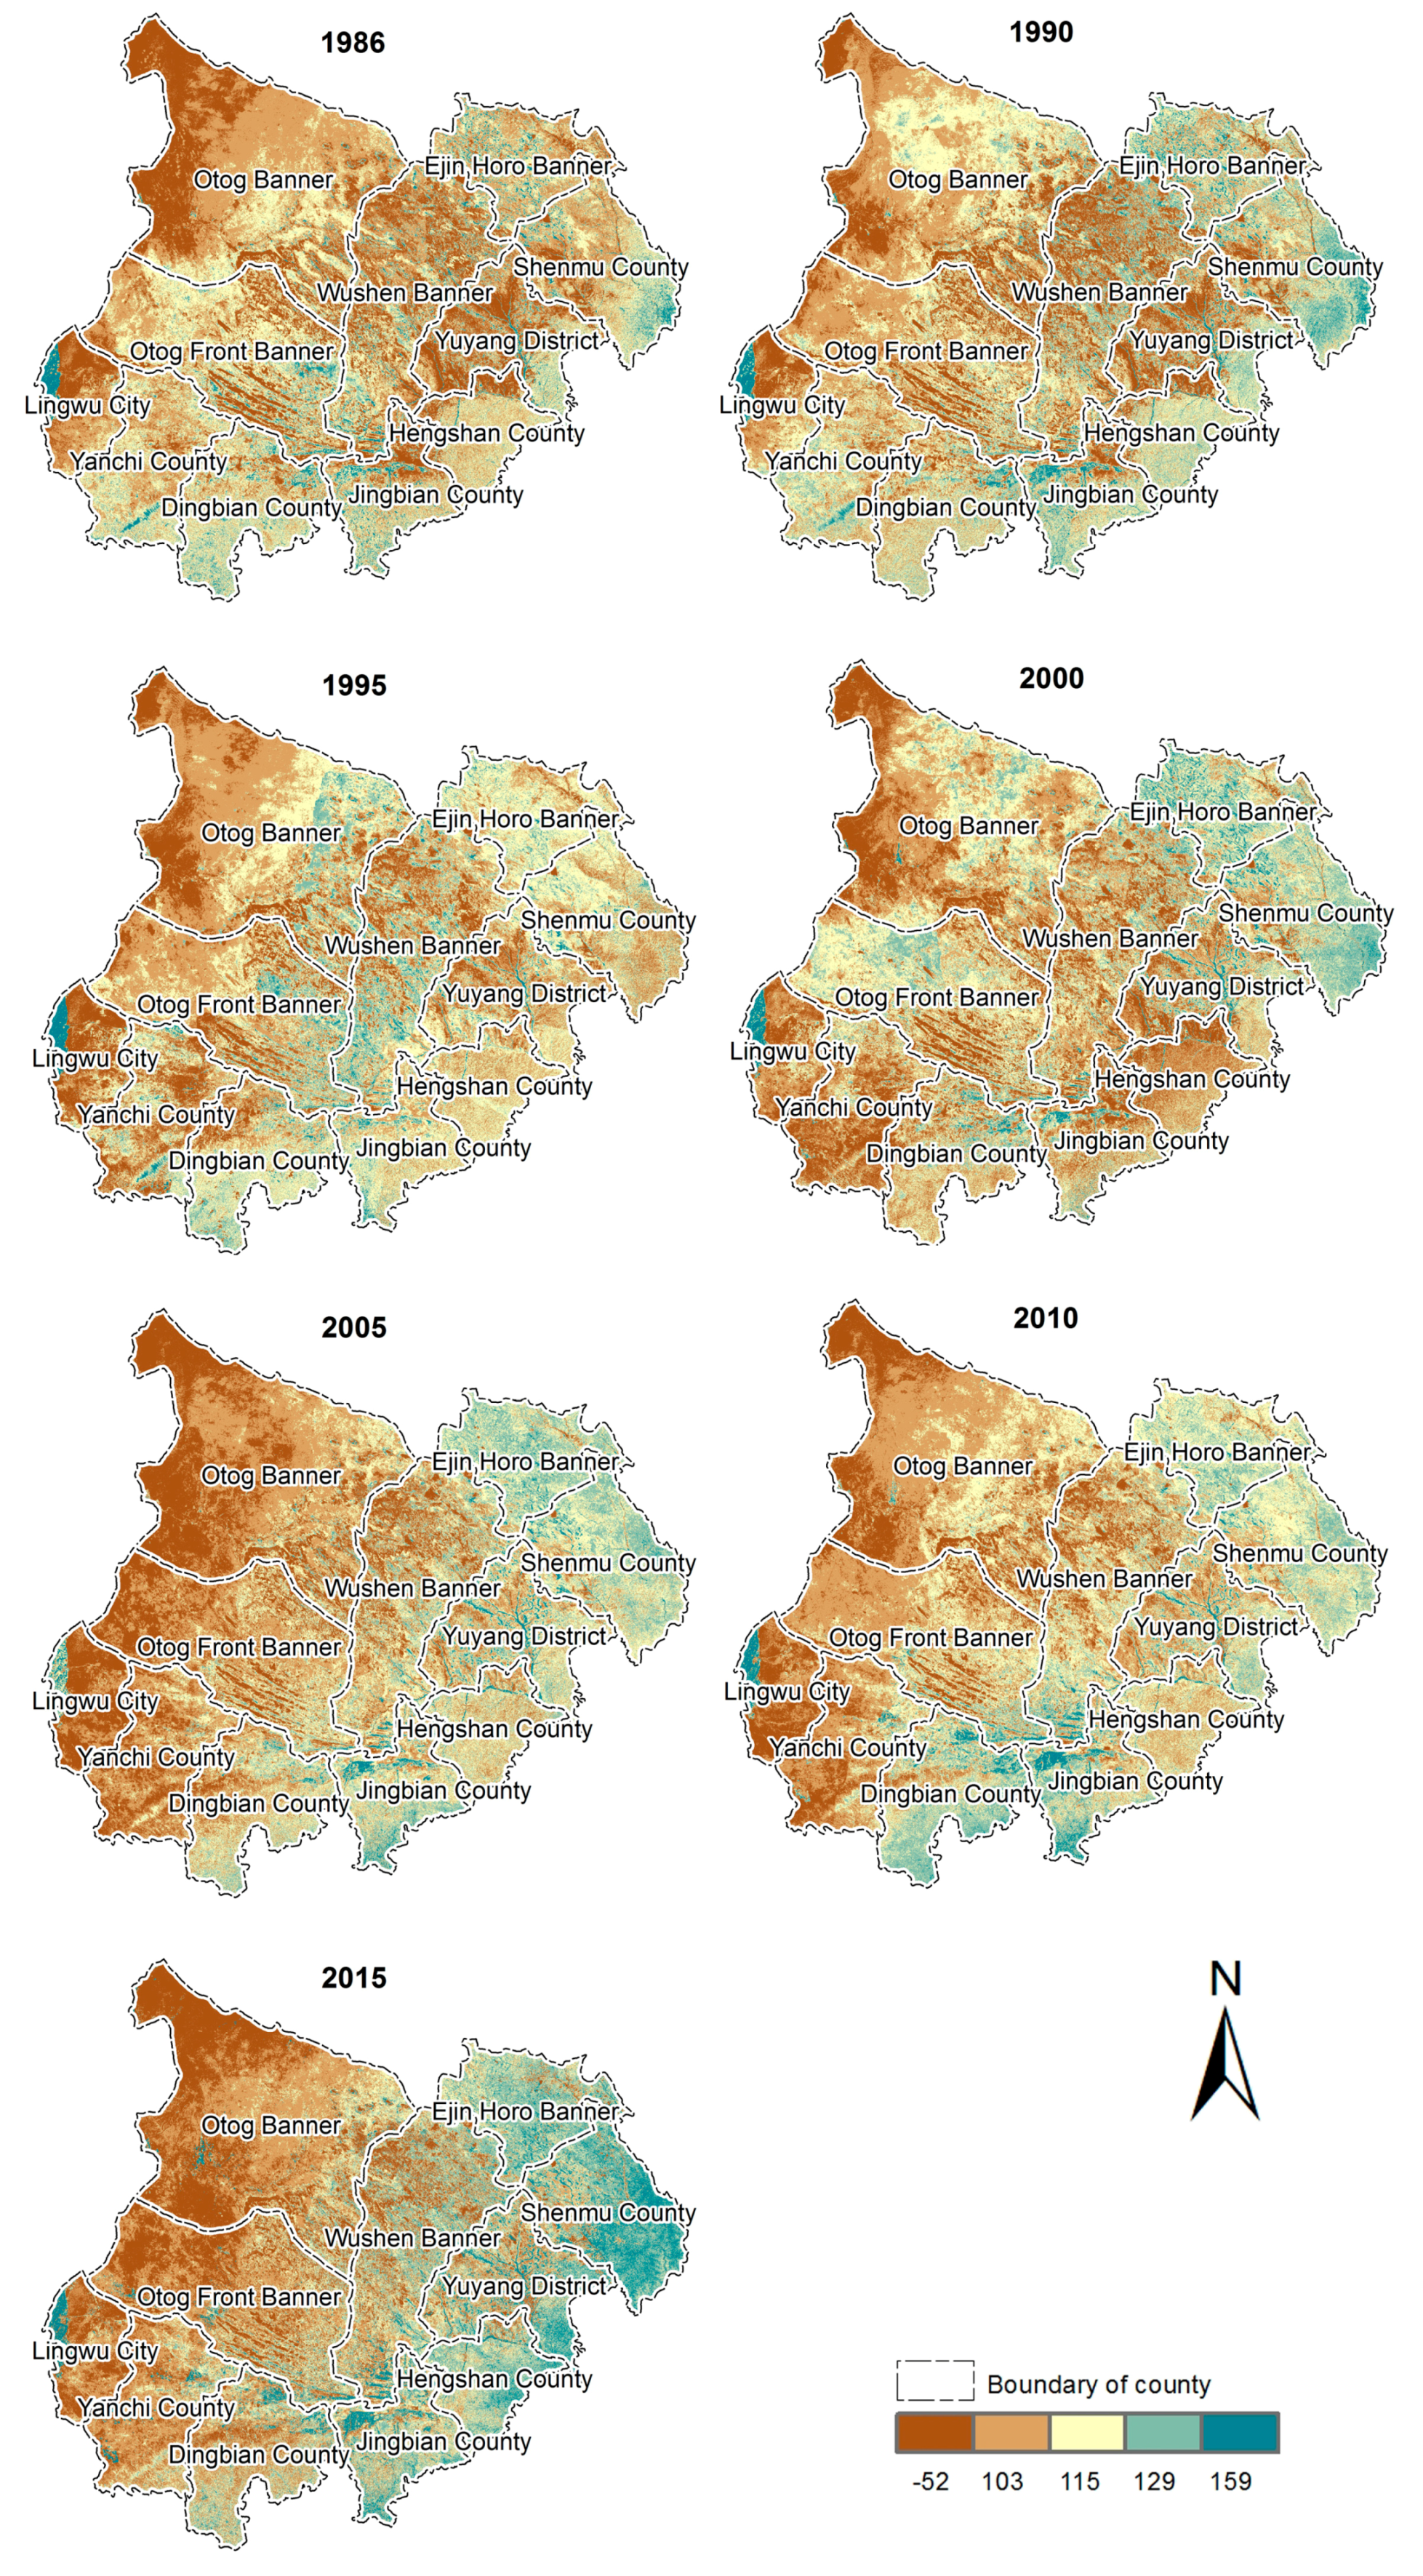
3.2. Dynamic of Spatial Pattern of Desertification from 1986 to 2015

As a whole, desertification reversed during the past 30 years in the center and the east of the Mu Us Desert, while it was exhibiting a growth and intensification in the western part of the region (Figure 5). Desertification decreased in two of the four banners of the Inner Mongolia Autonomous Region area, including the Ejin Horo banner and Wushen banner. The decreasing trend was relatively slow in the Wushen banner, and no change was observed in the Otog banner and Otog Front banner, where small-scale intensification and reversal can be still detected. The five counties (districts) of Shaanxi in the southeastern corner of the Mu Us Desert have exhibited gradual decrease in desertification since 1986. In Shenmu county, Yuyang district, Hengshan county and Jingbian county, the recovery is particularly remarkable. Since 2005, no significant desertification has been observed except for a minor increase in Dingbian county. The part of Mu Us Desert, which is in Ningxia Autonomous Region, first shows the increase in desertification followed by the reversed pattern. Desertification in Lingwu City and Yanchi County was the strongest in 2005 after which it exhibited the decline during the 2005–2015.

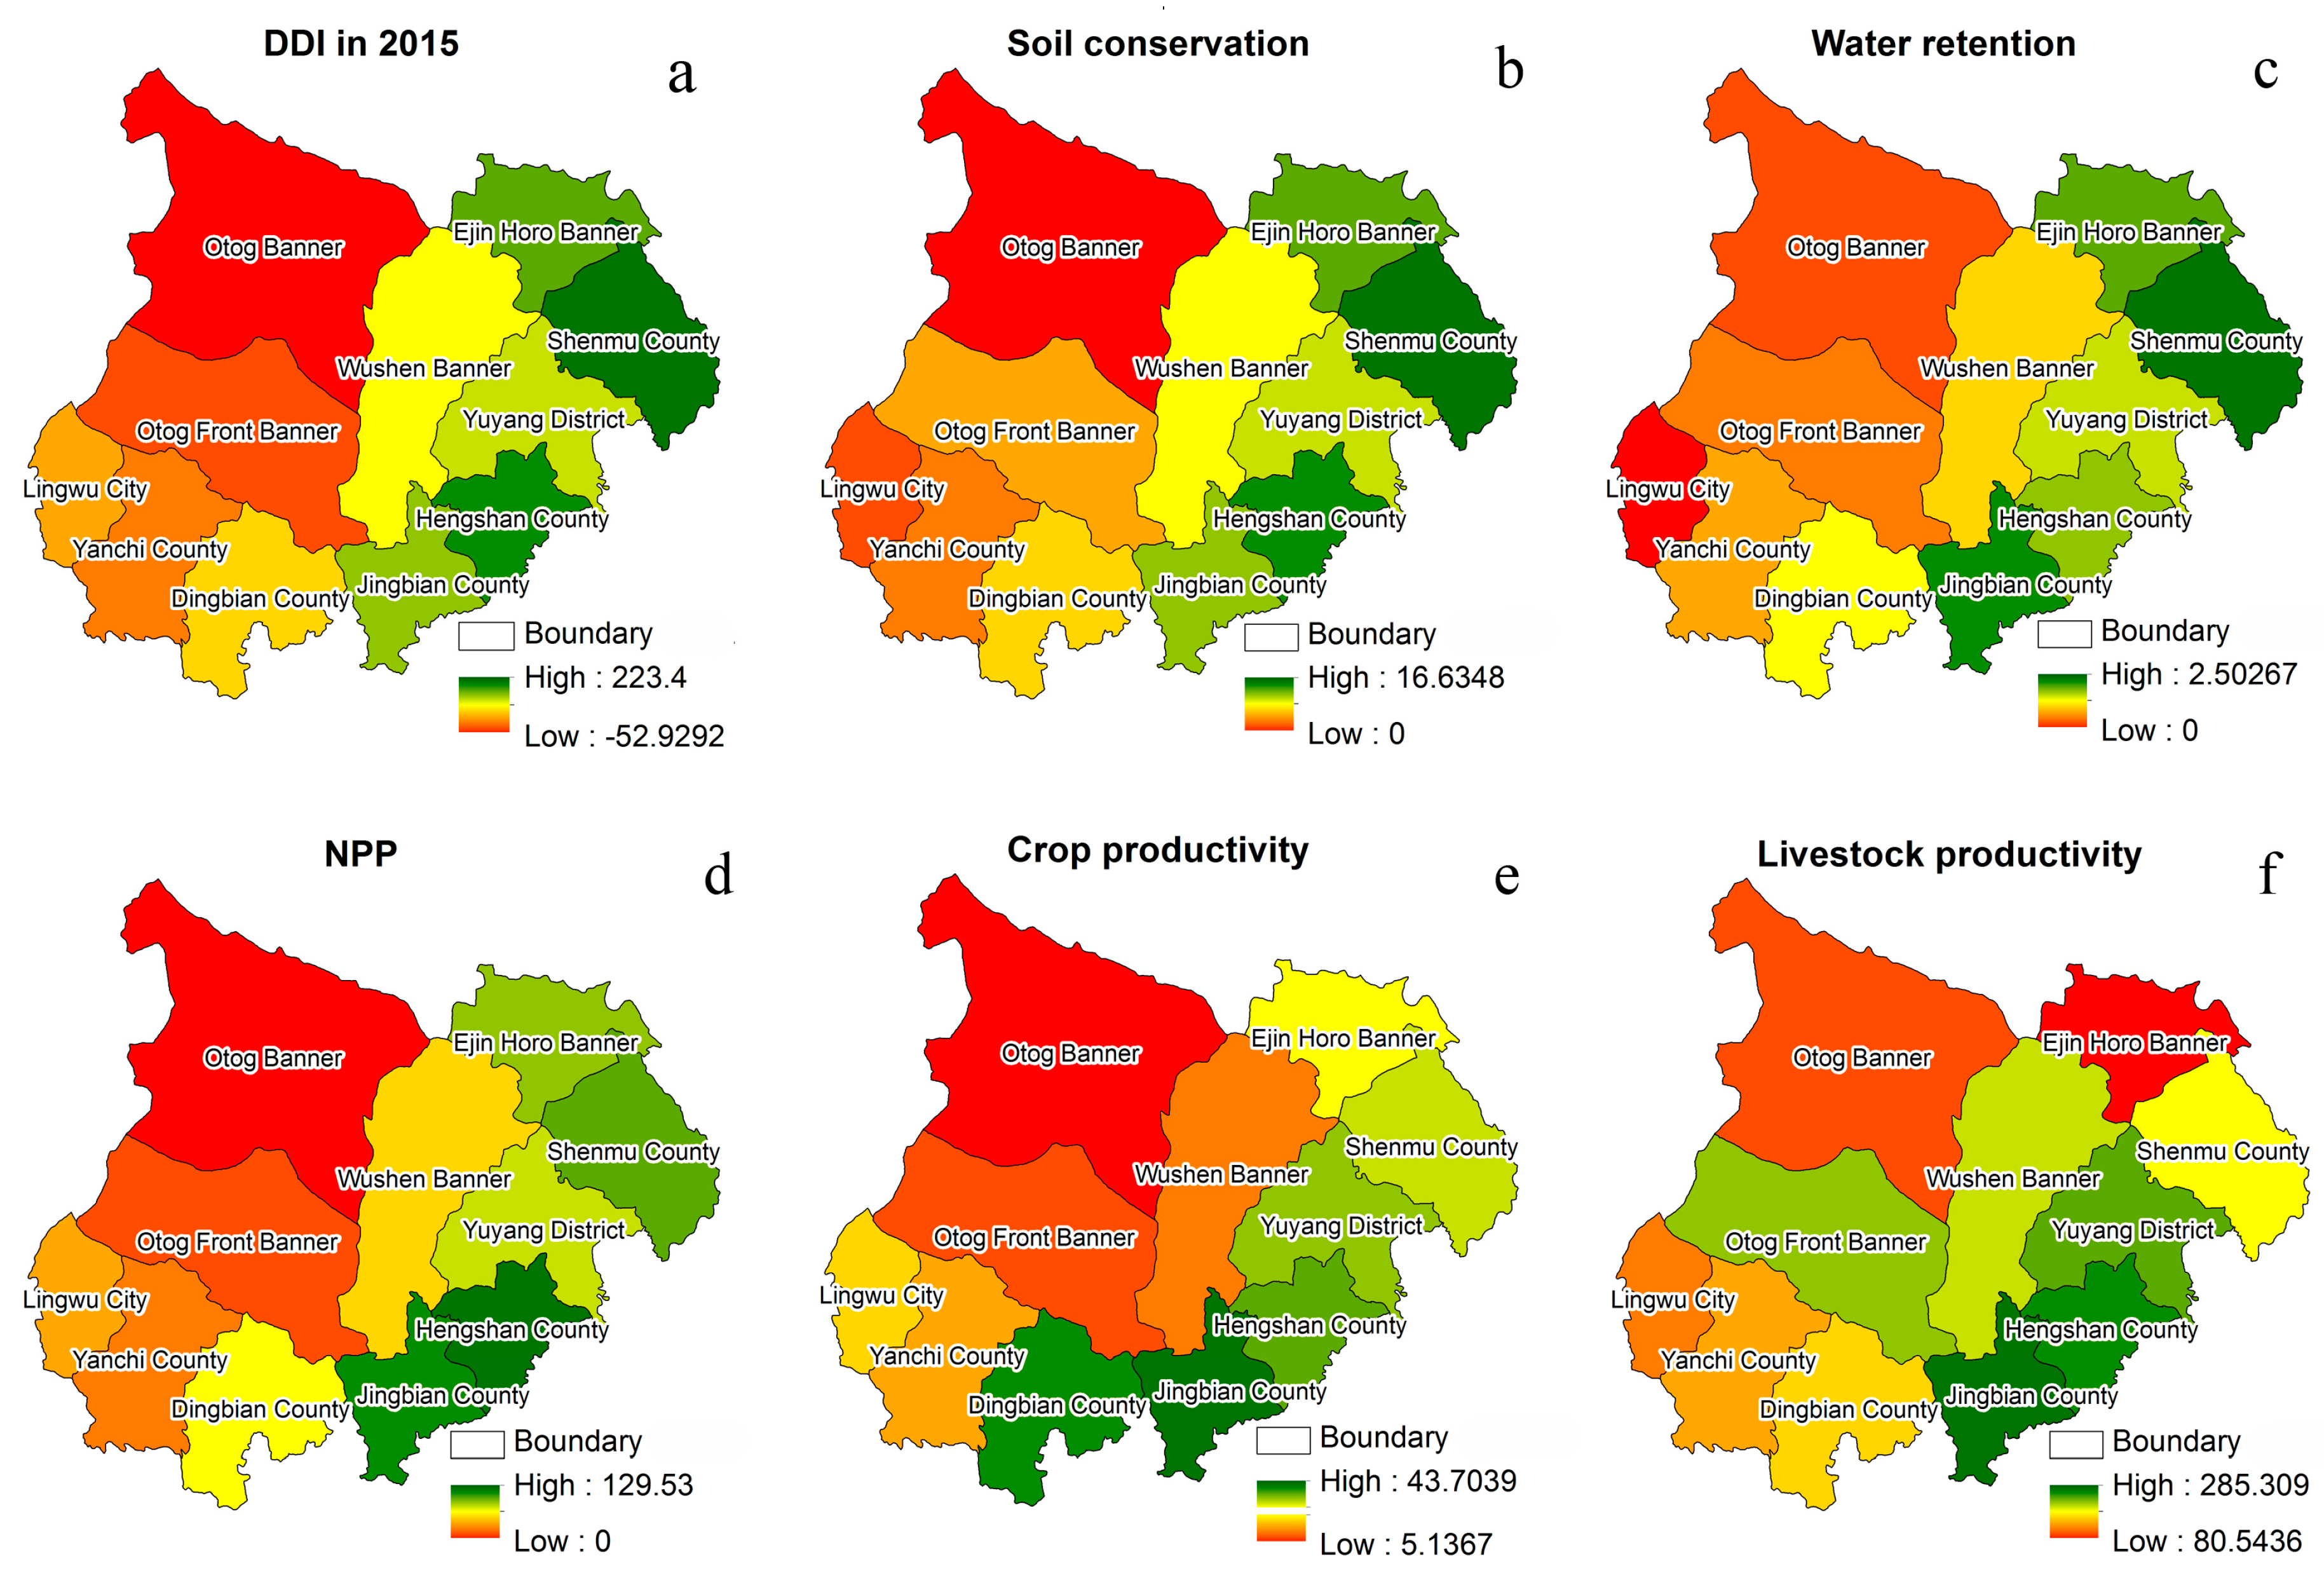
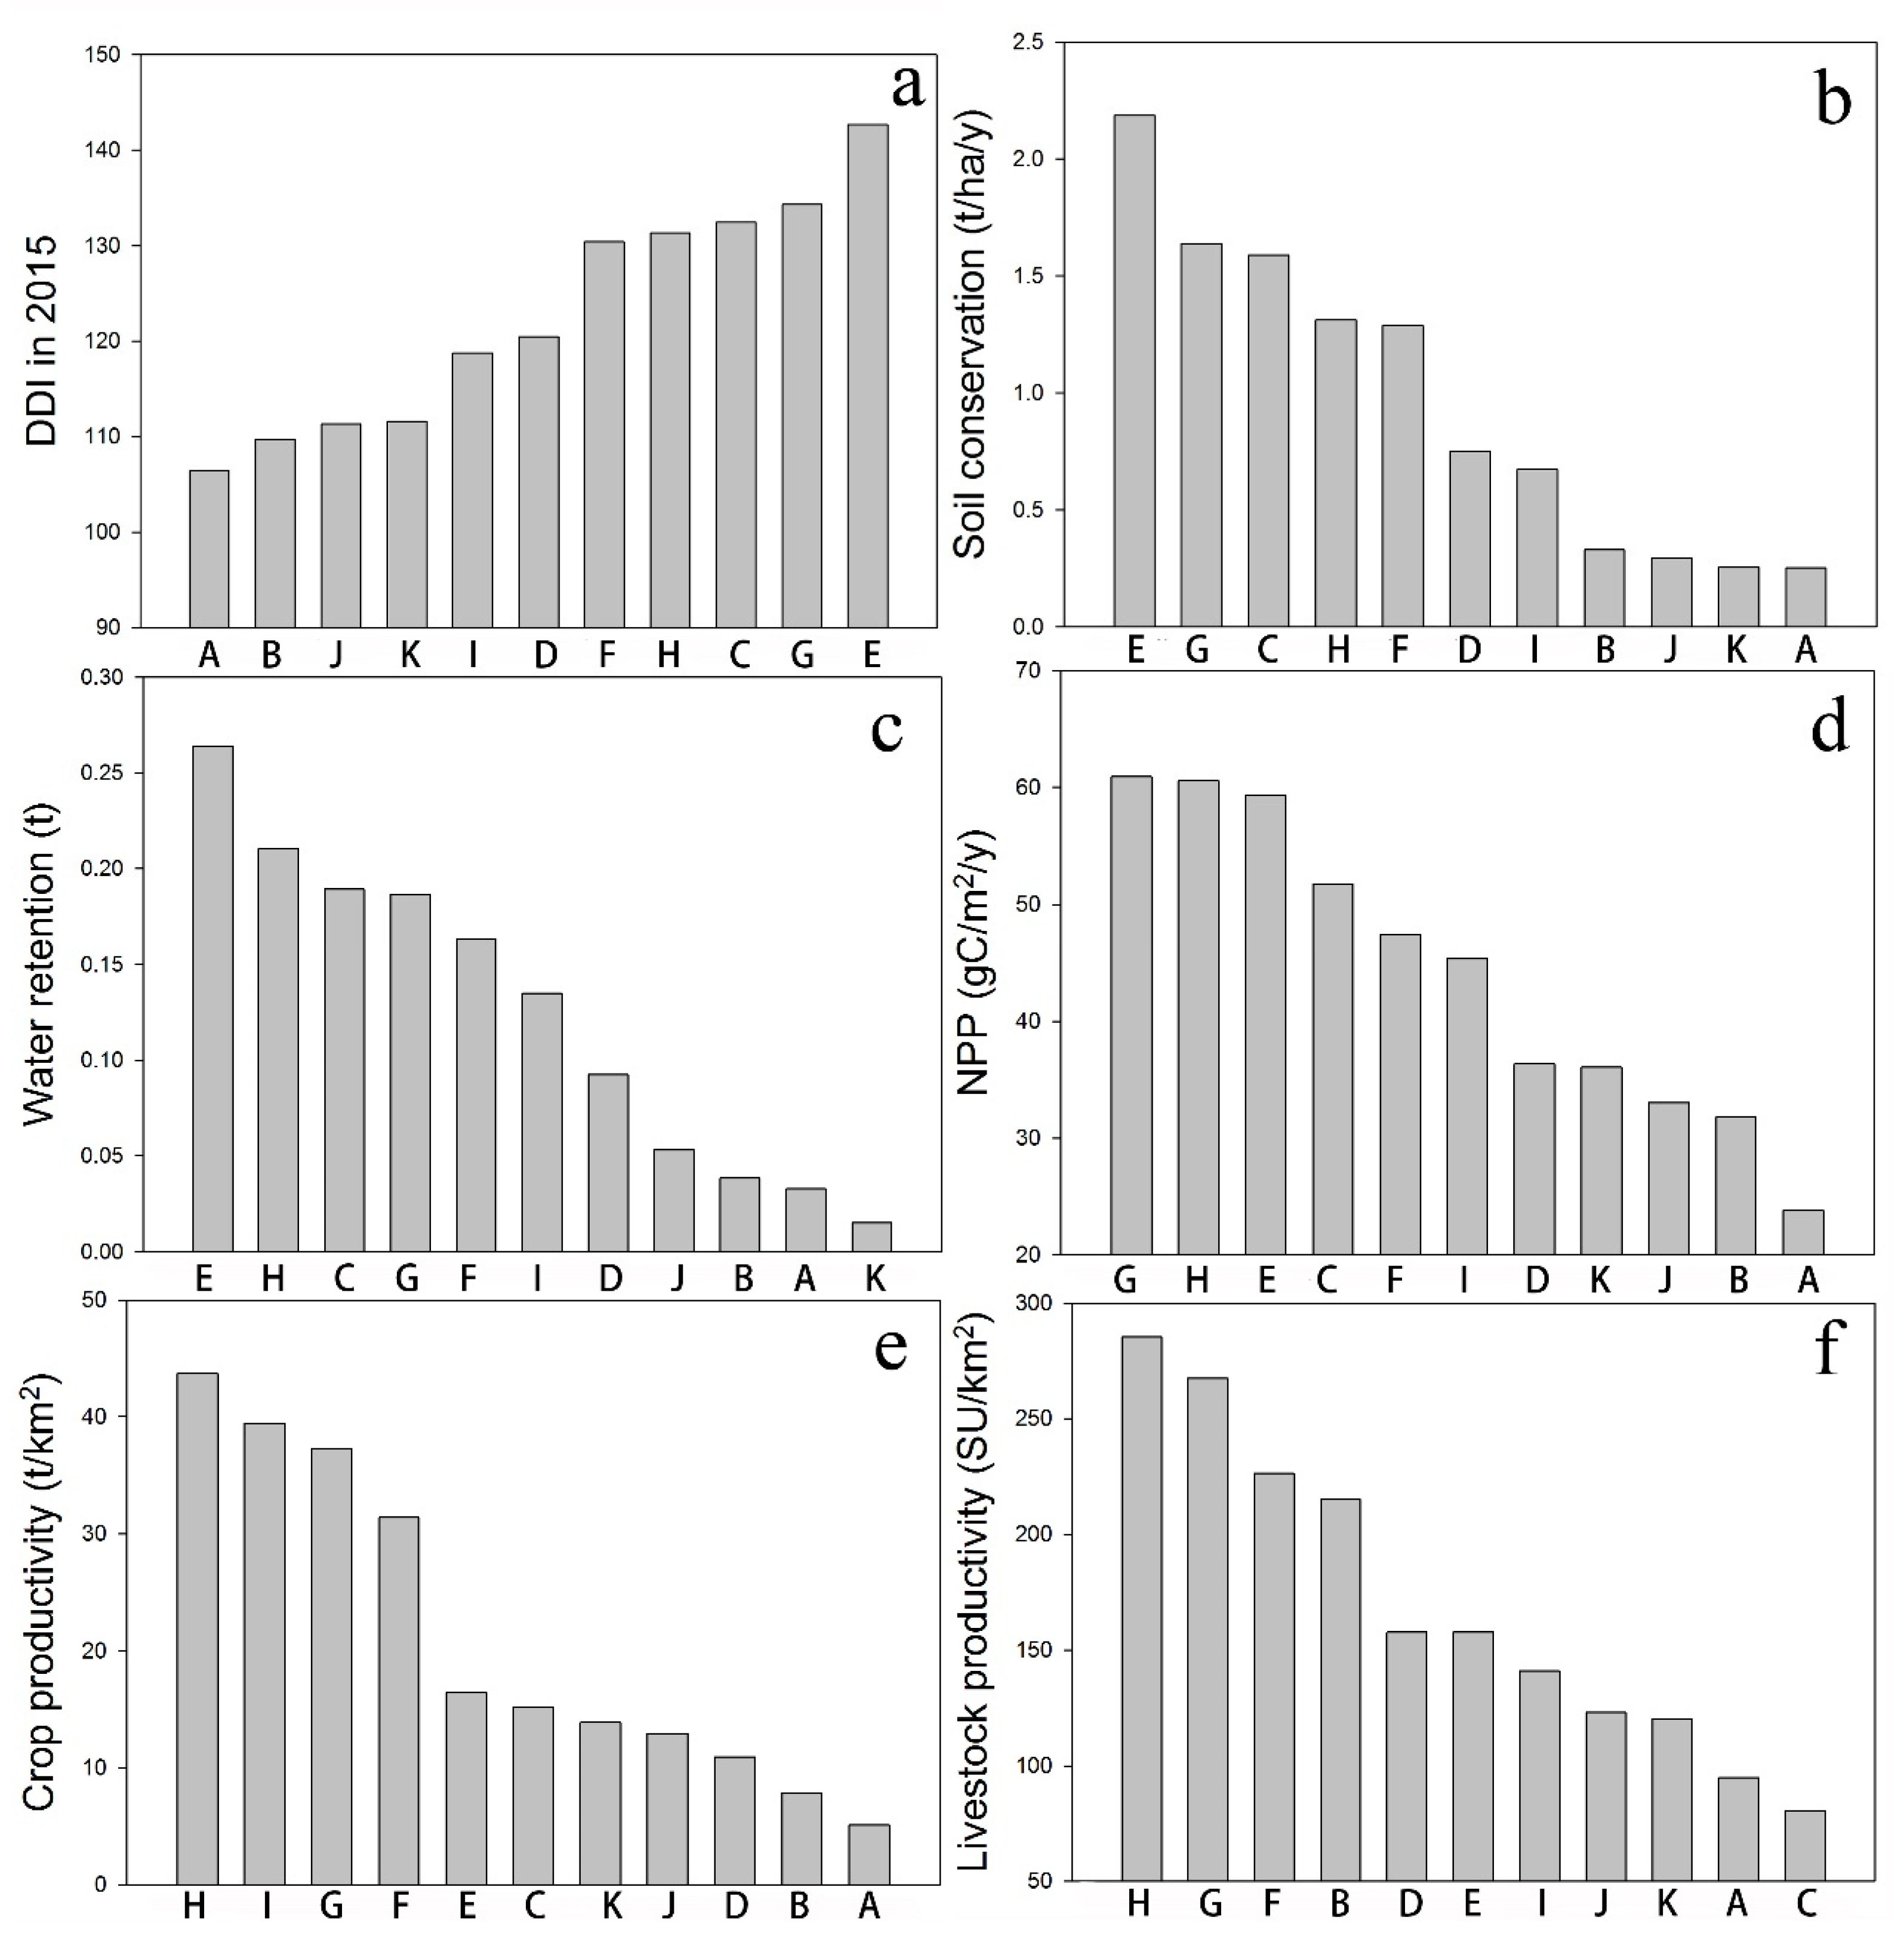
3.3. Spatial Pattern of Ecosystem Services

Except for LP (Figure 6f), spatial patterns of the other four ecosystem services are generally consistent with each other. SC, WR, NPP, and CP decrease gradually from the southeast to the northwest of the Mu Us Desert (Figure 6b–e). Among them, the highest value of SC is in Shenmu county and the lowest value is in Otog banner (Figure 7b). The highest value of WR is also in Shenmu county, but the lowest value is in Lingwu city (Figure 7c). Hengshan county has the highest NPP and the Otog banner is characterized by the high productivity (Figure 7d). The highest values of CP and LP are both in Jingbian county and lowest are in the Otog banner and Ejin Horo banner (Figure 7e,f).

3.4. Relationships between Ecosystem Services

Synergies among ecosystem services are clearly observed for regulating services SC, WR and NPP, provisioning services, CP, and LP, but only NPP and CP are correlated when the link between regulating and provisioning services is considered (Table 4). Relationships between other services are not significant.

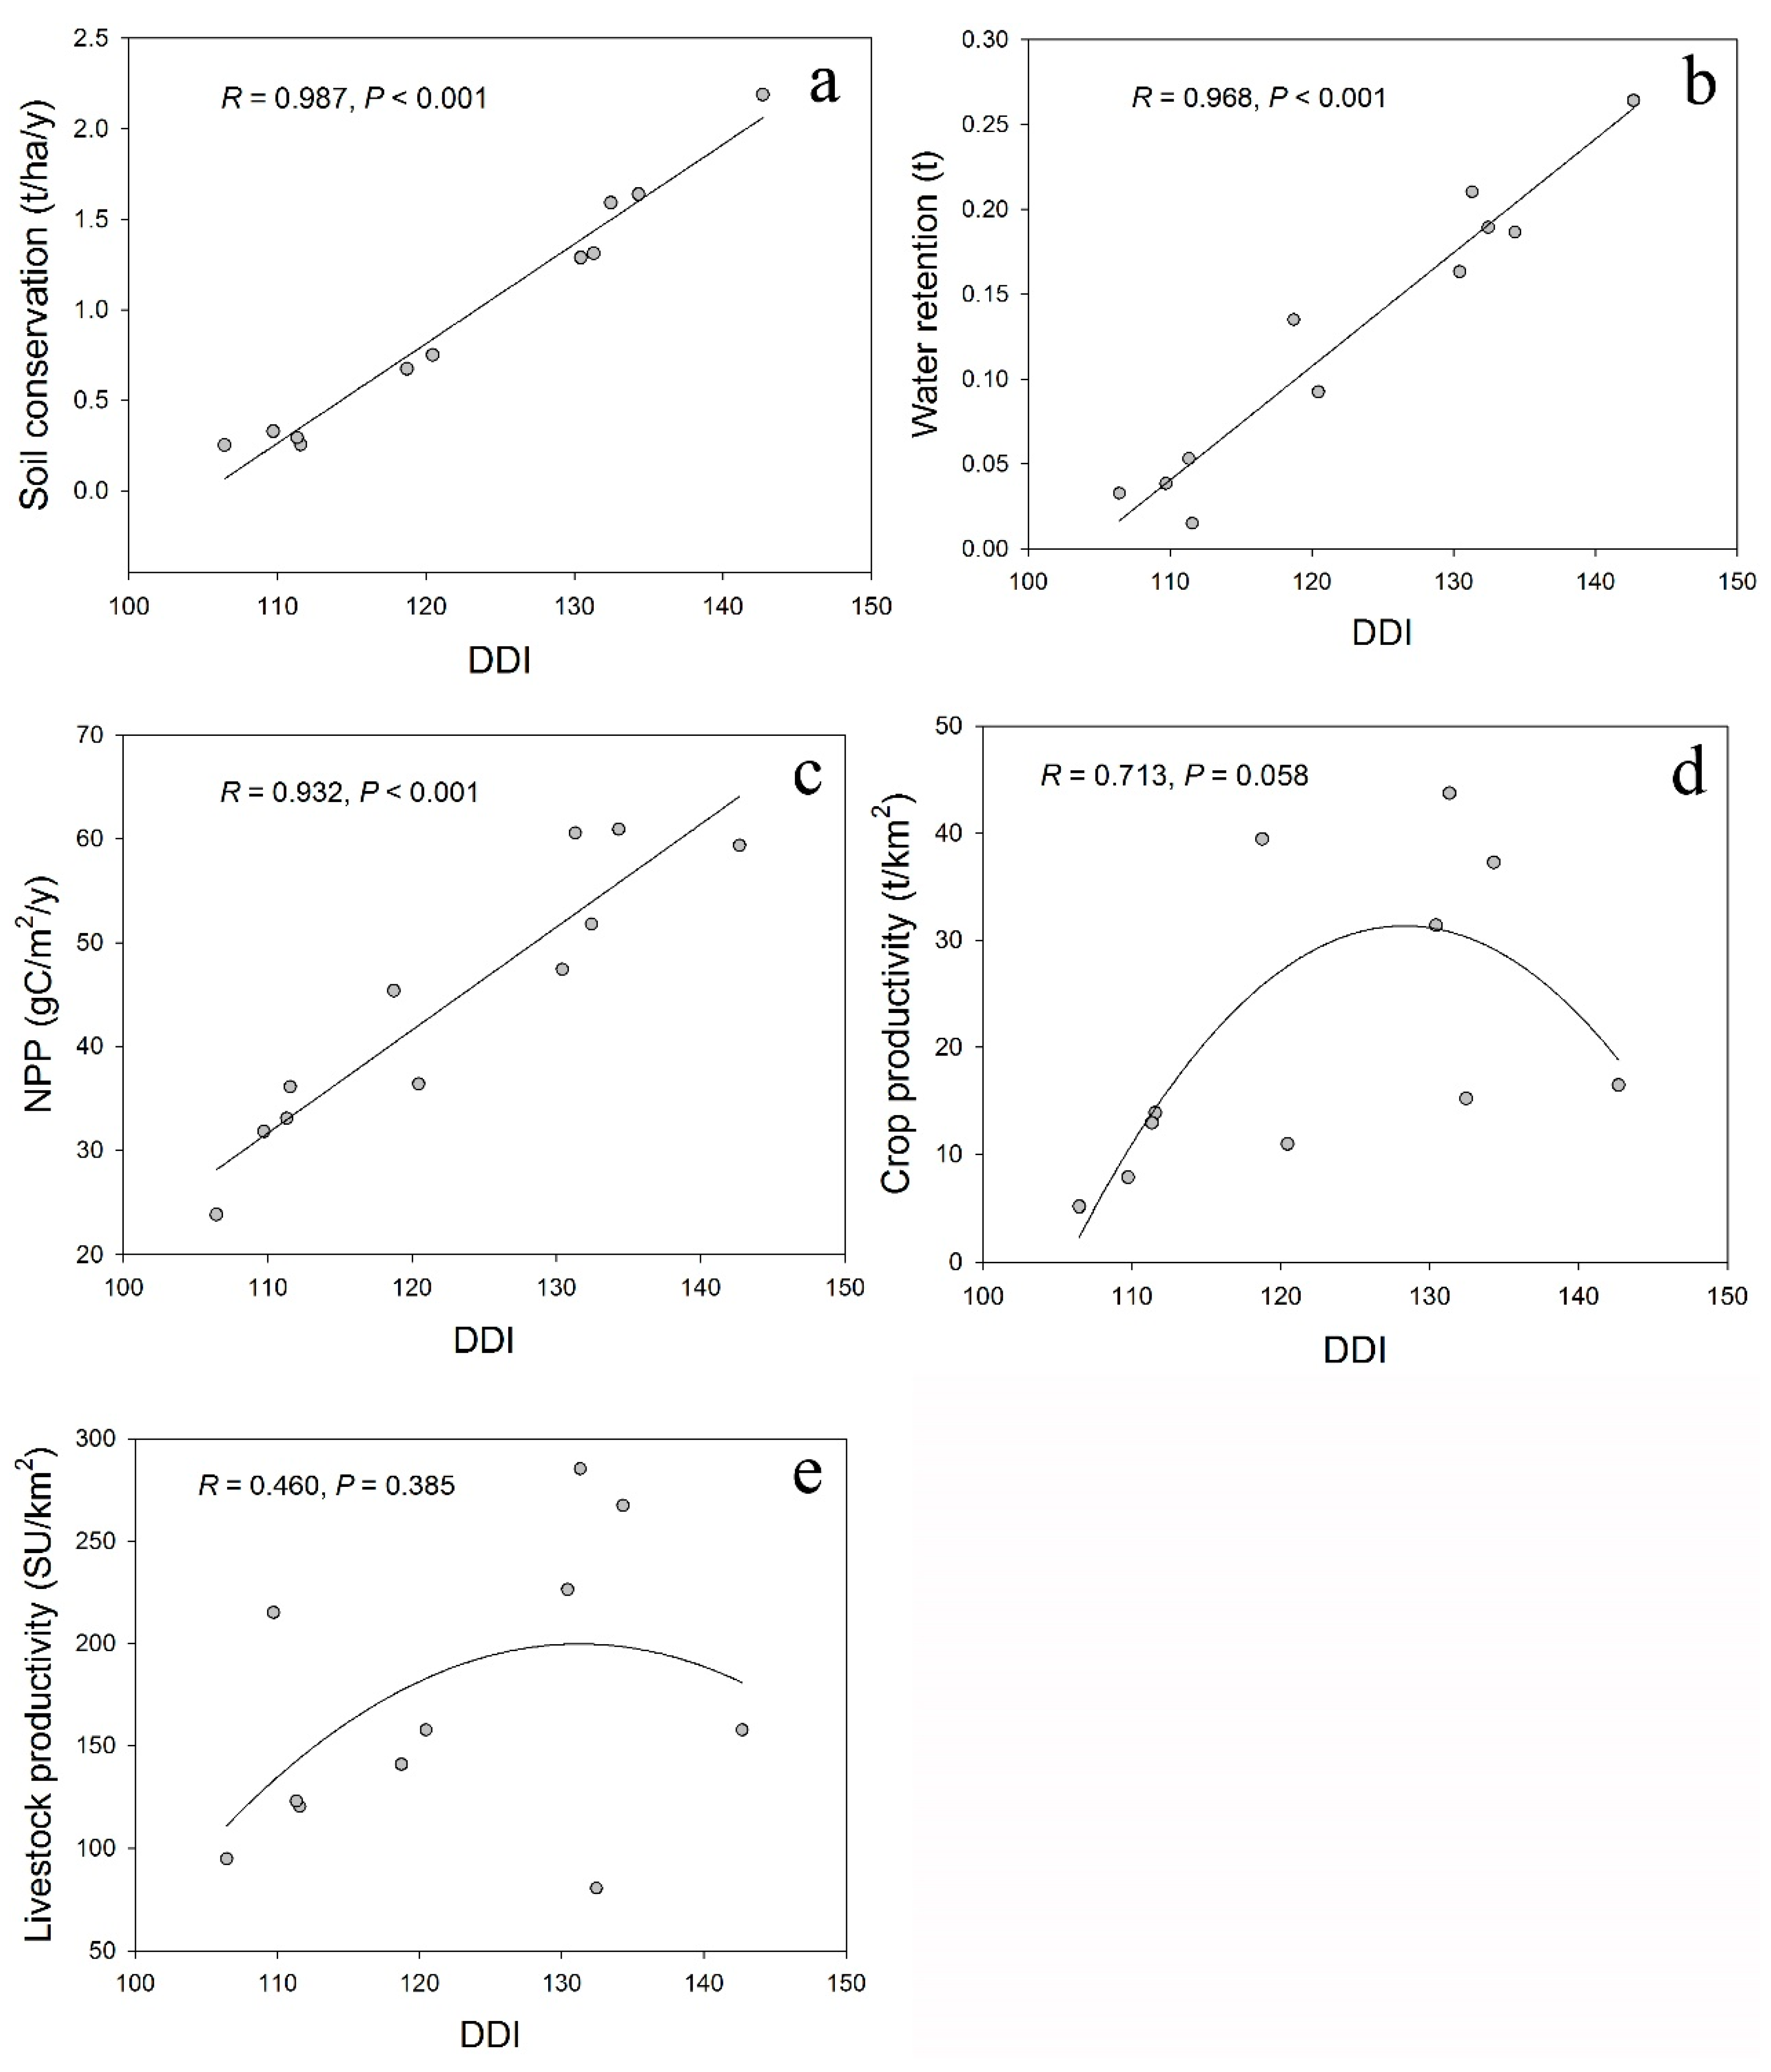
3.5. Effects of Desertification on Ecosystem Services

With the increase of DDI, the SC, WR, and NPP also increase significantly (Figure 8a–c). This suggest that all these ecosystem services improve when desertification decreases. CP and LP represented by non-significant unimodal curve with increasing DDI. CP and LP reached a maximum when DDI was approximately 131.32 (Figure 8d,e).

4. Discussion and Conclusions

4.1. Desertification Dynamics in 1986–2015

Numerous extensive studies on desertification pattern and dynamics in Mu Us Desert have been carried out, the results of these studies show that the main desertification in Mu Us Desert basically remained unchanged with the alternation of intensification and reversal, the eastern part of the desert is characterized by largely declining desertification. However, some individual localities in the western part of the region experienced significant desertification [28,29,30]. Our findings generally support those from previous studies of desertification patterns and dynamics in the Mu Us Desert. Desertification was not largely occurring in the region as a whole, despite some spatiotemporal heterogeneity and reversal trends, especially in the western part. Reversing trends were most obvious in Shaanxi Province. Desertification had been gradually decreasing since 1986, whereas no significant trends in desertification were observed from 2005 onward. The reversal and intensification of desertification in the Inner Mongolia Autonomous Region are both present since 1986. In Ningxia Autonomous Region, the first half of the study period is characterized by increasing desertification, which reached its peak in 2005. Desertification was then replaced by the opposite trend here (Figure 5).
Dynamics of desertification are driven by both geomorphic structure and climatic conditions [31], with contribution from human activities [32,33] and policies [18,34]. According to our results, climate change among the regional meteorological sites is highly consistent (Figure 4, Table 2 and Table 3), and if the climate is the dominant factor in the desertification change in the region, the trend of desertification among the three provinces/autonomous region should be the same, but the trend of desertification in the three provinces/autonomous region is quite different in this study, so climate factors in the Mu Us Desert are not likely to play a dominant role in the change of desertification patterns. We note a strong dependence of patterns of desertification dynamics on administrative divisions of this area. For example, in Shaanxi Province, where the Grain-for-Green Program (GFGP), which is the important component of development strategy of western frontiers of China, was introduced the earliest. It promptly yielded the desired outcome in the form of slowing desertification and ecosystem recovery here [35]. A series of ecological restoration projects have started, including the Double Rights and One System and Aerial Seeding Afforestation Project in Inner Mongolia Autonomous Region. Yet, the recovery of ecosystems did occur mostly because of different natural conditions and policy implementations. Thus, the coupling effect of anthropogenic factors and climate should explain most of the dynamics of desertification in this region during this study period at least. The driving factor of desertification trend may change from one period to another [36], but in this study, the driving factors have not been divided into a finer time scale, we therefore propose further in-depth analysis of drivers of desertification in the Mu Us Desert, which should be done in a follow-up study.

4.2. Relationships between Ecosystem Services

Relationships between different ecosystem services are often characterized as tradeoffs or synergies [37]. Previous studies have shown that synergy is often attributable to regulating, as well as provisioning services. The relationship between provisioning and regulating services has often the form of trade-offs as well [38,39,40]. Regulating services in this study include soil conservation, water retention, and net primary productivity (NPP). Provisioning services we studied include crop productivity and livestock productivity. The synergies between regulating services, such as soil conservation (SC), water retention (WR) and NPP, and between provisioning services, such as crop productivity (CP) and livestock productivity (LP) are strong, which is partly supported by our results (Table 4). Trade-offs between regulating services and provisioning services were not found by our study. So was the synergy trend.
SC, WR, and NPP are synergistically related to each other through vegetation cover. Higher NPP corresponds to dense vegetation cover [41], which in turn can reduce the wind speed while dense root systems of vegetation can enhance the ability of soil to resist erosion [42]. WR primarily depends on soil moisture content [8], and high NPP corresponds to better precipitation conditions. Plants in this region have high water use efficiency indicating that the regional soil has higher water holding capacity high [43,44]. Therefore, there is also a synergistic relationship between WR and NPP. In the region, the development of agriculture and livestock husbandry often depend on the quality of natural resources [45]. Higher NPP generally reflects better resource conditions. Consequently, the two provisioning services (CP and LP) are synergistic with three regulating services (SC, WR and NPP).

4.3. Impacts of Desertification on Ecosystem Services

Negative correlation between ecosystem services and desertification has been previously identified. Regulating services tend to decrease as desertification increases, while the relationship between desertification and other ecosystem services could exhibit non-linear patterns [17]. Our results provide additional support to those findings. Three regulating services examined in this study were positively correlated with DDI (Figure 8a–c) confirming the decline in those services with the intensification of desertification. The two provisioning services and DDI showed a hump-shaped relationship. Despite the lack of statistical significance of this relationship, it is interesting to note the potential of a decreasing trend in provisioning services after desertification passes some threshold and does not affect those services. Perhaps some other, unaccounted for in the study, factors could explain the decline of services in lieu of desertification (Figure 8d,e).
The explanation of the decline of three regulating services with the intensification of desertification is straightforward. With respect to desertification, the most basic functions of the ecosystem are soil and water conservation functions [17]. In the Mu Us Desert, the loss of vegetation cover triggers the loss of soil organic matter. This reduction has direct effects on soil structure by weakening soil aggregates. Such a condition accelerates the disaggregation of those particles by raindrops and wind erosion. Land cultivation and heavy grazing can further impact soil conditions. The combined effects of these soil erosion processes can be summarized as follows. First, in sandy substrates soil nutrients, such as nitrogen, phosphorus, and potassium, are eroded fast and soil fertility decreases [14,15,46]. Second, eroded soil becomes porous and permeable and cause the water regulation function to degrade and create a negative effect for biomass production and re-vegetation [17]. Third, sandy soils, when eroded, lead to increased contamination of atmosphere by dust thus interfering with vegetation photosynthesis, respiration, and transpiration, which all results in declining primary production [47,48,49]. In summary, desertification directly reduces three regulating services examined in this study. With the intensification of desertification, the two provisioning services respond non-linearly by first increasing and then decreasing. This may be an indication that human activities play a prominent role here leading to complex relationships between provisioning services and desertification [50]. In the initial stages of desertification or recovery from it, increases in farming and grazing take advantage of increased provisioning services and exacerbate soil erosion due to human disturbance. This is consistent with the first half of the hump-shaped curve obtained in this study. As human activities continue to intensify alongside with increasing desertification, the carrying capacity threshold is passed, which disrupts water and soil conservation functions. Sustained crop growth and livestock feed cannot be maintained, and provisioning services decline as desertification increases. This process corresponds to the latter half of the hump-shaped curve. Therefore, when the two parts are combined, the overall relationship turns into the hump-shaped curve found in this study.

Acknowledgments

This work was supported by Inner Mongolia Science & Technology Plan [Grant No. 201601061], Postdoctoral Science Foundation [Grant No. 156409] and the National Basic Research Program of China [Grant No. 31560180].

Author Contributions

Qingfu Liu, Yanyun Zhao, Xuefeng Zhang conducted the field experiment. Qingfu Liu, Yanyun Zhao and Xuefeng Zhang analyzed the data, Qingfu Liu, Yanyun Zhao and Alexander Buyantuev contributed to drafting the paper. Jianming Niu and Xiaojiang Wang contributed to the concept and design of the paper. Jianming Niu and Xiaojiang Wang were in charge of the final version of the paper.

Conflicts of Interest

The authors declare no conflicts of interest.

References

  1. Millennium Ecosystem Assessment. Ecosystems and Human Well-Being; Island Press: Washington, DC, USA, 2005. [Google Scholar]
  2. Wu, J. Landscape sustainability science: Ecosystem services and human well-being in changing landscapes. Landsc. Ecol. 2013, 28, 999–1023. [Google Scholar] [CrossRef]
  3. Lavorel, S.; Grigulis, K.; Lamarque, P.; Colace, M.-P.; Garden, D.; Girel, J.; Pellet, G.; Douzet, R. Using plant functional traits to understand the landscape distribution of multiple ecosystem services. J. Ecol. 2011, 99, 135–147. [Google Scholar] [CrossRef]
  4. UNCCD The Ordos Declaration. UNCCD: Conference of the Parties: Thirteenth Session Ordos, China, 6–16 September 2017. Available online: http://www2.unccd.int/sites/default/files/inline-files/Ordos%20declaration.pdf (accessed on 15 November 2017).
  5. Wang, X.; Hua, T.; Lang, L.; Ma, W. Spatial differences of aeolian desertification responses to climate in arid Asia. Glob. Planet. Chang. 2017, 148, 22–28. [Google Scholar] [CrossRef]
  6. Tallis, H.; Kareiva, P.; Marvier, M.; Chang, A. An ecosystem services framework to support both practical conservation and economic development. Proc. Natl. Acad. Sci. USA 2008, 105, 9457–9464. [Google Scholar] [CrossRef] [PubMed]
  7. Bennett, E.M.; Balvanera, P. The future of production systems in a globalized world. Front. Ecol. Environ. 2007, 5, 191–198. [Google Scholar] [CrossRef]
  8. Nelson, E.; Mendoza, G.; Regetz, J.; Polasky, S.; Tallis, H.; Cameron, D.R.; Chan, K.M.A.; Daily, G.C.; Goldstein, J.; Kareiva, P.M.; et al. Modeling multiple ecosystem services, biodiversity conservation, commodity production, and tradeoffs at landscape scales. Front. Ecol. Environ. 2009, 7, 4–11. [Google Scholar] [CrossRef]
  9. McNally, C.G.; Uchida, E.; Gold, A.J. The effect of a protected area on the tradeoffs between short-run and long-run benefits from mangrove ecosystems. Proc. Natl. Acad. Sci. USA 2011, 108, 13945–13950. [Google Scholar] [CrossRef] [PubMed]
  10. Lester, S.E.; Costello, C.; Halpern, B.S.; Gaines, S.D.; White, C.; Barth, J.A. Evaluating tradeoffs among ecosystem services to inform marine spatial planning. Mar. Policy 2013, 38, 80–89. [Google Scholar] [CrossRef]
  11. Wang, J.; Peng, J.; Zhao, M.; Liu, Y.; Chen, Y. Significant trade-off for the impact of Grain-for-Green Programme on ecosystem services in North-western Yunnan, China. Sci. Total Environ. 2017, 574, 57–64. [Google Scholar] [CrossRef] [PubMed]
  12. UNCCD. United Nations Convention to Combat Desertification in Those Countries Experiencing Serious Drought and/or Desertification, Particularly in Africa; UNCCD: Paris, France, 1994. [Google Scholar]
  13. Symeonakis, E.; Karathanasis, N.; Koukoulas, S.; Panagopoulos, G. Monitoring Sensitivity to Land Degradation and Desertification with the Environmentally Sensitive Area Index: The Case of Lesvos Island. Land. Degrad. Dev. 2016, 27, 1562–1573. [Google Scholar] [CrossRef]
  14. Lyles, L.; Tatarko, J. Wind Erosion Effects on Soil Texture and Organic Matter. J. Soil Water Conserv. 1986, 41, 191–193. [Google Scholar]
  15. Field, J.P.; Belnap, J.; Breshears, D.D.; Neff, J.C.; Okin, G.S.; Whicker, J.J.; Painter, T.H.; Ravi, S.; Reheis, M.C.; Reynolds, R.L. The ecology of dust. Front. Ecol. Environ. 2010, 8, 423–430. [Google Scholar] [CrossRef]
  16. D’Odorico, P.; Bhattachan, A.; Davis, K.F.; Ravi, S.; Runyan, C.W. Global desertification: Drivers and feedbacks. Adv. Water Resour. 2013, 51, 326–344. [Google Scholar] [CrossRef]
  17. Imeson, A. Desertification, Land Degradation and Sustainability; John Wiley & Sons, Ltd.: Chichester, UK, 2012. [Google Scholar]
  18. Li, S.; Wang, T.; Yan, C.Z. Assessing the Role of Policies on Land-Use/Cover Change from 1965 to 2015 in the Mu Us Sandy Land, Northern China. Sustainability 2017, 9, 1164. [Google Scholar] [CrossRef]
  19. Pan, J.; Li, T. Extracting desertification from Landsat TM imagery based on spectral mixture analysis and Albedo-Vegetation feature space. Nat. Hazards 2013, 68, 915–927. [Google Scholar] [CrossRef]
  20. Zeng, Y.N.; Xiang, N.P.; Feng, Z.D.; Hu, H. Albedo-NDVI Space and Remote Sensing Synthesis Index Models for Desertification Monitoring. Sci. Geogr. Sin. 2006, 26, 75–81. [Google Scholar]
  21. Liang, S. Narrowband to broadband conversions of land surface albedo I: Algorithms. Remote Sens. Environ. 2000, 76, 213–238. [Google Scholar] [CrossRef]
  22. Verstraete, M.M.; Pinty, B. Designing optimal spectral indexes for remote sensing applications. IEEE Trans. Geosci. Remote Sens. 1996, 34, 1254–1265. [Google Scholar] [CrossRef]
  23. Renard, K.G.; Foster, G.R.; Weesies, G.A.; Mccool, D.K.; Yoder, D. Predicting Soil Erosion by Water: A Guide to Conservation Planning with the Revised Universal Soil Loss Equation (RUSLE); United States Government Printing Office: Washington, DC, USA, 1997. [Google Scholar]
  24. Kareiva, P.; Tallis, H.; Ricketts, T.H.; Daily, G.C.; Polasky, S.; Kareiva, P.; Tallis, H.; Ricketts, T.H.; Daily, G.C.; Polasky, S. Natural Capital: Theory & Practice of Mapping Ecosystem Services; Oxford University Press: Oxford, UK, 2011. [Google Scholar]
  25. Budyko, M.I. Climate and Life; Academic Press: New York, NY, USA, 1974. [Google Scholar]
  26. Potter, C.S.; Randerson, J.T.; Field, C.B.; Matson, P.A.; Vitousek, P.M.; Mooney, H.A.; Klooster, S.A. Terrestrial ecosystem production: A process model based on global satellite and surface data. Glob. Biogeochem. Cycles 1993, 7, 811–841. [Google Scholar] [CrossRef]
  27. Zheng, Z.; Fu, B.; Hu, H.; Sun, G. A method to identify the variable ecosystem services relationship across time: A case study on Yanhe Basin, China. Landsc. Ecol. 2014, 29, 1689–1696. [Google Scholar] [CrossRef]
  28. Wang, Y.H.; Yang, J.R.; Ding, Y.; Ning, Z.P.; Zhang, H.L. Characteristics of Land Cover Change in Mu Us Desert in Recent Years. Bull. Soil Water Conserv. 2008, 28, 53–57. [Google Scholar]
  29. Yan, F.; Wu, B. Desertification progress in Mu Us Sandy Land over the past 40 years. Arid Land Geogr. 2013, 36, 987–996. [Google Scholar]
  30. Karnieli, A.; Qin, Z.H.; Wu, B.; Panov, N.; Yan, F. Spatio-Temporal Dynamics of Land-Use and Land-Cover in the Mu Us Sandy Land, China, Using the Change Vector Analysis Technique. Remote Sens. 2014, 6, 9316–9339. [Google Scholar] [CrossRef]
  31. Pan, D.; Domon, G.; de Blois, S.; Bouchard, A. Temporal (1958–1993) and spatial patterns of land use changes in Haut-Saint-Laurent (Quebec, Canada) and their relation to landscape physical attributes. Landsc. Ecol. 1999, 14, 35–52. [Google Scholar] [CrossRef]
  32. Serra, P.; Pons, X.; Saurí, D. Land-cover and land-use change in a Mediterranean landscape: A spatial analysis of driving forces integrating biophysical and human factors. Appl. Geogr. 2008, 28, 189–209. [Google Scholar] [CrossRef]
  33. Napton, D.E.; Auch, R.F.; Headley, R.; Taylor, J.L. Land changes and their driving forces in the Southeastern United States. Reg. Environ. Chang. 2010, 10, 37–53. [Google Scholar] [CrossRef]
  34. Peng, J.; Xu, Y.Q.; Cai, Y.L.; Xiao, H.L. The role of policies in land use/cover change since the 1970s in ecologically fragile karst areas of Southwest China: A case study on the Maotiaohe watershed. Environ. Sci. Policy 2011, 14, 408–418. [Google Scholar] [CrossRef]
  35. Jia, X.; Fu, B.; Feng, X.; Hou, G.; Liu, Y.; Wang, X. The tradeoff and synergy between ecosystem services in the Grain-for-Green areas in Northern Shaanxi, China. Ecol. Indic. 2014, 43, 103–113. [Google Scholar] [CrossRef]
  36. Xu, D.Y.; Kang, X.W.; Qiu, D.S.; Zhuang, D.F.; Pan, J.J. Quantitative assessment of desertification using Landsat data on a regional scale—A case study in the Ordos Plateau, China. Sensors 2009, 9, 1738–1753. [Google Scholar] [CrossRef] [PubMed]
  37. Felipe-Lucia, M.R.; Comin, F.A.; Bennett, E.M. Interactions among Ecosystem Services across Land Uses in a Floodplain Agroecosystem. Ecol. Soc. 2014, 19. [Google Scholar] [CrossRef]
  38. Bennett, E.M.; Peterson, G.D.; Gordon, L.J. Understanding relationships among multiple ecosystem services. Ecol. Lett. 2009, 12, 1394–1404. [Google Scholar] [CrossRef] [PubMed]
  39. Chisholm, R.A. Trade-offs between ecosystem services: Water and carbon in a biodiversity hotspot. Ecol. Econ. 2010, 69, 1973–1987. [Google Scholar] [CrossRef]
  40. Xu, Y.; Tang, H.; Wang, B.; Chen, J. Effects of land-use intensity on ecosystem services and human well-being: A case study in Huailai County, China. Environ. Earth Sci. 2016, 75. [Google Scholar] [CrossRef]
  41. Gong, G.; Liu, J.; Shao, Q.; Zhai, J. Sand-Fixing Function under the Change of Vegetation Coverage in a Wind Erosion Area in Northern China. J. Resour. Ecol. 2014, 5. [Google Scholar] [CrossRef]
  42. Saleh, A.; Fryrear, D.W. Soil roughness for the revised wind erosion equation (RWEQ). J. Soil Water Conserv. 1999, 54, 473–476. [Google Scholar]
  43. Wight, J.R.; Black, A.L. Range Fertilization: Plant Response and Water Use. J. Range Manag. 1979, 32, 345–349. [Google Scholar] [CrossRef]
  44. Prince, S.D.; Brown, D.C.E.; Kravitz, L.L. Evidence from rain-use efficiencies does not indicate extensive Sahelian desertification. Glob. Chang. Biol. 1998, 4, 359–374. [Google Scholar] [CrossRef]
  45. Archimede, H.; Alexandre, G.; Mahieu, M.; Fleury, J.; Petro, D.; Garcia, G.W.; Fanchone, A.; Bambou, J.-C.; Magdeleine, C.M.; Gourdine, J.-L.; et al. Agroecological Resources for Sustainable Livestock Farming in the Humid Tropics. In Sustainable Agriculture Reviews; Springer Science & Business Media: Berlin, Germany, 2014; Volume 14, pp. 299–330. [Google Scholar]
  46. Lang, L.; Wang, X.; Wang, G.; Hua, T.; Wang, H. Effects of aeolian processes on nutrient loss from surface soils and their significance for sandy desertification in Mu Us Desert, China: A wind tunnel approach. J. Arid Land 2015, 7, 421–428. [Google Scholar] [CrossRef]
  47. Hirano, T.; Kiyota, M.; Aiga, I. Physical effects of dust on leaf physiology of cucumber and kidney beans plants. Environ. Pollut. 1995, 89, 255–261. [Google Scholar] [CrossRef]
  48. Sharifi, M.R.; Gibson, A.C.; Rundel, P.W. Surface dust impacts on gas exchange in Mojave Desert shrubs. J. Appl. Ecol. 1997, 34, 837–846. [Google Scholar] [CrossRef]
  49. Honour, S.L.; Bell, J.N.B.; Ashenden, T.W.; Cape, J.N.; Power, S.A. Responses of herbaceous plants to urban air pollution: Effects on growth, phenology and leaf surface characteristics. Environ. Pollut. 2009, 157, 1279–1286. [Google Scholar] [CrossRef] [PubMed] [Green Version]
  50. Niemela, J.; Saarela, S.-R.; Soderman, T.; Kopperoinen, L.; Yli-Pelkonen, V.; Vare, S.; Kotze, D.J. Using the ecosystem services approach for better planning and conservation of urban green spaces: A Finland case study. Biodivers. Conserv. 2010, 19, 3225–3243. [Google Scholar] [CrossRef]
Figure 1. Field sites and standard false color of remote-sensing image of the study area in late July 2015.
Sustainability 10 00589 g001
Figure 2. (a) Scatter plot of the Albedo-NDVI feature space; (b) Albedo-NDVI feature space.
Sustainability 10 00589 g002
Figure 3. Regression analysis of Albedo-NDVI.
Sustainability 10 00589 g003
Figure 4. The annual precipitation and mean annual temperature in Mu Us Desert from 1985 to 2013.
Sustainability 10 00589 g004
Figure 5. Spatial Pattern of desertification in Mu Us Desert from 1986 to 2015. Smaller DDI values correspond to significant desertification.
Sustainability 10 00589 g005
Figure 6. Spatial pattern of ecosystem services and DDI in 2015 divided by each county; (a) DDI in 2015; (b) soil conservation; (c) water retention; (d) NPP; (e) crop productivity; (f) livestock productivity.
Sustainability 10 00589 g006
Figure 7. Ranking administrative units based on their (a) DDI in 2015. Smaller DDI signify severe desertification: (b) Soil conservation ; (c) Water retention; (d) NPP; (e) Crop productivity; (f) Livestock productivity; A—Otog banner, B—Otog Front banner, C—Ejin Horo banner, D—Wushen banner, E—Shenmu county, F—Yuyang district, G—Hengshan county, H—Jingbian county, I—Dingbian county, J—Yanchi county, K—Lingwu city.
Sustainability 10 00589 g007
Figure 8. Effects of desertification on (a) soil conservation; (b) water retention; (c) NPP; (d) crop productivity; and (e) livestock productivity.
Sustainability 10 00589 g008
Table 1. Correlation analysis of measured vegetation coverage and 10 desertification monitoring indices.
DDIAlbedoSBISFOIFVCNDVIWIGILSTRUE
MVC0.721 **−0.714 **−0.709 **−0.656 **0.583 **0.580 **0.566 **0.393 **−0.2320.012
** represents highly significant correlation. MVC is measured vegetation coverage; Albedo is surface albedo; SBI is soil brightness index; SFOI is soil ferric oxide index; FVC is fractional vegetation coverage; NDVI is normalized difference vegetation index; WI is wetness index; GI is greenness index; LST is land surface temperature; RUE is rain use efficiency.
Table 2. Correlations between annual precipitation.
OtogWushenYuyangHengshanYanchi
Otog1
Wushen 0.744 **1
Yuyang0.403 *0.744 **1
Hengshan0.447 *0.769 **0.869 **1
Yanchi0.377 *0.646 **0.585 **0.673 **1
* represents significant correlation; ** represents highly significant correlation.
Table 3. Correlations between mean annual temperature.
OtogWushenYuyangHengshanYanchi
Otog1
Wushen 0.975 **1
Yuyang0.949 **0.963 **1
Hengshan0.966 **0.961 **0.935 **1
Yanchi0.820 **0.824 **0.729 **0.835 **1
** represents highly significant correlation.
Table 4. Relationships between ecosystem services.
Soil ConservationWater RetentionNPPCrop ProductivityLivestock Productivity
Soil Conservation1
Water Retention 0.961 **1
NPP0.897 **0.928 **1
Crop Productivity0.4260.5850.725 *1
Livestock Productivity0.3340.3890.5390.657 *1
* represents significant correlation; ** represents highly significant correlation.

